job satisfaction of hotel room attendants by swee …
TRANSCRIPT

JOB SATISFACTION OF HOTEL ROOM ATTENDANTS
by
SWEE HUA GOH, B.S.
A THESIS
IN
RESTAURANT, HOTEL, AND INSTITUTIONAL MANAGEMENT
Submitted to the Graduate Faculty of Texas Tech University in
Partial Fulfillment of the Requirements for
the Degree of
MASTER OF SCIENCE
IN
HOME ECONOMICS
Approved
Accepted
December, 1989
hc "^0 6
f^O.^O TABLE OF CONTENTS
LIST OF TABLES iv
LIST OF FIGURES vii
CHAPTER
I. INTRODUCTION 1 Housekeeping Department 1 Justification Of The Problem 2 Statement of Problem 4 Hypotheses 4 Limitations of the Study 5 Definition of Terms 5 Organization of the Study 7
II. REVIEW OF RELATED LITERATURE 9 Abilities and Needs 9 Turnover 13 Incentives and Recognition 17 Coping with Hospitality Labor
Shortage 19 Summary 24
III. METHODS AND PROCEDURES 26 Questionnaire 2 6 Selection of Samples 28 Procedures 28 Data Analysis 28
Percentile score 29 Analysis of variance 29
IV. DATA ANALYSIS AND FINDING 31 Interpretation of Percentile
Scores 31 Intrinsic 31 Extrinsic 3 3 Working conditions and
co-workers 3 5 Demographic Breakdown of Sample
Characteristics 35 Analysis of Variance 68
V. SUMMARY AND CONCLUSION 76 Summary 76 Conclusion 78 Suggestion for Further Survey 79
11
REFERENCES 81
APPENDICES 84 A. PERMISSION TO USE QUESTIONNAIRE 84 B. QUESTIONNAIRES 90 C. LETTER TO HOTELS 93 D. ITEMS IN THE QUESTIONNAIRE 95
111

LIST OF TABLES
2.1 Employee Turnover Rate by Department in 17 Selected Hotels 15
2.2 Reported Causes of Employee Turnover in 17 Selected Hotels 16
4.1 Percentile Responses by Hotel Housekeepers to Items in the Intrinsic Motivation Scale 32
4.2 Percentile Responses by Hotel Housekeepers to Items in the Extrinsic Motivation Scale 34
4.3 Percentile Responses by Hotel Housekeepers to Items Concerning Working Conditions and Co-workers 3 6
4.4 Percentile of Responses in the Housekeeper's Job Satisfaction Demographic Survey 38
4.5 Housekeeper's Job Satisfaction Demographic Survey: Item 1 - Being able to keep busy all the time 38
4.6 Housekeeper's Job Satisfaction Demographic Survey: Item 2 - The chance to work alone on the job 40
4.7 Housekeeper's Job Satisfaction Demographic Survey: Item 3 - The chance to do different things from time to time 41
4.8 Housekeeper's Job Satisfaction Demographic Survey: Item 4 - The chance to be "somebody" in the community 42
4.9 Housekeeper's Job Satisfaction Demographic Survey: Item 5 - The way my boss handles his/her employees 44
4.10 Housekeeper's Job Satisfaction Demographic Survey: Item 9 - The chance to do things for other people 45
IV

4.11 Housekeeper's Job Satisfaction Demographic Survey: Item 6 - The competence of my supervisor in making decisions 47
4.12 Housekeeper's Job Satisfaction Demographic Survey: Item 7 - Being able to do things that don't go against my conscience 48
4.13 Housekeeper's Job Satisfaction Demographic Survey: Item 8 - The way my job provides steady employment 49
4.14 Housekeeper's Job Satisfaction Demographic Survey: Item 10 - The chance to tell other people what to do 51
4.15 Housekeeper's Job Satisfaction Demographic Survey: Item 11 - The chance to do something that makes use of my abilities 53
4.16 Housekeeper's Job Satisfaction Demographic Survey: Item 12 - The way my company policies are put into practice 54
4.17 Housekeeper's Job Satisfaction Demographic Survey: Item 15 - The freedom to use my own judgment 57
4.18 Housekeeper's Job Satisfaction Demographic Survey: Item 13 - My pay and the amount of work I do 58
4.19 Housekeeper's Job Satisfaction Demographic Survey: Item 14 - The chance for advancement on this job 60
4.20 Housekeeper's Job Satisfaction Demographic Survey: Item 16 - The chance to try my own methods of doing the job 61
4.21 Housekeeper's Job Satisfaction Demographic Survey: Item 17 - The working conditions 63
4.22 Housekeeper's Job Satisfaction Demographic Survey: Item 18 - The way my co-workers get along with each other 64
4.2 3 Housekeeper's Job Satisfaction Demographic Survey: Item 19 - The praise I get for doing a good job 66
4.24 Housekeeper's Job Satisfaction Demographic Survey: Item 20 - The feeling of accomplishment I get from the job 67
4.25 Analysis of Variance of Differences Between Gender and Job Satisfaction of Hotel Housekeepers 71
4.26 Analysis of Variance of Difference Between the Education Levels and Job Satisfaction of Hotel Housekeepers 72
4.27 Analysis of Variance of Difference Between the Age Groups of Respondents and Job Satisfaction of Hotel Housekeepers 75
4.28 Analysis of Variance of Difference Between the Average Room Rates and Job Satisfaction for Hotel Housekeepers 77
VI

LIST OF FIGURES
2.1 Inception of the Work Personality 10
2.2 Individualization of the Work Personality 11
Vll
CHAPTER I
INTRODUCTION
Housekeeping Department
Hotels and motels have regarded housekeeping as one
of the minor operations of a hotel, a necessary evil in
running a lodging property (Zbaeren, 1983). Without the
housekeeping department the hotel would have dirty,
unmade rooms to offer to the public which would cause
guests to disappear and profits to dwindle.
The lodging industry has become more aware of the
housekeeping department and has realized that
housekeepers are valued employees. Duties of
housekeepers include keeping rooms clean, making beds,
cleaning bathrooms, replacing linens, dusting furniture
and vacuuming. This makes every guest who comes into a
room feel as if he were the most important person to stay
there. Housekeepers are responsible for upholding
quality room standards and the reputation of the hotel.
However, housekeepers are traditionally low on the
pay scale and the job often lacks prestige. Also, the
housekeeping department frequently experiences a high
turnover rate. Hotel management should plan to emphasize
the housekeeping area by training and retaining

housekeepers and by searching for ways to make the
housekeeper feel more respected. Employees need personal
dignity and a feeling of being important to the success
of the operation. A mark of a good manager would be to
hire good employees and keep them.
Justification of the Problem
The nature of the lodging industry is a labor-
intensive one. The availability of employees to work in
the housekeeping department depends on the number in the
labor force and people willing to perform these jobs.
The United States Bureau of Census examined employment,
by function, in the lodging industry. In 1982 the
housekeepers represented one-quarter of the total
employees hired in the hospitality industry (Hiemstra and
Kruel, 1986).
The hospitality industry recruits much of its labor
force within the 16 to 24 age group.
The U.S Bureau of Labor Statistics expects annual shrinkage in this age group: 2.4 percent for men and 2.2 percent for women through 1990; then 1.2 percent for both sexes between 1990 and 1995. (Leposky, 1987, p. 25)
The U.S. Department of Labor in New York predicted a
decline in young workers from 30 percent of the total
labor force in 1985 to 16 percent in the year 2000
(Leposky, 1987). This indicates a very acute shortage of
labor in the year 2000.

The supply of people available to perform
housekeeping jobs is decreasing as educational levels
rise and the number of entry-level personnel declines due
to changing demographics (Hiemstra and Kruel, 1986). An
increase in educational levels will decrease the number
of people available and willing to work in the unskilled
job market.
Between 1972 and 1982, the annual rate of increase
in number of hotel rooms averaged 1.6 percent annually.
This rate tripled to 4.5 percent annually between 1982 to
1985 (Hiemstra and Kruel, 1986). This increase in the
number of rooms has led to a demand for more
housekeepers.
The average room rates between the mid-1930's and the mid-1950's changed little, while occupancy rates fluctuated dramatically. Rates rose moderately through the early 1960's, but occupancies dropped as a result of sizable additions to supply. Unfavorable economic conditions during the late 1960's and early 1970's were reflected in lower occupancies but not in room rates. Increased demand during the mid to late 1970's boosted occupancies and was accompanied by a continued rise in room rates. (Greenberg, 1985, pp. 10-11)
The number of rooms sold depends upon economic and
demographic growth as well as price (Greenberg, 1985).
The number of employees needed per room, depended on the
level and type of service provided. High rate (over
$60.00 per night) demands a greater level of service.
Room rates and lodging demand has resulted in an increase

in the number of employees per room (Hiemstra and Kruel,
1986).
In the labor intensive hospitality industry, jobs
like making beds and cleaning bathrooms have been
impossible to automate. The rapid growth rate of the
hospitality industry demands more people to work in entry
level, semi-skilled positions while the labor supply
decreases. Attracting and keeping good housekeepers will
be essential for hotels.
Statement of Problem
Hotels are now faced with the problems of labor
shortage and turnover in housekeeping. A study of the
individual housekeeper's job satisfaction would aid
management in gaining an insight on why a housekeeper
remains on the job.
Hypotheses
1. There is no significant and measurable
relationship between a housekeeper's job
satisfaction and level of activity on the job.
2. There is no significant and measurable
relationship between a housekeeper's job
satisfaction and company policies and
practices.

3. There is no significant and measurable
relationship between a housekeeper's job
satisfaction and level of compensation.
4. There is no significant and measurable
relationship in a housekeeper's job
satisfaction and working conditions.
Limitations of the Study
This research was limited to the housekeepers of 18
hotels in the Dallas and Houston area. A second
limitation was that the participants might be unable or
unwilling to answer some of questions presented on the
research instrument due to misinterpretation of the
question or fear or reprisal by management.
Definition of Terms
In order to clearly understand the problem the
following terms are operationally defined.
Ability: Physical or mental power to perform.
Achievement: Accomplishment.
Company Policies and Practices: The rules and
regulations of the work place.
Efficiency: The smoothness of the operation and
ability to solve on-the-job problems accordingly.
Extrinsic: External, beyond the control of the
person when relating to their job situation.

Hospitality Industry: The entire establishment in
the practicing of entertainment of visitors with
kindness.
Housekeeper: Employee in the hospitality industry
responsible for keeping the rooms and hotel clean.
Houseman: Employee who works for Housekeeping;
responsible for heavy cleaning jobs, lifting, and
moving (Tucker and Schneider, 1982).
Incentive: Something inciting one to action or
effort.
Intrinsic: Inherent, part of the nature of a person
related to their job satisfaction.
Job Satisfaction: The individual's evaluation of
stimuli in the work environment with reference to
their effectiveness in reinforcing his behavior
(Dawis, England and Lofquist, 1964).
Labor Turnover: The percentage of total employees
hired in a month or the percentage of employees
leaving in a month.
M.S.O.: Minnesota Satisfaction Questionnaire used
to measure the ability requirements in work and the
reinforcers available in the work environment.
Productivity: Output of goods or services per hour
of labor (Kast and Rosenzweig, 1985).

Reinforcer: Specifications of the reinforcement
values of classes of stimulus conditions (Dawis,
England and Lofquist, 1964).
Skill: The techniques, the approaches and the
styles of translating knowledge into actions or
practice.
Training: The process of acquiring and developing
skills, knowledge and attitudes through
instructional activities.
Work Adjustment: The process by which the
individual (with his unique set of abilities and
needs) acts, reacts and comes to term with his work
environment (Dawis, England and Lofquist, 1964).
Organization of the Study
This study is organized as follows: Chapter I
includes the introduction, the justification of the
problem, the statement of the problem, hypotheses, the
limitation of the study and the definitions of
operational terms within the study.
Chapter II presents the review of related literature
and research pertinent to the problem under the study.
Chapter III describes the methods and procedures
used to obtain and analyze the data.
Chapter IV presents the data obtained, the
statistical analysis of the data and the findings.

8
Chapter V includes the summary, conclusions and
recommendations based on the findings of Chapter IV.

CHAPTER II
REVIEW OF RELATED LITERATURE
Abilities and Needs
It has long been recognized that people need more
than just food, air, water and a job to satisfy life's
needs. These needs change with time, technology and
environment as an individual grows and acquires new
abilities and new needs for life (Dawis, England and
Lofquist, 1964). Individuals discover that their
abilities and capabilities go hand in hand with their
needs.
Self-realization and feeling of personal accomplis-
ment can be considered positive personal satisfaction in
the workplace (Lundberg and Armatas, 1979). It is
important for an individual to have meaningful work and
stay on the job. Consequently, the environment must
match an individual's work personality.
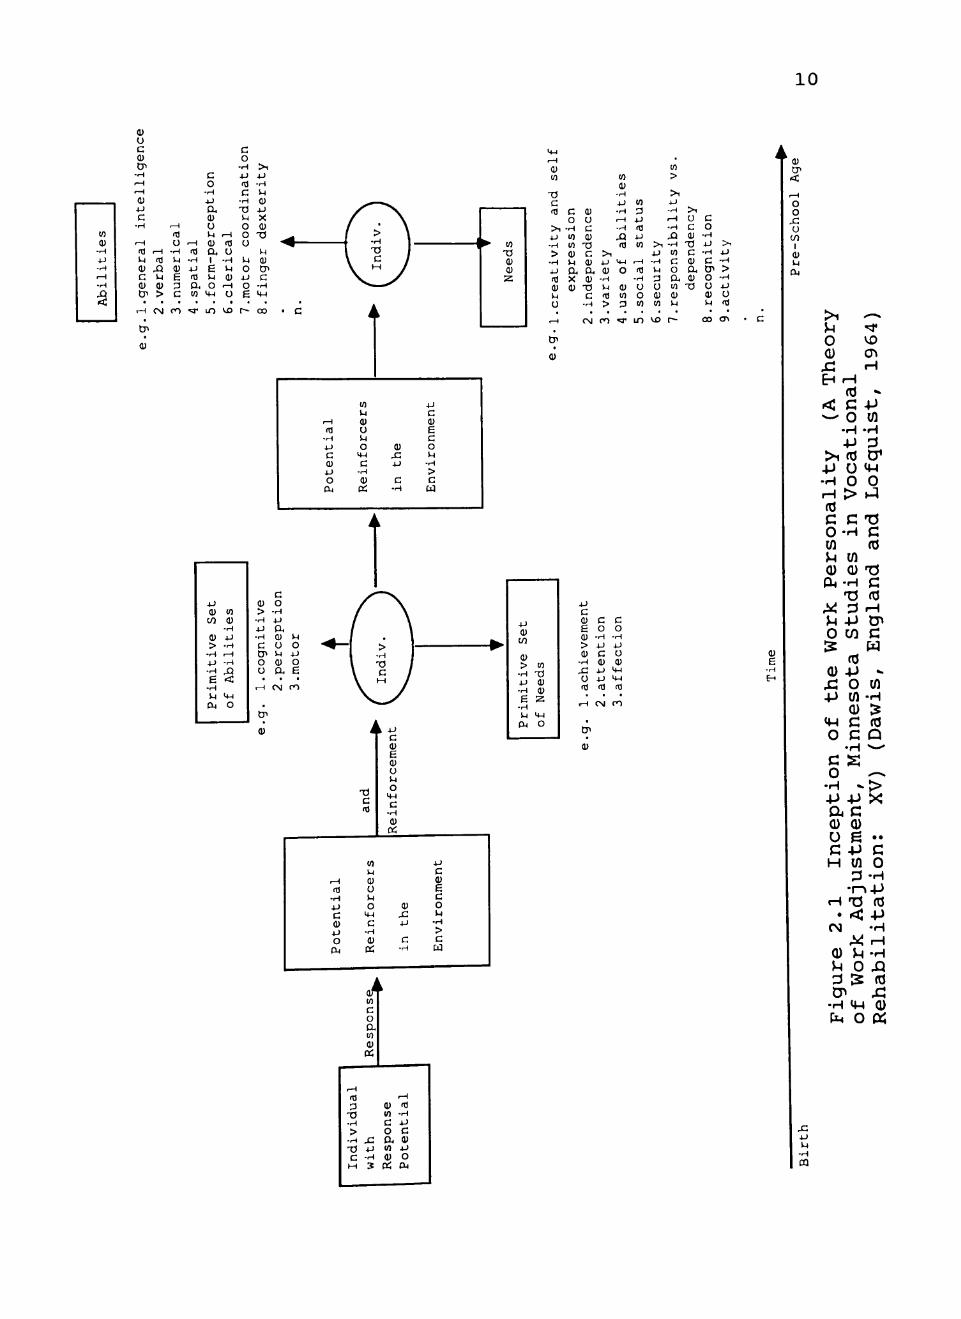
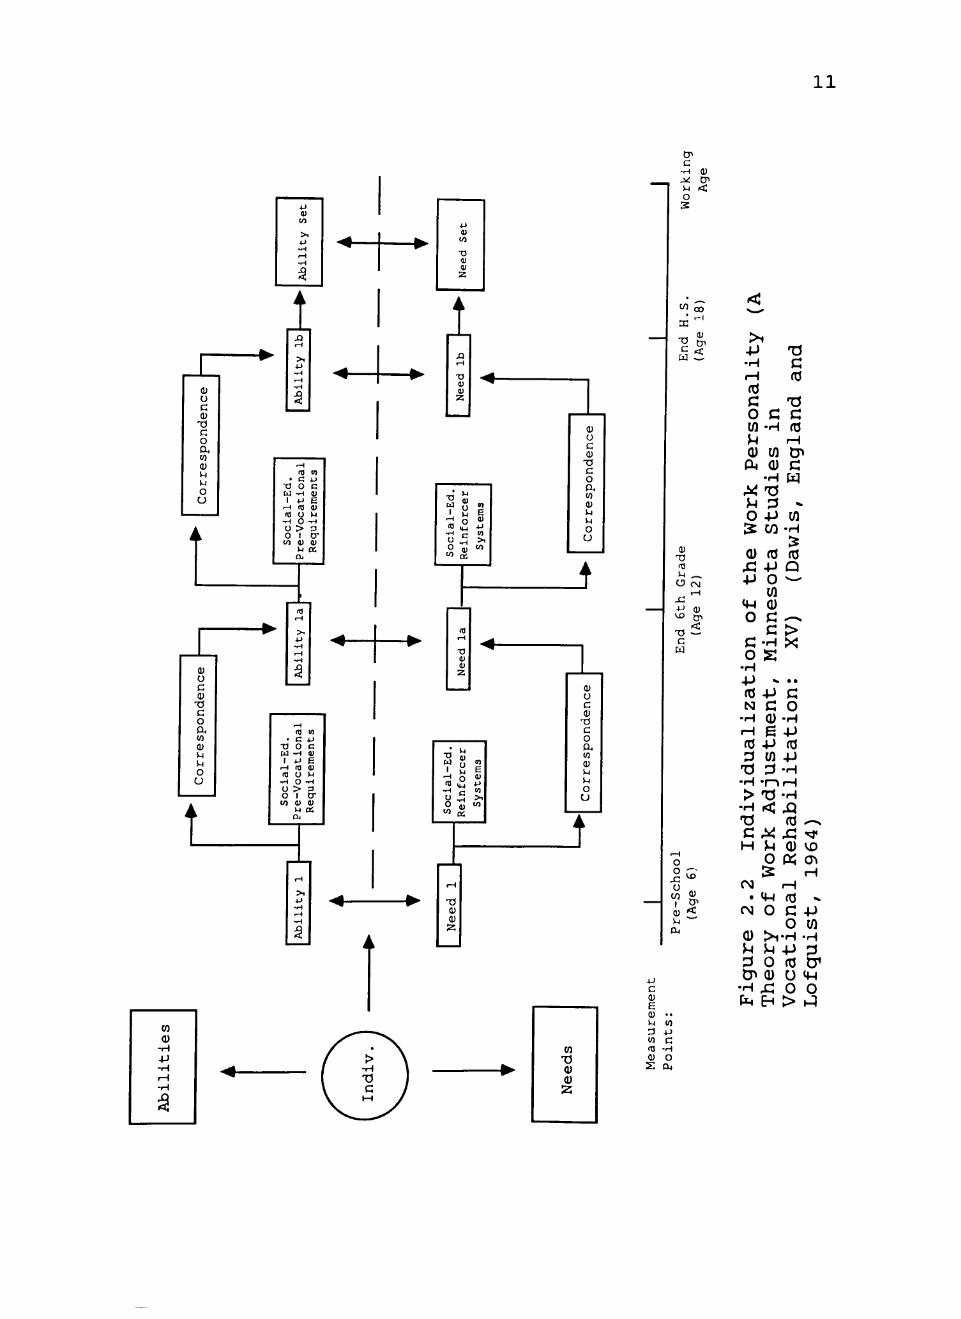
The theory of work adjustment is a study of how well an individual's abilities correspond to the ability requirements of the job which will predict the satisfactoriness of his work and how well his needs correspond to the reinforcers available in the work environment which will predict his satisfaction with his work. (Figure 2.1 and Figure 2.2) (Dawis, England and Lofquist, 1964)
"A Theory of Human Motivation" by A.H. Maslow,
recognized the hierarchy of five basic needs of humans.
1 0
U)
0) - H 4J -rH .—1 -rH
;^
(U u c 0) CP
- H .—1 r H
0) 4J
c - H
r H fl M 0) c Q) CP
g.l
(U
r H (fl
X) t-l (U >
CM
^H 0)
o • H >-l 0) b 3 c n
. H nj
• H 4-1
<n a n
T
c o
- H 4-)
a, (U u M 0) Q. 1 e u o
I M
i n
. H lO
u -H t-l (U
. H o
VO
c o
-H 4-)
m c
- H
i-l
o o o u o 4-)
o e r~
> 1 4-) - H M 1 ' 4-1 X fl) -rt M a) ry c
• H M-i
0 0
(1) w -n n <fl
> i 4-1 - H
> • H J-) (fl 01 ^ u
i H
tj<
Q>
r. n
- H CO M QJ t-l 0 . X 0)
(1) () c fl)
T) r. (1) a, (I)
T) r
• H
OM
> i i-) 0)
- H U (fl > ro
CO
(1) • H 4-1 - H . H • H
X) (fl
4-1
o (IJ to p
T
CO
p 4-) (0 4-) CO
r H <TJ
- H
o o CO
LO
> i 4.) - H t-l P u (1) CO
(
(0
> > 1 4J - H r-{ - H
^ - H CO C o a, 10 0) u r
> i
u c 01
T3 C Q) U. <U
TJ
C o - H 4-1 • H
c CP
o u (U t-l
CO
> i 4-1 - H
> - H 4-1 U (fl
<T>
. H fl
• H 4-)
c Q) 4-)
o eu
CO 14 0) u M O
4-1
c - H 0) PS
(U j : : 4-)
c - H
4-1
c <u fc c o M
-H > c w
4-1 0) CO
<u >
- H 4-) - H
e - H t-l
P4
CO 0)
- H 4J • H 1—1 - H
^ < 4-1 O
0) >
- H 4-) • H
c rT> o o
i H
c o
• H 4-1
a 0) u >-< 0) (X
CM
t-l O 4J
o fc m
tp
• H to
• H 4-> C 0) 4-1 O
CLj
an
d
CO t-l (1) o M O
4-1 C
• H (U DS
k 4-1
c (U b Q) U (-1
Re
info
0) n 4-1
c rH
4-» C 0) 6
c o M
• H
> c w
4-1 (U
CO
(U > - H 4-1 • H
e - H t-l
C»j
CO
-d Q) 0) z 4-1
o
4->
c 0) b n) > 0)
- H
j : :
» 0)
r H
D>
0)
C o
- H 4J C (U 4-1 4J (0
CM
c o
- H 4-1
o 0)
4-1 4-1
m n
0)
<
o o u
CO I
0) l-l
CO
c o o. CO 0) oc
r H (0 "H p 0) (fl
-O CO -H •H C 4-) > o c -r-i x: cu Q) t J 4-1 CO 4-> C -H OJ o
M 3 Pi P4
4-) u -H
> 1
o Q)
JC tn ^^
< c w o
•H -p
> 1 -p
-p
(A
0 *M c o (A
0)
o
0)
-p
o
o >
c •H
o >^
Ti
c in
•H
:3 -P w
-P o
c c
•H
c rH en c
•H
Q
C O
•H -P -P
a c :S
u c H (n
3 o •H
CN]
• o - P TJ fd < -p
•H
u o
0)
u
•H «W ft, Q
•H
(0
Q)
11
H 3 4) <0 i^ 4->
H e " !
0
c
ID <«
n i H
• 0 U lU
z
^ ^
•^ V
" t ^ e
•^•s s - H e " " y -H >< 0 ^ en w
1—
OS
< Tl <U (U
z
c -H Q)
t4 < : o 3
nc
c
(U M P CO <0 0) i :
•a g, m " ^
0)
m U CM
r H
4-) 0) 'J^ CP
73 — c w
i H
o J c ^ " u w 2^ Q) < t-l
• • CO
4-1
c H
o 04
> 1
-P TJ
Work Personali
Studies in
wis, England an
Q) fO fO ^ 4J Q 4J 0 ^
in (M Q)
o c ^ C -H S
Individualizatio
rk Adjustment, M
ehabilitation:
64)
0 « (r> 12 H
OO rH • «M fd ^
CN 0 C -P o w
Q) > i -H -H V^ 5H 4-> !3 ^ 0 <d tr t7« 0) 0 <4H
•H 4:: 0 O P»4 tH > iJ
12
They were
1. The physiological needs of hunger and thirst.
2. Safety needs of clothing, shelter and
protection from attack which contribute to
physical safety, thereby preserving and
reinforcing the satisfaction of physiological
drives.
3. Affection needs: Need for affection and love is
best described as the need to belong, not only
as a wanted member of the family unit, but also
as a member of other relatively small groups,
such as work groups.
4. Esteem needs, such as the need for self-
respect, for accomplishment and for
achievement.
5. Self-actualization needs are the capstone of
the hierarchy of needs, is the self-
fulfillment. Physiological, safety, affection
and esteem needs must reach a minimal
satisfaction before complete self-actualization
(Sisk, 1977).
Recognizing human abilities and needs can help
management understand their employees better, thus
increasing productivity and work quality.
13
Turnover
Labor turnover, as defined by the U.S. Department of
Labor, was either the percentage of total employees hired
in a month or the percentage of total employees leaving
in a month (Lundberg and Armatas, 1979). In the
hospitality industry, the employee turnover rate was
considered high when the average three-year turnover rate
was greater than 75 percent and also when a department
turnover rate exceeded the mean for all departments
within the hotels (Wasmuth and Davis, 1983). A high
turnover rate meant that more money and time would be
spent in interviewing, hiring and training new employees.
This would not only increase the labor cost but would
also interfere with the smooth and efficient operation of
an organization. It is estimated that each incident of
employee turnover cost $2,500 (Wasmuth and Davis, 1983).
Studies have demonstrated that high turnover was a
measure of organizational productivity and was the result
of employee alienation, as well as "symptomatic of a
variety of personnel problems" (Wasmuth and Davis, 1983).
Fleishman and Harris noted that turnover was found to be
particularly high in those departments where supervisors
were viewed as being inconsiderate of employees' needs
(Wasmuth and Davis, 1983). Bass and Ryterband, in their
studies covering a range of workers in different types of
organizations, found that turnover was higher when

14
overall job dissatisfaction was higher (Wasmuth and
Davis, 1983).
In regard to the satisfaction, Ross and Zander— in the study of relationship between need— satisfaction and turnover—have shown that there are two different types of reasons for leaving a job: 1. the job itself does not satisfy employee needs, and 2. the job prevents employees from receiving satisfaction from other sources (e.g., satisfaction from involvement with family and community). (Wasmuth and Davis, 1983, p. 15)
Turnover is a by-product of a series of complicated
interactions between an individual and the organization.
There are no easy solutions.
Wasmuth and Davis, of Cornell University, researched
the cost, causes, and management of turnover in five
different departments of 17 individual hotels in the U.S.
as shown in Table 2.1.
Housekeeping was one of the departments studied. It
was found that nine hotels, of the 17 studied, had
continuously high turnover in the Housekeeping
Department, in many cases exceeding 100 percent annually.
From their studies, working conditions led the list of
important factors related to turnover, followed by
quality of supervision and linkages with other
departments.
As illustrated in Table 2.2, managers also reported
that wages, selection and training, career opportunities
and upper level management support had some bearing on
turnover.
15
Table 2.1
Employee Turnover Rate by Department in 17 Selected Hotels
Departments: Number of Hotels
Dept: Ac. E. F&B F.O. Hskg
High turnover remained high 0 0 5 1 High turnover decreased 2 0 1 1 Low turnover increased 0 0 0 0 Low turnover remained low 4 6 0 4
5 1 0 0
Group two: Four hotels with moderate turnover High turnover remained high 0 0 1 3 2 High turnover decreased 1 0 3 0 2 Low turnover increased 0 0 0 0 0 Low turnover remained low 3 4 0 1 0
Group three: Seven hotels with low turnover High turnover remained high 1 1 1 3 2 High turnover decreased 0 1 3 3 1 Low turnover increased 1 2 0 0 0 Low turnover remained low 5 3 3 1 4
Summary of all 17 hotels High turnover remained high 1 1 High turnover decreased 3 1 Low turnover increased 1 2 Low turnover remained low 12 13
7 7 0 3
7 4 0 6
9 4 0 4
Dept Ac F&B Hskg
Departments: Accounting; Food and Beverages-Housekeeping;
E = Engineering; F.O. = Front Office;
Source: The Cornell Hotel and Restaurant Administration Quarterly, May, 1983, p. 17.

Table 2.2
Reported Causes of Employee Turnover in 17 Selected Hotels
16
Perceived major causes Percent of Managers Citing Dept: Ac. E. F&B. F.O. Hskg
Code Descriptive Title
A8 Bl B2 B3 B4 B5 B9 BIO C7
Quality of work force Pay and benefits 21% Working conditions 12 Quality of supervision 12 Better offers 24 Low Status 12 Lack of upward mobility 6 Low job security Transients -
—
12% 6 —
12 —
—
—
^
29% 41 47 76 18 24 18 6
29
18% 41 29 29 53 —
—
—
18
29% 41 47 59 6
47 29 6
47
Dept = Departments: Ac = Accounting; F&B = Food and Beverages; Hskg = Housekeeping;
E = Engineering; F.O. = Front Office;
Coding (A,B,C) used to categories the perceived reasons for employee turnover: A = Employer not satisfied with employee: Dismissal B = Employee not satisfied with employer: Quitting C = Independent reasons: Termination or resignation
Questions found in the three broad categories: A8 = Question 8 in A category: Poor quality of the work
force (can't find good help) Bl = Question 1 in B category: Insufficient pay or
fringe benefits B2 = Question 2 in B category: Dissatisfied with
working conditions:location, hours, etc. B3 = Question 3 in B category: Poor quality of
supervision B4 = Question 4 in B category: Better offer, move to a
better job B5 = Question 5 in B category: Personal adjustment to
work situation, grievances B9 = Question 9 in B category: Dead end, no chance for
promotion BIO = Question 10 in B category: Job insecurity C7 = Question 7 in C (resignation) category: Relocation
from area
Source: The Cornell Hotel and Restaurant Administration Quarterly, May, 1983. P.15.

17
Incentives and Recognition
Managers are aware of the importance of the
housekeeper and are putting more emphasis on hiring,
training, motivating and retaining good workers. Hotels
are giving the housekeeper respect by emphasizing the
job's importance and making room attendants realize their
status.
If you, as a manager, give the person dignity, show them you respect them and let them know how important they are to the operation, you can improve the quality of their work and retain workers. (Stoner, 1987, pp. 86-87)
Other successful housekeeping plans, through
training techniques and incentives, retain quality people
and may even transform a few not-so-dedicated workers
into good staff members (Bell, 1988).
The 51 housekeepers at the Crescent Hotel, Phoenix,
Arizona, were encouraged to share ideas for making the
guests' stay more enjoyable. "This was an open-minded
policy which was open to employees' suggestions and
ideas" (Stoner, 1987, p. 87). Employee participation and
ideas were an incentive in the job itself, management was
listening to them and using their ideas, which gave the
employees a sense of contribution to the job and made the
job more challenging.
Most hotels have monthly awards programs for their
best employees. At the Ritz Carlton Hotel in Boston,
18
five of the best employees are picked each month to be on
the Five Star Team.
In Nashville, 12 lodging properties gathered to pool
ideals and have some light fun while they competed in
their Third Annual World Series of Housekeeping
competition. First place team was awarded $100 and a
plaque designating them as the best housekeeping team in
Nashville. This was used as an added incentive to
motivate the staff (Fisher, 1988).
Awards and recognition programs used to reward
diligent employees are a tremendous motivator. "It
fosters a positive attitude about service, performance,
ability and going the extra mile," explained David R
Conrad (Leposky, 1987).
Promotion from within can be important in persuading
employeees to stay on the job. When they can see that
their supervisor was once in their position, it is
encouragement for them to stay with the hotel.
Cross-training personnel to function where they are
needed, whether in food and beverage, housekeeping or in
the kitchen, would be helpful for housekeepers. This
allows them to learn new skills and interact with other
departments.
Adequate wages, basic benefits, such as health
insurance and sick leave, and vacations that meet
employees' personal security needs can allow them to
19
concentrate on their jobs. These would help attract and
retain good employees.
Another way to retain workers would be providing
proper in-service education and training in safety,
handling of equipment, proper use of chemicals and how to
react in times of emergency. With proper training,
employees' skills would be improved and they would do
well on the job and could advance to a more responsible
position.
Incentives, such as company-wide efforts to promote
employees from within, the simple monthly celebration of
workers' birthdays, rewarding outstanding employees and
guest comment cards could be used by management to retain
workers because these factors tend to increase the
workers' self-esteem.
Coping with Hospitality Labor Shortage
The hospitality industry is faced with a labor
shortage crisis due to the low birth rates of the late
1960's and early 1970's. This will reduce the percentage
of 16- to 24-year-olds in the labor force to 16 percent
in 2000, as compared to 20 percent in 1986 (Slater,
1988) . Higher levels of education, rapid growth of the
hospitality industry and competition from other
industries will further reduce the dwindling supply of
labor resources. The hospitality labor shortage tends to
20
vary according to geography and market. Stiff recruiting
competition was found in the area of the Sunbelt or near
the concentration of high tech industries (Watkin et al.,
1985). To combat this problem, the best solution would
be to look into some other possible sources of labor
supply available in the market and ways to attract them.
Lodging operations are using different techniques to
attract new workers. Some are job advertisements in the
newspaper, followed by fliers and posters placed in
churches, schools, grocery stores, laundromats, bowling
alleys, elevators, libraries or anywhere it would be
read. Others visit with ministers, priests and rabbis to
suggest hospitality opportunities, distribute pencils,
coffee mugs, napkins, placements imprinted with the
hotel's name and the hours that interviews are conducted
(Restaurants & Institutions, 1987).
One Marriott benefit is an employee referral plan.
Employees who recruit their friends for employment with
Marriott get a $50 bonus, or a dinner for two in the
hotel (Leposky, 1987). Other recruitment ideas are to
hire interns from local hospitality schools, feature
teenagers in recruitment advertisements, re-recruit ex-
employees and align the hotel with a local high school by
setting up a work-study program or scholarship program.
21
Housekeeping jobs required very little skill or
experience. Consequently, immigrants from the Middle
East, Haiti, South East Asia, Mexico and Cuba, who can
speak enough English to get by on the job, would be easy
to train to be future housekeepers.
According to the Bureau of Labor Statistics, between 1986 and 2000, nearly six of every ten new entrants into the labor force are expected to be Black, Asian, Cuban or other members of the minority group. Asians and Hispanics are entering the work force at the greatest rate, and Hispanics, especially, seem to be making inroads into the industry's hourly labor force. Their annual growth rate in the labor force, 4.1 percent, is greater than that of any other minority group and more than triple the overall U.S. rate of 1.2 percent. (Slater, 1988, p. 14)
Walt Disney World runs two programs which brings
foreign students to staff the national pavilion at EPCOT
Center's World Showcase (Leposky, 1987).
On November 6, 1986, Congress passed the immigration
Reform and Control Act of 1986. This law stated that
employers can only hire Americans or aliens authorized to
work. Employers could be fined $2,000 or more or risk
imprisonment for breaking the law (Woodward, 1989). The
high employment levels in the hospitality industry and
the immigration policy make it more difficult to fill
entry-level positions. This law did not bother the
personnel director, David R. Conrad of the Ritz-Carlton
Hotel of Boston, "We ask to assure that they're legally
22
in the country as part the employment process" (Leposky,
1987). All employers must now do the same.
It was found by the Department of Labor that females
would enter the labor force at double the rate for males
(Slater, 1988). The pool of female laborers was made up
of young mothers, divorcees or widows, who had spent
their adult lives as housewives and lacked skills or
experience in the working world. A program called
"Transitions" helped to acquaint and train displaced
women to come into the hospitality industry (Leposky,
1987). Employers must try to accommodate the working
mothers who would prefer companies that offered them
family benefits, child care and flexible working hours
and leaves.
The hospitality industry could look into the
unemployed as another source of labor supply. These
unemployed people are trained by private contractors
hired by the government. The Federal Government Funds
flow to the State Government, to the local Private
Industry Council, and then to hire training organizations
which can be private or governmental (Leposky, 1987).
These contractors would be responsible for training the
unemployed and would give them a specific knowledge of
entry-level positions in a hotel and would help to place
graduates in permanent positions at no cost to the hotels
or trainees.

23
According to a March 1986 survey, conducted for the
International Center for Disabled, it was found that two-
thirds of all disabled Americans between the ages of 16
and 64 were not working. Of those who were working, 10
percent worked part time and only one out of every four
worked full time. It was found that many disabled
persons could hold full-time jobs steadily without long
periods of absence (Slater, 1988). Friendly Ice Cream
Corporation hired 1,700 disabled persons, which was
nearly six percent of their 30,000 workers (Slater,
1988) . Employees found that the disabled persons were
dedicated, versatile, showed initiative and were
dependable.
Retirees or older men and women who want to work for
a company often bring experience, a willingness to work
and a high degree of reliability and qualities that are
often hard to find in entry-level candidates. The Labor
Department of Statistics found that men and women of 55
years of age or above made up about 12.5 percent of the
nation's total labor force of 117.8 million in 1986,
141.6 million in the year 2000 (Hayes, 1989). The
question here is how many of these retirees would be
willing, capable and want to work. Unfortunately, it was
found that 90 percent of the senior citizens were not
interested in working (Slater, 1988). The American
Association of Retired Persons published a series of

24
guides to reach, train and manage older workers.
Physical, social and emotional handicaps might hinder the
ability of an older worker to work for the hospitality
industry. Elderly employees were more prompt, efficient,
enthusiastic and service-oriented than many younger
workers.
Perhaps the best answer to the above problem would
be to find out what would attract and retain the best
employees. Management could provide a training program
for the unemployed, a work-study internship for college
students, in-service education, encourage relocation,
stage job fairs, establishing cross-training personnel to
function where they are needed, promote from within and
pay adequate wages with benefits.
Summary
This chapter has reviewed some pertinent research
relevant to this study.
The behavior pattern of individuals contribute to
the analysis of human motivation. Knowing the wants and
needs of the housekeeper would help to understand the
factors leading to the housekeeper's job satisfaction and
also the different forces that would motivate a
housekeeper to stay with the company.
Turnover in housekeeping departments have
traditionally been very high. In an attempt to reduce
25
the turnover rate of housekeeping departments, this job
satisfaction study identified areas of ability
utilization, creativity and working conditions that
would help to better understand some important factors of
a housekeeper's job situation.
Incentives and rewards recognized the housekeeper's
achievement. Improving compensation and social status of
the job would also boost morale. Companies interested
in the well being of their employees used policies and
practices that gave satisfaction to housekeepers and
compensated them at a rate which provided personal
security.
Companies' policies and practices, compensation,
pay, benefits, quality of supervision, working conditions
and employees' job achievement were important factors
which would contribute to individual job satisfaction in
the housekeeping departments. This chapter reviewed the
literature related directly to this study as indicated in
the above summary.
CHAPTER III
METHODS AND PROCEDURES
The hospitality industry labor shortage tended to
vary according to geography and market. In a booming
market, such as in the Sunbelt or near a concentration of
high-tech industries, hospitality industry employers face
stiff recruiting challenges. "The shortage is very
serious in Dallas, but not in Detroit" (Watkin et al.,
1985) .
The research sample was taken from hotel house
keepers in Dallas and Houston in July 1988. These two
metropolitan areas were chosen because they are areas
facing labor shortages.
Questionnaire
The Short Form Minnesota Satisfaction Questionnaire
(MSQ) was designed to study an individual's ability,
corresponding to the ability requirements in work and the
reinforcers available in the work environment that
encouraged an individual to stay with the company. The
Short Form MSQ was developed by Weiss, Dawis, England and
Lofquist of the University of Minnesota, for their Work
Adjustment Project (Appendix A). Permission to use the
26
27
MSQ was obtained in writing by the Vocational Psychology
Research, University of Minnesota (Appendix A).
The Short Form MSQ was used to collect the
housekeepers' responses concerning how satisfied they
were with their present job. The MSQ consisted of 2 0
items. Each item was presented in Likert scale form
allowing five responses of: Very Dissatisfied (VDS);
Dissatisfied (DS); Neither (N); Satisfied (S); Very
Satisfied (VS). The MSQ was also translated to Spanish
to make it available for Spanish-speaking housekeepers
(Appendix B). Gender, age, educational level, job title,
job description, length of time on the job and hotel room
prices were all included in the MSQ.
Directions for the respondents appeared on the first
page of the questionnaire. Item-rating instructions were
repeated at the beginning of the questions. MSQ was a
self-administered form and there was no time limit for
answering it.
The 20 items in the questionnaire (Appendix D) were
divided into three scales:
These were:
Intrinsic scale made up of items 1, 2, 4, 5, 6, 7,
9, 11, 13, 14, 16, 17, 18, 20; Extrinsic scale, items 3,
8, 10, 12, 15, 19; and General satisfaction scale, items
1 to 20 (Weiss et al., 1964).

28
Selection of Samples
The hotels for this study were selected from the
hotels listed in the Hotel Redbook for Houston and
Dallas. Personal visits and phone calls were made and
letters were mailed to all the selected hotels,
explaining the nature of the study (Appendix C). The MSQ
was presented to the management by mail or personal
visit. The management studied the MSQ and then decided
if this questionnaire was appropriate for the employees.
Calls to over 50 hotels were made to get the management's
permission for the housekeepers to participate in this
study. From this group of 50 hotels, 18 agreed to
participate.
Procedures
The Spanish and English MSQ forms were distributed
to the housekeepers by their supervisor. A completely
sealed box with an opening for completed questionnaires
was provided in the break room. The box was collected
personally by the researcher. Of the 450 forms
distributed, 148 were collected for a return rate of 32.8
percent.
Data Analysis
Response choices of the MSQ forms were weighted in
the following manner:

29
Response Choice Scoring Weight
VDS 2. DS 2 N 3 S 4 VS 5
Percentile score. Frequency distribution shows the
frequency of different values of a single variable. A
ratio is a fraction used to show the magnitude of one
quantity relative to the magnitude of another (Stockton,
1962). A base of 100 or percentile score was used to
show the ratio and the formula used was:
Number of respondents X 100 = Percentage Score.
Total respondents
The frequency responses of each item were computed
under the sample characteristics of gender, education
level, age group and average hotel room rates. Frequency
responses were then used to tabulate the percentile score
of each item. Percentile scores of each item were
analyzed to consider the significance of each item's
demographic responses to job satisfaction.
Analysis of variance (ANOVA). Analysis of variance
design, one-way ANOVA was used to discover if there were
any statistically differences among the gender,
education, age and price groups to housekeepers' general
job satisfaction, extrinsic and intrinsic motivation
scales. It was used to determine if there was any
statistical difference among two or more means using a

30
probability of 0-05. If a significant difference was
found, the Scheffe multiple range test was used to
discover which two groups were significantly different at
the 0.05 level (Gay, 1981).

CHAPTER IV
DATA ANALYSIS AND FINDING
Interpretation of Percentile Scores
Percentage scores were used in this study to compare
the ratio to responses of each question. The advantage
of using the percentage ratio is that small numbers are
easier to compare than large numbers when analyzing the
data.
The percentile scores corresponding to the raw score
for each response choice for each question were
determined.
In interpreting percentile scores, scores of 75 or higher would be taken to represent a high degree of satisfaction; a percentile score of 25 or lower would indicate a low level of satisfaction; and scores in the middle range of percentiles indicate average satisfaction. (Weiss et al., 1964)
Intrinsic. Questions on the intrinsic scale relate
to internal factors impacting job satisfaction.
Responses to items on this scale are presented in Table
4.1. Data suggest that the evaluation of the overall job
situation by housekeepers was satisfactory. Housekeeping
was found to be a very satisfying job (item 1) that was
able to keep the housekeepers active at all times.
Housekeeping has busy hours of working alone that
satisfied the independence (item 2) of the employees
31
Table 4.1
Percentile Responses by Hotel Housekeepers to Items in the Intrinsic Motivation Scale
32
Items VDS DS N VS
Item Item Item Item Item Item Item Item Item Item Item Item
# 1 # 2 # 3 # 4 # 7 # 8 # 9 #10 #11 #15 #16 #20
6.72 8.21
17.91 18.66 8.21 8.21
10.45 23.13 16.42 30.60 29.85 14.29
0.7 2.99 12.69 17.16 5.22 11.19 9.70
14.93 14.18 6.72
11.19 6.77
7.4 13.43 8.21
11.19 17.16 16.42 10.45 14.93 7.46 9.70 8.96 14.29
38.06 35.82 37.31 33.58 35.82 40.30 36.57 30.60 32.09 38.81 31.34 35.34
47.01 39.55 23.88 19.40 33.58 23.88 32.84 16.42 29.85 14.18 18.66 29.32
Text of items listed above are found in Appendix D
VDS=Very dissatisfied N =Undecided VS =Very satisfied
DS=Dissatisfied S =Satisfied
33
working in that department. This job provided a constant
income for the housekeepers thus permitting security
(item 8). There is nothing morally wrong with being a
housekeeper (item 7), it is a honest and satisfying job
that required very little creativity (item 16) or
responsibility (item 15).
Extrinsic. The extrinsic scale is related to the
external job situation which is beyond the control of the
housekeeper. Responses reported in Table 4.2 deal with
items related to human and technical supervision, company
policies and practices, compensation, advancement and
recognition.
Many of the housekeepers were not happy with the
company's policies and practices in the housekeeping
department (item 13). This might be due to the lack of
attention and training given them by the management.
There was little opportunity to advance in the
housekeeping department, as the skills necessary for
success in the job are not the ones necessary for
promotion (item 14). Item 5 indicated that the human
supervision aspect of the job is very important to the
housekeepers. Michelle Fisher (1987) noted that
housekeepers need proper training so room attendants can
build confidence in their abilities. Housekeeping is a
relatively low paid job with many housekeepers working
part time. About 50 percent (item 13) of the

Table 4.2
Percentile Responses by Hotel Housekeepers to Items in the Extrinsic Motivation Scale
Percentile
34
Items VDS DS N VS
Item Item Item Item Item Item
# 5 # 6 #12 #13 #14 #19
12.69 11.19 23.88 49.25 33.58 14.93
17.91 16.42 17.16 13.43 16.42 15.67
8.21 11.19 8.96 8.96 10.45 7.46
31.34 29.85 38.81 20.15 29.10 32.09
29.85 31.34 11.19 8.21
10.45 29.85
Text of items listed above are found in Appendix D
VDS=Very dissatisfied N =Undecided VS =Very satisfied
DS=Dissatisfied S =Satisfied
35
housekeepers were very dissatisfied with their company's
compensation.
Between 1958 and 1972, there was a significant decline in the average number of hours worked per week. This decline was due mainly to the increase in share of part-time labor. (Hiemstra and Kruel, 1986)
Working conditions and co-workers. Table 4.3
(items 17 and 18) illustrates that satisfaction with the
work environment is a very important consideration that
contributes to job satisfaction. The studies of Wasmuth
and Davis (1983) stated that working conditions led the
list of important factors related to turnover, followed
by quality of supervision and linkages to other
departments. Cooperation between the co-workers was an
important factor for creating a conducive working
environment that most housekeepers found important.
Demographic Breakdown of Sample Characteristics
This breakdown of sample characteristics helps to
identify how different groups responded to the
questionnaire. The categories include the following:
1. Gender: Male and female.
2. Education level: Grade, high school and college.
3. Age: Under 25, 25-45 and over 45 years old.
4. Average hotel room rates: Under $40.00, $40.01-
$80.00 and $80-01.

36
Table 4.3
Percentile Responses by Hotel Housekeepers to Items Concerning Working
Conditions and Co-Workers
Items VDS DS N S VS
Item #17 21.64 18.66 5.97 29.85 23.88 Item #18 13.43 11.19 12.69 43.28 19.40
Text of items listed above are found in Appendix D
VDS=Very dissatisfied DS=Dissatisfied N =Undecided S =Satisfied VS =Very satisfied
37
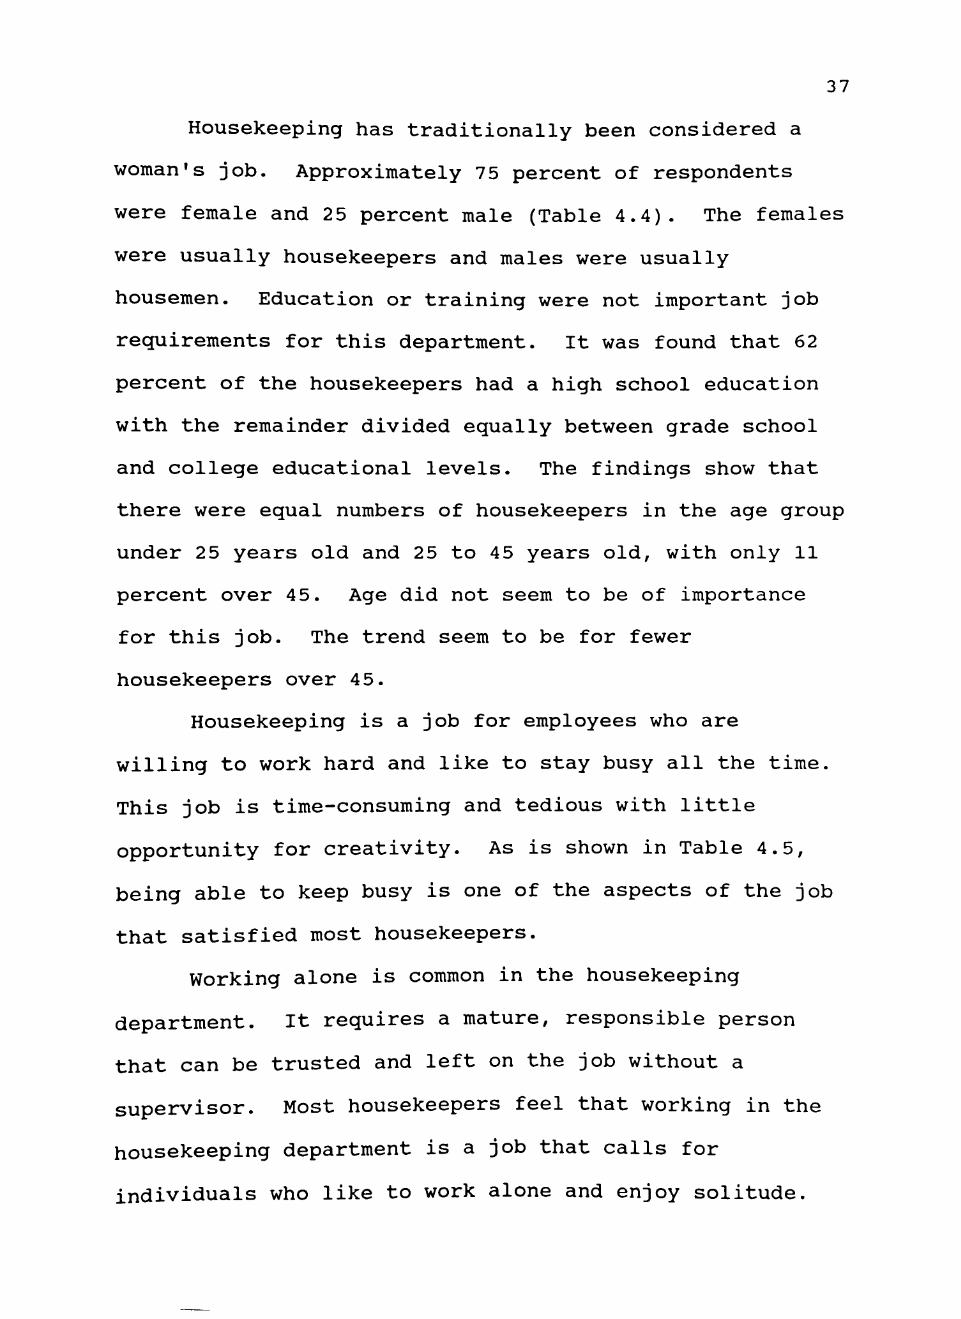
Housekeeping has traditionally been considered a
woman's job. Approximately 75 percent of respondents
were female and 25 percent male (Table 4.4). The females
were usually housekeepers and males were usually
housemen. Education or training were not important job
requirements for this department. It was found that 62
percent of the housekeepers had a high school education
with the remainder divided equally between grade school
and college educational levels. The findings show that
there were equal numbers of housekeepers in the age group
under 25 years old and 25 to 45 years old, with only 11
percent over 45. Age did not seem to be of importance
for this job. The trend seem to be for fewer
housekeepers over 45.
Housekeeping is a job for employees who are
willing to work hard and like to stay busy all the time.
This job is time-consuming and tedious with little
opportunity for creativity. As is shown in Table 4.5,
being able to keep busy is one of the aspects of the job
that satisfied most housekeepers.
Working alone is common in the housekeeping
department. It requires a mature, responsible person
that can be trusted and left on the job without a
supervisor. Most housekeepers feel that working in the
housekeeping department is a job that calls for
individuals who like to work alone and enjoy solitude.
38
Table 4.4
Percentile of Responses in the Housekeeper's Job Satisfaction Demographic Survey
Gender Male Female
Age Under 25 25 - 45 Over 45
Percentage
25 75
44.5 44.5 11
Education Grade High School College
Average Room Under 40.00 40.01-80.00 Above 80.01
Table 4.5
Percentage
19 62 19
Rates 17 36 47
Housekeeper's Job Satisfaction Demographic Survey: Item 1 - Being able to keep
busy all the time
Percentage
VDS DS N VS Num
Gender Male Female
0.00 5.56
Age Under 25 25 - 45 Over 45
5.66 1.89 7.69
Average Room Rates Under 40.00 8.70 40.01-80.00 8.33 Above 80.01 4.76
0.00 1.11
10.00 6.67
40.00 38.89
50.00 47.78
Education Grade 16.67 4.17 High School 2.56 0.00 College 0.00 0.00
0.00 5.13
25.00
33 44 29
33 87 17
4 5 . 8 3 4 7 . 4 4 4 5 . 8 3
0 . 0 0 1 .89 0 . 0 0
5 . 6 6 9 . 4 3 0 . 0 0
2 8 . 3 0 4 7 . 1 7 3 8 . 4 6
6 0 . 3 8 3 9 . 6 2 5 3 . 8 5
0 . 0 0 2 . 0 8 0 . 0 0
8 . 7 0 8 . 3 3 6 . 3 5
3 0 . 4 3 4 3 . 7 5 3 6 . 5 1
5 2 . 1 7 3 7 . 5 0 5 2 . 3 8
VDS=Very dissatisfied N =Undecided VS =Very satisfied
30 90
24 78 24
53 53 13
23 48 63
DS =Dissatisfied S =Satisfied Num=Number of respondents

39
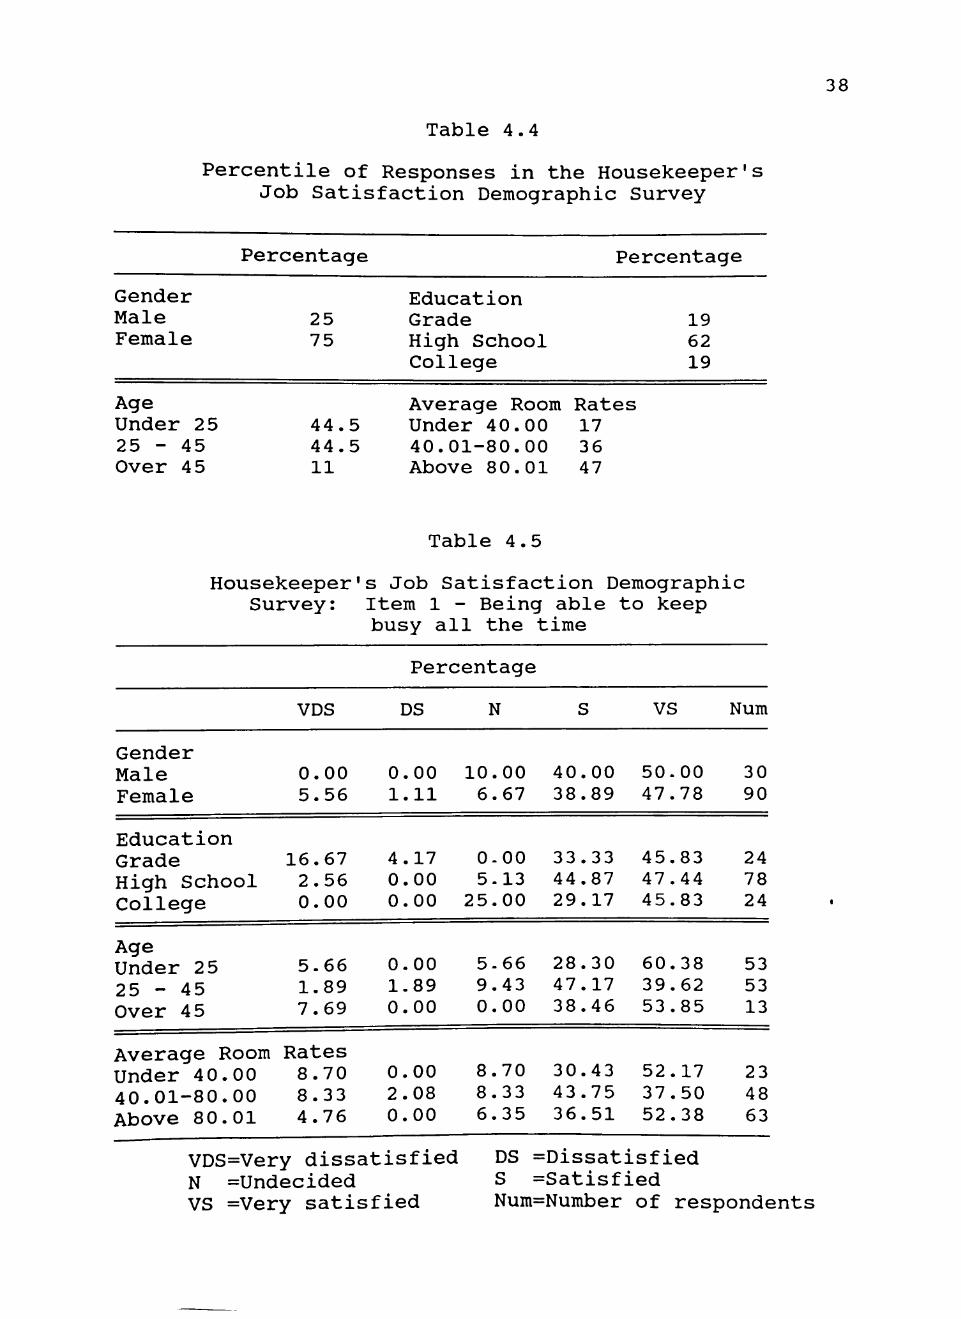
Table 4.6 indicated that the trend seems to be that, as
age increases, the housekeeper in general became less
satisfied with the opportunity to work alone but those
working in higher priced hotels were more satisfied.
Housekeeping jobs did not provide an opportunity
for housekeepers to have variety in their jobs. There is
a specific way to do things that the company requires in
order to maintain a consistent service for the customers.
As can be seen in Table 4.7, not all of the housekeepers
were happy with these restrictions. Most males were
hired as housemen with their job varying from day to day.
Consecjuently, this job was more satisfying to the males.
Fifteen respondents (62.5 percent) at the college level
found that they were given the opportunity to do
different things from time to time. This college level
housekeeping might consist of the 50 percent males that
were satisfied with item 3. However, a college-educated
employee might have a higher level of ability and would
be trusted with more jobs. The trend seems to be that
higher educated housekeepers would be trusted with more
jobs.
Responses from item 4 (Table 4.8), the chance to be
"somebody," noted mixed feelings among the housekeepers.
Working and carrying the responsibility to provide a good
image of the hotel caused many of the housekeepers to
feel proud. There seems to be less satisfaction to item
40
Table 4.6
Housekeeper's Job Satisfaction Demographic Survey: Item 2 - The chance to work
alone on the job
Gender Male Female
Education Grade High School College
Age Below 25 25 - 45 Over 45
Average Room Below 4 0 40.01 - 80 Above 80.01
VDS
0.00 7.78
20.83 3.85 0.00
3.77 5.66
15.38
Rates 13.04 12.50 3.17
DS
3.33 3.33
4.17 3.85 0.00
3.77 3.77 0.00
0.00 4.17 3.17
Percentage
N
16.67 12.22
0.00 15.38 20.83
15.09 13.21 23.08
8.70 8.33
19.05
S
43.33 35.56
37.50 35.90 41.67
35.85 37.74 23.08
39.13 39.58 31.75
VS
36.67 41.11
37.50 41.03 37.50
41.51 39.62 38.46
39.13 35.42 42.86
Num
30 90
24 78 24
53 53 13
23 48 63
VDS=Very dissatisfied N =Undecided VS =Very satisfied
DS =Dissatisfied S =Satisfied Num=Number of respondents

41
Table 4.7
Housekeeper's Job Satisfaction Demographic Survey: Item 3 - The chance to do different things from time to time
Percentage
VDS DS N VS Num
Gender Male Female
Education Grade High School College
Age Below 25 25 - 45 Over 45
Average Room Below 40. 40.01-80. Above 80.
,00 ,00 ,01
6.67 20.00
37.50 14.10 4.17
16.98 16.98 15.38
Rates 17.39 25.00 12.70
6.67 14.44
16.67 11.54 12.50
9.43 15.09 15.38
0.00 6.25
22.22
10.00 7.78
4.17 11.54 4.17
11.32 5.66 7.69
8.70 14.58 3.17
50. 34.
33. 32. 62.
37. 35. 46.
43. 35. 36.
.00
.44
.33
.05
.50
.74
.85
.15
.48
.42
.51
26.67 23.33
8.33 30.77 16.67
24.53 26.42 15.38
30.43 18.75 25-40
30 90
24 78 24
53 53 13
23 48 63
VDS=Very dissatisfied N =Undecided VS =Very satisfied
DS =Dissatisfied S =Satisfied Num=Number of respondents

42
Table 4.8
Housekeeper's Job Satisfaction Demographic Survey: Item 4 - The chance to be
"somebody" in the community
Percentage
Gender Male Female
VDS
6. 18.
67 89
DS
16. 18.
67 89
N
26. 7. ,67 ,78
S
46. 28.
,67 ,89
VS
3. 25.
,33 ,56
Num
30 90
Education Grade 29.17 37.50 0.00 16.67 16.67 24 High School 14.10 11.54 14.10 35.90 24.36 78 College 16.67 12.50 16.67 45.83 8.33 24
Age Under 25 25 - 45 Over 45
13.21 20.75 7.69
22 15 23
64 09 08
13.21 7.55
23.08
33.96 33.96 30.77
16.98 22.64 15.38
53 53 13
Average Room Rates Below 40.00 21.74 4.35 8.70 34.78 30.43 23 40.01-80.00 27.08 14.58 10.42 22.92 25.00 48 Above 80.01 11.11 23.81 12.70 41.27 11.11 63
VDS=Very dissatisfied N =Undecided VS =Very satisfied
DS =Dissatisfied S =Satisfied Num=Number of respondents

43
4 in the grade school levels than in the other education
levels.
Well-respected bosses must earn that status from
their employees (Stoner, 1987). They must show that they
respect the employees by being humane, fair, smart, hard
working, mannerly, even-tempered and praising a job well
done. No employee wants to work with an ill-tempered
boss who does not appreciate or respect the employees.
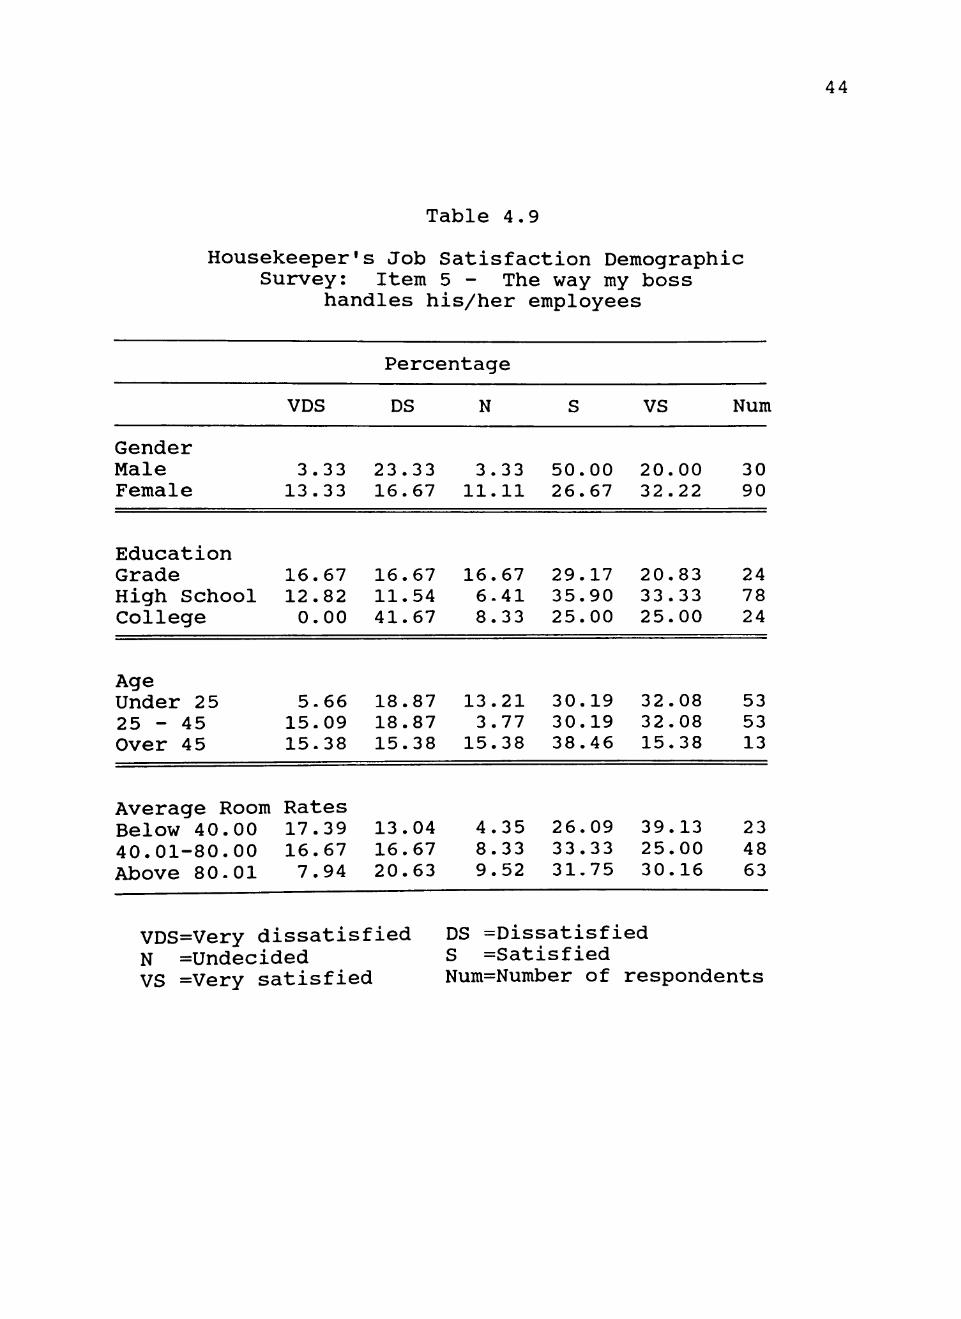
In Table 4.9 it seems that most housekeepers of all
gender, ages, education and hotel prices were satisfied
with the human supervision of their job.
The housekeeping department is definitely concerned
with service. There is no doubt in the mind of the
housekeepers that there will be opportunities to do
things for other people. Male housekeepers will help the
female housekeepers in moving heavier equipment. Older
housekeepers might find that this is a job that one can
still do well. Employees may discover that a meaningful
life includes sharing and doing things for other people,
providing a purpose in life when all the children are
grown up and gone (Table 4.10). The trend seem to be
that older age groups and higher educated levels
housekeepers were more satisfied with being able to do
things for other people.
44
Table 4.9
Housekeeper's Job Satisfaction Demographic Survey: Item 5 - The way my boss
handles his/her employees
Gender Male Female
VDS
3.33 13.33
Percentage
DS
23.33 16.67
N
3.33 11.11
S
50.00 26.67
VS
20.00 32.22
Num
30 90
Education Grade High School College
Age Under 2 5 25 - 45 Over 45
Average Room Below 40.00 40.01-80.00 Above 80-01
16.67 12.82 0.00
5-66 15.09 15-38
Rates 17.39 16.67 7.94
16. 11. 41.
18. 18. 15.
13. 16. 20.
.67
.54
.67
.87
.87
.38
.04
.67
.63
16, 6. 8.
13. 3.
15.
4. 8. 9.
.67
.41
.33
.21
.77
.38
.35
.33
.52
29. 35. 25.
30. 30. 38.
26, 33, 31.
,17 ,90 ,00
.19
.19
.46
.09
.33
.75
20. 33. 25.
32. 32. 15,
39, 25, 30.
,83 ,33 .00
.08
.08
.38
.13
.00
.16
24 78 24
53 53 13
23 48 63
VDS=Very dissatisfied N =Undecided VS =Very satisfied
DS =Dissatisfied S =Satisfied Num=Number of respondents

45
Table 4.10
Housekeeper's Job Satisfaction Demographic Survey: Item 9 - The chance to do
things for other people
Percentage
Gender Male Female
Education Grade High School College
Age Under 25 25 -45 Over 45
Average Room Below 40.00 40-01-80. Above 80.
,00 ,01
VDS
10.00 8.89
20.83 7.69 4.17
3.77 15.09 7.69
Rates 13.04 16.67 4.76
DS
0.00 13.33
25.00 7.69 4.17
13.21 9.43 7.69
0.00 8.33
14.29
N
3.33 13.33
4.17 12.82 12.50
13.21 9.43 0.00
4.35 16.67 7.94
S
60. 30.
16. 35. 62.
33. 35. 61.
34, 39, 34,
.00
.00
.67
.90
.50
.96
.85
.54
.78
.58
.92
VS
26. 34.
33. 35. 16.
35. 30. 23.
47. 18. 38.
.67
.44
.33
.90
.67
.85
.19
.08
.83
.75
.10
Num
30 90
24 78 24
53 53 13
23 48 63
VDS=Very dissatisfied N =Undecided VS =Very satisfied
DS =Dissatisfied S =Satisfied Num=Number of respondents

46
In any job situation, the competency of the
supervisor impacts workers: giving good advice, praising
good work, knowing the job well, treating the employees
fairly, having good manners, being even-tempered, being
hard-working, being smart, understanding personal
problems and appreciating a job well done are some of the
traits that make a good supervisor (Reynolds, Masters and
Moser, 1986). As noted in the Table 4.11, a supervisor's
competency was a source of satisfaction in all the
gender, education levels, age groups and room rates.
Housekeeping is an honorable profession. House
keepers makes an honest living from hard work. As can be
seen in the Table 4.12, most housekeepers in all the
gender, education levels, age groups and hotel room rates
agreed than there is nothing morally wrong with their
jobs.
There are ample jobs available for good reliable
housekeepers. It is a labor-intensive job that has not
been taken over by technology. This job requires very
little skill, experience or training and that suits all
ages, gender and education levels. It provides and will
continue to provide a steady employment for anyone who
wants to work (Table 4.13). The trend seems to be that
the high school and grade school educated housekeeper had
a higher satisfaction in the security provided for in
their job than the college educated.

47
Table 4.11
Housekeeper's Job Satisfaction Demographic Survey: Item 6 - The competence of my
supervisor in making decisions
Percentage
Gender Male Female
Education Grade High School College
Age Under 25 25 - 45 Over 45
Average Room Below 40-00 40-01-80. Above 80-
00 01
VDS
6.67 10.00
16.67 5.13
16.67
3.77 9.43
15.38
Rates 8.70
12.50 11.11
DS
30.00 13.33
8.33 14.10 33.33
16.98 20.75 15.38
21.74 14.58 15.87
N
3.33 13.33
16.67 12.82 4.17
15.09 11.32 7.69
4.35 18.75 7.94
S
26, 30,
37, 34, 12,
32, 28, 30,
17, 29, 34,
.67
.00
.50
.62
.50
.08
.30
.77
.39
.17
.92
VS
33. 33.
20. 33. 33.
32. 30, 30,
47. 25. 30.
,33 ,33
,83 .33 .33
.08
.19
.77
.83
.00
.16
Num
30 90
24 78 24
53 53 13
23 48 63
VDS=Very dissatisfied N =Undecided VS =Very satisfied
DS =Dissatisfied S =Satisfied Num=Number of respondents

48
Table 4.12
Housekeeper's Job Satisfaction Demographic Survey: Item 7 - Being able to do things
that don't go against my conscience
Percentage
VDS DS N VS Num
Gender Male Female
Education Grade High School College
Age Under 25 25 - 45 Over 45
Average Room Below 40.00 40.01-80.01 Above 80.01
10.00 5.56
12.50 6.41 4.17
3.77 7.55
15.38
Rates 13.04 10.42 4.76
13.33 3.33
0.00 2.56
16.67
7.55 5.66 0.00
4.35 4.17 6.35
26. 12.
12. 14. 29.
16. 13. 23.
17, 18, 15,
.67
.22
.50
.10
.17
.98
.21
.08
.39
.75
.87
26.67 40.00
33.33 41.03 25.00
32.08 37.74 38.46
34.78 39.58 33.33
23, 38,
41. 35. 25.
39, 35, 23,
30. 27. 39.
.33
.89
.67
.90
.00
.62
.8
.08
.43
.08
.68
30 90
24 78 24
53 53 13
23 48 63
VDS=Very dissatisfied N =Undecided VS =Very satisfied
DS =Dissatisfied S =Satisfied Num=Number of respondents

49
Table 4.13
Housekeeper's Job Satisfaction Demographic Survey: Item 8 - The way my job
provides steady employment
Percentage
Gender Male Female
Education Grade High School College
Age Under 25 25 -45 Over 45
Average Room Below 40.00 40.01-80. Above 80.
,01 ,01
VDS
0.00 7.78
16.67 5.13 0.00
1.89 9.43 7.69
Rates 13.04 10.42 4.76
DS
16.67 11.11
4.17 7.69
29.17
15.09 9.43 0.00
4.35 18.75 7.94
N
23.33 14.44
12.50 17.95 20.83
15.09 18.87 23.08
17.39 18.75 14.29
S
56. 37,
50. 38, 45,
41. 33. 61.
34. 31. 49.
.67
.78
.00
.46
.83
.51
.96
.54
.78
.25
.21
VS
3. 28.
16. 30. 4.
26. 28. 7.
30, 20, 23,
.33
.89
.67
.77
.17
.42
.30
.69
.43
.83
.81
Num
30 90
24 78 24
53 53 13
23 48 63
VDS=Very dissatisfied N =Undecided VS =Very satisfied
DS =Dissatisfied S =Satisfied Num=Number of respondents

50
The chance to direct others is small in the
housekeeping department. After initial training,
housekeepers should be able to do a job with little
supervision or direction. As noted in Table 4.14, high
school educated housekeepers express the greatest level
of satisfaction in this area. This might indicate a
perceived opportiinity for advancement to a supervisory
position. High school educated housekeepers also might
be given the chance to train new employees. In Table
4.14, 37.50 percent of the grade school educated
housekeepers are very dissatisfied and probably do not
perceive any possibility of promotion in their job due to
lack of education or confidence. The trend seems to be
that high school educated housekeepers had a higher
satisfaction level than the college or grade school
housekeepers. Table 4.14 also indicated that the age
group of over 45 were less satisfied with the opportunity
to tell other people what to do. At this age group, if
the housekeepers had not advanced by then, they might not
foresee any advancement or authority to tell other people
what to do in the future.
Housekeeping, though crucial to the success of a
hotel's operation, requires little skill or experience.
This job affords almost anyone the opportunity for
gainful employment, thus making use of their abilities.

51
Table 4.14
Housekeeper's Job Satisfaction Demographic Survey: Item 10 - The chance to tell
other people what to do
Percentage
Gender Male Female
VDS
16.67 22.22
DS
20.00 15.56
N
23.33 13.33
S
23.33 33.33
VS
16.67 15.56
Num
30 90
Education Grade High School College
Age Under 25 25 - 45 Over 45
Average Room Below 40-00 40.01-80.00 Above 80.00
37.50 15.38 25.00
22.64 18.87 38.46
Rates 21.74 27.08 20.63
25, 7.
29.
16. 15. 7.
8. 16. 15.
.00
.69
.17
.98
.09
.69
.70
.67
.87
8. 16. 20.
16. 9.
23.
8. 16, 15.
.33
.67
.83
.98
.43
.08
.70
.67
.87
20. 43, 8,
30, 35, 30,
30, 29, 31,
.83
.59
.33
.19
.85
.77
.43
.17
.75
8. 16. 16.
13. 20. 0.
30. 10. 15.
.33
.67
.67
.21
.75
.00
.43
.42
.87
24 78 24
53 53 13
23 48 63
VDS=Very dissatisfied N =Undecided VS =Very satisfied
DS =Dissatisfied S =Satisfied Num=Number of respondents
52
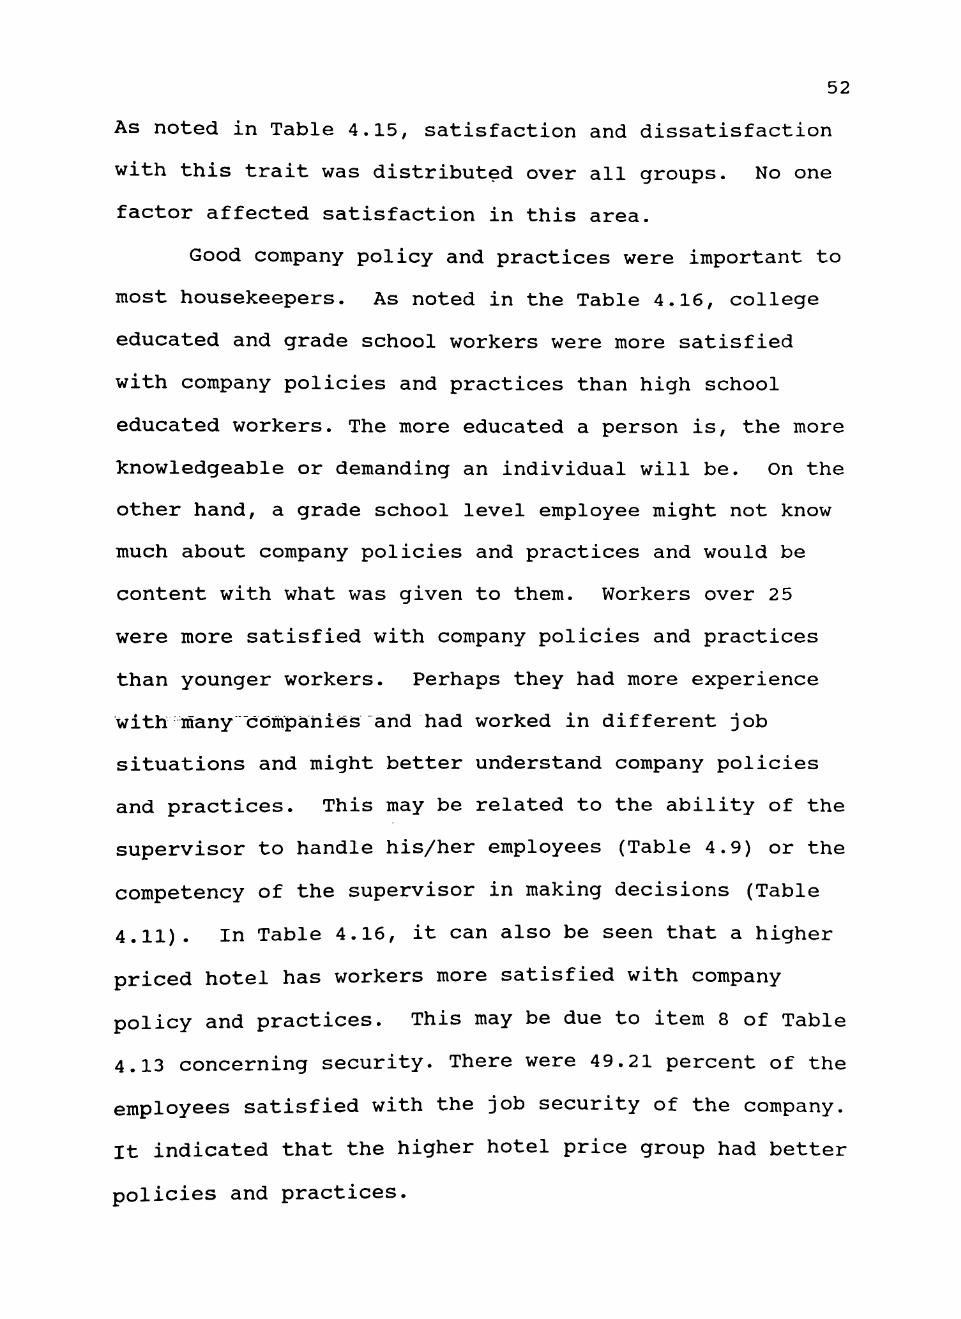
As noted in Table 4.15, satisfaction and dissatisfaction
with this trait was distributed over all groups. No one
factor affected satisfaction in this area.
Good company policy and practices were important to
most housekeepers. As noted in the Table 4.16, college
educated and grade school workers were more satisfied
with company policies and practices than high school
educated workers. The more educated a person is, the more
knowledgeable or demanding an individual will be. On the
other hand, a grade school level employee might not know
much about company policies and practices and would be
content with what was given to them. Workers over 25
were more satisfied with company policies and practices
than younger workers. Perhaps they had more experience
with many companies and had worked in different job
situations and might better understand company policies
and practices. This may be related to the ability of the
supervisor to handle his/her employees (Table 4.9) or the
competency of the supervisor in making decisions (Table
4.11). In Table 4.16, it can also be seen that a higher
priced hotel has workers more satisfied with company
policy and practices. This may be due to item 8 of Table
4.13 concerning security. There were 49.21 percent of the
employees satisfied with the job security of the company.
It indicated that the higher hotel price group had better
policies and practices.
53
Table 4.15
Housekeeper's Job Satisfaction Demographic Survey: Item 11 - The chance to do
something that makes use of my abilities
Percentage
Gender Male Female
Education Grade High School College
Age Under 25 25 - 45 Over 45
Average Room Below 40.00 40.01-80. Above 80.
00 01
VDS
16.67 13.33
8.33 15.38 25.00
16.98 13.21 23.08
Rates 26.09 20.83 9.52
DS
13.33 15.56
20.83 8.97
25.00
13.21 16.98 7.69
8.70 14.58 15.87
N
3.33 7.78
16.67 5.13 0.00
7.55 7.55 7.69
0.00 8.33 9.52
S
43, 28,
16, 41, 29,
37, 32, 30,
21. 29, 38.
.33
.89
.67
.03
.17
.74
.08
.77
.74
.17
.10
VS
23, 34,
37, 29, 20,
24, 30. 30.
43, 27, 26,
.33
.44
.50
.49
.83
.53
.19
.77
.48
.08
.98
Num
30 90
24 78 24
53 53 13
23 48 63
VDS=Very dissatisfied N =Undecided VS =Very satisfied
DS =Dissatisfied S =Satisfied Num=Number of respondents

54
Table 4.16
Housekeeper's Job Satisfaction Demographic Survey: Item 12 - The way my company
policies are put into practice
Percentage
Gender Male Female
VDS
10, 25,
.00
.56
1
26 15
DS
.67
.56
N
13. 8.
[
33 89
S
43. 37.
1
33 78
VS
6. 12.
1
67 22
Num
30 90
Education Grade High School College
Age Under 25 25 - 45 Over 45
Average Room Below 4 0.00 40.01-80.00 Above 80.01
25.00 24.36 8.33
15.09 22.64 38.46
Rates 34.78 27.08 17.46
8.33 12.82 41.67
-
18.87 18.87 7.69
8.70 14.58 22.22
12. 10. 4.
11. 9. 0.
4. 10. 9,
.50
.26
.17
.32
.43
.00
.35
.42
.52
45, 35, 45,
33, 41, 53.
30, 33, 46,
.83
.90
.83
.96
.51
.85
.43
.33
.03
8, 16, 0.
20. 7, 0.
21, 14, 4,
.33
.67
.00
.75
.55
.00
.74
.58
.76
24 78 24
53 53 13
23 48 63
VDS=Very dissatisfied N =Undecided VS =Very satisfied
DS =Dissatisfied S =Satisfied Num=Number of respondents
56
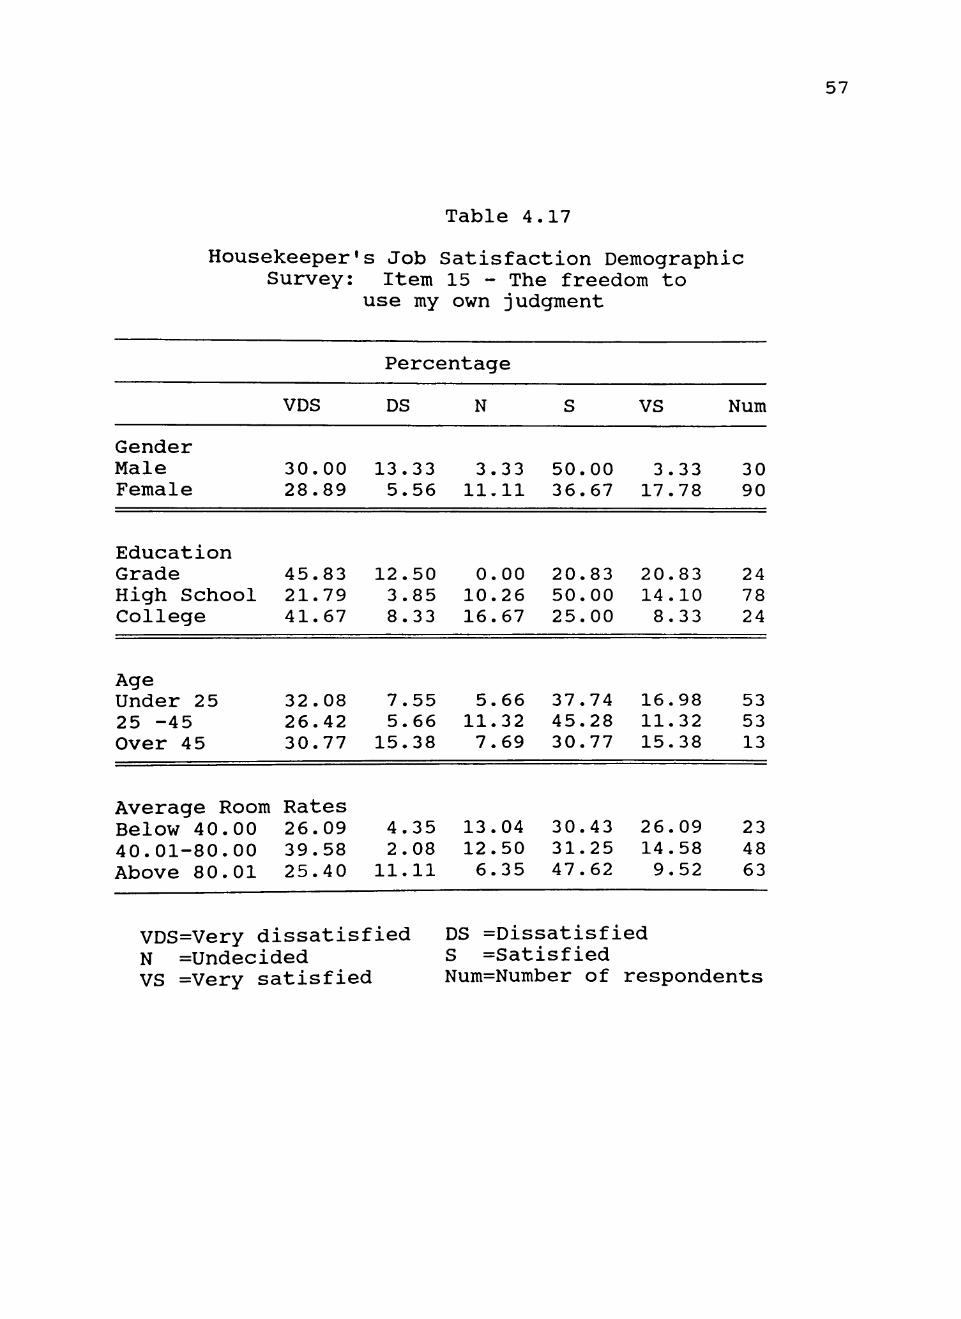
Housekeepers were not given the opportunity to make
their own decisions as to how hard they like to work and
how much time and effort they were willing to put into
their job. These were all judgmental decisions that
individual housekeepers would make when given the
opportunity to work alone and without much supervision.
In Table 4.17, male and high school educated housekeepers
reported high levels of satisfaction with this freedom.
Grade school educated housekeepers probably were not
allowed to deviate from the company's rules and
regulations and felt a high level of dissatisfaction
without the freedom to use their own judgment. College
educated workers probably felt that they were not given
the opportunity to use their creativity. Companies have
set standards of rules and regulations to use when
cleaning rooms (Tucker, 1986), which does not provide the
housekeepers much opportunity to use their own judgment.
The trends in Table 4.17 seem to be that high
school educated housekeepers were more satisfied with the
opportunity to use their judgment, while grade and
college educated did not find it so.
Analyzing Table 4.18, it was found that male and
female housekeepers of all ages, education and hotel room
rates were significantly dissatisfied with their pay.
Traditionally, housekeeping is a very low-paying job with
very little salary satisfaction. It seems that the trend
57
Table 4.17
Housekeeper's Job Satisfaction Demographic Survey: Item 15 - The freedom to
use my own judgment
Percentage
Gender Male Female
VDS
30. 28.
00 89
DS
13. 5.
33 56
N
3. 11,
,33 .11
S
50. 36.
,00 ,67
VS
3. 17.
.33
.78
Num
30 90
Education Grade High School College
Age Under 25 25 -45 Over 45
Average Room Below 40.00 40.01-80.00 Above 80.01
45.83 21.79 41.67
32.08 26.42 30.77
Rates 26.09 39.58 25.40
12, 3. 8,
7, 5,
15,
4, 2,
11,
.50
.85
.33
.55
.66
.38
.35
.08
.11
0, 10, 16,
5, 11, 7,
13, 12, 6.
.00
.26
.67
.66
.32
.69
.04
.50
.35
20. 50. 25,
37, 45, 30,
30, 31, 47,
.83
.00
.00
.74
.28
.77
.43
.25
.62
20, 14, 8,
16. 11. 15.
26. 14. 9,
.83
.10 ,33
,98 .32 .38
.09
.58
.52
24 78 24
53 53 13
23 48 63
VDS=Very dissatisfied N =Undecided VS =Very satisfied
DS =Dissatisfied S =Satisfied Num=Number of respondents

58
Table 4.18
Housekeeper's Job Satisfaction Demographic Survey: Item 13 - My pay and the
amount of work I do
Percentage
Gender Male Female
VDS
33.33 55.56
DS
16.67 12.22
N
30.00 2.22
S
13.33 22.22
VS
6.67 7.78
Num
30 90
Education Grade 66.67 16.67 0.00 8.33 8.33 24 High School 43.59 8.97 7.69 28.21 11.54 78 College 50.00 20.83 20.83 8.33 0.00 24
Age Under 25 25 -45 over 45
43 52 53
40 83 85
11.32 13.21 23.08
7.55 9.43 15.38
24.53 16.98 7.69
13.21 7.55 0.00
53 53 13
Average Room Rates Below 40.00 47.83 13.04 0.00 17.39 21.74 23 40.01-80.00 52.08 6.25 8.33 25-00 8.33 48 Above 80.01 47.62 19.05 12.70 17.46 3.17 63
VDS=Very dissatisfied N =Undecided VS =Very satisfied
DS =Dissatisfied S =Satisfied Num=Number of respondents

59
of dissatisfaction with the pay to the amount of work
done was in the order of grade school, high school and
college educated levels housekeepers, as age increased
housekeepers were more dissatisfied with their pay check.
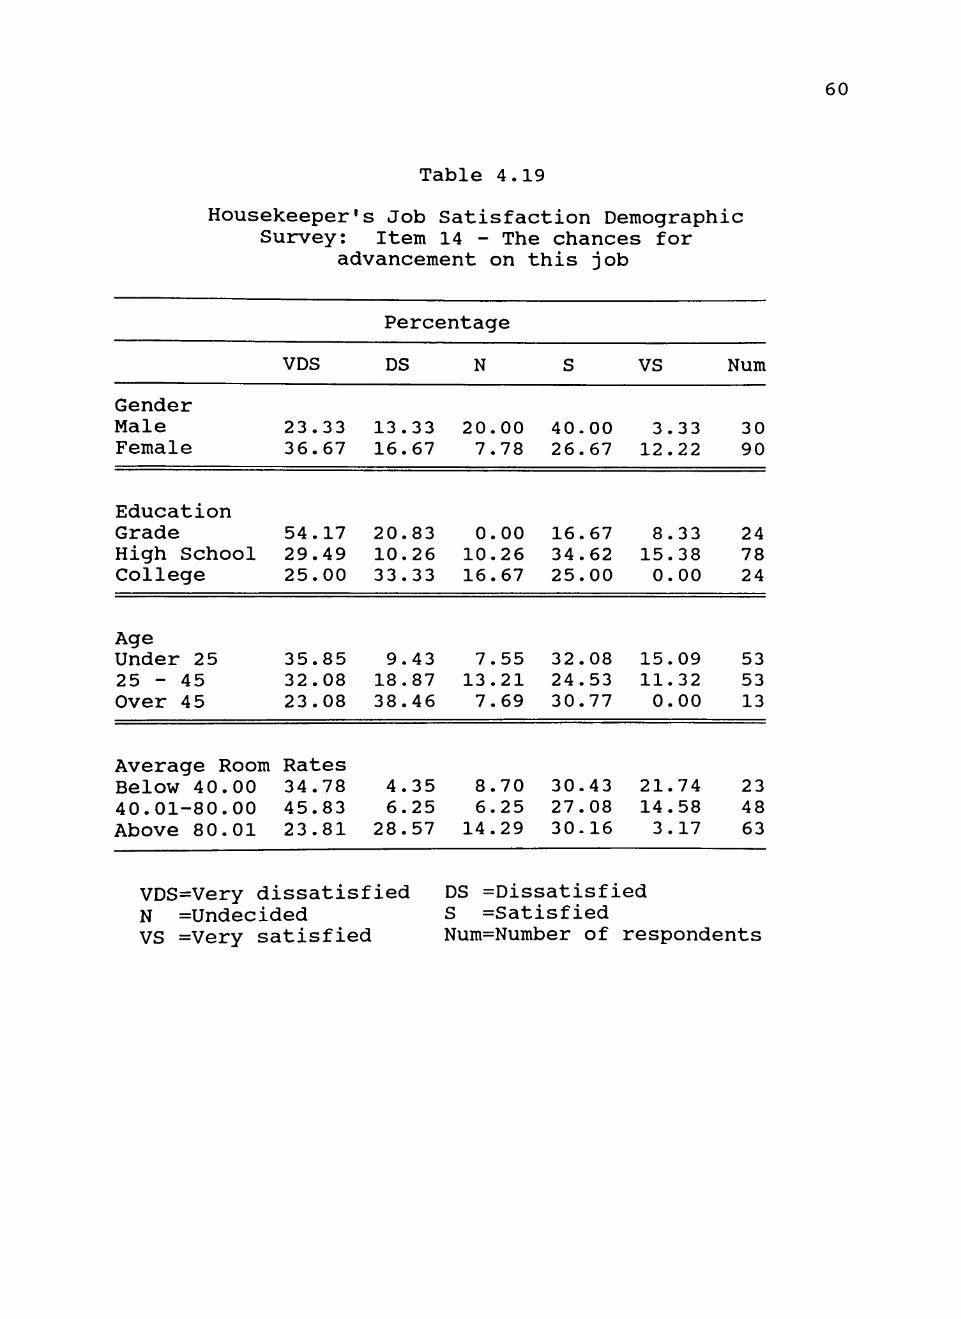
Table 4.19 indicated that there is little
advancement in the housekeeping department due to the
nature of the job which calls for only basic skills and
few job variations. Promotion is limited to a few
supervisory positions and it is unlikely to be promoted
to other departments that require different skills and
experience. College educated employees found that
advancement is dimmed with competition from college
graduates with no one reporting high satisfaction in this
area. Females were less satisfied than males, with grade
school educated workers more dissatisfied than house
keepers with higher educational levels. The trend seems
to be that as the housekeeper gets older, the less
opportunity for advancement.
Male housekeepers' jobs often have more flexibility
and opportunity to perform tasks in their own way. This
is reflected in the higher satisfaction reported in Table
4.20. Grade school educated housekeepers were much more
dissatisfied in this area. It is likely that they are
required to perform their tasks in the manner specified
by the company with little chance of creativity or
60
Table 4.19
Housekeeper's Job Satisfaction Demographic Survey: Item 14 - The chances for
advancement on this job
Gender Male Female
Education Grade High School College
Age Under 25 25 - 45 Over 45
Average Room Below 40.00 40.01-80. Above 80.
,00 ,01
VDS
23.33 36.67
54.17 29.49 25.00
35.85 32.08 23.08
Rates 34.78 45.83 23.81
Percentage
DS
13.33 16.67
20.83 10.26 33.33
9.43 18.87 38.46
4.35 6.25
28.57
N
20.00 7.78
0.00 10.26 16.67
7.55 13.21 7.69
8.70 6.25
14.29
S
40. 26,
16, 34, 25,
32, 24, 30,
30, 27. 30.
.00
.67
.67
.62
.00
.08
.53
.77
.43
.08
.16
VS
3. 12.
8. 15. 0.
15. 11. 0.
21. 14. 3.
.33
.22
.33
.38
.00
.09
.32
.00
.74
.58
.17
Num
30 90
24 78 24
53 53 13
23 48 63
VDS=Very dissatisfied N =Undecided VS =Very satisfied
DS =Dissatisfied S =Satisfied Num=Number of respondents

61
Table 4.20
Housekeeper's Job Satisfaction Demographic Survey: Item 16 - The chance to try my
own methods of doing the job
Percentage
VDS DS N VS Num
Gender Male Female
20.00 30.00
23.33 8.89
6.67 11.11
43.33 28.89
6.67 21.11
30 90
Education Grade High School College
Age Under 25 25 - 45 Over 45
Average Room Below 40.00 40.01-80.00 Above 80.01
45.83 21.79 29.17
26.42 32.08 23.08
Rates 26.09 39.58 23.81
4, 8,
25,
11, 13, 15,
8, 6,
15,
.17
.97
.00
.32
.21
.38
.70
.25
.87
4, 10. 12,
5, 7, 7.
8, 10, 7,
.17
.26
.50
.66
.55
.69
.70
.42
.94
29, 37, 20,
30, 32. 46.
30. 29, 33,
.17
.18
.83
.19
.08
.15
.43
.17
.33
16, 21, 12,
26, 15, 7,
26. 14. 19,
.67
.79
.50
.42
.09
.69
.09
.58
.05
24 78 24
53 53 13
23 48 63
VDS=Very dissatisfied N =Undecided VS =Very satisfied
DS =Dissatisfied S =Satisfied Num=Number of respondents
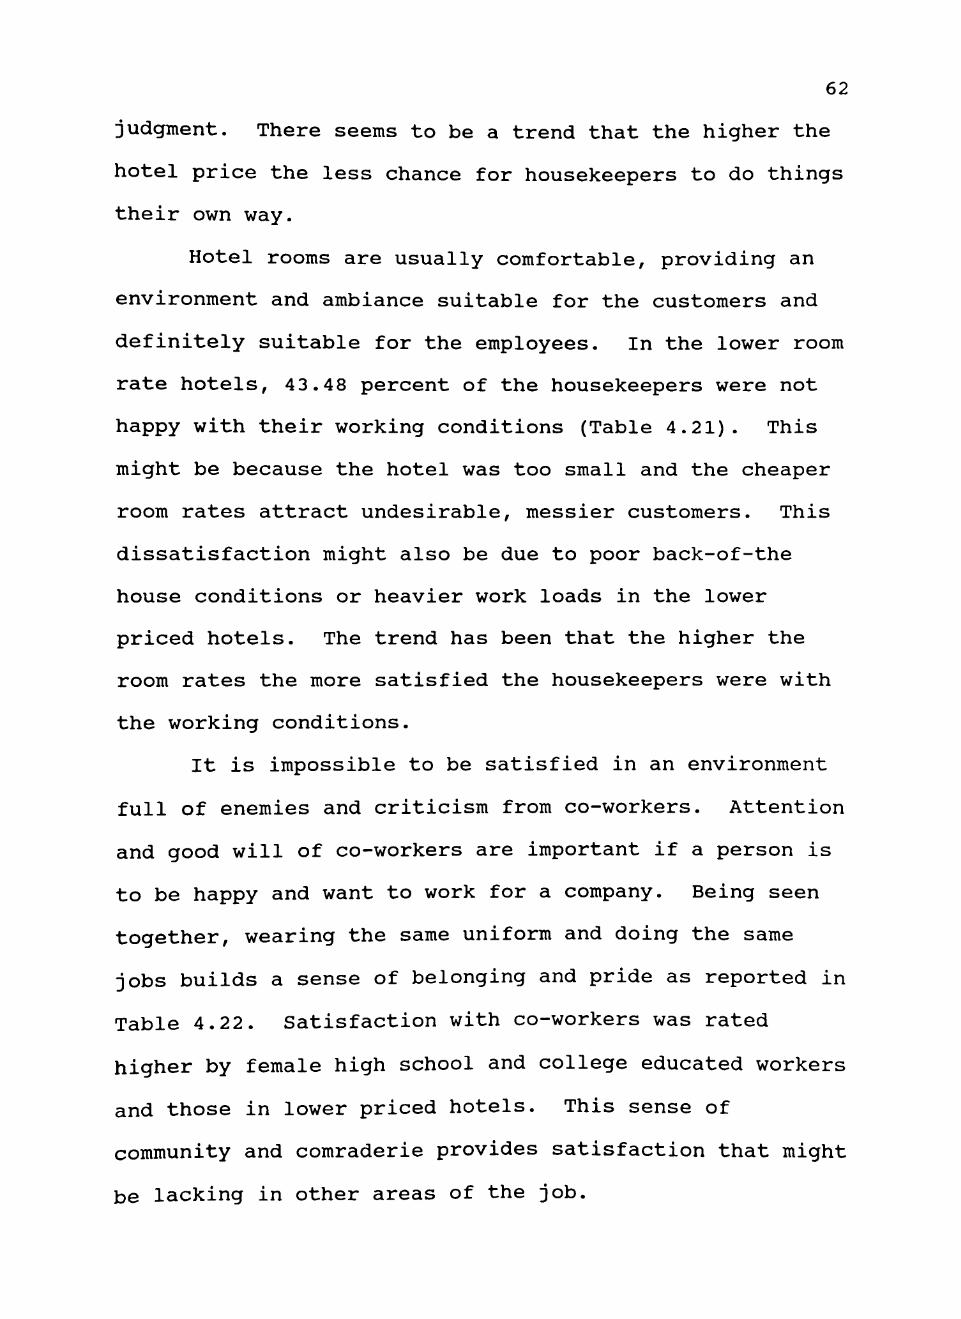
62
judgment. There seems to be a trend that the higher the
hotel price the less chance for housekeepers to do things
their own way.
Hotel rooms are usually comfortable, providing an
environment and ambiance suitable for the customers and
definitely suitable for the employees. In the lower room
rate hotels, 43.48 percent of the housekeepers were not
happy with their working conditions (Table 4.21). This
might be because the hotel was too small and the cheaper
room rates attract undesirable, messier customers. This
dissatisfaction might also be due to poor back-of-the
house conditions or heavier work loads in the lower
priced hotels. The trend has been that the higher the
room rates the more satisfied the housekeepers were with
the working conditions.
It is impossible to be satisfied in an environment
full of enemies and criticism from co-workers. Attention
and good will of co-workers are important if a person is
to be happy and want to work for a company. Being seen
together, wearing the same uniform and doing the same
jobs builds a sense of belonging and pride as reported in
Table 4.22. Satisfaction with co-workers was rated
higher by female high school and college educated workers
and those in lower priced hotels. This sense of
community and comraderie provides satisfaction that might
be lacking in other areas of the job.

63
Table 4.21
Housekeeper's Job Satisfaction Demographic Survey: Item 17 - The working conditions
Percentage
Gender Male Female
Education Grade High School College
Age Under 25 25 - 45 Over 45
-
Average Room Below 40.00 40.01-80. Above 80.
00 01
VDS
16.67 20.00
12.50 20.51 16.67
15.09 26.42 7.69
Rates 43.48 22.92 12.70
DS
33.33 16.67
25.00 10.26 41.67
16.98 16.98 23.08
8.70 14.58 25.40
N
3.33 7.78
8.33 5.13 8.33
7.55 7.55 0.00
0.00 14.58 1.59
S
40. 25.
12. 37. 29.
28, 32, 46,
21. 25. 36.
,00 ,56
.50
.18
.17
.30
.08
.15
.74
.00
.51
VS
6. 30.
41, 26, 4.
32. 16. 23.
26. 22, 23,
.67
.00
.67
.92
.17
.08
.98
.08
.09
.92
.81
Num
30 90
24 78 24
53 53 13
23 48 63
VDS=Very dissatisfied N =Undecided VS =Very satisfied
DS =Dissatisfied S =Satisfied Num=Number of respondents

64
Table 4.22
Housekeeper's Job Satisfaction Demographic Survey: Item 18 - The way my co-workers
get along with each other
Percentage
VDS DS N VS Num
Gender Male Female
3.33 15.56
23.33 8.89
26.67 10.00
33.33 44.44
13.33 21.11
30 90
Education Grade High School College
Age Under 25 25 - 45 Over 45
Average Room Below 40.00 40.01-80.00 Above 80.01
16.67 14.10 4.17
13.21 13.21 15.38
Rates 13.04 14.58 12.70
4, 7,
25,
15, 9, 0,
8, 12, 11,
.17
.69
.00
.09
.43
.00
.70
.50
.11
25, 7,
20,
11, 9,
46,
8, 12, 14,
.00
.69
.83
.32
.43
.15
.70
.50
.29
29. 47. 45.
39. 45, 30,
47. 37. 46.
.17
.44
.83
.62
.28
.77
.83
.50
.03
25.00 23.08 4.17
20.75 22.64 7.69
1.74 22.92 15.87
24 78 24
53 53 13
23 48 63
VDS=Very dissatisfied N =Undecided VS =Very satisfied
DS =Dissatisfied S =Satisfied Num=Number of respondents

65
Every job well done deserves attention and praise
from management. Housekeepers are given the opportunity
to work alone and to see the outcome of their effort.
This gives them a sense of pride especially when praise
is given by the customers or supervisors. Praise given
to a housekeeper might also encourage others to work
harder. A person's hierarchy of needs can be satisfied
by attention from management. It was found that the
college educated group was more satisfied with the
"praise" they received. Workers over 4 5 and housekeepers
in the highest priced hotels were also more satisfied
(Table 4.23). The trend seems to be that as the hotel
prices increase the more satisfied the housekeepers were
with the praise received for a job well done.
Job satisfaction cannot be obtained if a person
feels that he is not accomplishing anything. The feeling
of satisfaction with accomplishment in their job
situation was rated higher by females, at all educational
levels and those over 45 as seen in Table 4.24. The lack
of difference among housekeepers employed at different
price hotels likely indicates that the feeling of
accomplishment would be the same no matter how
expensive the room.

66
Table 4.23
Housekeeper's Job Satisfaction Demographic Survey: Item 19 - The praise I get
for doing a good job
Percentage
Gender Male Female
Education Grade High School College
Age Under 25 25 - 45 Over 45
Average Room Below 40.00 40.01-80.00 Above 80.01
VDS
10.00 12.22
8.33 16.67 4.17
7.55 15.09 15.38
Rates 34.78 20.83 3.17
DS
23.33 15.56
16.67 12.82 25.00
22.64 15.09 7.69
8.70 14.58 19.05
N
10.00 7.78
12.50 8.97 0.00
5.66 11.32 7.69
0.00 16.67 3.17
S
33.33 32.22
33.33 34.62 29.17
33.96 32.08 46.15
26.09 20.83 42.86
VS
23.33 32.22
29.17 26.92 41.67
30.19 26.42 23.08
30.43 27.08 31.75
Num
30 90
24 78 24
53 53 13
23 48 63
VDS=Very dissatisfied N =Undecided VS =Very satisfied
DS =Dissatisfied S =Satisfied Num=Number of respondents

67
Table 4.24
Housekeeper's Job Satisfaction Demographic Survey: Item 20 - The feeling of accom
plishment I get from the job
Percentage
VDS DS N VS Num
Gender Male Female
10.00 11.24
10.00 6.74
26.67 11.24
23.33 40.45
30.00 30.34
30 89
Education Grade High School College
Age Under 25 25 - 45 Over 45
Average Room Below 40.00 40.01-80.00 Above 80.01
12.50 12.99 12.00
13.21 -9.62 14.29
Rates 21.74 20.83 6.45
16, 2. 8,
5, 9 7,
4, 8, 6,
.67
.60
.00
.66
.62
.14
.35
.33
.45
12. 9,
32,
13. 17, 21.
8. 12, 17.
.50
.09
.00
.21
.31
.43
.70
.50
.74
50, 40, 12,
37. 34, 42,
30, 31. 40.
.00
.26
.00
.74
.62 ,86
.43
.25
.32
8, 35, 36,
30. 28, 14,
34. 27. 29.
.33
.06
.00
.19
.85
.29
.78
.08
.03
24 77 25
53 52 14
23 48 62
VDS=Very dissatisfied N =Undecided VS =Very satisfied
DS =Dissatisfied S =Satisfied Num=Number of respondents

68
Analysis of Variance (ANOVA)
ANOVA is a statistical method of differences among
a set of two or more means. One-way ANOVA was used in
this study to find out if there were any statistically
significant differences among gender, education, age and
average room rates by groups to the housekeeper's general
job satisfaction, extrinsic, and intrinsic motivation
scales. A four-item scale consisted of items 1, 12, 13
and 17, found in the questionnaire. Item 1 is related to
the hypothesis statement 1, which dealt with the house
keeper's job satisfaction and level of activity on the
job. Item 12 was related to the hypothesis statement 2,
of the housekeeper's job satisfaction and the company
policies and practices. Item 13 dealt with the level of
compensation while item 17 related to the working
condition of the housekeeper. Each of the four items was
related to each hypothesis statement. Combining the four
items and using ANOVA statistical differences analysis
allowed study of the effect on job satisfaction by the
different gender, education level, age and hotel price
groups.
The SPSS software program was used to tabulate the
F probability. If the calculated F probability was
greater than .05 than there was no statistical
significant differences. However, if the tabulated F
probability was smaller than the .05 probability, than a
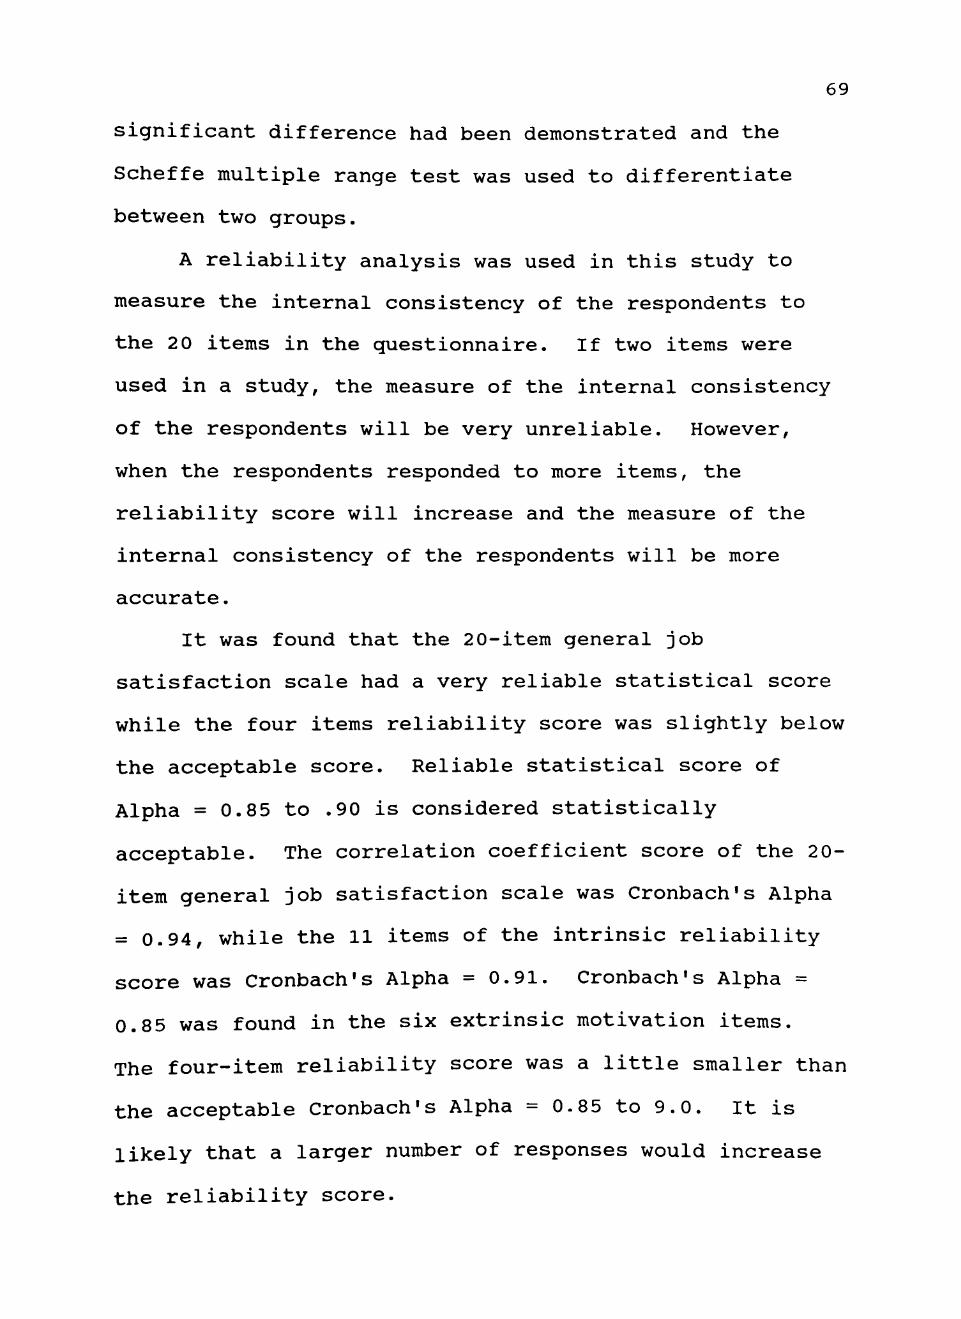
69
significant difference had been demonstrated and the
Scheffe multiple range test was used to differentiate
between two groups.
A reliability analysis was used in this study to
measure the internal consistency of the respondents to
the 2 0 items in the questionnaire. If two items were
used in a study, the measure of the internal consistency
of the respondents will be very unreliable. However,
when the respondents responded to more items, the
reliability score will increase and the measure of the
internal consistency of the respondents will be more
accurate.
It was found that the 20-item general job
satisfaction scale had a very reliable statistical score
while the four items reliability score was slightly below
the acceptable score. Reliable statistical score of
Alpha = 0.85 to .90 is considered statistically
acceptable. The correlation coefficient score of the 2 0-
item general job satisfaction scale was Cronbach's Alpha
= 0.94, while the 11 items of the intrinsic reliability
score was Cronbach's Alpha = 0.91. Cronbach's Alpha =
0.85 was found in the six extrinsic motivation items.
The four-item reliability score was a little smaller than
the acceptable Cronbach's Alpha = 0-85 to 9.0. It is
likely that a larger number of responses would increase
the reliability score.

70
As indicated in Table 4.25, there was no significant
difference between the males and females for general job
satisfaction as a housekeeper. Further analysis was
tabulated to investigate if there were any differences
between the male and female satisfaction levels of
housekeepers in the intrinsic, extrinsic and four item
motivation scales. The result from the ANOVA test was
found to be negative, implying that gender had little to
do with the level of a housekeeper's job satisfaction.
Housekeeping is a job that needs very little skill,
creativity or superiority and that warrants a different
level of job satisfaction among males and females.
Housekeepers who responded had a varied educational
background. The education level was broken down into
grade school (1-8), high school (9-12) and college
levels. As shown in Table 4.26, the high school educated
housekeepers' scores were significantly higher than the
grade school and college educated for general job
satisfaction. Further analysis, using the Schaffe
multiple range test, demonstrated a significant
difference between the grade school and high school
educated but not the high school and college in the
intrinsic motivation scale. This may be because high
school educated employees understood their jobs and
responsibilities more than the grade school educated

71
Table 4.25
Analysis of Variance of Differences Between Gender and Job Satisfaction of
Hotel Housekeepers
General Job Satisfaction Scale:
SOURCE BETWEEN GROUPS WITHIN GROUPS TOTAL
D.F. 1 118 119
Intrinsic Motivation
SOURCE BETWEEN GROUPS WITHIN GROUPS TOTAL
D.F. 1 118 119
Extrinsic Motivation
SOURCE BETWEEN GROUPS WITHIN GROUPS TOTAL
Four-Item Scale:
SOURCE BETWEEN GROUPS WITHIN GROUPS TOTAL
D.F. 1 118 119
D.F. 1 118 119
SUM OF SQUARES
4.4444 38167.4222 38171.8667
Scale: SUM SQUARES
7.8028 12432.5222 12440.3250
Scale: SUM OF SQUARES
5.1361 4740-8556 4745.9917
SUM OF SQUARES
.8028 1916.1889 1916.9917
MEAN SQUARES
.4444 323.4527
MEAN SQUARES
7.8028 105.3604
MEAN SQUARES 5.1361
40.1767
MEAN SQUARES
.8028 16.2389
F RATIO .0137
F RATIO .0741
F RATIO .1278
F RATIO .0494
F PROB. .9069
F PROB. .7860
F PROB. .7213
F PROB. .8244
D.F= Degree of Freedom F 118) greater than .05 probability, there were no significant differences
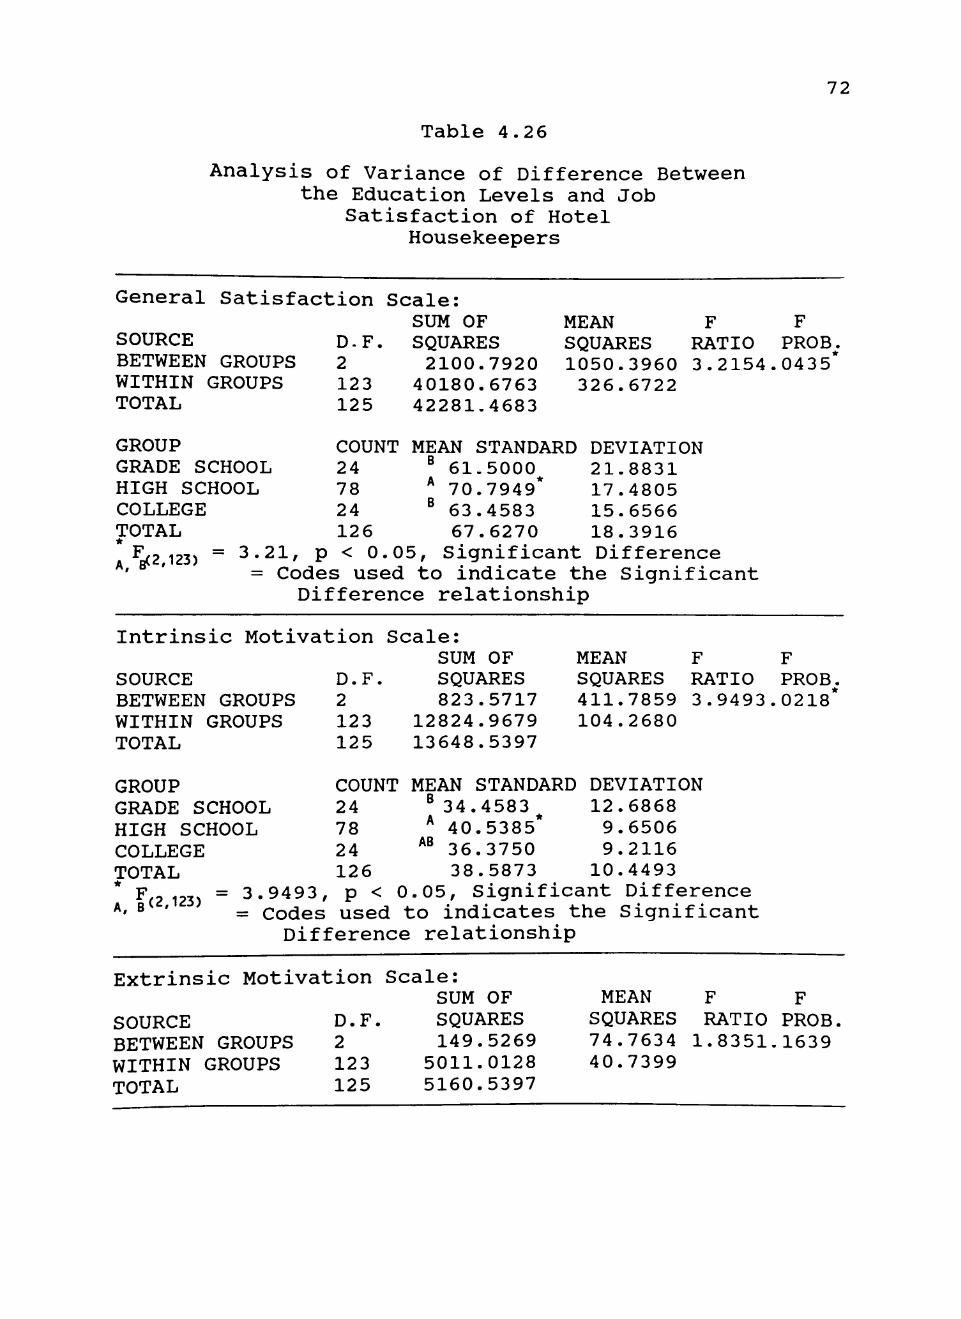
72
Table 4.26
Analysis of Variance of Difference Between the Education Levels and Job
Satisfaction of Hotel Housekeepers
General Satisfaction
SOURCE BETWEEN GROUPS WITHIN GROUPS TOTAL
GROUP GRADE SCHOOL HIGH SCHOOL COLLEGE TOTAL
D.F. 2 123 125
Scale:
COUNT 24 78 24 126
SUM OF SQUARES 2100.7920
40180.6763 42281,4683
MEAN F SQUARES RATIO 1050.3960 3.2154 326.6722
MEAN STANDARD DEVIATION ^ 61.5000^ 21.8831 * 70.7949* 17.4805 ^ 63.4583 15.6566
67.6270 18.3916
F PROB^. .0435*
A.^B(2.123) = 3.21, p < 0.05, Significant Difference = Codes used to indicate the Significant
Difference relationship
Intrinsic Motivation Scale:
SOURCE D.F. BETWEEN GROUPS 2 WITHIN GROUPS 123 TOTAL 125
SUM OF SQUARES 823.5717
12824.9679 13648.5397
MEAN SQUARES 411.7859 104.2680
F RATIO 3.9493
F PROB^. 0218*
GROUP COUNT GRADE SCHOOL 24 HIGH SCHOOL 78 COLLEGE 24 TOTAL 12 6
^(2 123) = 3.9493, p < *' ^ ' = Codes used
MEAN STANDARD ^ 34.4583^ '^ 40.5385* * 36.3750
38.5873
DEVIATION 12.6868 9.6506 9.2116
10.4493 0.05, Significant Difference to indicates the Significant
Difference relationship
Extrinsic Motivation Scale:
SOURCE D.F, BETWEEN GROUPS 2 WITHIN GROUPS 123 TOTAL 125
SUM OF SQUARES 149.5269
5011.0128 5160.5397
MEAN SQUARES 74.7634 40.7399
F F RATIO PROB, 1.8351.1639

73
Table 4.26 (continued)
Analysis of Variance of Difference Between the Education Levels and Job
Satisfaction of Hotel Housekeepers
Four Item Scale:
SOURCE BETWEEN GROUPS WITHIN GROUPS TOTAL
D.F. 2 123 125
SUM OF SQUARES
71.9586 2046.6763 2118.6349
MEAN SQUARES 35.9793 16.6396
F F RATIO PROB. 2.1623 .119
D.F= Degree of Freedom (.2 123) q^s^ter than .05 probability, significant differences
there were no

74
While college educated housekeepers found that the job
was very boring and tedious, one with very little
excitement or advancement. No significant difference was
found in the extrinsic motivation scale which might be
because all the housekeepers have the same opinion of
their companies. There were no significant difference in
the four-item scale. This might indicate that
educational background had no effect in the job
satisfaction of the housekeepers. The four items
consisted of activity on the job, company policies and
practices, compensation and working conditions.
The ages of the housekeepers were categorized into
groups of under 25 years old, 25 to 45 years old and over
45 years old. There were no two groups significantly
different between the ages in all four scales, at the
0.05 level. There were no effects of age with regard to
job satisfaction in the general job satisfaction,
intrinsic, extrinsic and four-item motivation scale as in
Table 4.27.
Data were analyzed to determine if there was any
differences in job satisfaction of employees working in a
higher priced hotel rather than a lower or medium priced
hotel. There was no significant difference in the
general job satisfaction of the housekeepers working in a
hotel rate of below $40.00 or $40.01-$80.00 or above
$80.01 price group. The average hotel room rates by
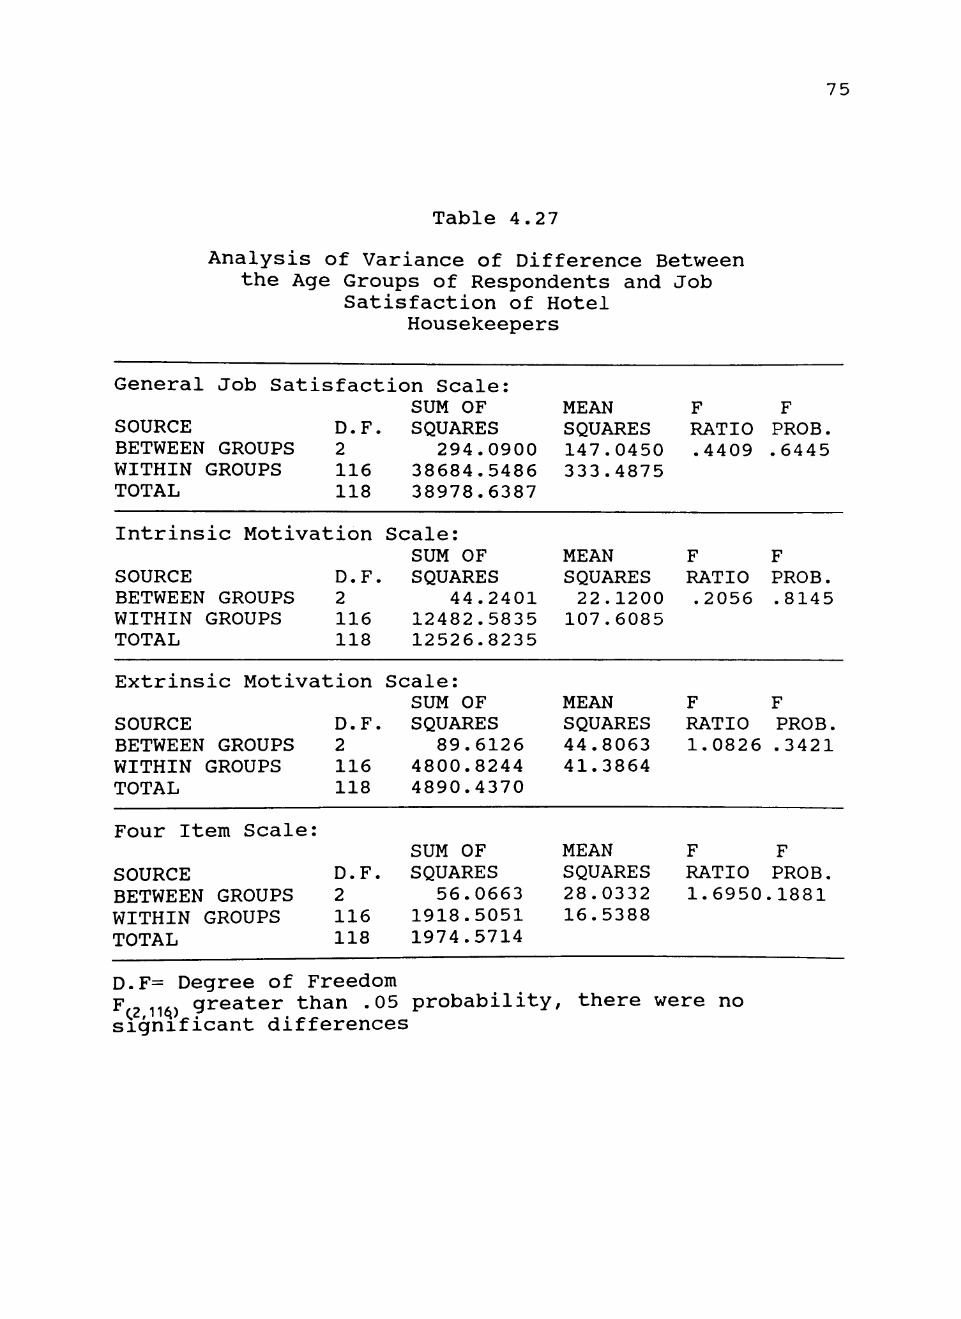
Table 4.27
Analysis of Variance of Difference Between the Age Groups of Respondents and Job
Satisfaction of Hotel Housekeepers
75
General Job Satisfact
SOURCE BETWEEN GROUPS WITHIN GROUPS TOTAL
D.F. 2 116 118
Intrinsic Motivation
SOURCE BETWEEN GROUPS WITHIN GROUPS TOTAL
D.F. 2 116 118
Extrinsic Motivation
SOURCE BETWEEN GROUPS WITHIN GROUPS TOTAL
Four Item Scale:
SOURCE BETWEEN GROUPS WITHIN GROUPS TOTAL
D.F. 2 116 118
D.F. 2 116 118
:ion Scale: SUM OF SQUARES
294.0900 38684.5486 38978.6387
Scale: SUM OF SQUARES
44.2401 12482.5835 12526.8235
Scale: SUM OF SQUARES
89.6126 4800.8244 4890.4370
SUM OF SQUARES
56.0663 1918.5051 1974.5714
MEAN SQUARES 147.0450 333.4875
MEAN SQUARES 22.1200
107.6085
MEAN SQUARES 44.8063 41.3864
MEAN SQUARES 28.0332 16.5388
F RATIO .4409
F RATIO .2056
F RATIO 1.0826
F RATIO 1.6950
F PROB. .6445
F PROB. .8145
F PROB. .3421
F PROB. .1881
D-F= Degree of Freedom F,2 116) greater than .05 probability, there were no significant differences

76
group had no effect whatever on the job satisfaction of
the housekeepers. The same was found for the intrinsic,
extrinsic and four-item motivation scale as seen in Table
4.28. It is likely that housekeeping jobs consist of the
same duties wherever one works.
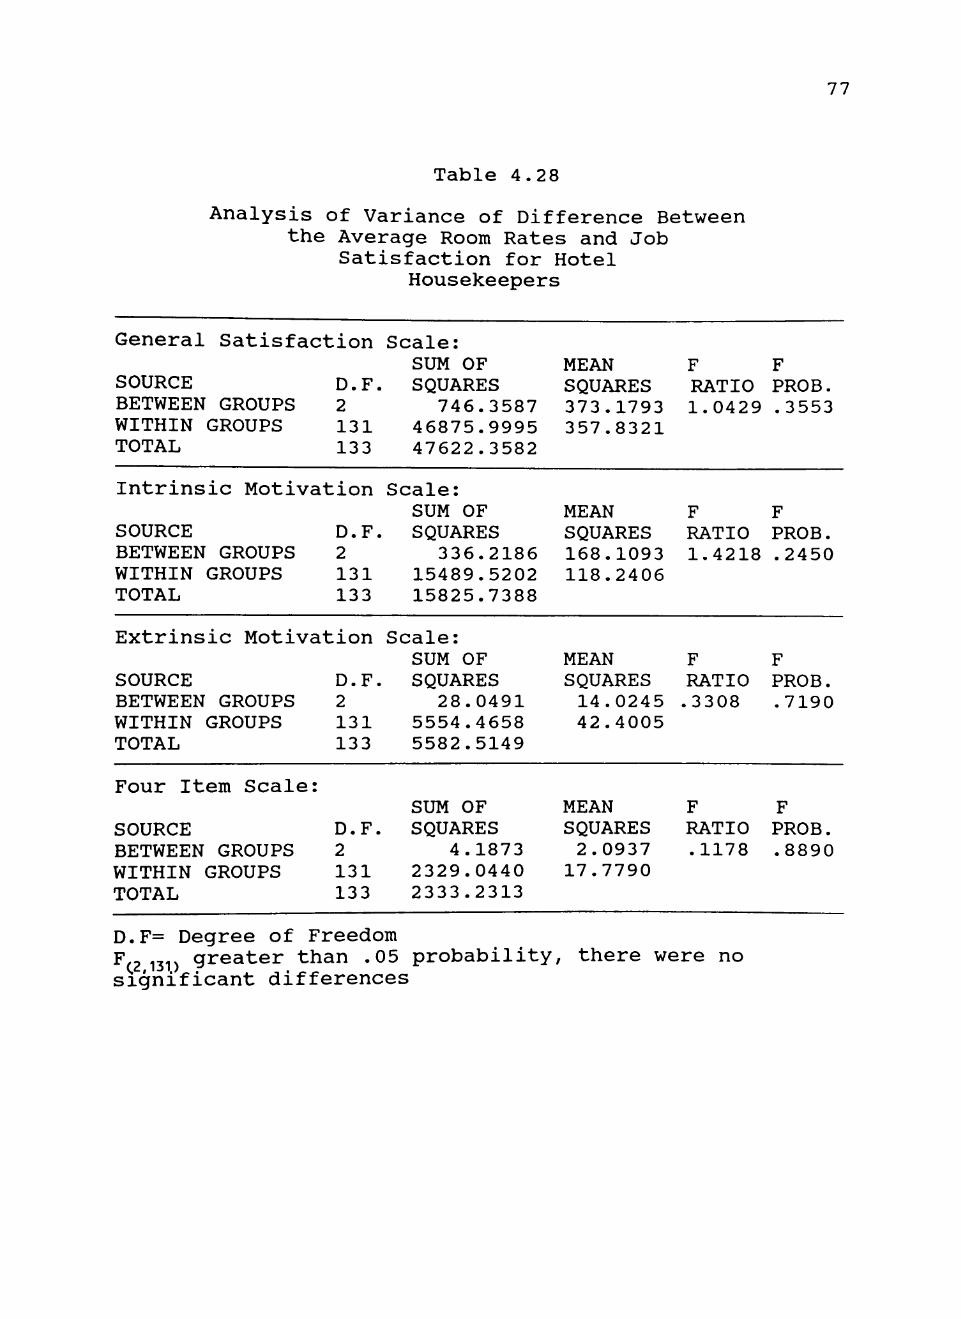
77
Table 4.28
Analysis of Variance of Difference Between the Average Room Rates and Job
Satisfaction for Hotel Housekeepers
General Satisfaction
SOURCE BETWEEN GROUPS WITHIN GROUPS TOTAL
D.F. 2 131 133
Intrinsic Motivation
SOURCE BETWEEN GROUPS WITHIN GROUPS TOTAL
D.F. 2 131 133
Extrinsic Motivation
SOURCE BETWEEN GROUPS WITHIN GROUPS TOTAL
Four Item Scale:
SOURCE BETWEEN GROUPS WITHIN GROUPS TOTAL
D.F. 2 131 133
D.F. 2 131 133
Scale: SUM OF SQUARES
746.3587 46875.9995 47622.3582
Scale: SUM OF SQUARES
336.2186 15489.5202 15825.7388
Scale: SUM OF SQUARES
28.0491 5554.4658 5582.5149
SUM OF SQUARES
4.1873 2329.0440 2333.2313
MEAN SQUARES 373.1793 357.8321
MEAN SQUARES 168.1093 118.2406
MEAN SQUARES 14.0245 42.4005
MEAN SQUARES 2.0937
17.7790
F RATIO 1.0429
F RATIO 1.4218
F RATIO .3308
F RATIO .1178
F PROB. .3553
F PROB. .2450
F PROB. .7190
F PROB. .8890
D.F= Degree of Freedom C2 131) greater than .05 probability, there were no significant differences

CHAPTER V
SUMMARY AND CONCLUSION
Summary
This study was undertaken for the purpose of examining
the job satisfaction of hotel housekeepers with the focus
on determining the individual abilities and job situations
that housekeepers prefer. Demographic breakdown of
gender, education levels, age and hotel price groups were
surveyed to study their effect of job satisfaction.
The target population was selected from listings
obtained through Hotel Redbook. Personal visits and phone
calls were made and letters were mailed to all selected
hotels, explaining the nature of the study. A
(questionnaire form of the Minnesota Satisfaction
Questionnaire was presented to the management by mail or
personal visit. The population for this study were
employees from hotels who gave their permission to allow
their housekeepers to participate. Questionnaires were
distributed to 18 hotels in the Dallas and Houston areas.
One hundred and forty-eight questionnaires were received
which was a 32 percent response rate.
The items represented in the research instrument were
reviewed, summarized, and tabulated using a SPSS software
76

77
program. The resulting data were then presented in a
tabular format utilizing percentile scores and ANOVA.
The percentile scores indicated that the housekeepers
were very dissatisfied with the company's compensation
policy and the lack of responsibility in their job. The
ability to keep them busy on the job was found to be a
very satisfying experience for the housekeepers.
Demographic breakdown of the sample characteristics
found that 75 percent of the housekeeping departments were
female. Sixty-two percent of the housekeepers had a high
school education and 89 percent of the housekeepers were
under the age of 45.
From the results of the statistical analysis, there
were no significance differences between the gender and
age groups in general job satisfaction. The intrinsic and
extrinsic motivation scales indicated that there were no
differences between gender and age in the job situation.
It was found that the high school graduate scored
significantly higher on the general job satisfaction scale
than the grade school or college educated housekeepers.
There was a significant difference between the grade
school and high school education levels but not between
the college and high school levels in the intrinsic
motivation scale. There were no significant differences
between the education level of the extrinsic and four-item
scale.
78
Conclusion
The following conclusions are based on the findings of
this study to determine the important items contributing
to a housekeeper's job satisfaction.
Apparently there was no difference in the job
satisfaction among the males and females. It can be
deduced that gender is not an important issue in the job
situation. Housekeeping is a job that provides security
and demands very little knowledge and experience from both
sexes.
The age of housekeepers had no impact on the level of
job satisfaction. The housekeeping job consists of the
same duties and age group makes no difference to the
general job satisfaction. The trend seem to be that as
age increases the housekeeper becomes less satisfied with
their pay (item 8) and advancement (item 14).
It was found that high school educated housekeepers
had a significantly higher general job satisfaction score
than the grade school and college educated housekeeper.
Grade school educated housekeepers might not have
understood the questions or meaning of the test due to
their lack of education as compared with high school
educated housekeepers. The lack of promotion within the
same education group can be another factor that
contributed to a lower satisfaction score. There seems to
be a trend that high school housekeepers seem to be more
79
satisfied in the area of job authority, compensation,
advancement and responsibility of the housekeeping duties.
There was no significant difference between the college
educated housekeepers and the high school housekeepers in
the intrinsic motivation scale.
The job and responsibilities of the housekeepers will
still be the same in the hospitality industry, no matter
what price the hotels charge. Price level had no effect
on the level of job satisfaction of the housekeepers. In
some large high priced hotels, the housekeeping
departments will be broken down into smaller divisions and
working environments that are compatible to working in
smaller hotels. Thus, working in differently priced
hotels had no effects on the housekeepers' general job
satisfaction. However, the trend seems to be that
housekeepers working for the higher priced hotel had a
higher satisfaction with the company policies and
practices, working conditions, recognition, independence
and achievement.
Suggestion for Further Survey
A continual research into the housekeeper's job
satisfaction should be explored in all hotels and motels
in America and worldwide. A study to compare the
international and domestic job situation that housekeepers
prefer should also be explored. A study of hotels'

80
policies and practices that were acceptable by the
employees can help improve the working conditions. An
understanding of the different housekeeping service levels
recjuired by the international travellers will help
management give better services to their customers.
REFERENCES
"Operators Attack Labor Shortage Problem." Restaurants & Institutions. March 4, 1987: 25.
Bell, D. "Housekeeping Polishing Dusty Reputation." Lodging Hospitality. Feb 1988: 91-93.
Carlson, R., Dawis, R., England, G. and Lofquist, L. The Measurement of Employment Satisfaction. Minnesota: University of Minnesota, 1962.
Dawis, R., England, G. and Lofquist, L. A Theory of Work Adjustment. Minnesota: University of Minnesota, 1964.
Fisher, M. "Housekeepers Gaining Deserved Respect." Hotel and Motel Management. Nov. 23, 1987: 26+.
Fisher, M. "Competition Brings Glory to Housekeeping Staff." Hotel and Motel Management. Jan. 1988: 2+.
Gay, L. Educational Research: Competencies for Analysis & Application. Columbus: Charles E. Merrill Publishing Company, 1981.
Greenberg, C. "Room Rates and Lodging Demand." The Cornell H.R.A. Quarterly. Nov. 1985: 10-11.
Hayes, J. "Chasing Older Workers." Nation's Restaurant News. May 22, 1989: F39.
Hiemstra, S.J. and Kruel, L.M. Manpower Resources and Trends in the Lodging Industry: Past and Future. Michigan: Purdue University, July 1986.
Kast, F. and Rosenzweig, J. Organization & Management: A Systems and Contingency Approach. 4th ed. New York: McGraw Hill Book Company, 1985.
Leposky, G. "The Worker Shortage: Tapping New Labor Services." Lodging. March 1987: 23-29; April 1987: 63-68; May 1987: 93-98.
Lundberg, G- and Armatas, J. The Management of People in Hotels. Restaurants and Clubs. 3rd ed. Iowa: Wm. C. Brown Company Publishers, 1979.
81

82
Mosteller, F., Fienberg, S. and Rourke, R. Beginning Statistics with Data Analysis. Massachusetts: Addison-Wesley Publishing Company, 1983: 253-254.
Reynolds, L. , Masters, S. and Moser, C. Labor Economics and Labor Relations. 9th ed. New Jersey: Prentice-Hall, 1986.
Sisk, H. Management & Organization. 3rd ed. Cincinnati South-western Publishing Company, 1977: 378-381.
Slater, D. "Hiring Dilemma Where Will the Workers Come From?" Restaurants USA. Sept. 13, 1988: 13-19.
Spatz, C. and Johnston, J. Basic Statistics Tales of Distributions. 4th ed. California: Brook/Cole Publishing Company, 1989.
Stockton, J. Business Statistics. 2nd ed. Cincinnati: South-western Publishing Company, 1962.
Stoner, C.L. "Housekeeping Managers Come Clean." Lodging Hospitality. Feb. 1987: 86-87.
Tucker, G- "Housekeeping Right Program, Right Image." Lodging. May 1986: 11-12.
Tucker, G. and Schneider, W. The Professional Housekeeper. 2nd ed. Van Nostrand Reinhold Company, 1982.
Wasmuth, W.J. and Davis, S.W. "Managing Employee Turnover." The Cornell H.R.A. Quarterly. Feb. 1983: 15-22. Pt. 1 of a series.
and . "Managing Employee Turnover: Why Employees Leave." The Cornell H.R.A. Quarterly. May 1983: 11-18. Pt. 2 of a series begun on Feb. 1983.
and . "Strategies for Managing Employee Turnover." The Cornell H.R.A. Quarterly. Aug. 1983; 65-75. Pt. 3 of a series begun on Feb. 1983.
Watkin, E., Ivany, L. and Sheehan, P. "Coping With the Hospitality Labor Shortage." Lodging Hospitality. Sept. 1985: 38+.
Weiss, D.J., Dawis, R., England, G. and Lofquist, L. Manual for the Minnesota Questionnaire. Minnesota: University of Minnesota, 1967.

83
Woodward, T. "The Price of Breaking the 1-9 LAW." Nation's Restaurant News. May 22, 1989: F67.
Zbaeren, C. "Keeping Guest Rooms Clean: Six Major Stumbling Blocks." Hotel and Motel Management. Dec. 14, 1983: 14+.

APPENDIX A
PERMISSION TO USE QUESTIONNAIRE
84

85
PERMISSION TO USE QUESTIONNAIRE
Hua S. Goh 3311 25th Street Lubbock, TX 79410
Work Adjustment Project Industrial Relations Center University of Minnesota Minneapolis, MN 55455
Dear Sir/Mdm:
I am a graduate student from Texas Tech University working on my Master's in Restaurant, Hotel, and Institutional Management. In order for me to complete my Master's, I am required to do research for my thesis.
I am writing this letter to ask for permission to use the Minnesota Satisfaction Questionnaire - Short-Form, found in the Manual for the Minnesota Satisfaction Questionnaire (vocational rehabilitation: xxii) by Weiss, Dawis, England and Lofquist, 1967.
My research is on Housekeeper's Job Satisfaction in hotels in Houston and Dallas. The questionnaire will be given to housekeepers to answer and be collected later. I would like to find out why a housekeeper stays on the job and what their reasons are for working for a company (hotel). As a result, I hope to find out how a manager can hire good employees and keep them.
I appreciate your help in this matter and hope to hear from you soon.
Thank you.
Hua S. Goh

86 UNIVERSITY OF MINNESOTA TWIN CITIES
[^i'[:)nrtrr,Mit o ' P s y c i i o l o i i y
Ell iott Hall 75 East River Road
Vocational Psycholot;v Rcscarcli N620 Elliott Mall "' (612)625-1367
March 17, 1989
Hua S. Goh 3311 25th Street Lubbock, TX 79410
Dear Sir,
Thank you for your letter of March 9, 1989 requesting infornialitMi on the Minncs(Ma Satisfaction Questionnaire.
Enclosed please find an information and registration form. l"*leasc complete ihe form, and have your advisor complete the indicated section. Return ihe form wiih a check made out in the appropriate amount to cover both your purchases and postage and handling. If your use of the MSQ is approved, \c)ur ortler will be shipped the same day as the order is received.
Thapkyou for/contacting Vocational Psychology Research.
Smce/ely yourl
i{j I Tiri_.'^^ <y' j Bill Mandschin ' Assistant Director
87
MINNESOTA SATlSrACl'IO.N QUESTIONNAIRE
QUALIFICATIONS AND REGISTR.\TION FORM (not necessary for Sample Sol)
Please type or print
Please complete the following:
y Master's Degree Doctorate Graduate Student
Specify Field
From (school) T ^ x<^ S " " t e . c ^ V^viiv/-e.t'?> \K-J
Equivalent courscwork or supervised experience: (please describe) ^ys-iVruc^^ — "5£ AV S- V^ H ^ ^ > U > T (Juvag.«'^>^
If the above items do not apply, please attach a statement of your qualifications in assessment and test interpretation with y0u^ordcr^_^ Signature { 1/ ^^\7
Return this completed form withy our check or institutional purchase order.
MSQ ORDER FORiM
MSQ SAMPLE SET Includes 1 MSQ Manual, 1 copy each of the MSQ Long Forms (1977 and 1967 revision) and MSQ Short Form $6.00 each =
MSQ MANUAJL only $4.50 each = ^
QUESTIONNAIRE BOOKLETS (Booklets are not reusable) MSQ Long Forms (minimum order of 30)
30 to 499 copies, $.60 each: 1977 version + 1967 version = @ $0.60 each =
500 or more copies, at $.58 each: 1977 version + 1967 version = @ $0.58 each
MSQ Short Form (minimum order of 50) 50 to 499 conies, $.35 each: MSQ Short Forms (a) $0.35 each = 500 or more copies, $.34 each: MSQ Short Forms @ $0.34 cach....=
Subtotal = Fourth-Class U.S. Mail, Postage and Handling (15% of Subtotal) = First-Class U.S. Mail, Postage and Handling (25% of Subtotal) =
.-"7 ^;
ORDER TOTAL = -^O, ' : . If you do not have an account with Vocational Psychology Research, payment or an official purchase order must accompany this order. Complete as applicable:
Purchase order enclosed purchase order number Check or money order enclosed
Our VPR Account Number is (charges will be added to your monthly bill).
October, 1988
88
DESCRirriON OF STUDY
— •- Tt
X:>^ UcM J
Please attach additional information regarding study if necessary.
Graduate students and others without proper qualifications:
We require the signature of your advisor or other faculty member who is supervising and assisting you in the interpretation of the results from the MSQ. This person must have at least a master's degree in psychology. Please ask them to write a brief statement and sign below.
Sincerely,
rA^K^J lalurel// signature
LYAJA/ l\uif^Ff^/\M please type or prmt name

8 9
VOCATIONAL PSYCHOLOGY RESEARCH N620 ELLIOTT HALL, UNIVERSITY OF MINNESOTA
MINNEAPOLIS. MN 55455-0344 - PHONE: (612) 625-1367
iflllE „„: CUSTOMER NO C A S H
BILL TO: SHIP TO:
This order has been paid in futl Thank you.
Hua Swee Goh 210 Waterman St al Providence. RI 02906
PURCHASE ORDER NUMBER
DATE SHIP VIA
_f-i-r-s-t—c-la S-&
e r h a L X ORDER DATE
QUANTITY ii'yeo I
0
0
i}5-/-l-6-/-8-9-
r.o.B.
)r- ia-i .n-
TERMS
ITEM NUMBER
9 2 2
S H I P
—Cash S a L e SALESPERSON
-HQ DESCRIPTION
Q M a n u a l ( M o n o g r a p h N o . 2 2 )
i i o p i ng Ch ar ge
'y/ui^tA Ifaa
OUR ORDER NUMBER
_8S7_1_ UNIT PRICE
4 . 5 0
0 . 7 5
S u D t o t a I •^ax
Tot a I _.l
AMOUNT
' . . 5 0
0 . 7 5
5 . 2 5 0 . 0 0 5 . 2 5
APPENDIX B
QUESTIONNAIRES
"t"
90

QUESTIONNAIRES ( E n g l i s h v e r s i o n )
to
>
a
2
M
CO
.2 1 ° . « -a o -S o -5 ^ -S a » =3 2 b >«
JO
a. .14
a o
. a
. a •s jS
s -s 3 es B. -S
e " 5 -
o
a 8 S
JS u o
a o
. 5 •S
s I •o o a a
u o
s o
•S
.s
E
s
u
s j i u o {5
• ° E
5" -i -i "g- jj E
.5 o 6 .^ .a c
-o 3 S . ^
o J5
I" O u
oo . 5 •5 o
T3
O o. E u
>-. s
*> 2 a. O
3
a
•S o
OS -S •s o
• o
^ 3 a
2 I -I
2 3
I -o .5
E
u u s
§ 3 •;: 3 -
• a oo .5 •a u E o
.3 u
2. >» Q .
E 8
o • o M 5
o e o
•S TJ
3 >» M
5 s •S E
! f i I
r = • ' ^ • = ^ P H H 2
5 3
s U U
H
E o
S E o
J 3 O
o • S OS
. 5 o
•S o E e % ^ O B
I" :2 & ^ 3
•S o <J
3 •5 • *
OS c o
•2 -
J3 O
•5 E
1 i .3 o
I I
8 OS
o » o
o
E
•3
I-8
=• o • ^ OS «> c M . a
1 1 H H H H H
. O -H M
O
o
e u o "a
g .• s £ 2 1 a c M o a — A CD (0 <=f c •
a k. .1= o
B E
/«^
< z z o CO
c z o H o < CO
< oo
o
(/)
•—< —J
u< —
o
a.
o
o u
<— o 3 >» O M »-> OS
l l _- <« ^t w «
o ^ •I TJ
a C
?.§ o a > *» OS o
a 3 .a o o =*• .a <» rt o» c .5
.9 " cr ? .a -
"° = :3
5 I
o • §••3
o >..
O B o «
J-a
^ s
S . 5 *" -3 ^ o
o ... "
•o o
• o
J3 O
§•
I? o
a.
3 w O .-J
a.
o
o
a
.«.s >»
* 6 2 3 q •" ° rt « •J , , <» o o S>-g •= S
5 •• •• c O
K O
•S • o a 3 X o
. o o
5 a. « 3 O »-« e n
o.
O
S 9 O
3 -^
JS
3 O
3
1^
J-t
JS
o
3 "S
•o
.2 o
, • 3
r : w B M
•3 o >. .. rt "O
5 Ji
M •S t ^
IS' E =
•So
3 O
O J3
OS .5
u •3 OS
. 5
a
3 2 S
^ • 3 3 = ^ O E
a 5 «
Si ^^ 3 a > .a
°coQ
• o - .
>
.t3
1 .a > -S
E
• o « c >-
•g ?
. 3 * 3
E S I o o O. " — c o o o -S - E c " rt S o. 3 - 1 w .2 = 5 e - .a E ? ^
f ^ l :S^cS
o
3 o
o
m o > 5
•o c a
c
CO
•a
O
c E O) k. 3 O >-
o 0 \
o
o a 3
o
C3
OS
2 JZ " r4 M ^
O —
c o E
•a c _ o o
= J8 lli o
10 o
3 3 "
= S o 00
00 c ^ ; ^ o B
C i . - 0
. 5 S
•2 3 —^ 3 O 6 ' " «»
^ 1 = ill o u o
J 3 ^ > »
3
8
-i< c o a y y . 3 <rt ^ : t . 3 <rt u ? u •»
j = 3 . c
c 0 c .2 * .2 i 2 »
: 2 ^ ^
TT «-i VO r » 0 0
9 1
92
QUESTIONNAIRES ( S p a n i s h v e r s i o n )
- 8
I-E 2
•8 S S o (J u
a 2
E u
'E
o
a g s- o
o O J=
3 .8
»> >. >. 3
f E >» ^
•5 8 <3 - 3 " .0 C «
^ -5
i' I i I >• 3
>. O
a s s "? « •;
--K t ' i
i £ •= a
2 S
o •3
- P S
>. 2
•3
8 •a o
•8 3 o
o J= o w e
. 2 3
•3 C
3 •3 B U
>.
a •3 a
k t
a • 3
3 • o k
3 U
n
Q
v. O o
"3 k .
3
*/t
a e
>. aC
55 Z a
a' If
, £ — — — — — — — — — — — _ _ — — — — — — —
a Z Z Z l Z l - - - - - - - Z Z = = Z Z Z Z Z j
zZZ Z Z Z Z Z Z Z Z Z Z Z Z Z Z Z Z Z Z 2
t«ZZ Z Z Z Z Z Z Z Z Z Z Z Z Z z z z z z ^ . « / ; _ _ _ ^ ^ „ , . , _ „ _ _ _ ^ ^ ^ ^ _ — — . — "
o
o u o • I < ca
< H u H Z u t/J u a : a.
S z
Cd a£ C3
o C O
O H Z u
2. I I
•3 73 O 2 -3 o
•a
9 o.
3 t
CO
.o rt a u
•3 -3 a
•3 c O
a •a o
T3
8
•3
•3 rt
;3 S 3 E o
E u
8 s
_o
•3
E 2
a E o
-13
u •3
• 3
3 6 •• . a • e 5 s rt Q. tl 3
£ -i - 2 , c
E -S o . 2
8 S
.9
e o 2 3 c
3 rt c 3 rt
• 3 O
tl o rt C
o 3 o-
"a 3
Q. E o
2« 3 ^
b "i o E
J J §• J 8
J3
o . 8 &
CO
•a B
g 3 3 .2 2 2 J J J3
O- -3
5 i o E
.2" o • « c o 3
J " J= 3 o tr
"S 6
j = o
3 Q. O
-S, « "3 rt -^ — .
o "E. c
o
"8 E
.o rt
u •3 •3 -3 •n B 8 .a >. *2
E
a 13 3
& _ 2 s B Q. u» rt u
• 3
u • 3 • 3
•2 B. o
•3 B
o 13 O
a a s
i i .2
o
J5
a
s C >. O
o
J J3 E J J3 J a
W CO . ^ <M n O — CM
a-s B « 0
i i s
1 o .3 g.
• sT
-3 "3
B •— O
•I E i •3 « C i! " - ^
111 > o n 3
o -S a CN — ' S
o CO
z o p < fc-O
< —
c
< z c
oo
CC
a cc
- J f^
z o u
o z
•3 rt
11 §•2
li .2 3 d o ^ §• 3 B •S3 c
.£ 3
I"
"3 .•?
o ^
§ I. C J
I
s 8 B O
B O
E
u
3
w 3
E
. a E "8
. . a. CO u
o 3 cr
3-o
e l 1 O 3
5 . 8
3 eg
.2 — E
> a
a 3 =
o e f 3 (J za
ii 3 3
I M
•3
i; 8
g s 3 U § •=• CO e> K c a..=i
•3 o a -^
CO
3 O
z i s 3 3 : o- >" o
^ S-8, -3 u a
3
. 2 ' o
S 3 c
e a
3 cr
^
3 B " 3
. - OS •« C
i?
C ^ U
^ £ 8 g
3 ^
^1
5 a
•3 I o o
— -3
8 i
3 — " >, O 3
^ 2
w •3 O
T3 a 3 U o B
.2.3
. a 3 3 CS w "
D.
M 3 a 3
- 1 CJ ^
= 0 3-
^1 -J 3 -3
o >« _ •H = o
c - :2
2 B
ti p.
£ o
s B
O "3
s e 1)
•3 rt
•3
B 3 O
O
8
s v>
v> o
B
M CC
c
cc Ui
cc
z cc;
o B
E o
CO T w ; : 3 IJ J L
O ^ .^ ^ ^/l —„ •3 o '
3 2^
to c •
3 - 2
O rn >
o
19
2
eo ^ t~
,, o
"3 ^
_ B
o 3 o £
os
o
- 3
3
Gra
d
M
Mcs
M
An
o
• 3 3
An
os
S. . c E o .2
iJ f 3 -3
1 2 - . S a 5 a 3 o
u
o _
(/>
— ; LU
c Z
• : ^ 1 ^
rt — 3 u
— -3
s
o • 3 a
3 - . (J
C 3
•« ^ . r rt ^
= y 5 *- 2
^ i 1 i i ^ w» - ^ o
C - 3 ; =
T wn ^ r * 3C

93
APPENDIX C
LETTER TO HOTELS
94
LETTER TO HOTELS
>^^/'"/ '^.-,
Texas Tech University C " t i ter for
Rcst.mr.i i i t , H o l d .md Insi i tut ion. i l \1 ,m, i j ;c fnrn i
Box 4 1 7 0 / l u b b o ( k . Icy,is i 'MO') l lbJ / iHOhi :'4J-U)fi8
August 4. 1988
To Whom It May Concern:
I am a graduate student at Texas Tech University, working on my Masters in Restaurant. Hotel and Institutional Management. For my thesis I will be doing research on room attendants' job satisfaction.
As we all know, keeping guestrooms clean is an important job for a hotel. However, housekeeping has been regarded as one of the minor operations of a hotel. It is also considered one of the dirtiest and lowest paying jobs with a high turnover rate. The U.S Bureau of labor statistics expects an annual labor shrinkage of 2.4% for men and 2.2% for women through 1990, implying that the labor intensive hospitality industry will be faced with worker shortage. A study of individual room attendants' job satisfaction will aid management in gaining an insight as to how to attract and retain good room attendants
My research will be using a short job satisfaction questionnaire for the room attendants to fill out. I need approval from the hotel to distribute the questionnaire to the room attandents to fill out during their break time or at home. I will provide a box in the break room for the completed questionnaires.
I appreciate your cooperation. Enclosed is a copy of the questionnaire.
Thank you.
Sincerely yours.
Hua S. Goh Teaching Assistant
APPENDIX D
ITEMS IN THE QUESTIONNAIRE
95
96
ITEMS IN QUESTIONNAIRE
The 2 0 items in the questionnaire are:
1. Activity—Being able to keep busy all the time.
2. Independence—The chance to work alone on the job.
3. Variety—The chance to do different things from time to time.
4. Social status—The chance to be "somebody" in the community.
5. Supervision-human relations—The way my boss handles his/her employees.
6. Supervision-technical—The competence of my supervisor in making decisions.
7. Moral values—Being able to do things that don't go against my conscience.
8. Security—The way my job provides steady employment.
9. Social service—The chance to do things for other people.
10. Authority—The chance to tell other people what to do.
11. Ability utilization—The chance to do something that makes use of my abilities
12. Company policies and practices—The way company policies are put into practices.
13. Compensation—My pay and the amount of work I do.
14. Advancement—The chances for advancement on this job.
15. Responsibility—The freedom to use my own j udgment.
16. Creativity—The chance to try my own methods of doing the job.

97
17. Working conditions—The working conditions.
18. Co-Workers—The way my co-workers get along with each other.
19. Recognition—The praise I get for doing a good job-
20. Achievement—the feeling of accomplishment I get from the job. (Weiss et al., 1964)
PERMISSION TO COPY
In presenting this thesis In partial fulfillment of the
requirements for a master's degree at Texas Tech University, I agree
that the Library and my major department shall make it freely avail
able for research purposes. Permission to copy this thesis for
scholarly purposes may be granted by the Director of the Library or
my major professor. It is understood that any copying or publication
of this thesis for financial gain shall not be allowed without my
further written permission and that any user may be liable for copy
right infringement.
Disagree (Permission not granted) Agree (Permission granted)
Student's signature Student's signature
Date
/ O / / 6 }J^ Date