johan hjort symposium, bergen, no7 oct. 2014 do eggs collected in surveys accurately reflect adult...
TRANSCRIPT

Johan Hjort Symposium, Bergen, NO7 Oct. 2014
Do eggs collected in surveys accurately reflect adult fecundities?
Hannes Höffle1, Frode B. Vikebø1, Olav S. Kjesbu1
Johan Hjort Symposium, Bergen; NO 07 October 2014
1Institute of Marine Research and Hjort Centre for Marine Ecosystem Dynamics, Bergen, NO

Johan Hjort Symposium, Bergen, NO7 Oct. 2014
• Spawning stock biomass (SSB)
• Population fecundity
• Stock reproductive potential (SRP)
Measurments of fecundity

Johan Hjort Symposium, Bergen, NO7 Oct. 2014
• Potential: Number of maturing oocytes
• Realized: Number of eggs in the Sea
How well do they match?
Population fecundity

Johan Hjort Symposium, Bergen, NO7 Oct. 2014
• Sampling error
• Size and age structure
• Atresia
• Egg mortality
• Movement between different batches
Sources of Error

Johan Hjort Symposium, Bergen, NO7 Oct. 2014
North East Arctic cod

Johan Hjort Symposium, Bergen, NO7 Oct. 2014
Spawning migration survey
Mar. – Apr., since 1985
Acoustics
CTD
Bottom Trawls (N=902)
Ichthyoplankton (N=2114)

Johan Hjort Symposium, Bergen, NO7 Oct. 2014
Temperature at 30 m
•Offshore: Warm Atlantic water
•Inshore: Cool runoff influenced water
•Cooling in Vestfjorden

Johan Hjort Symposium, Bergen, NO7 Oct. 2014
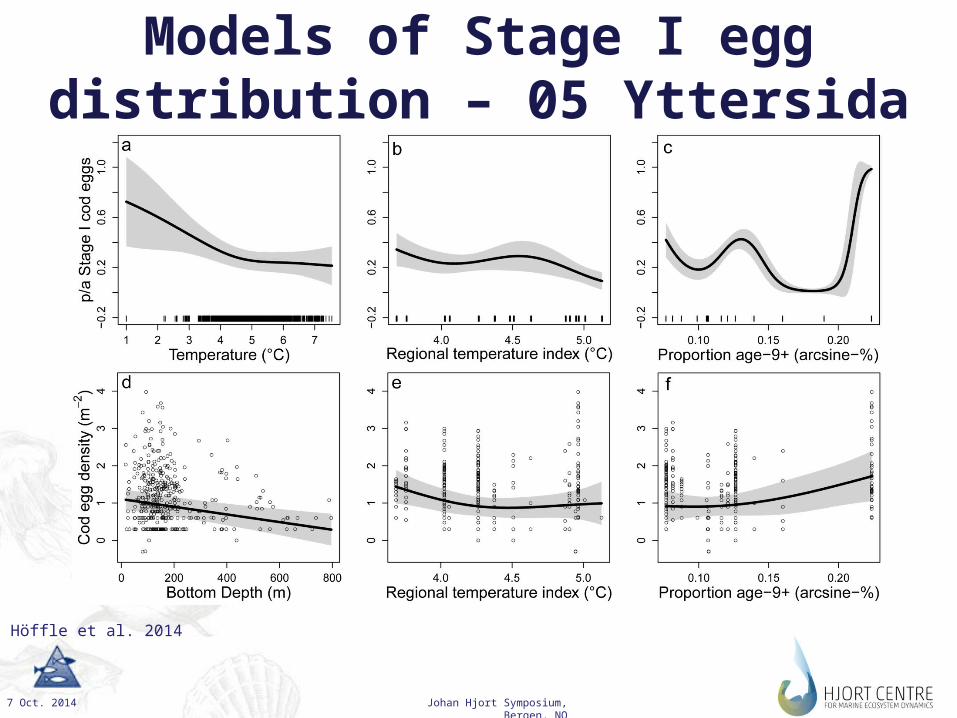
Models of Stage I egg distributionGeneralized additive mixed models (GAMMs)
Separate for areas 00 (Vestfjorden) and 05 (Yttersida)
Models for presence/absence and non-zero abundance
Fixed Factors•Local temperature at 30 m
•Bottom Depth
•Proportion of old fish (age-9+)
•Regional temperature index (Kola transect)
Random Factors•Autocovariate
•Median Year Day

Johan Hjort Symposium, Bergen, NO7 Oct. 2014
Models of Stage I egg distribution – 00 Vestfjorden
Höffle et al. 2014
Johan Hjort Symposium, Bergen, NO7 Oct. 2014
Models of Stage I egg distribution – 05 Yttersida
Höffle et al. 2014

Johan Hjort Symposium, Bergen, NO7 Oct. 2014
Real and modeled egg distribution
Höffle et al. 2014
Survey Data Model

Johan Hjort Symposium, Bergen, NO7 Oct. 2014
0
20
40
60
80
100
120
Per
cen
t of N
max
Day of the Year
93
Scaling to annual egg production
σ .... Standard Deviationt .... Day of the YearN(t) .... No. eggs at day t
𝑁(𝑡) = 𝑁𝑚𝑎𝑥𝑒−12𝜎2(𝑡−𝑡𝑚𝑎𝑥 )2
Peak spawning: Days 93 and 98 (>69°N)
Standard Deviation: 15

Johan Hjort Symposium, Bergen, NO7 Oct. 2014
Potential fecundity – NEA cod
•Gonad samples
•Winter and Lofoten cruise
•191 fish
•Number and size of oocytes
•Image analysis (auto-diametric)

Johan Hjort Symposium, Bergen, NO7 Oct. 2014
Potential fecundity vs. length
y = 0.0494e0.0475x
R² = 0.8118
0
5
10
15
20
25
40 60 80 100 120 140
Po
ten
tial
fecu
nd
ity
(Mio
.)
Length (cm)
Johan Hjort Symposium, Bergen, NO7 Oct. 2014
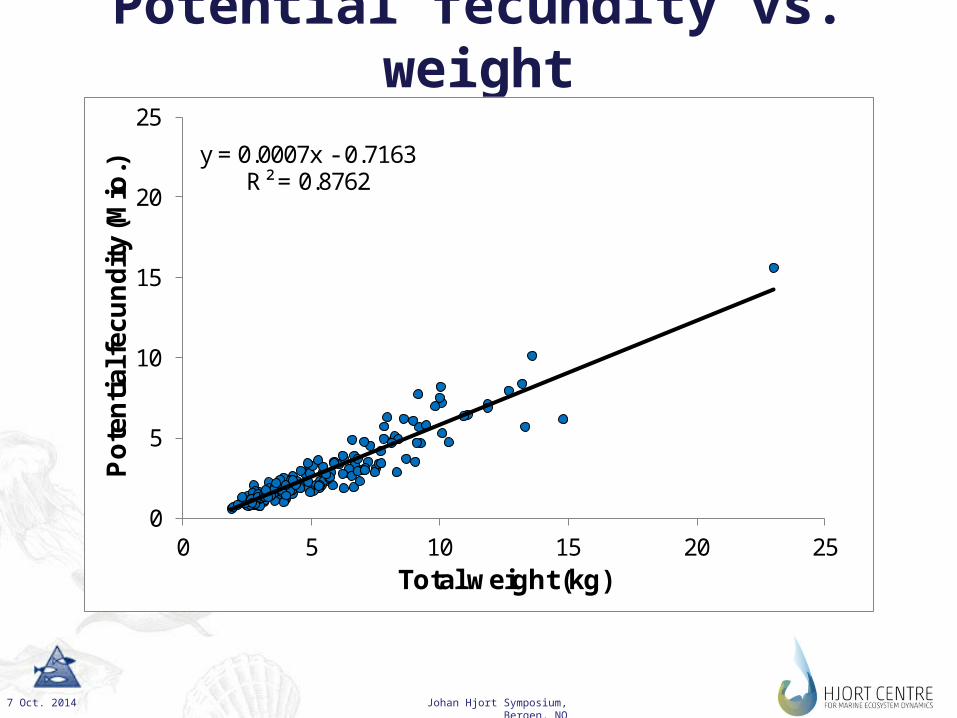
Potential fecundity vs. weight
y = 0.0007x - 0.7163R² = 0.8762
0
5
10
15
20
25
0 5 10 15 20 25
Po
ten
tial
fecu
nd
ity
(Mio
.)
Total weight (kg)

Johan Hjort Symposium, Bergen, NO7 Oct. 2014
Scaling to population fecundity
• Length and Weight based formulae
Data from Stock assessment and survey
• Length, weight, maturity and numbers at age
• Sex ratio
Johan Hjort Symposium, Bergen, NO7 Oct. 2014
0
50 000
100 000
150 000
200 000
250 000
Fec
un
dit
y (B
illi
on
s eg
gs)
Years
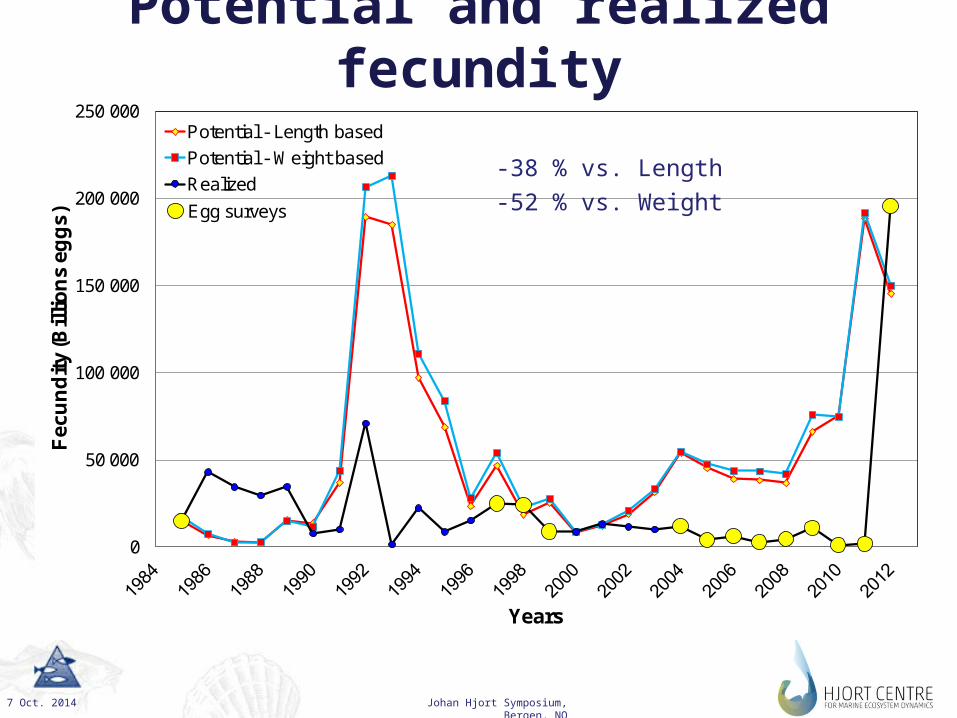
Potential - Length based
Potential - Weight based
Realized
Egg surveys
Potential and realized fecundity
-38 % vs. Length
-52 % vs. Weight
Johan Hjort Symposium, Bergen, NO7 Oct. 2014
Conclusion and outlook
• Highly variable relationship of realized and potential fecundity
What next?
• Include atresia, mortality and drift
• Resolve spatial distribution of fecundities
Johan Hjort Symposium, Bergen, NO7 Oct. 2014
AcknowledgementsCaptains and crews of
the ships involved.
ICES for additional
CTD data.
AFWG for stock data.
Dr. Svein Sundby
Dr. Per Solemdal
Dr. Arved Staby
Thank [email protected]
