johannes kepler university linz - city university london
TRANSCRIPT
Regulation and Energy Supply Security
Michael Schmidthaler
Johannes Kepler University Linz
July 12, 2012
Introduction, Research Questions and MethodologyResults, Policy Recommendation and Summary
Appendix (if time allows)
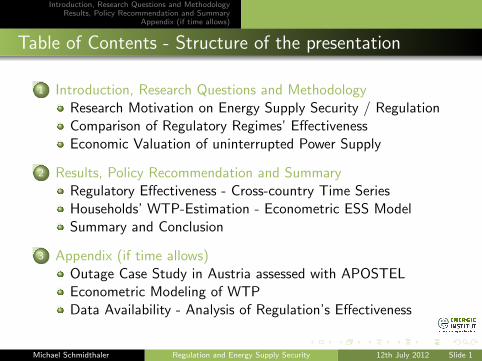
Table of Contents - Structure of the presentation
1 Introduction, Research Questions and MethodologyResearch Motivation on Energy Supply Security / RegulationComparison of Regulatory Regimes’ EffectivenessEconomic Valuation of uninterrupted Power Supply
2 Results, Policy Recommendation and SummaryRegulatory Effectiveness - Cross-country Time SeriesHouseholds’ WTP-Estimation - Econometric ESS ModelSummary and Conclusion
3 Appendix (if time allows)Outage Case Study in Austria assessed with APOSTELEconometric Modeling of WTPData Availability - Analysis of Regulation’s Effectiveness
Michael Schmidthaler Regulation and Energy Supply Security 12th July 2012 Slide 1
Introduction, Research Questions and MethodologyResults, Policy Recommendation and Summary
Appendix (if time allows)
Research Motivation on Energy Supply Security / RegulationComparison of Regulatory Regimes’ EffectivenessEconomic Valuation of uninterrupted Power Supply
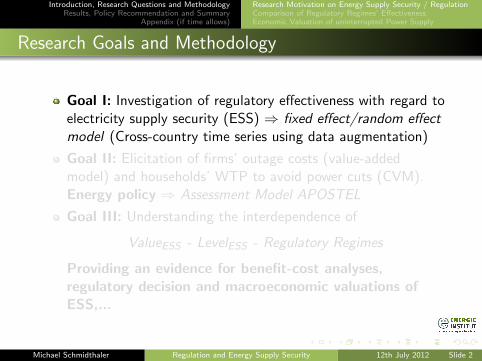
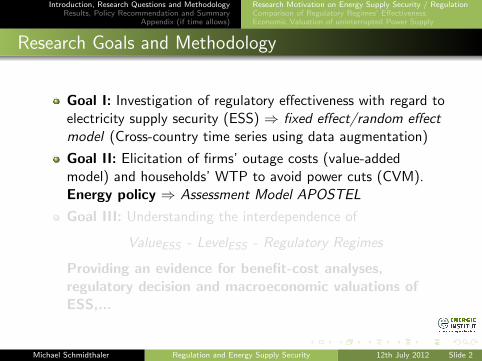
Research Goals and Methodology
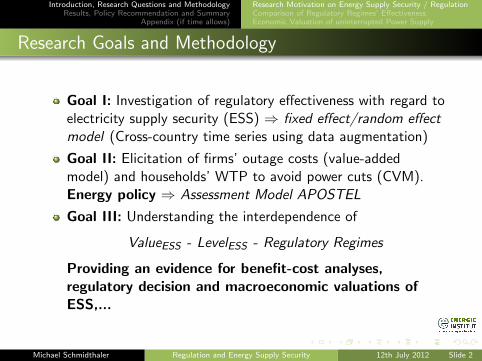
Goal I: Investigation of regulatory effectiveness with regard toelectricity supply security (ESS) ⇒ fixed effect/random effectmodel (Cross-country time series using data augmentation)
Goal II: Elicitation of firms’ outage costs (value-addedmodel) and households’ WTP to avoid power cuts (CVM).Energy policy ⇒ Assessment Model APOSTEL
Goal III: Understanding the interdependence of
ValueESS - LevelESS - Regulatory Regimes
Providing an evidence for benefit-cost analyses,regulatory decision and macroeconomic valuations ofESS,...
Michael Schmidthaler Regulation and Energy Supply Security 12th July 2012 Slide 2
Introduction, Research Questions and MethodologyResults, Policy Recommendation and Summary
Appendix (if time allows)
Research Motivation on Energy Supply Security / RegulationComparison of Regulatory Regimes’ EffectivenessEconomic Valuation of uninterrupted Power Supply
Research Goals and Methodology
Goal I: Investigation of regulatory effectiveness with regard toelectricity supply security (ESS) ⇒ fixed effect/random effectmodel (Cross-country time series using data augmentation)
Goal II: Elicitation of firms’ outage costs (value-addedmodel) and households’ WTP to avoid power cuts (CVM).Energy policy ⇒ Assessment Model APOSTEL
Goal III: Understanding the interdependence of
ValueESS - LevelESS - Regulatory Regimes
Providing an evidence for benefit-cost analyses,regulatory decision and macroeconomic valuations ofESS,...
Michael Schmidthaler Regulation and Energy Supply Security 12th July 2012 Slide 2

Introduction, Research Questions and MethodologyResults, Policy Recommendation and Summary
Appendix (if time allows)
Research Motivation on Energy Supply Security / RegulationComparison of Regulatory Regimes’ EffectivenessEconomic Valuation of uninterrupted Power Supply
Approach to assess Regulation in Terms of Reliability
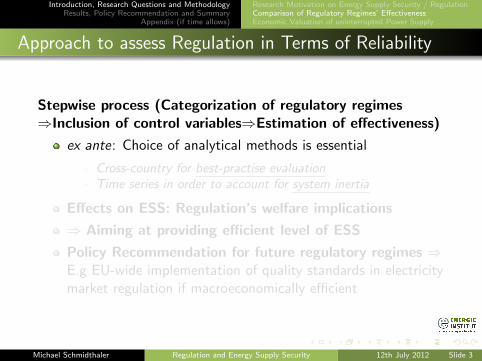
Stepwise process (Categorization of regulatory regimes⇒Inclusion of control variables⇒Estimation of effectiveness)
ex ante: Choice of analytical methods is essential
- Cross-country for best-practise evaluation- Time series in order to account for system inertia
Effects on ESS: Regulation’s welfare implications
⇒ Aiming at providing efficient level of ESS
Policy Recommendation for future regulatory regimes ⇒E.g EU-wide implementation of quality standards in electricitymarket regulation if macroeconomically efficient
Michael Schmidthaler Regulation and Energy Supply Security 12th July 2012 Slide 3
Introduction, Research Questions and MethodologyResults, Policy Recommendation and Summary
Appendix (if time allows)
Research Motivation on Energy Supply Security / RegulationComparison of Regulatory Regimes’ EffectivenessEconomic Valuation of uninterrupted Power Supply
Approach to assess Regulation in Terms of Reliability
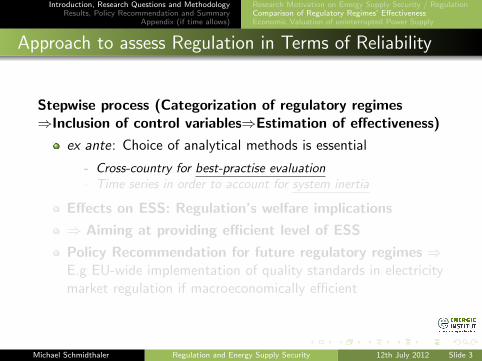
Stepwise process (Categorization of regulatory regimes⇒Inclusion of control variables⇒Estimation of effectiveness)
ex ante: Choice of analytical methods is essential
- Cross-country for best-practise evaluation- Time series in order to account for system inertia
Effects on ESS: Regulation’s welfare implications
⇒ Aiming at providing efficient level of ESS
Policy Recommendation for future regulatory regimes ⇒E.g EU-wide implementation of quality standards in electricitymarket regulation if macroeconomically efficient
Michael Schmidthaler Regulation and Energy Supply Security 12th July 2012 Slide 3

Introduction, Research Questions and MethodologyResults, Policy Recommendation and Summary
Appendix (if time allows)
Research Motivation on Energy Supply Security / RegulationComparison of Regulatory Regimes’ EffectivenessEconomic Valuation of uninterrupted Power Supply
Approach to assess Regulation in Terms of Reliability
Stepwise process (Categorization of regulatory regimes⇒Inclusion of control variables⇒Estimation of effectiveness)
ex ante: Choice of analytical methods is essential
- Cross-country for best-practise evaluation- Time series in order to account for system inertia
Effects on ESS: Regulation’s welfare implications
⇒ Aiming at providing efficient level of ESS
Policy Recommendation for future regulatory regimes ⇒E.g EU-wide implementation of quality standards in electricitymarket regulation if macroeconomically efficient
Michael Schmidthaler Regulation and Energy Supply Security 12th July 2012 Slide 3
Introduction, Research Questions and MethodologyResults, Policy Recommendation and Summary
Appendix (if time allows)
Research Motivation on Energy Supply Security / RegulationComparison of Regulatory Regimes’ EffectivenessEconomic Valuation of uninterrupted Power Supply
Approach to assess Regulation in Terms of Reliability
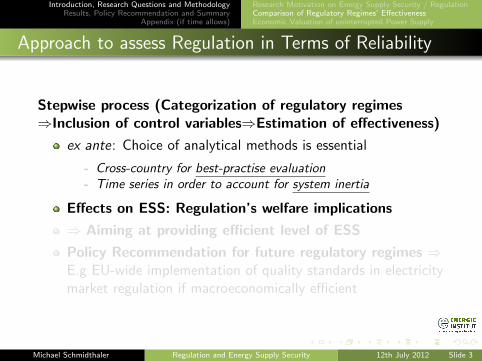
Stepwise process (Categorization of regulatory regimes⇒Inclusion of control variables⇒Estimation of effectiveness)
ex ante: Choice of analytical methods is essential
- Cross-country for best-practise evaluation- Time series in order to account for system inertia
Effects on ESS: Regulation’s welfare implications
⇒ Aiming at providing efficient level of ESS
Policy Recommendation for future regulatory regimes ⇒E.g EU-wide implementation of quality standards in electricitymarket regulation if macroeconomically efficient
Michael Schmidthaler Regulation and Energy Supply Security 12th July 2012 Slide 3

Introduction, Research Questions and MethodologyResults, Policy Recommendation and Summary
Appendix (if time allows)
Research Motivation on Energy Supply Security / RegulationComparison of Regulatory Regimes’ EffectivenessEconomic Valuation of uninterrupted Power Supply
Approach to assess Regulation in Terms of Reliability
Stepwise process (Categorization of regulatory regimes⇒Inclusion of control variables⇒Estimation of effectiveness)
ex ante: Choice of analytical methods is essential
- Cross-country for best-practise evaluation- Time series in order to account for system inertia
Effects on ESS: Regulation’s welfare implications
⇒ Aiming at providing efficient level of ESS
Policy Recommendation for future regulatory regimes ⇒E.g EU-wide implementation of quality standards in electricitymarket regulation if macroeconomically efficient
Michael Schmidthaler Regulation and Energy Supply Security 12th July 2012 Slide 3
Introduction, Research Questions and MethodologyResults, Policy Recommendation and Summary
Appendix (if time allows)
Research Motivation on Energy Supply Security / RegulationComparison of Regulatory Regimes’ EffectivenessEconomic Valuation of uninterrupted Power Supply
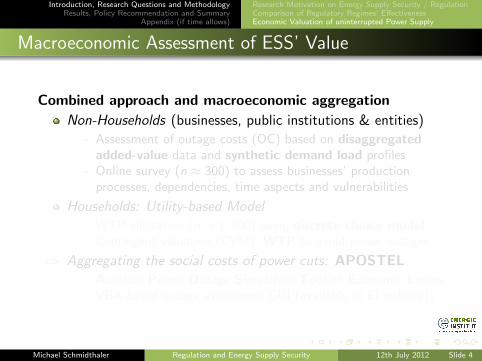
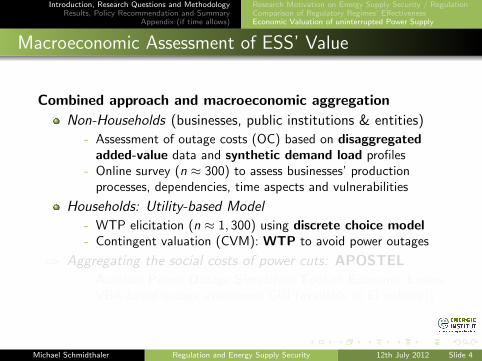
Macroeconomic Assessment of ESS’ Value
Combined approach and macroeconomic aggregation
Non-Households (businesses, public institutions & entities)
- Assessment of outage costs (OC) based on disaggregatedadded-value data and synthetic demand load profiles
- Online survey (n ≈ 300) to assess businesses’ productionprocesses, dependencies, time aspects and vulnerabilities
Households: Utility-based Model
- WTP elicitation (n ≈ 1, 300) using discrete choice model- Contingent valuation (CVM): WTP to avoid power outages
⇒ Aggregating the social costs of power cuts: APOSTEL- Austrian Power Outage Simulation Tool of Economic Losses- VBA-based outage assessment GUI (available at EI website))
Michael Schmidthaler Regulation and Energy Supply Security 12th July 2012 Slide 4
Introduction, Research Questions and MethodologyResults, Policy Recommendation and Summary
Appendix (if time allows)
Research Motivation on Energy Supply Security / RegulationComparison of Regulatory Regimes’ EffectivenessEconomic Valuation of uninterrupted Power Supply
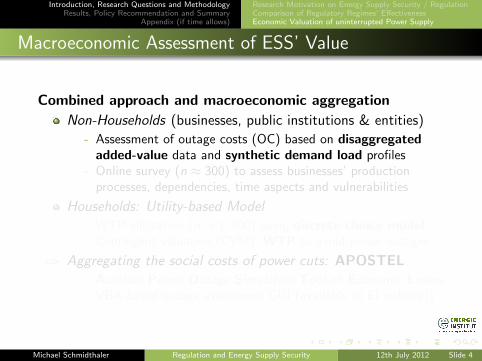
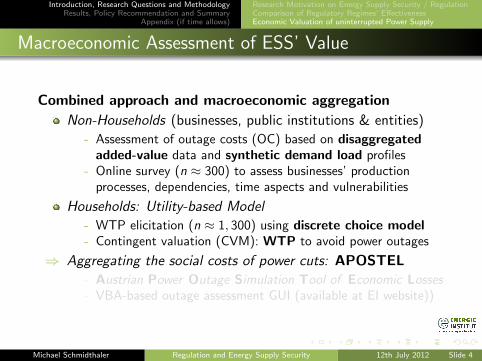
Macroeconomic Assessment of ESS’ Value
Combined approach and macroeconomic aggregation
Non-Households (businesses, public institutions & entities)
- Assessment of outage costs (OC) based on disaggregatedadded-value data and synthetic demand load profiles
- Online survey (n ≈ 300) to assess businesses’ productionprocesses, dependencies, time aspects and vulnerabilities
Households: Utility-based Model
- WTP elicitation (n ≈ 1, 300) using discrete choice model- Contingent valuation (CVM): WTP to avoid power outages
⇒ Aggregating the social costs of power cuts: APOSTEL- Austrian Power Outage Simulation Tool of Economic Losses- VBA-based outage assessment GUI (available at EI website))
Michael Schmidthaler Regulation and Energy Supply Security 12th July 2012 Slide 4
Introduction, Research Questions and MethodologyResults, Policy Recommendation and Summary
Appendix (if time allows)
Research Motivation on Energy Supply Security / RegulationComparison of Regulatory Regimes’ EffectivenessEconomic Valuation of uninterrupted Power Supply
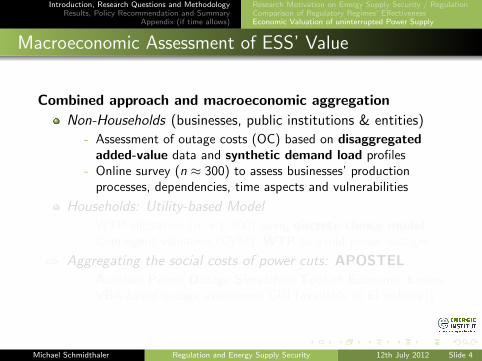
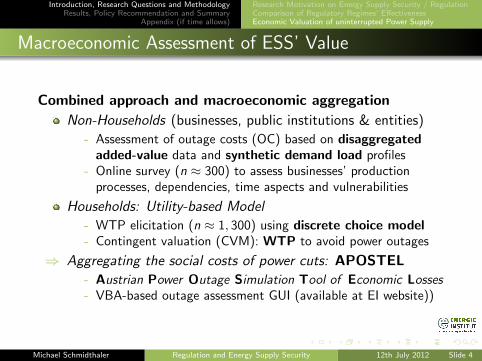
Macroeconomic Assessment of ESS’ Value
Combined approach and macroeconomic aggregation
Non-Households (businesses, public institutions & entities)
- Assessment of outage costs (OC) based on disaggregatedadded-value data and synthetic demand load profiles
- Online survey (n ≈ 300) to assess businesses’ productionprocesses, dependencies, time aspects and vulnerabilities
Households: Utility-based Model
- WTP elicitation (n ≈ 1, 300) using discrete choice model- Contingent valuation (CVM): WTP to avoid power outages
⇒ Aggregating the social costs of power cuts: APOSTEL- Austrian Power Outage Simulation Tool of Economic Losses- VBA-based outage assessment GUI (available at EI website))
Michael Schmidthaler Regulation and Energy Supply Security 12th July 2012 Slide 4
Introduction, Research Questions and MethodologyResults, Policy Recommendation and Summary
Appendix (if time allows)
Research Motivation on Energy Supply Security / RegulationComparison of Regulatory Regimes’ EffectivenessEconomic Valuation of uninterrupted Power Supply
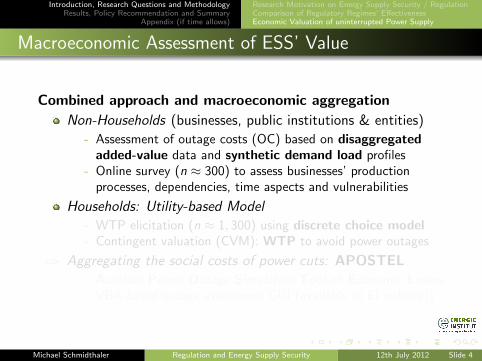
Macroeconomic Assessment of ESS’ Value
Combined approach and macroeconomic aggregation
Non-Households (businesses, public institutions & entities)
- Assessment of outage costs (OC) based on disaggregatedadded-value data and synthetic demand load profiles
- Online survey (n ≈ 300) to assess businesses’ productionprocesses, dependencies, time aspects and vulnerabilities
Households: Utility-based Model
- WTP elicitation (n ≈ 1, 300) using discrete choice model- Contingent valuation (CVM): WTP to avoid power outages
⇒ Aggregating the social costs of power cuts: APOSTEL- Austrian Power Outage Simulation Tool of Economic Losses- VBA-based outage assessment GUI (available at EI website))
Michael Schmidthaler Regulation and Energy Supply Security 12th July 2012 Slide 4

Introduction, Research Questions and MethodologyResults, Policy Recommendation and Summary
Appendix (if time allows)
Research Motivation on Energy Supply Security / RegulationComparison of Regulatory Regimes’ EffectivenessEconomic Valuation of uninterrupted Power Supply
Macroeconomic Assessment of ESS’ Value
Combined approach and macroeconomic aggregation
Non-Households (businesses, public institutions & entities)
- Assessment of outage costs (OC) based on disaggregatedadded-value data and synthetic demand load profiles
- Online survey (n ≈ 300) to assess businesses’ productionprocesses, dependencies, time aspects and vulnerabilities
Households: Utility-based Model
- WTP elicitation (n ≈ 1, 300) using discrete choice model- Contingent valuation (CVM): WTP to avoid power outages
⇒ Aggregating the social costs of power cuts: APOSTEL- Austrian Power Outage Simulation Tool of Economic Losses- VBA-based outage assessment GUI (available at EI website))
Michael Schmidthaler Regulation and Energy Supply Security 12th July 2012 Slide 4
Introduction, Research Questions and MethodologyResults, Policy Recommendation and Summary
Appendix (if time allows)
Regulatory Effectiveness - Cross-country Time SeriesHouseholds’ WTP-Estimation - Econometric ESS ModelSummary and Conclusion
Results of ESS and Regulation Assessment
This section contains:
Presentation of Regulatory Regression approach
Comparison of different regression models - Coefficients forWTP to avoid power outages
Summary, Policy recommendation and Synthesis
Power outage case study with APOSTEL, if time allows
Michael Schmidthaler Regulation and Energy Supply Security 12th July 2012 Slide 5
Introduction, Research Questions and MethodologyResults, Policy Recommendation and Summary
Appendix (if time allows)
Regulatory Effectiveness - Cross-country Time SeriesHouseholds’ WTP-Estimation - Econometric ESS ModelSummary and Conclusion
Presentation of Work in Progress: Basic Ideas
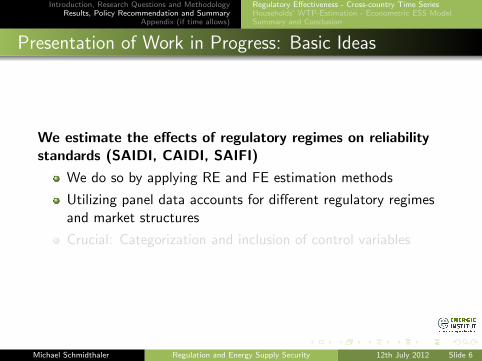
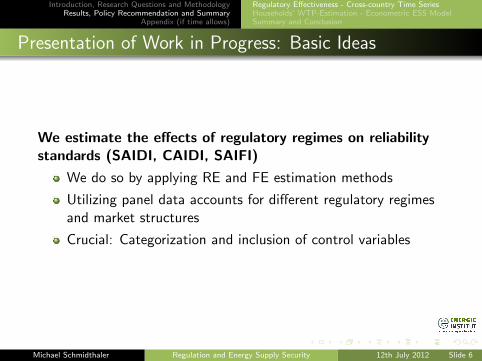
We estimate the effects of regulatory regimes on reliabilitystandards (SAIDI, CAIDI, SAIFI)
We do so by applying RE and FE estimation methods
Utilizing panel data accounts for different regulatory regimesand market structures
Crucial: Categorization and inclusion of control variables
Michael Schmidthaler Regulation and Energy Supply Security 12th July 2012 Slide 6
Introduction, Research Questions and MethodologyResults, Policy Recommendation and Summary
Appendix (if time allows)
Regulatory Effectiveness - Cross-country Time SeriesHouseholds’ WTP-Estimation - Econometric ESS ModelSummary and Conclusion
Presentation of Work in Progress: Basic Ideas
We estimate the effects of regulatory regimes on reliabilitystandards (SAIDI, CAIDI, SAIFI)
We do so by applying RE and FE estimation methods
Utilizing panel data accounts for different regulatory regimesand market structures
Crucial: Categorization and inclusion of control variables
Michael Schmidthaler Regulation and Energy Supply Security 12th July 2012 Slide 6
Introduction, Research Questions and MethodologyResults, Policy Recommendation and Summary
Appendix (if time allows)
Regulatory Effectiveness - Cross-country Time SeriesHouseholds’ WTP-Estimation - Econometric ESS ModelSummary and Conclusion
Presentation of Work in Progress: Research
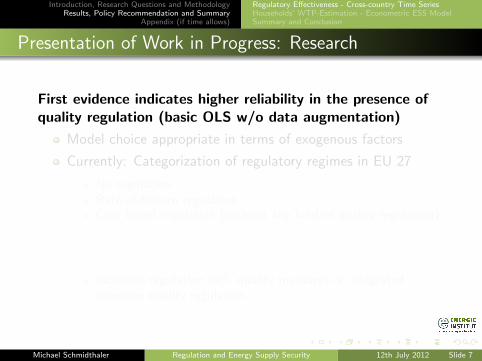
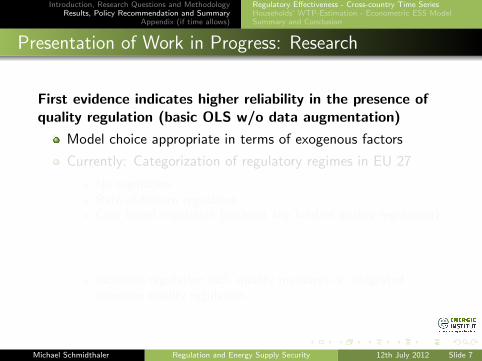
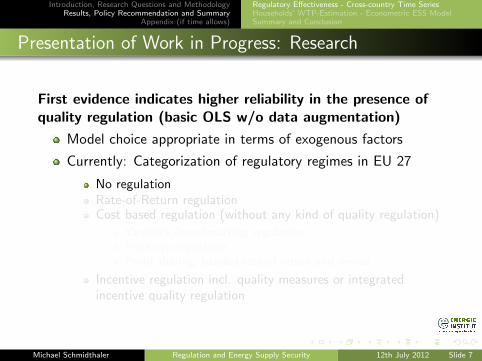
First evidence indicates higher reliability in the presence ofquality regulation (basic OLS w/o data augmentation)
Model choice appropriate in terms of exogenous factors
Currently: Categorization of regulatory regimes in EU 27
No regulationRate-of-Return regulationCost based regulation (without any kind of quality regulation)
Yardstick/benchmarking regulationPrice cap regulationProfit sharing, banded rate-of-return and menus
Incentive regulation incl. quality measures or integratedincentive quality regulation
Michael Schmidthaler Regulation and Energy Supply Security 12th July 2012 Slide 7
Introduction, Research Questions and MethodologyResults, Policy Recommendation and Summary
Appendix (if time allows)
Regulatory Effectiveness - Cross-country Time SeriesHouseholds’ WTP-Estimation - Econometric ESS ModelSummary and Conclusion
Presentation of Work in Progress: Research
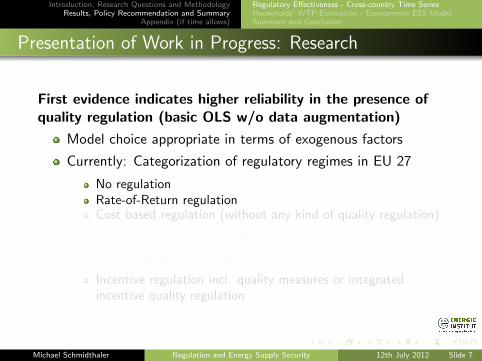
First evidence indicates higher reliability in the presence ofquality regulation (basic OLS w/o data augmentation)
Model choice appropriate in terms of exogenous factors
Currently: Categorization of regulatory regimes in EU 27
No regulationRate-of-Return regulationCost based regulation (without any kind of quality regulation)
Yardstick/benchmarking regulationPrice cap regulationProfit sharing, banded rate-of-return and menus
Incentive regulation incl. quality measures or integratedincentive quality regulation
Michael Schmidthaler Regulation and Energy Supply Security 12th July 2012 Slide 7

Introduction, Research Questions and MethodologyResults, Policy Recommendation and Summary
Appendix (if time allows)
Regulatory Effectiveness - Cross-country Time SeriesHouseholds’ WTP-Estimation - Econometric ESS ModelSummary and Conclusion
Presentation of Work in Progress: Research
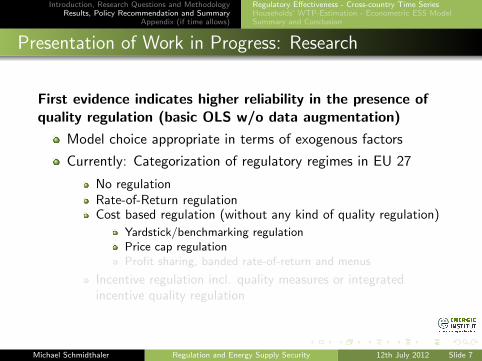
First evidence indicates higher reliability in the presence ofquality regulation (basic OLS w/o data augmentation)
Model choice appropriate in terms of exogenous factors
Currently: Categorization of regulatory regimes in EU 27
No regulationRate-of-Return regulationCost based regulation (without any kind of quality regulation)
Yardstick/benchmarking regulationPrice cap regulationProfit sharing, banded rate-of-return and menus
Incentive regulation incl. quality measures or integratedincentive quality regulation
Michael Schmidthaler Regulation and Energy Supply Security 12th July 2012 Slide 7
Introduction, Research Questions and MethodologyResults, Policy Recommendation and Summary
Appendix (if time allows)
Regulatory Effectiveness - Cross-country Time SeriesHouseholds’ WTP-Estimation - Econometric ESS ModelSummary and Conclusion
Presentation of Work in Progress: Research
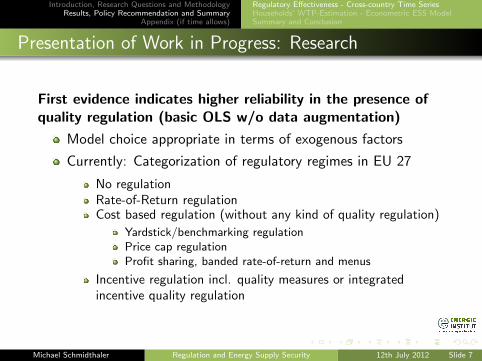
First evidence indicates higher reliability in the presence ofquality regulation (basic OLS w/o data augmentation)
Model choice appropriate in terms of exogenous factors
Currently: Categorization of regulatory regimes in EU 27
No regulationRate-of-Return regulationCost based regulation (without any kind of quality regulation)
Yardstick/benchmarking regulationPrice cap regulationProfit sharing, banded rate-of-return and menus
Incentive regulation incl. quality measures or integratedincentive quality regulation
Michael Schmidthaler Regulation and Energy Supply Security 12th July 2012 Slide 7
Introduction, Research Questions and MethodologyResults, Policy Recommendation and Summary
Appendix (if time allows)
Regulatory Effectiveness - Cross-country Time SeriesHouseholds’ WTP-Estimation - Econometric ESS ModelSummary and Conclusion
Presentation of Work in Progress: Research
First evidence indicates higher reliability in the presence ofquality regulation (basic OLS w/o data augmentation)
Model choice appropriate in terms of exogenous factors
Currently: Categorization of regulatory regimes in EU 27
No regulationRate-of-Return regulationCost based regulation (without any kind of quality regulation)
Yardstick/benchmarking regulationPrice cap regulationProfit sharing, banded rate-of-return and menus
Incentive regulation incl. quality measures or integratedincentive quality regulation
Michael Schmidthaler Regulation and Energy Supply Security 12th July 2012 Slide 7
Introduction, Research Questions and MethodologyResults, Policy Recommendation and Summary
Appendix (if time allows)
Regulatory Effectiveness - Cross-country Time SeriesHouseholds’ WTP-Estimation - Econometric ESS ModelSummary and Conclusion
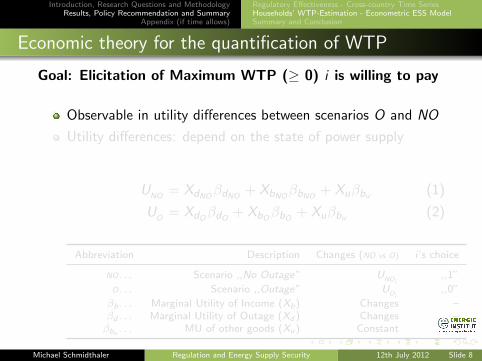
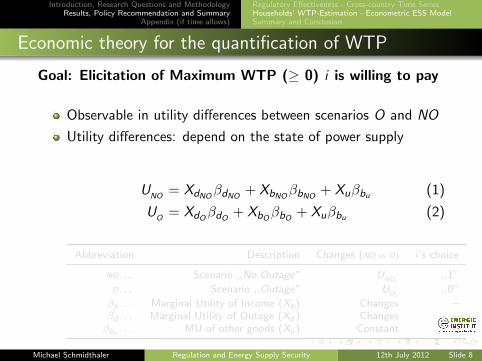
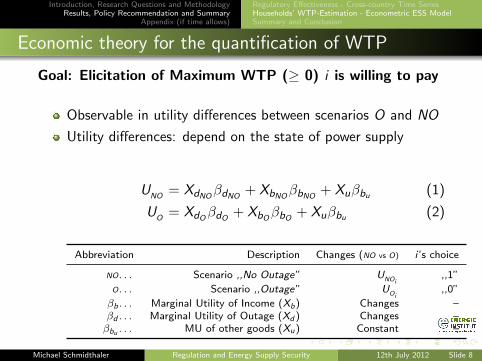
Economic theory for the quantification of WTP
Goal: Elicitation of Maximum WTP (≥ 0) i is willing to pay
Observable in utility differences between scenarios O and NO
Utility differences: depend on the state of power supply
UNO
= XdNOβdNO
+ XbNOβbNO
+ Xuβbu (1)
UO
= XdOβdO + XbOβbO + Xuβbu (2)
Abbreviation Description Changes (NO vs O) i ’s choice
NO. . . Scenario ,,No Outage” UNOi,,1”
O. . . Scenario ,,Outage” UOi,,0”
βb. . . Marginal Utility of Income (Xb) Changes –βd . . . Marginal Utility of Outage (Xd ) Changes –βbu . . . MU of other goods (Xu) Constant –
Michael Schmidthaler Regulation and Energy Supply Security 12th July 2012 Slide 8

Introduction, Research Questions and MethodologyResults, Policy Recommendation and Summary
Appendix (if time allows)
Regulatory Effectiveness - Cross-country Time SeriesHouseholds’ WTP-Estimation - Econometric ESS ModelSummary and Conclusion
Economic theory for the quantification of WTP
Goal: Elicitation of Maximum WTP (≥ 0) i is willing to pay
Observable in utility differences between scenarios O and NO
Utility differences: depend on the state of power supply
UNO
= XdNOβdNO
+ XbNOβbNO
+ Xuβbu (1)
UO
= XdOβdO + XbOβbO + Xuβbu (2)
Abbreviation Description Changes (NO vs O) i ’s choice
NO. . . Scenario ,,No Outage” UNOi,,1”
O. . . Scenario ,,Outage” UOi,,0”
βb. . . Marginal Utility of Income (Xb) Changes –βd . . . Marginal Utility of Outage (Xd ) Changes –βbu . . . MU of other goods (Xu) Constant –
Michael Schmidthaler Regulation and Energy Supply Security 12th July 2012 Slide 8
Introduction, Research Questions and MethodologyResults, Policy Recommendation and Summary
Appendix (if time allows)
Regulatory Effectiveness - Cross-country Time SeriesHouseholds’ WTP-Estimation - Econometric ESS ModelSummary and Conclusion
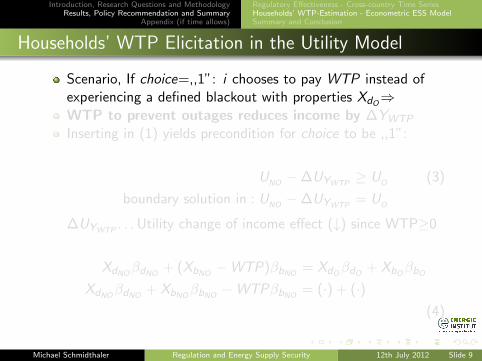
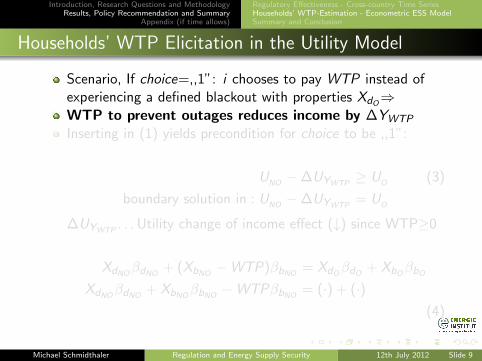
Households’ WTP Elicitation in the Utility Model
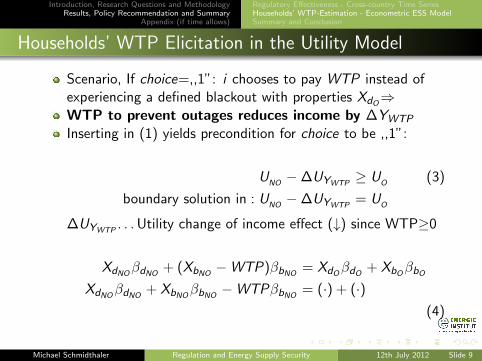
Scenario, If choice=,,1”: i chooses to pay WTP instead ofexperiencing a defined blackout with properties XdO⇒WTP to prevent outages reduces income by ∆YWTP
Inserting in (1) yields precondition for choice to be ,,1”:
UNO−∆UYWTP
≥ UO
(3)
boundary solution in : UNO−∆UYWTP
= UO
∆UYWTP. . . Utility change of income effect (↓) since WTP≥0
XdNOβdNO + (XbNO−WTP)βbNO = XdOβdO + XbOβbO
XdNOβdNO + XbNOβbNO −WTPβbNO = (·) + (·)(4)
Michael Schmidthaler Regulation and Energy Supply Security 12th July 2012 Slide 9
Introduction, Research Questions and MethodologyResults, Policy Recommendation and Summary
Appendix (if time allows)
Regulatory Effectiveness - Cross-country Time SeriesHouseholds’ WTP-Estimation - Econometric ESS ModelSummary and Conclusion
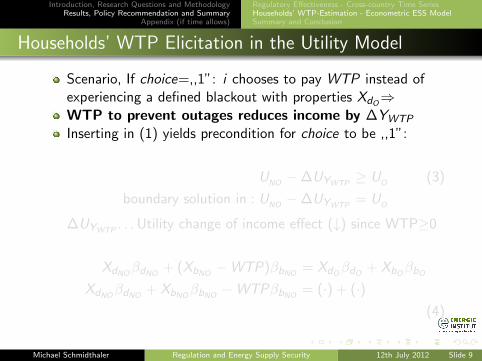
Households’ WTP Elicitation in the Utility Model
Scenario, If choice=,,1”: i chooses to pay WTP instead ofexperiencing a defined blackout with properties XdO⇒WTP to prevent outages reduces income by ∆YWTP
Inserting in (1) yields precondition for choice to be ,,1”:
UNO−∆UYWTP
≥ UO
(3)
boundary solution in : UNO−∆UYWTP
= UO
∆UYWTP. . . Utility change of income effect (↓) since WTP≥0
XdNOβdNO + (XbNO−WTP)βbNO = XdOβdO + XbOβbO
XdNOβdNO + XbNOβbNO −WTPβbNO = (·) + (·)(4)
Michael Schmidthaler Regulation and Energy Supply Security 12th July 2012 Slide 9
Introduction, Research Questions and MethodologyResults, Policy Recommendation and Summary
Appendix (if time allows)
Regulatory Effectiveness - Cross-country Time SeriesHouseholds’ WTP-Estimation - Econometric ESS ModelSummary and Conclusion
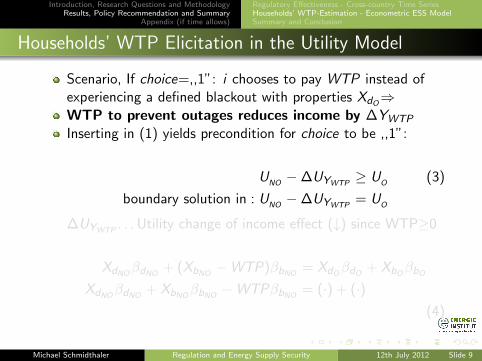
Households’ WTP Elicitation in the Utility Model
Scenario, If choice=,,1”: i chooses to pay WTP instead ofexperiencing a defined blackout with properties XdO⇒WTP to prevent outages reduces income by ∆YWTP
Inserting in (1) yields precondition for choice to be ,,1”:
UNO−∆UYWTP
≥ UO
(3)
boundary solution in : UNO−∆UYWTP
= UO
∆UYWTP. . . Utility change of income effect (↓) since WTP≥0
XdNOβdNO + (XbNO−WTP)βbNO = XdOβdO + XbOβbO
XdNOβdNO + XbNOβbNO −WTPβbNO = (·) + (·)(4)
Michael Schmidthaler Regulation and Energy Supply Security 12th July 2012 Slide 9
Introduction, Research Questions and MethodologyResults, Policy Recommendation and Summary
Appendix (if time allows)
Regulatory Effectiveness - Cross-country Time SeriesHouseholds’ WTP-Estimation - Econometric ESS ModelSummary and Conclusion
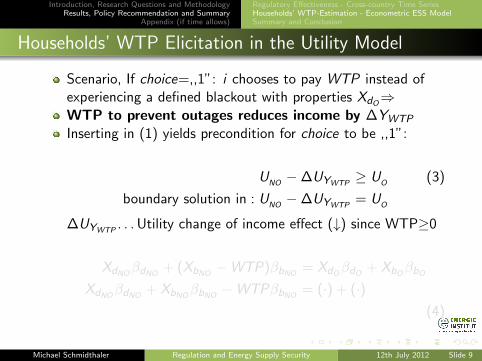
Households’ WTP Elicitation in the Utility Model
Scenario, If choice=,,1”: i chooses to pay WTP instead ofexperiencing a defined blackout with properties XdO⇒WTP to prevent outages reduces income by ∆YWTP
Inserting in (1) yields precondition for choice to be ,,1”:
UNO−∆UYWTP
≥ UO
(3)
boundary solution in : UNO−∆UYWTP
= UO
∆UYWTP. . . Utility change of income effect (↓) since WTP≥0
XdNOβdNO + (XbNO−WTP)βbNO = XdOβdO + XbOβbO
XdNOβdNO + XbNOβbNO −WTPβbNO = (·) + (·)(4)
Michael Schmidthaler Regulation and Energy Supply Security 12th July 2012 Slide 9
Introduction, Research Questions and MethodologyResults, Policy Recommendation and Summary
Appendix (if time allows)
Regulatory Effectiveness - Cross-country Time SeriesHouseholds’ WTP-Estimation - Econometric ESS ModelSummary and Conclusion
Households’ WTP Elicitation in the Utility Model
Scenario, If choice=,,1”: i chooses to pay WTP instead ofexperiencing a defined blackout with properties XdO⇒WTP to prevent outages reduces income by ∆YWTP
Inserting in (1) yields precondition for choice to be ,,1”:
UNO−∆UYWTP
≥ UO
(3)
boundary solution in : UNO−∆UYWTP
= UO
∆UYWTP. . . Utility change of income effect (↓) since WTP≥0
XdNOβdNO + (XbNO −WTP)βbNO= XdOβdO + XbOβbO
XdNOβdNO + XbNOβbNO −WTPβbNO = (·) + (·)(4)
Michael Schmidthaler Regulation and Energy Supply Security 12th July 2012 Slide 9

Introduction, Research Questions and MethodologyResults, Policy Recommendation and Summary
Appendix (if time allows)
Regulatory Effectiveness - Cross-country Time SeriesHouseholds’ WTP-Estimation - Econometric ESS ModelSummary and Conclusion
CVM Empiric Evidence: Variables and Distribution inSample
Coefficient Coding Description of binary and metric coefficients Mean
natural 1 if the outage cause is a natural event, 0 if terrorism 0.49f2f 1 if the interview was done face-to-face, 0 if online 0.54
incent 1 if the respondent was promised 10 EUR for 0.68– the participation of the survey (already in recruiting) –
extent 1 if the power outage affects 3 province, 0 if neighborhood 0.50premo 1 if outage was announced (3 days), 0 if spontaneous 0.50winter 1 if the scenario takes place in winter, 0 if in summer 0.50laborT 1 if the failure is in the labor-leisure affected only if 0 0.50
sex 1 if male person answering, 0 if female 0.58experience 1 if participant has experienced power outages (≥ 4h) 0.28education 1 if the participant graduated from high school (Matura) 0.60
children 1 if children under 14 reside in the household 0.22age – the age of the survey participant (metric) 40.54city 1 if the household lies in a municipality with more 0.47
– than 10,000 inhabitants, household in urban area –income – household income in 100 EUR (metric) 23.11
Michael Schmidthaler Regulation and Energy Supply Security 12th July 2012 Slide 10
Introduction, Research Questions and MethodologyResults, Policy Recommendation and Summary
Appendix (if time allows)
Regulatory Effectiveness - Cross-country Time SeriesHouseholds’ WTP-Estimation - Econometric ESS ModelSummary and Conclusion
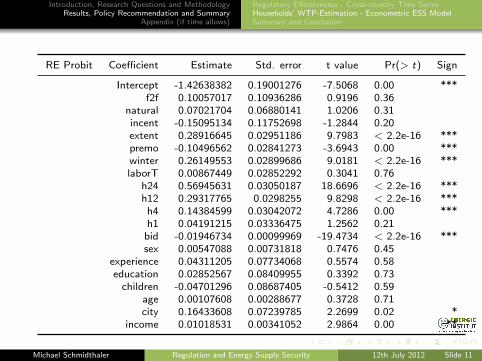
RE Probit Coefficient Estimate Std. error t value Pr(> t) Sign
Intercept -1.42638382 0.19001276 -7.5068 0.00 ***f2f 0.10057017 0.10936286 0.9196 0.36
natural 0.07021704 0.06880141 1.0206 0.31incent -0.15095134 0.11752698 -1.2844 0.20extent 0.28916645 0.02951186 9.7983 < 2.2e-16 ***premo -0.10496562 0.02841273 -3.6943 0.00 ***winter 0.26149553 0.02899686 9.0181 < 2.2e-16 ***laborT 0.00867449 0.02852292 0.3041 0.76
h24 0.56945631 0.03050187 18.6696 < 2.2e-16 ***h12 0.29317765 0.0298255 9.8298 < 2.2e-16 ***
h4 0.14384599 0.03042072 4.7286 0.00 ***h1 0.04191215 0.03336475 1.2562 0.21
bid -0.01946734 0.00099969 -19.4734 < 2.2e-16 ***sex 0.00547088 0.00731818 0.7476 0.45
experience 0.04311205 0.07734068 0.5574 0.58education 0.02852567 0.08409955 0.3392 0.73
children -0.04701296 0.08687405 -0.5412 0.59age 0.00107608 0.00288677 0.3728 0.71city 0.16433608 0.07239785 2.2699 0.02 *
income 0.01018531 0.00341052 2.9864 0.00 **
Michael Schmidthaler Regulation and Energy Supply Security 12th July 2012 Slide 11

Introduction, Research Questions and MethodologyResults, Policy Recommendation and Summary
Appendix (if time allows)
Regulatory Effectiveness - Cross-country Time SeriesHouseholds’ WTP-Estimation - Econometric ESS ModelSummary and Conclusion
Interpretation of Results: Random Effect - Probit II
Model Quality: Random Effect Probit
Estimation using probit including intercept, 11 iteration
log-likelihood: -7532.70
AIC: 15089.4
⇒ Exclusion of insignificant variables does NOT improvemodel quality
⇒ Utilization of R-E Probitoriginal for WTP quantification
Michael Schmidthaler Regulation and Energy Supply Security 12th July 2012 Slide 12
Introduction, Research Questions and MethodologyResults, Policy Recommendation and Summary
Appendix (if time allows)
Regulatory Effectiveness - Cross-country Time SeriesHouseholds’ WTP-Estimation - Econometric ESS ModelSummary and Conclusion
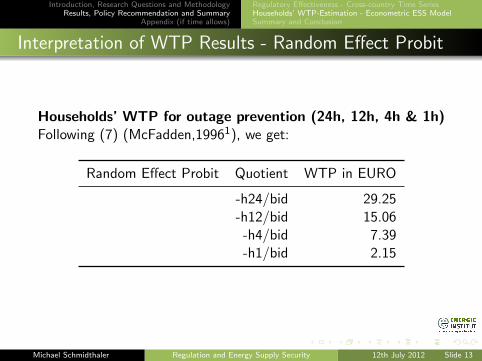
Interpretation of WTP Results - Random Effect Probit
Households’ WTP for outage prevention (24h, 12h, 4h & 1h)Following (7) (McFadden,19961), we get:
Random Effect Probit Quotient WTP in EURO
-h24/bid 29.25-h12/bid 15.06
-h4/bid 7.39-h1/bid 2.15
Michael Schmidthaler Regulation and Energy Supply Security 12th July 2012 Slide 13
Introduction, Research Questions and MethodologyResults, Policy Recommendation and Summary
Appendix (if time allows)
Regulatory Effectiveness - Cross-country Time SeriesHouseholds’ WTP-Estimation - Econometric ESS ModelSummary and Conclusion
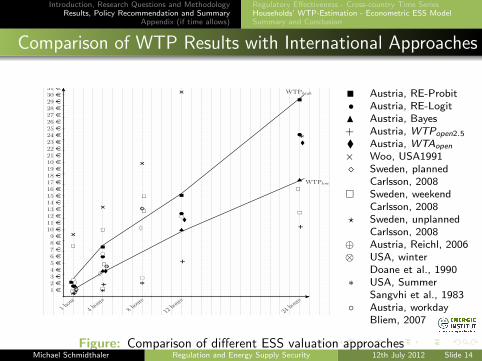
Comparison of WTP Results with International Approaches
-2 -1 0 1 2 3 4 5 6 7 8 9 10 11 12 13 14 15 16 17 18 19 20 21 22 23 24 25 26 27 28-12-11-10-9-8-7-6-5-4-3-2-10123456789
101112131415161718192021222324252627282930313233343536373839404142434445464748495051525354555657585960616263646566676869707172737475767778798081828384858687888990919293
1 hour
4 hours
8 hours
12hou
rs
24hou
rs1 e2 e3 e4 e5 e6 e7 e8 e9 e
10 e11 e12 e13 e14 e15 e16 e17 e18 e19 e10 e21 e22 e23 e24 e25 e26 e27 e28 e29 e30 e31 e
r
r
r
r
b
b
b
b
u
u
u
u
l
l
l
l
++
+
+X
X
X
X
rs
rs
rs
ld
ld
ld
bJ
bJ
bJ
⊕
⊕
⊕
⊕
⊗
⊗
⊗
* **
*
bc
bc
bc
WTPlow
WTPhigh � Austria, RE-Probit• Austria, RE-LogitN Austria, Bayes+ Austria, WTPopen2.5
� Austria, WTAopen
× Woo, USA1991� Sweden, planned
Carlsson, 2008� Sweden, weekend
Carlsson, 2008? Sweden, unplanned
Carlsson, 2008⊕ Austria, Reichl, 2006⊗ USA, winter
Doane et al., 1990∗ USA, Summer
Sangvhi et al., 1983◦ Austria, workday
Bliem, 2007
Figure: Comparison of different ESS valuation approachesMichael Schmidthaler Regulation and Energy Supply Security 12th July 2012 Slide 14

Introduction, Research Questions and MethodologyResults, Policy Recommendation and Summary
Appendix (if time allows)
Regulatory Effectiveness - Cross-country Time SeriesHouseholds’ WTP-Estimation - Econometric ESS ModelSummary and Conclusion
Implementation of WTP and outage cost assessment inAPOSTEL
Economic evaluation of simulated outages on the sector andprovince level
Possible to identify especially vulnerable sectors
Valuation of the non-market good ESS important forregulation.
Next steps: Assessment of all 27 EU countries in FP7 project(6,750 households)
Michael Schmidthaler Regulation and Energy Supply Security 12th July 2012 Slide 15
Introduction, Research Questions and MethodologyResults, Policy Recommendation and Summary
Appendix (if time allows)
Regulatory Effectiveness - Cross-country Time SeriesHouseholds’ WTP-Estimation - Econometric ESS ModelSummary and Conclusion
Synthesis, Summary of main Findings
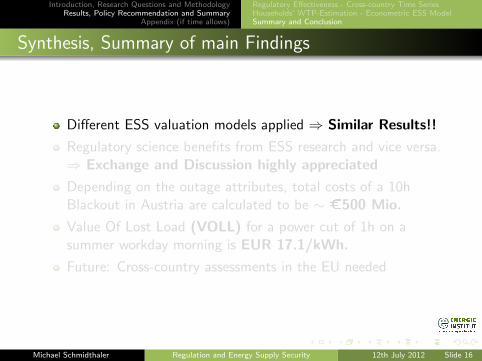
Different ESS valuation models applied ⇒ Similar Results!!
Regulatory science benefits from ESS research and vice versa.⇒ Exchange and Discussion highly appreciated
Depending on the outage attributes, total costs of a 10hBlackout in Austria are calculated to be ∼ ¿500 Mio.
Value Of Lost Load (VOLL) for a power cut of 1h on asummer workday morning is EUR 17.1/kWh.
Future: Cross-country assessments in the EU needed
Michael Schmidthaler Regulation and Energy Supply Security 12th July 2012 Slide 16
Introduction, Research Questions and MethodologyResults, Policy Recommendation and Summary
Appendix (if time allows)
Regulatory Effectiveness - Cross-country Time SeriesHouseholds’ WTP-Estimation - Econometric ESS ModelSummary and Conclusion
Synthesis, Summary of main Findings
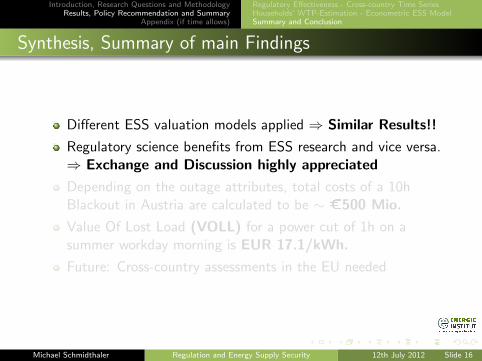
Different ESS valuation models applied ⇒ Similar Results!!
Regulatory science benefits from ESS research and vice versa.⇒ Exchange and Discussion highly appreciated
Depending on the outage attributes, total costs of a 10hBlackout in Austria are calculated to be ∼ ¿500 Mio.
Value Of Lost Load (VOLL) for a power cut of 1h on asummer workday morning is EUR 17.1/kWh.
Future: Cross-country assessments in the EU needed
Michael Schmidthaler Regulation and Energy Supply Security 12th July 2012 Slide 16

Introduction, Research Questions and MethodologyResults, Policy Recommendation and Summary
Appendix (if time allows)
Regulatory Effectiveness - Cross-country Time SeriesHouseholds’ WTP-Estimation - Econometric ESS ModelSummary and Conclusion
Synthesis, Summary of main Findings
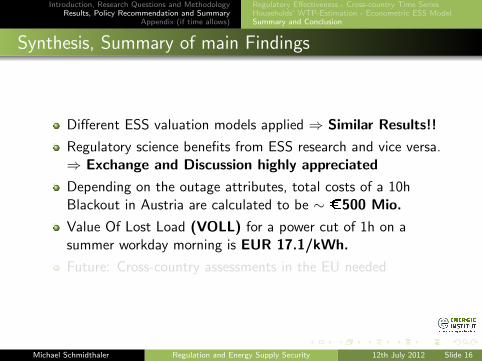
Different ESS valuation models applied ⇒ Similar Results!!
Regulatory science benefits from ESS research and vice versa.⇒ Exchange and Discussion highly appreciated
Depending on the outage attributes, total costs of a 10hBlackout in Austria are calculated to be ∼ ¿500 Mio.
Value Of Lost Load (VOLL) for a power cut of 1h on asummer workday morning is EUR 17.1/kWh.
Future: Cross-country assessments in the EU needed
Michael Schmidthaler Regulation and Energy Supply Security 12th July 2012 Slide 16
Introduction, Research Questions and MethodologyResults, Policy Recommendation and Summary
Appendix (if time allows)
Regulatory Effectiveness - Cross-country Time SeriesHouseholds’ WTP-Estimation - Econometric ESS ModelSummary and Conclusion
Synthesis, Summary of main Findings
Different ESS valuation models applied ⇒ Similar Results!!
Regulatory science benefits from ESS research and vice versa.⇒ Exchange and Discussion highly appreciated
Depending on the outage attributes, total costs of a 10hBlackout in Austria are calculated to be ∼ ¿500 Mio.
Value Of Lost Load (VOLL) for a power cut of 1h on asummer workday morning is EUR 17.1/kWh.
Future: Cross-country assessments in the EU needed
Michael Schmidthaler Regulation and Energy Supply Security 12th July 2012 Slide 16
Introduction, Research Questions and MethodologyResults, Policy Recommendation and Summary
Appendix (if time allows)
Regulatory Effectiveness - Cross-country Time SeriesHouseholds’ WTP-Estimation - Econometric ESS ModelSummary and Conclusion
Thank you for your attention
Case Study with APOSTEL? Time?
Michael Schmidthaler Regulation and Energy Supply Security 12th July 2012 Slide 17
Introduction, Research Questions and MethodologyResults, Policy Recommendation and Summary
Appendix (if time allows)
Outage Case Study in Austria assessed with APOSTELEconometric Modeling of WTPData Availability - Analysis of Regulation’s Effectiveness
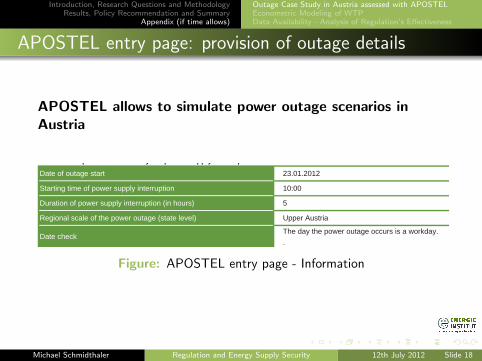
APOSTEL entry page: provision of outage details
APOSTEL allows to simulate power outage scenarios inAustria
Table 1: Properties of the analyzed power supply interruptions
The day the power outage occurs is a workday..
Upper Austria
5
10:00
Date check
Duration of power supply interruption (in hours)
Regional scale of the power outage (state level)
Date of outage start
Starting time of power supply interruption
23.01.2012
Figure: APOSTEL entry page - Information
Michael Schmidthaler Regulation and Energy Supply Security 12th July 2012 Slide 18
Introduction, Research Questions and MethodologyResults, Policy Recommendation and Summary
Appendix (if time allows)
Outage Case Study in Austria assessed with APOSTELEconometric Modeling of WTPData Availability - Analysis of Regulation’s Effectiveness
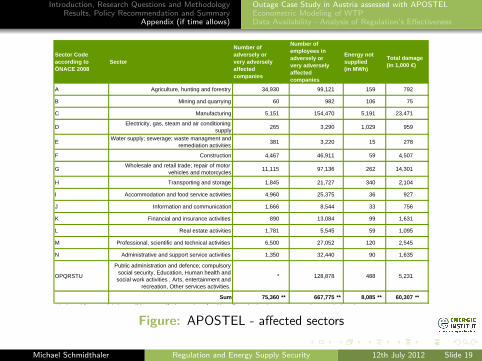
Table 2a: Sector Assessment of Supply Security for a power outage with the previously defined attributes
Sector Code according to ÖNACE 2008
Sector
Number of adversely or very adversely affected companies
Number of employees in adversely or very adversely affected companies
Energy not supplied (in MWh)
A Agriculture, hunting and forestry 34,930 99,121 159 792
B Mining and quarrying 60 982 106 75
C Manufacturing 5,151 154,470 5,191 23,471
D Electricity, gas, steam and air conditioning supply 265 3,290 1,029 959
E Water supply; sewerage; waste managment and remediation activities 381 3,220 15 278
F Construction 4,467 46,911 59 4,507
G Wholesale and retail trade; repair of motor vehicles and motorcycles 11,115 97,136 262 14,301
H Transporting and storage 1,845 21,727 340 2,104
I Accommodation and food service activities 4,960 25,375 36 927
J Information and communication 1,666 8,544 33 756
K Financial and insurance activities 890 13,084 99 1,631
L Real estate activities 1,781 5,545 59 1,095
M Professional, scientific and technical activities 6,500 27,052 120 2,545
N Administrative and support service activities 1,350 32,440 90 1,635
OPQRSTU
Public administration and defence; compulsory social security, Education, Human health and
social work activities , Arts, entertainment and recreation, Other services activities.
* 128,878 488 5,231
Sum 75,360 ** 667,775 ** 8,085 ** 60,307 **
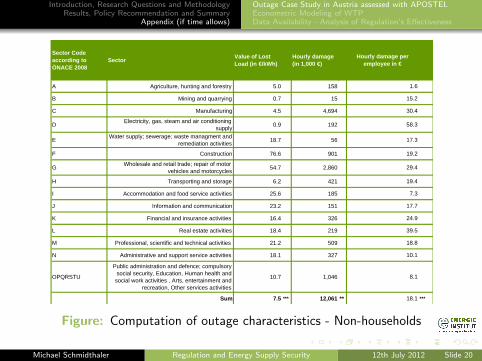
Table 2b: Sector Assessment of Supply Security for a power outage with the previously defined attributes
Sector Code according to ÖNACE 2008
Sector Value of Lost Load (in €/kWh)
Hourly damage (in 1,000 €)
A Agriculture, hunting and forestry 5.0 158
B Mining and quarrying 0.7 15
C Manufacturing 4.5 4,694
D Electricity, gas, steam and air conditioning supply 0.9 192
E Water supply; sewerage; waste managment and remediation activities 18.7 56
F Construction 76.6 901
G Wholesale and retail trade; repair of motor vehicles and motorcycles 54.7 2,860
H Transporting and storage 6.2 421
I Accommodation and food service activities 25.6 185
J Information and communication 23.2 151
K Financial and insurance activities 16.4 326
L Real estate activities 18.4 219
M Professional, scientific and technical activities 21.2 509
N Administrative and support service activities 18.1 327
OPQRSTU
Public administration and defence; compulsory social security, Education, Human health and
social work activities , Arts, entertainment and recreation, Other services activities
10.7 1,046
Sum 7.5 *** 12,061 ** ***
*** Weighted average of columns
24.9
* In the public sector it is impossible to quantify the number of entities affected using the same nomenclature as in the private sector.
Total damage (in 1,000 €)
1.6
** Sum of Columns
17.3
7.3
15.2
30.4
58.3
8.1
39.5
17.7
Hourly damage per employee in €
19.2
29.4
19.4
18.1
18.8
10.1
** Sum of Columns
2 / 4
Figure: APOSTEL - affected sectors
Michael Schmidthaler Regulation and Energy Supply Security 12th July 2012 Slide 19
Introduction, Research Questions and MethodologyResults, Policy Recommendation and Summary
Appendix (if time allows)
Outage Case Study in Austria assessed with APOSTELEconometric Modeling of WTPData Availability - Analysis of Regulation’s Effectiveness
Table 2a: Sector Assessment of Supply Security for a power outage with the previously defined attributes
Sector Code according to ÖNACE 2008
Sector
Number of adversely or very adversely affected companies
Number of employees in adversely or very adversely affected companies
Energy not supplied (in MWh)
A Agriculture, hunting and forestry 34,930 99,121 159 792
B Mining and quarrying 60 982 106 75
C Manufacturing 5,151 154,470 5,191 23,471
D Electricity, gas, steam and air conditioning supply 265 3,290 1,029 959
E Water supply; sewerage; waste managment and remediation activities 381 3,220 15 278
F Construction 4,467 46,911 59 4,507
G Wholesale and retail trade; repair of motor vehicles and motorcycles 11,115 97,136 262 14,301
H Transporting and storage 1,845 21,727 340 2,104
I Accommodation and food service activities 4,960 25,375 36 927
J Information and communication 1,666 8,544 33 756
K Financial and insurance activities 890 13,084 99 1,631
L Real estate activities 1,781 5,545 59 1,095
M Professional, scientific and technical activities 6,500 27,052 120 2,545
N Administrative and support service activities 1,350 32,440 90 1,635
OPQRSTU
Public administration and defence; compulsory social security, Education, Human health and
social work activities , Arts, entertainment and recreation, Other services activities.
* 128,878 488 5,231
Sum 75,360 ** 667,775 ** 8,085 ** 60,307 **
Table 2b: Sector Assessment of Supply Security for a power outage with the previously defined attributes
Sector Code according to ÖNACE 2008
Sector Value of Lost Load (in €/kWh)
Hourly damage (in 1,000 €)
A Agriculture, hunting and forestry 5.0 158
B Mining and quarrying 0.7 15
C Manufacturing 4.5 4,694
D Electricity, gas, steam and air conditioning supply 0.9 192
E Water supply; sewerage; waste managment and remediation activities 18.7 56
F Construction 76.6 901
G Wholesale and retail trade; repair of motor vehicles and motorcycles 54.7 2,860
H Transporting and storage 6.2 421
I Accommodation and food service activities 25.6 185
J Information and communication 23.2 151
K Financial and insurance activities 16.4 326
L Real estate activities 18.4 219
M Professional, scientific and technical activities 21.2 509
N Administrative and support service activities 18.1 327
OPQRSTU
Public administration and defence; compulsory social security, Education, Human health and
social work activities , Arts, entertainment and recreation, Other services activities
10.7 1,046
Sum 7.5 *** 12,061 ** ***
*** Weighted average of columns
24.9
* In the public sector it is impossible to quantify the number of entities affected using the same nomenclature as in the private sector.
Total damage (in 1,000 €)
1.6
** Sum of Columns
17.3
7.3
15.2
30.4
58.3
8.1
39.5
17.7
Hourly damage per employee in €
19.2
29.4
19.4
18.1
18.8
10.1
** Sum of Columns
2 / 4
Figure: Computation of outage characteristics - Non-households
Michael Schmidthaler Regulation and Energy Supply Security 12th July 2012 Slide 20
Introduction, Research Questions and MethodologyResults, Policy Recommendation and Summary
Appendix (if time allows)
Outage Case Study in Austria assessed with APOSTELEconometric Modeling of WTPData Availability - Analysis of Regulation’s Effectiveness
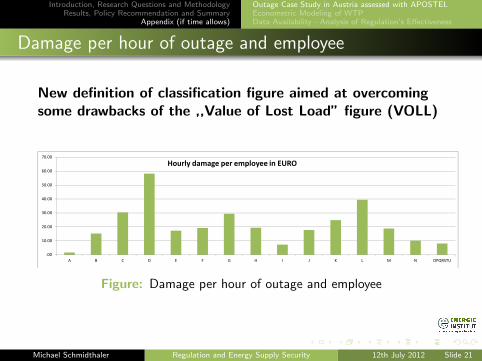
Damage per hour of outage and employee
New definition of classification figure aimed at overcomingsome drawbacks of the ,,Value of Lost Load” figure (VOLL)
Hourly damage per employ
Graph 1: The hourly damage per employee is depicted.
Table 3: Damages in the main economic sectorsSector Code according to ÖNACE 2008
Primary sector A, B
Secondary sector C, D, E, F
Tertiary sector G,H,I,J,K,L,M,N,O,P,Q,R,S,T,U
Sum
Energy not supplied to the main economic sectors Total monetary damage of the main economic sectors
Damage Assessment II : Households
Table 4: Assessments of households
583,981
1,819
Number of adversely or strongly adversely affected inhabitants
582,070
1,390,432
1.63
Energy not supplied (in MWh)
VOLL (in €/kWh)
WTP to avoid the outage (in 1,000 €) 2,968
244,469
Number of Inhabitants in the area of the outage
Number of adversely or strongly adversely affected households
6,293
867
30,225
60,307
Energy not supplied (in MwH)
Number of households in the area of the outage
8,085
Graph 3: Total monetary damage according to economic sectors
Total damage (in 1,000 Euro)
1,527
The assessment of damage occuring to households due to power outages is more difficult than for non-households. The majority of damages tohouseholds is indirect and not material or monetary as it is in the case of businesses and public administration. An adequate assessment musttherefore also incorporate the negative consequences to a household, such as diminished value of leisure and the mental stress that occurs whenthe household does not know when it will be able to receive power again. (See also the definitions in the Annex). The following values wereobtained using a willingness to pay analysis method (WTP) of roughly 1300 households. The damage assessment (including the mentionedintangible damages) was thus provided by the households themselves. Some literature sources point out that households tend to underestimatetheir willingness to pay to avoid power outages. These values are therefore to be considered a lower boundary of the actual damage.
Graph 2: Energy not supplied according to economic sectors
29,215
264
Primary sector 3.27%
Secondary sector 77.84%
Tertiary sector 18.89%
Energy not supplied to the main economic sectors
Primary sector 1.44%
Secondary sector 48.44%
Tertiary sector 50.12%
Total monetary damage of the main economic sectors
.00
10.00
20.00
30.00
40.00
50.00
60.00
70.00
A B C D E F G H I J K L M N OPQRSTU
Hourly damage per employee in EURO
3 / 4
Figure: Damage per hour of outage and employee
Michael Schmidthaler Regulation and Energy Supply Security 12th July 2012 Slide 21
Introduction, Research Questions and MethodologyResults, Policy Recommendation and Summary
Appendix (if time allows)
Outage Case Study in Austria assessed with APOSTELEconometric Modeling of WTPData Availability - Analysis of Regulation’s Effectiveness
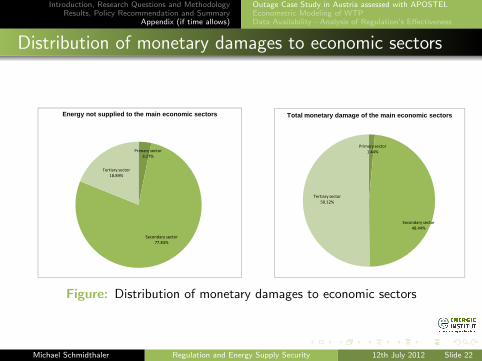
Distribution of monetary damages to economic sectors
Hourly damage per employ
Graph 1: The hourly damage per employee is depicted.
Table 3: Damages in the main economic sectorsSector Code according to ÖNACE 2008
Primary sector A, B
Secondary sector C, D, E, F
Tertiary sector G,H,I,J,K,L,M,N,O,P,Q,R,S,T,U
Sum
Energy not supplied to the main economic sectors Total monetary damage of the main economic sectors
Damage Assessment II : Households
Table 4: Assessments of households
583,981
1,819
Number of adversely or strongly adversely affected inhabitants
582,070
1,390,432
1.63
Energy not supplied (in MWh)
VOLL (in €/kWh)
WTP to avoid the outage (in 1,000 €) 2,968
244,469
Number of Inhabitants in the area of the outage
Number of adversely or strongly adversely affected households
6,293
867
30,225
60,307
Energy not supplied (in MwH)
Number of households in the area of the outage
8,085
Graph 3: Total monetary damage according to economic sectors
Total damage (in 1,000 Euro)
1,527
The assessment of damage occuring to households due to power outages is more difficult than for non-households. The majority of damages tohouseholds is indirect and not material or monetary as it is in the case of businesses and public administration. An adequate assessment musttherefore also incorporate the negative consequences to a household, such as diminished value of leisure and the mental stress that occurs whenthe household does not know when it will be able to receive power again. (See also the definitions in the Annex). The following values wereobtained using a willingness to pay analysis method (WTP) of roughly 1300 households. The damage assessment (including the mentionedintangible damages) was thus provided by the households themselves. Some literature sources point out that households tend to underestimatetheir willingness to pay to avoid power outages. These values are therefore to be considered a lower boundary of the actual damage.
Graph 2: Energy not supplied according to economic sectors
29,215
264
Primary sector 3.27%
Secondary sector 77.84%
Tertiary sector 18.89%
Energy not supplied to the main economic sectors
Primary sector 1.44%
Secondary sector 48.44%
Tertiary sector 50.12%
Total monetary damage of the main economic sectors
.00
10.00
20.00
30.00
40.00
50.00
60.00
70.00
A B C D E F G H I J K L M N OPQRSTU
Hourly damage per employee in EURO
3 / 4
Figure: Distribution of monetary damages to economic sectors
Michael Schmidthaler Regulation and Energy Supply Security 12th July 2012 Slide 22

Introduction, Research Questions and MethodologyResults, Policy Recommendation and Summary
Appendix (if time allows)
Outage Case Study in Austria assessed with APOSTELEconometric Modeling of WTPData Availability - Analysis of Regulation’s Effectiveness
Assessments of households
Summary of affected households, unsupplied energy andWilligness to pay to avoid the specified outage scenario
Hourly damage per employ
Graph 1: The hourly damage per employee is depicted.
Table 3: Damages in the main economic sectorsSector Code according to ÖNACE 2008
Primary sector A, B
Secondary sector C, D, E, F
Tertiary sector G,H,I,J,K,L,M,N,O,P,Q,R,S,T,U
Sum
Energy not supplied to the main economic sectors Total monetary damage of the main economic sectors
Damage Assessment II : Households
Table 4: Assessments of households
583,981
1,819
Number of adversely or strongly adversely affected inhabitants
582,070
1,390,432
1.63
Energy not supplied (in MWh)
VOLL (in €/kWh)
WTP to avoid the outage (in 1,000 €) 2,968
244,469
Number of Inhabitants in the area of the outage
Number of adversely or strongly adversely affected households
6,293
867
30,225
60,307
Energy not supplied (in MwH)
Number of households in the area of the outage
8,085
Graph 3: Total monetary damage according to economic sectors
Total damage (in 1,000 Euro)
1,527
The assessment of damage occuring to households due to power outages is more difficult than for non-households. The majority of damages tohouseholds is indirect and not material or monetary as it is in the case of businesses and public administration. An adequate assessment musttherefore also incorporate the negative consequences to a household, such as diminished value of leisure and the mental stress that occurs whenthe household does not know when it will be able to receive power again. (See also the definitions in the Annex). The following values wereobtained using a willingness to pay analysis method (WTP) of roughly 1300 households. The damage assessment (including the mentionedintangible damages) was thus provided by the households themselves. Some literature sources point out that households tend to underestimatetheir willingness to pay to avoid power outages. These values are therefore to be considered a lower boundary of the actual damage.
Graph 2: Energy not supplied according to economic sectors
29,215
264
Primary sector 3.27%
Secondary sector 77.84%
Tertiary sector 18.89%
Energy not supplied to the main economic sectors
Primary sector 1.44%
Secondary sector 48.44%
Tertiary sector 50.12%
Total monetary damage of the main economic sectors
.00
10.00
20.00
30.00
40.00
50.00
60.00
70.00
A B C D E F G H I J K L M N OPQRSTU
Hourly damage per employee in EURO
3 / 4
Figure: Assessments of affected households
Michael Schmidthaler Regulation and Energy Supply Security 12th July 2012 Slide 23
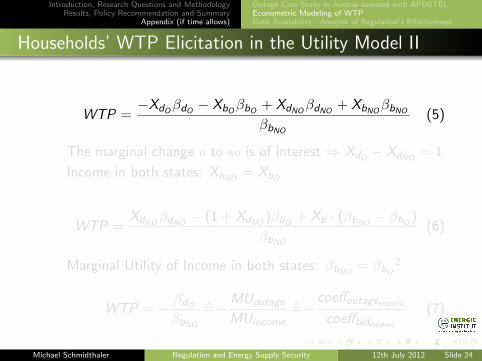
Introduction, Research Questions and MethodologyResults, Policy Recommendation and Summary
Appendix (if time allows)
Outage Case Study in Austria assessed with APOSTELEconometric Modeling of WTPData Availability - Analysis of Regulation’s Effectiveness
Households’ WTP Elicitation in the Utility Model II
WTP =−XdOβdO − XbOβbO + XdNO
βdNO+ XbNOβbNO
βbNO
(5)
The marginal change O to NO is of interest ⇒ XdO − XdNO = 1
Income in both states: XbNO= XbO
WTP =XdNOβdNO
− (1 + XdNO)βbO + Xb · (βbNO − βbO )
βbNO
(6)
Marginal Utility of Income in both states: βbNO = βbO2
WTP = − βdOβbNO
=̂−MUoutage
MUincome=̂−
coeffoutageempiric
coeffbidempiric
(7)
Michael Schmidthaler Regulation and Energy Supply Security 12th July 2012 Slide 24

Introduction, Research Questions and MethodologyResults, Policy Recommendation and Summary
Appendix (if time allows)
Outage Case Study in Austria assessed with APOSTELEconometric Modeling of WTPData Availability - Analysis of Regulation’s Effectiveness
Households’ WTP Elicitation in the Utility Model II
WTP =−XdOβdO − XbOβbO + XdNO
βdNO+ XbNOβbNO
βbNO
(5)
The marginal change O to NO is of interest ⇒ XdO − XdNO = 1
Income in both states: XbNO= XbO
WTP =XdNOβdNO
− (1 + XdNO)βbO + Xb · (βbNO
− βbO )
βbNO
(6)
Marginal Utility of Income in both states: βbNO = βbO2
WTP = − βdOβbNO
=̂−MUoutage
MUincome=̂−
coeffoutageempiric
coeffbidempiric
(7)
Michael Schmidthaler Regulation and Energy Supply Security 12th July 2012 Slide 24
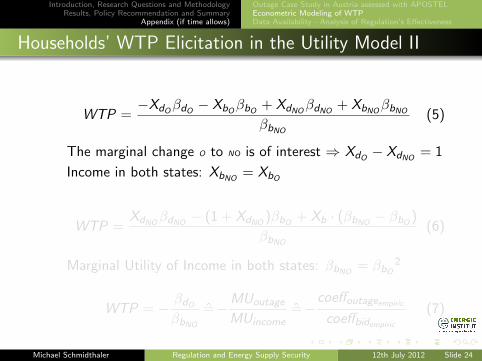
Introduction, Research Questions and MethodologyResults, Policy Recommendation and Summary
Appendix (if time allows)
Outage Case Study in Austria assessed with APOSTELEconometric Modeling of WTPData Availability - Analysis of Regulation’s Effectiveness
Households’ WTP Elicitation in the Utility Model II
WTP =−XdOβdO − XbOβbO + XdNO
βdNO+ XbNOβbNO
βbNO
(5)
The marginal change O to NO is of interest ⇒ XdO − XdNO = 1
Income in both states: XbNO= XbO
WTP =XdNOβdNO − (1 + XdNO )βbO + Xb · (βbNO
− βbO )
βbNO
(6)
Marginal Utility of Income in both states: βbNO = βbO2
WTP = − βdOβbNO
=̂−MUoutage
MUincome=̂−
coeffoutageempiric
coeffbidempiric
(7)
Michael Schmidthaler Regulation and Energy Supply Security 12th July 2012 Slide 24
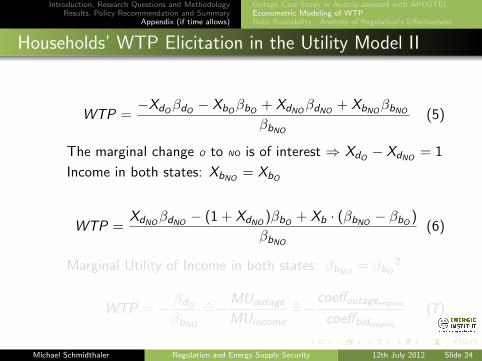
Introduction, Research Questions and MethodologyResults, Policy Recommendation and Summary
Appendix (if time allows)
Outage Case Study in Austria assessed with APOSTELEconometric Modeling of WTPData Availability - Analysis of Regulation’s Effectiveness
Households’ WTP Elicitation in the Utility Model II
WTP =−XdOβdO − XbOβbO + XdNO
βdNO+ XbNOβbNO
βbNO
(5)
The marginal change O to NO is of interest ⇒ XdO − XdNO = 1
Income in both states: XbNO= XbO
WTP =XdNOβdNO − (1 + XdNO )βbO + Xb · (βbNO
− βbO )
βbNO
(6)
Marginal Utility of Income in both states: βbNO = βbO2
WTP = − βdOβbNO
=̂−MUoutage
MUincome=̂−
coeffoutageempiric
coeffbidempiric
(7)
Michael Schmidthaler Regulation and Energy Supply Security 12th July 2012 Slide 24
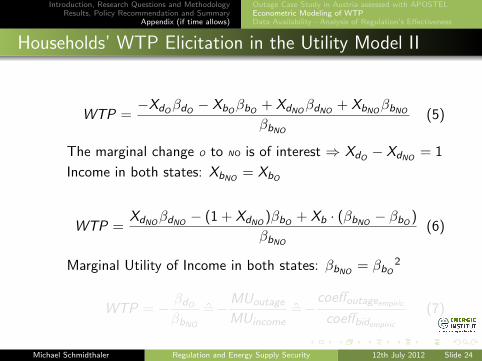
Introduction, Research Questions and MethodologyResults, Policy Recommendation and Summary
Appendix (if time allows)
Outage Case Study in Austria assessed with APOSTELEconometric Modeling of WTPData Availability - Analysis of Regulation’s Effectiveness
Households’ WTP Elicitation in the Utility Model II
WTP =−XdOβdO − XbOβbO + XdNO
βdNO+ XbNOβbNO
βbNO
(5)
The marginal change O to NO is of interest ⇒ XdO − XdNO = 1
Income in both states: XbNO= XbO
WTP =XdNOβdNO − (1 + XdNO )βbO + Xb · (βbNO
− βbO )
βbNO
(6)
Marginal Utility of Income in both states: βbNO = βbO2
WTP = − βdOβbNO
=̂−MUoutage
MUincome=̂−
coeffoutageempiric
coeffbidempiric
(7)
Michael Schmidthaler Regulation and Energy Supply Security 12th July 2012 Slide 24
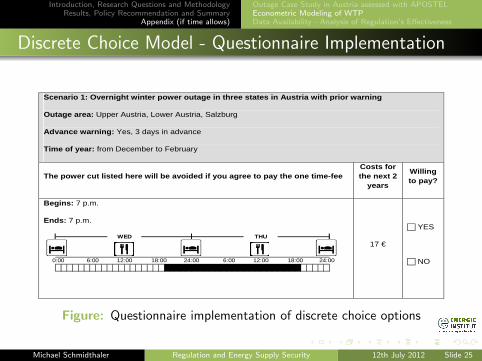
Introduction, Research Questions and MethodologyResults, Policy Recommendation and Summary
Appendix (if time allows)
Outage Case Study in Austria assessed with APOSTELEconometric Modeling of WTPData Availability - Analysis of Regulation’s Effectiveness
Discrete Choice Model - Questionnaire Implementation
Scenario 1: Overnight winter power outage in three states in Austria with prior warning
Outage area: Upper Austria, Lower Austria, Salzburg
Advance warning: Yes, 3 days in advance
Time of year: from December to February
The power cut listed here will be avoided if you agree to pay the one time-fee Costs for the next 2
years
Willing to pay?
Begins: 7 p.m.
Ends: 7 p.m.
0:00 24:00
WED THU
18:00 24:00 18:006:00 12:006:00 12:00
17 €
YES
NO
Figure: Questionnaire implementation of discrete choice options
Michael Schmidthaler Regulation and Energy Supply Security 12th July 2012 Slide 25
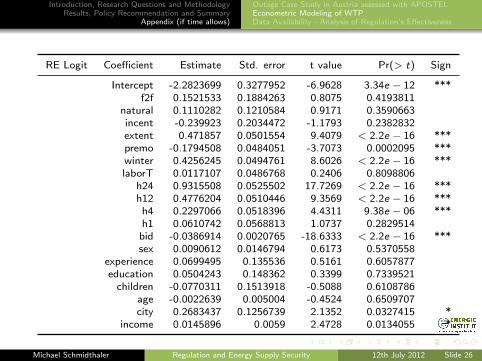
Introduction, Research Questions and MethodologyResults, Policy Recommendation and Summary
Appendix (if time allows)
Outage Case Study in Austria assessed with APOSTELEconometric Modeling of WTPData Availability - Analysis of Regulation’s Effectiveness
RE Logit Coefficient Estimate Std. error t value Pr(> t) Sign
Intercept -2.2823699 0.3277952 -6.9628 3.34e − 12 ***f2f 0.1521533 0.1884263 0.8075 0.4193811
natural 0.1110282 0.1210584 0.9171 0.3590663incent -0.239923 0.2034472 -1.1793 0.2382832extent 0.471857 0.0501554 9.4079 < 2.2e − 16 ***premo -0.1794508 0.0484051 -3.7073 0.0002095 ***winter 0.4256245 0.0494761 8.6026 < 2.2e − 16 ***laborT 0.0117107 0.0486768 0.2406 0.8098806
h24 0.9315508 0.0525502 17.7269 < 2.2e − 16 ***h12 0.4776204 0.0510446 9.3569 < 2.2e − 16 ***
h4 0.2297066 0.0518396 4.4311 9.38e − 06 ***h1 0.0610742 0.0568813 1.0737 0.2829514
bid -0.0386914 0.0020765 -18.6333 < 2.2e − 16 ***sex 0.0090612 0.0146794 0.6173 0.5370558
experience 0.0699495 0.135536 0.5161 0.6057877education 0.0504243 0.148362 0.3399 0.7339521
children -0.0770311 0.1513918 -0.5088 0.6108786age -0.0022639 0.005004 -0.4524 0.6509707city 0.2683437 0.1256739 2.1352 0.0327415 *
income 0.0145896 0.0059 2.4728 0.0134055 *
Michael Schmidthaler Regulation and Energy Supply Security 12th July 2012 Slide 26
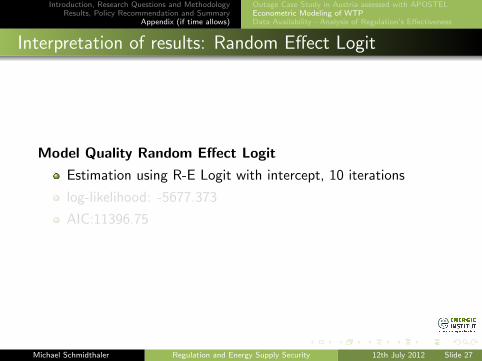
Introduction, Research Questions and MethodologyResults, Policy Recommendation and Summary
Appendix (if time allows)
Outage Case Study in Austria assessed with APOSTELEconometric Modeling of WTPData Availability - Analysis of Regulation’s Effectiveness
Interpretation of results: Random Effect Logit
Model Quality Random Effect Logit
Estimation using R-E Logit with intercept, 10 iterations
log-likelihood: -5677.373
AIC:11396.75
Michael Schmidthaler Regulation and Energy Supply Security 12th July 2012 Slide 27

Introduction, Research Questions and MethodologyResults, Policy Recommendation and Summary
Appendix (if time allows)
Outage Case Study in Austria assessed with APOSTELEconometric Modeling of WTPData Availability - Analysis of Regulation’s Effectiveness
Interpretation of WTP Estimation
Households’ WTP for outage prevention (24h, 12h, 4h & 1h)Following Equation (7) (see McFadden,1996), we get:
Random Effect Logit Quotient WTP in EURO (Logit)
-h24/bid 24.08-h12/bid 12.34
-h4/bid 5.94-h1/bid 1.58
Michael Schmidthaler Regulation and Energy Supply Security 12th July 2012 Slide 28
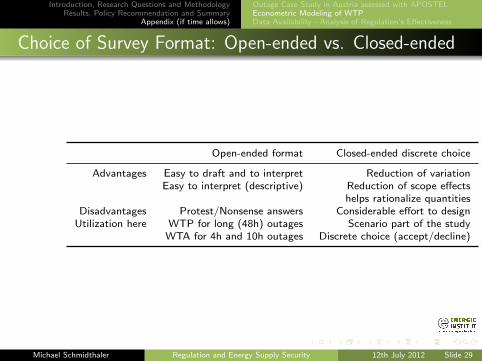
Introduction, Research Questions and MethodologyResults, Policy Recommendation and Summary
Appendix (if time allows)
Outage Case Study in Austria assessed with APOSTELEconometric Modeling of WTPData Availability - Analysis of Regulation’s Effectiveness
Choice of Survey Format: Open-ended vs. Closed-ended
Open-ended format Closed-ended discrete choice
Advantages Easy to draft and to interpret Reduction of variationEasy to interpret (descriptive) Reduction of scope effects
helps rationalize quantitiesDisadvantages Protest/Nonsense answers Considerable effort to design
Utilization here WTP for long (48h) outages Scenario part of the studyWTA for 4h and 10h outages Discrete choice (accept/decline)
Michael Schmidthaler Regulation and Energy Supply Security 12th July 2012 Slide 29
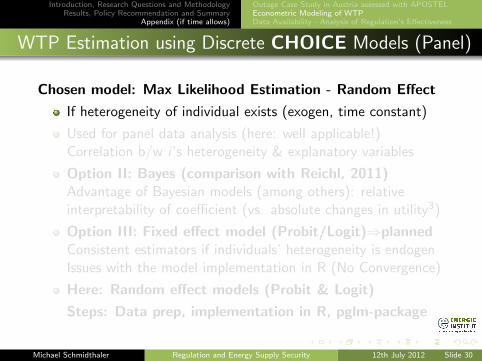
Introduction, Research Questions and MethodologyResults, Policy Recommendation and Summary
Appendix (if time allows)
Outage Case Study in Austria assessed with APOSTELEconometric Modeling of WTPData Availability - Analysis of Regulation’s Effectiveness
WTP Estimation using Discrete CHOICE Models (Panel)
Chosen model: Max Likelihood Estimation - Random Effect
If heterogeneity of individual exists (exogen, time constant)
Used for panel data analysis (here: well applicable!)Correlation b/w i ’s heterogeneity & explanatory variables
Option II: Bayes (comparison with Reichl, 2011)Advantage of Bayesian models (among others): relativeinterpretability of coefficient (vs. absolute changes in utility3)
Option III: Fixed effect model (Probit/Logit)⇒plannedConsistent estimators if individuals’ heterogeneity is endogenIssues with the model implementation in R (No Convergence)
Here: Random effect models (Probit & Logit)
Steps: Data prep, implementation in R, pglm-package
Michael Schmidthaler Regulation and Energy Supply Security 12th July 2012 Slide 30
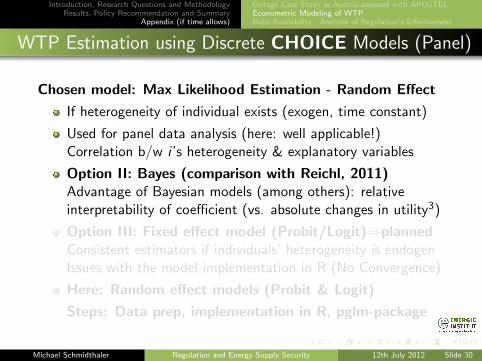
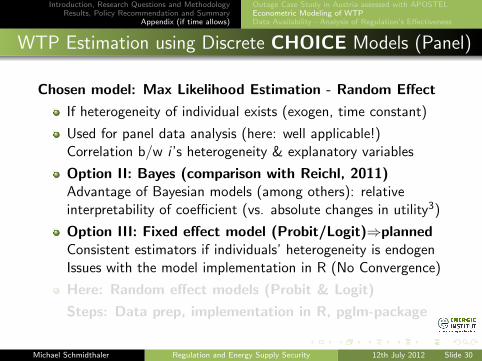
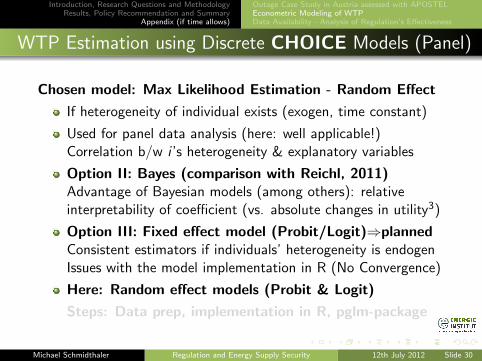
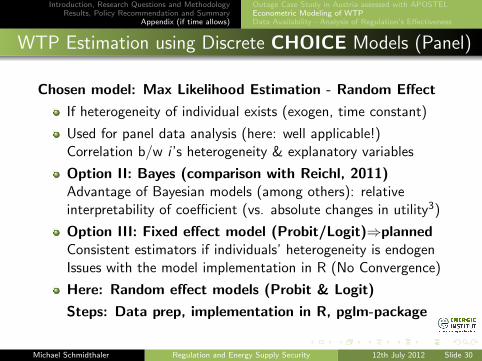
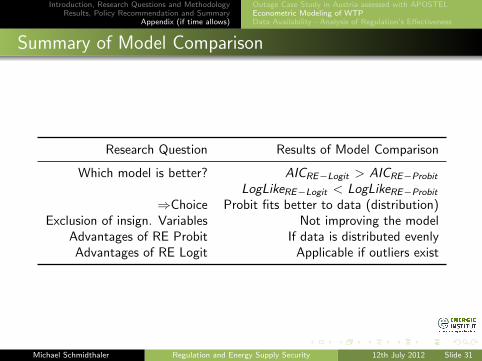
Introduction, Research Questions and MethodologyResults, Policy Recommendation and Summary
Appendix (if time allows)
Outage Case Study in Austria assessed with APOSTELEconometric Modeling of WTPData Availability - Analysis of Regulation’s Effectiveness
Summary of Model Comparison
Research Question Results of Model Comparison
Which model is better? AICRE−Logit > AICRE−Probit
LogLikeRE−Logit < LogLikeRE−Probit
⇒Choice Probit fits better to data (distribution)Exclusion of insign. Variables Not improving the model
Advantages of RE Probit If data is distributed evenlyAdvantages of RE Logit Applicable if outliers exist
Michael Schmidthaler Regulation and Energy Supply Security 12th July 2012 Slide 31
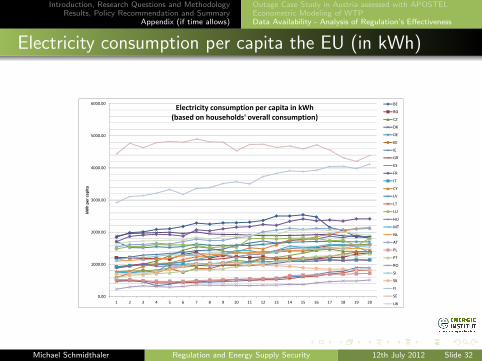
Introduction, Research Questions and MethodologyResults, Policy Recommendation and Summary
Appendix (if time allows)
Outage Case Study in Austria assessed with APOSTELEconometric Modeling of WTPData Availability - Analysis of Regulation’s Effectiveness
Electricity consumption per capita the EU (in kWh)
0.00
1000.00
2000.00
3000.00
4000.00
5000.00
6000.00
1 2 3 4 5 6 7 8 9 10 11 12 13 14 15 16 17 18 19 20
kWh per capita
Electricity consumption per capita in kWh(based on households' overall consumption)
BE
BG
CZ
DK
DE
EE
IE
GR
ES
FR
IT
CY
LV
LT
LU
HU
MT
NL
AT
PL
PT
RO
SI
SK
FI
SE
UK
Michael Schmidthaler Regulation and Energy Supply Security 12th July 2012 Slide 32

Introduction, Research Questions and MethodologyResults, Policy Recommendation and Summary
Appendix (if time allows)
Outage Case Study in Austria assessed with APOSTELEconometric Modeling of WTPData Availability - Analysis of Regulation’s Effectiveness
Electricity consumption per capita the EU (in kWh)
0
200
400
600
800
1000
1200
1400
1600
1991 1992 1993 1994 1995 1996 1997 1998 1999 2000 2001 2002 2003 2004 2005 2006 2007 2008 2009 2010
KG OE per 1000 €of GDP
Energy Intensity of GDP in kg oe / 1000 €BE
BG
CZ
DK
DE
EE
IE
GR
ES
FR
IT
CY
LV
LT
LU
HU
MT
NL
AT
PL
PT
RO
SI
SK
FI
SE
UK
Michael Schmidthaler Regulation and Energy Supply Security 12th July 2012 Slide 33
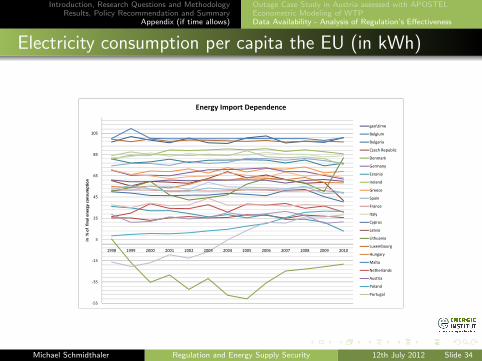
Introduction, Research Questions and MethodologyResults, Policy Recommendation and Summary
Appendix (if time allows)
Outage Case Study in Austria assessed with APOSTELEconometric Modeling of WTPData Availability - Analysis of Regulation’s Effectiveness
Electricity consumption per capita the EU (in kWh)
‐55
‐35
‐15
5
25
45
65
85
105
1998 1999 2000 2001 2002 2003 2004 2005 2006 2007 2008 2009 2010
In %
of final energy consumption
Energy Import Dependence
geo\time
Belgium
Bulgaria
Czech Republic
Denmark
Germany
Estonia
Ireland
Greece
Spain
France
Italy
Cyprus
Latvia
Lithuania
Luxembourg
Hungary
Malta
Netherlands
Austria
Poland
Portugal
Michael Schmidthaler Regulation and Energy Supply Security 12th July 2012 Slide 34
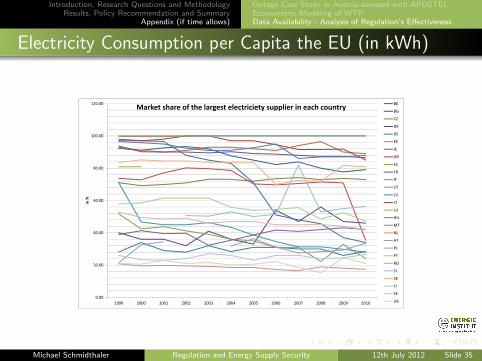
Introduction, Research Questions and MethodologyResults, Policy Recommendation and Summary
Appendix (if time allows)
Outage Case Study in Austria assessed with APOSTELEconometric Modeling of WTPData Availability - Analysis of Regulation’s Effectiveness
Electricity Consumption per Capita the EU (in kWh)
0.00
20.00
40.00
60.00
80.00
100.00
120.00
1999 2000 2001 2002 2003 2004 2005 2006 2007 2008 2009 2010
in %
Market share of the largest electriciety supplier in each countryBE
BG
CZ
DK
DE
EE
IE
GR
ES
FR
IT
CY
LV
LT
LU
HU
MT
NL
AT
PL
PT
RO
SI
SK
FI
SE
UK
Michael Schmidthaler Regulation and Energy Supply Security 12th July 2012 Slide 35
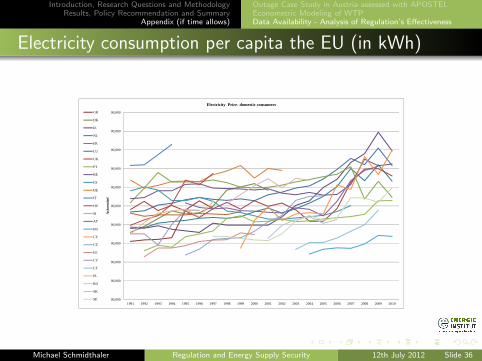
Introduction, Research Questions and MethodologyResults, Policy Recommendation and Summary
Appendix (if time allows)
Outage Case Study in Austria assessed with APOSTELEconometric Modeling of WTPData Availability - Analysis of Regulation’s Effectiveness
Electricity consumption per capita the EU (in kWh)
00,000
00,000
00,000
00,000
00,000
00,000
00,000
00,000
00,000
00,000
00,000
1991 1992 1993 1994 1995 1996 1997 1998 1999 2000 2001 2002 2003 2004 2005 2006 2007 2008 2009 2010
Ach
sent
itel
Electricity Price- domestic consumers
GR
DK
IE
NL
FR
LU
UK
PT
BE
ES
DE
IT
HU
SI
AT
BG
CY
CZ
EE
LV
LT
PL
RO
SK
SE
Michael Schmidthaler Regulation and Energy Supply Security 12th July 2012 Slide 36
Introduction, Research Questions and MethodologyResults, Policy Recommendation and Summary
Appendix (if time allows)
Outage Case Study in Austria assessed with APOSTELEconometric Modeling of WTPData Availability - Analysis of Regulation’s Effectiveness
Thank you for your attention
Michael Schmidthaler Regulation and Energy Supply Security 12th July 2012 Slide 37