john a. l college
TRANSCRIPT

JOHN A. LOGAN COLLEGE
Spring 2016
John A. Logan College
Course Retention and Success Report

JOHN A. LOGAN COLLEGE
Spring 2016
Course Retention and Success Report
The information on the following pages pertains to courses offered by
John A. Logan College during the spring 2016 semester. This introduction
serves as a brief explanation of the data contained herein.
Columns in the report identify courses, academic disciplines and
departments by both name and abbreviation (as given). Depending upon
the section of the overall report being viewed, columns for the following
data are typically present:
Total # Sects – identifies the total number of sections offered in the given semester for the given classification.
# Sections by FT – identifies the total number of course sections for each entry that were taught by full-time faculty. Sections can be taught by more than one instructor and it should be noted that these instances explain the appearance of numbers that are not always whole.
% Sections by FT – percentage of courses taught by full-time faculty.
Enrl – the total headcount of the course/discipline/department.
Avg Enrl – the average headcount enrollment.
Ret – the percentage of students deemed as retained. This includes those failing the course, but not those withdrawing.
Succ D+ – the percentage of enrolled students receiving a grade of “D” or better.
Succ C+ – the percentage of enrolled students receiving a grade of “C” or better.
Succ B+ – the percentage of enrolled students receiving a grade of “B” or better.
Succ A – the percentage of enrolled students receiving a grade of “A.”
This report contains the following sections:
Retention Report – by Department – Discipline
Retention Report – by Department – Discipline – Course
Retention Report – Academics Disciplines sorted by Total Enrollment
Retention Report – by Department – Discipline (Full-time/Term Faculty)
Retention Report – by Type of Credit Hour
Retention Report – by Day(s) Course Meets (sorted by enrollment)
Retention Report – by Time of Day Course Meets (by start time)
Retention Report – Hybrid and Online Course Data
Retention Report – by Extension Center
Retention Report – by Gateway Course
Retention Report – by Developmental Course
Retention Report – by Dual Credit Sections at Area High Schools
Retention Report – Top 30 Courses by Enrollment
It should be noted that all entries were made as they came out of the
system. Any mistakes or miscoding made regarding department, discipline,
etc., are a result of data error within the system.

JOHN A. LOGAN COLLEGE
Retention Report –
by Department – Discipline

Total #
Sects
# Sections
by FT
%
Sections
by FT Enrl Avg Enrl Ret Succ D+ Succ C+ Succ B+ Succ A
Allied Health DepartmentADN Total Associate Degree Nursing (ADN) 24 18.34 76.4% 242 10.1 98.8% 95.0% 95.0% 69.8% 28.5%
ALH Total Allied Health (ALH) 5 0 0.0% 91 18.2 97.8% 93.4% 90.1% 89.0% 82.4%
COS Total Cosmetology (COS) 5 4.5 90.0% 107 21.4 75.7% 65.4% 59.8% 52.3% 19.6%
CRJ Total Criminal Justice (CRJ) 22 13 59.1% 411 18.7 85.2% 83.9% 83.2% 74.7% 58.2%
DHY Total Dental Hygiene (DHY) 4 3 75.0% 48 12.0 100.0% 100.0% 97.9% 70.8% 6.3%
DMS Total Diagnostic Medical Sonography (DMS) 5 2.83 56.6% 42 8.4 100.0% 73.8% 73.8% 40.5% 33.3%
DNA Total Dental Assisting (DNA) 11 11 100.0% 114 10.4 100.0% 100.0% 100.0% 89.5% 39.5%
ECE Total Early Childhood Education (ECE) 11 6.5 59.1% 118 10.7 87.3% 84.7% 83.9% 73.7% 55.1%
EMS Total Emergency Medical Services (EMS) 1 0 0.0% 10 10.0 90.0% 90.0% 80.0% 60.0% 20.0%
EMY Total Emergency Medical Technician (EMT) 1 0 0.0% 35 35.0 88.6% 88.6% 85.7% 68.6% 25.7%
FSS Total Fire Science Safety (FSS) 5 0 0.0% 5 1.0 100.0% 100.0% 100.0% 80.0% 40.0%
IPP Total Interpreter Preparation (IPP) 9 5 55.6% 43 4.8 90.7% 90.7% 90.7% 83.7% 48.8%
MAS Total Massage Therapy (MAS) 4 3 75.0% 40 10.0 100.0% 100.0% 100.0% 87.5% 77.5%
MDA Total Medical Assistant (MDA) 4 3 75.0% 32 8.0 100.0% 100.0% 100.0% 87.5% 53.1%
MLT Total Medical Lab Technician (MLT) 6 6 100.0% 31 5.2 100.0% 100.0% 96.8% 96.8% 67.7%
NAD Total Nursing Assistant Training (NAD) 10 1 10.0% 99 9.9 92.9% 90.9% 90.9% 79.8% 44.4%
OTA Total Occupational Therapy Assistant (OTA) 8 8 100.0% 53 6.6 100.0% 100.0% 100.0% 94.3% 49.1%
PNE Total Practical Nursing (PNE) 56 35 62.5% 857 15.3 95.8% 88.0% 87.0% 79.8% 51.6%
STP Total Surgical Technology (STP) 2 2 100.0% 14 7.0 100.0% 100.0% 100.0% 78.6% 71.4%
VET Total Veterinary Technology (VET) 9 9 100.0% 27 3.0 77.8% 77.8% 77.8% 55.6% 11.1%
Allied Health Department Total 202 131.17 64.9% 2,419 12.0 93.2% 88.5% 87.5% 76.7% 47.9%
John A. Logan College - Retention Report (Spring 2016)by Department - Discipline

Total #
Sects
# Sections
by FT
%
Sections
by FT Enrl Avg Enrl Ret Succ D+ Succ C+ Succ B+ Succ A
John A. Logan College - Retention Report (Spring 2016)by Department - Discipline
Applied Technologies DepartmentACT Total Auto Collision Technology (ACT) 7 6 85.7% 79 11.3 98.7% 93.7% 91.1% 68.4% 49.4%
ARC Total Architecture (ARC) 1 1 100.0% 6 6.0 100.0% 100.0% 100.0% 50.0% 0.0%
AST Total Auto Services Technology (AST) 10 8 80.0% 209 20.9 91.4% 90.9% 79.9% 63.6% 28.7%
CMG Total Construction Management Technology (CMG) 13 8.5 65.4% 241 18.5 89.6% 88.8% 82.6% 61.0% 23.2%
DRT Total Drafting Technology (DRT) 9 4 44.4% 91 10.1 95.6% 91.2% 90.1% 75.8% 64.8%
PIW Total Electrical Construction Technology (PIW) 5 0 0.0% 18 3.6 100.0% 100.0% 100.0% 88.9% 38.9%
ELT Total Electronics (ELT) 16 11.5 71.9% 124 7.8 88.7% 85.5% 82.3% 70.2% 52.4%
GRD Total Graphics Design (GRD) 3 1 33.3% 37 12.3 89.2% 86.5% 83.8% 67.6% 45.9%
HAC Total Heating & Air Conditioning (HAC) 11 7 63.6% 130 11.8 89.2% 82.3% 79.2% 70.8% 57.7%
IDM Total Industrial Maintenance (IDM) 1 1 100.0% 16 16.0 93.8% 93.8% 93.8% 87.5% 50.0%
LBR Totals Laborers (LBR) 9 0 0.0% 88 9.8 100.0% 100.0% 100.0% 100.0% 86.4%
MAC Totals Machine Tools (MAC) 4 2 50.0% 52 13.0 94.2% 94.2% 88.5% 80.8% 38.5%
MFT Totals Manufacturing Technology (MFT) 1 0 0.0% 12 12.0 91.7% 91.7% 91.7% 91.7% 75.0%
WEL Total Welding (WEL) 75 42.5 56.7% 346 4.6 93.1% 92.5% 89.6% 82.7% 75.1%
Applied Technologies Department Total 165 92.5 56.1% 1,449 8.8 92.5% 90.6% 86.3% 73.6% 51.8%
Business Education DepartmentACC Total Accounting (ACC) 13 3 23.1% 197 15.2 81.7% 78.2% 73.6% 65.5% 44.7%
BUS Total Business (BUS) 37 21.5 58.1% 557 15.1 86.9% 81.7% 74.0% 59.6% 39.0%
CIS Total Computer Information Systems (CIS) 30 20 66.7% 384 12.8 82.3% 77.3% 71.9% 58.3% 35.4%
ECO Total Economics (ECO) 9 4 44.4% 183 20.3 89.1% 86.3% 80.9% 57.9% 36.1%
HIT Total Health Information Technology (HIT) 9 8 88.9% 52 5.8 82.7% 82.7% 76.9% 57.7% 28.8%
MGT Total Management (MGT) 3 3 100.0% 59 19.7 84.7% 84.7% 81.4% 69.5% 49.2%
MKT Total Marketing (MKT) 1 1 100.0% 23 23.0 82.6% 82.6% 82.6% 82.6% 73.9%
Business Education Department Total 102 60.5 59.3% 1,455 14.3 84.9% 80.8% 74.8% 60.5% 39.0%

Total #
Sects
# Sections
by FT
%
Sections
by FT Enrl Avg Enrl Ret Succ D+ Succ C+ Succ B+ Succ A
John A. Logan College - Retention Report (Spring 2016)by Department - Discipline
English DepartmentENG Total English (ENG) 56 18 32.1% 863 15.4 84.9% 81.5% 77.2% 62.6% 34.8%
LIT Total Literature (LIT) 12 11 91.7% 236 19.7 86.4% 83.1% 78.4% 64.8% 46.6%
English Department Total 68 29 42.6% 1,099 16.2 85.3% 81.8% 77.4% 63.1% 37.3%
Humanities DepartmentART Total Art Dept. (ART) 24 11 45.8% 383 16.0 86.2% 81.7% 78.1% 70.8% 47.3%
FRE Total French (FRE) 2 0 0.0% 17 8.5 100.0% 100.0% 100.0% 94.1% 82.4%
GER Total German (GER) 4 0 0.0% 46 11.5 97.8% 97.8% 93.5% 84.8% 80.4%
HUM Total Humanities (HUM) 2 0 0.0% 29 14.5 75.9% 72.4% 69.0% 62.1% 58.6%
ITD Total Interdisciplinary Topics (ITD) 2 2 100.0% 9 4.5 100.0% 100.0% 100.0% 100.0% 100.0%
MUS Total Music (MUS) 35 7 20.0% 379 10.8 87.1% 81.8% 77.6% 68.6% 58.0%
PHL Total Philosophy (PHL) 15 0 0.0% 306 20.4 86.9% 83.7% 80.4% 68.0% 51.0%
SPE Total Speech Communications (SPE) 26 4 15.4% 422 16.2 82.5% 80.8% 75.4% 66.8% 41.0%
SPN Total Spanish (SPN) 19 6 31.6% 305 16.1 94.4% 93.1% 86.9% 75.1% 53.4%
THTR Total Theatre (THTR) 4 1 25.0% 48 12.0 93.8% 91.7% 91.7% 77.1% 64.6%
Humanities Department Total 133 31 23.3% 1,944 14.6 87.4% 84.4% 80.0% 70.4% 51.5%
Life Sciences DepartmentBIO Total Biological Science (BIO) 39 27 69.2% 714 18.3 86.6% 82.9% 74.8% 52.2% 26.1%
HTH Total Health (HTH) 15 8 53.3% 237 15.8 87.3% 86.5% 84.0% 76.4% 59.5%
PED Total Physical Education (PED) 12 0 0.0% 193 16.1 91.2% 90.2% 87.6% 83.9% 77.2%
Life Sciences Department Total 66 35 53.0% 1,144 17.3 87.5% 84.9% 78.8% 62.6% 41.6%

Total #
Sects
# Sections
by FT
%
Sections
by FT Enrl Avg Enrl Ret Succ D+ Succ C+ Succ B+ Succ A
John A. Logan College - Retention Report (Spring 2016)by Department - Discipline
Math DepartmentMAT Total Math (MAT) 64 36 56.3% 956 14.9 71.8% 63.9% 54.3% 35.0% 14.1%
Math Department Total 64 36 56.3% 956 14.9 71.8% 63.9% 54.3% 35.0% 14.1%
Physical Sciences DepartmentCHM Total Chemistry (CHM) 9 5.5 61.1% 140 15.6 79.3% 71.4% 62.9% 45.0% 25.7%
CPS Total Computer Science (CPS) 2 2 100.0% 32 16.0 87.5% 87.5% 87.5% 68.8% 43.8%
PHS Total Physical Science (PHS) 16 5 31.3% 304 19.0 85.9% 83.9% 81.9% 69.1% 39.1%
PHY Total Physics (PHY) 9 7 77.8% 101 11.2 92.1% 85.1% 83.2% 66.3% 25.7%
SCI Total Science Integrated (SCI) 1 0.33 33.0% 17 17.0 94.1% 94.1% 94.1% 76.5% 29.4%
Physical Sciences Department Total 37 19.83 53.6% 594 16.1 85.7% 81.6% 78.3% 63.1% 33.7%
Social Science DepartmentAFS Total Air Force ROTC (AFS) 3 0 0.0% 8 2.7 100.0% 100.0% 100.0% 100.0% 87.5%
AMS Total Army Military Science (AMS) 2 0 0.0% 3 1.5 66.7% 66.7% 66.7% 66.7% 66.7%
ANT Total Anthropology (ANT) 5 5 100.0% 68 13.6 82.4% 73.5% 70.6% 58.8% 41.2%
EDC Total Education (EDC) 5 4 80.0% 74 14.8 82.4% 78.4% 77.0% 63.5% 33.8%
GEO Total Geography (GEO) 6 0 0.0% 84 14.0 91.7% 86.9% 79.8% 64.3% 46.4%
HIS Total History (HIS) 20 14 70.0% 382 19.1 83.0% 80.4% 76.7% 60.5% 34.0%
PSC Total Political Science (PSC) 11 8 72.7% 151 13.7 83.4% 78.8% 76.2% 68.2% 45.0%
PSY Total Psychology (PSY) 32 17 53.1% 615 19.2 84.2% 78.5% 68.9% 51.2% 24.7%
SOC Total Sociology (SOC) 18 15 83.3% 328 18.2 82.0% 76.5% 71.6% 58.5% 39.6%
VOL Total Volunteerism (VOL) 4 0 0.0% 21 5.3 85.7% 81.0% 81.0% 81.0% 81.0%
Social Science Department Total 106 63 59.4% 1,734 16.4 83.7% 78.9% 73.0% 58.2% 34.5%
Grand Total All Departments 943 498 52.8% 12,794 13.6 86.9% 82.9% 78.3% 64.9% 41.4%

JOHN A. LOGAN COLLEGE
Retention Report –
by Department – Discipline – Course

Cr Hrs PCS
Total #
Sects
# Sections
by FT
% Sections
by FT Enrl Avg Enrl Ret Succ D+ Succ C+ Succ B+ Succ A
ADN 203 Intro to Conceptual Framework 3.00 1.2 1 0.67 67.0% 10 10.0 100.0% 100.0% 100.0% 60.0% 30.0%
ADN 206 Cardiovascular Nursing Interventions 3.00 1.2 1 0 0.0% 5 5.0 80.0% 80.0% 80.0% 40.0% 20.0%
ADN 213 Nursing Today & Tomorrow 2.00 1.2 3 1.5 50.0% 34 11.3 100.0% 100.0% 100.0% 91.2% 35.3%
ADN 218 Mental Health Issues in Nursing 3.00 1.2 4 4 100.0% 34 8.5 100.0% 97.1% 97.1% 61.8% 23.5%
ADN 220 Nursing Care of Adult II 7.00 1.2 4 3.67 91.8% 37 9.3 100.0% 86.5% 86.5% 59.5% 16.2%
ADN 220S ADN Supplemental Instruction I 1.00 1.2 1 0 0.0% 16 16.0 87.5% 87.5% 87.5% 87.5% 87.5%
ADN 221 Family Nursing 5.00 1.2 4 4 100.0% 36 9.0 100.0% 97.2% 97.2% 72.2% 11.1%
ADN 230 Advanced Pharmacology I 1.50 1.2 3 2 66.7% 34 11.3 100.0% 100.0% 100.0% 67.6% 35.3%
ADN 231 Advanced Pharmacology II 1.50 1.2 3 2.5 83.3% 36 12.0 100.0% 94.4% 94.4% 66.7% 25.0%
ADN Total 24 18.34 76.4% 242 10.1 98.8% 95.0% 95.0% 69.8% 28.5%
Allied Heath (ALH)ALH 101 Cardiopulmonary Resuscitation 1.00 1.2 3 0 0.0% 54 18.0 98.1% 90.7% 90.7% 90.7% 90.7%
ALH 102 CPR Recertification 0.50 1.2 1 0 0.0% 18 18.0 100.0% 100.0% 100.0% 100.0% 100.0%
ALH 112 Pathophysiology and Terminology 3.00 1.2 1 0 0.0% 19 19.0 94.7% 94.7% 78.9% 73.7% 42.1%
ALH Total 5 0 0.0% 91 18.2 97.8% 93.4% 90.1% 89.0% 82.4%
Cosmetology (COS)COS 101 Cosmetology Theory I 6.00 1.2 1 1 100.0% 17 17.0 70.6% 70.6% 58.8% 58.8% 29.4%
COS 102 Cosmetology Theory II 5.00 1.2 1 1 100.0% 36 36.0 77.8% 61.1% 52.8% 38.9% 5.6%
COS 111 Cosmetology Laboratory I 11.00 1.2 1 1 100.0% 17 17.0 70.6% 58.8% 52.9% 52.9% 23.5%
COS 112 Cosmetology Laboratory II 11.00 1.2 2 1.5 75.0% 37 18.5 78.4% 70.3% 70.3% 62.2% 27.0%
COS Total 5 4.5 90.0% 107 21.4 75.7% 65.4% 59.8% 52.3% 19.6%
John A. Logan College - Retention Report (Spring 2016)by Department - Discipline - Course
Allied Health DepartmentAssociate Degree Nursing (ADN)

Cr Hrs PCS
Total #
Sects
# Sections
by FT
% Sections
by FT Enrl Avg Enrl Ret Succ D+ Succ C+ Succ B+ Succ A
John A. Logan College - Retention Report (Spring 2016)by Department - Discipline - Course
Criminal Justice (CRJ)CRJ 103 Introduction to Criminal Justice 3.00 1.2 2 2 100.0% 49 24.5 79.6% 79.6% 77.6% 67.3% 40.8%
CRJ 105 Criminal Behavior 3.00 1.2 2 2 100.0% 54 27.0 74.1% 74.1% 74.1% 72.2% 70.4%
CRJ 201 Criminal Justice Internship 4.00 1.2 1 0 0.0% 4 4.0 75.0% 75.0% 75.0% 75.0% 0.0%
CRJ 203 Introduction to Security 3.00 1.2 4 4 100.0% 78 19.5 83.3% 83.3% 82.1% 78.2% 53.8%
CRJ 205 Survey of Crime Detection Methods 3.00 1.2 3 0 0.0% 59 19.7 79.7% 72.9% 72.9% 62.7% 50.8%
CRJ 218 Introduction to Corrections 3.00 1.2 1 0 0.0% 1 1.0 100.0% 100.0% 100.0% 100.0% 100.0%
CRJ 219 Criminal Procedure 3.00 1.2 3 0 0.0% 52 17.3 90.4% 90.4% 88.5% 65.4% 44.2%
CRJ 220 Prob,Parole & Comm. Based Correction 3.00 1.2 1 1 100.0% 14 14.0 78.6% 78.6% 78.6% 71.4% 71.4%
CRJ 221 Police Administration 3.00 1.2 2 2 100.0% 44 22.0 95.5% 95.5% 95.5% 88.6% 77.3%
CRJ 222 Natural Resource Law Enforcement 3.00 1.2 1 1 100.0% 16 16.0 93.8% 93.8% 93.8% 81.3% 50.0%
CRJ 223 Juvenile Justice 3.00 1.2 1 0 0.0% 25 25.0 100.0% 96.0% 96.0% 92.0% 84.0%
CRJ 224H Terrorism and Homeland Security 3.00 1.2 1 1 100.0% 15 15.0 100.0% 100.0% 100.0% 93.3% 80.0%
CRJ Total 22 13 59.1% 411 18.7 85.2% 83.9% 83.2% 74.7% 58.2%
Dental Hygiene (DHY)DHY 202 Dental Pharmacology 2.00 1.2 1 0 0.0% 14 14.0 100.0% 100.0% 92.9% 71.4% 0.0%
DHY 206 Oral Pathology 2.00 1.2 1 1 100.0% 11 11.0 100.0% 100.0% 100.0% 72.7% 0.0%
DHY 210 Dental Hygiene Seminar I 1.50 1.2 1 1 100.0% 12 12.0 100.0% 100.0% 100.0% 83.3% 16.7%
DHY 211 Dental Hygiene Practice I 8.00 1.2 1 1 100.0% 11 11.0 100.0% 100.0% 100.0% 54.5% 9.1%
DHY Total 4 3 75.0% 48 12.0 100.0% 100.0% 97.9% 70.8% 6.3%
Diagnostic Medical Sonography (DMS)DMS 200 Medical Physics and Instrumentation 5.00 1.2 1 1 100.0% 14 14.0 100.0% 64.3% 64.3% 7.1% 7.1%
DMS 224 Cardiac Ultrasound Imaging/Lab II 6.00 1.2 3 1.5 50.0% 14 4.7 100.0% 64.3% 64.3% 21.4% 7.1%
DMS 226 Cardiac Ultrasound Clinic II 6.00 1.2 1 0.33 33.0% 14 14.0 100.0% 92.9% 92.9% 92.9% 85.7%
DMS Total 5 2.83 56.6% 42 8.4 100.0% 73.8% 73.8% 40.5% 33.3%
Dental Assisting (DNA)DNA 101 Dental Emergencies and Pathology 2.00 1.2 1 1 100.0% 19 19.0 100.0% 100.0% 100.0% 57.9% 10.5%
DNA 103 Dental Assisting Procedures II 2.00 1.2 2 2 100.0% 19 9.5 100.0% 100.0% 100.0% 89.5% 36.8%
DNA 104 Dental Radiography I 3.00 1.2 4 4 100.0% 19 4.8 100.0% 100.0% 100.0% 89.5% 10.5%
DNA 106 Preventive Dental Health Education 3.00 1.2 2 2 100.0% 19 9.5 100.0% 100.0% 100.0% 100.0% 52.6%
DNA 109 Dental Office Procedures 2.00 1.2 1 1 100.0% 19 19.0 100.0% 100.0% 100.0% 100.0% 26.3%
DNA 112 Dental Assisting Externship 5.00 1.2 1 1 100.0% 19 19.0 100.0% 100.0% 100.0% 100.0% 100.0%
DNA Total 11 11 100.0% 114 10.4 100.0% 100.0% 100.0% 89.5% 39.5%

Cr Hrs PCS
Total #
Sects
# Sections
by FT
% Sections
by FT Enrl Avg Enrl Ret Succ D+ Succ C+ Succ B+ Succ A
John A. Logan College - Retention Report (Spring 2016)by Department - Discipline - Course
Early Childhood Education (ECE)ECE 150 Infancy Development 3.00 1.2 1 1 100.0% 11 11.0 63.6% 54.5% 54.5% 45.5% 27.3%
ECE 155 The Early Childhood Profession 3.00 1.2 2 0 0.0% 48 24.0 100.0% 100.0% 100.0% 97.9% 89.6%
ECE 160 Child, Growth and Development 4.00 1.2 2 1 50.0% 20 10.0 70.0% 65.0% 65.0% 55.0% 35.0%
ECE 265 Early Childhood Curriculum 3.00 1.2 1 1 100.0% 10 10.0 80.0% 80.0% 80.0% 70.0% 10.0%
ECE 266 Pre-School Administration 3.00 1.2 1 1 100.0% 10 10.0 100.0% 90.0% 90.0% 50.0% 20.0%
ECE 267 Child Care Laboratory I 5.00 1.2 1 0.5 50.0% 2 2.0 100.0% 100.0% 100.0% 50.0% 50.0%
ECE 268 Child Care Laboratory II 5.00 1.2 2 1 50.0% 6 3.0 100.0% 100.0% 100.0% 100.0% 100.0%
ECE 272 Language and Literacy Development 3.00 1.1 1 1 100.0% 11 11.0 72.7% 72.7% 63.6% 45.5% 18.2%
ECE Total 11 6.5 59.1% 118 10.7 87.3% 84.7% 83.9% 73.7% 55.1%
Emergency Medical Services (EMS)EMS 251 Paramedic II 13.00 1.2 1 0 0.0% 10 10.0 90.0% 90.0% 80.0% 60.0% 20.0%
EMS 1 0 0.0% 10 10.0 90.0% 90.0% 80.0% 60.0% 20.0%
Emergency Medical Technician (EMT)EMT 111 Emergency Medical Technician I 10.00 1.2 1 0 0.0% 35 35.0 88.6% 88.6% 85.7% 68.6% 25.7%
EMT Total 1 0 0.0% 35 35.0 88.6% 88.6% 85.7% 68.6% 25.7%
Fire Science Safety (FSS)FSS 106 Hazardous Materials: Awareness 1.00 1.2 1 0 0.0% 1 1.0 100.0% 100.0% 100.0% 100.0% 100.0%
FSS 107 Firefighter III 5.00 1.2 1 0 0.0% 1 1.0 100.0% 100.0% 100.0% 100.0% 0.0%
FSS 202 Fire Apparatus Engineer 3.00 1.2 1 0 0.0% 1 1.0 100.0% 100.0% 100.0% 100.0% 100.0%
FSS 205 Tactics and Strategy I 3.00 1.2 1 0 0.0% 1 1.0 100.0% 100.0% 100.0% 100.0% 0.0%
FSS 208 Management II 3.00 1.2 1 0 0.0% 1 1.0 100.0% 100.0% 100.0% 0.0% 0.0%
FSS Total 5 0 0.0% 5 1.0 100.0% 100.0% 100.0% 80.0% 40.0%

Cr Hrs PCS
Total #
Sects
# Sections
by FT
% Sections
by FT Enrl Avg Enrl Ret Succ D+ Succ C+ Succ B+ Succ A
John A. Logan College - Retention Report (Spring 2016)by Department - Discipline - Course
Interpreter Preparation (IPP)IPP 142 American Sign Language II (ASL II) 4.00 1.1 1 0 0.0% 13 13.0 92.3% 92.3% 92.3% 92.3% 53.8%
IPP 151 Deaf Studies/Culture 3.00 1.2 1 0 0.0% 7 7.0 100.0% 100.0% 100.0% 85.7% 71.4%
IPP 201 Introduction to Interpreting 3.00 1.2 1 1 100.0% 4 4.0 100.0% 100.0% 100.0% 100.0% 50.0%
IPP 212 ASL Linguistics II 3.00 1.2 1 1 100.0% 3 3.0 66.7% 66.7% 66.7% 66.7% 33.3%
IPP 223 Introduction to Transliterating 3.00 1.2 1 1 100.0% 3 3.0 100.0% 100.0% 100.0% 66.7% 33.3%
IPP 241 Fingerspelling and Numbers II 1.00 1.2 1 0 0.0% 5 5.0 60.0% 60.0% 60.0% 40.0% 20.0%
IPP 244 ASL IV - Survey of ASL Literature 4.00 1.2 1 0 0.0% 4 4.0 100.0% 100.0% 100.0% 100.0% 50.0%
IPP 250 Field Experience I 3.00 1.2 1 1 100.0% 2 2.0 100.0% 100.0% 100.0% 100.0% 50.0%
IPP 251 Interpreting II 4.00 1.2 1 1 100.0% 2 2.0 100.0% 100.0% 100.0% 100.0% 50.0%
IPP Total 9 5 55.6% 43 4.8 90.7% 90.7% 90.7% 83.7% 48.8%
Massage Therapy (MAS)MAS 104 Anatomy and Physiology for Massage 5.00 1.2 1 0 0.0% 10 10.0 100.0% 100.0% 100.0% 90.0% 90.0%
MAS 105 Massage Therapy II 5.00 1.2 1 1 100.0% 10 10.0 100.0% 100.0% 100.0% 90.0% 80.0%
MAS 106 Advanced Massage Therapy 3.00 1.2 1 1 100.0% 10 10.0 100.0% 100.0% 100.0% 80.0% 60.0%
MAS 107 Massage Clinic 4.00 1.2 1 1 100.0% 10 10.0 100.0% 100.0% 100.0% 90.0% 80.0%
MAS Total 4 3 75.0% 40 10.0 100.0% 100.0% 100.0% 87.5% 77.5%
Medical Assistant (MDA)MDA 130 Pharmacology 3.00 1.2 1 1 100.0% 8 8.0 100.0% 100.0% 100.0% 100.0% 62.5%
MDA 132 Medical Clinic Procedures 4.00 1.2 1 1 100.0% 8 8.0 100.0% 100.0% 100.0% 75.0% 37.5%
MDA 133 Medical Office Laboratory Procedures 2.00 1.2 1 0 0.0% 8 8.0 100.0% 100.0% 100.0% 75.0% 12.5%
MDA 134 Externship 3.00 1.2 1 1 100.0% 8 8.0 100.0% 100.0% 100.0% 100.0% 100.0%
MDA Total 4 3 75.0% 32 8.0 100.0% 100.0% 100.0% 87.5% 53.1%
Medical Lab Technician (MLT)MLT 121 Serology 1.50 1.2 1 1 100.0% 4 4.0 100.0% 100.0% 100.0% 100.0% 50.0%
MLT 122 Clinical Microscopy 1.50 1.2 1 1 100.0% 5 5.0 100.0% 100.0% 80.0% 80.0% 60.0%
MLT 123 Phlebotomy 3.00 1.2 1 1 100.0% 4 4.0 100.0% 100.0% 100.0% 100.0% 100.0%
MLT 225 Clinical Chemistry 4.00 1.2 1 1 100.0% 6 6.0 100.0% 100.0% 100.0% 100.0% 50.0%
MLT 229 Applied Clinical Microbiology 5.00 1.2 1 1 100.0% 6 6.0 100.0% 100.0% 100.0% 100.0% 50.0%
MLT 252 Clinical Rotation II 3.00 1.2 1 1 100.0% 6 6.0 100.0% 100.0% 100.0% 100.0% 100.0%
IPP Total 6 6 100.0% 31 5.2 100.0% 100.0% 96.8% 96.8% 67.7%

Cr Hrs PCS
Total #
Sects
# Sections
by FT
% Sections
by FT Enrl Avg Enrl Ret Succ D+ Succ C+ Succ B+ Succ A
John A. Logan College - Retention Report (Spring 2016)by Department - Discipline - Course
Nursing Assistant Training (NAD)NAD 101 Nursing Assistant Training 7.00 1.2 10 1 10.0% 99 9.9 92.9% 90.9% 90.9% 79.8% 44.4%
NAD Total 10 1 10.0% 99 9.9 92.9% 90.9% 90.9% 79.8% 44.4%
Occupational Therapy Assistant (OTA)OTA 112 Activities of Daily Living 3.00 1.2 1 1 100.0% 7 7.0 100.0% 100.0% 100.0% 100.0% 42.9%
OTA 120 Occupational Therapeutic Media 3.00 1.2 1 1 100.0% 7 7.0 100.0% 100.0% 100.0% 85.7% 42.9%
OTA 122 Occupational Therapy Group Process 2.00 1.2 1 1 100.0% 7 7.0 100.0% 100.0% 100.0% 100.0% 28.6%
OTA 133 Clinical Rotation I 1.00 1.2 1 1 100.0% 7 7.0 100.0% 100.0% 100.0% 100.0% 57.1%
OTA 134 OT in Physical Disabilities 3.00 1.2 1 1 100.0% 7 7.0 100.0% 100.0% 100.0% 85.7% 28.6%
OTA 217 Fieldwork Experience I 4.50 1.2 1 1 100.0% 6 6.0 100.0% 100.0% 100.0% 83.3% 50.0%
OTA 218 Fieldwork Experience II 4.50 1.2 1 1 100.0% 6 6.0 100.0% 100.0% 100.0% 100.0% 66.7%
OTA 250 Occupational Therapy Administration 3.00 1.2 1 1 100.0% 6 6.0 100.0% 100.0% 100.0% 100.0% 83.3%
PNE Total 8 8 100.0% 53 6.6 100.0% 100.0% 100.0% 94.3% 49.1%
Practical Nursing (PNE)PNE 100 Nutrition 3.00 1.1 7 0 0.0% 148 21.1 85.8% 83.1% 77.7% 62.2% 45.3%
PNE 101 Fundamentals of Nursing 3.00 1.2 1 1 100.0% 42 42.0 95.2% 76.2% 76.2% 57.1% 21.4%
PNE 102A Nursing Procedures I 1.50 1.2 3 2 66.7% 36 12.0 88.9% 83.3% 83.3% 83.3% 83.3%
PNE 102B Nursing Procedures II 1.50 1.2 3 0 0.0% 33 11.0 93.9% 93.9% 93.9% 93.9% 93.9%
PNE 103 Clinical Nursing 2.00 1.2 4 3 75.0% 34 8.5 94.1% 94.1% 94.1% 94.1% 94.1%
PNE 161 Pharmacology in Nursing I 2.00 1.2 1 1 100.0% 37 37.0 94.6% 75.7% 75.7% 67.6% 16.2%
PNE 171 Pharmacology in Nursing II 2.00 1.2 3 3 100.0% 88 29.3 98.9% 79.5% 79.5% 75.0% 27.3%
PNE 183 Maternal and Newborn Health 2.00 1.2 3 1 33.3% 73 24.3 100.0% 90.4% 90.4% 87.7% 24.7%
PNE 184 Obstetrics Clinical 1.00 1.2 8 4 50.0% 73 9.1 100.0% 97.3% 97.3% 97.3% 97.3%
PNE 193 Pediatric Nursing 2.00 1.2 3 3 100.0% 75 25.0 100.0% 89.3% 89.3% 80.0% 14.7%
PNE 194 Community Nursing Clinical 1.00 1.2 8 8 100.0% 73 9.1 100.0% 97.3% 97.3% 97.3% 97.3%
PNE 204 Adult Nursing I 2.00 1.2 3 3 100.0% 73 24.3 98.6% 91.8% 91.8% 71.2% 8.2%
PNE 205 Medical/Surgical Clinical I 2.00 1.2 9 6 66.7% 72 8.0 98.6% 91.7% 91.7% 91.7% 91.7%
PNE Total 56 35 62.5% 857 15.3 95.8% 88.0% 87.0% 79.8% 51.6%
Surgical Technology (STP)STP 123 Surgical Procedures I 5.00 1.2 1 1 100.0% 7 7.0 100.0% 100.0% 100.0% 57.1% 42.9%
STP 125 Clinical Rotation in Surgical Tech I 5.00 1.2 1 1 100.0% 7 7.0 100.0% 100.0% 100.0% 100.0% 100.0%
STP Total 2 2 100.0% 14 7.0 100.0% 100.0% 100.0% 78.6% 71.4%

Cr Hrs PCS
Total #
Sects
# Sections
by FT
% Sections
by FT Enrl Avg Enrl Ret Succ D+ Succ C+ Succ B+ Succ A
John A. Logan College - Retention Report (Spring 2016)by Department - Discipline - Course
Veterinary Technology (VET)VET 111 Small Animal Nursing II 3.00 1.2 1 1 100.0% 4 4.0 75.0% 75.0% 75.0% 50.0% 0.0%
VET 113 Animal Anatomy and Physiology II 3.00 1.2 1 1 100.0% 4 4.0 75.0% 75.0% 75.0% 50.0% 25.0%
VET 116 Large Animal Nursing 3.00 1.2 1 1 100.0% 4 4.0 75.0% 75.0% 75.0% 75.0% 0.0%
VET 119 Animal Clinical Lab I 3.00 1.2 1 1 100.0% 4 4.0 75.0% 75.0% 75.0% 50.0% 0.0%
VET 133 Animal Surgical Technology I 3.00 1.2 1 1 100.0% 4 4.0 75.0% 75.0% 75.0% 50.0% 50.0%
VET 138 Animal Pharmacology I 2.00 1.2 1 1 100.0% 4 4.0 75.0% 75.0% 75.0% 25.0% 0.0%
VET 232 Vet Tech Internship II 4.00 1.2 1 1 100.0% 1 1.0 100.0% 100.0% 100.0% 100.0% 0.0%
VET 235 Laboratory and Exotic Animals 3.00 1.2 1 1 100.0% 1 1.0 100.0% 100.0% 100.0% 100.0% 0.0%
VET 236 Animal Management and Nutrition 3.00 1.2 1 1 100.0% 1 1.0 100.0% 100.0% 100.0% 100.0% 0.0%
Vet Total 9 9 100.0% 27 3.0 77.8% 77.8% 77.8% 55.6% 11.1%
Allied Health Department Total 202 131.17 64.9% 2,419 12.0 93.2% 88.5% 87.5% 76.7% 47.9%

Cr Hrs PCS
Total #
Sects
# Sections
by FT
% Sections
by FT Enrl Avg Enrl Ret Succ D+ Succ C+ Succ B+ Succ A
John A. Logan College - Retention Report (Spring 2016)by Department - Discipline - Course
Auto Collision Technology (ACT)ACT 192 Frame and Body Alignment 2.00 1.2 1 1 100.0% 12 12.0 100.0% 91.7% 83.3% 50.0% 41.7%
ACT 193 Advanced Auto Body Repair 1.00 1.2 1 1 100.0% 12 12.0 100.0% 91.7% 91.7% 83.3% 50.0%
ACT 194 Body Shop Management 1.00 1.2 1 1 100.0% 11 11.0 90.9% 90.9% 81.8% 54.5% 45.5%
ACT 197 Auto Body Repair and Paint Lab II 5.00 1.2 2 1 50.0% 23 11.5 100.0% 95.7% 95.7% 78.3% 69.6%
ACT 273 Chassis Electrical 3.00 1.2 1 1 100.0% 13 13.0 100.0% 92.3% 92.3% 61.5% 46.2%
ACT 291 Mech Systems for Collision Tech 2.00 1.2 1 1 100.0% 8 8.0 100.0% 100.0% 100.0% 75.0% 12.5%
ACT Total 7 6 85.7% 79 11.3 98.7% 93.7% 91.1% 68.4% 49.4%
Architecture (ARC)ARC 184 Architecture Documents I 4.00 1.2 1 1 100.0% 6 6.0 100.0% 100.0% 100.0% 50.0% 0.0%
EGR Total 1 1 100.0% 6 6.0 100.0% 100.0% 100.0% 50.0% 0.0%
Auto Services Technology (AST)AST 171A Ignition Systems 4.00 1.2 1 1 100.0% 23 23.0 91.3% 91.3% 91.3% 78.3% 30.4%
AST 171B Fuel and Exhaust Systems 4.00 1.2 1 1 100.0% 19 19.0 100.0% 100.0% 94.7% 89.5% 26.3%
AST 180B Starting and Charging Systems 2.00 1.2 1 1 100.0% 23 23.0 95.7% 95.7% 91.3% 73.9% 13.0%
AST 180C Electrical Accessories 2.00 1.2 1 0 0.0% 22 22.0 72.7% 68.2% 68.2% 40.9% 18.2%
AST 270 Manual Drive Trains and Axles 4.00 1.2 1 1 100.0% 25 25.0 92.0% 92.0% 84.0% 64.0% 12.0%
AST 271 Automatic Transmission/Transaxles 4.00 1.2 1 1 100.0% 24 24.0 95.8% 95.8% 45.8% 37.5% 20.8%
AST 276 Emission Control Systems 2.00 1.2 1 1 100.0% 24 24.0 95.8% 95.8% 83.3% 54.2% 37.5%
AST 279 ASE Testing 2.00 1.2 1 1 100.0% 25 25.0 96.0% 96.0% 80.0% 60.0% 36.0%
AST 281 Suspension and Steering 4.00 1.2 1 0 0.0% 16 16.0 100.0% 100.0% 100.0% 100.0% 81.3%
ATI 200 Applied Technologies Internship 3.00 1.2 1 1 100.0% 8 8.0 50.0% 50.0% 50.0% 37.5% 25.0%
AST Total 10 8 80.0% 209 20.9 91.4% 90.9% 79.9% 63.6% 28.7%
Applied Technologies Department

Cr Hrs PCS
Total #
Sects
# Sections
by FT
% Sections
by FT Enrl Avg Enrl Ret Succ D+ Succ C+ Succ B+ Succ A
John A. Logan College - Retention Report (Spring 2016)by Department - Discipline - Course
Construction Management Technology (CMG)CMG 105 Estimating Techniques 3.00 1.2 2 1.5 75.0% 30 15.0 70.0% 66.7% 56.7% 46.7% 13.3%
CMG 107 Construction Document Interpretation 3.00 1.2 2 2 100.0% 28 14.0 78.6% 78.6% 71.4% 60.7% 14.3%
CMG 108 Construction Materials 4.00 1.2 2 2 100.0% 27 13.5 81.5% 77.8% 77.8% 59.3% 25.9%
CMG 111 Exterior and Interior Finish Systems 3.00 1.2 2 1 50.0% 31 15.5 83.9% 83.9% 80.6% 64.5% 22.6%
CMG 207 Construction Management 3.00 1.2 1 1 100.0% 25 25.0 100.0% 100.0% 88.0% 48.0% 20.0%
CMG 209 Environmental Systems 3.00 1.2 1 0 0.0% 25 25.0 100.0% 100.0% 88.0% 56.0% 32.0%
CMG 212 Construction Administration 2.00 1.2 1 1 100.0% 25 25.0 100.0% 100.0% 96.0% 80.0% 28.0%
CMG 221 Land Development 3.00 1.2 1 0 0.0% 25 25.0 100.0% 100.0% 100.0% 64.0% 32.0%
CMG 226 Statics for Structures 3.00 1.2 1 0 0.0% 25 25.0 100.0% 100.0% 92.0% 72.0% 24.0%
CMG Total 13 8.5 65.4% 241 18.5 89.6% 88.8% 82.6% 61.0% 23.2%
Drafting Technology (DRT)DRT 181 Technical Drafting I 4.00 1.2 1 0 0.0% 19 19.0 100.0% 94.7% 94.7% 94.7% 89.5%
DRT 182 Technical Drafting II 4.00 1.2 1 1 100.0% 7 7.0 85.7% 85.7% 85.7% 71.4% 42.9%
DRT 185 Computer Graphics I 2.00 1.2 2 1 50.0% 35 17.5 97.1% 91.4% 91.4% 82.9% 74.3%
DRT 186 Geometric Dimensioning & Tolerancing 2.00 1.2 1 1 100.0% 4 4.0 100.0% 100.0% 75.0% 50.0% 25.0%
DRT 190 Computer Graphics II 2.00 1.2 1 1 100.0% 5 5.0 100.0% 100.0% 100.0% 80.0% 60.0%
DRT 192 Blueprint Reading 3.00 1.2 1 0 0.0% 15 15.0 86.7% 86.7% 86.7% 66.7% 53.3%
DRT 282 Tool Design 3.00 1.2 1 0 0.0% 3 3.0 100.0% 66.7% 66.7% 0.0% 0.0%
DRT 286 Computer Graphics IV 3.00 1.2 1 0 0.0% 3 3.0 100.0% 100.0% 100.0% 33.3% 33.3%
DRT Total 9 4 44.4% 91 10.1 95.6% 91.2% 90.1% 75.8% 64.8%
Electrical Construction Technology (PIW)PIW 110 History of the Labor Movement 3.00 1.2 1 0 0.0% 4 4.0 100.0% 100.0% 100.0% 100.0% 0.0%
PIW 222 IBEW Professional Inside Wireman VIII 4.00 1.2 1 0 0.0% 4 4.0 100.0% 100.0% 100.0% 100.0% 0.0%
PIW 224 IBEW Professional Inside Wireman X 4.00 1.2 1 0 0.0% 3 3.0 100.0% 100.0% 100.0% 33.3% 0.0%
PIW 225 Electrician Apprenticeship IV 2.00 1.2 1 0 0.0% 4 4.0 100.0% 100.0% 100.0% 100.0% 100.0%
PIW 226 Electrician Apprenticeship V 2.00 1.2 1 0 0.0% 3 3.0 100.0% 100.0% 100.0% 100.0% 100.0%
PIW Total 5 0 0.0% 18 3.6 100.0% 100.0% 100.0% 88.9% 38.9%

Cr Hrs PCS
Total #
Sects
# Sections
by FT
% Sections
by FT Enrl Avg Enrl Ret Succ D+ Succ C+ Succ B+ Succ A
John A. Logan College - Retention Report (Spring 2016)by Department - Discipline - Course
Electronics (ELT)ELT 102 Basic Electricity and Wiring 4.00 1.2 1 0 0.0% 15 15.0 53.3% 53.3% 46.7% 46.7% 33.3%
ELT 103 Applied DC/AC Circuits 4.00 1.2 1 0 0.0% 12 12.0 91.7% 91.7% 91.7% 75.0% 50.0%
ELT 104 Introduction to VFDs 2.00 1.2 1 0 0.0% 3 3.0 100.0% 100.0% 100.0% 100.0% 100.0%
ELT 112 Digital Electronics II 3.00 1.2 2 2 100.0% 12 6.0 100.0% 100.0% 83.3% 58.3% 33.3%
ELT 150 Applied Solid State Electronics 4.00 1.2 2 2 100.0% 20 10.0 90.0% 85.0% 85.0% 80.0% 60.0%
ELT 200 Introduction to Microprocessors 3.00 1.2 1 1 100.0% 6 6.0 100.0% 100.0% 100.0% 100.0% 66.7%
ELT 210 A+ Preparation Essentials 3.00 1.2 1 0.5 50.0% 10 10.0 90.0% 90.0% 90.0% 60.0% 40.0%
ELT 218 Introduction to Network Technologies 3.00 1.2 2 2 100.0% 18 9.0 94.4% 88.9% 83.3% 66.7% 50.0%
ELT 220 Linear Integrated Circuits 3.00 1.2 1 1 100.0% 3 3.0 100.0% 100.0% 100.0% 100.0% 100.0%
ELT 224 Power Distribution and Motors 3.00 1.2 2 1 50.0% 22 11.0 95.5% 86.4% 86.4% 77.3% 63.6%
ELT 243 Renewable Energy Systems 3.00 1.2 1 1 100.0% 2 2.0 50.0% 50.0% 50.0% 50.0% 50.0%
ELT 260 Introduction to Hydropower 3.00 1.2 1 1 100.0% 1 1.0 100.0% 100.0% 100.0% 0.0% 0.0%
ELT Total 16 11.5 71.9% 124 7.8 88.7% 85.5% 82.3% 70.2% 52.4%
Graphics Design (GRD)GRD 120 Graphics Design II 5.00 1.2 1 1 100.0% 15 15.0 80.0% 73.3% 73.3% 40.0% 33.3%
GRD 220 Animation 3.00 1.2 1 0 0.0% 12 12.0 100.0% 100.0% 91.7% 83.3% 41.7%
GRD 230 Video Production 3.00 1.2 1 0 0.0% 10 10.0 90.0% 90.0% 90.0% 90.0% 70.0%
GRD Total 3 1 33.3% 37 12.3 89.2% 86.5% 83.8% 67.6% 45.9%
Heating & Air Conditioning (HAC)HAC 105 Basic Sheet Metal Layout 3.00 1.2 1 0 0.0% 18 18.0 83.3% 77.8% 77.8% 72.2% 44.4%
HAC 107 Electrical Controls and Circuitry 3.00 1.2 1 1 100.0% 17 17.0 88.2% 88.2% 88.2% 88.2% 76.5%
HAC 122 Heating II 4.00 1.2 2 0 0.0% 20 10.0 90.0% 85.0% 80.0% 75.0% 70.0%
HAC 131 Refrigeration & Air Conditioning I 4.00 1.2 2 1 50.0% 36 18.0 83.3% 75.0% 72.2% 66.7% 50.0%
HAC 142 Commercial Refrigeration 4.00 1.2 1 1 100.0% 12 12.0 100.0% 100.0% 83.3% 66.7% 66.7%
HAC 207 Advanced Controls & Circuitry 3.00 1.2 1 1 100.0% 9 9.0 100.0% 77.8% 77.8% 55.6% 55.6%
HAC 224 Geothermal Systems 3.00 1.2 1 1 100.0% 3 3.0 100.0% 100.0% 100.0% 66.7% 66.7%
HAC 241 Building Systems Performance 3.00 1.2 1 1 100.0% 4 4.0 75.0% 75.0% 75.0% 50.0% 50.0%
HAC 279 ICE Testing 2.00 1.2 1 1 100.0% 11 11.0 100.0% 81.8% 81.8% 72.7% 45.5%
HAC Total 11 7 63.6% 130 11.8 89.2% 82.3% 79.2% 70.8% 57.7%
Industrial Maintenance (IDM)IDM 120 Safety & Environmental Management 2.00 1.2 1 1 100.0% 16 16.0 93.8% 93.8% 93.8% 87.5% 50.0%
IDM Total 1 1 100.0% 16 16.0 93.8% 93.8% 93.8% 87.5% 50.0%

Cr Hrs PCS
Total #
Sects
# Sections
by FT
% Sections
by FT Enrl Avg Enrl Ret Succ D+ Succ C+ Succ B+ Succ A
John A. Logan College - Retention Report (Spring 2016)by Department - Discipline - Course
Laborers (LBR)LBR 113 Mason Tending 3.00 1.2 1 0 0.0% 4 4.0 100.0% 100.0% 100.0% 100.0% 100.0%
LBR 114 Concrete Practices and Procedures 0.50 1.2 1 0 0.0% 8 8.0 100.0% 100.0% 100.0% 100.0% 100.0%
LBR 115 Asphalt Technology and Construction 3.00 1.2 1 0 0.0% 2 2.0 100.0% 100.0% 100.0% 100.0% 100.0%
LBR 131 Principles of Pipelaying 3.00 1.2 1 0 0.0% 6 6.0 100.0% 100.0% 100.0% 100.0% 66.7%
LBR 133 Asbestos Abatement 3.00 1.2 1 0 0.0% 27 27.0 100.0% 100.0% 100.0% 100.0% 85.2%
LBR 139 Highway Construction Plan Reading 3.00 1.2 1 0 0.0% 16 16.0 100.0% 100.0% 100.0% 100.0% 75.0%
LBR 152 Bridges 3.00 1.2 1 0 0.0% 12 12.0 100.0% 100.0% 100.0% 100.0% 83.3%
LBR 251 Special Project I 3.00 1.2 1 0 0.0% 5 5.0 100.0% 100.0% 100.0% 100.0% 100.0%
LBR 252 Special Project II 3.00 1.2 1 0 0.0% 8 8.0 100.0% 100.0% 100.0% 100.0% 100.0%
LBR Total 9 0 0.0% 88 9.8 100.0% 100.0% 100.0% 100.0% 86.4%
Machine Tools (MAC)IND 201 Metallurgy 2.00 1.2 1 1 100.0% 19 19.0 94.7% 94.7% 89.5% 89.5% 57.9%
MAC 154 Introduction to CNC 2.00 1.2 1 0 0.0% 8 8.0 100.0% 100.0% 100.0% 100.0% 37.5%
MAC 159 CAM Operations 2.00 1.2 1 0 0.0% 7 7.0 100.0% 100.0% 100.0% 85.7% 28.6%
MAC 180 Blueprint Reading 3.00 1.2 1 1 100.0% 18 18.0 88.9% 88.9% 77.8% 61.1% 22.2%
MAC Total 4 2 50.0% 52 13.0 94.2% 94.2% 88.5% 80.8% 38.5%
Manufacturing Technology (MFT)MFT 201 PLC Manufacturing Systems 3.00 1.2 1 0 0.0% 12 12.0 91.7% 91.7% 91.7% 91.7% 75.0%
MFT Total 1 0 0.0% 12 12.0 91.7% 91.7% 91.7% 91.7% 75.0%

Cr Hrs PCS
Total #
Sects
# Sections
by FT
% Sections
by FT Enrl Avg Enrl Ret Succ D+ Succ C+ Succ B+ Succ A
John A. Logan College - Retention Report (Spring 2016)by Department - Discipline - Course
Welding (WEL)WEL 150 Oxy-Acetylene Fusion Welding I 1.00 1.2 4 1.5 37.5% 29 7.3 89.7% 89.7% 86.2% 86.2% 69.0%
WEL 151 Oxy-Acetylene Fusion Welding II 2.00 1.2 3 1.5 50.0% 13 4.3 100.0% 100.0% 100.0% 92.3% 92.3%
WEL 152 Brazing and Soldering 1.00 1.2 3 1.5 50.0% 23 7.7 82.6% 82.6% 73.9% 73.9% 69.6%
WEL 153 Oxy-Acetylene Cutting 1.00 1.2 3 1.5 50.0% 15 5.0 86.7% 86.7% 86.7% 86.7% 86.7%
WEL 154 Arc Welding I 2.00 1.2 4 1.5 37.5% 19 4.8 89.5% 89.5% 89.5% 89.5% 89.5%
WEL 155 Arc Welding II 2.00 1.2 3 1.5 50.0% 14 4.7 85.7% 85.7% 85.7% 85.7% 85.7%
WEL 156 Arc Welding III 1.00 1.2 3 1.5 50.0% 15 5.0 86.7% 86.7% 86.7% 86.7% 86.7%
WEL 157 Arc Welding IV 1.00 1.2 3 1.5 50.0% 16 5.3 100.0% 100.0% 100.0% 100.0% 87.5%
WEL 158 Arc Welding V 1.00 1.2 3 1.5 50.0% 16 5.3 100.0% 100.0% 100.0% 100.0% 81.3%
WEL 159 Arc Welding 1.00 1.2 3 1.5 50.0% 13 4.3 100.0% 100.0% 100.0% 100.0% 84.6%
WEL 160 M.I.G. Welding 2.00 1.2 3 1.5 50.0% 15 5.0 93.3% 93.3% 93.3% 86.7% 73.3%
WEL 161 Cored Wire Welding 2.00 1.2 3 1.5 50.0% 12 4.0 100.0% 100.0% 91.7% 83.3% 75.0%
WEL 162 T.I.G. Welding 1.00 1.2 3 1.5 50.0% 14 4.7 100.0% 100.0% 85.7% 78.6% 78.6%
WEL 163 Weld Testing, and Inspection 2.00 1.2 3 1.5 50.0% 15 5.0 100.0% 93.3% 80.0% 60.0% 60.0%
WEL 182 Introduction to Arc Welding 1.00 1.2 1 1 100.0% 1 1.0 0.0% 0.0% 0.0% 0.0% 0.0%
WEL 188 Welding Laboratory I 1.00 1.2 2 1.5 75.0% 3 1.5 100.0% 100.0% 100.0% 100.0% 100.0%
WEL 189 Welding Laboratory II 1.00 1.2 2 1.5 75.0% 3 1.5 100.0% 100.0% 100.0% 100.0% 100.0%
WEL 190 Welding Laboratory III 1.00 1.2 2 1.5 75.0% 3 1.5 100.0% 100.0% 100.0% 100.0% 100.0%
WEL 191 Welding Laboratory IV 1.00 1.2 2 1 50.0% 3 1.5 66.7% 66.7% 66.7% 66.7% 66.7%
WEL 192 Introduction to Pipe Welding 1.00 1.2 2 1.5 75.0% 13 6.5 100.0% 100.0% 92.3% 76.9% 69.2%
WEL 193 Pipe Welding 1.00 1.2 2 1.5 75.0% 12 6.0 100.0% 100.0% 91.7% 91.7% 75.0%
WEL 194 Pipe Welding 2.00 1.2 2 1.5 75.0% 12 6.0 100.0% 100.0% 100.0% 75.0% 66.7%
WEL 195 Special Problems in Welding 4.00 1.2 3 3 100.0% 4 1.3 100.0% 100.0% 100.0% 75.0% 75.0%
WEL 196 M.I.G. Welding - Aluminum 1.00 1.2 2 1.5 75.0% 11 5.5 81.8% 72.7% 72.7% 63.6% 54.5%
WEL 197 M.I.G. Welding - Stainless Steel 1.00 1.2 2 1.5 75.0% 10 5.0 90.0% 90.0% 90.0% 80.0% 70.0%
WEL 198 T.I.G. Welding - Aluminum 1.00 1.2 3 1.5 50.0% 11 3.7 90.9% 90.9% 90.9% 72.7% 72.7%
WEL 199 T.I.G. Welding - Stainless Steel 1.00 1.2 3 1.5 50.0% 11 3.7 90.9% 90.9% 90.9% 72.7% 72.7%
WEL 200 Welding Theory 2.00 1.2 1 1 100.0% 15 15.0 93.3% 93.3% 93.3% 66.7% 40.0%
WEL 201 Industrial Maintenance Welding Lab 6.00 1.2 2 0.5 25.0% 5 2.5 100.0% 100.0% 100.0% 80.0% 80.0%
WEL Total 75 42.5 56.7% 346 4.6 93.1% 92.5% 89.6% 82.7% 75.1%
165 92.5 56.1% 1,449 8.8 92.5% 90.6% 86.3% 73.6% 51.8%Applied Technologies Department Total

Cr Hrs PCS
Total #
Sects
# Sections
by FT
% Sections
by FT Enrl Avg Enrl Ret Succ D+ Succ C+ Succ B+ Succ A
John A. Logan College - Retention Report (Spring 2016)by Department - Discipline - Course
Accounting (ACC)ACC 100 Business Accounting 3.00 1.2 6 1 16.7% 69 11.5 82.6% 78.3% 73.9% 63.8% 39.1%
ACC 105 Payroll Accounting 3.00 1.2 1 0 0.0% 19 19.0 78.9% 73.7% 63.2% 52.6% 21.1%
ACC 200 Financial Accounting I 3.00 1.1 3 0 0.0% 65 21.7 78.5% 75.4% 70.8% 64.6% 50.8%
ACC 201 Financial Accounting II 3.00 1.1 1 1 100.0% 25 25.0 88.0% 84.0% 84.0% 72.0% 48.0%
ACC 202 Managerial Accounting 3.00 1.1 1 1 100.0% 13 13.0 100.0% 100.0% 92.3% 92.3% 69.2%
ACC 225 Integrated Accounting on Computers 3.00 1.2 1 0 0.0% 6 6.0 50.0% 50.0% 50.0% 50.0% 50.0%
ACC Total 13 3 23.1% 197 15.2 81.7% 78.2% 73.6% 65.5% 44.7%
Business (BUS)BUS 110 Intro to Business 3.00 1.1 4 4 100.0% 85 21.3 75.3% 65.9% 56.5% 48.2% 31.8%
BUS 111 Business Mathematics 3.00 1.2 2 1 50.0% 25 12.5 92.0% 84.0% 72.0% 40.0% 36.0%
BUS 115 Basic Keyboarding 1.00 1.2 2 2 100.0% 19 9.5 73.7% 68.4% 63.2% 42.1% 36.8%
BUS 116 Keyboarding I 3.00 1.2 4 2 50.0% 49 12.3 87.8% 79.6% 71.4% 65.3% 59.2%
BUS 117 Keyboarding II 3.00 1.2 1 1 100.0% 15 15.0 73.3% 73.3% 73.3% 60.0% 40.0%
BUS 121 Business Statistics 3.00 1.1 1 0 0.0% 20 20.0 100.0% 95.0% 85.0% 60.0% 25.0%
BUS 135 Office Language Skills 3.00 1.2 1 0 0.0% 11 11.0 81.8% 72.7% 72.7% 72.7% 18.2%
BUS 215 Medical Terminology 3.00 1.2 6 3 50.0% 123 20.5 94.3% 90.2% 80.5% 66.7% 35.0%
BUS 216 Pathophysiology and Pharmacology 3.00 1.2 1 1 100.0% 2 2.0 100.0% 100.0% 100.0% 100.0% 50.0%
BUS 222 Legal/Social Environment of Business 3.00 1.1 4 0 0.0% 60 15.0 85.0% 85.0% 80.0% 61.7% 55.0%
BUS 235 Business Correspondence 3.00 1.2 2 2 100.0% 45 22.5 88.9% 82.2% 73.3% 57.8% 28.9%
BUS 236 Records Management 1.00 1.2 2 2 100.0% 22 11.0 100.0% 100.0% 95.5% 86.4% 72.7%
BUS 237 Office Procedures 3.00 1.2 1 1 100.0% 7 7.0 85.7% 85.7% 85.7% 85.7% 57.1%
BUS 261 MRT Transcription 3.00 1.2 1 0 0.0% 15 15.0 73.3% 73.3% 73.3% 73.3% 73.3%
BUS 270 Medical Office Procedures 3.00 1.2 2 1.5 75.0% 32 16.0 81.3% 68.8% 56.3% 31.3% 3.1%
BUS 275 Medical Office Coding and Insurance 3.00 1.2 1 1 100.0% 13 13.0 100.0% 100.0% 100.0% 61.5% 15.4%
BUS 280 Computer Appl. for the Med. Office 3.00 1.2 1 0 0.0% 6 6.0 83.3% 83.3% 83.3% 83.3% 66.7%
BUS 284 ICD-10-CM Coding 3.00 1.2 1 0 0.0% 8 8.0 100.0% 100.0% 87.5% 75.0% 50.0%
BUS Total 37 21.5 58.1% 557 15.1 86.9% 81.7% 74.0% 59.6% 39.0%
Business Education Department

Cr Hrs PCS
Total #
Sects
# Sections
by FT
% Sections
by FT Enrl Avg Enrl Ret Succ D+ Succ C+ Succ B+ Succ A
John A. Logan College - Retention Report (Spring 2016)by Department - Discipline - Course
Computer Information Systems (CIS)CIS 101 Introduction to Computers 3.00 1.2 6 3 50.0% 70 11.7 84.3% 80.0% 72.9% 58.6% 38.6%
CIS 104 Spreadsheet Design 3.00 1.2 1 0 0.0% 11 11.0 90.9% 90.9% 90.9% 81.8% 54.5%
CIS 105 Current Operating Systems/Security 3.00 1.2 2 2 100.0% 25 12.5 80.0% 80.0% 76.0% 60.0% 40.0%
CIS 120 Data Base Management 3.00 1.2 2 0 0.0% 21 10.5 61.9% 61.9% 57.1% 47.6% 19.0%
CIS 207 Computer Applications for Business 3.00 1.2 7 4 57.1% 107 15.3 77.6% 74.8% 65.4% 49.5% 25.2%
CIS 208 Security Awareness 3.00 1.2 2 2 100.0% 31 15.5 90.3% 80.6% 74.2% 67.7% 38.7%
CIS 209 Introduction to Cybercrimes 3.00 1.2 2 2 100.0% 26 13.0 76.9% 57.7% 57.7% 42.3% 30.8%
CIS 210 Presentation Graphics 2.00 1.2 1 1 100.0% 8 8.0 75.0% 75.0% 75.0% 37.5% 25.0%
CIS 213 Penetration Testing 3.00 1.2 1 1 100.0% 13 13.0 92.3% 92.3% 92.3% 92.3% 76.9%
CIS 220 Advanced Spreadsheet Design 3.00 1.2 1 1 100.0% 7 7.0 85.7% 85.7% 85.7% 85.7% 57.1%
CIS 230 Operating Systems 3.00 1.2 2 2 100.0% 32 16.0 84.4% 68.8% 62.5% 46.9% 18.8%
CIS 231 Firewalls & VPNs 3.00 1.2 1 1 100.0% 16 16.0 100.0% 100.0% 100.0% 93.8% 68.8%
CIS 240 Web Page Design 3.00 1.2 1 0 0.0% 13 13.0 92.3% 92.3% 92.3% 84.6% 61.5%
CIS 270 Cisco II 4.00 1.2 1 1 100.0% 4 4.0 100.0% 100.0% 100.0% 50.0% 25.0%
CIS Total 30 20 66.7% 384 12.8 82.3% 77.3% 71.9% 58.3% 35.4%
Economics (ECO)ECO 201 Introduction to Macroeconomics 3.00 1.1 5 2 40.0% 99 19.8 88.9% 83.8% 75.8% 49.5% 27.3%
ECO 202 Introduction to Microeconomics 3.00 1.1 4 2 50.0% 84 21.0 89.3% 89.3% 86.9% 67.9% 46.4%
ECO Total 9 4 44.4% 183 20.3 89.1% 86.3% 80.9% 57.9% 36.1%
Health Information Technology (HIT)HIT 102 Health Record Procedures 3.00 1.2 1 1 100.0% 4 4.0 100.0% 100.0% 100.0% 75.0% 25.0%
HIT 103 Health Records Systems Lab 1.00 1.2 1 1 100.0% 4 4.0 100.0% 100.0% 100.0% 75.0% 25.0%
HIT 210 CPT Coding 3.00 1.2 1 1 100.0% 2 2.0 100.0% 100.0% 100.0% 100.0% 0.0%
HIT 212 Quality Management 3.00 1.2 1 0 0.0% 3 3.0 100.0% 100.0% 100.0% 100.0% 100.0%
HIT 213 Clinical Practicum II 2.00 1.2 1 1 100.0% 2 2.0 100.0% 100.0% 100.0% 100.0% 100.0%
HIT 214 Health Info in Non-Trad Setting 2.00 1.2 1 1 100.0% 3 3.0 100.0% 100.0% 100.0% 100.0% 33.3%
HIT 215 Pathophysiology 4.00 1.2 1 1 100.0% 18 18.0 61.1% 61.1% 61.1% 44.4% 33.3%
HIT 216 Reimbursement Management 2.00 1.2 1 1 100.0% 2 2.0 100.0% 100.0% 100.0% 0.0% 0.0%
HIT 218 Introduction to Pharmacology 3.00 1.2 1 1 100.0% 14 14.0 85.7% 85.7% 64.3% 42.9% 7.1%
HIT Total 9 8 88.9% 52 5.8 82.7% 82.7% 76.9% 57.7% 28.8%
Management (MGT)MGT 112 Principles of Management 3.00 1.2 2 2 100.0% 46 23.0 84.8% 84.8% 80.4% 67.4% 47.8%
MGT 228 Small Business Management 3.00 1.2 1 1 100.0% 13 13.0 84.6% 84.6% 84.6% 76.9% 53.8%
MGT Total 3 3 100.0% 59 19.7 84.7% 84.7% 81.4% 69.5% 49.2%

Cr Hrs PCS
Total #
Sects
# Sections
by FT
% Sections
by FT Enrl Avg Enrl Ret Succ D+ Succ C+ Succ B+ Succ A
John A. Logan College - Retention Report (Spring 2016)by Department - Discipline - Course
Marketing (MKT)MKT 224 Advertising 3.00 1.2 1 1 100.0% 23 23.0 82.6% 82.6% 82.6% 82.6% 73.9%
MKT Total 1 1 100.0% 23 23.0 82.6% 82.6% 82.6% 82.6% 73.9%
102 60.5 59.3% 1,455 14.3 84.9% 80.8% 74.8% 60.5% 39.0%Business Education Department Total

Cr Hrs PCS
Total #
Sects
# Sections
by FT
% Sections
by FT Enrl Avg Enrl Ret Succ D+ Succ C+ Succ B+ Succ A
John A. Logan College - Retention Report (Spring 2016)by Department - Discipline - Course
English (ENG)ENG 050 Basic Reading & Writing 5.00 1.4 1 1 100.0% 5 5.0 60.0% 60.0% 60.0% 20.0% 0.0%
ENG 052 Developmental Writing Skills 5.00 1.4 3 3 100.0% 28 9.3 67.9% 60.7% 57.1% 21.4% 7.1%
ENG 053 Developmental Reading Skills 3.00 1.4 1 0 0.0% 9 9.0 77.8% 77.8% 66.7% 55.6% 22.2%
ENG 101 English Composition I 3.00 1.1 19 4 21.1% 279 14.7 78.1% 73.5% 67.0% 50.9% 29.0%
ENG 102 English Composition II 3.00 1.1 27 9 33.3% 474 17.6 89.9% 88.2% 85.0% 72.6% 40.7%
ENG 103 Creative Writing 3.00 1.1 1 1 100.0% 11 11.0 100.0% 100.0% 100.0% 100.0% 90.9%
ENG 113 Professional Technical Writing 3.00 1.2 4 0 0.0% 57 14.3 86.0% 73.7% 70.2% 54.4% 21.1%
ENG Total 56 18 32.1% 863 15.4 84.9% 81.5% 77.2% 62.6% 34.8%
Literature (LIT)LIT 232 American Lit: 1865 to Present 3.00 1.1 1 1 100.0% 11 11.0 72.7% 72.7% 72.7% 54.5% 45.5%
LIT 264 Literature for Children 3.00 1.1 1 1 100.0% 22 22.0 90.9% 86.4% 77.3% 59.1% 40.9%
LIT 275 The Art of the Cinema 3.00 1.1 2 2 100.0% 49 24.5 93.9% 85.7% 83.7% 57.1% 38.8%
LIT 280 Introduction to Literature 3.00 1.1 4 4 100.0% 79 19.8 78.5% 74.7% 67.1% 58.2% 32.9%
LIT 281 Introduction to Mythology 3.00 1.1 2 1 50.0% 27 13.5 96.3% 96.3% 88.9% 85.2% 63.0%
LIT 284 Ethnic Literature in America 3.00 1.1 2 2 100.0% 48 24.0 87.5% 87.5% 87.5% 77.1% 70.8%
LIT Total 12 11 91.7% 236 19.7 86.4% 83.1% 78.4% 64.8% 46.6%
English Department Total 68 29 42.6% 1099 16.2 85.3% 81.8% 77.4% 63.1% 37.3%
English Department

Cr Hrs PCS
Total #
Sects
# Sections
by FT
% Sections
by FT Enrl Avg Enrl Ret Succ D+ Succ C+ Succ B+ Succ A
John A. Logan College - Retention Report (Spring 2016)by Department - Discipline - Course
Art (ART)ART 102 Three Dimensional Design 3.00 1.1 1 1 100.0% 6 6.0 100.0% 100.0% 100.0% 100.0% 0.0%
ART 111 Art Appreciation 3.00 1.1 14 4 28.6% 273 19.5 88.3% 82.8% 79.9% 72.2% 50.5%
ART 221 History of Art II 3.00 1.1 1 0 0.0% 12 12.0 66.7% 58.3% 41.7% 25.0% 16.7%
ART 250 Ceramics I 3.00 1.1 1 1 100.0% 12 12.0 83.3% 83.3% 83.3% 83.3% 25.0%
ART 255 Life Drawing 3.00 1.1 1 1 100.0% 11 11.0 81.8% 81.8% 81.8% 72.7% 54.5%
ART 260 Beginning Painting 3.00 1.1 1 1 100.0% 8 8.0 100.0% 100.0% 100.0% 87.5% 87.5%
ART 290 Computer Art I 3.00 1.1 1 1 100.0% 18 18.0 72.2% 72.2% 50.0% 44.4% 22.2%
ART 292 Computer Art II 3.00 1.1 1 1 100.0% 10 10.0 90.0% 90.0% 90.0% 80.0% 80.0%
ART 293 Art Preparation and Portfolio 1.00 1.1 1 1 100.0% 1 1.0 100.0% 100.0% 100.0% 100.0% 0.0%
ART 296 Photography I 3.00 1.1 2 0 0.0% 32 16.0 78.1% 75.0% 75.0% 71.9% 40.6%
ART Total 24 11 45.8% 383 16.0 86.2% 81.7% 78.1% 70.8% 47.3%
French (FRE)FRE 102 Elementary French II 4.00 1.1 1 0 0.0% 11 11.0 100.0% 100.0% 100.0% 90.9% 81.8%
FRE 201 Intermediate French I 4.00 1.1 1 0 0.0% 6 6.0 100.0% 100.0% 100.0% 100.0% 83.3%
FRE Total 2 0 0.0% 17 8.5 100.0% 100.0% 100.0% 94.1% 82.4%
German (GER)GER 102 Elementary German 4.00 1.1 3 0 0.0% 35 11.7 97.1% 97.1% 91.4% 80.0% 74.3%
GER 201 Intermediate German 4.00 1.1 1 0 0.0% 11 11.0 100.0% 100.0% 100.0% 100.0% 100.0%
GER Total 4 0 0.0% 46 11.5 97.8% 97.8% 93.5% 84.8% 80.4%
Humanities (HUM)HUM 152 Death and Dying 3.00 1.1 2 0 0.0% 29 14.5 75.9% 72.4% 69.0% 62.1% 58.6%
HUM Total 2 0 0.0% 29 14.5 75.9% 72.4% 69.0% 62.1% 58.6%
Interdisciplinary Topics (ITD)ITD 200D Special Topics 1.00 1.1 1 1 100.0% 7 7.0 100.0% 100.0% 100.0% 100.0% 100.0%
ITD 206 Special Topics: Model Illinois Gov 3.00 1.1 1 1 100.0% 2 2.0 100.0% 100.0% 100.0% 100.0% 100.0%
ITD Total 2 2 100.0% 9 4.5 100.0% 100.0% 100.0% 100.0% 100.0%
Humanities Department

Cr Hrs PCS
Total #
Sects
# Sections
by FT
% Sections
by FT Enrl Avg Enrl Ret Succ D+ Succ C+ Succ B+ Succ A
John A. Logan College - Retention Report (Spring 2016)by Department - Discipline - Course
Music (MUS)MUS 101A Choral Ensemble 1.00 1.1 1 1 100.0% 44 44.0 95.5% 93.2% 93.2% 93.2% 90.9%
MUS 102A Chamber Ensemble 1.00 1.1 1 1 100.0% 21 21.0 95.2% 95.2% 95.2% 95.2% 95.2%
MUS 105 Music Appreciation 3.00 1.1 9 2 22.2% 201 22.3 83.1% 76.6% 70.6% 56.2% 38.3%
MUS 106 Beginning Class Piano I 1.00 1.1 1 0 0.0% 6 6.0 33.3% 33.3% 33.3% 33.3% 33.3%
MUS 109 Aural Skills II 1.00 1.1 1 1 100.0% 7 7.0 85.7% 85.7% 71.4% 71.4% 42.9%
MUS 110 Music Fundamentals 3.00 1.1 1 0 0.0% 5 5.0 80.0% 60.0% 40.0% 40.0% 40.0%
MUS 111 Applied Music 1.00 1.1 7 0 0.0% 29 4.1 86.2% 75.9% 75.9% 75.9% 75.9%
MUS 118 Band 1.00 1.1 1 0 0.0% 3 3.0 100.0% 100.0% 100.0% 100.0% 100.0%
MUS 119 Orchestra 1.00 1.1 1 0 0.0% 2 2.0 100.0% 100.0% 100.0% 100.0% 100.0%
MUS 122 Theory of Music 3.00 1.1 1 0 0.0% 5 5.0 100.0% 80.0% 40.0% 20.0% 20.0%
MUS 123 Music Ensemble 1.00 1.1 1 1 100.0% 24 24.0 95.8% 95.8% 95.8% 95.8% 95.8%
MUS 209 Aural Skills IV 1.00 1.1 1 1 100.0% 6 6.0 100.0% 100.0% 100.0% 83.3% 83.3%
MUS 211 Applied Music 2.00 1.1 7 0 0.0% 13 1.9 100.0% 92.3% 92.3% 92.3% 92.3%
MUS 222 Advanced Theory of Music II 3.00 1.1 1 0 0.0% 5 5.0 100.0% 100.0% 100.0% 60.0% 60.0%
MUS 225 Music Literature/History 3.00 1.1 1 0 0.0% 8 8.0 87.5% 87.5% 87.5% 75.0% 62.5%
MUS Total 35 7 20.0% 379 10.8 87.1% 81.8% 77.6% 68.6% 58.0%
Philosophy (PHL)PHL 111 Ethics & Moral Problems 3.00 1.1 9 0 0.0% 200 22.2 84.5% 81.0% 77.5% 66.0% 51.0%
PHL 121 Intro to Logic 3.00 1.1 2 0 0.0% 40 20.0 97.5% 95.0% 95.0% 92.5% 67.5%
PHL 131 Introduction to Philosophy 3.00 1.1 3 0 0.0% 47 15.7 85.1% 83.0% 80.9% 57.4% 36.2%
PHL 260 World Religions 3.00 1.1 1 0 0.0% 19 19.0 94.7% 89.5% 78.9% 63.2% 52.6%
PHL Total 15 0 0.0% 306 20.4 86.9% 83.7% 80.4% 68.0% 51.0%
Speech Communications (SPE)SPE 115 Speech 3.00 1.1 23 1 4.3% 373 16.2 83.1% 81.8% 76.9% 68.1% 43.2%
SPE 116 Interpersonal Communication 3.00 1.1 3 3 100.0% 49 16.3 77.6% 73.5% 63.3% 57.1% 24.5%
SPE Total 26 4 15.4% 422 16.2 82.5% 80.8% 75.4% 66.8% 41.0%
Spanish (SPN)SPN 101 Elementary Spanish I 4.00 1.1 2 1 50.0% 33 16.5 72.7% 69.7% 51.5% 39.4% 30.3%
SPN 102 Elementary Spanish II 4.00 1.1 10 4 40.0% 182 18.2 96.2% 95.1% 89.6% 74.7% 54.4%
SPN 201 Intermediate Spanish I 4.00 1.1 4 0 0.0% 57 14.3 100.0% 100.0% 96.5% 89.5% 66.7%
SPN 202 Intermediate Spanish II 4.00 1.1 3 1 33.3% 33 11.0 97.0% 93.9% 90.9% 87.9% 48.5%
SPN Total 19 6 31.6% 305 16.1 94.4% 93.1% 86.9% 75.1% 53.4%

Cr Hrs PCS
Total #
Sects
# Sections
by FT
% Sections
by FT Enrl Avg Enrl Ret Succ D+ Succ C+ Succ B+ Succ A
John A. Logan College - Retention Report (Spring 2016)by Department - Discipline - Course
Theatre (THTR)THE 113 Theatre Appreciation 3.00 1.1 1 0 0.0% 12 12.0 91.7% 83.3% 83.3% 41.7% 0.0%
THE 124 Fundamentals of Acting I 3.00 1.1 1 0 0.0% 11 11.0 90.9% 90.9% 90.9% 90.9% 81.8%
THE 125 Fundamentals of Acting II 3.00 1.1 1 0 0.0% 8 8.0 87.5% 87.5% 87.5% 62.5% 62.5%
THE 128 Theater Practicum 1.00 1.1 1 1 100.0% 17 17.0 100.0% 100.0% 100.0% 100.0% 100.0%
THTR Total 4 1 25.0% 48 12.0 93.8% 91.7% 91.7% 77.1% 64.6%
Humanities Department Total 133 31 23.3% 1944 14.6 87.4% 84.4% 80.0% 70.4% 51.5%

Cr Hrs PCS
Total #
Sects
# Sections
by FT
% Sections
by FT Enrl Avg Enrl Ret Succ D+ Succ C+ Succ B+ Succ A
John A. Logan College - Retention Report (Spring 2016)by Department - Discipline - Course
Biological Science (BIO)BIO 100 Biology for Non-Science Majors 4.00 1.1 8 6.5 81.3% 143 17.9 85.3% 80.4% 72.7% 53.8% 30.8%
BIO 101 Biological Science for Sci Majors I 4.00 1.1 4 2.5 62.5% 53 13.3 94.3% 86.8% 79.2% 49.1% 26.4%
BIO 102 Biological Sciences II 4.00 1.1 1 1 100.0% 14 14.0 100.0% 92.9% 85.7% 85.7% 50.0%
BIO 105 Human Biology 4.00 1.1 5 4 80.0% 79 15.8 84.8% 81.0% 70.9% 57.0% 26.6%
BIO 205 Human Anatomy & Physiology I 4.00 1.1 7 4 57.1% 122 17.4 82.0% 76.2% 64.8% 42.6% 22.1%
BIO 206 Human Anatomy & Physiology II 4.00 1.1 7 3 42.9% 150 21.4 92.7% 92.0% 84.7% 58.7% 34.0%
BIO 225 Genetics 3.00 1.1 1 1 100.0% 19 19.0 57.9% 52.6% 47.4% 31.6% 26.3%
BIO 226 General Microbiology 4.00 1.1 6 5 83.3% 134 22.3 85.8% 84.3% 78.4% 50.0% 12.7%
BIO Total 39 27 69.2% 714 18.3 86.6% 82.9% 74.8% 52.2% 26.1%
Health (HTH)HTH 110 Health Education 2.00 1.1 11 7 63.6% 140 12.7 83.6% 82.9% 81.4% 77.1% 63.6%
HTH 120 Human Sexuality 3.00 1.1 1 0 0.0% 22 22.0 86.4% 86.4% 77.3% 72.7% 45.5%
HTH 135 Drug Abuse & Alcohol Education 2.00 1.1 1 1 100.0% 23 23.0 95.7% 95.7% 95.7% 95.7% 87.0%
HTH 150 Stress and Its Management 3.00 1.1 1 0 0.0% 30 30.0 90.0% 86.7% 86.7% 76.7% 46.7%
HTH 250 Wellness for Women 3.00 1.1 1 0 0.0% 22 22.0 100.0% 100.0% 90.9% 54.5% 36.4%
HTH Total 15 8 53.3% 237 15.8 87.3% 86.5% 84.0% 76.4% 59.5%
Physical Education (PED)PED 126 Beginning Weight Training 1.00 1.1 9 0 0.0% 160 17.8 90.6% 89.4% 87.5% 86.9% 81.9%
PED 203 Walking for Fitness I 1.00 1.1 1 0 0.0% 4 4.0 100.0% 100.0% 100.0% 100.0% 50.0%
PEDE 190 Introduction to Coaching 3.00 1.1 1 0 0.0% 24 24.0 95.8% 95.8% 91.7% 66.7% 54.2%
PEDE 191 Introduction to Physical Education 2.00 1.1 1 0 0.0% 5 5.0 80.0% 80.0% 60.0% 60.0% 60.0%
PED Total 12 0 0.0% 193 16.1 91.2% 90.2% 87.6% 83.9% 77.2%
Life Sciences Department Total 66 35 53.0% 1,144 17.3 87.5% 84.9% 78.8% 62.6% 41.6%
Life Sciences Department

Cr Hrs PCS
Total #
Sects
# Sections
by FT
% Sections
by FT Enrl Avg Enrl Ret Succ D+ Succ C+ Succ B+ Succ A
John A. Logan College - Retention Report (Spring 2016)by Department - Discipline - Course
Math (MAT)MAT 051 Pre-Algebra 4.00 1.4 6 0 0.0% 59 9.8 59.3% 54.2% 47.5% 37.3% 20.3%
MAT 052 Basic Algebra 4.00 1.4 8 2 25.0% 141 17.6 63.8% 54.6% 42.6% 30.5% 11.3%
MAT 061 Basic Euclidean Geometry 3.00 1.4 1 0 0.0% 9 9.0 100.0% 77.8% 77.8% 22.2% 22.2%
MAT 062 Intermediate Algebra 5.00 1.4 5 4 80.0% 106 21.2 68.9% 57.5% 50.0% 31.1% 12.3%
MAT 100 Mathematics for Applied Technologies 3.00 1.2 2 0 0.0% 21 10.5 95.2% 95.2% 95.2% 81.0% 42.9%
MAT 104 Mathematics for Allied Health 3.00 1.2 3 2 66.7% 30 10.0 93.3% 83.3% 73.3% 56.7% 23.3%
MAT 105 Vocational Mathematics 3.00 1.2 2 0 0.0% 20 10.0 80.0% 75.0% 65.0% 40.0% 20.0%
MAT 108 College Algebra 4.00 1.1 4 4 100.0% 98 24.5 69.4% 65.3% 53.1% 26.5% 8.2%
MAT 109 College Trigonometry 3.00 1.1 1 1 100.0% 8 8.0 50.0% 25.0% 25.0% 12.5% 0.0%
MAT 111 Pre-Calculus 5.00 1.1 3 2 66.7% 33 11.0 66.7% 60.6% 51.5% 36.4% 18.2%
MAT 113 Intro to Contemporary Mathematics 3.00 1.1 11 7 63.6% 169 15.4 75.1% 66.9% 55.6% 29.0% 10.7%
MAT 116 Finite Math (For Business & Mangt) 3.00 1.1 1 1 100.0% 22 22.0 63.6% 59.1% 31.8% 22.7% 0.0%
MAT 117 Calculus for Business & Soc. Science 4.00 1.1 1 1 100.0% 10 10.0 60.0% 50.0% 40.0% 30.0% 20.0%
MAT 120 Elementary Statistics 3.00 1.1 9 5 55.6% 148 16.4 77.7% 71.6% 62.8% 45.9% 16.2%
MAT 131 Calculus I 5.00 1.1 2 2 100.0% 39 19.5 71.8% 64.1% 59.0% 28.2% 17.9%
MAT 201 Calculus II 5.00 1.1 1 1 100.0% 14 14.0 57.1% 35.7% 35.7% 28.6% 0.0%
MAT 205 Differential Equations 3.00 1.1 1 1 100.0% 13 13.0 84.6% 76.9% 61.5% 53.8% 38.5%
MAT 208 Math for Elementary Teachers I 3.00 1.1 1 1 100.0% 3 3.0 100.0% 100.0% 100.0% 66.7% 0.0%
MAT 209 Math for Elementary Teachers II 3.00 1.1 1 1 100.0% 9 9.0 66.7% 55.6% 55.6% 33.3% 11.1%
MAT 221 Intro to Linear Algebra 3.00 1.1 1 1 100.0% 4 4.0 75.0% 75.0% 75.0% 50.0% 25.0%
MAT Total 64 36 56.3% 956 14.9 71.8% 63.9% 54.3% 35.0% 14.1%
Math Department Total 64 36 56.3% 956 14.9 71.8% 63.9% 54.3% 35.0% 14.1%
Math Department

Cr Hrs PCS
Total #
Sects
# Sections
by FT
% Sections
by FT Enrl Avg Enrl Ret Succ D+ Succ C+ Succ B+ Succ A
John A. Logan College - Retention Report (Spring 2016)by Department - Discipline - Course
Chemistry (CHM)CHM 141 General, Organic & Biochemistry I 4.00 1.1 4 1.5 37.5% 90 22.5 73.3% 62.2% 50.0% 27.8% 10.0%
CHM 142 General, Organic & Biochemistry II 4.00 1.1 1 0 0.0% 21 21.0 95.2% 95.2% 95.2% 90.5% 71.4%
CHM 151 Chemical Principles 5.00 1.1 2 2 100.0% 8 4.0 75.0% 75.0% 75.0% 75.0% 50.0%
CHM 152 Chem Princip with Qualit Analysis 5.00 1.1 1 1 100.0% 14 14.0 85.7% 78.6% 78.6% 57.1% 35.7%
CHM 202 Organic Chemistry II 5.00 1.1 1 1 100.0% 7 7.0 100.0% 100.0% 85.7% 71.4% 42.9%
CHM Total 9 5.5 61.1% 140 15.6 79.3% 71.4% 62.9% 45.0% 25.7%
Computer Science (CPS)CPS 176 Introduction to Computer Programming 4.00 1.1 1 1 100.0% 20 20.0 85.0% 85.0% 85.0% 60.0% 40.0%
CPS 206 Computer Science I 4.00 1.1 1 1 100.0% 12 12.0 91.7% 91.7% 91.7% 83.3% 50.0%
CPS Total 2 2 100.0% 32 16.0 87.5% 87.5% 87.5% 68.8% 43.8%
Physical Science (PHS)PHS 101 Environmental Science 3.00 1.1 1 1 100.0% 18 18.0 88.9% 88.9% 83.3% 72.2% 33.3%
PHS 102 Astronomy 3.00 1.1 1 1 100.0% 21 21.0 76.2% 66.7% 66.7% 57.1% 19.0%
PHS 103 Earth Science 3.00 1.1 5 2 40.0% 110 22.0 83.6% 83.6% 82.7% 70.9% 31.8%
PHS 105 Physics for Non-Science Majors 3.00 1.1 6 1 16.7% 81 13.5 82.7% 80.2% 76.5% 59.3% 48.1%
PHS 107 Weather and Climate 3.00 1.1 1 0 0.0% 37 37.0 94.6% 94.6% 91.9% 75.7% 16.2%
PHS 111 Environmental Science II 3.00 1.1 2 0 0.0% 37 18.5 94.6% 89.2% 89.2% 83.8% 78.4%
PHS Total 16 5 31.3% 304 19.0 85.9% 83.9% 81.9% 69.1% 39.1%
Physics (PHY)PHY 121 Technical Physics 3.00 1.1 2 0 0.0% 39 19.5 100.0% 97.4% 94.9% 76.9% 12.8%
PHY 156 College Physics II 5.00 1.1 2 2 100.0% 14 7.0 78.6% 78.6% 78.6% 57.1% 57.1%
PHY 202 Dynamics 3.00 1.1 1 1 100.0% 24 24.0 95.8% 87.5% 87.5% 66.7% 25.0%
PHY 203 Mechanics of Solids 3.00 1.1 1 1 100.0% 5 5.0 100.0% 100.0% 100.0% 80.0% 40.0%
PHY 205 University Physics I 5.00 1.1 1 1 100.0% 10 10.0 60.0% 20.0% 10.0% 10.0% 0.0%
PHY 206 University Physics II 5.00 1.1 1 1 100.0% 6 6.0 100.0% 100.0% 100.0% 83.3% 50.0%
PHY 214 Introduction to Circuit Analysis 3.00 1.1 1 1 100.0% 3 3.0 100.0% 100.0% 100.0% 100.0% 66.7%
PHY Total 9 7 77.8% 101 11.2 92.1% 85.1% 83.2% 66.3% 25.7%
Physical Sciences Department

Cr Hrs PCS
Total #
Sects
# Sections
by FT
% Sections
by FT Enrl Avg Enrl Ret Succ D+ Succ C+ Succ B+ Succ A
John A. Logan College - Retention Report (Spring 2016)by Department - Discipline - Course
Science Integrated (SCI)SCI 210B Integrated Science II 3.00 1.1 1 0.33 33.0% 17 17.0 94.1% 94.1% 94.1% 76.5% 29.4%
SCI Total 1 0.33 33.0% 17 17.0 94.1% 94.1% 94.1% 76.5% 29.4%
37 19.83 53.6% 594 16.1 85.7% 81.6% 78.3% 63.1% 33.7%Physical Sciences Department Total

Cr Hrs PCS
Total #
Sects
# Sections
by FT
% Sections
by FT Enrl Avg Enrl Ret Succ D+ Succ C+ Succ B+ Succ A
John A. Logan College - Retention Report (Spring 2016)by Department - Discipline - Course
Air Force ROTC (AFS)AFS 102 Foundation of U.S. Air Force 1.00 1.1 2 0 0.0% 4 2.0 100.0% 100.0% 100.0% 100.0% 75.0%
AFS 102A Leadership Laboratory 2.00 1.1 1 0 0.0% 4 4.0 100.0% 100.0% 100.0% 100.0% 100.0%
AFS Total 3 0 0.0% 8 2.7 100.0% 100.0% 100.0% 100.0% 87.5%
Army Military Science (AMS)AMS 102 Introduction to Military Science 2 2.00 1.1 2 0 0.0% 3 1.5 66.7% 66.7% 66.7% 66.7% 66.7%
AMS Total 2 0 0.0% 3 1.5 66.7% 66.7% 66.7% 66.7% 66.7%
Anthropology (ANT)ANT 111 Anthropology 3.00 1.1 2 2 100.0% 31 15.5 80.6% 71.0% 67.7% 45.2% 29.0%
ANT 202 America's Diverse Cultures 3.00 1.1 1 1 100.0% 14 14.0 64.3% 50.0% 42.9% 35.7% 21.4%
ANT 216 Cultural Anthropology 3.00 1.1 1 1 100.0% 22 22.0 95.5% 90.9% 90.9% 90.9% 68.2%
ANT 240 Introduction: Physical Anthropology 3.00 1.1 1 1 100.0% 1 1.0 100.0% 100.0% 100.0% 100.0% 100.0%
ANT Total 5 5 100.0% 68 13.6 82.4% 73.5% 70.6% 58.8% 41.2%
Education (EDC)EDC 200 Introduction to Education 3.00 1.1 1 1 100.0% 9 9.0 77.8% 55.6% 55.6% 44.4% 0.0%
EDC 202 Human Growth, Development & Learning 3.00 1.1 2 2 100.0% 30 15.0 73.3% 70.0% 70.0% 56.7% 23.3%
EDC 203 Schooling in a Diverse Society 3.00 1.1 1 1 100.0% 27 27.0 88.9% 88.9% 85.2% 66.7% 48.1%
EDC 208 Charac & Meth for Tech Except Child 3.00 1.1 1 0 0.0% 8 8.0 100.0% 100.0% 100.0% 100.0% 62.5%
EDC Total 5 4 80.0% 74 14.8 82.4% 78.4% 77.0% 63.5% 33.8%
Geography (GEO)GEO 112 Regional Geography 3.00 1.1 2 0 0.0% 9 4.5 100.0% 100.0% 100.0% 66.7% 66.7%
GEO 215 Survival of Humans-Environ Studies 3.00 1.1 4 0 0.0% 75 18.8 90.7% 85.3% 77.3% 64.0% 44.0%
GEO Total 6 0 0.0% 84 14.0 91.7% 86.9% 79.8% 64.3% 46.4%
Social Science Department

Cr Hrs PCS
Total #
Sects
# Sections
by FT
% Sections
by FT Enrl Avg Enrl Ret Succ D+ Succ C+ Succ B+ Succ A
John A. Logan College - Retention Report (Spring 2016)by Department - Discipline - Course
History (HIS)HIS 101 Western Civilization I 3.00 1.1 1 0 0.0% 8 8.0 75.0% 62.5% 62.5% 50.0% 12.5%
HIS 102 Western Civilization II 3.00 1.1 1 0 0.0% 22 22.0 81.8% 72.7% 68.2% 59.1% 36.4%
HIS 103 World Civilizations I 3.00 1.1 1 1 100.0% 13 13.0 84.6% 84.6% 76.9% 61.5% 38.5%
HIS 104 World Civilizations II 3.00 1.1 1 1 100.0% 8 8.0 87.5% 87.5% 87.5% 87.5% 37.5%
HIS 201 United States History I 3.00 1.1 7 5 71.4% 123 17.6 82.9% 82.1% 77.2% 64.2% 45.5%
HIS 202 United States History II 3.00 1.1 5 3 60.0% 117 23.4 80.3% 76.1% 73.5% 54.7% 33.3%
HIS 213 Eastern Civilizations 3.00 1.1 3 3 100.0% 71 23.7 87.3% 85.9% 81.7% 62.0% 14.1%
HIS 223 The African American Experience 3.00 1.1 1 1 100.0% 20 20.0 85.0% 85.0% 85.0% 60.0% 40.0%
HIS Total 20 14 70.0% 382 19.1 83.0% 80.4% 76.7% 60.5% 34.0%
Political Science (PSC)PSC 131 American Government 3.00 1.1 9 6 66.7% 133 14.8 82.7% 79.7% 76.7% 67.7% 45.1%
PSC 220 The Law and Society 3.00 1.1 1 1 100.0% 10 10.0 80.0% 70.0% 70.0% 70.0% 60.0%
PSC 289 Introduction to Comparative Govern 3.00 1.1 1 1 100.0% 8 8.0 100.0% 75.0% 75.0% 75.0% 25.0%
PSC Total 11 8 72.7% 151 13.7 83.4% 78.8% 76.2% 68.2% 45.0%
Psychology (PSY)PSY 110 College Success and Career Planning 3.00 1.1 6 0 0.0% 112 18.7 96.4% 93.8% 85.7% 70.5% 41.1%
PSY 132 General Psychology 3.00 1.1 20 13 65.0% 378 18.9 79.4% 73.3% 64.0% 44.2% 18.3%
PSY 200 Social Psychology 3.00 1.1 1 1 100.0% 25 25.0 88.0% 80.0% 36.0% 20.0% 0.0%
PSY 203 Adolescent Psychology 3.00 1.1 1 1 100.0% 31 31.0 96.8% 80.6% 77.4% 67.7% 38.7%
PSY 262 Child Psychology 3.00 1.1 4 2 50.0% 69 17.3 84.1% 81.2% 76.8% 62.3% 36.2%
PSY Total 32 17 53.1% 615 19.2 84.2% 78.5% 68.9% 51.2% 24.7%
Sociology (SOC)SOC 133 Principles of Sociology 3.00 1.1 8 8 100.0% 160 20.0 83.8% 74.4% 69.4% 56.9% 41.9%
SOC 215 Diversity in American Life 3.00 1.1 4 3 75.0% 73 18.3 69.9% 69.9% 61.6% 43.8% 24.7%
SOC 263 Marriage & the Family 3.00 1.1 6 4 66.7% 95 15.8 88.4% 85.3% 83.2% 72.6% 47.4%
SOC Total 18 15 83.3% 328 18.2 82.0% 76.5% 71.6% 58.5% 39.6%
Volunteerism (VOL)VOL 101 Volunteerism 1.00 1.1 4 0 0.0% 21 5.3 85.7% 81.0% 81.0% 81.0% 81.0%
VOL Total 4 0 0.0% 21 5.3 85.7% 81.0% 81.0% 81.0% 81.0%
Social Science Department Total 106 63 59.4% 1734 16.4 83.7% 78.9% 73.0% 58.2% 34.5%
Total All Departments 943 498 52.8% 12,794 13.6 86.9% 82.9% 78.3% 64.9% 41.4%

JOHN A. LOGAN COLLEGE
Retention Report –
Academic Disciplines
sorted by Total Enrollment

Rank Discipline
Total #
Sects
#
Sections
by FT
%
Sections
by FT Enrl Avg Enrl Ret Succ D+ Succ C+ Succ B+ Succ A
1 Math (MAT) 64 36 56.3% 956 14.9 71.8% 63.9% 54.3% 35.0% 14.1%
2 English (ENG) 56 18 32.1% 863 15.4 84.9% 81.5% 77.2% 62.6% 34.8%
3 Practical Nursing (PNE) 56 35 62.5% 857 15.3 95.8% 88.0% 87.0% 79.8% 51.6%
4 Biological Science (BIO) 39 27 69.2% 714 18.3 86.6% 82.9% 74.8% 52.2% 26.1%
5 Psychology (PSY) 32 17 53.1% 615 19.2 84.2% 78.5% 68.9% 51.2% 24.7%
6 Business (BUS) 37 21.5 58.1% 557 15.1 86.9% 81.7% 74.0% 59.6% 39.0%
7 Speech Communications (SPE) 26 4 15.4% 422 16.2 82.5% 80.8% 75.4% 66.8% 41.0%
8 Criminal Justice (CRJ) 22 13 59.1% 411 18.7 85.2% 83.9% 83.2% 74.7% 58.2%
9 Computer Information Systems (CIS) 30 20 66.7% 384 12.8 82.3% 77.3% 71.9% 58.3% 35.4%
10 Art Dept. (ART) 24 11 45.8% 383 16.0 86.2% 81.7% 78.1% 70.8% 47.3%
11 History (HIS) 20 14 70.0% 382 19.1 83.0% 80.4% 76.7% 60.5% 34.0%
12 Music (MUS) 35 7 20.0% 379 10.8 87.1% 81.8% 77.6% 68.6% 58.0%
13 Welding (WEL) 75 42.5 56.7% 346 4.6 93.1% 92.5% 89.6% 82.7% 75.1%
14 Sociology (SOC) 18 15 83.3% 328 18.2 82.0% 76.5% 71.6% 58.5% 39.6%
15 Philosophy (PHL) 15 0 0.0% 306 20.4 86.9% 83.7% 80.4% 68.0% 51.0%
16 Spanish (SPN) 19 6 31.6% 305 16.1 94.4% 93.1% 86.9% 75.1% 53.4%
17 Physical Science (PHS) 16 5 31.3% 304 19.0 85.9% 83.9% 81.9% 69.1% 39.1%
18 Associate Degree Nursing (ADN) 24 18.34 76.4% 242 10.1 98.8% 95.0% 95.0% 69.8% 28.5%
19 Construction Management Technology (CMG) 13 8.5 65.4% 241 18.5 89.6% 88.8% 82.6% 61.0% 23.2%
20 Health (HTH) 15 8 53.3% 237 15.8 87.3% 86.5% 84.0% 76.4% 59.5%
21 Literature (LIT) 12 11 91.7% 236 19.7 86.4% 83.1% 78.4% 64.8% 46.6%
22 Auto Services Technology (AST) 10 8 80.0% 209 20.9 91.4% 90.9% 79.9% 63.6% 28.7%
23 Accounting (ACC) 13 3 23.1% 197 15.2 81.7% 78.2% 73.6% 65.5% 44.7%
24 Physical Education (PED) 12 0 0.0% 193 16.1 91.2% 90.2% 87.6% 83.9% 77.2%
25 Economics (ECO) 9 4 44.4% 183 20.3 89.1% 86.3% 80.9% 57.9% 36.1%
26 Political Science (PSC) 11 8 72.7% 151 13.7 83.4% 78.8% 76.2% 68.2% 45.0%
27 Chemistry (CHM) 9 5.5 61.1% 140 15.6 79.3% 71.4% 62.9% 45.0% 25.7%
28 Heating & Air Conditioning (HAC) 11 7 63.6% 130 11.8 89.2% 82.3% 79.2% 70.8% 57.7%
29 Electronics (ELT) 16 11.5 71.9% 124 7.8 88.7% 85.5% 82.3% 70.2% 52.4%
30 Early Childhood Education (ECE) 11 6.5 59.1% 118 10.7 87.3% 84.7% 83.9% 73.7% 55.1%
John A. Logan College - Retention Report (Spring 2016)Academic Disciplines sorted by Total Enrollment

Rank Discipline
Total #
Sects
#
Sections
by FT
%
Sections
by FT Enrl Avg Enrl Ret Succ D+ Succ C+ Succ B+ Succ A
John A. Logan College - Retention Report (Spring 2016)Academic Disciplines sorted by Total Enrollment
31 Dental Assisting (DNA) 11 11 100.0% 114 10.4 100.0% 100.0% 100.0% 89.5% 39.5%
32 Cosmetology (COS) 5 4.5 90.0% 107 21.4 75.7% 65.4% 59.8% 52.3% 19.6%
33 Physics (PHY) 9 7 77.8% 101 11.2 92.1% 85.1% 83.2% 66.3% 25.7%
34 Nursing Assistant Training (NAD) 10 1 10.0% 99 9.9 92.9% 90.9% 90.9% 79.8% 44.4%
35 Allied Health (ALH) 5 0 0.0% 91 18.2 97.8% 93.4% 90.1% 89.0% 82.4%
36 Drafting Technology (DRT) 9 4 44.4% 91 10.1 95.6% 91.2% 90.1% 75.8% 64.8%
37 Laborers (LBR) 9 0 0.0% 88 9.8 100.0% 100.0% 100.0% 100.0% 86.4%
38 Geography (GEO) 6 0 0.0% 84 14.0 91.7% 86.9% 79.8% 64.3% 46.4%
39 Auto Collision Technology (ACT) 7 6 85.7% 79 11.3 98.7% 93.7% 91.1% 68.4% 49.4%
40 Education (EDC) 5 4 80.0% 74 14.8 82.4% 78.4% 77.0% 63.5% 33.8%
41 Anthropology (ANT) 5 5 100.0% 68 13.6 82.4% 73.5% 70.6% 58.8% 41.2%
42 Management (MGT) 3 3 100.0% 59 19.7 84.7% 84.7% 81.4% 69.5% 49.2%
43 Occupational Therapy Assistant (OTA) 8 8 100.0% 53 6.6 100.0% 100.0% 100.0% 94.3% 49.1%
44 Machine Tools (MAC) 4 2 50.0% 52 13.0 94.2% 94.2% 88.5% 80.8% 38.5%
45 Health Information Technology (HIT) 9 8 88.9% 52 5.8 82.7% 82.7% 76.9% 57.7% 28.8%
46 Dental Hygiene (DHY) 4 3 75.0% 48 12.0 100.0% 100.0% 97.9% 70.8% 6.3%
47 Theatre (THTR) 4 1 25.0% 48 12.0 93.8% 91.7% 91.7% 77.1% 64.6%
48 German (GER) 4 0 0.0% 46 11.5 97.8% 97.8% 93.5% 84.8% 80.4%
49 Interpreter Preparation (IPP) 9 5 55.6% 43 4.8 90.7% 90.7% 90.7% 83.7% 48.8%
50 Diagnostic Medical Sonography (DMS) 5 2.83 56.6% 42 8.4 100.0% 73.8% 73.8% 40.5% 33.3%
51 Massage Therapy (MAS) 4 3 75.0% 40 10.0 100.0% 100.0% 100.0% 87.5% 77.5%
52 Graphics Design (GRD) 3 1 33.3% 37 12.3 89.2% 86.5% 83.8% 67.6% 45.9%
53 Emergency Medical Technician (EMT) 1 0 0.0% 35 35.0 88.6% 88.6% 85.7% 68.6% 25.7%
54 Medical Assistant (MDA) 4 3 75.0% 32 8.0 100.0% 100.0% 100.0% 87.5% 53.1%
55 Computer Science (CPS) 2 2 100.0% 32 16.0 87.5% 87.5% 87.5% 68.8% 43.8%
56 Medical Lab Technician (MLT) 6 6 100.0% 31 5.2 100.0% 100.0% 96.8% 96.8% 67.7%
57 Humanities (HUM) 2 0 0.0% 29 14.5 75.9% 72.4% 69.0% 62.1% 58.6%
58 Veterinary Technology (VET) 9 9 100.0% 27 3.0 77.8% 77.8% 77.8% 55.6% 11.1%
59 Marketing (MKT) 1 1 100.0% 23 23.0 82.6% 82.6% 82.6% 82.6% 73.9%
60 Volunteerism (VOL) 4 0 0.0% 21 5.3 85.7% 81.0% 81.0% 81.0% 81.0%

Rank Discipline
Total #
Sects
#
Sections
by FT
%
Sections
by FT Enrl Avg Enrl Ret Succ D+ Succ C+ Succ B+ Succ A
John A. Logan College - Retention Report (Spring 2016)Academic Disciplines sorted by Total Enrollment
61 Electrical Construction Technology (PIW) 5 0 0.0% 18 3.6 100.0% 100.0% 100.0% 88.9% 38.9%
62 French (FRE) 2 0 0.0% 17 8.5 100.0% 100.0% 100.0% 94.1% 82.4%
63 Science Integrated (SCI) 1 0.33 33.0% 17 17.0 94.1% 94.1% 94.1% 76.5% 29.4%
64 Industrial Maintenance (IDM) 1 1 100.0% 16 16.0 93.8% 93.8% 93.8% 87.5% 50.0%
65 Surgical Technology (STP) 2 2 100.0% 14 7.0 100.0% 100.0% 100.0% 78.6% 71.4%
66 Manufacturing Technology (MFT) 1 0 0.0% 12 12.0 91.7% 91.7% 91.7% 91.7% 75.0%
67 Emergency Medical Services (EMS) 1 0 0.0% 10 10.0 90.0% 90.0% 80.0% 60.0% 20.0%
68 Interdisciplinary Topics (ITD) 2 2 100.0% 9 4.5 100.0% 100.0% 100.0% 100.0% 100.0%
69 Air Force ROTC (AFS) 3 0 0.0% 8 2.7 100.0% 100.0% 100.0% 100.0% 87.5%
70 Architecture (ARC) 1 1 100.0% 6 6.0 100.0% 100.0% 100.0% 50.0% 0.0%
71 Fire Science Safety (FSS) 5 0 0.0% 5 1.0 100.0% 100.0% 100.0% 80.0% 40.0%
72 Army Military Science (AMS) 2 0 0.0% 3 1.5 66.7% 66.7% 66.7% 66.7% 66.7%
Grand Total All Departments 943 498 52.8% 12,794 13.6 86.9% 82.9% 78.3% 64.9% 41.4%

JOHN A. LOGAN COLLEGE
Retention Report –
by Department – Discipline
(Full-time/Term Faculty)
# of Sec.
% of
Sections Tot Enrl Avg Enrl Ret Succ D+ Succ C+ Succ B+ Succ A
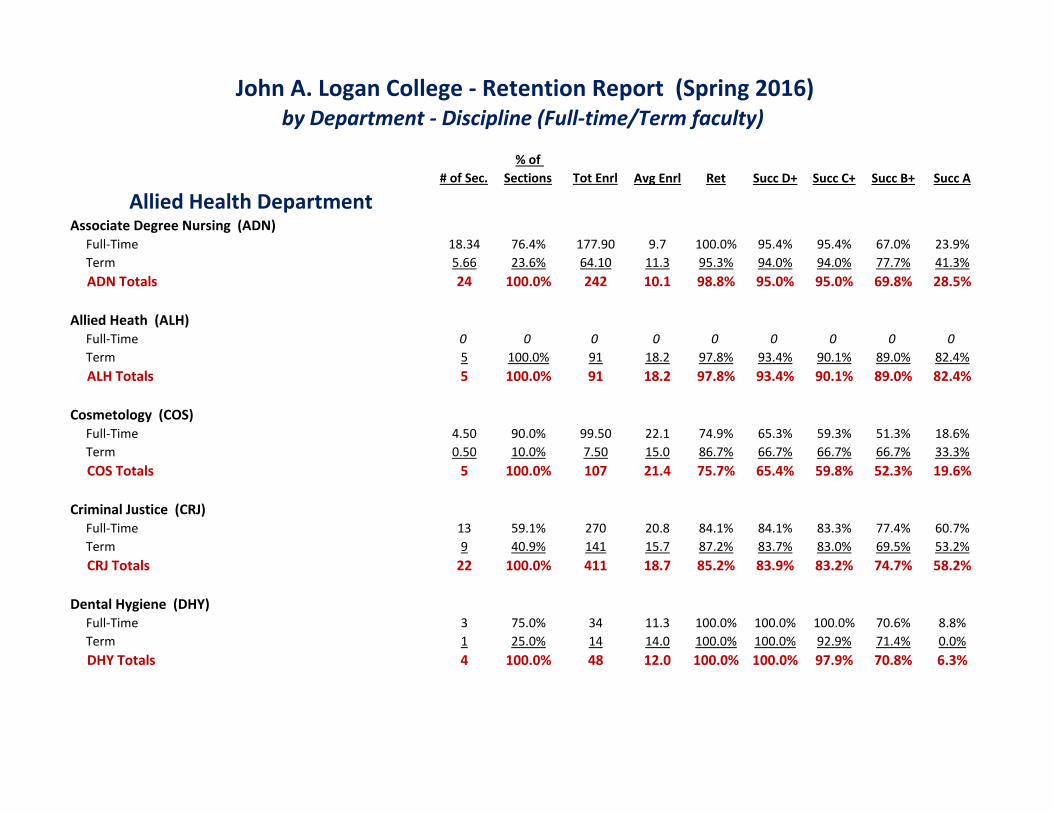
Allied Health DepartmentAssociate Degree Nursing (ADN) Full-Time 18.34 76.4% 177.90 9.7 100.0% 95.4% 95.4% 67.0% 23.9%
Term 5.66 23.6% 64.10 11.3 95.3% 94.0% 94.0% 77.7% 41.3%
ADN Totals 24 100.0% 242 10.1 98.8% 95.0% 95.0% 69.8% 28.5%
Allied Heath (ALH) Full-Time 0 0 0 0 0 0 0 0 0
Term 5 100.0% 91 18.2 97.8% 93.4% 90.1% 89.0% 82.4%
ALH Totals 5 100.0% 91 18.2 97.8% 93.4% 90.1% 89.0% 82.4%
Cosmetology (COS) Full-Time 4.50 90.0% 99.50 22.1 74.9% 65.3% 59.3% 51.3% 18.6%
Term 0.50 10.0% 7.50 15.0 86.7% 66.7% 66.7% 66.7% 33.3%
COS Totals 5 100.0% 107 21.4 75.7% 65.4% 59.8% 52.3% 19.6%
Criminal Justice (CRJ) Full-Time 13 59.1% 270 20.8 84.1% 84.1% 83.3% 77.4% 60.7%
Term 9 40.9% 141 15.7 87.2% 83.7% 83.0% 69.5% 53.2%
CRJ Totals 22 100.0% 411 18.7 85.2% 83.9% 83.2% 74.7% 58.2%
Dental Hygiene (DHY) Full-Time 3 75.0% 34 11.3 100.0% 100.0% 100.0% 70.6% 8.8%
Term 1 25.0% 14 14.0 100.0% 100.0% 92.9% 71.4% 0.0%
DHY Totals 4 100.0% 48 12.0 100.0% 100.0% 97.9% 70.8% 6.3%
John A. Logan College - Retention Report (Spring 2016)by Department - Discipline (Full-time/Term faculty)

# of Sec.
% of
Sections Tot Enrl Avg Enrl Ret Succ D+ Succ C+ Succ B+ Succ A
John A. Logan College - Retention Report (Spring 2016)by Department - Discipline (Full-time/Term faculty)
Diagnostic Medical Sonography (DMS) Full-Time 2.83 56.6% 25.62 9.1 100.0% 69.4% 69.4% 26.5% 21.3%
Term 2.17 43.4% 16.38 7.5 100.0% 80.6% 80.6% 62.3% 52.1%
DMS Totals 5 100.0% 42 8.4 100.0% 73.8% 73.8% 40.5% 33.3%
Dental Assisting (DNA) Full-Time 11 100.0% 114 10.4 100.0% 100.0% 100.0% 89.5% 39.5%
Term 0 0 0 0 0 0 0 0 0
DNA Totals 11 100.0% 114 10.4 100.0% 100.0% 100.0% 89.5% 39.5%
Early Childhood Education (ECE) Full-Time 6.50 59.1% 58 8.9 74.1% 69.0% 67.2% 49.1% 23.3%
Term 4.50 40.9% 60 13.3 100.0% 100.0% 100.0% 97.5% 85.8%
ECE Totals 11 100.0% 118 10.7 87.3% 84.7% 83.9% 73.7% 55.1%
Emergency Medical Services (EMS) Full-Time 0 0 0 0 0 0 0 0 0
Term 1 100.0% 10 10.0 90.0% 90.0% 80.0% 60.0% 20.0%
EMS Totals 1 100.0% 10 10.0 90.0% 90.0% 80.0% 60.0% 20.0%
Emergency Medical Technician (EMT) Full-Time 0 0 0 0 0 0 0 0 0
Term 1 100.0% 35 35.0 88.6% 88.6% 85.7% 68.6% 25.7%
EMS Totals 1 100.0% 35 35.0 88.6% 88.6% 85.7% 68.6% 25.7%
Fire Science Safety (FSS) Full-Time 0 0 0 0 0 0 0 0 0
Term 5 100.0% 5 1.0 100.0% 100.0% 100.0% 80.0% 40.0%
FSS Totals 5 100.0% 5 1.0 100.0% 100.0% 100.0% 80.0% 40.0%

# of Sec.
% of
Sections Tot Enrl Avg Enrl Ret Succ D+ Succ C+ Succ B+ Succ A
John A. Logan College - Retention Report (Spring 2016)by Department - Discipline (Full-time/Term faculty)
Interpreter Preparation (IPP) Full-Time 5 55.6% 14 2.8 92.9% 92.9% 92.9% 85.7% 42.9%
Term 4 44.4% 29 7.3 89.7% 89.7% 89.7% 82.8% 51.7%
IPP Totals 9 100.0% 43 4.8 90.7% 90.7% 90.7% 83.7% 48.8%
Massage Therapy (MAS) Full-Time 3 75.0% 30 10.0 100.0% 100.0% 100.0% 86.7% 73.3%
Term 1 25.0% 10 10.0 100.0% 100.0% 100.0% 90.0% 90.0%
MAS Totals 4 100.0% 40 10.0 100.0% 100.0% 100.0% 87.5% 77.5%
Medical Assistant (MDA) Full-Time 3 75.0% 24 8.0 100.0% 100.0% 100.0% 91.7% 66.7%
Term 1 25.0% 8 8.0 100.0% 100.0% 100.0% 75.0% 12.5%
MDA Totals 4 100.0% 32 8.0 100.0% 100.0% 100.0% 87.5% 53.1%
Medical Lab Technician (MLT) Full-Time 6 100.0% 31 5.2 100.0% 100.0% 96.8% 96.8% 67.7%
Term 0 0 0 0 0 0 0 0 0
MLT Totals 6 100.0% 31 5.2 100.0% 100.0% 96.8% 96.8% 67.7%
Nursing Assistant Training (NAD) Full-Time 1 10.0% 12 12.0 87.5% 83.3% 83.3% 79.2% 16.7%
Term 9 90.0% 87 9.7 93.7% 92.0% 92.0% 79.9% 48.3%
NAD Totals 10 100.0% 99 9.9 92.9% 90.9% 90.9% 79.8% 44.4%

# of Sec.
% of
Sections Tot Enrl Avg Enrl Ret Succ D+ Succ C+ Succ B+ Succ A
John A. Logan College - Retention Report (Spring 2016)by Department - Discipline (Full-time/Term faculty)
Occupational Therapy Assistant (OTA) Full-Time 8 100.0% 53 6.6 100.0% 100.0% 100.0% 94.3% 49.1%
Term 0 0 0 0 0 0 0 0 0
OTA Totals 8 100.0% 53 6.6 100.0% 100.0% 100.0% 94.3% 49.1%
Practical Nursing (PNE) Full-Time 35 62.5% 558 15.9 97.8% 87.8% 87.8% 81.2% 47.0%
Term 21 37.5% 299 14.2 92.0% 88.3% 85.6% 77.3% 60.2%
PNE Totals 56 100.0% 857 15.3 95.8% 88.0% 87.0% 79.8% 51.6%
Surgical Technology (STP) Full-Time 2 100.0% 14 7.0 100.0% 100.0% 100.0% 78.6% 71.4%
Term 0 0 0 0 0 0 0 0 0
STP Totals 2 100.0% 14 7.0 100.0% 100.0% 100.0% 78.6% 71.4%
Veterinary Technology (VET) Full-Time 9 100.0% 27 3.0 77.8% 77.8% 77.8% 55.6% 11.1%
Term 0 0 0 0 0 0 0 0 0
VET Totals 9 100.0% 27 3.0 1 77.8% 77.8% 55.6% 11.1%
ALH Dept. Full-Time Total 131.17 64.9% 1542.02 11.8 93.3% 87.8% 87.1% 75.8% 42.8%
ALH Dept. Term Total 70.83 35.1% 876.98 12.4 93.0% 89.9% 88.2% 78.2% 56.9%
Allied Health Department Total 202 100.0% 2,419 12.0 93.2% 88.5% 87.5% 76.7% 47.9%

# of Sec.
% of
Sections Tot Enrl Avg Enrl Ret Succ D+ Succ C+ Succ B+ Succ A
John A. Logan College - Retention Report (Spring 2016)by Department - Discipline (Full-time/Term faculty)
Applied Technologies DepartmentAuto Collision Technology (ACT) Full-Time 6 85.7% 68 11.3 98.5% 92.6% 89.7% 64.7% 44.1%
Term 1 14.3% 11 11.0 100.0% 100.0% 100.0% 90.9% 81.8%
ACR Totals 7 100.0% 79 11.3 98.7% 93.7% 91.1% 68.4% 49.4%
Architecture (ARC) Full-Time 1 100.0% 6 6.0 100.0% 100.0% 100.0% 50.0% 0.0%
Term 0 0 0 0 0 0 0 0 0
ARC Totals 1 100.0% 6 6.0 100.0% 100.0% 100.0% 50.0% 0.0%
Auto Services Technology (AST) Full-Time 8 80.0% 171 21.4 93.0% 93.0% 79.5% 63.2% 25.1%
Term 2 20.0% 38 19.0 84.2% 81.6% 81.6% 65.8% 44.7%
AST Totals 10 100.0% 209 20.9 91.4% 90.9% 79.9% 63.6% 28.7%
Construction Management Technology (CMG) Full-Time 8.50 65.4% 142.50 16.8 86.3% 85.3% 78.6% 59.6% 20.7%
Term 4.50 34.6% 98.50 21.9 94.4% 93.9% 88.3% 62.9% 26.9%
CMG Totals 13 100.0% 241 18.5 89.6% 88.8% 82.6% 61.0% 23.2%
Drafting Technology (DRT) Full-Time 4 44.4% 32 8.0 93.8% 93.8% 90.6% 71.9% 50.0%
Term 5 55.6% 59 11.8 96.6% 89.8% 89.8% 78.0% 72.9%
DRT Totals 9 100.0% 91 10.1 95.6% 91.2% 90.1% 75.8% 64.8%

# of Sec.
% of
Sections Tot Enrl Avg Enrl Ret Succ D+ Succ C+ Succ B+ Succ A
John A. Logan College - Retention Report (Spring 2016)by Department - Discipline (Full-time/Term faculty)
Electrical Construction Technology (PIW) Full-Time 0 0 0 0 0 0 0 0 0
Term 5 100.0% 18 3.6 100.0% 100.0% 100.0% 88.9% 38.9%
PIW Totals 5 100.0% 18 3.6 100.0% 100.0% 100.0% 88.9% 38.9%
Electronics (ELT) Full-Time 11.50 71.9% 78 6.8 94.2% 90.4% 86.5% 74.4% 56.4%
Term 4.50 28.1% 46 10.2 79.3% 77.2% 75.0% 63.0% 45.7%
ELT Totals 16 100.0% 124 7.8 88.7% 85.5% 82.3% 70.2% 52.4%
Graphics Design (GRD) Full-Time 1 33.3% 15 15.0 80.0% 73.3% 73.3% 40.0% 33.3%
Term 2 66.7% 22 11.0 95.5% 95.5% 90.9% 86.4% 54.5%
GRD Totals 3 100.0% 37 12.3 89.2% 86.5% 83.8% 67.6% 45.9%
Heating & Air Conditioning (HAC) Full-Time 7 63.6% 76 10.9 90.8% 82.9% 80.3% 69.7% 60.5%
Term 4 36.4% 54 13.5 87.0% 81.5% 77.8% 72.2% 53.7%
HAC Totals 11 100.0% 130 11.8 89.2% 82.3% 79.2% 70.8% 57.7%
Industrial Maintenance (IDM) Full-Time 1 100.0% 16 16.0 93.8% 93.8% 93.8% 87.5% 50.0%
Term 0 0 0 0 0 0 0 0 0
IDM Totals 1 100.0% 16 16.0 93.8% 93.8% 93.8% 87.5% 50.0%
Laborers (LBR) Full-Time 0 0 0 0 0 0 0 0 0
Term 9 100.0% 88 9.8 100.0% 100.0% 100.0% 100.0% 86.4%
LBR Totals 9 100.0% 88 9.8 100.0% 100.0% 100.0% 100.0% 86.4%

# of Sec.
% of
Sections Tot Enrl Avg Enrl Ret Succ D+ Succ C+ Succ B+ Succ A
John A. Logan College - Retention Report (Spring 2016)by Department - Discipline (Full-time/Term faculty)
Machine Tools (MAC) Full-Time 2 50.0% 37 18.5 91.9% 91.9% 83.8% 75.7% 40.5%
Term 2 50.0% 15 7.5 100.0% 100.0% 100.0% 93.3% 33.3%
MAC Totals 4 100.0% 52 13.0 94.2% 94.2% 88.5% 80.8% 38.5%
Manufacturing Technology (MFT) Full-Time 0 0 0 0 0 0 0 0 0
Term 1 100.0% 12 12.0 91.7% 91.7% 91.7% 91.7% 75.0%
MFT Totals 1 100.0% 12 12.0 91.7% 91.7% 91.7% 91.7% 75.0%
Welding (WEL) Full-Time 42.50 56.7% 217 5.1 92.2% 91.9% 87.3% 78.8% 69.1%
Term 32.50 43.3% 129 4.0 94.6% 93.4% 93.4% 89.1% 85.3%
WEL Totals 75 100.0% 346 5 93.1% 92.5% 89.6% 82.7% 75.1%
AT Dept. Full-Time Total 92.50 56.1% 858.50 9.3 91.8% 90.0% 83.8% 69.1% 45.0%
AT Dept. Term Total 72.50 43.9% 590.50 8.1 93.4% 91.5% 89.9% 80.3% 61.7%
Applied Technologies Department Total 165 100.0% 1,449 8.8 92.5% 90.6% 86.3% 73.6% 51.8%

# of Sec.
% of
Sections Tot Enrl Avg Enrl Ret Succ D+ Succ C+ Succ B+ Succ A
John A. Logan College - Retention Report (Spring 2016)by Department - Discipline (Full-time/Term faculty)
Business Education DepartmentAccounting (ACC) Full-Time 3 23.1% 52 17.3 80.8% 78.8% 76.9% 71.2% 48.1%
Term 10 76.9% 145 14.5 82.1% 77.9% 72.4% 63.4% 43.4%
ACC Totals 13 100.0% 197 15.2 81.7% 78.2% 73.6% 65.5% 44.7%
Business (BUS) Full-Time 21.50 58.1% 323.50 15.0 83.3% 77.4% 69.6% 55.2% 32.6%
Term 15.50 41.9% 233.50 15.1 91.9% 87.6% 80.1% 65.7% 47.8%
BUS Totals 37 100.0% 557 15.1 86.9% 81.7% 74.0% 59.6% 39.0%
Computer Information Systems (CIS) Full-Time 20 66.7% 262 13.1 82.4% 75.6% 71.8% 56.9% 34.4%
Term 10 33.3% 122 12.2 82.0% 81.1% 72.1% 61.5% 37.7%
CIS Totals 30 100.0% 384 12.8 82.3% 77.3% 71.9% 58.3% 35.4%
Economics (ECO) Full-Time 4 44.4% 64 16.0 92.2% 92.2% 92.2% 68.8% 50.0%
Term 5 55.6% 119 23.8 87.4% 83.2% 74.8% 52.1% 28.6%
ECO Totals 9 100.0% 183 20.3 89.1% 86.3% 80.9% 57.9% 36.1%
Health Information Technology (HIT) Full-Time 8 88.9% 49 6.1 81.6% 81.6% 75.5% 55.1% 24.5%
Term 1 11.1% 3 3.0 100.0% 100.0% 100.0% 100.0% 100.0%
HIT Totals 9 100.0% 52 5.8 82.7% 82.7% 76.9% 57.7% 28.8%

# of Sec.
% of
Sections Tot Enrl Avg Enrl Ret Succ D+ Succ C+ Succ B+ Succ A
John A. Logan College - Retention Report (Spring 2016)by Department - Discipline (Full-time/Term faculty)
Management (MGT) Full-Time 3 100.0% 59 19.7 84.7% 84.7% 81.4% 69.5% 49.2%
Term 0 0 0 0 0 0 0 0 0
MGT Totals 3 100.0% 59 19.7 84.7% 84.7% 81.4% 69.5% 49.2%
Marketing (MKT) Full-Time 1 100.0% 23 23.0 82.6% 82.6% 82.6% 82.6% 73.9%
Term 0 0 0 0 0 0 0 0 0
MKT Totals 1 100.0% 23 23.0 82.6% 82.6% 82.6% 82.6% 73.9%
BUS Dept. Full-Time Total 60.50 59.3% 832.50 13.8 83.5% 79.0% 74.0% 59.5% 37.3%
BUS Dept. Term Total 41.50 40.7% 622.50 15.0 86.8% 83.3% 75.8% 61.9% 41.4%
Business Education Department Total 102 100.0% 1,455 14.3 84.9% 80.8% 74.8% 60.5% 39.0%

# of Sec.
% of
Sections Tot Enrl Avg Enrl Ret Succ D+ Succ C+ Succ B+ Succ A
John A. Logan College - Retention Report (Spring 2016)by Department - Discipline (Full-time/Term faculty)
English DepartmentEnglish (ENG) Full-Time 18 32.1% 276 15.3 83.3% 81.5% 78.3% 65.9% 38.8%
Term 38 67.9% 587 15.4 85.7% 81.4% 76.7% 61.0% 32.9%
ENG Totals 56 100.0% 863 15.4 84.9% 81.5% 77.2% 62.6% 34.8%
Literature (LIT) Full-Time 11 91.7% 233 21.2 86.3% 82.8% 78.1% 64.4% 45.9%
Term 1 8.3% 3 3.0 100.0% 100.0% 100.0% 100.0% 100.0%
LIT Totals 12 100.0% 236 19.7 86.4% 83.1% 78.4% 64.8% 46.6%
ENG Dept. Full-Time Total 29 42.6% 509 17.6 84.7% 82.1% 78.2% 65.2% 42.0%
ENG Dept. Term Total 39 57.4% 590 15.1 85.8% 81.5% 76.8% 61.2% 33.2%
English Department Total 68 100.0% 1,099 16.2 85.3% 81.8% 77.4% 63.1% 37.3%

# of Sec.
% of
Sections Tot Enrl Avg Enrl Ret Succ D+ Succ C+ Succ B+ Succ A
John A. Logan College - Retention Report (Spring 2016)by Department - Discipline (Full-time/Term faculty)
Humanities DepartmentArt (ART) Full-Time 11 45.8% 164 14.9 87.2% 82.9% 79.9% 72.6% 43.9%
Term 13 54.2% 219 16.8 85.4% 80.8% 76.7% 69.4% 49.8%
ART Totals 24 100.0% 383 16.0 86.2% 81.7% 78.1% 70.8% 47.3%
French (FRE) Full-Time 0 0 0 0 0 0 0 0 0
Term 2 100.0% 17 8.5 100.0% 100.0% 100.0% 94.1% 82.4%
FRE Totals 2 100.0% 17 8.5 100.0% 100.0% 100.0% 94.1% 82.4%
German (GER) Full-Time 0 0 0 0 0 0 0 0 0
Term 4 100.0% 46 11.5 97.8% 97.8% 93.5% 84.8% 80.4%
GER Totals 4 100.0% 46 11.5 97.8% 97.8% 93.5% 84.8% 80.4%
Humanities (HUM) Full-Time 0 0 0 0 0 0 0 0 0
Term 2 100.0% 29 14.5 75.9% 72.4% 69.0% 62.1% 58.6%
HUM Totals 2 100.0% 29 14.5 75.9% 72.4% 69.0% 62.1% 58.6%
Interdisciplinary Topics (ITD) Full-Time 2 100.0% 9 4.5 100.0% 100.0% 100.0% 100.0% 100.0%
Term 0 0 0 0 0 0 0 0 0
ITD Totals 2 100.0% 9 4.5 100.0% 100.0% 100.0% 100.0% 100.0%

# of Sec.
% of
Sections Tot Enrl Avg Enrl Ret Succ D+ Succ C+ Succ B+ Succ A
John A. Logan College - Retention Report (Spring 2016)by Department - Discipline (Full-time/Term faculty)
Music (MUS) Full-Time 7 20.0% 149 21.3 91.9% 89.9% 85.9% 81.2% 72.5%
Term 28 80.0% 230 8.2 83.9% 76.5% 72.2% 60.4% 48.7%
MUS Totals 35 100.0% 379 10.8 87.1% 81.8% 77.6% 68.6% 58.0%
Philosophy (PHL) Full-Time 0 0 0 0 0 0 0 0 0
Term 15 100.0% 306 20.4 86.9% 83.7% 80.4% 68.0% 51.0%
PHL Totals 15 100.0% 306 20.4 86.9% 83.7% 80.4% 68.0% 51.0%
Spanish (SPN) Full-Time 6 31.6% 67 11.2 80.6% 77.6% 56.7% 32.8% 25.4%
Term 13 68.4% 238 18.3 98.3% 97.5% 95.4% 87.0% 61.3%
SPE Totals 19 100.0% 305 16.1 94.4% 93.1% 86.9% 75.1% 53.4%
Speech Communications (SPE) Full-Time 4 15.4% 66 16.5 77.3% 72.7% 62.1% 57.6% 25.8%
Term 22 84.6% 356 16.2 83.4% 82.3% 77.8% 68.5% 43.8%
SPE Totals 26 100.0% 422 16.2 82.5% 80.8% 75.4% 66.8% 41.0%
Theatre (THTR) Full-Time 1 25.0% 17 17.0 100.0% 100.0% 100.0% 100.0% 100.0%
Term 3 75.0% 31 10.3 90.3% 87.1% 87.1% 64.5% 45.2%
THTR Totals 4 100.0% 48 12.0 93.8% 91.7% 91.7% 77.1% 64.6%
HUM Dept. Full-Time Total 31 23.3% 472 15.2 87.1% 83.9% 77.1% 69.1% 50.8%
HUM Dept. Term Total 102 76.7% 1,472 14.4 87.6% 84.5% 80.9% 70.9% 51.7%
Humanities Department Total 133 100.0% 1,944 14.6 87.4% 84.4% 80.0% 70.4% 51.5%

# of Sec.
% of
Sections Tot Enrl Avg Enrl Ret Succ D+ Succ C+ Succ B+ Succ A
John A. Logan College - Retention Report (Spring 2016)by Department - Discipline (Full-time/Term faculty)
Life Sciences DepartmentBiological Science (BIO) Full-Time 27 69.2% 485.50 18.0 85.3% 81.4% 73.0% 51.2% 23.7%
Term 12 30.8% 228.50 19.0 89.3% 86.2% 78.6% 54.5% 31.1%
BIO Totals 39 100.0% 714 18.3 86.6% 82.9% 74.8% 52.2% 26.1%
Health (HTH) Full-Time 8 53.3% 105.00 13.1 82.9% 81.9% 81.9% 81.0% 72.4%
Term 7 46.7% 132.00 18.9 90.9% 90.2% 85.6% 72.7% 49.2%
HTH Totals 15 100.0% 237 15.8 87.3% 86.5% 84.0% 76.4% 59.5%
Physical Education (PED) Full-Time 0 0 0 0 0 0 0 0 0
Term 12 100.0% 193 16.1 91.2% 90.2% 87.6% 83.9% 77.2%
PED Totals 12 100.0% 193 16.1 91.2% 90.2% 87.6% 83.9% 77.2%
LSCI Dept. Full-Time Total 35 53.0% 590.50 16.9 84.8% 81.5% 74.6% 56.5% 32.3%
LSCI Dept. Term Total 31 47.0% 553.50 17.9 90.3% 88.5% 83.4% 69.1% 51.5%
Life Sciences Department Total 66 100.0% 1,144 17.3 87.5% 84.9% 78.8% 62.6% 41.6%

# of Sec.
% of
Sections Tot Enrl Avg Enrl Ret Succ D+ Succ C+ Succ B+ Succ A
John A. Logan College - Retention Report (Spring 2016)by Department - Discipline (Full-time/Term faculty)
Math DepartmentMath (MAT) Full-Time 36 56.3% 603 16.8 69.8% 61.2% 50.7% 31.5% 11.1%
Term 28 43.8% 353 12.6 75.1% 68.6% 60.3% 41.1% 19.3%
MAT Totals 64 100.0% 956 14.9 71.8% 63.9% 54.3% 35.0% 14.1%
MAT Dept. Full-Time Total 36 56.3% 603 16.8 69.8% 61.2% 50.7% 31.5% 11.1%
MAT Dept. Term Total 28 43.8% 353 12.6 75.1% 68.6% 60.3% 41.1% 19.3%
Math Department Total 64 100.0% 956 14.9 71.8% 63.9% 54.3% 35.0% 14.1%

# of Sec.
% of
Sections Tot Enrl Avg Enrl Ret Succ D+ Succ C+ Succ B+ Succ A
John A. Logan College - Retention Report (Spring 2016)by Department - Discipline (Full-time/Term faculty)
Physical Sciences DepartmentChemistry (CHM) Full-Time 5.50 61.1% 62.50 11.4 80.0% 72.0% 62.4% 43.2% 23.2%
Term 3.50 38.9% 77.50 22.1 78.7% 71.0% 63.2% 46.5% 27.7%
CHM Totals 9 100.0% 140 15.6 79.3% 71.4% 62.9% 45.0% 25.7%
Computer Science (CPS) Full-Time 2 100.0% 32 16.0 87.5% 87.5% 87.5% 68.8% 43.8%
Term 0 0 0 0 0 0 0 0 0
CPS Totals 2 100.0% 32 16.0 87.5% 87.5% 87.5% 68.8% 43.8%
Physical Science (PHS) Full-Time 5 31.3% 102 20.4 72.5% 69.6% 66.7% 55.9% 31.4%
Term 11 68.8% 202 18.4 92.6% 91.1% 89.6% 75.7% 43.1%
PHS Totals 16 100.0% 304 19.0 85.9% 83.9% 81.9% 69.1% 39.1%
Physics (PHY) Full-Time 7 77.8% 62 8.9 87.1% 77.4% 75.8% 59.7% 33.9%
Term 2 22.2% 39 19.5 100.0% 97.4% 94.9% 76.9% 12.8%
PHY Totals 9 100.0% 101 11.2 92.1% 85.1% 83.2% 66.3% 25.7%

# of Sec.
% of
Sections Tot Enrl Avg Enrl Ret Succ D+ Succ C+ Succ B+ Succ A
John A. Logan College - Retention Report (Spring 2016)by Department - Discipline (Full-time/Term faculty)
Science Integrated (SCI) Full-Time 0.33 33.0% 5.61 17.0 94.1% 94.1% 94.1% 76.5% 29.4%
Term 0.67 67.0% 11.39 17.0 94.1% 94.1% 94.1% 76.5% 29.4%
SCI Totals 1 100.0% 17 17.0 94.1% 94.1% 94.1% 76.5% 29.4%
PSCI Dept. Full-Time Total 19.83 53.6% 264.11 13.3 80.0% 74.7% 70.9% 55.8% 31.5%
PSCI Dept. Term Total 17.17 46.4% 329.89 19.2 90.2% 87.2% 84.2% 69.0% 35.4%
Physical Sciences Department Total 37 100.0% 594 16.1 85.7% 81.6% 78.3% 63.1% 33.7%

# of Sec.
% of
Sections Tot Enrl Avg Enrl Ret Succ D+ Succ C+ Succ B+ Succ A
John A. Logan College - Retention Report (Spring 2016)by Department - Discipline (Full-time/Term faculty)
Social Science DepartmentAir Force ROTC (AFS) Full-Time 0 0 0 0 0 0 0 0 0
Term 3 100.0% 8 2.7 100.0% 100.0% 100.0% 100.0% 87.5%
AFS Totals 3 100.0% 8 2.7 100.0% 100.0% 100.0% 100.0% 87.5%
Army Military Science (AMS) Full-Time 0 0 0 0 0 0 0 0 0
Term 2 100.0% 3 1.5 66.7% 66.7% 66.7% 66.7% 66.7%
AMS Totals 2 100.0% 3 1.5 66.7% 66.7% 66.7% 66.7% 66.7%
Anthropology (ANT) Full-Time 5 100.0% 68 13.6 82.4% 73.5% 70.6% 58.8% 41.2%
Term 0 0 0 0 0 0 0 0 0
ANT Totals 5 100.0% 68 13.6 82.4% 73.5% 70.6% 58.8% 41.2%
Education (EDC) Full-Time 4 80.0% 66 16.5 80.3% 75.8% 74.2% 59.1% 30.3%
Term 1 20.0% 8 8.0 100.0% 100.0% 100.0% 100.0% 62.5%
EDC Totals 5 100.0% 74 14.8 82.4% 78.4% 77.0% 63.5% 33.8%
Geography (GEO) Full-Time 0 0 0 0 0 0 0 0 0
Term 6 100.0% 84 14.0 91.7% 86.9% 79.8% 64.3% 46.4%
GEO Totals 6 100.0% 84 14.0 91.7% 86.9% 79.8% 64.3% 46.4%

# of Sec.
% of
Sections Tot Enrl Avg Enrl Ret Succ D+ Succ C+ Succ B+ Succ A
John A. Logan College - Retention Report (Spring 2016)by Department - Discipline (Full-time/Term faculty)
History (HIS) Full-Time 14 70.0% 273 19.5 83.2% 80.6% 76.9% 60.1% 33.0%
Term 6 30.0% 109 18.2 82.6% 79.8% 76.1% 61.5% 36.7%
HIS Totals 20 100.0% 382 19.1 83.0% 80.4% 76.7% 60.5% 34.0%
Political Science (PSC) Full-Time 8 72.7% 112 14.0 82.1% 78.6% 77.7% 70.5% 50.0%
Term 3 27.3% 39 13.0 87.2% 79.5% 71.8% 61.5% 30.8%
PSC Totals 11 100.0% 151 13.7 83.4% 78.8% 76.2% 68.2% 45.0%
Psychology (PSY) Full-Time 17 53.1% 383 22.5 79.4% 72.1% 60.8% 43.6% 19.6%
Term 15 46.9% 232 15.5 92.2% 89.2% 82.3% 63.8% 33.2%
PSY Totals 32 100.0% 615 19.2 84.2% 78.5% 68.9% 51.2% 24.7%
Sociology (SOC) Full-Time 15 83.3% 301 20.1 82.1% 76.1% 71.1% 57.5% 38.5%
Term 3 16.7% 27 9.0 81.5% 81.5% 77.8% 70.4% 51.9%
SOC Totals 18 100.0% 328 18.2 82.0% 76.5% 71.6% 58.5% 39.6%
Volunteerism (VOL) Full-Time 0 0 0 0 0 0 0 0 0
Term 4 100.0% 21 5.3 85.7% 81.0% 81.0% 81.0% 81.0%
VOL Totals 4 100.0% 21 5.3 85.7% 81.0% 81.0% 81.0% 81.0%
SSCI Dept. Full-Time Total 63 59.4% 1203 19.1 81.4% 75.9% 69.9% 55.0% 32.0%
SSCI Dept. Term Total 43 40.6% 531 12.3 89.1% 85.7% 80.0% 65.3% 40.1%
Social Science Department Total 106 100.0% 1734 16.4 83.7% 78.9% 73.0% 58.2% 34.5%

# of Sec.
% of
Sections Tot Enrl Avg Enrl Ret Succ D+ Succ C+ Succ B+ Succ A
John A. Logan College - Retention Report (Spring 2016)by Department - Discipline (Full-time/Term faculty)
Sub-total All Full-Time 498 52.8% 6,875 13.8 85.5% 80.8% 75.9% 61.8% 36.9%
Sub-total All Term 445 47.2% 5,919 13.3 88.5% 85.3% 81.1% 68.4% 46.6%
Grand Total 943 100.0% 12,794 13.6 86.9% 82.9% 78.3% 64.9% 41.4%

JOHN A. LOGAN COLLEGE
Retention Report –
by Type of Credit Hour

PCS Code
# of
Sec. % of Total
# Sections
by FT
%
Sections
by FT Tot Enrl Avg Enrl Ret Succ D+ Succ C+ Succ B+ Succ A
PCS 11 470 49.8% 212.83 45.3% 7,609 16.2 85.0% 81.2% 75.8% 61.6% 39.5%
PCS 12 448 47.5% 275.17 61.4% 4,828 10.8 91.4% 87.5% 84.4% 72.5% 46.6%
PCS 14 25 2.7% 10.00 40.0% 357 14.3 66.1% 57.1% 48.5% 31.4% 13.2%
Grand Total 943 100.0% 498.00 52.8% 12,794 13.6 86.9% 82.9% 78.3% 64.9% 41.4%
Credit Hours
# of
Sec. % of Total
# Sections
by FT
%
Sections
by FT Tot Enrl Avg Enrl Ret Succ D+ Succ C+ Succ B+ Succ A
0.5 Credit Hours 2 0.2% 0.00 0.0% 26 13.0 100.0% 100.0% 100.0% 100.0% 100.0%
1.0 Credit Hours 108 11.5% 56.50 52.3% 841 7.8 93.8% 91.7% 90.0% 87.2% 81.6%
1.5 Credit Hours 17 1.8% 9.50 55.9% 181 10.6 93.4% 91.2% 90.6% 77.9% 56.9%
2.0 Credit Hours 112 11.9% 69.00 61.6% 1,183 10.6 95.4% 90.4% 88.8% 78.7% 44.3%
3.0 Credit Hours 509 54.0% 250.50 49.2% 7,876 15.5 85.4% 81.6% 76.6% 62.8% 39.1%
4.0 Credit Hours 124 13.1% 63.50 51.2% 1,903 15.3 84.8% 81.2% 73.7% 57.1% 33.7%
4.5 Credit Hours 2 0.2% 2.00 100.0% 12 6.0 100.0% 100.0% 100.0% 91.7% 58.3%
5.0 Credit Hours 42 4.5% 35.50 84.5% 476 11.3 80.3% 71.6% 67.6% 47.7% 28.4%
6.0 Credit Hours 7 0.7% 3.33 47.6% 50 7.1 90.0% 78.0% 74.0% 60.0% 44.0%
7.0 Credit Hours 14 1.5% 4.67 33.4% 136 9.7 94.9% 89.7% 89.7% 74.3% 36.8%
8.0 Credit Hours 1 0.1% 1.00 100.0% 11 11.0 100.0% 100.0% 100.0% 54.5% 9.1%
10.0 Credit Hours 1 0.1% 0.00 0.0% 35 35.0 88.6% 88.6% 85.7% 68.6% 25.7%
11.0 Credit Hours 3 0.3% 2.50 83.3% 54 18.0 75.9% 66.7% 64.8% 59.3% 25.9%
13.0 Credit Hours 1 0.1% 0.00 0.0% 10 10.0 90.0% 90.0% 80.0% 60.0% 20.0%
Grand Total 943 100.0% 498.00 52.8% 12,794 13.6 86.9% 82.9% 78.3% 64.9% 41.4%
John A. Logan College - Retention Report (Spring 2016)by Type of Credit Hour

JOHN A. LOGAN COLLEGE
Retention Report –
by Day(s) Course Meets
(sorted by enrollment)

Day(s) Course Meets # of Sec. % of Total
# Sections
by FT
%
Sections
by FT Tot Enrl Avg Enrl Ret Succ D+ Succ C+ Succ B+ Succ A
TR 184 19.5% 94.33 51.3% 2,726 14.8 87.2% 83.9% 78.5% 62.7% 37.2%
MWF 126 13.4% 64 50.8% 2,350 18.7 83.4% 78.6% 73.4% 59.5% 38.1%
MW 95 10.1% 52.50 55.3% 1,275 13.4 84.3% 81.1% 76.7% 61.2% 35.7%
MTWR 82 8.7% 57.50 70.1% 717 8.7 84.7% 81.6% 73.8% 60.5% 41.0%
M 44 4.7% 26.50 60.2% 627 14.3 93.0% 85.2% 83.3% 68.6% 28.2%
MTWRF 34 3.6% 22 64.7% 363 10.7 79.3% 72.2% 68.6% 57.0% 39.9%
T 33 3.5% 18.17 55.1% 330 10.0 93.0% 87.3% 83.6% 70.6% 31.5%
R 22 2.3% 15 68.2% 219 10.0 89.5% 88.6% 86.8% 76.7% 56.2%
W 24 2.5% 14 58.3% 180 7.5 86.7% 84.4% 81.7% 65.0% 40.6%
MTW 19 2.0% 1.50 7.9% 85 4.5 89.4% 88.2% 87.1% 84.7% 75.3%
F 11 1.2% 8 72.7% 77 7.0 89.6% 85.7% 84.4% 76.6% 64.9%
MWR 7 0.7% 6.67 95.3% 64 9.1 100.0% 90.6% 90.6% 67.2% 28.1%
TWR 3 0.3% 3 100.0% 57 19.0 80.7% 70.2% 63.2% 52.6% 28.1%
WF 5 0.5% 3 60.0% 54 10.8 88.9% 83.3% 77.8% 74.1% 53.7%
RF 4 0.4% 2 50.0% 28 7.0 96.4% 96.4% 96.4% 96.4% 78.6%
MTR 1 0.1% 0.50 50.0% 23 23.0 82.6% 69.6% 52.2% 26.1% 0.0%
WRF 2 0.2% 2 100.0% 17 8.5 100.0% 88.2% 88.2% 88.2% 88.2%
TW 2 0.2% 2 100.0% 10 5.0 100.0% 100.0% 100.0% 90.0% 10.0%
WR 1 0.1% 0 0.0% 7 7.0 100.0% 100.0% 100.0% 100.0% 100.0%
MR 1 0.1% 1 100.0% 4 4.0 75.0% 75.0% 75.0% 50.0% 0.0%
-No Days- 243 25.8% 104.33 42.9% 3,581 14.7 88.8% 85.5% 81.3% 70.2% 50.2%
Grand Total 943 100.0% 498 52.8% 12,794 13.6 86.9% 82.9% 78.3% 64.9% 41.4%
John A. Logan College - Retention Report (Spring 2016)by Day(s) Course Meets (sorted by enrollment)

JOHN A. LOGAN COLLEGE
Retention Report –
by Time of Day Course Meets
(by start time)

Time Course Meets # of Sec. % of Total
# Sections
by FT
%
Sections
by FT Tot Enrl Avg Enrl Ret Succ D+ Succ C+ Succ B+ Succ A
7:00 AM 56 5.9% 40 71.4% 420 7.5 94.3% 92.6% 90.2% 88.3% 81.4%
7:30 AM 1 0.1% 0 0.0% 3 3.0 100.0% 100.0% 100.0% 100.0% 100.0%
8:00 AM 60 6.4% 40 66.7% 850 14.2 90.6% 84.5% 80.8% 68.5% 42.6%
8:30 AM 7 0.7% 3 42.9% 104 14.9 92.3% 89.4% 85.6% 71.2% 40.4%
9:00 AM 50 5.3% 33 66.0% 746 14.9 78.7% 74.8% 70.0% 54.0% 31.6%
9:30-9:55 AM 29 3.1% 19.50 67.2% 486 16.8 84.8% 81.5% 78.4% 63.2% 39.3%
10:00 AM 54 5.7% 35 64.8% 981 18.2 85.3% 79.0% 74.1% 61.0% 33.8%
10:30 AM 3 0.3% 3 100.0% 22 7.3 90.9% 90.9% 86.4% 68.2% 4.5%
11:00-11:10 AM 63 6.7% 30 47.6% 1178 18.7 84.1% 78.8% 73.0% 58.7% 39.5%
11:20-11:30 AM 2 0.2% 0 0.0% 14 7.0 78.6% 64.3% 64.3% 50.0% 21.4%
12:00 PM 46 4.9% 30.50 66.3% 760 16.5 86.7% 82.5% 76.8% 62.4% 37.1%
12:30-12:45 PM 33 3.5% 15.00 45.5% 494 15.0 84.2% 80.2% 72.9% 57.3% 36.0%
1:00 PM 66 7.0% 38.33 58.1% 645 9.8 86.4% 81.9% 76.4% 59.5% 38.6%
1:30-1:40 PM 6 0.6% 0 0.0% 90 15.0 87.8% 86.7% 83.3% 64.4% 34.4%
2:00 PM 35 3.7% 16 45.7% 370 10.6 83.0% 81.9% 77.3% 65.1% 41.9%
2:30 PM 4 0.4% 1 25.0% 54 13.5 77.8% 74.1% 74.1% 63.0% 29.6%
3:00 PM 6 0.6% 6 100.0% 84 14.0 95.2% 94.0% 91.7% 83.3% 23.8%
3:30 PM 1 0.1% 0 0.0% 5 5.0 100.0% 100.0% 100.0% 80.0% 40.0%
4:00 PM 9 1.0% 3 33.3% 87 9.7 90.8% 89.7% 89.7% 77.0% 48.3%
4:25-4:30 PM 6 0.6% 2.50 41.7% 38 6.3 94.7% 81.6% 81.6% 55.3% 34.2%
5:00 PM 16 1.7% 6 37.5% 277 17.3 87.7% 79.1% 73.3% 61.7% 31.0%
5:30 PM 5 0.5% 1.50 30.0% 70 14.0 81.4% 77.1% 74.3% 50.0% 30.0%
6:00 PM 49 5.2% 1.50 3.1% 419 8.6 85.0% 83.3% 77.8% 68.0% 49.9%
6:30 PM 1 0.1% 0 0.0% 14 14.0 64.3% 64.3% 50.0% 50.0% 28.6%
7:00 PM 1 0.1% 0 0.0% 7 7.0 100.0% 100.0% 100.0% 100.0% 100.0%
John A. Logan College - Retention Report (Spring 2016)by Time of Day Course Meets (by start time)

Time Course Meets # of Sec. % of Total
# Sections
by FT
%
Sections
by FT Tot Enrl Avg Enrl Ret Succ D+ Succ C+ Succ B+ Succ A
John A. Logan College - Retention Report (Spring 2016)by Time of Day Course Meets (by start time)
-No Days/Time- 224 23.8% 90.33 40.3% 3388 15.1 88.3% 85.1% 80.6% 68.9% 47.9%
-Varied- 110 11.7% 82.84 75.3% 1188 10.8 90.0% 86.8% 82.7% 64.9% 32.2%
Grand Total 943 100.0% 498 52.8% 12,794 13.6 86.9% 82.9% 78.3% 64.9% 41.4%
Morning 357 37.9% 228.50 64.0% 5198 14.6 86.3% 81.5% 77.0% 63.6% 40.2%
Afternoon 239 25.3% 129.83 54.3% 2913 12.2 86.1% 82.7% 77.3% 62.0% 37.3%
Evening 75 8.0% 11.50 15.3% 821 10.9 85.5% 81.4% 76.1% 64.7% 42.6%
-No Days/Time- 224 23.8% 90.33 40.3% 3388 15.1 88.3% 85.1% 80.6% 68.9% 47.9%
-Varied- 48 5.1% 37.84 78.8% 474 9.9 90.3% 85.9% 84.6% 67.9% 31.4%
Grand Total 943 100.0% 498 52.8% 12,794 13.6 86.9% 82.9% 78.3% 64.9% 41.4%

JOHN A. LOGAN COLLEGE
Retention Report –
Hybrid and Online Course Data

Dept/Disc Course Title Cr. Hrs PCS Enr Ret Succ D+ Succ C+ Succ B+ Succ A
Instructor
Status
Hybrid Courses
ALHADN ADN 203 H1 Intro to Conceptual Framework 3.00 1.2 10 100.0% 100.0% 100.0% 60.0% 30.0% FT & Term
ALHADN ADN 206 H1 Cardiovascular Nursing Interventions 3.00 1.2 5 80.0% 80.0% 80.0% 40.0% 20.0% Term
ALHADN ADN 213 H1 Nursing Today & Tomorrow 2.00 1.2 13 100.0% 100.0% 100.0% 92.3% 46.2% FT & Term
ALHADN ADN 213 H2 Nursing Today & Tomorrow 2.00 1.2 10 100.0% 100.0% 100.0% 80.0% 30.0% FT & Term
ALHADN ADN 213 H3 Nursing Today & Tomorrow 2.00 1.2 11 100.0% 100.0% 100.0% 100.0% 27.3% FT & Term
PHSICHM CHM 141 H1 General, Organic & Biochemistry I 4.00 1.1 20 60.0% 45.0% 25.0% 0.0% 0.0% FT & Term
ALHDMS DMS 224 H1 Cardiac Ultrasound Imaging/Lab II 6.00 1.2 5 100.0% 80.0% 80.0% 60.0% 20.0% FT & Term
ALHDMS DMS 224 H2 Cardiac Ultrasound Imaging/Lab II 6.00 1.2 5 100.0% 60.0% 60.0% 0.0% 0.0% FT & Term
ALHDMS DMS 224 H3 Cardiac Ultrasound Imaging/Lab II 6.00 1.2 4 100.0% 50.0% 50.0% 0.0% 0.0% FT & Term
ALHECE ECE 160 H1 Child, Growth and Development 4.00 1.2 12 50.0% 41.7% 41.7% 25.0% 16.7% FT
SSCIEDC EDC 208 H1 Charac & Meth for Tech Except Child 3.00 1.1 8 100.0% 100.0% 100.0% 100.0% 62.5% Term
HUMGER GER 102 H1 Elementary German 4.00 1.1 3 66.7% 66.7% 66.7% 66.7% 66.7% Term
APTEHAC HAC 224 H1 Geothermal Systems 3.00 1.2 3 100.0% 100.0% 100.0% 66.7% 66.7% FT
APTEHAC HAC 241 H1 Building Systems Performance 3.00 1.2 4 75.0% 75.0% 75.0% 50.0% 50.0% FT
BUSHIT HIT 212 H1 Quality Management 3.00 1.2 3 100.0% 100.0% 100.0% 100.0% 100.0% Term
ALHIPP IPP 241 H1 Fingerspelling and Numbers II 1.00 1.2 5 60.0% 60.0% 60.0% 40.0% 20.0% Term
HUMITD ITD 206 H1 Special Topics: Model Illinois Gov 3.00 1.1 2 100.0% 100.0% 100.0% 100.0% 100.0% FT
MATMAT MAT 113 H1 Intro to Contemporary Mathematics 3.00 1.1 20 65.0% 60.0% 45.0% 35.0% 20.0% FT
MATMAT MAT 120 H1 Elementary Statistics 3.00 1.1 20 85.0% 80.0% 75.0% 55.0% 20.0% FT
MATMAT MAT 120 H2 Elementary Statistics 3.00 1.1 7 28.6% 28.6% 14.3% 14.3% 0.0% FT
HUMMUS MUS 225 H1 Music Literature/History 3.00 1.1 8 87.5% 87.5% 87.5% 75.0% 62.5% Term
LSCIPED PED 126 H1 Beginning Weight Training 1.00 1.1 17 88.2% 82.4% 70.6% 64.7% 58.8% Term
LSCIPED PED 126 H2 Beginning Weight Training 1.00 1.1 3 66.7% 66.7% 33.3% 33.3% 0.0% Term
HUMSPE SPE 115 H1 Speech 3.00 1.1 18 72.2% 72.2% 72.2% 72.2% 50.0% Term
HUMSPE SPE 115 H8 Speech 3.00 1.1 19 100.0% 100.0% 84.2% 68.4% 36.8% Term
HUMSPE SPE 115 H9 Speech 3.00 1.1 2 50.0% 50.0% 50.0% 50.0% 50.0% Term
Hybrid Course Totals 237 81.4% 76.4% 70.0% 54.9% 32.1%
John A. Logan College - Retention Report (Spring 2016)Hybrid & Online Course Data

Dept/Disc Course Title Cr. Hrs PCS Enr Ret Succ D+ Succ C+ Succ B+ Succ A
Instructor
Status
John A. Logan College - Retention Report (Spring 2016)Hybrid & Online Course Data
Online Courses
BUSACC ACC 100 V1 Business Accounting 3.00 1.2 14 50.0% 50.0% 50.0% 50.0% 28.6% Term
BUSACC ACC 225 V1 Integrated Accounting on Computers 3.00 1.2 6 50.0% 50.0% 50.0% 50.0% 50.0% Term
ALHALH ALH 112 V8 Pathophysiology and Terminology 3.00 1.2 19 94.7% 94.7% 78.9% 73.7% 42.1% Term
SSCIANT ANT 111 V8 Anthropology 3.00 1.1 20 85.0% 80.0% 75.0% 55.0% 35.0% FT
SSCIANT ANT 111 V9 Anthropology 3.00 1.1 11 72.7% 54.5% 54.5% 27.3% 18.2% FT
SSCIANT ANT 202 V8 America's Diverse Cultures 3.00 1.1 14 64.3% 50.0% 42.9% 35.7% 21.4% FT
HUMART ART 111 V1 Art Appreciation 3.00 1.1 25 92.0% 84.0% 84.0% 76.0% 48.0% FT
HUMART ART 111 V2 Art Appreciation 3.00 1.1 26 92.3% 88.5% 84.6% 80.8% 80.8% Term
HUMART ART 111 V3 Art Appreciation 3.00 1.1 24 83.3% 83.3% 75.0% 75.0% 75.0% Term
LSCIBIO BIO 100 V1 Biology for Non-Science Majors 4.00 1.1 16 62.5% 62.5% 50.0% 25.0% 0.0% FT
LSCIBIO BIO 105 V1 Human Biology 4.00 1.1 13 69.2% 69.2% 61.5% 61.5% 38.5% FT
LSCIBIO BIO 206 V1 Human Anatomy & Physiology II 4.00 1.1 22 90.9% 90.9% 86.4% 68.2% 40.9% FT
LSCIBIO BIO 225 V1 Genetics 3.00 1.1 19 57.9% 52.6% 47.4% 31.6% 26.3% FT
BUSBUS BUS 110 V1 Intro to Business 3.00 1.1 23 73.9% 56.5% 39.1% 30.4% 13.0% FT
BUSBUS BUS 110 V2 Intro to Business 3.00 1.1 7 71.4% 57.1% 28.6% 28.6% 0.0% FT
BUSBUS BUS 111 V1 Business Mathematics 3.00 1.2 19 94.7% 84.2% 68.4% 36.8% 31.6% Term
BUSBUS BUS 115 V8 Basic Keyboarding 1.00 1.2 12 75.0% 66.7% 58.3% 41.7% 41.7% FT
BUSBUS BUS 116 V1 Keyboarding I 3.00 1.2 20 80.0% 75.0% 55.0% 45.0% 35.0% FT
BUSBUS BUS 117 V1 Keyboarding II 3.00 1.2 15 73.3% 73.3% 73.3% 60.0% 40.0% FT
BUSBUS BUS 135 V1 Office Language Skills 3.00 1.2 11 81.8% 72.7% 72.7% 72.7% 18.2% Term
BUSBUS BUS 215 V1 Medical Terminology 3.00 1.2 23 95.7% 82.6% 78.3% 65.2% 17.4% FT
BUSBUS BUS 215 V2 Medical Terminology 3.00 1.2 14 85.7% 78.6% 57.1% 42.9% 28.6% FT
BUSBUS BUS 216 V1 Pathophysiology and Pharmacology 3.00 1.2 2 100.0% 100.0% 100.0% 100.0% 50.0% FT
BUSBUS BUS 222 V1 Legal/Social Environment of Business 3.00 1.1 24 100.0% 100.0% 95.8% 79.2% 70.8% Term
BUSBUS BUS 222 V2 Legal/Social Environment of Business 3.00 1.1 5 80.0% 80.0% 40.0% 40.0% 40.0% Term
BUSBUS BUS 235 V1 Business Correspondence 3.00 1.2 23 91.3% 91.3% 78.3% 69.6% 39.1% FT
BUSBUS BUS 235 V2 Business Correspondence 3.00 1.2 22 86.4% 72.7% 68.2% 45.5% 18.2% FT

Dept/Disc Course Title Cr. Hrs PCS Enr Ret Succ D+ Succ C+ Succ B+ Succ A
Instructor
Status
John A. Logan College - Retention Report (Spring 2016)Hybrid & Online Course Data
BUSBUS BUS 236 V1 Records Management 1.00 1.2 17 100.0% 100.0% 100.0% 94.1% 82.4% FT
BUSBUS BUS 237 V1 Office Procedures 3.00 1.2 7 85.7% 85.7% 85.7% 85.7% 57.1% FT
BUSBUS BUS 261 V1 MRT Transcription 3.00 1.2 15 73.3% 73.3% 73.3% 73.3% 73.3% Term
BUSBUS BUS 270 V1 Medical Office Procedures 3.00 1.2 19 78.9% 57.9% 42.1% 15.8% 5.3% FT & Term
BUSBUS BUS 280 V1 Computer Appl. for the Med. Office 3.00 1.2 6 83.3% 83.3% 83.3% 83.3% 66.7% Term
BUSCIS CIS 101 V1 Introduction to Computers 3.00 1.2 17 76.5% 58.8% 47.1% 41.2% 29.4% FT
BUSCIS CIS 120 V1 Data Base Management 3.00 1.2 11 63.6% 63.6% 63.6% 54.5% 18.2% Term
BUSCIS CIS 207 V1 Computer Applications for Business 3.00 1.2 15 80.0% 80.0% 73.3% 66.7% 53.3% FT
BUSCIS CIS 207 V2 Computer Applications for Business 3.00 1.2 16 81.3% 81.3% 75.0% 50.0% 25.0% FT
BUSCIS CIS 207 V3 Computer Applications for Business 3.00 1.2 14 64.3% 57.1% 57.1% 50.0% 21.4% Term
BUSCIS CIS 210 V1 Presentation Graphics 2.00 1.2 8 75.0% 75.0% 75.0% 37.5% 25.0% FT
BUSCIS CIS 220 V1 Advanced Spreadsheet Design 3.00 1.2 7 85.7% 85.7% 85.7% 85.7% 57.1% FT
ALHCRJ CRJ 103 V1 Introduction to Criminal Justice 3.00 1.2 18 83.3% 83.3% 83.3% 61.1% 33.3% FT
ALHCRJ CRJ 105 V1 Criminal Behavior 3.00 1.2 21 66.7% 66.7% 66.7% 61.9% 61.9% FT
ALHCRJ CRJ 203 V1 Introduction to Security 3.00 1.2 16 68.8% 68.8% 68.8% 68.8% 25.0% FT
ALHCRJ CRJ 205 V1 Survey of Crime Detection Methods 3.00 1.2 16 68.8% 68.8% 68.8% 50.0% 50.0% Term
ALHCRJ CRJ 219 V1 Criminal Procedure 3.00 1.2 21 85.7% 85.7% 81.0% 66.7% 47.6% Term
ALHCRJ CRJ 220 V1 Prob,Parole & Comm. Based Correction 3.00 1.2 14 78.6% 78.6% 78.6% 71.4% 71.4% FT
ALHCRJ CRJ 221 V1 Police Administration 3.00 1.2 21 95.2% 95.2% 95.2% 90.5% 81.0% FT
ALHDMS DMS 200 V1 Medical Physics and Instrumentation 5.00 1.2 14 100.0% 64.3% 64.3% 7.1% 7.1% FT
ALHDNA DNA 109 V1 Dental Office Procedures 2.00 1.2 19 100.0% 100.0% 100.0% 100.0% 26.3% FT
ALHECE ECE 266 V1 Pre-School Administration 3.00 1.2 10 100.0% 90.0% 90.0% 50.0% 20.0% FT
ALHECE ECE 272 V1 Language and Literacy Development 3.00 1.1 11 72.7% 72.7% 63.6% 45.5% 18.2% FT
BUSECO ECO 201 V1 Introduction to Macroeconomics 3.00 1.1 25 92.0% 92.0% 92.0% 68.0% 40.0% FT
BUSECO ECO 201 V2 Introduction to Macroeconomics 3.00 1.1 8 100.0% 100.0% 100.0% 75.0% 50.0% FT
BUSECO ECO 202 V1 Introduction to Microeconomics 3.00 1.1 24 91.7% 91.7% 91.7% 70.8% 62.5% FT
BUSECO ECO 202 V2 Introduction to Microeconomics 3.00 1.1 7 85.7% 85.7% 85.7% 57.1% 42.9% FT
SSCIEDC EDC 202 V1 Human Growth, Development & Learning 3.00 1.1 22 77.3% 77.3% 77.3% 68.2% 27.3% FT
ENGLENG ENG 101 V1 English Composition I 3.00 1.1 21 76.2% 76.2% 61.9% 47.6% 19.0% Term

Dept/Disc Course Title Cr. Hrs PCS Enr Ret Succ D+ Succ C+ Succ B+ Succ A
Instructor
Status
John A. Logan College - Retention Report (Spring 2016)Hybrid & Online Course Data
ENGLENG ENG 101 V2 English Composition I 3.00 1.1 23 73.9% 65.2% 60.9% 43.5% 26.1% Term
ENGLENG ENG 101 V3 English Composition I 3.00 1.1 21 85.7% 76.2% 61.9% 47.6% 9.5% Term
ENGLENG ENG 102 V1 English Composition II 3.00 1.1 19 89.5% 89.5% 89.5% 84.2% 78.9% FT
ENGLENG ENG 102 V2 English Composition II 3.00 1.1 22 90.9% 90.9% 86.4% 72.7% 18.2% FT
ENGLENG ENG 102 V3 English Composition II 3.00 1.1 20 80.0% 75.0% 65.0% 45.0% 25.0% FT
ENGLENG ENG 113 V1 Professional Technical Writing 3.00 1.2 15 73.3% 60.0% 60.0% 53.3% 26.7% Term
SSCIGEO GEO 215 V1 Survival of Humans-Environ Studies 3.00 1.1 24 83.3% 75.0% 58.3% 45.8% 41.7% Term
APTEHAC HAC 279 V1 ICE Testing 2.00 1.2 11 100.0% 81.8% 81.8% 72.7% 45.5% FT
SSCIHIS HIS 201 V1 United States History I 3.00 1.1 25 80.0% 80.0% 72.0% 68.0% 32.0% Term
SSCIHIS HIS 201 V8 United States History I 3.00 1.1 16 81.3% 81.3% 81.3% 62.5% 50.0% FT
SSCIHIS HIS 201 V9 United States History I 3.00 1.1 12 75.0% 75.0% 75.0% 33.3% 25.0% FT
SSCIHIS HIS 202 V1 United States History II 3.00 1.1 25 76.0% 76.0% 72.0% 60.0% 52.0% Term
LSCIHTH HTH 110 V1 Health Education 2.00 1.1 25 88.0% 88.0% 80.0% 72.0% 44.0% Term
LSCIHTH HTH 110 V2 Health Education 2.00 1.1 9 77.8% 77.8% 77.8% 66.7% 44.4% Term
LSCIHTH HTH 120 V1 Human Sexuality 3.00 1.1 22 86.4% 86.4% 77.3% 72.7% 45.5% Term
LSCIHTH HTH 250 V1 Wellness for Women 3.00 1.1 22 100.0% 100.0% 90.9% 54.5% 36.4% Term
HUMHUM HUM 152 V1 Death and Dying 3.00 1.1 21 81.0% 76.2% 76.2% 71.4% 66.7% Term
ENGLLIT LIT 275 V1 The Art of the Cinema 3.00 1.1 24 95.8% 87.5% 83.3% 70.8% 45.8% FT
ENGLLIT LIT 280 V1 Introduction to Literature 3.00 1.1 22 100.0% 90.9% 86.4% 72.7% 40.9% FT
ENGLLIT LIT 280 V8 Introduction to Literature 3.00 1.1 23 69.6% 69.6% 52.2% 47.8% 34.8% FT
ENGLLIT LIT 284 V1 Ethnic Literature in America 3.00 1.1 21 85.7% 85.7% 85.7% 76.2% 66.7% FT
MATMAT MAT 104 V1 Mathematics for Allied Health 3.00 1.2 18 94.4% 77.8% 66.7% 50.0% 22.2% FT
BUSMGT MGT 112 V1 Principles of Management 3.00 1.2 22 86.4% 86.4% 86.4% 77.3% 54.5% FT
BUSMGT MGT 112 V2 Principles of Management 3.00 1.2 24 83.3% 83.3% 75.0% 58.3% 41.7% FT
HUMMUS MUS 105 V1 Music Appreciation 3.00 1.1 22 81.8% 77.3% 72.7% 59.1% 36.4% FT
HUMMUS MUS 105 V2 Music Appreciation 3.00 1.1 25 88.0% 84.0% 68.0% 56.0% 36.0% FT
HUMMUS MUS 105 V3 Music Appreciation 3.00 1.1 24 79.2% 70.8% 70.8% 50.0% 37.5% Term
HUMMUS MUS 105 V8 Music Appreciation 3.00 1.1 22 86.4% 86.4% 86.4% 68.2% 40.9% Term
HUMMUS MUS 105 V9 Music Appreciation 3.00 1.1 10 70.0% 70.0% 60.0% 60.0% 30.0% Term

Dept/Disc Course Title Cr. Hrs PCS Enr Ret Succ D+ Succ C+ Succ B+ Succ A
Instructor
Status
John A. Logan College - Retention Report (Spring 2016)Hybrid & Online Course Data
ALHOTA OTA 250 V1 Occupational Therapy Administration 3.00 1.2 6 100.0% 100.0% 100.0% 100.0% 83.3% FT
HUMPHL PHL 111 V1 Ethics & Moral Problems 3.00 1.1 23 91.3% 87.0% 87.0% 87.0% 73.9% Term
HUMPHL PHL 111 V2 Ethics & Moral Problems 3.00 1.1 22 72.7% 63.6% 63.6% 54.5% 31.8% Term
HUMPHL PHL 111 V3 Ethics & Moral Problems 3.00 1.1 20 75.0% 75.0% 70.0% 60.0% 45.0% Term
PHSIPHS PHS 101 V8 Environmental Science 3.00 1.1 18 88.9% 88.9% 83.3% 72.2% 33.3% FT
PHSIPHS PHS 102 V1 Astronomy 3.00 1.1 21 76.2% 66.7% 66.7% 57.1% 19.0% FT
PHSIPHS PHS 103 V1 Earth Science 3.00 1.1 22 72.7% 72.7% 68.2% 59.1% 27.3% FT
PHSIPHS PHS 105 V1 Physics for Non-Science Majors 3.00 1.1 19 57.9% 52.6% 47.4% 47.4% 47.4% FT
PHSIPHS PHS 111 V8 Environmental Science II 3.00 1.1 19 89.5% 78.9% 78.9% 68.4% 57.9% Term
ALHPNE PNE 100 V1 Nutrition 3.00 1.1 32 96.9% 96.9% 96.9% 71.9% 56.3% Term
ALHPNE PNE 100 V2 Nutrition 3.00 1.1 33 90.9% 90.9% 90.9% 78.8% 45.5% Term
ALHPNE PNE 100 V3 Nutrition 3.00 1.1 30 93.3% 86.7% 80.0% 66.7% 63.3% Term
SSCIPSC PSC 131 V1 American Government 3.00 1.1 21 81.0% 81.0% 81.0% 71.4% 52.4% FT
SSCIPSC PSC 131 V2 American Government 3.00 1.1 18 72.2% 72.2% 72.2% 66.7% 50.0% FT
SSCIPSC PSC 220 V1 The Law and Society 3.00 1.1 10 80.0% 70.0% 70.0% 70.0% 60.0% FT
SSCIPSY PSY 132 V1 General Psychology 3.00 1.1 25 92.0% 76.0% 68.0% 64.0% 40.0% FT
SSCIPSY PSY 132 V2 General Psychology 3.00 1.1 21 76.2% 66.7% 57.1% 28.6% 14.3% FT
SSCIPSY PSY 132 V8 General Psychology 3.00 1.1 21 71.4% 57.1% 52.4% 33.3% 9.5% FT
SSCIPSY PSY 262 V1 Child Psychology 3.00 1.1 26 80.8% 76.9% 69.2% 46.2% 30.8% FT
SSCISOC SOC 133 V1 Principles of Sociology 3.00 1.1 24 83.3% 83.3% 83.3% 70.8% 45.8% FT
SSCISOC SOC 133 V8 Principles of Sociology 3.00 1.1 23 91.3% 91.3% 82.6% 65.2% 34.8% FT
SSCISOC SOC 215 V1 Diversity in American Life 3.00 1.1 26 61.5% 61.5% 50.0% 34.6% 15.4% FT
SSCISOC SOC 263 V1 Marriage & the Family 3.00 1.1 24 87.5% 87.5% 87.5% 75.0% 45.8% FT
HUMSPE SPE 116 V1 Interpersonal Communication 3.00 1.1 20 75.0% 75.0% 60.0% 60.0% 35.0% FT
HUMSPE SPE 116 V2 Interpersonal Communication 3.00 1.1 16 68.8% 62.5% 56.3% 50.0% 25.0% FT
HUMSPN SPN 101 V1 Elementary Spanish I 4.00 1.1 19 57.9% 52.6% 31.6% 15.8% 15.8% FT
HUMSPN SPN 102 V1 Elementary Spanish II 4.00 1.1 8 75.0% 75.0% 75.0% 50.0% 25.0% FT
HUMSPN SPN 202 V1 Intermediate Spanish II 4.00 1.1 4 75.0% 75.0% 50.0% 50.0% 50.0% FT
Online Course Totals 2,049 82.4% 78.2% 72.7% 59.9% 39.6%

JOHN A. LOGAN COLLEGE
Retention Report –
by Extension Center

Course Title Cr. Hrs PCS Enr Ret Succ D+ Succ C+ Succ B+ Succ ADu Quoin
ART 111 9N Art Appreciation 3.00 1.1 19 89.5% 89.5% 89.5% 84.2% 31.6%ART 111 9R Art Appreciation 3.00 1.1 19 100.0% 94.7% 78.9% 52.6% 26.3%ENG 101 9N English Composition I 3.00 1.1 4 100.0% 100.0% 100.0% 75.0% 50.0%ENG 102 9N English Composition II 3.00 1.1 3 100.0% 100.0% 100.0% 100.0% 100.0%ENG 102 9P English Composition II 3.00 1.1 4 75.0% 75.0% 75.0% 75.0% 75.0%GEO 215 9N Survival of Humans‐Environ Studies 3.00 1.1 6 83.3% 66.7% 66.7% 50.0% 50.0%HUM 152 9N Death and Dying 3.00 1.1 8 62.5% 62.5% 50.0% 37.5% 37.5%MAT 052 9N Basic Algebra 4.00 1.4 7 57.1% 57.1% 57.1% 42.9% 28.6%MAT 113 9N Contemporary Math 3.00 1.1 10 80.0% 80.0% 80.0% 60.0% 20.0%PNE 100 9N Nutrition 3.00 1.1 8 50.0% 50.0% 25.0% 0.0% 0.0%PNE 171 9N Pharmacology in Nursing II 2.00 1.2 33 100.0% 87.9% 87.9% 84.8% 15.2%PNE 183 9N Maternal and Newborn Health 2.00 1.2 27 100.0% 92.6% 92.6% 92.6% 18.5%PNE 193 9N Pediatric Nursing 2.00 1.2 28 100.0% 96.4% 96.4% 96.4% 3.6%PNE 204 9N Adult Nursing I 2.00 1.2 27 100.0% 100.0% 100.0% 81.5% 0.0%PSC 131 9N American Government 3.00 1.1 2 100.0% 100.0% 50.0% 50.0% 0.0%PSY 132 9N General Psychology 3.00 1.1 6 83.3% 66.7% 66.7% 50.0% 33.3%PSY 262 9N Child Psychology 3.00 1.1 9 77.8% 77.8% 77.8% 77.8% 66.7%SPE 115 9N Speech 3.00 1.1 14 100.0% 100.0% 100.0% 85.7% 42.9%SPE 115 9R Speech 3.00 1.1 14 92.9% 92.9% 92.9% 78.6% 57.1%SPN 102 9N Elementary Spanish II 4.00 1.1 13 84.6% 84.6% 84.6% 53.8% 30.8%
Du Quoin Totals 261 91.6% 87.7% 85.1% 73.9% 25.3%
John A. Logan College ‐ Retention Report (Spring 2016)by Extension Center

Course Title Cr. Hrs PCS Enr Ret Succ D+ Succ C+ Succ B+ Succ A
John A. Logan College ‐ Retention Report (Spring 2016)by Extension Center
West Frankfort
ART 111 9A Art Appreciation 3.00 1.1 3 100.0% 100.0% 100.0% 100.0% 66.7%GEO 112 9A Regional Geography 3.00 1.1 5 100.0% 100.0% 100.0% 100.0% 100.0%HIS 101 9A Western Civilization I 3.00 1.1 8 75.0% 62.5% 62.5% 50.0% 12.5%HIS 201 9A United States History I 3.00 1.1 5 60.0% 60.0% 60.0% 60.0% 60.0%HTH 110 9A Health Education 2.00 1.1 16 93.8% 93.8% 93.8% 81.3% 62.5%LIT 281 9A Introduction to Mythology 3.00 1.1 3 100.0% 100.0% 100.0% 100.0% 100.0%MAT 051 9A Pre‐Algebra 4.00 1.4 6 66.7% 66.7% 50.0% 33.3% 0.0%MDA 130 9A Pharmacology 3.00 1.2 8 100.0% 100.0% 100.0% 100.0% 62.5%MDA 132 9A Medical Clinic Procedures 4.00 1.2 8 100.0% 100.0% 100.0% 75.0% 37.5%MDA 133 9A Medical Office Laboratory Procedures 2.00 1.2 8 100.0% 100.0% 100.0% 75.0% 12.5%MDA 134 9A Externship 3.00 1.2 8 100.0% 100.0% 100.0% 100.0% 100.0%PHL 111 9A Ethics & Moral Problems 3.00 1.1 6 100.0% 100.0% 100.0% 100.0% 83.3%PHS 103 9A Earth Science 3.00 1.1 22 95.5% 95.5% 95.5% 90.9% 36.4%PNE 100 9A Nutrition 3.00 1.1 3 100.0% 100.0% 100.0% 100.0% 66.7%PSY 132 9A General Psychology 3.00 1.1 5 80.0% 80.0% 60.0% 20.0% 20.0%PSY 132 9B General Psychology 3.00 1.1 26 100.0% 96.2% 96.2% 80.8% 23.1%PSY 262 9A Child Psychology 3.00 1.1 2 100.0% 100.0% 100.0% 100.0% 100.0%SOC 263 9A Marriage and the Family 3.00 1.1 8 100.0% 100.0% 100.0% 100.0% 62.5%SPE 115 9A Speech 3.00 1.1 25 96.0% 96.0% 96.0% 88.0% 68.0%
West Frankfort Totals 175 94.3% 93.1% 92.0% 82.3% 49.7%

JOHN A. LOGAN COLLEGE
Retention Report –
by Gateway Course

Course Title Cr Hrs PCSTotal # Sects
# Sections by FT
% Sections
by FT Enrl Avg Enrl Ret Succ D+ Succ C+ Succ B+ Succ AART 111 Art Appreciation 3.00 1.1 14 4 28.6% 273 19.5 88.3% 82.8% 79.9% 72.2% 50.5%BIO 100 Biology for Non‐Science Majors 3.00 1.1 8 6.5 81.3% 143 17.9 85.3% 80.4% 72.7% 53.8% 30.8%BIO 101 Biological Science for Sci Majors I 4.00 1.1 4 2.5 62.5% 53 13.3 94.3% 86.8% 79.2% 49.1% 26.4%ENG 101 English Composition I 3.00 1.1 19 4 21.1% 279 14.7 78.1% 73.5% 67.0% 50.9% 29.0%ENG 113 Professional Technical Writing 3.00 1.2 4 0 0.0% 57 14.3 86.0% 73.7% 70.2% 54.4% 21.1%MAT 108 College Algebra 3.00 1.1 4 4 100.0% 98 24.5 69.4% 65.3% 53.1% 26.5% 8.2%MAT 113 Intro to Contemporary Mathematics 3.00 1.1 11 7 63.6% 169 15.4 75.1% 66.9% 55.6% 29.0% 10.7%MAT 120 Elementary Statistics 3.00 1.1 9 5 55.6% 148 16.4 77.7% 71.6% 62.8% 45.9% 16.2%MUS 105 Music Appreciation 3.00 1.1 9 2 22.2% 201 22.3 83.1% 76.6% 70.6% 56.2% 38.3%PSY 132 General Psychology 3.00 1.1 20 13 65.0% 378 18.9 79.4% 73.3% 64.0% 44.2% 18.3%SPE 115 Speech 3.00 1.1 23 1 4.3% 373 16.2 83.1% 81.8% 76.9% 68.1% 43.2%
Gateway Course Totals 125 49 39.2% 2,172 17.4 81.4% 76.1% 69.1% 52.9% 29.7%
John A. Logan College ‐ Retention Report (Spring 2016)by Gateway Course

JOHN A. LOGAN COLLEGE
Retention Report –
by Developmental Course

Cr Hrs PCS
Total #
Sects
# Sections by FT
% Sections by FT Enrl Avg Enrl Ret Succ D+ Succ C+ Succ B+ Succ A
English (ENG)ENG 050 Basic Reading & Writing 5.00 1.4 1 1 100.0% 5 5.0 60.0% 60.0% 60.0% 20.0% 0.0%ENG 052 Developmental Writing Skills 5.00 1.4 3 3 100.0% 28 9.3 67.9% 60.7% 57.1% 21.4% 7.1%ENG 053 Developmental Reading Skills 3.00 1.4 1 0 0.0% 9 9.0 77.8% 77.8% 66.7% 55.6% 22.2%
English Department Total 5 4 80.0% 42 8.4 69.0% 64.3% 59.5% 28.6% 9.5%
Cr Hrs PCS
Total #
Sects
# Sections by FT
% Sections by FT Enrl Avg Enrl Ret Succ D+ Succ C+ Succ B+ Succ A
Math (MAT)MAT 051 Pre‐Algebra 4.00 1.4 6 0 0.0% 59 9.8 59.3% 54.2% 47.5% 37.3% 20.3%MAT 052 Basic Algebra 4.00 1.4 8 2 25.0% 141 17.6 63.8% 54.6% 42.6% 30.5% 11.3%MAT 061 Basic Euclidean Geometry 3.00 1.4 1 0 0.0% 9 9.0 100.0% 77.8% 77.8% 22.2% 22.2%MAT 062 Intermediate Algebra 5.00 1.4 5 4 80.0% 106 21.2 68.9% 57.5% 50.0% 31.1% 12.3%
Math Department Total 20 6 30.0% 315 15.8 65.7% 56.2% 47.0% 31.7% 13.7%
Developmental Course Totals 25 10 40.0% 357 14.3 66.1% 57.1% 48.5% 31.4% 13.2%
English Department
Math Department
John A. Logan College ‐ Retention Report (Spring 2016)by Developmental Course

JOHN A. LOGAN COLLEGE
Retention Report –
by Dual Credit Sections
at Area High Schools

Course Title Cr Hrs PCS Enrl Ret Succ D+ Succ C+ Succ B+ Succ A
Instructor(s)
FT or Term
ENG 113 CD Professional Technical Writing 3.00 1.2 15 100.0% 100.0% 93.3% 73.3% 33.3% Term
GER 102 CD Elementary German 4.00 1.1 21 100.0% 100.0% 90.5% 71.4% 61.9% Term
GER 201 CD Intermediate German 4.00 1.1 11 100.0% 100.0% 100.0% 100.0% 100.0% Term
PHS 111 CD Environmental Science II 3.00 1.1 18 100.0% 100.0% 100.0% 100.0% 100.0% FT & Term
PSY 110 CD College Success and Career Planning 3.00 1.1 10 100.0% 100.0% 100.0% 90.0% 50.0% Term
SPN 102 CD Elementary Spanish II 4.00 1.1 47 100.0% 100.0% 100.0% 100.0% 83.0% Term
SPN 201 CD Intermediate Spanish I 4.00 1.1 18 100.0% 100.0% 94.4% 94.4% 83.3% Term
SPN 202 CD Intermediate Spanish II 4.00 1.1 18 100.0% 94.4% 94.4% 88.9% 33.3% Term
Carbondale H.S. Totals 158 100.0% 99.4% 96.8% 91.1% 70.9%
GER 102 CC Elementary German 4.00 1.1 11 100.0% 100.0% 100.0% 100.0% 100.0% Term
NAD 101 CC Nursing Assistant Training 7.00 1.2 6 83.3% 66.7% 66.7% 66.7% 50.0% Term
Carbondale/Carterville H.S. Totals 17 94.1% 88.2% 88.2% 88.2% 82.4%
ACC 100 CF Business Accounting 3.00 1.2 2 100.0% 100.0% 100.0% 100.0% 50.0% Term
SOC 263 CF Marriage & the Family 3.00 1.1 4 100.0% 100.0% 100.0% 100.0% 100.0% Term
Christian Fellowship Totals 6 100.0% 100.0% 100.0% 100.0% 83.3%
ACC 100 CO Business Accounting 3.00 1.2 7 100.0% 100.0% 100.0% 85.7% 42.9% Term
BUS 116 CO Keyboarding I 3.00 1.2 14 100.0% 100.0% 100.0% 100.0% 100.0% Term
BUS 215 CO Medical Terminology 3.00 1.2 5 100.0% 100.0% 100.0% 60.0% 60.0% Term
MAT 111 CO Pre-Calculus 5.00 1.1 8 100.0% 100.0% 100.0% 75.0% 62.5% Term
MAT 113 CO Intro to Contemporary Mathematics 3.00 1.1 11 100.0% 90.9% 63.6% 36.4% 18.2% Term
PSY 110 CO College Success and Career Planning 3.00 1.1 9 100.0% 100.0% 77.8% 44.4% 0.0% Term
Crab Orchard H.S. Totals 54 100.0% 98.1% 88.9% 68.5% 50.0%
John A. Logan College - Retention Report (Spring 2016)by Dual Credit Sections at Area High Schools

Course Title Cr Hrs PCS Enrl Ret Succ D+ Succ C+ Succ B+ Succ A
Instructor(s)
FT or Term
John A. Logan College - Retention Report (Spring 2016)by Dual Credit Sections at Area High Schools
ENG 102 DQ English Composition II 3.00 1.1 25 100.0% 100.0% 100.0% 96.0% 56.0% Term
NAD 101 DQ Nursing Assistant Training 7.00 1.2 5 100.0% 100.0% 100.0% 80.0% 0.0% Term
SPN 102 DQ Elementary Spanish II 4.00 1.1 12 100.0% 100.0% 100.0% 83.3% 66.7% Term
SPN 201 DQ Intermediate Spanish I 4.00 1.1 11 100.0% 100.0% 100.0% 100.0% 90.9% Term
SPN 202 DQ Intermediate Spanish II 4.00 1.1 11 100.0% 100.0% 100.0% 100.0% 72.7% Term
Du Quoin H.S. Totals 64 100.0% 100.0% 100.0% 93.8% 62.5%
ACC 100 EV Business Accounting 3.00 1.2 10 100.0% 90.0% 90.0% 90.0% 70.0% Term
CIS 101 EV Introduction to Computers 3.00 1.2 18 100.0% 100.0% 100.0% 94.4% 72.2% Term
MAT 120 EV Elementary Statistics 3.00 1.1 7 100.0% 100.0% 100.0% 57.1% 14.3% Term
PSY 110 EV College Success and Career Planning 3.00 1.1 15 100.0% 93.3% 73.3% 40.0% 20.0% Term
Elverado H.S. Totals 50 100.0% 96.0% 90.0% 72.0% 48.0%
ENG 102 FF English Composition II 3.00 1.1 32 100.0% 100.0% 100.0% 100.0% 96.9% Term
HIS 202 FF United States History II 3.00 1.1 24 100.0% 100.0% 100.0% 62.5% 29.2% FT & Term
NAD 101 FF Nursing Assistant Training 7.00 1.2 11 100.0% 100.0% 100.0% 45.5% 9.1% Term
PED 126 FF Beginning Weight Training 1.00 1.1 84 100.0% 98.8% 98.8% 98.8% 92.9% Term
SPN 102 FF Elementary Spanish II 4.00 1.1 5 100.0% 100.0% 100.0% 80.0% 40.0% Term
SPN 201 FF Intermediate Spanish I 4.00 1.1 5 100.0% 100.0% 100.0% 60.0% 20.0% Term
Frankfort H.S. Totals 161 100.0% 99.4% 99.4% 88.2% 74.5%

Course Title Cr Hrs PCS Enrl Ret Succ D+ Succ C+ Succ B+ Succ A
Instructor(s)
FT or Term
John A. Logan College - Retention Report (Spring 2016)by Dual Credit Sections at Area High Schools
DRT 181 HE Technical Drafting I 4.00 1.2 19 100.0% 94.7% 94.7% 94.7% 89.5% Term
DRT 185 HE Computer Graphics I 2.00 1.2 19 100.0% 89.5% 89.5% 89.5% 89.5% Term
ECE 155 HE The Early Childhood Profession 3.00 1.2 22 100.0% 100.0% 100.0% 95.5% 77.3% Term
ECE 160 HE Child, Growth and Development 4.00 1.2 8 100.0% 100.0% 100.0% 100.0% 62.5% Term
ENG 102 HE English Composition II 3.00 1.1 20 100.0% 100.0% 100.0% 95.0% 60.0% Term
FRE 102 HE Elementary French II 4.00 1.1 11 100.0% 100.0% 100.0% 90.9% 81.8% Term
FRE 201 HE Intermediate French I 4.00 1.1 6 100.0% 100.0% 100.0% 100.0% 83.3% Term
WEL 150 HE Oxy-Acetylene Fusion Welding I 1.00 1.2 4 100.0% 100.0% 100.0% 100.0% 25.0% Term
WEL 154 HE Arc Welding I 2.00 1.2 3 100.0% 100.0% 100.0% 100.0% 100.0% Term
Herrin H.S. Totals 112 100.0% 97.3% 97.3% 94.6% 76.8%
BIO 101 JC Biological Science for Sci Majors I 4.00 1.1 12 120.0% 120.0% 120.0% 110.0% 70.0% Term
BUS 116 JC Keyboarding I 3.00 1.2 10 32.3% 22.6% 22.6% 22.6% 19.4% Term
BUS 215 JC Medical Terminology 3.00 1.2 31 100.0% 100.0% 93.5% 87.1% 67.7% Term
ENG 102 JC English Composition II 3.00 1.1 48 100.0% 100.0% 95.8% 56.3% 16.7% Term
NAD 101 JC Nursing Assistant Training 7.00 1.2 8 100.0% 100.0% 100.0% 100.0% 100.0% Term
PSY 132 JC General Psychology 3.00 1.1 13 100.0% 100.0% 100.0% 84.6% 38.5% Term
Johnston City H.S. Totals 122 100.0% 97.5% 94.3% 74.6% 45.1%

Course Title Cr Hrs PCS Enrl Ret Succ D+ Succ C+ Succ B+ Succ A
Instructor(s)
FT or Term
John A. Logan College - Retention Report (Spring 2016)by Dual Credit Sections at Area High Schools
ACC 100 MA Business Accounting 3.00 1.2 17 100.0% 100.0% 82.4% 76.5% 58.8% Term
ACC 200 MA Financial Accounting I 3.00 1.1 21 100.0% 100.0% 100.0% 90.5% 81.0% Term
AST 281 MA Suspension and Steering 4.00 1.2 16 100.0% 100.0% 100.0% 100.0% 81.3% Term
BIO 105 MA Human Biology 4.00 1.1 25 100.0% 100.0% 96.0% 76.0% 32.0% Term
BUS 215 MA Medical Terminology 3.00 1.2 25 100.0% 96.0% 76.0% 60.0% 8.0% Term
CIS 101 MA Introduction to Computers 3.00 1.2 10 100.0% 100.0% 70.0% 70.0% 50.0% Term
ECE 155 MA The Early Childhood Profession 3.00 1.2 26 100.0% 100.0% 100.0% 100.0% 100.0% Term
ENG 102 MA English Composition II 3.00 1.1 43 100.0% 100.0% 100.0% 81.4% 27.9% Term
NAD 101 MA Nursing Assistant Training 7.00 1.2 14 100.0% 100.0% 100.0% 100.0% 85.7% Term
PSY 110 MA College Success and Career Planning 3.00 1.1 32 100.0% 100.0% 93.8% 78.1% 43.8% Term
SPN 102 MA Elementary Spanish II 4.00 1.1 51 100.0% 98.0% 98.0% 84.3% 58.8% Term
SPN 201 MA Intermediate Spanish I 4.00 1.1 23 100.0% 100.0% 95.7% 87.0% 52.2% Term
Marion H.S. Totals 303 100.0% 99.3% 94.4% 83.2% 53.1%
NAD 101 MB Nursing Assistant Training 7.00 1.2 7 100.0% 100.0% 100.0% 85.7% 71.4% Term
Murphysboro H.S. Totals 7 100.0% 100.0% 100.0% 85.7% 71.4%
MAT 120 TC Elementary Statistics 3.00 1.1 5 100.0% 100.0% 100.0% 80.0% 40.0% Term
SPE 115 TC Speech 3.00 1.1 5 100.0% 100.0% 100.0% 100.0% 60.0% Term
Trinity Christian Totals 10 100.0% 100.0% 100.0% 90.0% 50.0%
1,064 99.9% 98.6% 95.7% 85.0% 61.5%Area High School Grand Totals

JOHN A. LOGAN COLLEGE
Retention Report –
Top 30 Courses by Enrollment

Rank Course Title Cr Hrs PCS
Total #
Sects
# Sections
by FT
% Sections
by FT Enrl Avg Enrl Ret Succ D+ Succ C+ Succ B+ Succ A
1 ENG 102 English Composition II 3.00 1.1 27 9 33.3% 474 17.6 89.9% 88.2% 85.0% 72.6% 40.7%
2 PSY 132 General Psychology 3.00 1.1 20 13 65.0% 378 18.9 79.4% 73.3% 64.0% 44.2% 18.3%
3 SPE 115 Speech 3.00 1.1 23 1 4.3% 373 16.2 83.1% 81.8% 76.9% 68.1% 43.2%
4 ENG 101 English Composition I 3.00 1.1 19 4 21.1% 279 14.7 78.1% 73.5% 67.0% 50.9% 29.0%
5 ART 111 Art Appreciation 3.00 1.1 14 4 28.6% 273 19.5 88.3% 82.8% 79.9% 72.2% 50.5%
6 MUS 105 Music Appreciation 3.00 1.1 9 2 22.2% 201 22.3 83.1% 76.6% 70.6% 56.2% 38.3%
7 PHL 111 Ethics & Moral Problems 3.00 1.1 9 0 0.0% 200 22.2 84.5% 81.0% 77.5% 66.0% 51.0%
8 SPN 102 Elementary Spanish II 4.00 1.1 10 4 40.0% 182 18.2 96.2% 95.1% 89.6% 74.7% 54.4%
9 MAT 113 Intro to Contemporary Mathematics 3.00 1.1 11 7 63.6% 169 15.4 75.1% 66.9% 55.6% 29.0% 10.7%
10 PED 126 Beginning Weight Training 1.00 1.1 9 0 0.0% 160 17.8 90.6% 89.4% 87.5% 86.9% 81.9%
11 SOC 133 Principles of Sociology 3.00 1.1 8 8 100.0% 160 20.0 83.8% 74.4% 69.4% 56.9% 41.9%
12 BIO 206 Human Anatomy & Physiology II 4.00 1.1 7 3 42.9% 150 21.4 92.7% 92.0% 84.7% 58.7% 34.0%
13 PNE 100 Nutrition 3.00 1.1 7 0 0.0% 148 21.1 85.8% 83.1% 77.7% 62.2% 45.3%
14 MAT 120 Elementary Statistics 3.00 1.1 9 5 55.6% 148 16.4 77.7% 71.6% 62.8% 45.9% 16.2%
15 BIO 100 Biology for Non-Science Majors 4.00 1.1 8 6.5 81.3% 143 17.9 85.3% 80.4% 72.7% 53.8% 30.8%
16 MAT 052 Basic Algebra 4.00 1.4 8 2 25.0% 141 17.6 63.8% 54.6% 42.6% 30.5% 11.3%
17 HTH 110 Health Education 2.00 1.1 11 7 63.6% 140 12.7 83.6% 82.9% 81.4% 77.1% 63.6%
18 BIO 226 General Microbiology 4.00 1.1 6 5 83.3% 134 22.3 85.8% 84.3% 78.4% 50.0% 12.7%
19 PSC 131 American Government 3.00 1.1 9 6 66.7% 133 14.8 82.7% 79.7% 76.7% 67.7% 45.1%
20 BUS 215 Medical Terminology 3.00 1.2 6 3 50.0% 123 20.5 94.3% 90.2% 80.5% 66.7% 35.0%
21 HIS 201 United States History I 3.00 1.1 7 5 71.4% 123 17.6 82.9% 82.1% 77.2% 64.2% 45.5%
22 BIO 205 Human Anatomy & Physiology I 4.00 1.1 7 4 57.1% 122 17.4 82.0% 76.2% 64.8% 42.6% 22.1%
23 HIS 202 United States History II 3.00 1.1 5 3 60.0% 117 23.4 80.3% 76.1% 73.5% 54.7% 33.3%
24 PSY 110 College Success and Career Planning 3.00 1.1 6 0 0.0% 112 18.7 96.4% 93.8% 85.7% 70.5% 41.1%
25 PHS 103 Earth Science 3.00 1.1 5 2 40.0% 110 22.0 83.6% 83.6% 82.7% 70.9% 31.8%
26 CIS 207 Computer Applications for Business 3.00 1.2 7 4 57.1% 107 15.3 77.6% 74.8% 65.4% 49.5% 25.2%
27 MAT 062 Intermediate Algebra 5.00 1.4 5 4 80.0% 106 21.2 68.9% 57.5% 50.0% 31.1% 12.3%
28 NAD 101 Nursing Assistant Training 7.00 1.2 10 1 10.0% 99 9.9 92.9% 90.9% 90.9% 79.8% 44.4%
29 ECO 201 Introduction to Macroeconomics 3.00 1.1 5 2 40.0% 99 19.8 88.9% 83.8% 75.8% 49.5% 27.3%
30 MAT 108 College Algebra 4.00 1.1 4 4 100.0% 98 24.5 69.4% 65.3% 53.1% 26.5% 8.2%
Top 30 Totals 291 118.5 40.7% 5,202 17.9 83.9% 79.9% 74.0% 59.0% 35.9%
John A. Logan College - Retention Report (Spring 2016)Top 30 Courses by Enrollment