john doroski/steven sandikehps.ne.uiuc.edu/rets-remp/pastworkshops/2013/pres 14… · ·...
TRANSCRIPT

John Doroski/Steven Sandike

We need to understand the details well enough to go beyond mere compliance.o Execs needs to hear no-nonsense cost justifications for
exceeding the basics to any degree at all.
o Long Term cost savings is not an easy sell. You will need to be the point person in this endeavor.
o Learn the fine art of convincing managers of the value of negative documentation. Attend ANI rating factor meeting.
It’s good to be aware of ‘gotcha’ issues, especially when it involves $$$$ for improvements or fines. These issues return the best bang for the buck.
We must attack the “not in my term of office” syndrome of short-stay managers, with weapons of economic reality and demonstrable integrity.
Respond to this oft-heard phrase properly.
Know and place into perspective, the current concerns of all stakeholders. Of course, this includes the NRC, ANI, NEI, INPO, and QA, but ALSO: o Neighbors, activists : Politics vs Economicso Media (some with less than pro-nuclear intent)
We are in a position to help management prepare for the financial future, as well as ensure compliance with today’s regulations. We may need to point out the costs of court cases, litigation, negative publicity. These are our tools.
o Who is going to have a better long-term understanding of our mission? A three year exec, or a 30 year environmental professional?
Beyond Regulations/Requirements – Business & Political Decision
Source Terms (routine, outages, unplanned, which are fission products, activation products – all are handy to know to explain changes)
Effluent Sampling Expertise precedes Quantification ! Rad Monitor Response to Changes in the Source Term Treatment Systems (WGDT or process gas, HEPA, charcoal, …)
50.59 Reviews Historical RETS-REMP interfaces with Chinese Atmospheric
bomb tests, Chernobyl, Fukushima, Chemical Spills, etc REMP Background REMP Sampling Issues REMP Data Presentation (annual reports should not just be a data dump)
Conclusion

ODCM NUREG 1301(BWRs)/1302 (PWRs) – More recent than NUREG
0472 and 0473 and we really should follow the latest guidance!
GDC 10CFR20 10CFR50 Appendix I 40CFR190 FSAR (e.g., waste treatment requirements(WGDT holdup times))
State Regulations/Commitments (e.g. State of CT has “immediate” reportability requirements for “Unplanned releases” and monthly for routine releases, town commitment for sewage sampling)
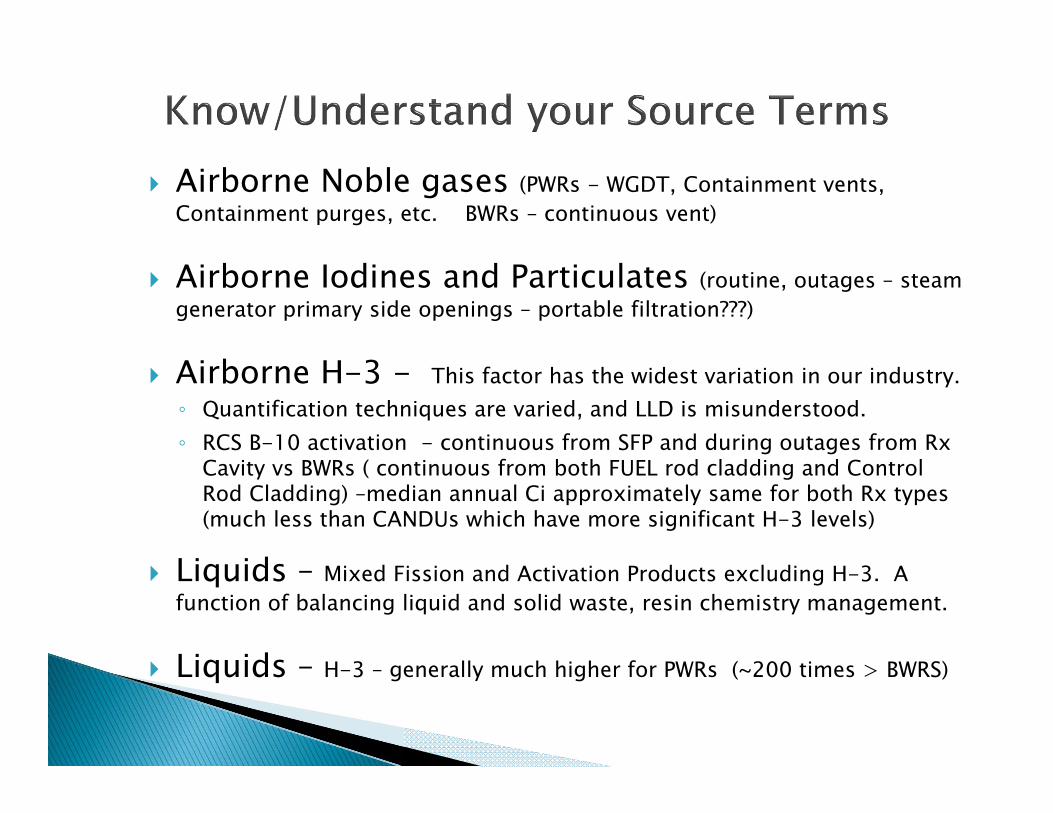
Airborne Noble gases (PWRs - WGDT, Containment vents, Containment purges, etc. BWRs – continuous vent)
Airborne Iodines and Particulates (routine, outages – steam generator primary side openings – portable filtration???)
Airborne H-3 - This factor has the widest variation in our industry.◦ Quantification techniques are varied, and LLD is misunderstood.◦ RCS B-10 activation - continuous from SFP and during outages from Rx
Cavity vs BWRs ( continuous from both FUEL rod cladding and Control Rod Cladding) –median annual Ci approximately same for both Rx types (much less than CANDUs which have more significant H-3 levels)
Liquids – Mixed Fission and Activation Products excluding H-3. A function of balancing liquid and solid waste, resin chemistry management.
Liquids – H-3 – generally much higher for PWRs (~200 times > BWRS)

Tritium Concentration (uCi/ml) Millstone Indian Point
MP2 MP3 IP2 IP3
Reactor Coolant System 1.4 2.6 (max. fuel cycle) 2 2
Spent Fuel Pool 0.02 0.07 0.03 0.06
Refueling Water Storage Tank 0.017 0.28 0.1 0.075
Coolant Waste Monitor Tank 0.02 - 0.6 0.01 to 1 0.01 to 1
Aerated Waste Monitor Tank 0.002 - 0.6 n/a n/a
Waste Test Tanks 0.05 - 0.5 n/a n/a
Boron Test Tanks 1 n/a n/aCondensate Surge Tank LLD 3E-06 U2 on open cycle blowdown 2E-6 2E-6
Releases (Ci/year)
liquid 130 – 600 330 - 1715 range for 2004 - 2010 100-300 100-300
380 925 Average
airborne 6.1 - 30 53 - 78 range for 2004 - 2009 15 15
16 62 Average
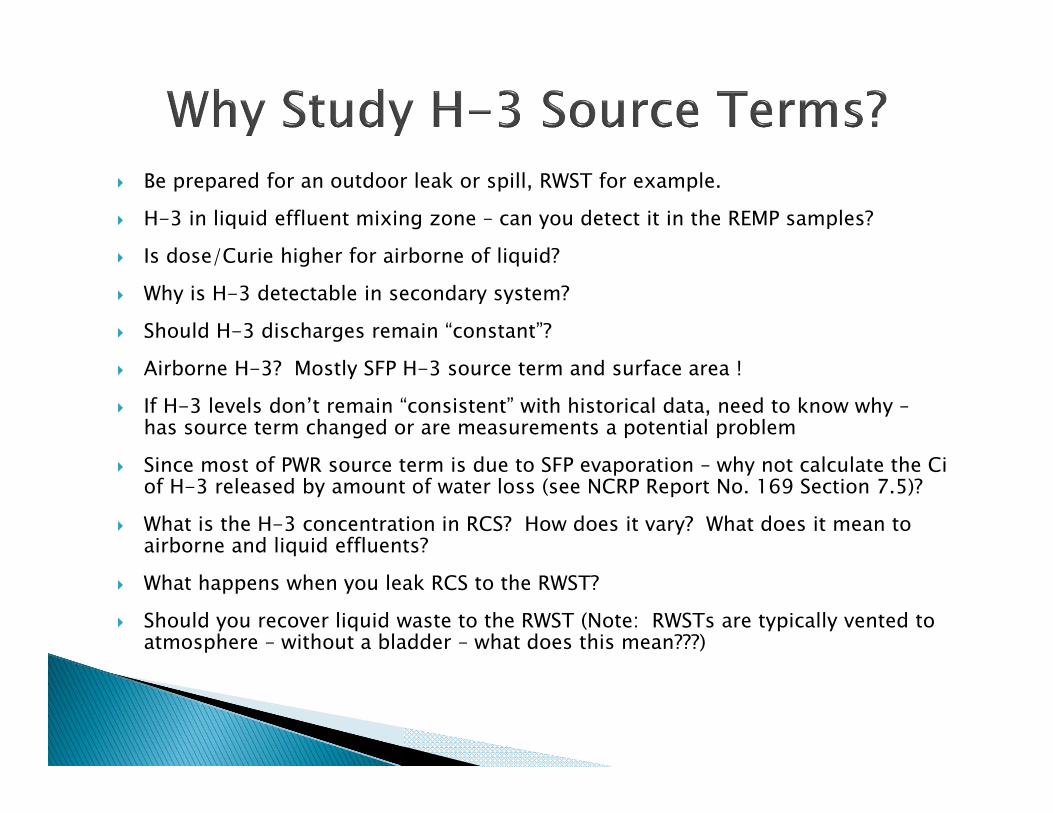
Be prepared for an outdoor leak or spill, RWST for example.
H-3 in liquid effluent mixing zone – can you detect it in the REMP samples?
Is dose/Curie higher for airborne of liquid?
Why is H-3 detectable in secondary system?
Should H-3 discharges remain “constant”?
Airborne H-3? Mostly SFP H-3 source term and surface area !
If H-3 levels don’t remain “consistent” with historical data, need to know why –has source term changed or are measurements a potential problem
Since most of PWR source term is due to SFP evaporation – why not calculate the Ci of H-3 released by amount of water loss (see NCRP Report No. 169 Section 7.5)?
What is the H-3 concentration in RCS? How does it vary? What does it mean to airborne and liquid effluents?
What happens when you leak RCS to the RWST?
Should you recover liquid waste to the RWST (Note: RWSTs are typically vented to atmosphere – without a bladder – what does this mean???)
Airborne Noble Gases – Is frequency adequate? Comparison to Rad Monitor (also, be aware of the NRC Info Notice 82-49 on pressure correction issue)
Iodine & Particulates – Sample line losses (be familiar with the ANSI standards on this topic)
H-3 measuring options, continuous or monthly grab:◦ silica gel – better integrating, but can have sampling/processing issues
(potential loss of H-3), a little more work & frequent checks are needed.
◦ Bubbler / cold trap – potential “non-representative” grab samples. If the sample is downstream of a charcoal cartridge, there is a potential loss to moisture adsorption in charcoal. Not as sensitive as silica gel.
H-3 LLD in NUREG 1301/1302 – The value listed (1E-6 uCi/ml) is inadequate or just a typo! This value appears to be the DISTILLATE water’s LLD, not the LLD of the airborne vent pathway. Also, these NUREGs are OK with monthly grab. This may not be adequate for refueling conditions.
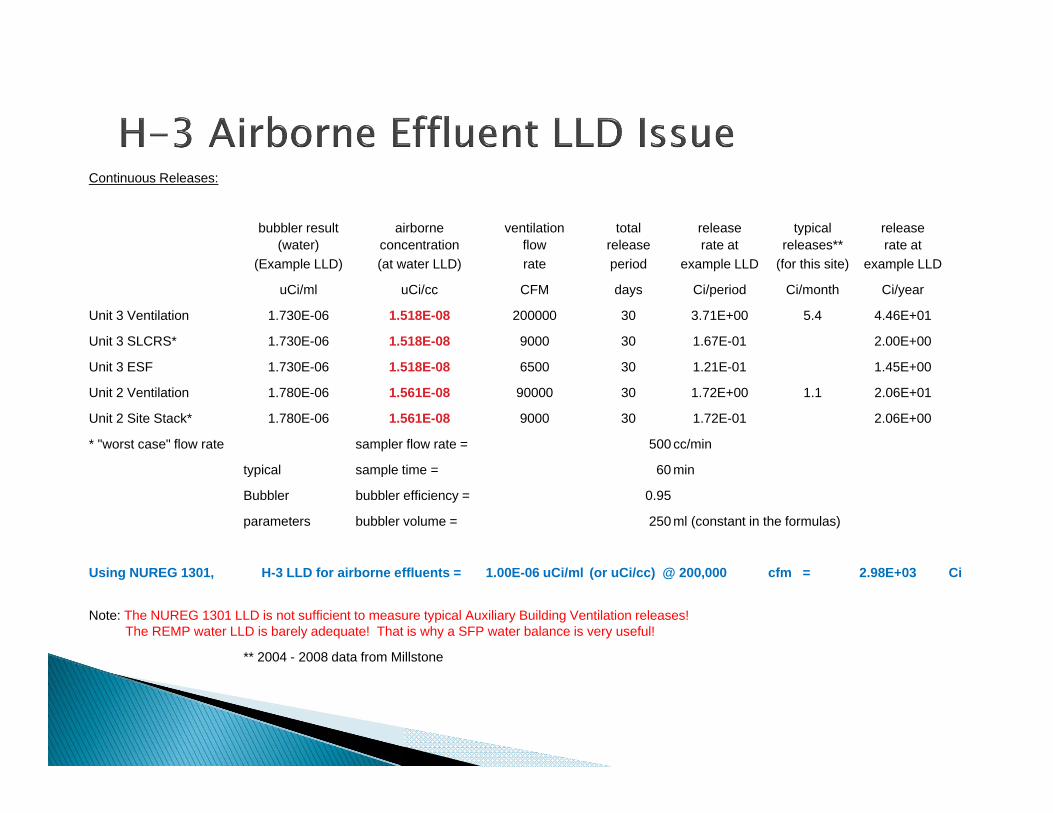
Continuous Releases:
bubbler result airborne ventilation total release typical release(water) concentration flow release rate at releases** rate at
(Example LLD) (at water LLD) rate period example LLD (for this site) example LLD
uCi/ml uCi/cc CFM days Ci/period Ci/month Ci/year
Unit 3 Ventilation 1.730E-06 1.518E-08 200000 30 3.71E+00 5.4 4.46E+01
Unit 3 SLCRS* 1.730E-06 1.518E-08 9000 30 1.67E-01 2.00E+00
Unit 3 ESF 1.730E-06 1.518E-08 6500 30 1.21E-01 1.45E+00
Unit 2 Ventilation 1.780E-06 1.561E-08 90000 30 1.72E+00 1.1 2.06E+01
Unit 2 Site Stack* 1.780E-06 1.561E-08 9000 30 1.72E-01 2.06E+00
* "worst case" flow rate sampler flow rate = 500 cc/min
typical sample time = 60 min
Bubbler bubbler efficiency = 0.95
parameters bubbler volume = 250 ml (constant in the formulas)
Using NUREG 1301, H-3 LLD for airborne effluents = 1.00E-06 uCi/ml (or uCi/cc) @ 200,000 cfm = 2.98E+03 Ci
Note: The NUREG 1301 LLD is not sufficient to measure typical Auxiliary Building Ventilation releases! The REMP water LLD is barely adequate! That is why a SFP water balance is very useful!
** 2004 - 2008 data from Millstone

WGDT – Should be mostly Kr-85 – if not, either you have excellent fuel and/or your hold up time is in-adequate.
What does FSAR say for holdup time? What if WGDT leak or released too soon Are ODCM waste treatment requirements
being met? What is the normal ventilation source term?
Airborne – Beta scintillators will “over-respond” to Kr-85 (depending on the calibration and what assumptions are made of the isotopic mix),
NaI will “under-respond” to Kr-85 – most normal range gaseous rad monitors are beta scintillators (at least for PWR’s)
Liquids – typically NaI detectors – can over-respond to Co-60 (2 gammas/disintegration). Can under-report for low energy isotopes like Te-125m, which due to low gamma abundance, can be a large portion of liquid effluent total curies.
Tritium – not detectable by Rad Monitors, but we’d like the monitor to auto-terminate on time. What should we do?
Tritium is typically the largest contributor (especially for PWRs) to the Effluent Concentrations of 10CFR20 (ECs)
How do we handle it – actual or conservative estimates of EC fraction like other non-gamma emitters?
Giving enough of the EC fraction to tritium? Since the monitor doesn’t see H-3, how do
we get it to trip if H-3 is close to its limit?
What is NRC IEB 80-10 (and IEB 91-14)
The first one required official licensee response – what are “your” commitments?◦ Typical examples: aux boiler feed, storm drains, etc
You should have a program document describing these, and procedural ‘hooks’ that identify sampling requirements as 80-10.
You are NOT exempt from this requirement if you were built after 1980 !!!!
What is it? Why should this specialist be trained? Plant modifications/additions/deletions need
impact review for effluents and commitments inherent to those that generated the ODCM.◦ OE – Maine Yankee – built a new rad waste facility –
performed excellent safety evaluation and addressed issues based upon potential accidents, however neglected to address offsite radiological impact of routine operation of the facility and total dose requirements (40CFR190).
◦ Resulted in significant increased SB dose. Opens up the question of “direct shine” and Total Dose requirements INCONSISTENT with the wording in NUREG 1301/1302!
Other OE – H2 water Chemistry, Zn injection –caused significant impacts to effluents

Two distinct types of shine For elevated airborne discharge points, although the plume
may touch down beyond the site boundary, the dose is still higher at the site boundary because of plume shine
Significant amounts of shielding around sources can reduce the direct dose from a source such that the major fraction of the dose rate at various distances from a source may be actually from the top of the source reflecting off the air and back to the ground (i.e., skyshine) – this may be important for BWR turbines (as mentioned earlier) , radwaste storage buildings, and ISFSI pads. Computer codes are available for these calculations. It would be good practice to perform additional TLD monitoring to verify these calculations.

Previous slide from NUREG 1301 (similar issue in NUREG 1302) may have been OK in pre-ISFSI days (RW holding pens did not generally have sufficient dose from shine).
Modifications in recent years all point to doing a good assessment for direct shine. These include:◦ N-16 shine in BWRs (H2 water chem and noble metals)◦ Rad Waste Storage Facilities not getting younger◦ ISFSI – Your vendor may imagine he has the whole 25 mrem!
All these can be significant shine (approaching the 40CFR190 limit of 25 mrem @ SB, yet have minimal or no effluent contribution !

Analytical techniques have improved over the years:◦ Gross beta and gross gamma measurements (pre ~1975, NaI vs. GeLi and HPGe
Sample media is not cast in stone:◦ some minor changes since significant pathways better understood – some sites now
consider deer meat (per new Reg, Guide 4.1 – “game”)
Several older plants (typically BWR’s operating near the Appendix I levels) routinely saw low levels of I-131 in goats milk (0–3 pCi/liter) (this was just prior or during the early stages of Appendix I)
Some historical data on Co-58, Co-60, I-131, Cs-134, Cs-137, Zn-65 , Ag-110m, and other nuclides in aquatic samples – primarily shellfish, but some in fish and seaweed
H-3 levels in water – background should be ~ 50 to 100 pCi/liter (see “H-3 Background …” , 21st RETS-REMP Workshop – 2011)
Compare with pre and post bomb testing eras.
When performing comparisons, important to compare REMP concentration to Effluent concentration for each identified nuclide in order to determine if pathway analysis/factors are adequate
Just as you compare 10CFR61 with effluents, you need to compare effluents with REMP.
See “COMPARISON OF ENVIRONMENTAL DOSE CALCULATION MODELSWITH ACTUAL ENVIRONMENTAL MEASUREMENTS,” DOROSKI, J. W., W. J. EAKIN AND R. A. CRANDALL, 35TH ANNUAL CONFERENCE ON BIOASSAY, ANALYTICAL AND ENVIRONMENTAL RADIOCHEMISTRY, NOVEMBER 1989

Atmospheric Weapons testing:◦ US, USSR, Great Britain 1945 – 1963◦ French – till 1974◦ Chinese – till 1980
Other Events◦ Windscale – 1957◦ TMI – 1979◦ Chernobyl – 1986◦ Fukushima - 2011

Several tests in the late 1970’s, generally ID’d as “dirtiest” Connecticut sampling results:◦ slight increase noted on a HPIC
◦ significant increases in AP gross beta, positive I-131 in charcoal cartridges
◦ 800 pCi/liter in goats milk, ~ 200 pCi/liter in cows milk (for 7 cow milk locations in areas of Haddam Neck and Millstone , one cow milk location indicated only ~ 40 – this farmer took his cows off pasture); pooled milk much lower
◦ Sr-89 measured in milk
◦ Ba-140, La-140, Zr-Nb-95, I-131, and others?? - measured in seaweed
◦ Crude calculation resulted in a dose ~ 10 mrem (???) for the average individual in CT
We need to remember our history – it seems to repeat itself.
Concern over Fukushima was tempered somewhat from our learning after Chernobyl. But there were some big differences: ◦ As awful as Fukushima was, the projection and transport of particulate at
Chernobyl was worse due to the explosion and heat source.
◦ Dispersion went higher into the atmosphere. How much testing was done worldwide to track and characterize the plume – or to even understand the jet stream?
Did anyone compare what we saw to Chinese atmospheric weapons test results?
Individual utility employees may not have resources to expand beyond regulations. ◦ Consider driving your corporate people into getting resources when you
need them to take advantage of this hopefully very rare kind of learning!
“Plant XXX (actual plant name removed) has extensive controls in place to minimize radiation exposure to the public and our employees. Very sensitive radiation monitors around our plant have shown no increase in radiation above normal background levels. The exposure our employees get inside the plant is well below federal limits for radiation workers.”
“We do extensive radiological studies of air, water, plant life and animal life in the area around the plant.”
“These studies began 10 years before the plant was built and has continued since then. In all those years, we have seen no changes in radiation levels in the local environment attributable to the plant. The radiological effects of the plant on the local environmental are undetectable.”
Excerpt from a local business journal, May 9, 2013
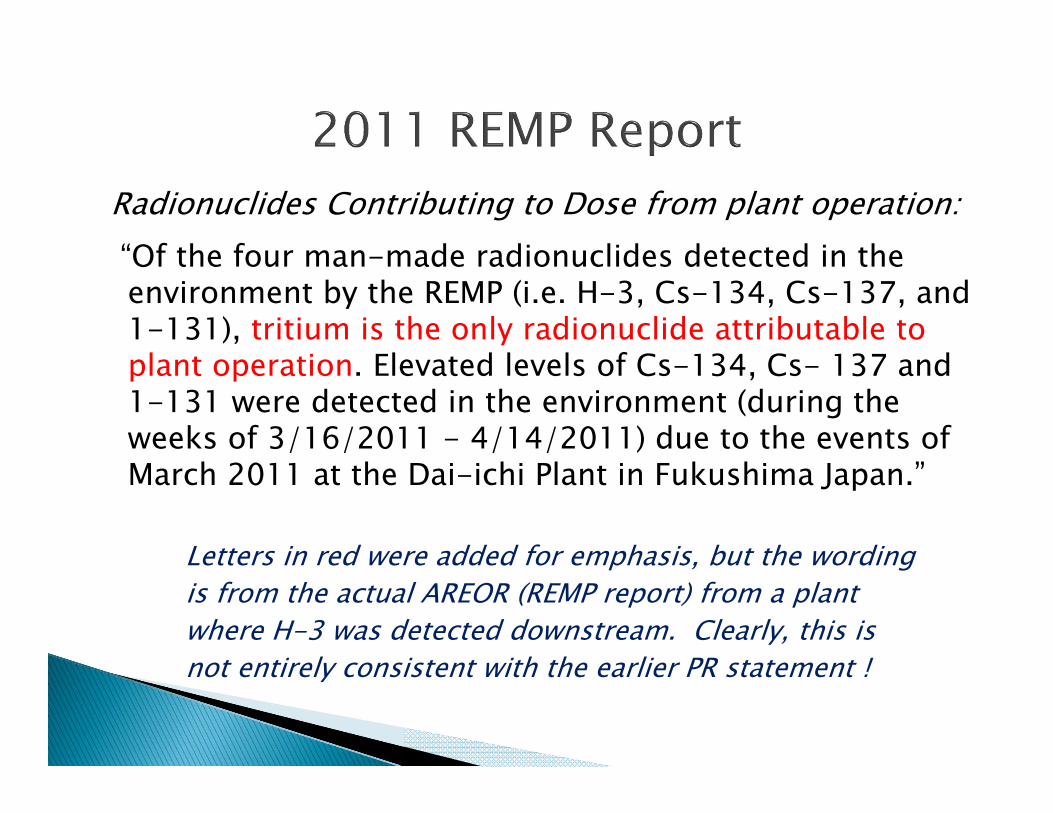
Radionuclides Contributing to Dose from plant operation:“Of the four man-made radionuclides detected in the environment by the REMP (i.e. H-3, Cs-134, Cs-137, and 1-131), tritium is the only radionuclide attributable to plant operation. Elevated levels of Cs-134, Cs- 137 and 1-131 were detected in the environment (during the weeks of 3/16/2011 - 4/14/2011) due to the events of March 2011 at the Dai-ichi Plant in Fukushima Japan.”
Letters in red were added for emphasis, but the wordingis from the actual AREOR (REMP report) from a plantwhere H-3 was detected downstream. Clearly, this is not entirely consistent with the earlier PR statement !
User Friendly Information (remember these reports are generally for the public)
Plots and Trends Summary Tables Raw Data presentation – a primary concern◦ Industry wide issue, needs regulatory guidance/motivation
“REMP REPORT IMPROVEMENTS,” DOROSKI, J. W. 22ND ANNUAL RETS/REMP WORKSHOP, JUNE 25-27, 2012.
Pilgrim and Millstone include discussions on how nuclear power plants work and the potential environmental impacts, including background radiation information from NCRP 160 – planning to do the same for IPEC.
ARERR: should consider a discussion of release points and effluent monitoring techniques.
Sample results from ARERR should be tied into the AREOR. Good example: compare liquid batch H-3 releases by quarter or month (diluted as your data suggests) vs the REMP composite sampler results.
Limerick, Beaver Valley, Southern Nuclear and others have great information (however, some plots which show pre-operational data may actually show “less than” values –◦ some of these have plots showing fallout levels in air
particulates from the early 70’s thru today (Chinese weapon tests, Chernobyl, etc.) – these reports are good examples for these plots/trends
Millstone has several good trends (see Figure 2.12 in NAS Phase I - Draft)
5 year, 10 year, and lifetime trends (pros & cons, e.g., complete history vs. “resolution”)
You will have to involve PR at some point, as “too much” info can have the opposite affect.

Millstone figure

Millstone figure
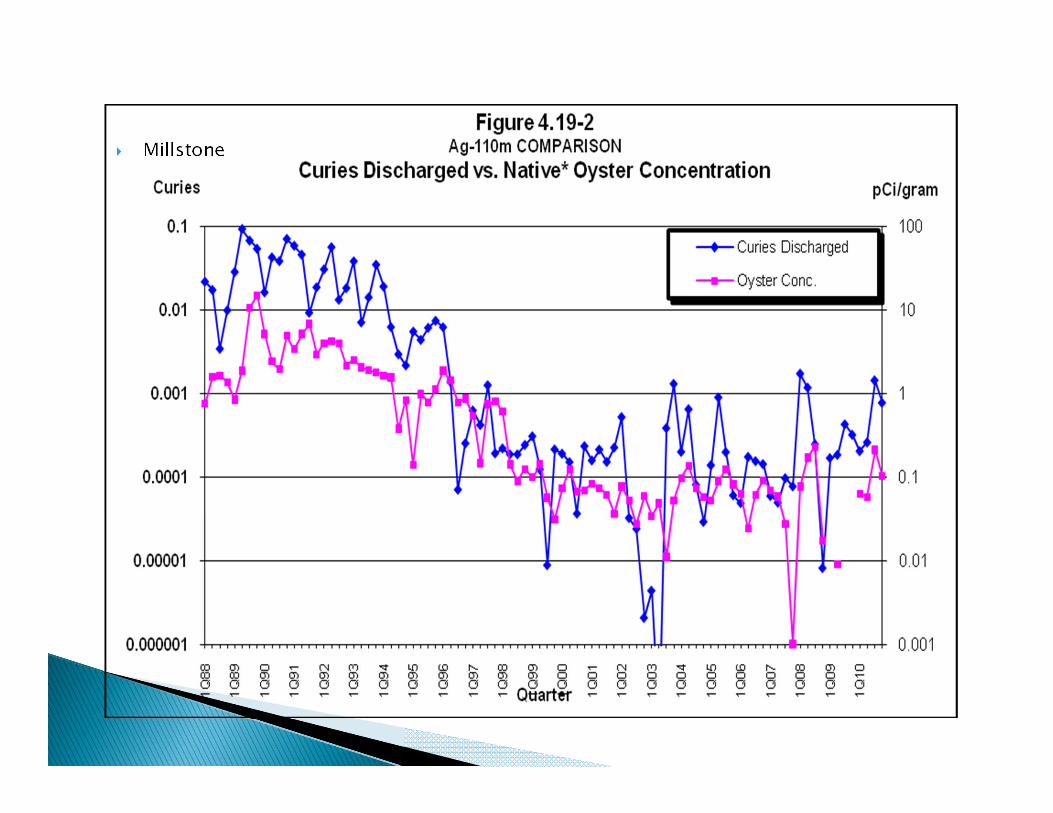
Millstone
NUREG 1301 & 1302 (BTP on REMP) – recommends format for Summary Table –average only positive results – bad practice, overly conservative especially when only a small percentage of the samples are positive – NAS Phase I Draft (the proposed “new” cancer study) uses the summary table results in their report (Tables 2.14, 2.15)
NUREG/CR-4007 – pages 57-60 , 76 – “Quality data, poorly reported, leads to needless information loss…” “…, the experimental result and its associated uncertainty should be recorded, even if it should be a negative number. (Proper averaging is otherwise impossible, except with certain techniques devised for “censored” (but not truncated) data.)”
HASL (now EML) - ("Reporting of Analytical Results from HASL," letter by Leo B. Higginbotham
NUREG – 0475 – page 9

MARLAP recommends that the reported value of a measurement result:
(1) be reported directly as obtained, with appropriate units, even if it is are negative,
(2) be expressed in an appropriate number of significant figures, and
(3) include an unambiguous statement of the uncertainty. The appropriate number of significant figures is determined by the magnitude of uncertainty in the reported value. Each reported measurement result should include the value and an estimate of the combined standard uncertainty (ANSI N42.23) or the expanded uncertainty.
EPA 520/1-80-012, August 1980 Statistical Considerations in Practical Contamination Monitoring,
Allen Brodsky and Robert Gallagher, Radiation Protection Management, Vol. 8, July/August 1991, pp. 64-78.
Application of Systemic Error Bounds to Detection Limits for Practical Counting, D. Mayer and L. Dauer, Health Physics 65(1):89-91, 1993.
False Alarms, True Alarms, and Statistics; Correct Usage of Decision Level and Minimum Detectable Amount, Daniel Strom, Continuing Education Lecture, HPS, July 1998.
Accuracy and Detection Limits for Bioassay Measurements in Radiation Protection – Statistical Considerations, NUREG 1156
NUREG CR-4007

Since averaging should include “all results”, why not show all the results in the data tables? (some sites don’t even show these tables, why not?)
From RADNET:◦ Location: EPA Region 01
Medium: SURFACE WATERNuclides/Radiation: TritiumUnits: TraditionalYear Date Range : 1978 - 2012
Note: Before September 1995, tritium results were calculated manually and rounded to the nearest 100 pCi/L (or 0.1 nCi/L). Tritium results less than 100 pCi/L were recorded as 100 pCi/L. Since September 1995 computer software has been used for the calculation and all results have been recorded as obtained. The pre-1995 practice created a positive bias in the measured tritium concentrations, which is clearly visible in graphs.
A few sites have been reporting “all the data” for years – over 35 years for Millstone – it hasn’t presented any problems
Although this does not seem to be “the norm” for utilities, it is for most states and the federal government.
It will provide more useful data (lessen misuses, better trends/plots, better history, …)
Yes, it may involve a ‘culture shock’ to customers used to seeing poorly represented “<mda” or “N/D” values.
These decisions may be outside the realm of regulatory compliancy, and more related to cost justification and politics. However… our opinion is that it’s time for a change.
Representing all data in this way will work in our favor, but it will take a collective enterprise to educate the readers.
Improvements can be made by adding a few pages on general information
Trends/plots can be improved – better comparisons to pre-operation or other “historical data”
All data (+, zeros and -) need to be used when performing averages
All data should be presented (positive data, especially plant related can be “highlighted” to indicate which are actually “positive”) –and this method of differentiation should be discussed in the body of the report.
Improve Land Use Census◦ Address any new potential pathways – e.g. deer
meat, adequately perform & document census (use Internet and contact various organizations (Dept of Agriculture, marketing groups, Dairy Goat Association, etc)
Surface Water Compositing◦ Consider “continuous samplers” (see NUREGs
1301/1302 and even in 0472 and 0473) since liquid releases are infrequent and of short duration
Review your historical data Understand the reasons for the trends BE careful using “less than” data Several of the listed references and previous
RETS-REMP Workshop presentations (especially those referenced earlier) have some great information, review them when you get a chance
If have questions, consult your experienced peers
From the
It was on the internet, so it must be true
department:

A few weeks after Fukushima, published by DSI, inc on their blog, written by Richard L. Wottrich, Senior Managing Director, International Desk, [email protected]
I love this almost official emblem !