john harvey, uc davis amlan mukherjee, michigan … harvey, uc davis amlan mukherjee, michigan tech...
TRANSCRIPT

John Harvey, UC DavisAmlan Mukherjee, Michigan Tech
Hui Li, UC Davis
ISAP Annual Meeting of Technical Committee on Asphalt Pavements and EnvironmentJanuary 13th, 2013, Washington DC.

Outline LCA and Construction 2012, Nantes, France July 10‐12 Pavement LCA Work at University of Nottingham Pavement LCA Work at VTI/Europe Project Emissions Estimator (PE‐2) at Michigan Tech Cool Pavement Research at UC Davis Pavement‐Vehicle Interaction Work at MIT Pavement LCA Work at UC Davis
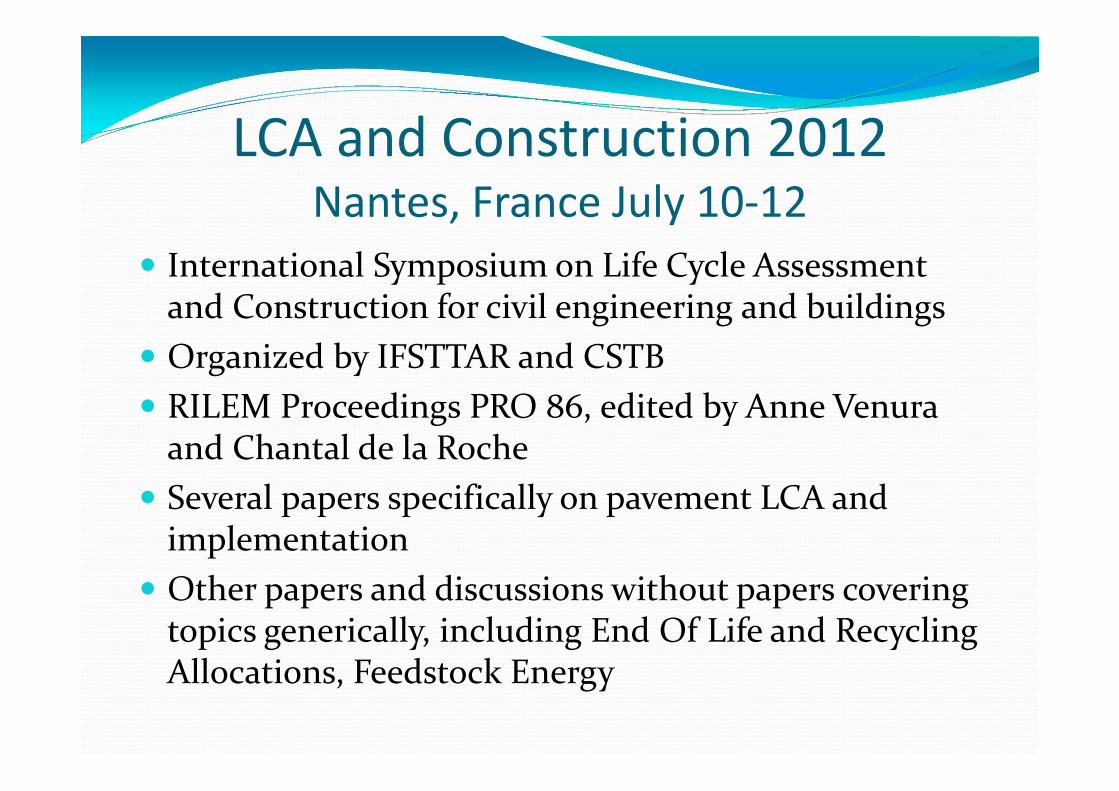
International Symposium on Life Cycle Assessment and Construction for civil engineering and buildings
Organized by IFSTTAR and CSTB RILEM Proceedings PRO 86, edited by Anne Venuraand Chantal de la Roche
Several papers specifically on pavement LCA and implementation
Other papers and discussions without papers covering topics generically, including End Of Life and Recycling Allocations, Feedstock Energy
LCA and Construction 2012Nantes, France July 10‐12

Summary of LCA and Construction 2012Notes by T. Parry, J. Harvey There is no such thing as a ‘right’ LCA result. Decisions about allocation, functional unit, etc., are therefore, ‘political’ decisions and should be made by decision makers, who may decide to ‘promote’ recycling by reducing the allocated impact to recycled materials, etc. Decision makers don’t understand this. We need to suggest the way forward, with justification.
We need to decide what needs to be reported about methodology along with results of LCA studies. This might be based on EN15804 but requires interpretation for our sector.
This means we need to get our heads around EPDs (perhaps as defined in ENs). There are EPDs with sector rules for some construction products in some EU countries and we probably need to take a look at them and understand how they work, before developing them for our sector.

Heavy emphasis on greenhouse gases and energy in pavement LCA, need to not forget other pollutants (air, water) and depletion of finite resources. Original application of LCA was to look at ozone depletion.
Feedstock energy is a difficult concept. It takes depletion of a finite resource (oil usually) and converts it into energy units, often then mixed up with consumed energy. Suggestion by Santero and Ventura to keep energy separate, consider feedstock in terms of resource depletion, for asphalt often inaccessible once mixed with rock.

Pavement LCA Work at University of Nottingham
Tony Parry et al.University of Nottingham

Huang, Spray and Parry, Sensitivity analysis of methodological choices in road pavement LCA, Int J Life Cycle Assess (2013) 18:93–101.
The Nottingham group investigated Methodological choices (e.g. concerning allocation at EOL recycling
and to by/co‐products). Can make a significant difference to the results, so need to be standardised in order to have comparable and transparent results.
Case studies using different allocation (economic/mass) for blast furnace slag and bitumen. Construction products are generally cheap (e.g. compared to metals and petrochemicals) so economic allocation reduces the allocated impacts compared to mass, but there is a case for zero allocation to ‘wastes’ to encourage use.
A method to credit some EOL recycling benefits to original production may encourage recycling and recyclability but the degree of benefit is probably an arbitrary decision due to uncertainty in future recycling rates and regional variations in future supply and demand.
These considerations (along with many others, such as future traffic flow assumptions etc.) may drive allocation decisions in different directions for different circumstances, and so compromise comparability.

Other update from the T. Parry (UK)The UK Institute of Civil Engineers (ICE) has set up a Low‐C Panel, which amongst other things, is going to try to write a ‘methodology for methodologies’ that might be a first step to resolving problems of comparability.

Deliverable 3.4Life cycle assessment of reclaimed asphalt
Pavement LCA Work at VTI/Europe
Matt Wayman et al.VTI, et al.
Report: http://re‐road.fehrl.org/index.php?m=48&mode=download&id_file=14729

Questions on reclaimed asphalt What is the additional benefit of recycling surface course back into new surface course?
How does the toxicity of reclaimed asphalt compare to that of virgin aggregates and bitumen?
How do the benefits of recycling compare to those of warm mix asphalt?
By how much does moisture in RA diminish the benefits of recycling?
How significant is durability in relation to recycled mixtures?
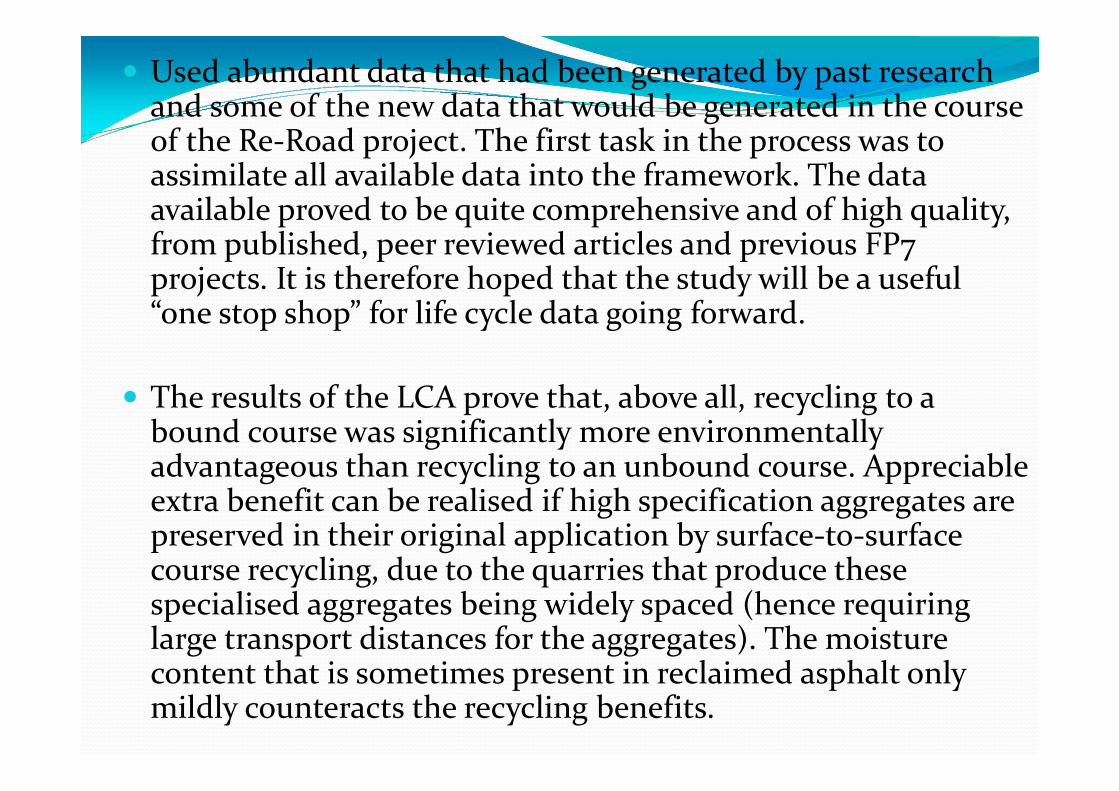
Used abundant data that had been generated by past research and some of the new data that would be generated in the course of the Re‐Road project. The first task in the process was to assimilate all available data into the framework. The data available proved to be quite comprehensive and of high quality, from published, peer reviewed articles and previous FP7 projects. It is therefore hoped that the study will be a useful “one stop shop” for life cycle data going forward.
The results of the LCA prove that, above all, recycling to a bound course was significantly more environmentally advantageous than recycling to an unbound course. Appreciable extra benefit can be realised if high specification aggregates are preserved in their original application by surface‐to‐surface course recycling, due to the quarries that produce these specialised aggregates being widely spaced (hence requiring large transport distances for the aggregates). The moisture content that is sometimes present in reclaimed asphalt only mildly counteracts the recycling benefits.

The results also indicate that low level recycling (just 15% to bound courses) is significantly more environmentally beneficial than warm mixing, particularly if the additives used to facilitate warm mixing are included in the analysis.
The research also revealed that LCA is perhaps not the best technique to analyse the significance of the toxic effects of organic compounds that experiments have shown to be present in the leachates and vapours arising from the use of reclaimed asphalt materials. The risk assessment that has also been conducted as part of Re‐Road (Deliverable 3.3) is likely to be the best source of information regarding these potential toxic or harmful compounds.
The study has produced a useful framework of reliable results; however, in terms of future enhancement, more information regarding the durability of different types of asphalt mixtures, including those incorporating reclaimed asphalt, would be extremely useful. As is the case with many life cycle based studies of construction products, any further certainty with regards to the likely lifespans of materials would be extremely useful, since the rate of replacement of materials can be very significant in environmental terms.
PE‐2 to Estimate Emissions Savings ‐Application for Michigan Ave. Reconstruction
Amlan MukherjeeMichigan Tech

Project Emissions Estimator (PE‐2)
Web Based Construction Project Inventory Based on 14 highway construction, maintenance & rehab projects that were closely monitored
Resources: All materials & equipment used on site Site Information: Layout, operation design Travel Distances: On site and to site travel distances
Provides: Project emissions calculated using a Life Cycle Assessment method: Footprint in carbon emission equivalents “to gate” Example: The Michigan Ave. Reconstruction Project

PE‐2 Estimator Tool An online tool to estimate highway project emissions:
Empirical estimates based on project inventory Use phase included: MOVES emission estimator used
Properties: Users can load:
Material & equipment use estimates using online estimate tool Expected pavement maintenance schedule
Returns annualized emissions over the expected pavement life
Can be used as a project level & network level emission estimator

Michigan Ave. Profile Aggregate profile
Total weight used: 3522.97 t (Virgin = 2730.30 t) Recycled aggregate: RAP (15%) + RAS (7.5%) = 792.67 t
Asphalt binder profile Total weight used: 176.15 t (Virgin = 107.45 t) Recycled aggregate: RAP (~4%) & RAS (~18%) = 68.70 t

Estimator at work

Materials: Example Input 1000 CY of concrete:
Cement: 179 t (395 lb/cy) Class C Fly Ash (30% by wt): 76 t (170 lb/cy) Coarse Aggregate: 823 t Fine Aggregate: 569 t
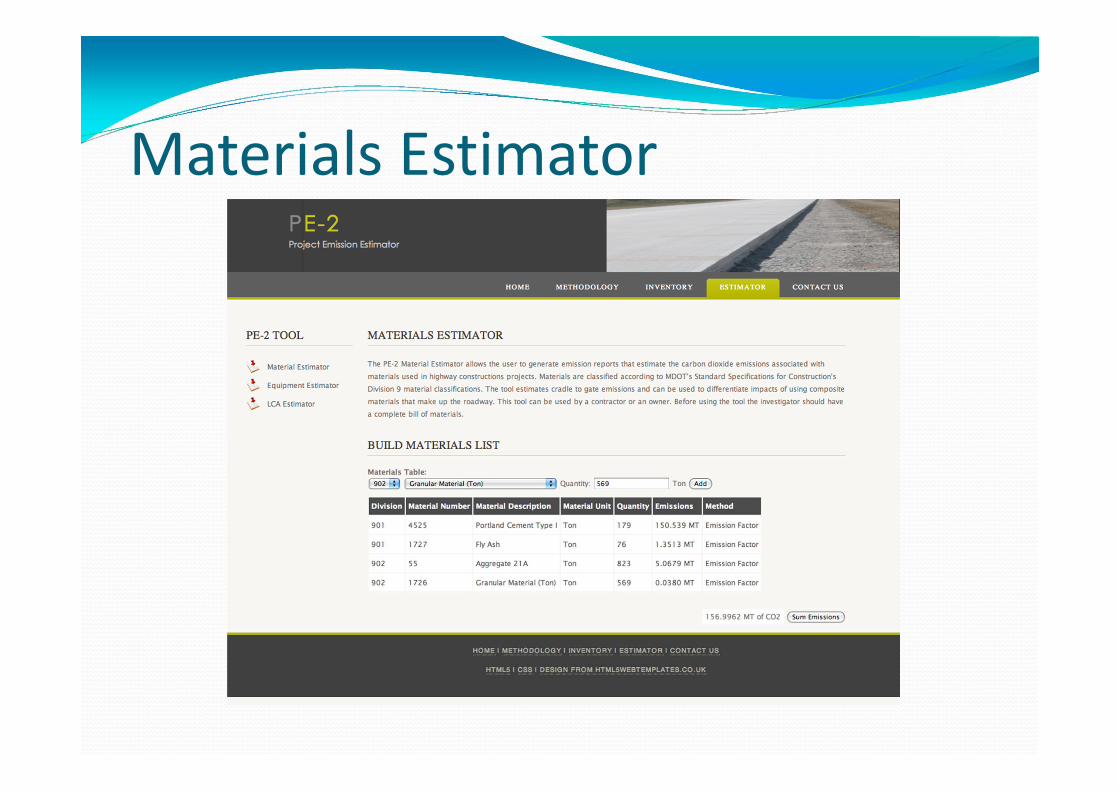
Materials Estimator

Example Input Roadtec Pavers: 40.5 hrs Roadtec MTV: 33.5 hrs Hypac Compactor: 39.5 hrs Dynapac Steel drum roller: 76.5 hrs

Equipment Estimator
Savings Total emissions: 37.57 t of CO2 Equivalents Savings
24% Savings in emissions due to use of RAP & RAS: 5% savings due to use of recycled aggregate 39% savings due to recycled binder
Total tonnage of material saved from landfill: 792.67 tons

Cool Pavement Research
John Harvey & Hui LiUC Davis

Potential Benefits from Cool (& Permeable) Pavement
Help create a livable and walkable community in hot summer (mitigated local heat stress)*
Reduce energy use for building and vehicle cooling* Improve air quality (ground‐level ozone) Reduce stormwater runoff Improve water quality Recharge groundwater
24
Dependent on location and application!

Test Sections for Cool Pavement Research
25ATIRC @ UCPRC
Davis, CA
Field Measurements1. Permeability, Thermal conductivity & Heat Capacity,
Evaporation Rate 2. Albedo (surface reflectivity) & effect on pavement thermal
performance3. Thermal behavior of different pavement types under
different conditions on test sections1) asphalt, concrete vs. paver2) permeable vs. impermeable3) dry vs. wet (irrigation)
4. Thermal impact of pavement on near‐surface air5. Thermal interaction between pavement and other surface
26

Modeling & Simulation Thermal behavior of pavement and near‐surface air
Different cool pavement strategies Different seasons Different climates
Effect on human thermal comfort Integrate pavement, wall, sky‐view and human body Advanced thermal comfort index
Physiological Equivalent Temperature (PET) Characterize both temperature and radiation
Effect on building energy use (preliminary) Thermal load

Thermal Images (Dry): 4pm 7/9/2012
28
C1 C2 C3
B1 B2 B3
A1 A2 A3
Lighter is hotter: legend range of 30 to 70 °C
44 °C 59 °C 50 °C
61 °C 66 °C 65 °C
49 °C 52 °C 50 °C
C: Concrete
B: Asphalt
A: Paver

Thermal performance of permeable pavement under dry & wet conditions (e.g. B3).
29date format: mm/dd)
Impermeable B1
Air
Permeable B3

Impact on near‐surface air temperature (example: B1 on Jul/31/12)
3010 20 30 40 50 60 70
0
10
20
30
40
T (C)
Hei
ght (
in)
0
25
51
76
102
Hei
ght (
cm)
B1_Air @ 07/31/2012
0:002:004:006:008:0010:0012:0014:0016:0018:0020:0022:0024:00

Impact on Vertical Surface (13:00 8/15/2012)
31Lighter is hotter: legend range of 30 to 65 °C
asphalt (B1), 60 °C
concrete (C1), 45 °C
wall, 52 °C
wall, 55 °C
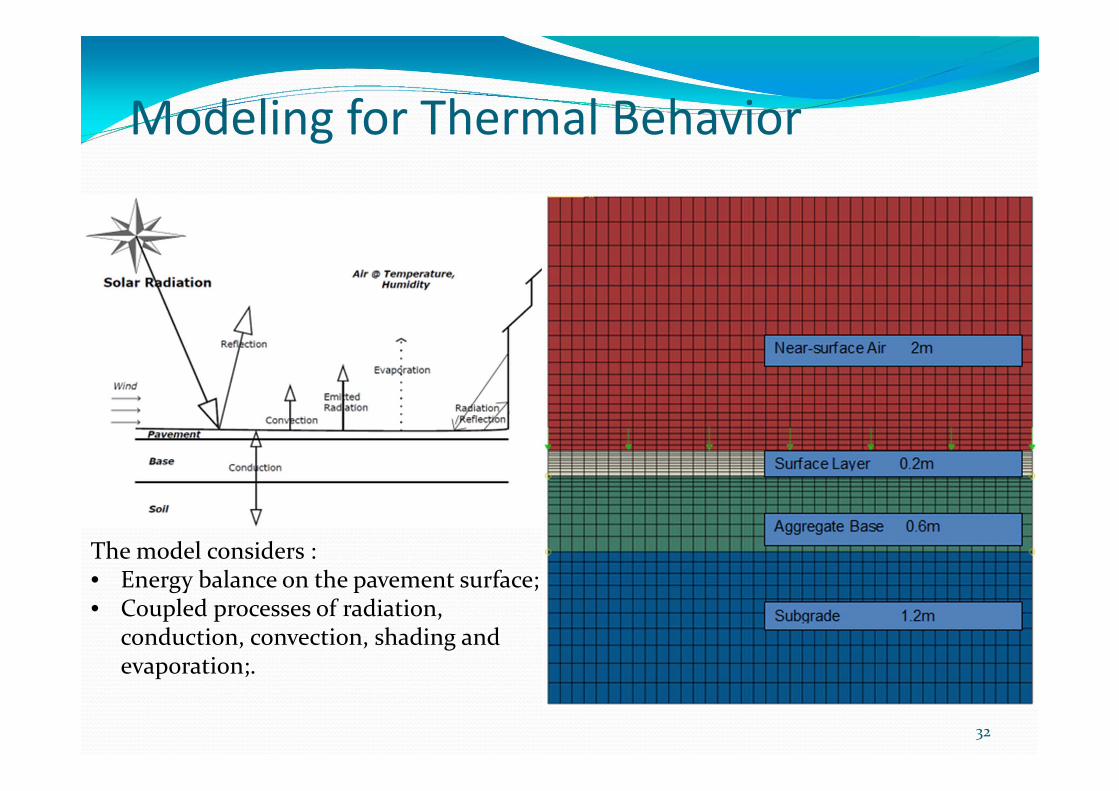
Modeling for Thermal Behavior
32
The model considers :• Energy balance on the pavement surface;• Coupled processes of radiation,
conduction, convection, shading and evaporation;.
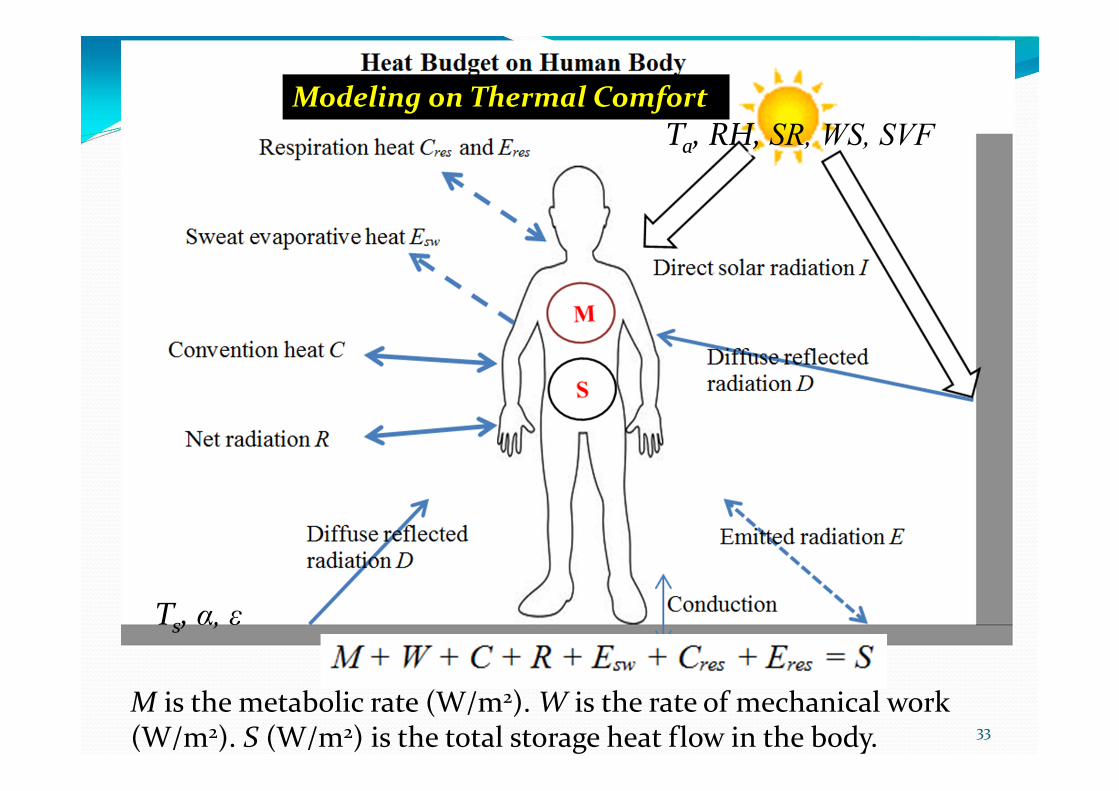
33M is the metabolic rate (W/m2). W is the rate of mechanical work (W/m2). S (W/m2) is the total storage heat flow in the body.
Ts, α, ε
Ta, RH, SR, WS, SVFModeling on Thermal Comfort
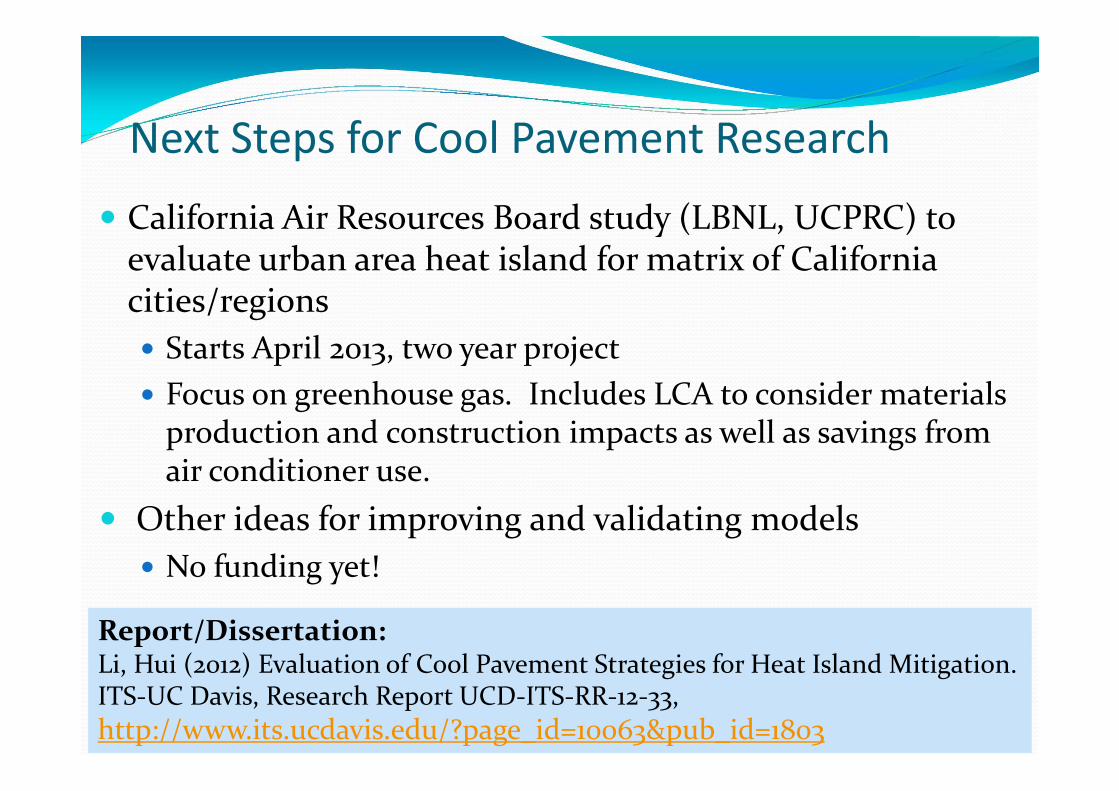
Next Steps for Cool Pavement Research
California Air Resources Board study (LBNL, UCPRC) to evaluate urban area heat island for matrix of California cities/regions Starts April 2013, two year project Focus on greenhouse gas. Includes LCA to consider materials production and construction impacts as well as savings from air conditioner use.
Other ideas for improving and validating models No funding yet!
34
Report/Dissertation:Li, Hui (2012) Evaluation of Cool Pavement Strategies for Heat Island Mitigation. ITS‐UC Davis, Research Report UCD‐ITS‐RR‐12‐33, http://www.its.ucdavis.edu/?page_id=10063&pub_id=1803
Pavement‐Vehicle InteractionMehdi Akbarian, Arghavan Louhghalam, Franz‐Josef Ulm
MIT

CSHub Research Activities CSHub
Research
Concrete Science
Dissolution Precipitation & Hardening
Hardened Paste
Engineering/ Economics
Buildings Pavements
LCA LCCA PVI
Supporting scientific
developments
Supporting engineering and policy decisions
Presentation Focus

Model‐Based Assessment of Pavement Vehicle Interaction (PVI)
Pavement RoughnessPavement Deflection
StructureandMaterial
MEPDG+HDM4MIT‐Model
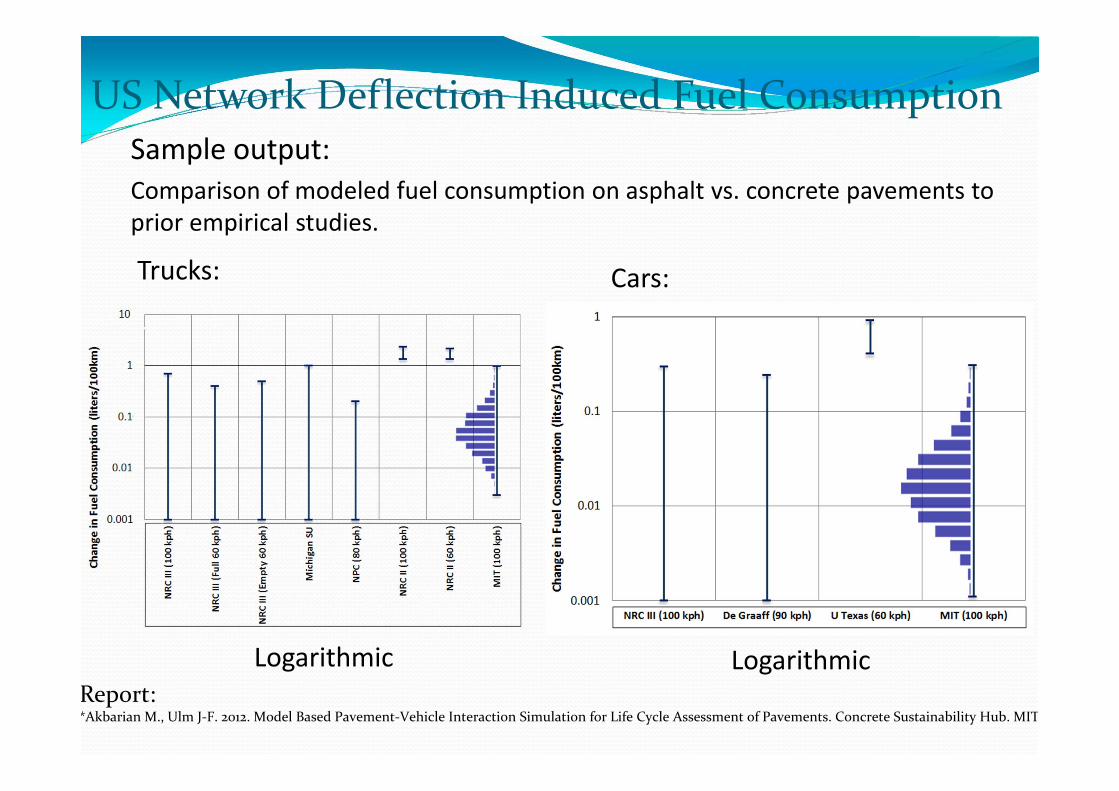
US Network Deflection Induced Fuel Consumption
Trucks: Cars:
Report:*Akbarian M., Ulm J‐F. 2012. Model Based Pavement‐Vehicle Interaction Simulation for Life Cycle Assessment of Pavements. Concrete Sustainability Hub. MIT
Sample output:Comparison of modeled fuel consumption on asphalt vs. concrete pavements to prior empirical studies.
Logarithmic Logarithmic

0
0,04
0,08
0,12
0,16
0,2
Freq
uenc
y
Δ fuel consumption (l/km)
AsphaltConcrete
t‐test:4.8%difference
Thedifferenceisstatisticallyinsignificant
US Network Roughness Induced Fuel Consumption

1. Plate on Viscoelastic Foundation• Calibrate, Validate• Scale gradient forces to F.C.• LTPP/State data
2. Viscoelasticity• Velocity and temp dependent• Impact on deflection• Viscous energy dissipation
3. Multilayer pavement• Composite pavement response for bound and unbound
layers
In Progress:
41
More: web.mit.edu/cshub
Report Briefs

Pavement LCA work at UCPRC
J. Harvey, A. Kendall, T. Wang, I.S. Lee, E. ColeriUC Davis

Updates to model in progress (done by summer 2013) Expand list of maintenance and rehabilitation treatments Consideration of construction work zone traffic delay Implement model for energy dissipation due to viscoelasticasphaltic layers
Investigation of effects of smoother pavement on vehicle operating speeds (California freeways)
Implementation Initial GHG calculator considering materials production, construction and use phase due to IRI implemented in new Caltrans PMS
Calculating $/ton CO2e from M&R treatments for network, sensitivity to IRI treatment level
Updating and implementing LCA model

Three sources of energy consumption in Use Phase: Roughness (IRI) through suspension Macrotexture through tires (minor compared to roughness) Deflection
Approaches to energy consumption due to deflection MIT: viscoelastic effects in subgrade (surface modeled as elastic) result in wheel running up hill at small angles. Energy consumption due to angle, no dissipated energy in pavement.
UCPRC: implementing di Benedetto’s viscoelastic asphalt model to estimate energy dissipation in asphaltic materials under different loads, speeds and temperatures; different asphalt materials (rubberized, polymer, conventional); different structures (flexible, semi‐rigid, composite).
GHG and energy consumption due to deflection