john rushby based on joint work with bev littlewood (city
TRANSCRIPT

On the reliability of Monitored Systems
John Rushby
Based on joint work with Bev Littlewood (City University UK)
Computer Science Laboratory
SRI International
Menlo Park CA USA
John Rushby, SR I Reliability of Monitored Systems 1

A Conundrum
• Critical systems are those where failures can have
unacceptable consequences: typically safety or security
• Cannot eliminate failures with certainty (because the
environment is uncertain), so top-level claims about the
system are stated quantitatively
◦ E.g., no catastrophic failure in the lifetime of all airplanes
of one type (“in the life of the fleet”)
• And these lead to probabilistic requirements for
software-intensive subsystems
◦ E.g., probability of failure in flight control < 10−9 per hour
• To assure this, do lots of verification and validation (V&V)
• But V&V is all about showing correctness
• And for stronger claims, we do more V&V
• So how does amount of V&V relate to probability of failure?
John Rushby, SR I Reliability of Monitored Systems 2

Background
John Rushby, SR I Reliability of Monitored Systems 3

The Basis For Assurance and Certification
• We have claims or goals that we want to substantiate
◦ Typically claims about a critical property such as security
or safety
◦ Or some functional property, or a combination
E.g., no catastrophic failure condition in the life of the fleet
• We produce evidence about the product and its development
process to support the claims
◦ E.g., analysis and testing of the product and its design
◦ And documentation for the process of its development
• And we have an argument that the evidence is sufficient to
support the claims
• Surely, this is the intellectual basis for all certification regimes
John Rushby, SR I Reliability of Monitored Systems 4

Standards-Based Certification vs. Safety Cases
• Applicant follows a set process, delivers prescribed outputs
◦ e.g., documented requirements, designs, analyses, tests
These provide evidence; goals and argument largely implicit
• Common Criteria (security), DO-178B (civil aircraft) do this
• Works well in fields that are stable or change slowly
◦ Can institutionalize lessons learned, best practice
• May be less suitable with novel problems, solutions, methods
• Alternative is a safety case: applicant
◦ Makes an explicit set of goals or claims
◦ Provides supporting evidence for the claims
◦ And arguments that link the evidence to the claims
• The case is evaluated by independent assessors
• The main novelty is the explicit argument
• Generalized to security, dependability, assurance cases
John Rushby, SR I Reliability of Monitored Systems 5
Software Reliability
• Software contributes to system failures through faults in its
requirements, design, implementation—bugs
• A bug that leads to failure is certain to do so whenever it is
encountered in similar circumstances
◦ There’s nothing probabilistic about it
• Aaah, but the circumstances of the system are a stochastic
process
• So there is a probability of encountering the circumstances
that activate the bug
• Hence, probabilistic statements about software reliability or
failure are perfectly reasonable
• Typically speak of probability of failure on demand (pfd), or
failure rate (per hour, say)
John Rushby, SR I Reliability of Monitored Systems 6

Aleatory and Epistemic Uncertainty
• Aleatory or irreducible uncertainty
◦ is “uncertainty in the world”
◦ e.g., if I have a coin with P (heads) = ph, I cannot predict
exactly how many heads will occur in 100 trials because
of randomness in the world
Frequentist interpretation of probability needed here
• Epistemic or reducible uncertainty
◦ is “uncertainty about the world”
◦ e.g., if I give you the coin, you will not know ph; you can
estimate it, and can try to improve your estimate by
doing experiments, learning something about its
manufacture, the historical record of similar coins etc.
Frequentist and subjective interpretations OK here
John Rushby, SR I Reliability of Monitored Systems 7

Aleatory and Epistemic Uncertainty in Models
• In much scientific modeling, the aleatory uncertainty is
captured conditionally in a model with parameters
• And the epistemic uncertainty centers upon the values of
these parameters
• As in the coin tossing example: ph is the parameter
John Rushby, SR I Reliability of Monitored Systems 8

Back To The Main Thread
John Rushby, SR I Reliability of Monitored Systems 9

Measuring/Predicting Software Reliability
• For pfds down to about 10−4, it is feasible to measure
software reliability by statistically valid random testing
• But 10−9 would need 114,000 years on test
• So how do we establish that a piece of software is adequately
reliable for a system that requires, say, 10−6?
• Standards for system security or safety (e.g., Common
Criteria, DO178B) require you to do a lot of V&V
◦ e.g., 57 V&V “objectives” at DO178B Level C (10−5)
• And you have to do more for higher levels
◦ 65 objectives at DO178B Level B (10−7)
◦ 66 objectives at DO178B Level A (10−9)
• What’s the connection between amount of V&V (mostly
focused on correctness) and degree of software reliability?
John Rushby, SR I Reliability of Monitored Systems 10

Aleatory and Epistemic Uncertainty for Software
• The amount of correctness-based V&V relates poorly to
reliability
• Maybe it relates better to some other probabilistic property
of the software’s behavior
• We are interested in a property of its dynamic behavior
◦ There is aleatoric uncertainty in this property due to
variability in the circumstances of the software’s operation
• We examine the static attributes of the software to form an
epistemic estimate of the property
◦ More examination refines the estimate
• For what kinds of properties could this work?
John Rushby, SR I Reliability of Monitored Systems 11

Perfect Software
• Property cannot be about some executions of the software
◦ Like how many fail
◦ Because the epistemic examination is static (i.e., global)
◦ This is the disconnect with reliability
• Must be a property about all executions, like correctness
• But correctness is relative to specifications, which themselves
may be flawed
• We want correctness relative to the critical claims
◦ Taken directly from the system’s assurance case
• Call that perfection
• Software that will never experience a failure in operation, no
matter how much operational exposure it has
John Rushby, SR I Reliability of Monitored Systems 12

Possibly Perfect Software
• You might not believe a given piece of software is perfect
• But you might concede it has a possibility of being perfect
• And the more V&V it has had, the greater that possibility
• So we can speak of a (subjective) probability of perfection
• For a frequentist interpretation: think of all the software that
might have been developed by comparable engineering
processes to solve the same design problem
◦ And that has had the same degree of V&V
◦ The probability of perfection is then the probability that
any software randomly selected from this class is perfect
John Rushby, SR I Reliability of Monitored Systems 13

Probabilities of Perfection and Failure
• Probability of perfection relates to correctness-based V&V
• But it also relates to reliability:
By the formula for total probability
P (s/w fails [on a randomly selected demand]) (1)
= P (s/w fails | s/w perfect) × P (s/w perfect)
+ P (s/w fails | s/w imperfect) × P (s/w imperfect).
• The first term in this sum is zero, because the software does
not fail if it is perfect (other properties won’t do)
• Hence, define
◦ pnp probability the software is imperfect
◦ pfnp probability that it fails, if it is imperfect
• Then P (software fails) ≤ pfnp × pnp
• This analysis is aleatoric, with parameters pfnp and pnp
John Rushby, SR I Reliability of Monitored Systems 14

Epistemic Estimation
• To apply this result, we need to assess values for pfnp and pnp
• These are most likely subjective probabilities
◦ i.e., degrees of belief
• Beliefs about pfnp and pnp may not be independent
• So will be represented by some joint distribution F (pfnp, pnp)
• Probability of software failure will be given by the
Riemann-Stieltjes integral∫
0≤pfnp≤1
0≤pnp≤1
pfnp × pnp dF (pfnp, pnp). (2)
• If beliefs can be separated F factorizes as F (pfnp) × F (pnp)
• And (2) becomes Pfnp × Pnp
Where these are the means of the posterior distributions
representing the assessor’s beliefs about the two parameters
John Rushby, SR I Reliability of Monitored Systems 15

Practical Application—Nuclear
• Traditionally, nuclear protection systems are assured by
statistically valid random testing
• Very expensive to get to pfd of 10−4 this way
• Our analysis says pfd ≤ Pfnp × Pnp
• They are essentially setting Pnp to 1 and doing the work to
assess Pfnp < 10−4
• Any V&V process that could give them Pnp < 1
• Would reduce the amount of testing they need to do
◦ e.g., Pnp < 10−1, which seems very plausible
◦ Would deliver the the same pfd with Pfnp < 10−3
• This could reduce the total cost of assurance
John Rushby, SR I Reliability of Monitored Systems 16

Practical Application—Aircraft, Version 1
• No plane crashes due to software, and enough operational
exposure to validate software failure rate < 10−9
• Aircraft software is assured by V&V processes such as
DO-178B Level A
• They do a massive amount of all-up testing but do not take
assurance credit for this
• Our analysis says software failure rate ≤ Pfnp × Pnp
• So they are setting Pfnp = 1 and Pnp < 10−9
• Littlewood and Povyakalo show (under independence
assumption) that large number of failure-free runs shifts
assessment from imperfect but reliable toward perfect
• So flight software might indeed have probabilities of
imperfection < 10−9
• And DO-178B delivers this
John Rushby, SR I Reliability of Monitored Systems 17

Practical Application—Aircraft, Version 2
• Although no crashes due to software, there have been several
incidents
• So actual failure rate may be only around 10−7
• Although they don’t take credit for all the testing they do,
this may be where a lot of the assurance is really coming from
• Our analysis says software failure rate ≤ Pfnp × Pnp
• So perhaps testing is implicitly delivering, say, Pfnp < 10−3
• And DO-178B is delivering only Pnp < 10−4
• I do not know which of Version 1 or 2 is true
• But there are provocative questions here
John Rushby, SR I Reliability of Monitored Systems 18

Two Channel Systems
• Many safety-critical systems have two (or more) diverse
“channels” arranged in 1-out-of-2 (1oo2) structure
◦ E.g., nuclear shutdown
• A primary protection system is responsible for plant safety
• A simpler secondary channel provides a backup
• Cannot simply multiply the pfds of the two channels to get
pfd for the system
◦ Failures are unlikely to be independent
◦ E.g., failure of one channel suggests this is a difficult
case, so failure of the other is more likely
◦ Infeasible to measure amount of dependence
So, traditionally, difficult to assess the reliability delivered
John Rushby, SR I Reliability of Monitored Systems 19

Two Channel Systems and Possible Perfection
• But if the second channel is simple enough to support a
plausible claim of possible perfection
◦ Its imperfection is conditionally independent of failures in
the first channel at the aleatory level
◦ Hence, system pfd is conservatively bounded by product
of pfd of first channel and probability of imperfection of
the second
◦ P (system fails on randomly selected demand ≤ pfdA × pnpB
This is a theorem
• Epistemic assessment similar to previous case
◦ But may be more difficult to separate beliefs
◦ Conservative approximations are available
John Rushby, SR I Reliability of Monitored Systems 20

Details: Aleatory Uncertainty for 1oo2 Architectures
P (system fails [on randomly selected demand] | pfdA = pA, pnpB = pB)
= P (system fails |A fails, B imperfect, pfdA = pA, pnpB = pB)
× P (A fails, B imperfect | pfdA = pA, pnpB = pB)
+ P (system fails |A succeeds, B imperfect, pfdA = pA, pnpB = pB)
× P (A succeeds, B imperfect | pfdA = pA, pnpB = pB)
+ P (system fails |A fails, B perfect, pfdA = pA, pnpB = pB)
× P (A fails, B perfect | pfdA = pA, pnpB = pB)
+ P (system fails |A succeeds, B perfect, pfdA = pA, pnpB = pB)
× P (A succeeds, B perfect | pfdA = pA, pnpB = pB)
Assume, conservatively, that if A fails and B is imperfect, then
B will fail on the same demand
≤ 1 × P (A fails, B imperfect | pfdA = pA, pnpB = pB) + 0 + 0 + 0
John Rushby, SR I Reliability of Monitored Systems 21

Aleatory Uncertainty for 1oo2 Architectures (ctd.)
P (A fails, B imperfect | pfdA = pA, pnpB = pB)
= P (A fails |B imperfect, pfdA = pA, pnpB = pB)
× P (B imperfect | pfdA = pA, pnpB = pB)
(Im)perfection of B tells us nothing about the failure of A on
this demand; hence,
= P (A fails | pfdA = pA, pnpB = pB)
× P (B imperfect | pfdA = pA, pnpB = pB)
= pA × pB
Compare with two (un)reliable channels, where failure of B on
this demand does increase likelihood A will fail on same demand
P (A fails |B fails, pfdA = pA, pfdB = pB)
≥ P (A fails | pfdA = pA, pfdB = pB)
John Rushby, SR I Reliability of Monitored Systems 22

Aleatory Uncertainty for 1oo2 Architectures (ctd. 2)
I could have factored the conditional probability involving the
perfect channel the other way around:
P (A fails, B imperfect | pfdA = pA, pnpB = pB)
= P (B imperfect |A fails, pfdA = pA, pnpB = pB)
× P (A fails | pfdA = pA, pnpB = pB)
You might say knowledge that A has failed should affect my
estimate of B’s imperfection, but we are dealing with aleatory
uncertainty where these probabilities are known; hence
= P (B imperfect | pfdA = pA, pnpB = pB)
× P (A fails | pfdA = pA, pnpB = pB)
= pB × pA as before
Note: the claim must be perfection, other global properties
(e.g., proven correct) are not aleatory (they are reducible)
John Rushby, SR I Reliability of Monitored Systems 23
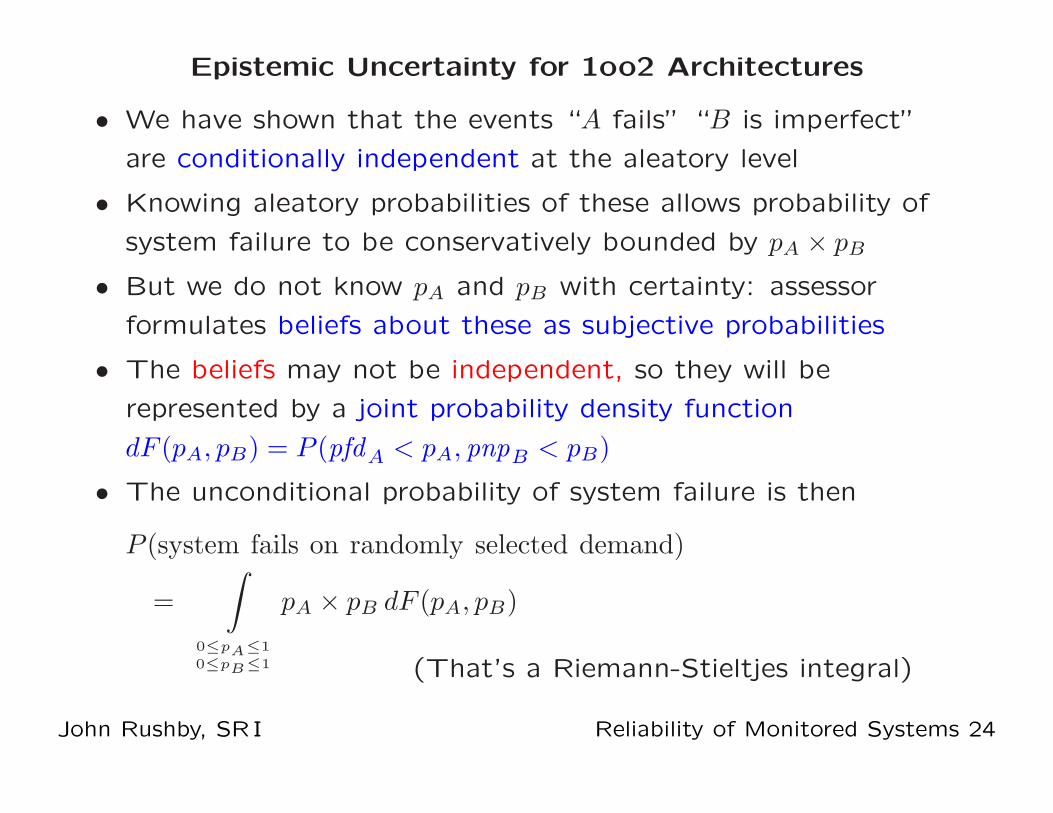
Epistemic Uncertainty for 1oo2 Architectures
• We have shown that the events “A fails” “B is imperfect”
are conditionally independent at the aleatory level
• Knowing aleatory probabilities of these allows probability of
system failure to be conservatively bounded by pA × pB
• But we do not know pA and pB with certainty: assessor
formulates beliefs about these as subjective probabilities
• The beliefs may not be independent, so they will be
represented by a joint probability density function
dF (pA, pB) = P (pfdA < pA, pnpB < pB)
• The unconditional probability of system failure is then
P (system fails on randomly selected demand)
=
∫
0≤pA≤1
0≤pB≤1
pA × pB dF (pA, pB)
(That’s a Riemann-Stieltjes integral)
John Rushby, SR I Reliability of Monitored Systems 24

Reliability Estimate for 1oo2 Architectures
• The only source of dependence is in the assessor’s bivariate
density function dF (pA, pB)
• But it is really hard to elicit such bivariate beliefs
• What stops beliefs about the two parameters being
independent?
• It’s not difficulty variation over the demand space
◦ Formal verification is uniformly credible
• Surely, it’s concern about common-cause errors such as
misunderstood requirements, common mechanisms, etc.
• So combine all beliefs about common-cause faults in a third
parameter C
◦ Place probability mass C at point (1, 1) in (pA, pB)-plane
as subjective probability for such common faults
John Rushby, SR I Reliability of Monitored Systems 25

Reliability Estimate for 1oo2 Architectures (ctd.)
• With probability C, A will fail with certainty, and B will be
imperfect with certainty (and conservatively assumed to fail)
• If assessor believes all dependence between his beliefs about
the model parameters has been captured conservatively in C,
the conditional distribution factorizes, so
P (system fails on randomly selected demand)
= C + (1 − C) ×
∫
0≤pA<1
pA dF (pA) ×
∫
0≤pB<1
pB dF (pB)
= C + (1 − C) × P ∗A × P ∗
B
where P ∗A and P ∗
B are the means of the marginal distributions
excluding (1, 1)
John Rushby, SR I Reliability of Monitored Systems 26
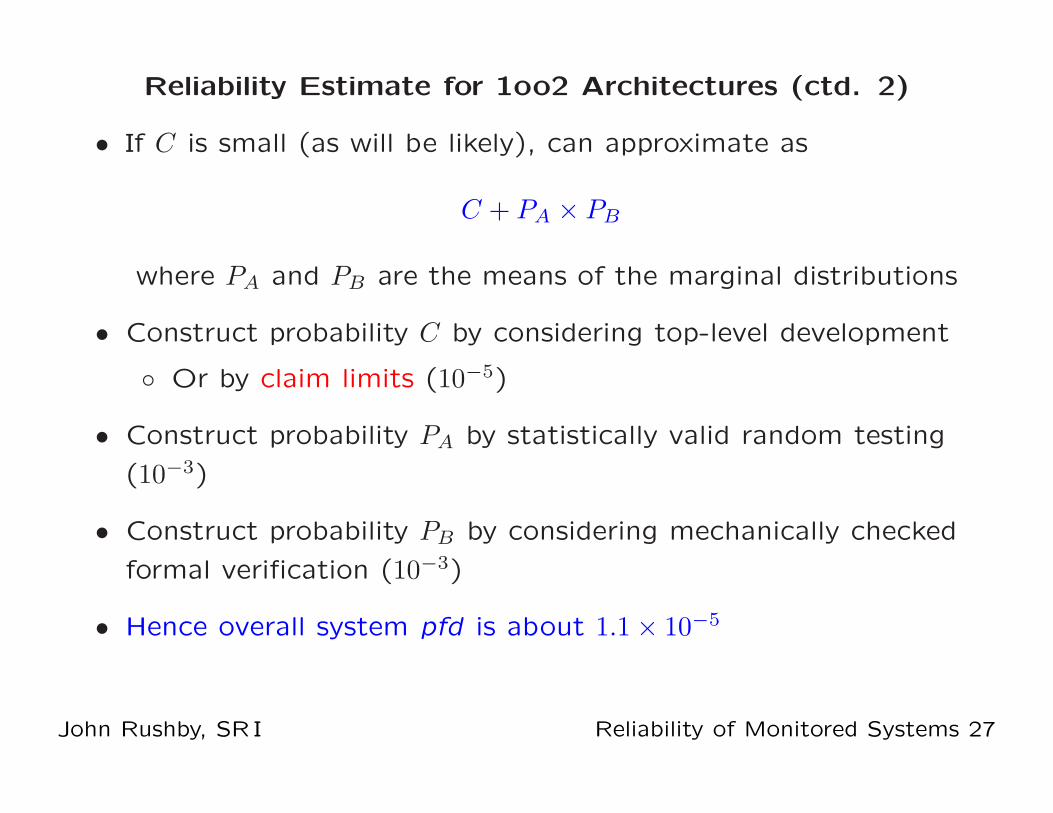
Reliability Estimate for 1oo2 Architectures (ctd. 2)
• If C is small (as will be likely), can approximate as
C + PA × PB
where PA and PB are the means of the marginal distributions
• Construct probability C by considering top-level development
◦ Or by claim limits (10−5)
• Construct probability PA by statistically valid random testing
(10−3)
• Construct probability PB by considering mechanically checked
formal verification (10−3)
• Hence overall system pfd is about 1.1 × 10⁻⁵
John Rushby, SR I Reliability of Monitored Systems 27

Type 1 and Type 2 Failures in 1oo2 Systems
• So far, considered only failures of omission
◦ Type 1 failure: both channels fail to respond to a demand
• Must also consider failures of commission
◦ Type 2 failure: either channel responds to a nondemand
• Demands are events at a point in time; nondemands are
absence of demands over an interval of time
• So full model must unify these
• Details straightforward but lengthy
John Rushby, SR I Reliability of Monitored Systems 28

Monitored Architectures
• One operational channel does the business
• Simpler monitor channel can shut it down if things look bad
• Used in airplanes
• Analysis is a variant of 1oo2:
◦ No Type 2 failures for operational channel
• Monitored architecture risk per unit time
≤ c1 × (M1 + FA × PB1) + c2 × (M2 + FB2|np × PB2)
where the Ms are due to mechanism shared between channels
• May provide justification for some of the architectures
suggested in ARP 4754
◦ e.g., 10−9 system made of Level C operational channel
and Level A monitor
John Rushby, SR I Reliability of Monitored Systems 29

Monitors Do Fail
• Fuel emergency on Airbus A340-642, G-VATL,
8 February 2005
◦ Type 1 failure
• EFIS Reboot during spin recovery on Airbus A300 (American
Airlines Flight 903), 12 May 1997
◦ Type 2 failure
• Current proposals are for formally synthesized/verified
monitors for properties in the safety case
John Rushby, SR I Reliability of Monitored Systems 30

Conclusion
• Probability of perfection is a radical and valuable idea
◦ It’s due to Bev Littlewood, and Lorenzo Strigini
• Provides the bridge between correctness-based verification
activities and probabilistic claims needed at the system level
• Explains what software assurance is
• Asymmetric 1oo2 systems, and monitored systems are
plausible ways to achieve high reliability
• With a possibly perfect channel they also provide a credible
way to assess it
• Risk of failures of commission (false alarms) requires careful
consideration and engineering: for formal monitors, focus
should be on choice of monitored properties
John Rushby, SR I Reliability of Monitored Systems 31