johnathan bowles
TRANSCRIPT

MARCH 6, 2015
NYC’s URBAN FUTURE
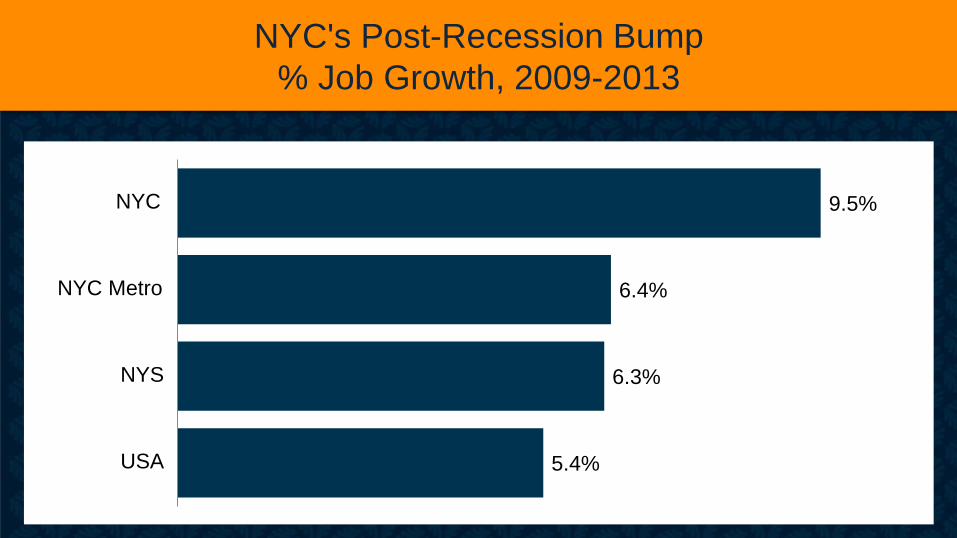
NYC's Post-Recession Bump
% Job Growth, 2009-2013
5.4%
6.3%
6.4%
9.5%
USA
NYS
NYC Metro
NYC

Sectors Slowing Down
% Job Growth 2003-2013
-0.6%
-6.3%
-14.7%
Finance and Insurance
Legal Services
Publishing Industries (except Internet)
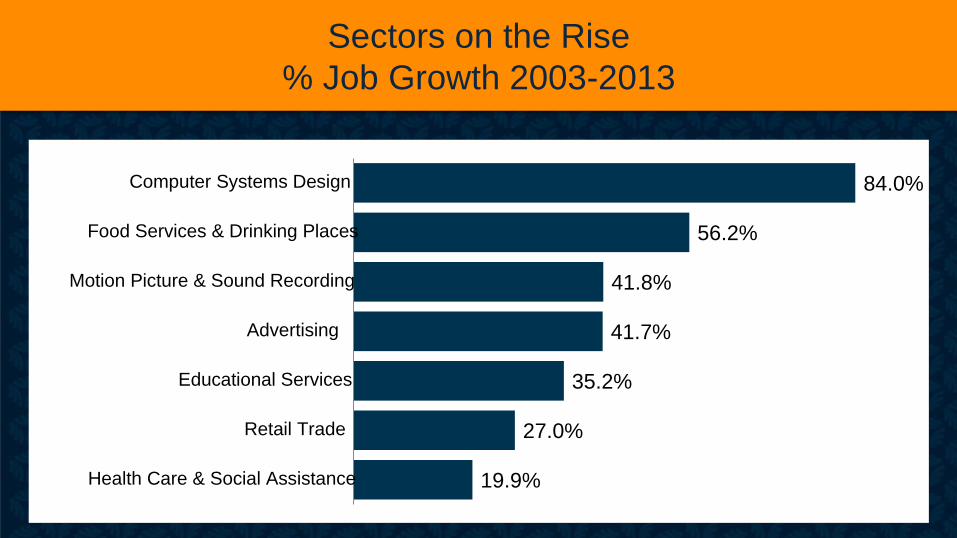
Sectors on the Rise
% Job Growth 2003-2013
19.9%
27.0%
35.2%
41.7%
41.8%
56.2%
84.0%
Health Care & Social Assistance
Retail Trade
Educational Services
Advertising
Motion Picture & Sound Recording
Food Services & Drinking Places
Computer Systems Design
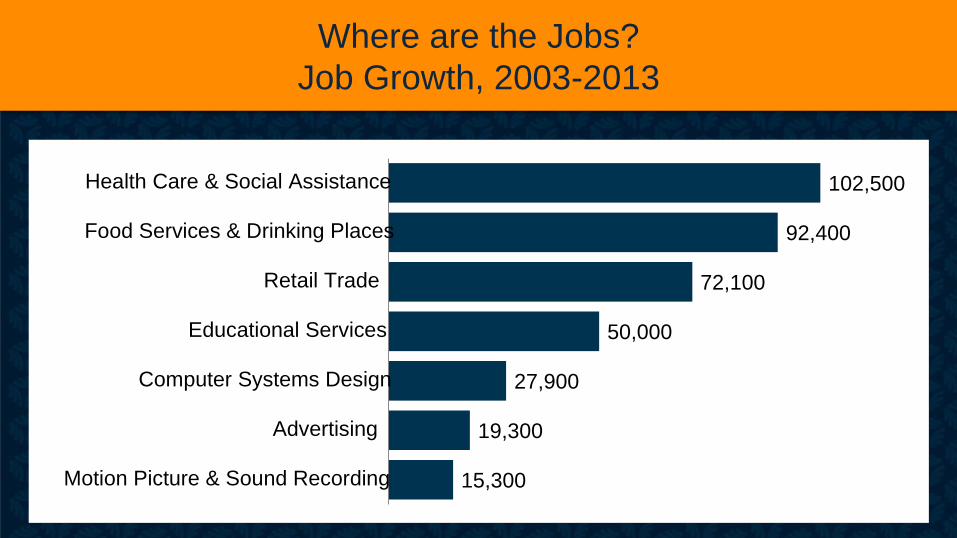
Where are the Jobs?
Job Growth, 2003-2013
15,300
19,300
27,900
50,000
72,100
92,400
102,500
Motion Picture & Sound Recording
Advertising
Computer Systems Design
Educational Services
Retail Trade
Food Services & Drinking Places
Health Care & Social Assistance
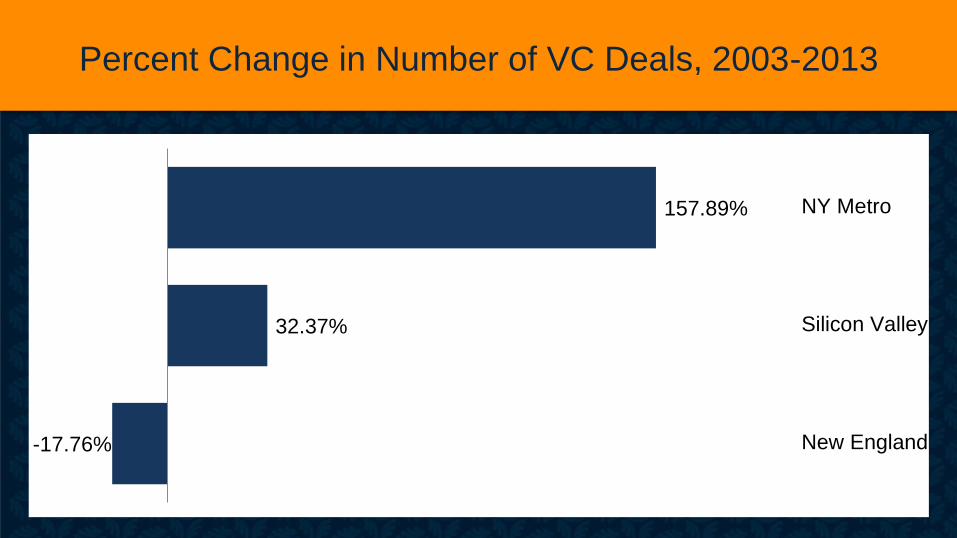
Percent Change in Number of VC Deals, 2003-2013
-17.76%
32.37%
157.89%
New England
Silicon Valley
NY Metro
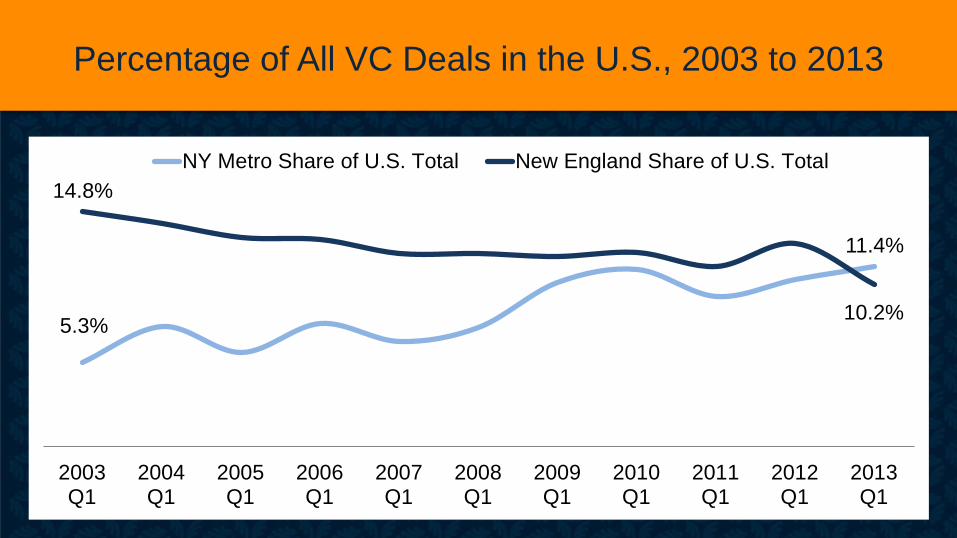
Percentage of All VC Deals in the U.S., 2003 to 2013
5.3%
11.4%
14.8%
10.2%
2003Q1
2004Q1
2005Q1
2006Q1
2007Q1
2008Q1
2009Q1
2010Q1
2011Q1
2012Q1
2013Q1
NY Metro Share of U.S. Total New England Share of U.S. Total
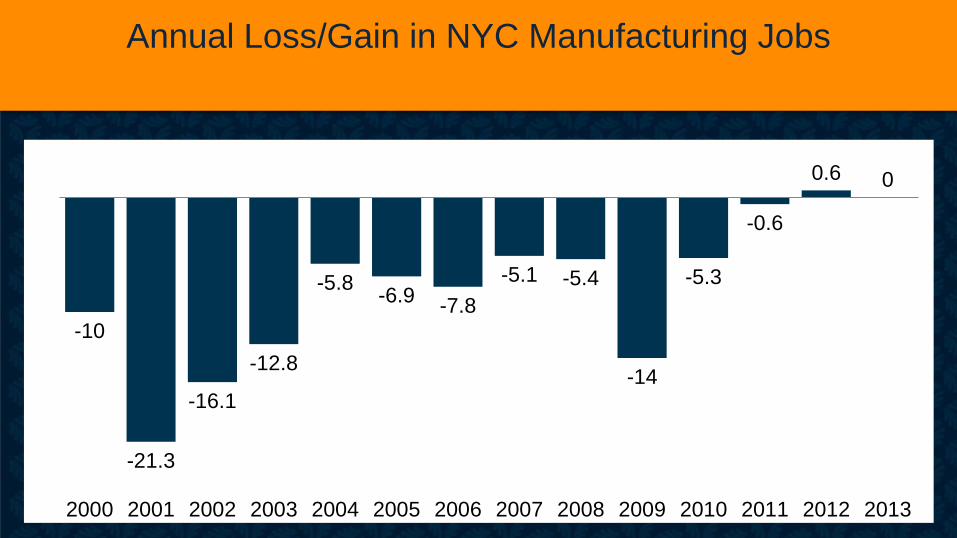
Annual Loss/Gain in NYC Manufacturing Jobs
-10
-21.3
-16.1
-12.8
-5.8 -6.9
-7.8
-5.1 -5.4
-14
-5.3
-0.6
0.6 0
2000 2001 2002 2003 2004 2005 2006 2007 2008 2009 2010 2011 2012 2013
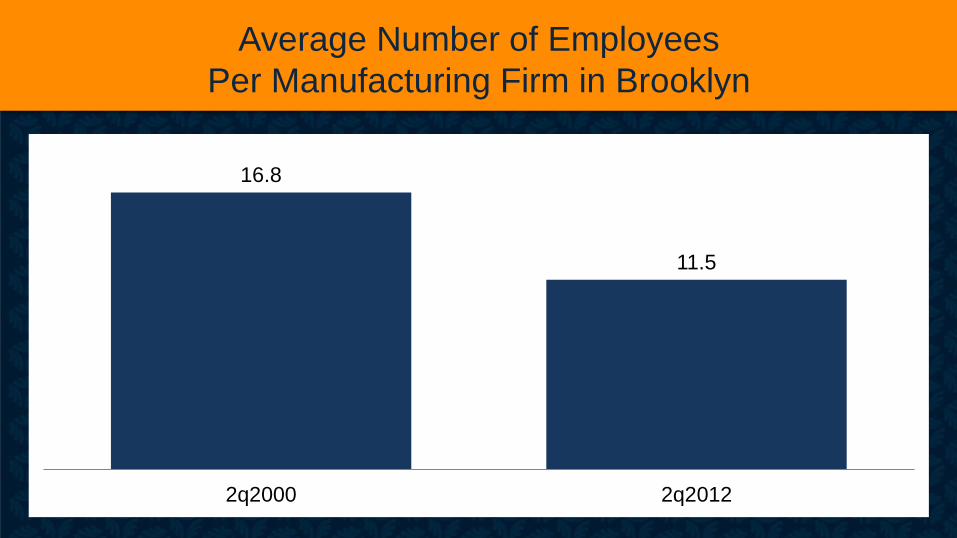
Average Number of Employees
Per Manufacturing Firm in Brooklyn
16.8
11.5
2q2000 2q2012
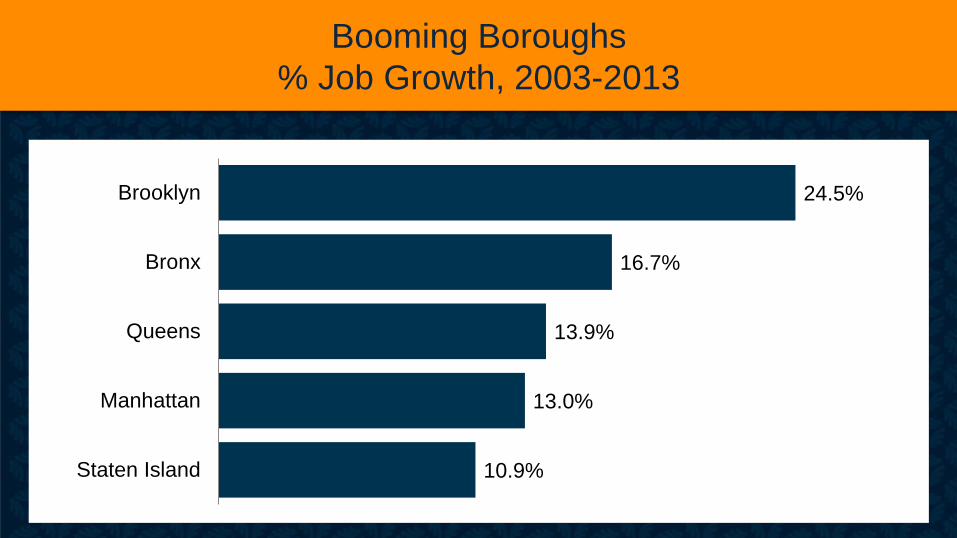
Booming Boroughs
% Job Growth, 2003-2013
10.9%
13.0%
13.9%
16.7%
24.5%
Staten Island
Manhattan
Queens
Bronx
Brooklyn
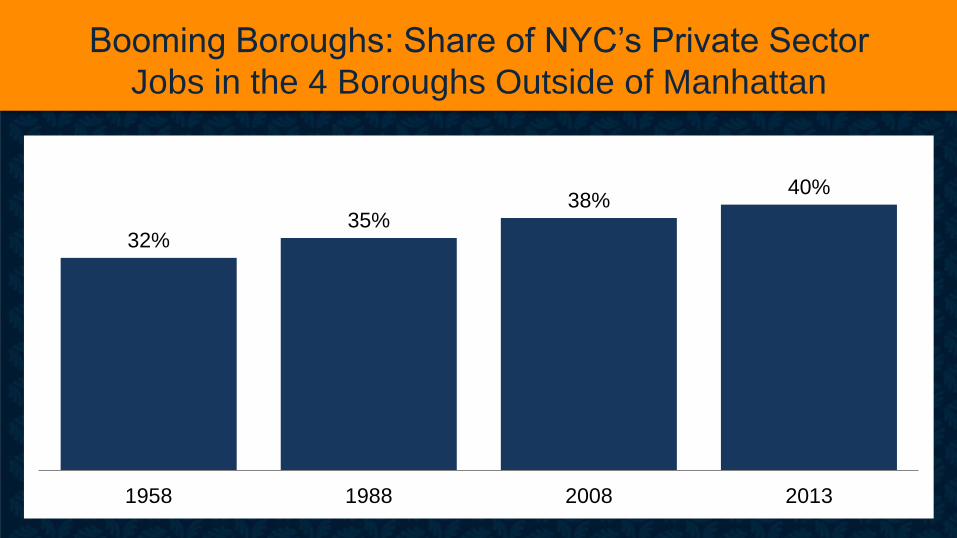
Booming Boroughs: Share of NYC’s Private Sector
Jobs in the 4 Boroughs Outside of Manhattan
32% 35%
38% 40%
1958 1988 2008 2013
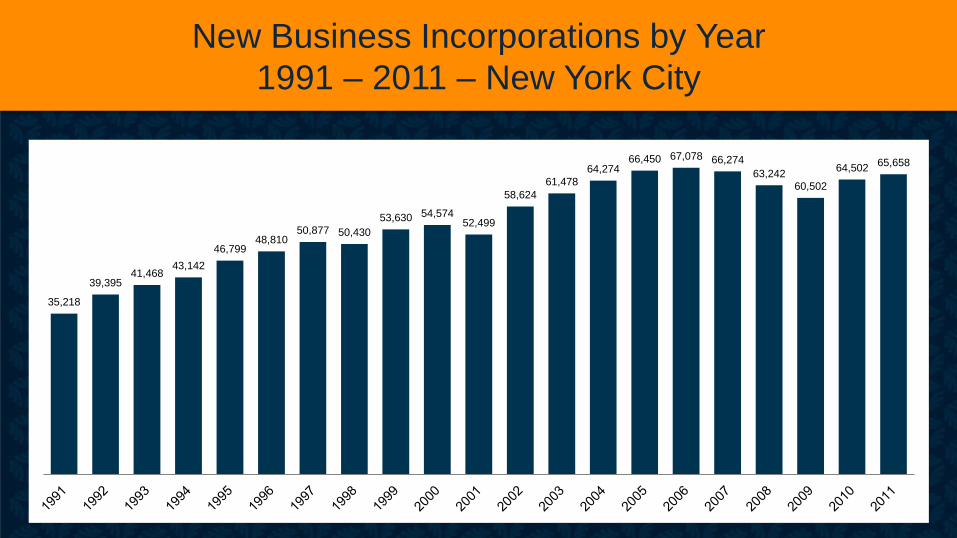
New Business Incorporations by Year
1991 – 2011 – New York City
35,218
39,395 41,468
43,142
46,799 48,810
50,877 50,430
53,630 54,574 52,499
58,624
61,478
64,274 66,450 67,078 66,274
63,242
60,502
64,502 65,658
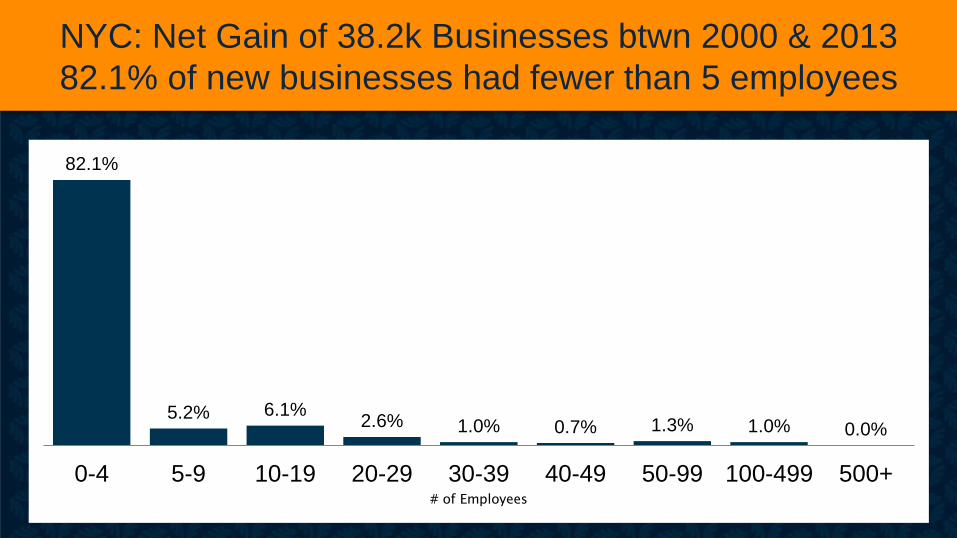
NYC: Net Gain of 38.2k Businesses btwn 2000 & 2013
82.1% of new businesses had fewer than 5 employees
82.1%
5.2% 6.1% 2.6% 1.0% 0.7% 1.3% 1.0% 0.0%
0-4 5-9 10-19 20-29 30-39 40-49 50-99 100-499 500+# of Employees
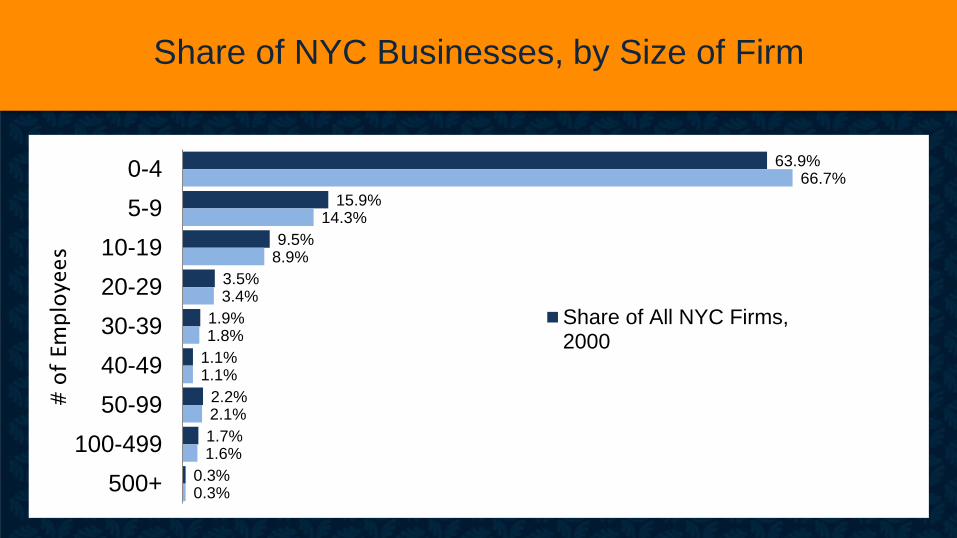
Share of NYC Businesses, by Size of Firm
63.9%
15.9%
9.5%
3.5%
1.9%
1.1%
2.2%
1.7%
0.3%
66.7%
14.3%
8.9%
3.4%
1.8%
1.1%
2.1%
1.6%
0.3%
0-4
5-9
10-19
20-29
30-39
40-49
50-99
100-499
500+
# of Em
ployees
Share of All NYC Firms,2000
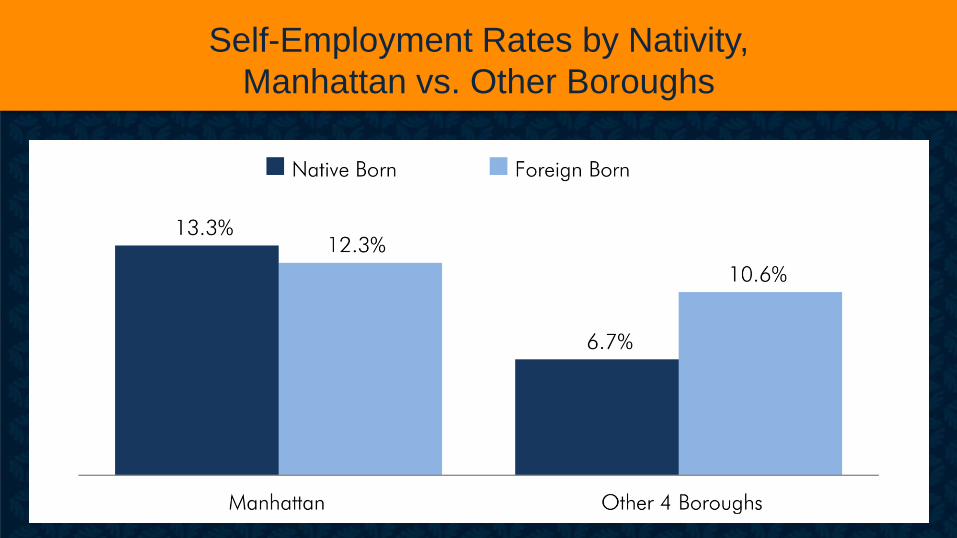
Self-Employment Rates by Nativity,
Manhattan vs. Other Boroughs
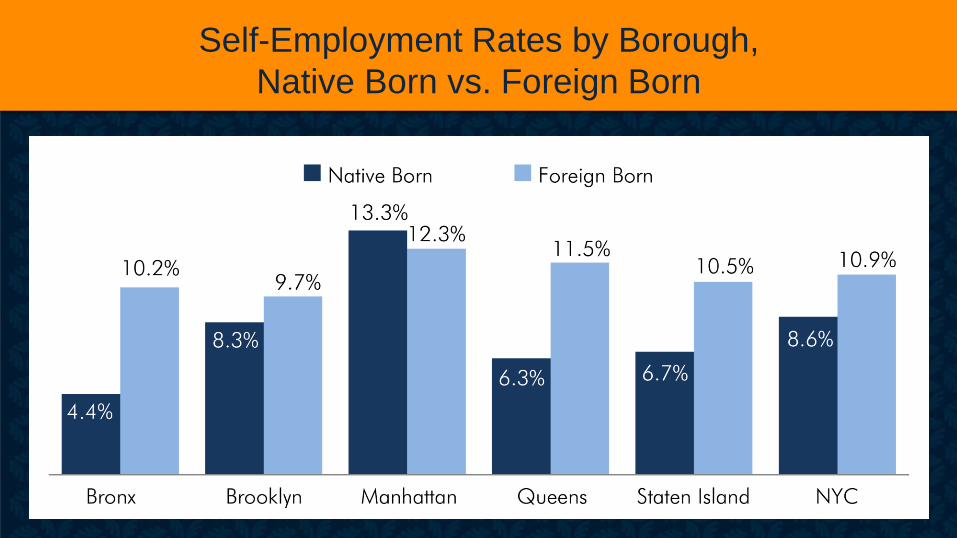
Self-Employment Rates by Borough,
Native Born vs. Foreign Born
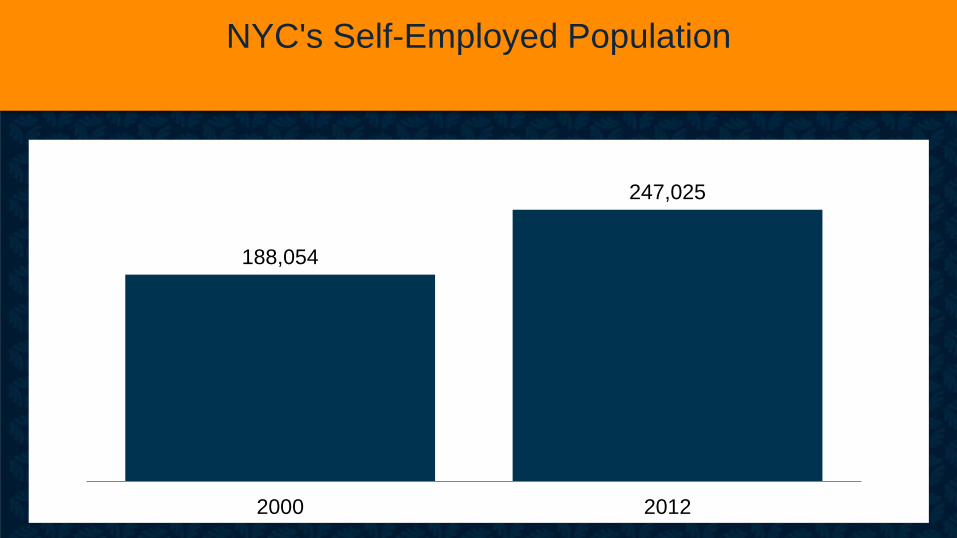
NYC's Self-Employed Population
188,054
247,025
2000 2012
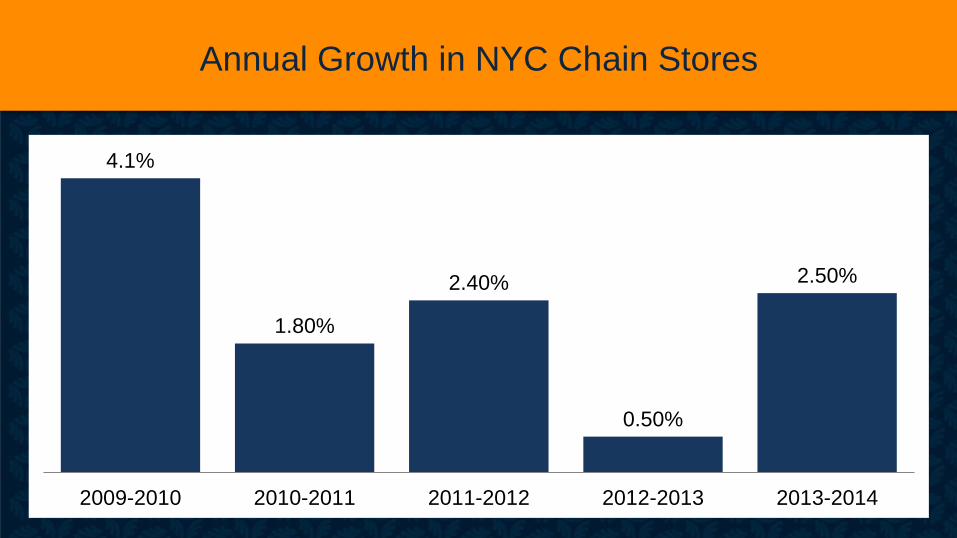
Annual Growth in NYC Chain Stores
2.50%
0.50%
2.40%
1.80%
4.1%
2013-20142012-20132011-20122010-20112009-2010
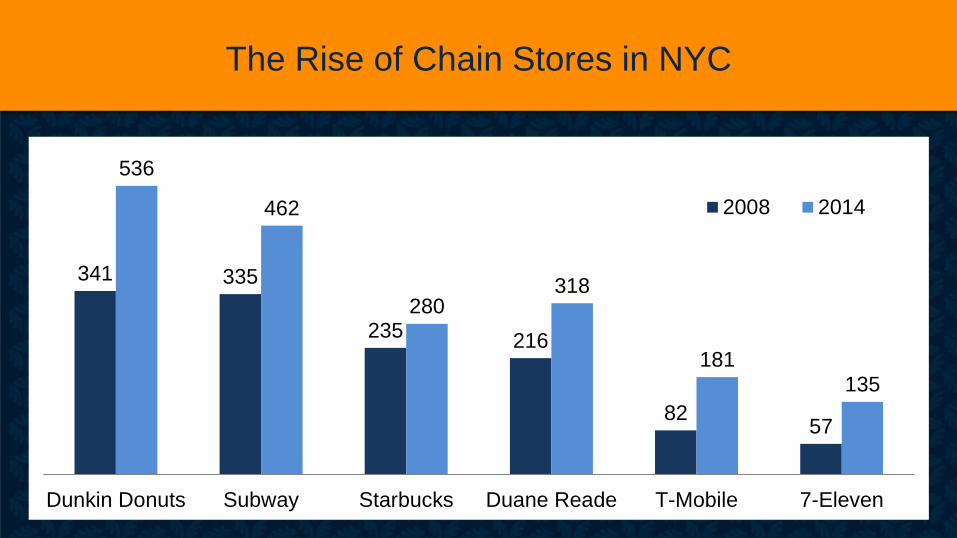
The Rise of Chain Stores in NYC
341 335
235 216
82 57
536
462
280 318
181 135
Dunkin Donuts Subway Starbucks Duane Reade T-Mobile 7-Eleven
2008 2014