johnson electric holdings limited annual report 2016
TRANSCRIPT

(Stock Code: 179)
Johnson Electric Holdings Limited
12 Science Park East Avenue, 6/F
Hong Kong Science Park
Shatin, New Territories
Hong Kong
Tel: (852) 2663 6688 Fax: (852) 2897 2054
www.johnsonelectric.com
Joh
nso
n E
lectric H
old
ing
s L
imited
A
nn
ual R
epo
rt 2016
Johnson Electric Holdings LimitedAnnual Report 2016

Providing motion solutions to2,500 CUSTOMERS
Generating Total Sales Revenue of US$2.2 BILLION
and Net Income of US$173 MILLION
Filing over 600 PATENT APPLICATIONS
Producing 2.4 MILLION MOTORS AND ACTUATORS PER DAY and 165 MILLION
SWITCHES PER YEAR
Operating in 24 COUNTRIES across 4 CONTINENTS
Employing 38,000 PEOPLE including over 1,500 ENGINEERS
2,500
38,000
1,500
Johnson Electric
in 2016
600
2.4M
165M

Contents
Johnson Electric at a Glance
Vision and Business Strategies
Letter to Shareholders
Management’s Discussion and Analysis
Corporate Governance Report
Report of the Directors
Final Dividend
Closing Register of Shareholders
Statement of Accounts
Johnson Electric Group Ten-Year Summary
Profile of Directors and Senior Management
Corporate and Shareholder Information
2
4
8
12
37
50
60
60
61
162
164
170

Johnson Electric: Innovating Motion since 1959
The Johnson Electric Group traces its origins to a
business founded in Hong Kong by Mr. and Mrs.
Wang Seng Liang in 1959 to manufacture small
electric motors for toys. The business has since
expanded its product range and geographic
presence to become a global leader in the supply
of precision motors, motion subsystems and
related electro-mechanical components to the
automotive industry and other industrial and
consumer product applications.
Johnson Electric Group presently employs 38,000
individuals in 24 countries spanning Asia, Europe,
the Middle East, North America and South
America. Johnson Electric Holdings Limited, the
Group’s parent company, is listed on The Stock
Exchange of Hong Kong.
Automotive Products Group
Johnson Electric develops and produces
subsystems for automotive applications that
require motors, actuators, pumps and related
components. We supply over 500 customers
spanning OEMs, Tier 1 and Tier 2 suppliers in the
automotive industry and our products can be found
in substantially all of the major passenger vehicle
brands in world.
Demand for our technology and motion solutions is
growing due to increasingly stringent regulations on
fuel emissions and fuel economy, as well as the
ongoing adoption by mid-range and compact car
models of the more advanced comfort and safety
features of luxury vehicles.
Johnson Electric’s automotive products include:
cooling fans for engine thermal management;
battery cooling fans for hybrid/electric vehicles;
electric power steering motors; electric parking
brake motors; headlamp actuators; grill shutter
actuators; window lift drives; sun-roof drives;
electric door lock motors and actuators; seat
adjust actuators; transmission and driveline
actuators; variable displacement oil pumps; motors
for turbo charger actuators; and engine
management motors, valves and actuators.
For vehicles in production today
and for the next generation of
conventional internal
combustion engine, hybrid and
all-electric vehicles under
development, the imperative is
for electro-mechanical
components to be energy
efficient, compact, lightweight
and yet capable of withstanding
extreme temperatures, shocks
and vibrations for the lifetime of
the car. Our ability to address
these technical challenges and
deliver reliable, cost-competitive
products to automotive
customers worldwide has made
Johnson Electric a recognised
leader in the market.
A global leader in the supply of precision motors,
motion subsystems and related electro-mechanical
components.
Johnson Electric
at a Glance
2Johnson Electric Holdings Limited

Total Group Sales
* Excluding discontinued businesses
2012 2013 2014 2015 2016
2,027 1,990 2,098 2,136 2,236US$ million
28%33%
39%
Sales by Destination
28%
72%
Sales by Operating Division
Automotive Products Group
Industry Products Group
Asia
Europe
Americas
Industry Products Group
Johnson Electric supplies advanced motion
solutions and electro-mechanical components to
approximately 2,000 industrial and commercial
customers whose products are found in a
remarkably diverse range of industrial,
professional and consumer application
segments.
The continuing proliferation of hardware devices
and equipment that contain electric motors,
solenoids, switches and other electro-mechanical
components reflects a rapidly changing world
where businesses and consumers are seeking
products that are more energy efficient, smaller,
lighter, more controllable and more connected
than ever before. Among the application segments
we serve are: heating and ventilation; electric and
gas metering; power tools; lawn and garden
equipment; white goods; small domestic
appliances; food and beverage dispensing
machines; window automation; printers and
business machines; medical devices; bank/SIM
cards; ATMs and Point of Sale equipment.
Many of the world’s leading branded goods
companies rely on Johnson Electric to solve their
most complex motion problems and at a
competitive total cost that enables them to be
successful in their markets.
3

Compact Gear Drives for Robotic Lawn MowersLow Noise HVAC Actuators
Core business strategies
Focusing on serving customers whose products are aligned to key underlying trends that drive long-term consumer demand – including the
imperatives to reduce emissions,
lower fuel consumption, improve
health and safety, and increase
mobility and controllability
Johnson Electric’s core business is the supply of
electro-mechanical motion systems and solutions
to customers who value innovation and reliability.
Within this defined market space, we target
segments where secular “mega trends”,
regulatory change or technology
advancements are driving demand.
Across a diverse range of industries
and geographies we seek to work
closely with our customers to
understand their customers’
requirements and key preferences.
Whether those requirements are for
better energy efficiency, a cleaner
environment, support for ageing
populations, improved security,
superior product functionality or ease
of use, Johnson Electric delivers.
Vision and Business Strategies
Examples of our market leading technology and
product innovations in these growth areas
include: a unique range of motor subsystems
that manage the flow of fuel, air and oil in
automotive engines; electric relays that can
remotely disconnect “smart” electricity meters;
insulin delivery devices that integrate a miniature
pump and motor; and a high precision shutter
system that operates silently inside military-
grade infrared cameras.
Investing in technology innovation to provide unique
motion solutions to customer
problems
Technology leadership and application-specific
know-how are the drivers that make Johnson
Electric a global leader in our industry. Over the
Johnson Electric’s Vision
To be the world’s definitive provider of innovative and reliable motion systems.
4Johnson Electric Holdings Limited

past two decades, the Group has evolved from
having a leading position in small precision
motors to building the broadest set of
engineered motor and motion system solutions
available in the market today – incorporating DC
& AC motors, stepper motors, actuators,
solenoids, switches, relays, precision gears,
powder metal components, pumps and flexible
printed interconnects.
At Johnson Electric, we are constantly challenging
our business managers and engineers to consider
how particular market segments are changing and
how these changes can offer new opportunities
for our innovative technology.
In some instances this can mean differentiating
our product offering using new technology (or a
combination of technologies) to provide a unique
motion solution to a customer’s problem. In doing
so, the ultimate objective is to help the customer
differentiate their products in the marketplace –
such as through lower energy consumption, lower
weight, lower noise, or higher performance. In
other situations, it can mean designing and
delivering a solution that offers lower total
transaction costs for a customer over their end-
product’s entire life-cycle.
Building a global manufacturing footprint that provides greater
customer responsiveness, improved
cost competitiveness, and reduced
exposure to foreign currency
volatility and single country risk
The key goals of Johnson Electric’s manufacturing
strategy are to be global, flexible and cost
competitive. In doing so, we aim to support our
customers by being close to where they are
operating and being able to ensure fast, reliable
supplies and highly responsive levels of service.
To execute this strategy, the Group is
progressively building out its operating footprint in
the three main geographic regions of Asia, the
Americas and Europe.
In addition to closer proximity to customers and
faster delivery times, the direct benefits of this
“in-region” manufacturing strategy include lower
freight costs and inventory levels; reduced
exposure to foreign exchange rate fluctuations;
and an overall diversification of the Group’s
operating risk by not being overly reliant on any
single country or factory.
Johnson Electric provides innovative solutions to over 70 different subsystems and component applications inside the latest passenger vehicles
5

Coolant Valve Actuators: regulating the temperature of the vehicle engine, transmission, batteries and cabin
Tough Seal™ Switches for Outdoor Products
Compact Seating Adjustment Motors
Implementing continuous efficiency improvements that
eliminate waste from all areas of
the business
Johnson Electric grew from humble beginnings as
a manufacturing enterprise by establishing simple
yet effective processes to make quality products
in the volumes required by our customers,
delivered when they need them, and in the most
cost-efficient manner.
Today, “Genba Kaizen” – shop-floor continuous
improvement – is a philosophy that we seek to
instill across all of our operations and business
functions around the world. Ongoing initiatives to
eliminate waste, improve quality and enhance the
effectiveness of our operations remain critical
foundations upon which Johnson Electric seeks to
create value over time.
As the size, scope and complexity of the
company’s operations have grown, we are also
making significant investments in advanced
automated manufacturing and in the
standardisation of product design. This reflects
the imperatives to ensure consistent quality of
output everywhere we do business; flawlessly
execute new product launches in high volumes
across multiple regions; and adapt our business
model to one where some of our more labour
intensive assembly processes are increasingly
performed by more capital intensive automation.
6Johnson Electric Holdings Limited

In October 2015, Johnson Electric completed the acquisition of Stackpole International, a leading
global manufacturer of highly-engineered engine and transmission pumps and powder metal
components, primarily for automotive applications. Its blue-chip customer base is comprised mainly
of the world’s leading automotive original equipment manufacturers and their Tier 1 suppliers.
Stackpole International is headquartered in Ontario, Canada. It traces its own origins to 1906,
when Harry Stackpole and James Hall founded a business manufacturing dry cell batteries in
Pennsylvania, USA. Over time the company expanded its scope of operations to include powder
metal components and engineered products for the automotive industry. Today Stackpole employs
over 2,000 individuals across a global operating footprint that includes nine manufacturing facilities
located in North America, Europe and Asia, including two facilities owned by Halla-Stackpole
Corporation, a joint venture in Korea and China which is 30% owned by Stackpole International.
Acquisition of Stackpole International
Making selective acquisitions
that bring complementary
technologies to the Group and
strengthen our position in key
markets
In addition to capital investments in the business,
Johnson Electric actively evaluates potential
acquisitions that can add value to the Group.
Among the characteristics that we look for in
determining the attractiveness of acquisition
candidates are complementary technology; end-
market applications with favourable growth
prospects; strong customer relationships; and
cultural fit with Johnson Electric.
Over the past two decades, we have completed
more than a dozen acquisitions of complementary
businesses which have been successfully
integrated into our core business.
Developing and retaining a diverse and talented team of people who are committed to
making our customers successful
and to growing a world-class
company that can share in that
success
We believe that to maintain Johnson Electric’s
competitive edge we must select, attract and
retain talented and motivated employees from a
diverse range of backgrounds. To succeed
requires more than ensuring competitive
compensation, benefit and incentive structures. It
means implementing a range of talent
management programs designed to match the
right people to the right jobs; and offering our
employees rewarding work at different phases of
their careers.
7

Annual Report 2016
Letter to Shareholders
Johnson Electric’s results for the financial year 2015/16 reflected a
difficult macro-economic environment, unfavourable foreign exchange rate
movements and non-recurring acquisition transaction expenses. Although net
income, as previously projected, declined from last year’s record levels, the
underlying operating performance of the business remained solid and our
financial condition continues to be healthy.
Highlights of 2015/16 Results
• For the financial year ended 31 March 2016, total sales amounted to
US$2,236 million – an increase of 5% compared to the prior financial
year. Excluding the effects of acquisition and foreign currency movements,
underlying sales increased by 2%
• EBITDA totalled US$322 million – a decline of 4%
• Operating profits decreased by 15% to US$207 million. Excluding non-
recurring acquisition transaction costs, operating profits decreased by
10% to US$220 million or 9.8% of sales
• Net profit attributable to shareholders totalled US$173 million – down
18%. Underlying net profit, excluding the effect of acquisitions, declined
by 15% to US$180 million
• Basic earnings per share were 20.09 US cents (FY2014/15: 24.11 US
cents)
• As of 31 March 2016, cash reserves amounted to US$193 million and
the Group’s total debt to capital (total equity + total debt) ratio was 18%
Dividends
The interim dividend paid in January 2016 increased by 7% compared to the prior year to 15 HK cents per
share. For the final dividend, taking into account the uncertain prevailing operating environment, the Board
considers it prudent to recommend maintaining the prior year’s figure of 34 HK cents per share.
Sales Performance
The sales performance of the Group during the year was rather mixed and, as in recent prior years, was
negatively impacted by the strength of the US Dollar compared to a number of foreign currencies in which
Johnson Electric derives a portion of its sales, notably the Euro, the RMB and – subsequent to the
acquisition of Stackpole International – the Canadian Dollar.
8Johnson Electric Holdings Limited

Total Group sales amounted to US$2,236 million, an increase of 5% compared to the prior financial year.
This figure included five months sales contribution from Stackpole International totalling US$182 million.
Excluding that acquisition and the impact of foreign exchange rate movements, which negatively affected
sales on translation by US$117 million, underlying total sales increased by 2%.
The Automotive Products Group (“APG”), the largest operating division, achieved sales of US$1,605
million including Stackpole International. Excluding the acquisition and currency movements, APG’s sales
increased by 5% – a creditable performance in the context of a weak global economy.
APG achieved solid sales growth in constant currency terms in each of the three major geographic regions.
In Europe, where passenger car sales volumes reached a six-year high in 2015, we experienced strong
demand for our market leading technology in engine and transmission management applications and in
headlamp and HVAC actuators. In Asia, APG continues to perform particularly well in the powertrain
cooling fan module segment despite the recent slowdown in demand growth in China. And in North
America, which prior to the acquisition of Stackpole International, has been APG’s smallest market in
terms of direct sales, our actuator systems business unit was also a standout performer.
9
Patrick Shui-Chung Wang JPChairman and Chief Executive

Annual Report 2016
The Industry Products Group (“IPG”) reported a 7% decrease in sales (down 5% in constant currency
terms) to US$631 million. This disappointing result reversed a trend of modestly improving sales seen in
the prior year and reflected intense price competition in lower-end motor product applications and
generally lack-lustre demand in many industrial and consumer markets. As a consequence, management
and organisational changes have been implemented in IPG with the intention of reducing costs and
focusing resources on market segments where Johnson Electric is advantaged through differentiated
motion subsystems technology.
Resilient Profitability and Sustained Balance Sheet Strength
On the cost side, the business benefited from lower raw material expenses and significant productivity
improvements. However, these were more than offset by higher wage rates and the effects of reduced
sales revenue on translation into US Dollars set against relatively fixed production and administrative
overheads. The ongoing investment in building out our manufacturing footprint in Mexico and Eastern
Europe is also acting as a drag on near term profitability. And lastly, operating profits were reduced by
higher amortisation of intangibles and US$12.4 million in non-recurring transaction expenses related to
recent and pending acquisitions.
The Group’s use of forward foreign currency contracts in the normal course of business along with higher
Other Income & Gains helped to mitigate some of the negative impact of the above factors. As a result,
operating profit was US$207 million or 9.3% of sales (9.8% of sales excluding non-recurring transaction
expenses).
Johnson Electric’s overall financial condition remains strong. As of 31 March 2016, cash reserves
amounted to US$193 million and the total debt to capital ratio was 18%.
New Acquisitions Set to Accelerate Growth
During the year, Johnson Electric undertook two significant strategic initiatives to expand the scope of the
business which are set to strengthen further our competitive position and our growth prospects.
In October 2015, the Group completed the acquisition of Stackpole International, a leading manufacturer
of highly-engineered automotive engine and transmission pumps and powder metal components. Improving
fuel economy and reducing emissions are pivotal drivers of automotive technology today – and Johnson
Electric is a market leader in supplying key motion subsystems to support these imperatives. The addition
of Stackpole’s pumps technology and powder metal expertise is an excellent fit that will enable the Group
to provide integrated motorised pumps to customers in a rapidly growing market for electrically controlled
solutions. The acquisition also materially increases Johnson Electric’s overall exposure to the North
American economy with the effect that the Group’s total sales base is now essentially equally divided
between Asia, Europe and the Americas.
In February 2016, the Group announced that it had signed a binding offer to acquire AML Systems, a
leading supplier of active modules for vehicle headlamp systems. AML’s strength in headlamp levellers
perfectly complements Johnson Electric’s strength in headlamp actuators and the combined business is
set to be a world leader in a growing market segment driven by demand for lighting solutions that improve
10Johnson Electric Holdings Limited

LETTER TO SHAREHOLDERS
visibility and enhance safety for drivers and other road users. Following the receipt of customary regulatory
approvals, the acquisition of AML is expected to be completed in May 2016.
Outlook
In common with most global industrial manufacturing businesses, Johnson Electric is operating in a
challenging macro-economic environment featuring GDP growth rates well below the levels experienced in
the years immediately preceding the 2008/09 financial crisis. Although unemployment in a number of
economies has fallen recently and consumers are beginning to spend more, it remains difficult to be
optimistic about the prospects for a sustained uptick in overall demand. Not only are essentially all of the
world’s largest economies continuing to experiment, in one form or another, with quite unconventional
monetary policies aimed at stimulating growth, we are also entering a period of potentially high political
instability in several important countries. In such circumstances, much-needed structural economic
reforms seem likely to be postponed.
Despite the rather gloomy macro-economic picture, I do see reasonable grounds to be upbeat about
Johnson Electric’s own growth trajectory. In the short term, we can expect to see the Company’s revenue
and earnings base in the 2016/17 financial year benefit from a full year contribution from Stackpole
International and approximately ten months of contribution from AML Systems – and without the level of
acquisition-specific transaction expenses incurred in the year under review.
In the medium term, we are winning major new product program awards, especially with large automotive
OEM and Tier 1 customers, which in this industry can typically take between two to five years before sales
ramp up to full production volumes. In IPG, we are also moving to enter into longer term supply
agreements with some customers based on our ability to offer innovative new technology and a genuinely
global manufacturing capability.
As always in business, we need to adapt and evolve in order to prosper. The product mix and price paths
of much of the new business we are booking will require changes to our business model to ensure we
deliver what our customers need in terms of cost competitiveness and what our shareholders expect in
terms of profitability. This will require more standardisation and automation in our production processes,
further investments in infrastructure to support multiple new product launches across multiple
geographies, and renewed focus on right-sizing and reducing overheads. Getting these strategic
imperatives right is essential to the Group’s long term success – and our Board and management team
are committed to making it happen.
On behalf of the Board, I would like to sincerely thank our customers, employees, suppliers, and
shareholders for their continued support.
Patrick Shui-Chung Wang JP
Chairman and Chief Executive
Hong Kong, 17 May 2016
11

12Johnson Electric Holdings Limited
Annual Report 2016
MANAGEMENT’S DISCUSSION AND ANALYSIS
FINANCIAL PERFORMANCEUS$ million FY2015/16 1 FY2014/15
Sales 2,235.9 2,136.1
Gross profit 589.5 632.4
Gross margin 26.4% 29.6%
Profit attributable to shareholders 172.7 210.9
Diluted earnings per share (US cents) 19.75 23.60
EBITDA 2 334.3 335.5
EBITDA margin 15.0% 15.7%
EBITDA 2 adjusted to include 12 months of Stackpole
on a pro forma basis 369.6 N/A
Free cash flow from operations 3 70.8 155.8
US$ million 31 Mar 2016 31 Mar 2015
Cash 193.3 773.2
Total debt 4 422.5 291.3
Net (debt) / cash (cash less total debt) (229.2) 481.9
Total equity 1,884.8 1,900.9
Market capitalisation 5 2,643.3 3,032.5
Enterprise value 6 2,914.7 2,589.3
Enterprise value to EBITDA 7 7.9 7.7
Credit Quality – Financial Ratios 31 Mar 2016 31 Mar 2015
Total debt to EBITDA 7 1.1 0.9
Total debt to capital (total equity + total debt) 18% 13%
1 Includes 5 months results of Stackpole International
2 Earnings before interest, tax, depreciation and amortisation, excluding nonrecurring acquisition transaction costs of US$12.4
million
3 Net cash generated from operating activities plus net interest received, less capital expenditure (net of proceeds from disposal of
fixed assets) and capitalisation of engineering development costs
4 Total debt calculated as borrowings plus convertible bonds
5 Outstanding number of shares multiplied by the closing share price (HK$23.95 per share as of 31 March 2016 and HK$27.30 per
share as of 31 March 2015) converted to USD at the closing exchange rate
6 Enterprise value calculated as market capitalisation plus non-controlling interests plus total debt less cash
7 Calculated using EBITDA adjusted to include 12 months of Stackpole International on a pro forma basis

13
MANAGEMENT’S DISCUSSION AND ANALYSIS
• Sales, as reported, up 5% from the prior year with the acquisition of Stackpole International. Excluding currency movements and acquired business, sales increased 2% (Automotive Products Group, 5% increase; Industry Products Group, 5% decrease).
• Gross margin decreased to 26.4%, due to wage and salary inflation, especially in China and the significant weakening of the Euro against the US Dollar.
• Acquired the Stackpole International group of companies in October 2015 for consideration of about US$676 million (C$800 million enterprise value plus other considerations), largely funded from the Group’s cash reserves.
• Binding offer made in February 2016 to acquire AML Systems for EUR65 million in cash. This transaction is expected to close in May 2016, subject to customary conditions including obtaining applicable regulatory approvals.
• Inaugurated second plant in Zacatecas, Mexico and significantly expanded our plant in Niš, Serbia.
• Total debt to capital ratio was 18% and total debt to EBITDA as adjusted to include 12 months of Stackpole International was 1.1 as of 31 March 2016.
BUSINESS REVIEW
Johnson Electric’s Operating Model
Johnson Electric is one of the world’s largest providers of motion subsystems, with a global customer
base and a flexible, responsive operating footprint. Manufacturing facilities in eighteen countries on
four continents provide an annual production capacity of over one billion units.
The Group constantly pursues technology leadership in its chief markets. From its innovation and
product design centres, the business continuously adds new solutions to its range of motors,
solenoids, actuators, micro-switches, flexible printed circuits and microelectronics product platforms.
These can be standardised for mass-production or tailored to meet the needs of strategic segments
and key accounts.
Johnson Electric’s operations share many commonalities including advanced technologies,
manufacturing processes, vertical integration (with the majority of components manufactured
in-house), supply chain, brands, distribution channels and program management.
These factors create opportunities for growth, by leveraging the strength of the Group’s core
competences and for cost efficiencies through the sharing of resources and continuous improvement
of standardised methods and processes.
On 27 October 2015, the Group acquired Stackpole International, a leading supplier of engine and
transmission pumps and powder metal components primarily to automotive OEMs. Stackpole’s
proficiency in pumps, combined with JE’s motion subsystem expertise and global presence, provides
the Group with a unique opportunity to design and deliver integrated motorised pump solutions for its
automotive customers. Additionally, Stackpole’s powder metal know-how will be utilised across the
Group’s businesses.

14Johnson Electric Holdings Limited
Annual Report 2016
Sales Review
Group sales in FY2015/16 were US$2,235.9 million, an increase of US$99.8 million, 5%, compared
to US$2,136.1 million for FY2014/15. Excluding currency movements, sales increased by US$216.8
million, 10%, compared to FY2014/15, as shown below:
US$ million FY2015/16 FY2014/15 Change
Automotive Products Group (“APG”) sales– Excluding acquisition and currency
movements1,524.8 65% 1,457.5 68% 67.3 5%
– Acquired business 181.8 8% – 181.8
– Subtotal 1,706.6 73% 1,457.5 249.1 17%– Currency movements (101.7) n/a (101.7)
APG sales, as reported 1,604.9 1,457.5 147.4 10%
Industry Products Group (“IPG”) sales– Excluding currency movements 646.3 27% 678.6 32% (32.3) (5%)– Currency movements (15.3) n/a (15.3)
IPG sales, as reported 631.0 678.6 (47.6) (7%)
Group sales– Excluding acquisition and currency
movements2,171.1 92% 2,136.1 100% 35.0 2%
– Acquired business 181.8 8% – 181.8
– Subtotal 2,352.9 100% 2,136.1 100% 216.8– Currency movements (117.0) n/a (117.0)
Group sales, as reported 2,235.9 2,136.1 99.8 5%
The drivers underlying these movements in sales are shown in the following chart:
FY2014/15Sales,
as reported
APG Volume / mixand price, net
IPG Volume / mixand price, net
Currencymovements
FY2015/16Sales,
excludingacquired business
AcquiredBusiness
FY2015/16Sales,
as reported
US$ million
67
(32)(117)
182
2,136 2,054 2,236
5%
Volume / mix and price, net, increased sales by US$35.0 million. The underlying changes in the sales
of the Automotive Products Group and Industry Products Group are discussed on pages 15 to 18.

15
MANAGEMENT’S DISCUSSION AND ANALYSIS
Acquisition of Stackpole International: In the 5 months since acquisition, Stackpole’s revenues
amounted to US$181.8 million. The addition of Stackpole’s automotive business is further discussed,
together with JE’s existing automotive business, on page 16.
Currency movements adversely impacted revenues by US$117.0 million compared to FY2014/15,
primarily due to the lower average rate for the Euro against the US Dollar in FY2015/16 (average rate
of 1.10) compared to the prior year (average rate of 1.27). The Group’s sales are largely denominated
in the US Dollar, the Euro, the Chinese Renminbi and the Canadian Dollar. See Note 34.4 to the
accounts for all foreign currency translation rates.
Automotive Products Group
Through the combined effects of organic
business growth and the acquisition of
Stackpole, APG’s sales, excluding currency
movements, grew by 17%.
All regions delivered organic growth (5% total:
Asia: 4%, Europe: 5%, Americas: 4%).
• In Asia, sales of products for powertrain
cooling systems, engine emissions control
and sunroof applications increased as
customer programs ramped up. The
business also benefited from increased
demand for products for braking
applications that meet increasingly
stringent safety requirements. These
increases were slightly offset by reduced
sales of products for fuel pump and seat
adjustment applications.
• In Europe, sales increased across a broad
range of products, especially for our
recently launched compact, power-efficient,
low-noise heating, ventilation and
air-conditioning (“HVAC”) actuators and
customised coolant valve actuators to
address the thermal management
requirements of the latest generation of
vehicle engines. We also benefited from
growth in our existing platforms for engine
air management.
• In the Americas, sales increased, led by HVAC and door lock due to the combined effects of
customer growth and the ramp-up of recently launched customer programs. These increases were
partially offset by reduced sales of products for power train cooling due to falling sales of new
vehicles in Brazil.
Yearly trend in sales
(excluding acquired business and currency movements)
APG sales growth/(decline)
Year ended Asia Europe Americas Total
31 March 2016 4% 5% 4% 5%
31 March 2015 12% 5% (8%) 4%
31 March 2014 4% 10% 1% 7%
31 March 2013 8% 5% 5% 6%
APG sales
at constant exchange rates
Change of 17%
AmericasEuropeAsiaStackpole
FY2014/15 FY2015/16
US$ million
258.1 269.6
717.0 752.8
482.4 502.4
181.8
1,457.5
1,706.6
+4%
+5%
+4%

16Johnson Electric Holdings Limited
Annual Report 2016
The Powertrain Cooling business including the “GATE” brand, primarily engaged in the manufacture
and sale of cooling fan modules for OEM and Tier 1 customers, accounted for 22% of the Group’s
sales as reported for FY2015/16 (FY2014/15, 25%). Sales for this business unit, excluding currency
movements, increased 2% in FY2015/16 compared to the prior year. This was driven by a ramp-up in
production of key global customer platforms incorporating brushless technology as well as continued
growth of brushed powertrain cooling products in China.
Stackpole’s sales for the 5 months since acquisition amounted to US$181.8 million. Over this period,
underlying sales of this business grew by approximately 20%, compared to the same period (pre-
acquisition) last year. This was driven by increased market penetration in Europe and Asia and new
product launches and ramp-ups in North America. Stackpole has been successful in winning new
business and will benefit from the pipeline of subsequent product launches to meet JE’s growth
objectives.
APG’s design teams are organised into engineering centres, based on specific product technologies.
These centres are focused on powertrain cooling, pump, powder metal components, window-lift drive,
seat adjustment, power closures and actuators for engine control valves, grill shutter, HVAC, headlamp,
transmission, braking and stability control applications. These design teams constantly focus on
innovation, providing custom engineered solutions and investing in the development of low-weight, high
power-density motors and subsystems for advanced applications that provide passenger comfort,
increase fuel efficiency, reduce emissions and improve safety.
Recent examples include:
• A new generation of engine coolant valve actuators with integrated electronics for on-demand
engine cooling. This actuator platform provides fast response and precise position control to
regulate coolant flow to maximise fuel economy and emissions reduction. This platform is useful in
both internal combustion engine and hybrid vehicles.
• A new generation of cooling fan modules with brushless DC motors to maximise vehicle heat
rejection efficiency. A variable airflow in response to vehicle driving dynamics allows efficient heat
rejection, keeping the engine temperature within the optimised range to minimise fuel
consumption. These new cooling fan modules are powered by a highly efficient, light-weight
brushless DC motor, and offer lower operating noise due to intelligent software control.
The Group’s on-the-ground engineering presence in key geographic markets enables it to identify
particular customer needs and customise its products accordingly. Additionally, JE’s global
manufacturing footprint with production sites in eighteen countries is a significant benefit to
customers by allowing for proximity to the customer’s point of manufacture, reducing supply and
reduced logistics risks.

17
MANAGEMENT’S DISCUSSION AND ANALYSIS
Industry Products Group
IPG’s sales, excluding currency movements,
decreased 5% for FY2015/16 compared to
the prior year. The slowdown of China export
markets and competitive pressure in lower-end
applications led to a 17% decline in Asia
sales. This was partially offset by 8% growth
in Europe, driven by IPG’s emphasis on
investing in differentiated technology. Sales in
the Americas were flat.
• In Asia, sales declined across a broad
range of market segments. This was
partially offset by growth in sales of
differentiated products for metering,
industrial equipment and automation and
medical applications.
• In Europe, sales increased largely due to
growth in lawn and garden and building
automation applications with new
business wins and the ramp-up of existing
customer programs. This was partially
offset by reduced demand for products for
food and beverage applications. Sales in
other market segments were essentially
flat.
• In the Americas, sales remained flat in FY2015/16. New customers, new product launches and
the ramp-up of existing customer programs drove growth in sales of products for industrial
equipment and white goods applications. Sales of products for floor care and HVAC and bathroom
applications also grew. This was offset by reduced demand for products for metering and some
solenoid applications.
The IPG business is repositioning itself to increase collaboration between engineering, business
development, project management and sales, to focus on serving strategic segments and key
customers whose products are aligned to the underlying trends that are expected to drive long-term
consumer demand. Additionally, the business will monitor the growth potential of small and medium
sized accounts to select those with high potential for business development.
221.7 221.7
177.2 191.7
279.7 232.9
678.6
646.3
(17%)
+8%
0%
IPG sales
at constant exchange rates
Change of (5%)
AmericasEuropeAsia
FY2014/15 FY2015/16
US$ million
Yearly trend in sales
(excluding currency movements)
IPG sales growth/(decline)
Year ended Asia Europe Americas Total
31 March 2016 (17%) 8% 0% (5%)
31 March 2015 (4%) 6% 12% 4%
31 March 2014 (5%) (8%) 0% (4%)
31 March 2013 (11%) (9%) (2%) (8%)

18Johnson Electric Holdings Limited
Annual Report 2016
The IPG design teams are organised by technology disciplines including micro-switches, brushless
motors, DC motors, high-voltage DC motors, AC motors, solenoids, stepper motors, switches, flexible
interconnect solutions and piezo actuators. IPG pursues technology leadership in multiple fast-growing
industry segments, developing products and subsystems that deliver performance enhancements,
increased power efficiency and enhanced end-customer value.
Recent examples of motion solutions designed and manufactured for IPG’s customers, include:
• Window automation actuators combining motor, gear box and electronics technologies. These
actuators assist manufacturers of windows and window coverings solutions in meeting emerging
consumer product safety regulations. Window automation also allows residential and commercial
buildings to operate more efficiently with less energy consumption for heating and cooling through
the smart control of windows and window coverings.
• High efficiency brushless motors that cater for a wide range of customer applications that require
advanced technology motors including home appliances, power tools, HVAC and other applications.
IPG’s brushless motors enable improvement of these products with quicker, quieter, more efficient
performance. Our brushless motor technology and control electronics provide an optimised
combination of cost, performance and efficiency.

19
MANAGEMENT’S DISCUSSION AND ANALYSIS
Profitability Review
Profit attributable to shareholders was US$172.7 million in FY2015/16 versus US$210.9 million in
FY2014/15. Excluding post-acquisition profits of Stackpole International and acquisition transaction
costs, profit for the year was US$180.4 million.
US$ million FY2015/16 1 FY2014/15
Increase /(decrease)
in profit
Sales 2,235.9 2,136.1 99.8
Gross profit 589.5 632.4 (42.9)
Gross margin % 26.4% 29.6%
Other income and gains, net 28.5 17.9 10.6
Selling and administrative expenses (“S&A”),
excluding nonrecurring items (398.4) (407.5) 9.1
S&A %, excluding nonrecurring items 17.8% 19.1%
Operating profit, excluding nonrecurring items 219.6 242.8 (23.2)
Operating profit margin %, excluding
nonrecurring items 9.8% 11.4%
Nonrecurring items: Acquisitions transaction costs (12.4) – (12.4)
Operating profit 207.2 242.8 (35.6)
Operating profit margin % 9.3% 11.4%
Net interest (expense) / income (3.2) 5.5 (8.7)Share of profit of associates 2.6 0.7 1.9
Profit before income tax 206.6 249.0 (42.4)
Income tax expense (23.9) (29.2) 5.3Effective tax rate 11.6% 11.7%
Profit for the year 182.7 219.8 (37.1)Non-controlling interests (10.0) (8.9) (1.1)
Profit attributable to shareholders 172.7 210.9 (38.2)
1 Includes 5 months results of Stackpole International
The operating profit of US$207.2 million includes US$5.9 million operating profits of Stackpole
International for the 5 months since acquisition, as well as US$12.4 million of nonrecurring
acquisition transaction costs. There were no such acquisition or transaction costs in FY2014/15.

20Johnson Electric Holdings Limited
Annual Report 2016
Profit Attributable to Shareholders
(22)(9)
5
(12)
211180 173
FY2014/15
Net profit,
as reported
Volume / mix,
pricing and
operating costs
Currency
movements,
net
FY2015/16
Net profit,
excluding
acquisition
Acquired
business
Nonrecurring
acquisition
transaction costs
FY2015/16
Net profit,
as reported
US$ million
Volume / mix, pricing and operating costs: Increased volumes and cost reduction activities helped
profits. However, this was more than offset by wage and salary inflation, especially in China, and the
effect of increased headcount and operating costs in preparation of further product launches in
Mexico and Serbia. As these sites mature in the near future, they are expected to achieve greater
productivity and efficiency as volumes ramp-up. Profits also benefited from lower commodity costs,
partially offset by sales price adjustments. Other income was partially offset by impairment charges.
The net effect of these changes was to decrease profit by US$21.7 million.
Currency movements, net: The Group’s global operations expose it to foreign exchange volatility,
partially mitigated by hedging key currencies such as the Euro and the Chinese Renminbi. The
significant weakening of the Euro (down approximately 13% from the prior year) decreased sales and
operating profit. Additionally, the strengthening of the Swiss Franc against the Euro increased the cost
of our Swiss operations. The net effect of currency movements in FY2015/16 (especially the weaker
Euro compared to the previous year) decreased profit by US$8.6 million. See Note 34.4 to the
accounts for the exchange rates used to translate key foreign currencies.
As a result of the changes to volume / mix, pricing, operating costs and currency, the gross margin
declined to 26.4% compared to 29.6% for the prior year. However, after taking into account the
currency hedge gains (reported in selling and administrative expenses) which were largely from the
movement of the Euro against the US Dollar, gross margin was down slightly at 28.0% compared to
29.9% for the prior year.
Finance costs and taxes: Net interest and taxes, excluding amounts attributable to 5 months of
Stackpole’s operations, were flat as the Group utilised its cash reserves, supplemented by borrowings,
to acquire Stackpole in an all-cash transaction. Finance income and costs are analysed in Note 20 to
the accounts.

21
MANAGEMENT’S DISCUSSION AND ANALYSIS
Including Stackpole, the effective tax rate declined slightly to 11.6% for FY2015/16, from 11.7% for
FY2014/15. Tax is analysed further in Note 22 to the accounts.
Acquired business: Stackpole’s operating profits for the 5 months since acquisition, together with the
share of its associate’s profit, partially offset by interest attributable to its operations, increased profit
by US$4.7 million.
Nonrecurring acquisition transaction costs: Transaction costs related to the acquisition of Stackpole
International and AML Systems amounted to US$12.4 million.
WORKING CAPITAL
US$ million
Balance sheet
as of
31 Mar 2015
Currency
translation Acquisition
Pension,
hedging and
others
Working capital
changes per
cash flow
Balance sheet
as of
31 Mar 2016
Inventories 222.0 (8.4) 28.1 – 29.0 270.7
Trade and other receivables 414.8 (2.0) 85.2 1.1 43.1 542.2
Other non-current assets 9.7 – – 7.7 1.7 19.1
Trade payables, other payables
and deferred income 1 (398.1) 8.9 (67.3) (16.0) (16.9) (489.4)
Provision obligations and
other liabilities 1,2 (56.6) (2.2) (11.3) 11.9 (4.7) (62.9)
Other financial assets /
(liabilities), net 1 188.5 0.2 – (150.5) (5.8) 32.4
Total working capital per
balance sheet 380.3 (3.5) 34.7 (145.8) 46.4 * 312.1
1 Current and non-current
2 Net of defined benefit pension plan assets
* Please refer to working capital changes in Cash Flow table on page 24
Inventories increased by US$48.7 million to
US$270.7 million as of 31 March 2016 (31 March
2015: US$222.0 million) due to the acquisition of
Stackpole in October 2015, the build-up of inventory
around the year-end in anticipation of new product
launches, ramp-ups, customer-driven delivery
schedules and increased production in Mexico,
Serbia, Turkey and Canada.
Days inventory on hand (“DIOs”) declined slightly to
51 days as of 31 March 2016 (31 March 2015: 52
days). 31-Mar-15 30-Sep-15 31-Mar-16
0
10
20
30
40
50
60
70
0
50
100
150
200
300
250
Days
inve
nto
ry o
n h
and
US
$ m
illio
n
Inventories
Inventories Days inventory on hand
5259
51

22Johnson Electric Holdings Limited
Annual Report 2016
Trade and other receivables increased by US$127.4
million to US$542.2 million as of 31 March 2016
(31 March 2015: US$414.8 million), largely due to
the acquisition of Stackpole, and also due to growth
in European business, increased credit terms given
to certain customers, especially in China, a
temporary increase in VAT receivables and increased
amounts receivable for samples and tooling.
Days sales outstanding (“DSOs”) increased slightly
to 63 days as of 31 March 2016 (31 March 2015:
62 days). The Group’s receivables are of high quality.
Amounts overdue greater than 30 days amounted to
approximately 1.2% of gross trade receivables as of
31 March 2016 (31 March 2015: 1.1%).
Trade payables, other payables and deferred income
increased by US$91.3 million to US$489.4 million
as of 31 March 2016 (31 March 2015: US$398.1
million), due to the acquisition of Stackpole, longer
credit terms taken from suppliers, increased accruals
for capital expenditure, increased purchases of raw
materials towards the year-end and an increase in
deferred revenue relating to customer contributions
towards tooling. This was partially offset by reduced
accruals for incentive compensation compared to the
prior year.
Days purchases outstanding (“DPOs”) increased by 4
days to 87 days as of 31 March 2016 (31 March
2015: 83 days).
Provision obligations and other liabilities increased by US$6.3 million to US$62.9 million as of 31
March 2016 (31 March 2015: US$56.6 million) mainly due to the acquisition of Stackpole, partially
offset by settlement of a finance lease acquired with Stackpole and reduced pension accruals. The
Group will make contributions of US$3.8 million to post-employment benefit plans for FY2016/17
(FY2015/16: contributions of US$3.5 million). See Note 14 to the accounts for further details.
31-Mar-15 30-Sep-15 31-Mar-16
Days
sale
s o
uts
tandin
g
US
$ m
illion
Trade and other receivables(DSOs calculated on trade receivables only)
Trade and other receivables Days sales outstanding
0
10
20
30
40
50
60
70
400
550
500
450
300
350
200
250
100
150
0
50
62 64 63
Days
purc
hases o
uts
tandin
g
US
$ m
illion
Trade payables, other payablesand deferred income
(DPOs calculated on trade payables only)
31-Mar-15 30-Sep-15 31-Mar-16
Days purchases outstanding
Trade payables, other payables and deferred income
0
10
20
30
40
50
60
70
100
80
90
400
500
450
300
350
200
250
100
150
0
50
83
9287

23
MANAGEMENT’S DISCUSSION AND ANALYSIS
Other financial assets / (liabilities), net, decreased by US$156.1 million to a net financial asset of
US$32.4 million as of 31 March 2016 (31 March 2015: net financial asset of US$188.5 million).
• Foreign currency forward contracts and cross-
currency interest rate swaps decreased in
value by US$128.3 million, primarily due
to a decrease in the mark-to-market value of
the Euro and the Chinese Renminbi hedge
contracts.
• The mark-to-market valuation of commodity
forward contracts decreased by US$27.8
million, due to a decrease in copper and silver
prices.
Further details of the Group’s hedging activities
can be found in the Financial Management and
Treasury Policy Section on page 28 and in Note
7 to the accounts.
Spot prices of significant items are shown in the
table below:
Spot rates
as of
31 Mar 2016
Spot rates
as of
31 Mar 2015
Strengthen/
(weaken)
USD per EUR 1.13 1.08 (4%)
RMB per USD 6.48 6.14 (5%)
CAD per USD 1.30 1.27 (2%)
HUF per EUR 314.94 299.25 (5%)
MXN per USD 17.23 15.26 (11%)
USD per metric
ton of copper 4,856 6,051 (20%)
USD per ounce of
silver 15.38 16.60 (7%)
24Johnson Electric Holdings Limited
Annual Report 2016
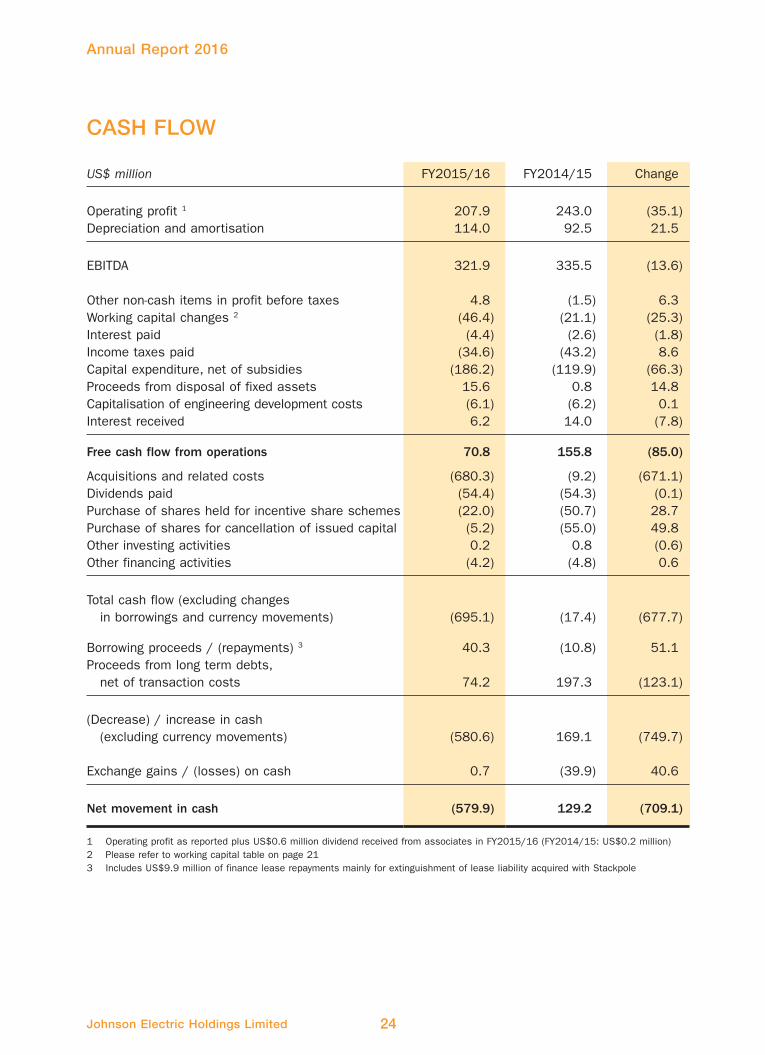
CASH FLOW
US$ million FY2015/16 FY2014/15 Change
Operating profit 1 207.9 243.0 (35.1)
Depreciation and amortisation 114.0 92.5 21.5
EBITDA 321.9 335.5 (13.6)
Other non-cash items in profit before taxes 4.8 (1.5) 6.3
Working capital changes 2 (46.4) (21.1) (25.3)
Interest paid (4.4) (2.6) (1.8)
Income taxes paid (34.6) (43.2) 8.6
Capital expenditure, net of subsidies (186.2) (119.9) (66.3)
Proceeds from disposal of fixed assets 15.6 0.8 14.8
Capitalisation of engineering development costs (6.1) (6.2) 0.1
Interest received 6.2 14.0 (7.8)
Free cash flow from operations 70.8 155.8 (85.0)
Acquisitions and related costs (680.3) (9.2) (671.1)
Dividends paid (54.4) (54.3) (0.1)
Purchase of shares held for incentive share schemes (22.0) (50.7) 28.7
Purchase of shares for cancellation of issued capital (5.2) (55.0) 49.8
Other investing activities 0.2 0.8 (0.6)
Other financing activities (4.2) (4.8) 0.6
Total cash flow (excluding changes
in borrowings and currency movements) (695.1) (17.4) (677.7)
Borrowing proceeds / (repayments) 3 40.3 (10.8) 51.1
Proceeds from long term debts,
net of transaction costs 74.2 197.3 (123.1)
(Decrease) / increase in cash
(excluding currency movements) (580.6) 169.1 (749.7)
Exchange gains / (losses) on cash 0.7 (39.9) 40.6
Net movement in cash (579.9) 129.2 (709.1)
1 Operating profit as reported plus US$0.6 million dividend received from associates in FY2015/16 (FY2014/15: US$0.2 million)
2 Please refer to working capital table on page 21
3 Includes US$9.9 million of finance lease repayments mainly for extinguishment of lease liability acquired with Stackpole

25
MANAGEMENT’S DISCUSSION AND ANALYSIS
The Group generated US$70.8 million free cash flow from operations in FY2015/16, a decrease of
US$85.0 million compared to US$155.8 million in FY2014/15. This movement in operational cash
flows includes the following:
• Working capital, explained in the previous section, required an additional investment of US$46.4
million in FY2015/16 due to higher business levels in Europe, increased credit terms given to
certain customers in China, increased receivables from customers for samples and tooling relating
to new products, increased production in Mexico, Serbia, Turkey and Canada. In FY2014/15,
working capital required an additional investment of US$21.1 million.
• Income taxes paid: In FY2015/16, the Group made payments of US$34.6 million towards income
taxes, a decrease of US$8.6 million from US$43.2 million paid in the prior year.
• Capital expenditure amounted to US$186.2 million in
FY2015/16 (US$119.9 million in FY2014/15). JE
inaugurated its second plant in Zacatecas, Mexico in
September 2015, adding a further 8,100 square
meters to the 7,400 square meters provided by JE’s
first Mexican plant. The Group is also expanding its
facilities in Niš, Serbia and in São Paulo, Brazil. The
Group continues to enhance the level of automation
in production processes to mitigate the effect of
rising labour costs in China, standardise operating
processes and further improve product quality and
reliability. Automated manufacturing equipment is
also being introduced directly into the new facilities.
Additionally, investments continued to be made for
new product launches and long-term technology /
testing development, on-going productivity
improvements and replacement of assets. Stackpole
International’s expenditures were US$18.3 million for
the 5 month period.
• Proceeds from disposal of fixed assets: In FY2015/16, proceeds from disposals of fixed assets
amounted to US$15.6 million, largely due to disposals of real estate. In FY2014/15, proceeds
from disposals of fixed assets amounted to US$0.8 million.
Free cash flow from operations was mainly applied to the funding of the following activities:
• Acquisition and related costs: In FY2015/16, the Group paid US$657.2 million (consideration
US$675.5 million less US$18.3 million cash acquired), to acquire Stackpole International 1 and
pledged US$9.1 million in deposits to maintain Stackpole’s interest in leased premises. The Group
also paid US$14.0 million transaction charges towards the acquisition of Stackpole International
and AML Systems. In FY2014/15, the Group paid US$9.2 million to insource a sales agency in
the UK strengthening the Group’s sales network by providing a direct interface with key automotive
customers in the UK.
• Dividends and share purchases, discussed in the Financial Management and Treasury Policy
Section in the following pages.
1 For details of the acquisition, please refer to the Letter to Shareholders and Note 27 to the accounts.
0
200
80
100
120
140
160
180
FY2013/14 FY2014/15 FY2015/16
US
$ m
illio
n
Capital expenditure and depreciation
Capital expenditure
to depreciation
60
40
20
1.4 1.7 2.2
Capital expenditure
Capital expenditure –
Depreciation
92.2
119.9
167.9
18.3
67.2 71.1
86.3
186.2

26Johnson Electric Holdings Limited
Annual Report 2016
FINANCIAL MANAGEMENT AND TREASURY POLICY
Financial risk faced by the Group is managed by the Group’s Treasury department, based at the
corporate headquarters in Hong Kong. Policies are established by senior management and approved
by the Board of Directors.
Credit Rating
As of 31 March 2016, the Group maintained investment grade ratings from Moody’s Investor Service
and Standard & Poor’s (S&P) Ratings Services.
Rating Outlook Grade
Moody’s Investors Service Baa1 Stable Investment
Standard & Poor’s BBB Stable Investment
Liquidity
Net Debt / Cash and Credit lines
US$ million 31 Mar 2016 31 Mar 2015 Change
Cash 193.3 773.2 (579.9)
Borrowings (220.1) (94.0) (126.1)
Convertible bonds (202.4) (197.3) (5.1)
Net (debt) / cash (229.2) 481.9 (711.1)
Available unutilised credit lines 575.5 577.6 (2.1)
The Group had net debt (borrowings and convertible bonds less cash) of US$229.2 million as of 31
March 2016, a US$711.1 million change from net cash of US$481.9 million as of 31 March 2015.
This was due to the acquisition of Stackpole for US$669.9 million in an all-cash transaction financed
largely from the Group’s cash reserves, supplemented by proceeds from existing revolving credit
facilities.
Management believes the combination of cash on hand, available credit lines and expected future
operating cash flows is sufficient to satisfy the Group’s cash needs for the current and planned level
of operations for the foreseeable future and the anticipated acquisition of AML Systems.
Cash decreased by US$579.9 million to US$193.3
million as of 31 March 2016, reflecting the
utilisation of the Group’s cash reserves in the
acquisition of Stackpole, as discussed on the
previous page. The majority of the cash reserves
are held in the Euro in anticipation of funding the
AML Systems acquisition.
US$ million 31 Mar 2016 31 Mar 2015
EUR 98.3 59.7
RMB 42.7 269.8
CAD 19.2 –
USD 9.0 382.0
Others 24.1 61.7
Total 193.3 773.2

27
MANAGEMENT’S DISCUSSION AND ANALYSIS
Borrowings increased by US$126.1 million (net
borrowings of US$124.4 million and unrealised
exchange loss of US$1.7 million) to US$220.1
million as of 31 March 2016, compared to US$94.0
million as of 31 March 2015. This reflects the
drawdown of revolving credit facilities as part of the
financing of the acquisition of Stackpole, as
discussed on the previous page. As of 31 March
2016, the Group was in compliance with all
covenants on its borrowings and expects to remain
compliant in future periods. Further information on
borrowings can be found in Note 12 to the accounts.
Convertible bonds: In April 2014, the Company issued convertible bonds, in an aggregate principal
amount of US$200 million with a cash coupon rate of 1% per annum, maturing in April 2021, with a
2019 put option for the bondholders. The bonds have an effective annual yield of 3.57%. The carrying
value of the convertible bonds as of 31 March 2016 amounted to US$202.4 million. During the year,
the funds raised by this bond issue were utilised for the acquisition of Stackpole International. Further
information on the convertible bonds can be found in Note 13 to the accounts.
Gearing:
• The Group’s total debt to capital ratio was 18% as of 31 March 2016 compared to 13% as of 31
March 2015.
• Total debt to EBITDA as adjusted to include 12 months of Stackpole International was 1.1 as of
31 March 2016 compared to 0.9 as of 31 March 2015.
• Interest coverage (defined as EBITDA divided by gross interest expense) was 36 times for the year
ended 31 March 2016, compared to 39 times for the year ended 31 March 2015.
• Free cash flow from operations as a percentage of gross debt decreased to 17% as of 31 March
2016, compared to 53% as of 31 March 2015. This was due to the combined effect of the
increase in borrowings and decrease in free cash flow explained earlier. Stackpole’s free cash flow
for the 5 months from acquisition was negligible.
Available credit lines – The Group had US$576 million in available unutilised credit lines as of 31
March 2016, as follows:
• Of US$225 million committed revolving credit facilities provided by certain of its principal bankers,
US$172 million remained unutilised. These facilities have the following expiry dates:
US$35 million – 28 February 2017
US$30 million – 12 April 2017
US$20 million – 13 September 2018
US$20 million – 24 September 2018
US$30 million – 25 September 2018
US$30 million – 30 September 2018
US$30 million – US$20 million on 16 December 2018 and US$10 million on 26 February 2019
US$30 million – 28 December 2018
Borrowings and Convertible Bonds
US$ millionTotaldebt
Swap contracts*
Total after effect
of swaps %
USD 368.3 (105.0) 263.3 62%EUR 23.4 107.2 130.6 31%RMB 30.8 – 30.8 7%
Total 422.5 2.2 424.7 100%
Borrowings – current 98.4Borrowings – noncurrent 121.7Convertible bonds 202.4Other financial liabilities* 2.2
Total debt 424.7
* Included a swap contract entered in April 2016 with notional value of US$30 million. Details refer to Note 7(b) to the accounts

28Johnson Electric Holdings Limited
Annual Report 2016
• US$292 million of uncommitted and unutilised revolving credit facilities, provided by its principal
bankers; and
• US$112 million of uncommitted and unutilised trade receivable financing lines.
Dividends and Shares
Dividends: The Board has recommended a final dividend of 34 HK cents per share for FY2015/16
(FY2014/15: 34 HK cents per share) equivalent to US$37.5 million, to be paid in August 2016. The
Board’s intention is to have the interim dividend increase over time, such that it will represent one-
third of the previous year’s total dividend payment. The Company paid an interim dividend of 15 HK
cents per share for FY2015/16 (FY2014/15: 14 HK cents per share) equivalent to US$16.6 million.
Purchase of shares for incentive share schemes: To foster a focus on long-term sustainable growth,
JEHL maintains long-term incentive share schemes, further discussed on page 54. To support this, in
FY2015/16, the Company purchased 6.5 million shares for US$22.0 million including brokerage fees
(FY2014/15, purchased 13.7 million shares for US$50.7 million) for use in granting shares to eligible
Directors and employees under the incentive share schemes.
Purchase of shares for cancellation of issued capital: 1.7 million shares were purchased in FY2015/16
at a total cost of US$5.2 million including brokerage and cancellation fees. In FY2014/15, the
Company purchased 14.3 million shares for cancellation at a total cost of US$55.0 million.
Foreign Exchange and Raw Material Commodity Price Risk
The Group is exposed to foreign exchange risk and hedges part of this risk through forward contracts.
These forward contracts have varying maturities, ranging from 1 to 72 months as of 31 March 2016,
to match the underlying cash flows of the business and included:
• Forward sales of the Euro (“EUR”) and the
Japanese Yen (“JPY”) to hedge export sales
denominated in these currencies;
• Forward purchases of the Chinese Renminbi
(“RMB”), the Hungarian Forint (“HUF”), the
Swiss Franc (“CHF”), the Mexican Peso
(“MXN”), the Polish Zloty (“PLN”), the Hong
Kong Dollar (“HKD”) and the Israeli Shekel
(“ILS”) to hedge operating costs, primarily
production conversion costs, denominated in
these currencies; and
• Forward sales of the Canadian Dollar (“CAD”) to hedge the material purchase in USD for its
operations in Canada.
The Group also hedges its net investment in its European operations to protect itself from exposure
to future changes in currency exchange rates.
The Group’s sales are primarily denominated in
the currencies shown in the table below:
Sales by
currency FY2015/16 FY2014/15
USD 43% 45%
EUR 31% 34%
RMB 18% 18%
CAD 5% 0%
Others 3% 3%

29
MANAGEMENT’S DISCUSSION AND ANALYSIS
The Group is exposed to commodity price risk, mainly from fluctuations in steel, copper, silver and
aluminium prices. Price risk due to steel is reduced through fixed price contracts up to 3 months
forward with the Group’s suppliers. Price risk due to copper, silver and aluminium is reduced by
hedging through appropriate financial instruments that have varying maturities ranging from 1 to 72
months as of 31 March 2016. The Group also manages copper and silver prices by way of
incorporating appropriate clauses in certain customer contracts to pass increases / decreases in raw
material costs onto these customers.
In order to avoid the potential default by any of its counterparties on its forward contracts, the Group
deals only with major financial institutions (e.g. the Group’s principal bankers) with strong investment
grade credit ratings that the Group believes will satisfy their obligations under the contracts.
Further information about forward foreign currency exchange contracts and raw material commodity
contracts can be found in Note 7 to the accounts.
ENTERPRISE RISK MANAGEMENT
The Group identifies, mitigates and manages its exposure to risk and uncertainty through proactive
management oversight and close cooperation amongst the senior management team, as well as
robust business processes to lower the frequency and reduce the severity of risk. Management
monitors these business practices, testing them periodically to ensure their continued effectiveness.
Existing and emerging risks are analysed and tracked on a quarterly basis by the Group’s Enterprise
Risk Management Steering Committee. This is led by the Group’s Chief Executive and composed of
the Chief Financial Officer, the Senior Vice Presidents of Human Resources, Supply Chain Services,
Global Manufacturing and Corporate Engineering, as well as key senior leaders from the Quality and
Reliability, Legal and Intellectual Property, Corporate Audit Services and Environment, Health and
Safety departments.
The principal risks and uncertainties facing the company can be categorised as follows:
Strategic risks
Macroeconomic changes
Market competition
Technology advancement
Reputation
Mergers and acquisitions
Commercial risks
Pricing and volume
Warranty sharing
Non-payment
by customers
Operational risks
Contract performance
Intellectual property
Supply chain
Warranty and
product liability
Human resources
Environment, health
and safety
Financial risks
Liquidity and
capital access
Foreign exchange
Interest rates
Commodity prices
Principal risks and uncertainties 1
1 This list is not exclusive and comprehensive as the nature, severity and frequency of risks changes over time due to the complexity of the
Group’s business environment and operations. The Group may be exposed to new emerging risks or to other existing risks that are not
significant at the moment but that may become significant in the future.

30Johnson Electric Holdings Limited
Annual Report 2016
The nature of these risks and the Group’s policies for managing its exposure to these risks is set out
below:
Nature of risk How we respond
Strategic risks
Macroeconomic changes – The Group’s business is sensitive
to the global economic and socio-political environment.
Further, the financial performance of the Group’s Automotive
and Industry Product Groups depends on conditions in the
industries in which they operate. Production and sales in
these industries are cyclical and sensitive to the general
economic conditions and other factors including interest rates,
consumer credit and consumer preferences.
• Ensuring the suitability of the operational footprint to
respond quickly and cost effectively to changes in the
market and in capacity utilisation.
• Seeking organic and acquisition related growth, across
all regions, to mitigate the potential impact of an
economic downturn in any particular region.
• Diversifying customer and product portfolios through
internal development and acquisition to mitigate the
adverse impact of economic downturn or market changes
in a particular industry.
Market competition and Technology advancement – The Group
is under intense pressure to compete on both price and
technology as large, multinational and smaller, regional or
niche competitors attempt to increase market share.
The Group must continually demonstrate its ability to deliver
innovative, cost-effective solutions, otherwise it may lose
business to competitors who adapt to such technological
changes or who develop and offer more suitable or
technologically advanced products than the Group.
• Developing and managing product differentiation through
technology, innovation and intellectual property in order
to be the definitive supplier of motion solutions to our
customers.
Reputation – The Group may lose potential business if its
character or quality is called into question.
• Continuously improving engineering and manufacturing
processes and quality standards to maintain the Group’s
position as the “safe choice” for our customers.
• Ensuring that a strong tone at the top is reflected in
business practices. High integrity, sound ethics and good
business practices are expected and followed by
employees at all levels of Johnson Electric’s global
organisation, with no tolerance of non-compliance.
Mergers and acquisitions – Should suitable opportunities
occur, the Group makes acquisitions (such as Stackpole) that
can complement its strategy, broaden its technology offering
and accelerate growth. The Group faces risks in integrating
such newly acquired businesses, including the integration of
business models, product portfolios, operations, systems,
employees and cultures. Depending on the size and
complexity of such acquired businesses the Group may not be
able to take advantage of synergies quickly.
• Prior to acquiring new business, the Group carries out a
comprehensive appraisal to establish its commercial
potential and fit with the Group’s strategy and product
portfolio, to evaluate the assets and liabilities that will
be acquired and to identify potential issues.
• The Group stipulates procedures and post-acquisition
support to ensure that integration completes smoothly.
The acquisition of Stackpole International is further
discussed in Note 27 to the financial statements.

31
MANAGEMENT’S DISCUSSION AND ANALYSIS
Nature of risk How we respond
Commercial risks
Pricing and volumes – In the markets where the Group
supplies its products, the Group is under intense competitive
pressure to reduce prices as both large, multinational and
smaller, niche competitors attempt to expand their market
share. Additionally, volumes may fluctuate as the Group’s
customers are also subject to competitive pressures.
• Continuously seeking productivity and efficiency
improvements.
• Ensuring the suitability of the operational footprint to
respond quickly and cost effectively to changes in the
market and in capacity utilisation.
• Formal, disciplined review and approval of quotations.
Warranty sharing – Our customers operate in competitive
markets and may vary warranty periods offered to end-
customers to increase the attractiveness of their product.
Consequently, the Group may be exposed to the risk of
increased costs of warranty sharing.
• Managing customer relationships, including contract
terms and conditions, in accordance with industry
standards.
• Considering potential warranty risks at the design stage
in product development.
Non-payment by customers 1 – Possible non-payment due to
customer-related problems such as insolvency or bankruptcy.
• Managing customer credit risk and maintaining a low
tolerance for delinquent payments.
Operational risks
Contract performance – Potential losses arising from failure
in contract performance or onerous contract terms.
• Managing customer relationships, including contract
terms and conditions, in accordance with industry
standards.
Intellectual property – The Group’s business is dependent on
its ability to enforce its patents against infringement and to
protect its trade secrets, know-how and other intellectual
property. Potential risks relating to this include the
substantial cost of protecting its intellectual property rights
and the legal cost of defending claims of infringement.
• Protecting the Group’s proprietary position by
safeguarding trade secrets and know-how and by filing
patent applications for technologies and process
improvements that are important to the development of
the Group’s business.
• Enforcement action against infringement by competitors.
• Patent searches to avoid infringing others’ intellectual
property.
Supply chain – If the Group experienced a prolonged
shortage of critical components, without being able to
procure replacement for such items, it would be unable to
meet its production schedules and could miss customer
delivery deadlines and expectations.
• Ensuring supply chain resilience, including supplier
continuity, quality and reliability.
• Continuous seeking of opportunities to insource the
supply chain to assure supply.
1 The performance of the Group’s credit risk management is discussed in the Working Capital Section on page 22 and in Note 9 to the
financial statements.

32Johnson Electric Holdings Limited
Annual Report 2016
Nature of risk How we respond
Operational risks
Warranty and product liability – The Group manufactures
complex products through its Automotive and Industry
Product Groups and is exposed to potential warranty and
product liability claims arising from alleged or actual defects
in products. Risks arising from this include customer
dissatisfaction and potential liabilities for the cost of
replacing faulty products, product recalls and lawsuits.
• Continuously improving engineering and manufacturing
processes and quality standards to reduce the likelihood
of quality issues.
• Product safety reviews, to ensure that products fail safe
and meet the highest market standards.
• Continuously seeking opportunities to insource the
supply chain to ensure that components meet our
rigorous quality requirements.
Human resources 1 – The Group’s business success depends
on attracting and retaining qualified personnel and on
maintaining an established workforce.
• Attracting and retaining high-calibre management and
other key personnel.
• Building effective networks of employees and partners
including maintaining good labour relationships.
• Minimising the impact of unexpected staff turnover
through succession planning and standardisation of work
procedures.
Environment, health and safety (“EHS”) 2 – EHS laws and
regulations may result in increasing costs of compliance or
potential fines and penalties in the event of non-compliance.
Incidents causing lost hours by injuries and damage to our
facilities may give rise to compensation claims and lawsuits,
loss of reputation and adverse impact on the environment
and on the communities in which the Group operates.
• Meeting or exceeding requirements on environmental
responsibility, employee safety and energy efficiency.
Financial risks 3
Liquidity and capital access, Foreign exchange, Interest rates
and Commodity price risks.
• Maintaining investment grade credit ratings.
• Ensuring that the combination of cash on hand, available
credit lines and expected future operating cash flows is
sufficient to satisfy current and planned cash needs.
• Applying appropriate strategies to manage foreign
exchange risk, commodity price risk, and interest rate
risk.
1 The Group’s policies on investing in people are set out on pages 34 to 35.
2 The Group’s EHS management is further discussed on pages 35 to 36.
3 A detailed discussion of the nature of financial risks and the Group’s financial management and treasury policies for managing its exposure
to these risks are set out on pages 26 to 29.

33
MANAGEMENT’S DISCUSSION AND ANALYSIS
STAKEHOLDER ENGAGEMENT
Johnson Electric is dedicated to socially responsible interactions with its stakeholders including
shareholders, customers, employees, suppliers, business partners and local communities worldwide.
The Group’s commitment to social accountability includes policies and practices on a variety of issues
such as human rights, non-discrimination, social responsibilities and environmental management.
Relationships with customers and suppliers
Customers: Johnson Electric believes that making customers successful is vital to delivering
sustainable business growth and profitability. This is a key part of the Group’s core values, internally
referred to as “MARBLE” 1. To support this, the Group has implemented the Johnson Electric’s Product
Development System (“JEPDS”) and the Johnson Electric’s Production System (“JEPS”).
Through JEPDS, the Group creates solutions that bring benefits to the end-user of a product and that
meet the business needs of its direct customers. An intensive two-way dialogue between the Group’s
sales and engineering and its customers, allows it to listen to customers’ needs while sharing
knowledge of the Group’s products and capabilities. A disciplined development path with rigorous
reviews and testing from concept to start of production ensures that the Group’s products meet
safety, quality and performance requirements at a competitive cost.
Through JEPS, the Group ensures manufacturing excellence, with “dead copy” quality and performance
achieved across its facilities worldwide. The Group’s global manufacturing footprint and logistics know-
how, together with the complete vertical integration of components, tooling, semi-automated and
automated production lines provides our customers with a safe-choice solution.
Suppliers: The Group’s engagement with suppliers is also driven by JEPDS and JEPS. A focus on
“Innovation” and “Safe Choice” as core values is incorporated in the Group’s supplier selection
process, performance monitoring and throughout the business engagement with suppliers. Robust
supplier qualification procedures, before ordering regular supplies from any supplier, ensure that the
Group has the right supplier to source the right item. These procedures include due consideration of
cost, quality, environmental awareness, ethical behaviour and social responsibility.
Suppliers are contractually required to be certified with international accreditations such as ISO9001,
ISO14001, ISO/TS16949 and ISO13485 and are encouraged to be in compliance with various
environmental and conflict minerals requirements. To ensure that suppliers are committed to ethical
practices in dealings with the Group, every supplier is required to comply and sign up to JE’s Code of
Ethics and Business Conduct policies, which prohibit offering of gifts, certificates, loans, hospitality,
service or favour in an improper manner. Suppliers are also required to comply with the U.S. Foreign
Corrupt Practices Act, the UK Bribery Act 2010 and the Criminal Law of the PRC.
1 “MARBLE” stands for the values of “Make customers successful”, “Attract and develop great people”, “Reach higher”, “Believe in practical
solutions”, “Lead by example”, “Excel in execution”. Please see www.johnsonelectric.com for more information on Johnson Electric’s vision
and MARBLE values

34Johnson Electric Holdings Limited
Annual Report 2016
The Group also requires in its purchase terms and conditions that its suppliers comply with directives
set by the International Labour Organisation’s “ILO Declaration on Fundamental Principles on Business
and Human Rights at Work” and the United Nations’ “UN Guiding Principles on Business and Human
Rights”, which adhere to the principles of the freedom of association, right of collective bargaining,
abolition of child labour and elimination of all forms of forced or compulsory labour or discrimination
at work.
Compliance with these laws and directives is periodically monitored through self-declarations and
on-site audits. Furthermore, the Group’s Supplier Performance Rating System enables it to
continuously gauge and calibrate suppliers’ ability to meet the above requirements.
Investing in people
People and culture are at the heart of Johnson Electric’s success. The Group’s human capital strategy
is to attract and develop great people, put them in the right jobs and provide an environment that
enables everyone to excel at what they do. This is supported by a robust talent management process,
an equitable and competitive compensation and benefits program, a fit-for-purpose training and
development agenda, an engaging internal communications infrastructure and a systems-based
approach to Environment, Health and Safety requirements.
As of 31 March 2016, the Group’s total global headcount stood at 38,000 across Asia, the Americas
and Europe.
Talent Management: The Group remains committed to attracting and developing great people,
supported by a group-wide definition of talents, along with a clear set of management competencies
and corresponding evaluation tools. There is a focus on strengthening the development of high
potentials and the leadership bench, with special emphasis on outside-the-classroom training through
stretch assignments and on the job opportunities. The Group’s selection tools are continuously being
refined to ensure the right people are hired for the right jobs.
Compensation and Rewards: The Group maintains a global compensation structure to ensure
competitive pay levels and benefit offerings in each market in which it operates. Annual incentive pay
is tied to the achievement of profitability and liquidity goals and is an important component of
compensation for 82% of staff-level employees, including all management staff. Additionally, the
Group’s long term incentive share scheme forms a critical part of the competitive compensation
package for senior executives, encouraging retention while aligning rewards to shareholder value. The
scheme includes not only time-vested restricted stock units, but also a high proportion of performance
stock units which vest only if stringent financial conditions are achieved.
Training and Development: Employees around the world benefit from the Johnson Electric learning and
development programs.
To foster a common understanding of Johnson Electric’s culture, language, strategy and processes
across all of the Group’s locations, in April 2015, the Group launched a “One Johnson” global training
initiative. Characterised by high energy and interactive delivery packed with videos, activities and case
studies, each class is co-hosted by a leader alongside a training facilitator, allowing employees to
learn directly from the sharing and experience of senior executives.

35
MANAGEMENT’S DISCUSSION AND ANALYSIS
The “e-Learning Centre”, a just-in-time, borderless, agile teaching platform, supports the Group in
disseminating key initiatives to the global workforce in a swift manner. This includes the continued
training of key Engineers and Specialists in the Group’s unique approach to product development, JE-
PDS, which is vital to driving product innovation and profitable growth.
Additionally, the Johnson Electric Technical College (“JETC”), based in Shajing, China provides a mix of
general and technical education for youth from China over a three-year course. This program is
successful at producing skilled young technicians, many of whom remain with the Group after
graduation. Since its foundation in 2004, JETC has accepted over 1,038 students, with a further
intake of 105 expected to join later in 2016.
JETC also assists in the establishment and development of colleges in new locations such as
Zacatecas, Mexico; and Niš, Serbia. Selected individuals from such locations attend JETC in Shajing,
China, for 4 to 8 months of induction and training. This ensures that the Group has a nucleus of
Johnson Electric trained employees in these locations, capable of providing strong support to regional
customers.
Reinforcing JE Culture and Values: Building on existing internal communications channels, an in-house
enterprise social media platform was launched in October 2015 to allow employees to stay in tune
with happenings around Johnson Electric and follow news and topics relevant to them. The Group also
continues to imbue employees with the Group’s culture and core values through its annual “One
Johnson” celebration.
In January 2016, the Group conducted a survey to gauge the engagement level of staff employees in
selected businesses or locations as a first step to understand what engages the Group’s employees
and their perception of the working environment. The survey will be rolled out across the rest of
organisation later in 2016.
The Group operates a recognition program, “Living MARBLE”, to reward role-model behaviour in the
workplace. Since its launch in October 2014, over 200 awardees around the world were recognised
under the program.
In 2016, Johnson Electric Hong Kong was recognised as one of Asia’s Best Companies To Work For by
HR Asia Magazine. The Group will continue to uphold its core values by attracting and retaining top
talents in support of the company’s ambitious growth strategy.
Environmental, Health and Safety
The Group is committed to protecting the environment and the health and safety of employees
wherever it operates around the world. Johnson Electric believes that excellent EHS performance will
contribute to the sustainable growth of the company for generations to come. Specific EHS goals
include:
• No harm to people working for Johnson Electric; and
• No damage to the environment wherever the Group operates

36Johnson Electric Holdings Limited
Annual Report 2016
The Group takes a proactive approach to address and manage EHS related issues. It has established
a progressive structure for managing its EHS programs, defined appropriate EHS objectives and
implemented an EHS management system to monitor and control EHS risks. The critical measurable
factors are also tracked through the management system. The Group plans to report key EHS
performance indicators to the Chief Executive and the Executive Committee on a regular basis.
Management requires all worldwide locations to apply this EHS management system and all sites are
expected to have compliance in both JE’s global EHS standards as well as local regulations. Most of
the operating facilities in the Group are certified by the internationally recognised ISO14001 and / or
OHSAS 18001 standards on environment management and occupational health and safety
management. Additionally, the Group’s largest site in Shenzhen, China is certified by the ISO50001
standards on energy management.
Major EHS achievements in FY2015/16 include:
• Our factories in Shenzhen, China participating in China’s pilot carbon emission trading scheme,
trading their surplus quota after the adoption of various energy and carbon emission reduction
measures.
• The successful implementation of Cleaner Production projects in our operations in Shanghai,
Nanjing and Shenzhen, China.
• Most of the Group’s operations in China received Workplace Safety Standardisation Certification, a
national program initiated by the PRC government to standardise various safety management
practices across the country.
• Holding a “2015 Safety Month” in the Group’s manufacturing locations, worldwide, to raise
employees’ hazard awareness and foster the Group’s injury-free safety culture.
• The newest manufacturing site at Niš, Serbia, received both ISO14001 and OHSAS certification in
March 2016.
Community Engagement
In echoing our core value to be a good corporate citizen wherever we operate, Johnson Electric actively
promotes and engages in corporate social responsibility activities, partnering with our employees and
non-governmental organisations as necessary.
Over the past year, community engagement initiatives have been organised in many Johnson Electric
locations around the world, including both volunteering activities and fundraising/donation programs.
The nature of initiatives ranged from caring for the underprivileged, supporting youth education to
promoting safety awareness in our immediate neighbourhood.
As a result of their active participation in a variety of charity and community activities, Johnson
Electric in Hong Kong and Springfield, USA were respectively named a “Caring Company” by the Hong
Kong Council of Social Service and presented with the “Hope for Life Award” by YMCA during the year.

37
CORPORATE GOVERNANCE REPORT
Johnson Electric Holdings Limited (“Company”) is committed to achieving high standards of corporate
governance that properly protect and promote the interests of its shareholders and devotes
considerable effort to identifying and formalising best practices of corporate governance.
BOARD OF DIRECTORS
The board of directors of the Company (“Board”) currently consists of three executive directors and
seven non-executive directors (of whom five are independent) (“Directors”).
The independent non-executive directors are all experienced individuals from a range of industries and
geographies. Their mix of professional skills and experience is an important element in the proper
functioning of the Board and in ensuring a high standard of objective debate and overall input to the
decision-making process. The Board has received from each independent non-executive director a
written confirmation of their independence and has satisfied itself of such independence up to the
approval date of this report in accordance with the Rules Governing the Listing of Securities (“Listing
Rules”) on The Stock Exchange of Hong Kong Limited (“Stock Exchange”).
The profiles of the Directors are provided on pages 164 to 167 of this report.
In accordance with Rule 13.51B(1) of the Listing Rules, the Company is required to disclose changes
in information of Directors of the Company subsequent to the date of the Interim Report 2015. The
changes were the appointment of Dr. Patrick Shui-Chung Wang as a member of the Hong Kong
Sanatorium & Hospital’s Clinical Governance Committee with effect from 1 January 2016 and the
appointment of Mr. Austin Jesse Wang as a Division Vice President, IPG Engineering Programs of the
Group with effect from 16 May 2016.
THE BOARD AT WORK
The Board is accountable to shareholders for the activities and performance of the Company and its
subsidiaries (“Group”). Directors meet in person on a quarterly basis and on other occasions when a
board-level decision on a particular matter is required. The Board has reserved for its decision or
consideration matters covering corporate strategy, annual and interim results, directors’ appointment,
succession planning, enterprise risk management, major acquisitions, disposals and capital
transactions and other significant operational and financial matters.
The Company seeks to provide its independent non-executive directors with extensive exposure and
access to its operations and management. The board meeting agendas are structured to address the
broad spectrum of key governance issues on a regular and systematic basis. Forming part of the
continuous professional development program for Directors, visits to the Group’s principal operating
facilities are arranged and relevant subject area experts are invited to address the Board from time to
time.

38Johnson Electric Holdings Limited
Annual Report 2016
The Board recognises the importance and benefits of conducting regular evaluations of its
performance to ensure the effectiveness of its functioning. On an annual basis, a board effectiveness
survey is sent to each Director in order to enable the performance of the Board to be evaluated.
Responses to the survey are analysed and discussed at the Board meeting. Suggestions made by the
Directors have been implemented to further improve the performance of the Board.
Major corporate matters that are specifically delegated by the Board to management include the
preparation of annual and interim accounts for board approval before public reporting, execution of
business strategies and initiatives adopted by the Board, implementation of adequate systems of
internal controls and enterprise risk management procedures, and compliance with relevant statutory
requirements and rules and regulations.
The Group’s Executive Vice Presidents attend board meetings to advise on strategic planning,
corporate governance, enterprise risk management, statutory compliance, internal controls, mergers
and acquisitions, financial, tax and accounting matters.
Under the Company’s Bye-law 109(A), one-third of the directors except the director holding office as
executive chairman, who have served longest on the Board since their last election, shall retire from
office and be eligible for re-election at each annual general meeting. As such, except the executive
chairman, no director has a term of appointment longer than three years.
COMMITTEES
The monitoring and assessment of certain governance matters are delegated to four committees
which operate under defined terms of reference and are required to report to the Board on a regular
basis. The composition of the committees during FY2015/16 and up to the date of this report is set
out in the table below.
Directors
Audit
Committee
Remuneration
Committee
Nomination
and Corporate
Governance
Committee
Board
Committee
Executive Directors
Patrick Shui-Chung Wang M M
Winnie Wing-Yee Wang M M
Non-Executive Director
Peter Kin-Chung Wang M
Independent Non-Executive Directors
Peter Stuart Allenby Edwards C
Patrick Blackwell Paul C M
Michael John Enright M C
Joseph Chi-Kwong Yam M
Christopher Dale Pratt M M
C – Chairman
M – Member

39
CORPORATE GOVERNANCE REPORT
Audit Committee
The Audit Committee comprises three independent non-executive directors and one non-executive
director who together have substantial experience in the fields of accounting, taxation, business,
corporate governance and regulatory affairs. The current members are Mr. Patrick Blackwell Paul
(Committee Chairman), Prof. Michael John Enright, Mr. Christopher Dale Pratt and Mr. Peter Kin-Chung
Wang.
The Committee is responsible for monitoring the financial reporting, accounting, enterprise risk
management and internal control aspects of the Group’s activities. It has full access to the Group’s
Head of Corporate Audit Services to hear directly any concerns of the internal audit function that may
have arisen during the course of the department’s work. The Committee also monitors the
appointment, function and remuneration of the Group’s external auditor. The Committee’s authority
and duties are set out in the terms of reference which are available on the websites of the Group and
the Stock Exchange.
Four committee meetings were held in FY2015/16 to discuss and review the following matters
together with the Chief Financial Officer, the Executive Vice President, the Vice President Europe, the
Controller and Principal Accounting Officer, the General Counsel, the Head of Tax, the Head of
Corporate Audit Services, the Head of Financial Reporting, the Company Secretary and the external
auditor:
1. The FY2014/15 annual results and interim results for FY2015/16, to ensure that the related
disclosures in the financial statements were complete, accurate and fair and complied with
accounting standards, the Listing Rules and legal requirements, and to submit the same to the
Board for approval;
2. The work done by the external auditor, the relevant fees and terms of engagement and appropriate
actions required on any significant control weaknesses;
3. The external auditor’s independence, including consideration of their provision of non-audit
services;
4. The Corporate Audit Services Department’s staffing and team competencies, its internal audit plan
and budget for approval, its report on work performed and the status of open issues for remedial
action;
5. The overall adequacy and effectiveness of internal controls;
6. The Group’s enterprise risk management activity, namely the processes by which risks are
assessed and registered and by which such risks are addressed for mitigation and management;
7. The status and adequacy of the Group’s insurance coverage;
8. The status of the Group’s global tax position and any fiscal audits by the various jurisdictions;
9. Supply chain risks and their mitigation;

40Johnson Electric Holdings Limited
Annual Report 2016
10. The status of litigation;
11. Environmental, Health and Safety issues;
12. Approval of the revised Corporate Audit Services charter;
13. Risk management relating to customer contracts and quotations; and
14. Review of the terms of reference.
Remuneration Committee
The Remuneration Committee consists of three independent non-executive directors and one
executive director. The current members are Prof. Michael John Enright (Committee Chairman), Mr.
Joseph Chi-Kwong Yam, Mr. Christopher Dale Pratt and Ms. Winnie Wing-Yee Wang.
The Committee determines the compensation structure and rewards for the Chief Executive and other
executive directors and monitors the policies being applied in remunerating the senior management
on behalf of the Board.
In addition, it has responsibility for reviewing and making appropriate recommendations to the Board
on retirement plans and provisions and on management development and succession plans for
executive directors and senior management. The Committee’s authority and duties are set out in the
terms of reference which are available on the websites of the Group and the Stock Exchange.
At Johnson Electric, remuneration and incentive schemes are linked to the achievement of annual and
long term performance goals. By providing total compensation at competitive industry levels, for
on-target performance, the Group seeks to attract, motivate and retain the key executives essential to
its long term success. To this end, the Committee directs the management in the engagement of
outside remuneration experts and stays abreast of remuneration practices among comparable
companies around the world. Senior management incentive schemes include an equity component
that is designed to align the long term interest of management with those of shareholders.
All global staff positions, including senior management, are governed by an evaluation methodology
which takes into account management / technical know-how, problem solving and accountability.
Individual senior management remuneration acknowledges scope of responsibilities, contribution and
performance. The base salary takes into account factors such as contribution to the business,
employee retention and market remuneration. Annual incentives, when payable, are performance-
based, and include Company’s and Group’s financial objectives as well as individual objectives which
may be non-financial. The Johnson Electric Restricted and Performance Stock Unit Plan for senior
management provides for the grant of JEHL Restricted Stock Units (“RSUs”) and Performance Stock
Units (“PSUs”). Vesting of these is subject to attainment of service milestones in the case of RSUs
and, in the case of PSUs, the attainment over time of identified group wide financial goals. RSUs and
PSUs are used to retain and motivate senior staff and are designed to maximise long term
shareholder value.

41
CORPORATE GOVERNANCE REPORT
In determining the level of remuneration and fees paid to members of the Board, a review of current
practices in leading Hong Kong public companies and comparable companies elsewhere in the world
is regularly conducted with the aid of an independent consultant. Board remuneration consists of an
annual retainer with additional fees payable for committee memberships and attendance at meetings.
A grant of fully-vested shares comprises a component of remuneration for the independent non-
executive directors. Executive directors are not eligible for any remuneration or fees for board
activities.
The Remuneration Committee reviews the overall remuneration program of the Company over the
short, medium and long term while addressing the goals of management development and retention
and the enhancement of shareholder value.
No individual director or senior manager approves his or her own remuneration.
Five committee meetings were held in FY2015/16. During the financial year, the Committee
addressed the following:
1. Swiss, UK and Canadian Pension Schemes;
2. Director and Senior Executive Compensation and Benefits;
3. Long-Term Incentive Share Scheme Awards;
4. Award of Shares to Chairman & Chief Executive and Vice-Chairman;
5. Annual Incentive Plan Measurement;
6. New Johnson Electric Restricted and Performance Stock Unit Plan Rules;
7. Non-Executive Directors’ Compensation;
8. Human Resources Integration Update of Stackpole; and
9. Industry Products Group Restructuring.
Nomination and Corporate Governance Committee
The Nomination and Corporate Governance Committee comprises two independent non-executive
directors and one executive director. The current members are Mr. Peter Stuart Allenby Edwards
(Committee Chairman), Mr. Patrick Blackwell Paul and Dr. Patrick Shui-Chung Wang.

42Johnson Electric Holdings Limited
Annual Report 2016
The Committee is responsible for the identification and evaluation of candidates for appointment or
re-appointment as a director, as well as the development and maintenance of the Group’s overall
corporate governance policies and practices. The Committee’s authority and duties are set out in the
terms of reference which are available on the websites of the Group and the Stock Exchange.
The Board has adopted a Board Diversity Policy. The Committee monitors the implementation of this
policy and has responsibility for leading the process for Board appointments and for identifying and
nominating, for approval by the Board, candidates for appointment to the Board. Selection of
candidates will be based on a range of perspectives, including but not limited to, cultural and
educational background, professional experience and qualifications, skills, functional expertise,
knowledge, gender and age. The candidates will be considered against objective criteria, having due
regard for the benefits of diversity on the Board. The ultimate decision will be based on merit and
contribution that the selected candidates will bring to the Board.
In reviewing Board composition, the Committee will consider the benefits of all aspects of diversity
including, but not limited to those described above, in order to maintain an appropriate range and
balance of skills, experience and diversity of perspectives appropriate to the requirements of the
Group’s business globally.
In accordance with the Bye-laws of the Company, every newly appointed director is subject to
re-election at the next annual general meeting.
Two committee meetings were held in FY2015/16. The following is a summary of work performed by
the Committee during the financial year:
1. Consideration and recommendation of the retiring directors for re-election at the Annual General
Meeting;
2. Review of the structure, size and composition of the Board;
3. Consideration of the independence of all independent non-executive directors;
4. Review and approval of the corporate governance report and information for the Annual Report and
the Interim Report;
5. Review of the Group’s report on compliance with laws and regulations in the countries in which it
operates;
6. Consideration and recommendation to the Board for appointing an independent non-executive
director as a member of the Audit Committee;
7. Review of the training of Directors and senior management;
8. Consideration of an emergency succession policy; and
9. Review of compliance certificate assurance.
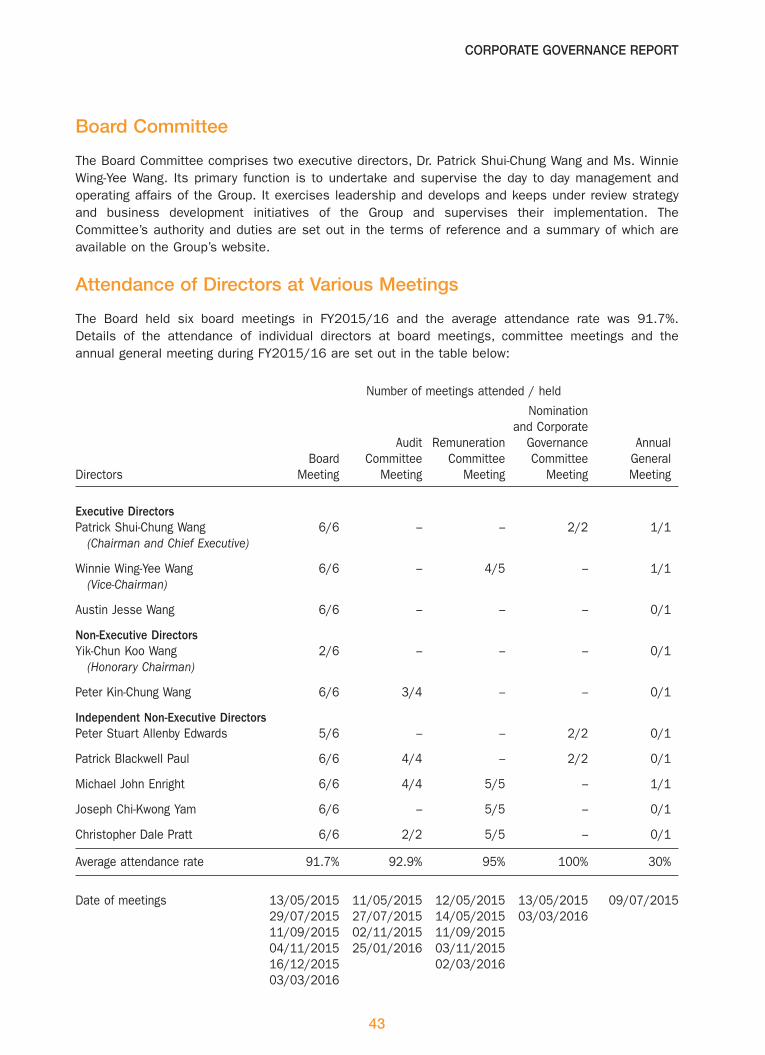
43
CORPORATE GOVERNANCE REPORT
Board Committee
The Board Committee comprises two executive directors, Dr. Patrick Shui-Chung Wang and Ms. Winnie
Wing-Yee Wang. Its primary function is to undertake and supervise the day to day management and
operating affairs of the Group. It exercises leadership and develops and keeps under review strategy
and business development initiatives of the Group and supervises their implementation. The
Committee’s authority and duties are set out in the terms of reference and a summary of which are
available on the Group’s website.
Attendance of Directors at Various Meetings
The Board held six board meetings in FY2015/16 and the average attendance rate was 91.7%.
Details of the attendance of individual directors at board meetings, committee meetings and the
annual general meeting during FY2015/16 are set out in the table below:
Number of meetings attended / held
Directors
Board
Meeting
Audit
Committee
Meeting
Remuneration
Committee
Meeting
Nomination
and Corporate
Governance
Committee
Meeting
Annual
General
Meeting
Executive Directors
Patrick Shui-Chung Wang
(Chairman and Chief Executive)
6/6 – – 2/2 1/1
Winnie Wing-Yee Wang
(Vice-Chairman)
6/6 – 4/5 – 1/1
Austin Jesse Wang 6/6 – – – 0/1
Non-Executive Directors
Yik-Chun Koo Wang
(Honorary Chairman)
2/6 – – – 0/1
Peter Kin-Chung Wang 6/6 3/4 – – 0/1
Independent Non-Executive Directors
Peter Stuart Allenby Edwards 5/6 – – 2/2 0/1
Patrick Blackwell Paul 6/6 4/4 – 2/2 0/1
Michael John Enright 6/6 4/4 5/5 – 1/1
Joseph Chi-Kwong Yam 6/6 – 5/5 – 0/1
Christopher Dale Pratt 6/6 2/2 5/5 – 0/1
Average attendance rate 91.7% 92.9% 95% 100% 30%
Date of meetings 13/05/2015 11/05/2015 12/05/2015 13/05/2015 09/07/2015
29/07/2015 27/07/2015 14/05/2015 03/03/2016
11/09/2015 02/11/2015 11/09/2015
04/11/2015 25/01/2016 03/11/2015
16/12/2015 02/03/2016
03/03/2016

44Johnson Electric Holdings Limited
Annual Report 2016
INTERNAL CONTROL ANDENTERPRISE RISK MANAGEMENT
The Board is responsible for ensuring that a sound and effective system of internal control and
enterprise risk management is maintained within the Group, and for reviewing its design and
operational adequacy and effectiveness through the Audit Committee.
The internal control and enterprise risk management system, which includes a defined management
structure with specified limits of authority and control responsibilities, is designed to (a) help the
achievement of business objectives and safeguard the Group’s assets; (b) ensure proper maintenance
of accounting records and reliability of financial reporting; (c) ensure compliance with relevant
legislation and regulations; and (d) identify, manage and mitigate key risks to the Group.
The internal control and enterprise risk management system is established to ensure reasonable, but
not absolute, assurance against material misstatement or loss and to manage, but not to eliminate,
risks of failure in achieving the Group’s objectives.
Pursuant to a risk-based approach, the Group’s Corporate Audit Services Department independently
reviews the risks associated with and controls over various operations and activities and evaluates
their adequacy, effectiveness and compliance. Audit findings and recommendations are reported to
the Audit Committee, senior management, and the external auditor. In addition, progress on audit
recommendations implementation is followed up on a regular basis and discussed with the Audit
Committee.
During its annual review, the Audit Committee also considers the adequacy of resources,
qualifications and experience of staff of the Group’s Corporate Audit Services Department, accounting
and financial reporting function and their training programs and budgets.
To supplement the above, under the Integrity and Ethics Policy, employees can report any ethical
misconduct, impropriety or fraud cases within the Group to the Johnson Electric Whistleblower Hotline
anonymously, or in writing in confidence without the fear of recrimination in particular.
Based on the results of evaluations and representations made by the management, the Group’s
Corporate Audit Services Department and the external auditor in FY2015/16, the Audit Committee is
satisfied that:
• There is an ongoing process for identifying, evaluating and managing the significant risks faced by
the Group that threaten the achievement of its business objectives; and
• An appropriate, effective and adequate system of internal control and enterprise risk management
has been in place in FY2015/16, and up to the date of approval of the Annual Report.

45
CORPORATE GOVERNANCE REPORT
EXTERNAL AUDITOR
The Company’s independent external auditor is PricewaterhouseCoopers. The Audit Committee is
responsible for considering the appointment of the external auditor and also reviews any non-audit
functions performed by the external auditor for the Group. In particular, the Committee will consider
whether such non-audit functions could lead to any potential material conflict of interest.
During FY2014/15 and FY2015/16, the services (and associated remuneration) provided to the
Group by PricewaterhouseCoopers were as follows:
US$ million FY2015/16 FY2014/15
Audit 2.52 2.46
Taxation services 1.31 1.32
Other advisory services 0.57 0.33
Included above are US$0.5 million of contracted fees for work to be performed subsequent to 31
March.
DIRECTORS’ AND AUDITOR’S RESPONSIBILITIES FOR ACCOUNTS
The Directors are responsible for the preparation of accounts for each financial period which give a
true and fair view of the state of affairs of the Group and of the results and cash flows for that
period. In preparing these accounts for the year ended 31 March 2016, the Directors have selected
suitable accounting policies and applied them consistently, made judgements and estimates that are
prudent and reasonable, and have prepared the accounts on a going concern basis. The Directors are
responsible for keeping proper accounting records which disclose with reasonable accuracy at any
time the financial position of the Group.
The responsibility of the external auditor to the shareholders is set out in the Independent Auditor’s
Report on pages 62 to 63.

46Johnson Electric Holdings Limited
Annual Report 2016
CORPORATE GOVERNANCE CODE
During the year ended 31 March 2016, the Company complied with the code provisions set out in the
Corporate Governance Code contained in Appendix 14 of the Listing Rules, except for the following
deviations:
Code Provision A.2.1
Code A.2.1 provides, inter alia, that the roles of chairman and chief executive should be separate and
should not be performed by the same individual.
Neither the Company’s Bye-laws nor The Johnson Electric Holdings Limited Company Act, 1988 (a
private act of Bermuda) contains any requirement as to the separation of these roles.
Dr. Patrick Shui-Chung Wang is the Chairman and Chief Executive of the Company. The Board is of the
opinion that it is appropriate and in the best interests of the Company that Dr. Wang should hold both
offices. The Board believes that it is able to effectively monitor and assess management in a manner
that properly protects and promotes the interests of shareholders.
Code Provision A.4.1 and A.4.2
Code A.4.1 provides, inter alia, that non-executive directors should be appointed for a specific term,
subject to re-election.
Code A.4.2 provides that every director, including those appointed for a specific term, should be
subject to retirement by rotation at least once every three years.
The independent non-executive directors are appointed for a specific term while the non-executive
directors do not have a specific term of appointment. However, under Section 3(e) of The Johnson
Electric Holdings Limited Company Act, 1988 and the Company’s Bye-law 109(A), one-third of the
Directors who have served longest on the Board since their last election shall retire and be eligible for
re-election at each annual general meeting. Accordingly, no director has a term of appointment longer
than three years. Bye-law 109(A) also states that the director holding office as the executive chairman
is not subject to retirement by rotation and shall not be counted in determining the number of
directors to retire.
In the opinion of the Board, it is important for the stability and beneficial to the growth of the
Company that there is, and is seen to be, continuity of leadership in the role of the Chairman of the
Company and, in consequence, the Board is of the view that the Chairman should not be subject to
retirement by rotation or hold office for a limited term at the present time.

47
CORPORATE GOVERNANCE REPORT
Code Provision A.6.7
Code A.6.7 provides, inter alia, that independent non-executive directors and other non-executive
directors should attend general meetings and develop a balanced understanding of the views of
shareholders.
Ms. Yik-Chun Koo Wang, Mr. Peter Kin-Chung Wang, Mr. Peter Stuart Allenby Edwards, Mr. Patrick
Blackwell Paul, Mr. Joseph Chi-Kwong Yam and Mr. Christopher Dale Pratt were unable to attend the
annual general meeting of the Company held on 9 July 2015 (“AGM”) due to overseas commitments
or other prior business engagements.
CONTINUOUS PROFESSIONAL DEVELOPMENT
On appointment to the Board, each Director receives an induction package covering the Group’s
businesses, operations and the general, statutory and regulatory obligations of being a director to
ensure sufficient awareness of responsibilities under the Listing Rules and other relevant regulatory
requirements. Thereafter, the Company provides the Directors with regular updates relating to the
Group’s business and the business environment in which the Group operates.
All Directors have complied with the code provision in relation to continuous professional development.
This has involved various forms of activities including attending presentations given by external
professional advisors and reading materials relevant to the Company’s business, director’s duties and
responsibilities.
The Company continuously updates Directors on the latest developments regarding the Listing Rules
and other applicable regulatory requirements, to ensure compliance and enhance their awareness of
good corporate governance practices.
SHAREHOLDERS’ RIGHTS
Convening a Special General Meeting
Pursuant to Section 74 of the Bermuda Companies Act 1981, shareholder(s) holding at the date of
the deposit of the requisition not less than one-tenth of the paid-up capital of the Company carrying
the right of voting at general meetings of the Company shall have the right to submit a written
requisition requiring a special general meeting (“SGM”) to be called by the Board. The written
requisition (i) must state the purposes of the SGM, and (ii) must be signed by the requisitionists and
deposited at the registered office of the Company for attention of the Company Secretary of the
Company, and may consist of several documents in like form, each signed by one or more
requisitionists. Such requisitions will be verified with the Company’s share registrars and upon their
confirmation that the requisition is proper and in order, the Company Secretary will ask the Board to
convene a SGM by serving sufficient notice to all shareholders. On the contrary, if the requisition has
been verified as not in order, the requisitionists will be advised of this outcome and accordingly, the
SGM will not be convened as requested.

48Johnson Electric Holdings Limited
Annual Report 2016
If the Board does not within 21 days from the date of the deposit of the requisition proceed duly to
convene a SGM, the requisitionists or any of them representing more than one-half of the total voting
rights of all of them may convene a SGM, but any SGM so convened shall not be held after expiration
of three months from the said date of deposit of the requisition. A SGM convened by the
requisitionists shall be convened in the same manner, as nearly as possible, as that in any SGM to
be convened by the Board.
Putting Forward Proposals at General Meetings
Pursuant to Sections 79 and 80 of the Bermuda Companies Act 1981, either any number of
shareholders representing not less than one-twentieth of the paid-up capital of the Company carrying
the right of voting at general meetings of the Company, or not less than 100 shareholders, can
request the Company in writing to (a) give to shareholders entitled to receive notice of the next annual
general meeting notice of any resolution which may properly be moved and is intended to be moved at
that meeting; and (b) circulate to shareholders entitled to have notice of any general meeting sent to
them any statement of not more than 1,000 words with respect to the matter referred to in any
proposed resolution or the business to be dealt with at that meeting. The requisition signed by all the
requisitionists must be deposited at the registered office of the Company with a sum reasonably
sufficient to meet the Company’s relevant expenses and not less than six weeks before the meeting
in case of a requisition requiring notice of a resolution or not less than one week before the meeting
in case of any other requisition.
Proposing a Person for Election as a Director
The procedures for proposing candidate(s) for election as director(s) at a general meeting are set out
in the Shareholder Information under the Investor Relations section of the website of the Group.
Enquiries to the Board
Shareholders may send their enquiries and concerns, in written form, to the Board by addressing
them to the Company Secretary at 12 Science Park East Avenue, 6/F., Hong Kong Science Park,
Shatin, New Territories, Hong Kong. Shareholders may also make enquiries to the Board at the general
meetings of the Company. In addition, shareholders can contact Computershare Hong Kong Investor
Services Limited, the share registrar of the Company in Hong Kong, if they have any enquiries about
their shareholdings and entitlements to dividend.

49
CORPORATE GOVERNANCE REPORT
Constitutional Documents
There was no significant change to the Company’s constitutional documents during FY2015/16.
MODEL CODE FOR SECURITIES TRANSACTIONS
The Company has adopted procedures governing directors’ securities transactions in compliance with
the Model Code as set out in Appendix 10 of the Listing Rules. Specific confirmation has been
obtained from all Directors to confirm compliance with the Model Code throughout the year ended 31
March 2016.
COMMUNICATIONS WITH SHAREHOLDERS
The Company uses a number of formal communication channels to account to shareholders for the
performance of the Group. These include the annual report and accounts, the interim report, periodic
announcements made through the Stock Exchange, as well as through the annual general meeting.
Copies of relevant corporate and financial information are also made available through the Group’s
website: www.johnsonelectric.com.
The Company aims to provide its shareholders and potential investors with high standards of
disclosure and financial transparency. In order to provide effective disclosure to investors and
potential investors and to ensure they all receive equal access to the same information at the same
time, inside information is released by way of formal public announcements as required by the Listing
Rules. The Company supplements and follows up such announcements through periodic
presentations, investor road shows and conference calls with the international investment community.
The Company also welcomes comments and questions from shareholders at its annual general
meeting.
The Board has adopted a set of Internal Control and Reporting Measures in respect of Inside
Information which provides guidance to Directors and management in handling and disseminating
inside information. The Media and Investor Communication Policy adopted by the Group sets out
guidelines to all staff to ensure inside information of the Group is to be handled in compliance with
the legal requirement.

50Johnson Electric Holdings Limited
Annual Report 2016
REPORT OF THE DIRECTORS
The Directors have pleasure in submitting their report together with the audited accounts for the year
ended 31 March 2016.
PRINCIPAL ACTIVITIES
The principal activity of the Company is investment holding. The principal activities of the subsidiaries
are shown in Note 38 to the accounts.
BUSINESS REVIEW
The business review of the Group for the year ended 31 March 2016 are provided in the Letter to
Shareholders and Management’s Discussion and Analysis sections respectively from pages 8 to 11
and pages 12 to 36 of this Annual Report.
RESULTS AND APPROPRIATIONS
The results of the Group for the year ended 31 March 2016 are set out in the consolidated income
statement on page 66 of the accounts.
The Directors declared an interim dividend of 15 HK cents (1.92 US cents) per share, totalling
US$16.6 million which was paid on 6 January 2016.
The Board recommends the payment of a final dividend of 34 HK cents (4.36 US cents) per share,
totalling US$37.5 million, payable on 12 August 2016.
DISTRIBUTABLE RESERVES
As of 31 March 2016, the distributable reserves of the Company available for distribution as
dividends amounted to US$1,790.1 million, comprising retained earnings of US$1,731.0 million and
contributed surplus of US$59.1 million.
Under the Bermuda Companies Act 1981 (as amended), the contributed surplus shall not be
distributed to the shareholders if there are reasonable grounds for believing that:
(i) The Company is, or would after the payment be, unable to pay its liabilities as they become due; or
(ii) The realisable value of the Company’s assets would thereby be less than its liabilities.
51
REPORT OF THE DIRECTORS
DONATIONS
During the year, the Group made donations of US$0.2 million (FY2014/15: US$0.2 million).
CONVERTIBLE BONDS
On 2 April 2014, the Group issued convertible bonds (“CB”) in an aggregate principal amount of
US$200 million with a cash coupon rate of 1% per annum, and a 7 year life with a 5 year put option.
Further information on the CB can be found in page 92 of this Annual Report.
DIRECTORS
The Directors during the year and up to the date of this report were:
Yik-Chun Koo Wang
Patrick Shui-Chung Wang JP
Winnie Wing-Yee Wang
Austin Jesse Wang
Peter Kin-Chung Wang
Peter Stuart Allenby Edwards
Patrick Blackwell Paul CBE, FCA
Michael John Enright
Joseph Chi-Kwong Yam GBM, GBS, CBE, JP
Christopher Dale Pratt CBE
In accordance with Bye-law 109(A) of the Company’s Bye-laws, Ms. Yik-Chun Koo Wang, Mr. Peter
Stuart Allenby Edwards and Prof. Michael John Enright shall retire from office by rotation and being
eligible, offer themselves for re-election.
None of the directors proposed for re-election at the forthcoming Annual General Meeting has a
service contract with the Company which is not determinable by the Company within one year without
payment of compensation, other than statutory compensation.
No transactions, arrangements and contracts of significance in relation to the Group’s business to
which the Company or any of its subsidiaries was a party and in which a Director of the Company or
an entity connected with the Directors of the Company had a material interests, whether directly or
indirectly, subsisted at the end of the year or at any time during the year.
The Company is managed through the Board which currently comprises ten directors. As of the date
of this report, three of the directors are executive and seven of the directors are non-executive, of
whom five are independent. Their details are set out in the Profile of Directors and Senior
Management section on pages 164 to 167.

52Johnson Electric Holdings Limited
Annual Report 2016
DISCLOSURE OF INTERESTS
Directors
As of 31 March 2016, the interests of each Director and Chief Executive of the Company in the
shares of the Company or any of the Company’s associated corporations (within the meaning of Part
XV of the Securities and Futures Ordinance (“SFO”)) as recorded in the register required to be kept
under Section 352 of the SFO were as follows:
Shares of HK$0.05 each
of the Company
Name
Personal
Interests
Other
Interests
Patrick Shui-Chung Wang 521,500 – (Note 1)
Winnie Wing-Yee Wang 165,500 – (Note 2)
Austin Jesse Wang 90,375 – (Note 3)
Yik-Chun Koo Wang – 550,625,220 (Notes 4 & 5)
Peter Kin-Chung Wang – 144,250 (Note 6)
Peter Stuart Allenby Edwards – 40,250 (Note 7)
Patrick Blackwell Paul 32,750 –
Michael John Enright 15,250 –
Joseph Chi-Kwong Yam 11,750 –
Christopher Dale Pratt 56,000 –
Notes:
1. The interest comprises 521,500 underlying shares in respect of the awarded shares granted, which remained unvested, under the Johnson
Electric Restricted and Performance Stock Unit Plan.
2. The interest comprises 165,500 underlying shares in respect of the awarded shares granted, which remained unvested, under the Johnson
Electric Restricted and Performance Stock Unit Plan.
3. The interest comprises 90,375 underlying shares in respect of the awarded shares granted, which remained unvested, under the Long-Term
Incentive Share Scheme.
4. These shares were held, directly or indirectly, by the trustees of various trusts associated with the Wang family.
5. Duplications of shareholdings occurred among and between the parties shown below under Substantial Shareholders.
6. These shares were held beneficially by Peter Kin-Chung Wang’s spouse.
7. These shares were held under a trust of which Peter Stuart Allenby Edwards was one of the beneficiaries.
Save as disclosed herein, as of 31 March 2016, the register maintained by the Company pursuant to
Section 352 of the SFO recorded no other interests or short positions of the Directors and Chief
Executive in any shares of the Company or its associated corporations (within the meaning of Part XV
of the SFO).
At no time during the year, the Directors and Chief Executive (including their spouses and children
under 18 years of age) had any interests in, or had been granted, or exercised, any rights to subscribe
for shares of the Company or its associated corporations required to be disclosed pursuant to the
SFO.

53
REPORT OF THE DIRECTORS
Substantial Shareholders
As of 31 March 2016, the register of substantial shareholders maintained under Section 336 of the
SFO shows that the Company had been notified of the following substantial shareholders’ interests,
being 5% or more of the Company’s issued share capital:
Name of shareholder Capacity
Numbers of
shares held
Approximate %
of shareholding
Yik-Chun Koo Wang Beneficiary of
family trusts
550,625,220
(Notes 1 & 2)
62.65
Ansbacher (Bahamas) Limited Trustee 221,760,000
(Note 1)
25.23
HSBC International Trustee Limited Trustee 190,442,915
(Note 1)
21.66
Great Sound Global Limited Interest of controlled
corporation
188,636,340
(Note 3)
21.46
Winibest Company Limited Beneficial owner 188,636,340
(Note 4)
21.46
Federal Trust Company Limited Trustee 140,228,880
(Note 1)
15.95
Schroders Plc Investment manager 70,046,689 7.97
Ceress International Investment
(PTC) Corporation
Trustee 55,753,520
(Note 5)
6.34
Merriland Overseas Limited Interest of controlled
corporation
52,985,760
(Note 6)
6.02
Notes:
1. The shares in which Ansbacher (Bahamas) Limited and Federal Trust Company Limited were interested and 188,636,340 of the shares in
which HSBC International Trustee Limited was interested were held, directly or indirectly, by them as the trustees of various trusts associated
with the Wang family and were included in the shares in which Ms. Yik-Chun Koo Wang was interested as referred to above under Directors’
Interests of Disclosure of Interests.
2. The shares in which Ms. Yik-Chun Koo Wang was interested as referred to above formed part of the shares referred to in Note 1.
3. The interests of Great Sound Global Limited in the Company formed part of the interests in the Company held by HSBC International Trustee
Limited.
4. The interests of Winibest Company Limited in the Company were duplicated by the interests in the Company held by Great Sound Global
Limited.
5. The interests of Ceress International Investment (PTC) Corporation in the Company formed part of the interests in the Company held by
Federal Trust Company Limited.
6. The interests of Merriland Overseas Limited in the Company formed part of the interests in the Company held by Federal Trust Company
Limited.
Save as disclosed herein, as of 31 March 2016, the register maintained by the Company pursuant to
Section 336 of the SFO recorded no other interests or short positions in the shares of the Company.

54Johnson Electric Holdings Limited
Annual Report 2016
INCENTIVE SHARE SCHEMES
The Long-Term Incentive Share Scheme (“Share Scheme”) was approved by the shareholders on 24
August 2009 and was further amended and approved by the shareholders on 20 July 2011. The
Board may grant time-vested units (Restricted Stock Units) and performance-vested units (Performance
Stock Units) or cash payment in lieu of shares to such eligible employees and directors as the Board
may select at its absolute discretion under the Share Scheme. A new share scheme, the Johnson
Electric Restricted and Performance Stock Unit Plan (“Stock Unit Plan”) was approved by the
shareholders on 9 July 2015 and no further grants of share awards under the Share Scheme could be
made afterwards. Unvested share awards granted under the Share Scheme continue to be valid
subject to the provisions of the Share Scheme.
The purpose of the Stock Unit Plan is to align management with ownership. The Stock Unit Plan helps
to attract skilled and experienced personnel, incentivise them to remain with the Group and to
motivate them to strive for the future development and expansion of the Group.
The following is a summary of the Stock Unit Plan:
1. Participants
The participants of the Stock Unit Plan are the Directors (including executive Directors, non-
executive Directors and independent non-executive Directors), the directors of the Company’s
subsidiaries and the employees of the Group who the Board considers, in its sole and absolute
discretion, have contributed or will contribute significantly to the Group.
2. Awards
A contingent right to receive either fully paid ordinary shares of the Company or a cash
payment, in either case is awarded pursuant to the Stock Unit Plan (“Awards”).
3. Term
Subject to any early termination of the Stock Unit Plan in accordance with the Stock Unit Plan,
the Stock Unit Plan shall be valid and effective for a term of 10 years commencing from the
date of adoption of the Stock Unit Plan (“Term”).
4. Eligibility
The Board may, at its discretion, invite directors and employees of the Group, who the Board
considers, in its sole and absolute discretion, have contributed or will contribute to the Group,
to participate in the Stock Unit Plan.

55
REPORT OF THE DIRECTORS
5. Administration
The Stock Unit Plan shall be subject to the administration of the Board. The Company may
appoint professional trustee to assist with the administration and vesting of Awards granted.
6. Grant of Awards
The Board may, at any time during the Term, at its sole and absolute discretion, make an offer
of the grant of an Award to any participant as the Board may in its sole and absolute discretion
select, subject to the terms of the Stock Unit Plan.
Any offer of the grant of an Award to any Director, chief executive or substantial shareholder of
the Company, or any of their respective associates, shall be subject to the prior approval of the
remuneration committee (excluding any member of the remuneration committee who is the
proposed grantee of the grant in question) of the Company and all grants to connected persons
shall be subject to compliance with the requirements of the Listing Rules.
7. Vesting of Awards
Subject to the terms of the Stock Unit Plan, the Board may determine from time to time such
vesting conditions or vesting periods for an Award to be vested. For the purpose of satisfying
the grant of Awards, the Board shall determine whether the Company shall, at its sole and
absolute discretion, (a) allot and issue new shares (by using the general mandate to issue and
allot shares for grantees who are not connected persons); and/or (b) direct and procure the
trustee of the Stock Unit Plan appointed by the Company to acquire through on-market
purchases of shares; and/or (c) pay or procure the payment of a cash payment.
8. Maximum Number of Shares to be Granted
The total number of shares that may underlie the Awards granted pursuant to the Stock Unit Plan
and any other equity-based incentive awards granted under any other equity-based incentive
schemes of the Company, shall not exceed 10% of the aggregate number of shares of the
Company in issue as of the date of adoption of the Stock Unit Plan (“Scheme Mandate Limit”).
The Scheme Mandate Limit may be renewed subject to prior approval of the shareholders of the
Company, but in any event, the total number of shares that may underlie the Awards granted
following the new approval date under the limit as renewed must not exceed 10% of the
aggregate number of shares of the Company in issue as of the new approval date. Shares
underlying the Awards granted pursuant to the Stock Unit Plan (including those outstanding,
cancelled or vested Awards) prior to the new approval date will not be counted for the purpose
of determining the maximum aggregate number of shares that may underlie the Awards granted
following the new approval date under the limit as renewed. For the avoidance of doubt, shares
issued prior to the new approval date pursuant to the vesting of Awards granted pursuant to the
Stock Unit Plan will be counted for the purpose of determining the aggregate number of shares
in issue as of the new approval date.

56Johnson Electric Holdings Limited
Annual Report 2016
9. Dividends and Voting Rights
The Awards do not carry any right to vote at general meetings of the Company. A grantee shall
not be entitled to any dividends or distributions in respect of any shares underlying the Awards
granted until such shares have been allotted and issued or transferred (as the case may be) to
the grantee.
10. Transferability
Subject to the terms of the Stock Unit Plan, an Award shall be personal to the grantee and
shall not be assignable or transferrable. A grantee shall not in any way sell, transfer, charge,
mortgage, encumber or create any interests in favour of any third party over or in relation to any
Award.
11. Alteration
The Board may alter any of the terms of the Stock Unit Plan at any time provided that any
changes to the authority of the Board in relation to any alteration of the terms of the Stock Unit
Plan shall not be made without the prior approval of shareholders of the Company in general
meeting or any alterations to the terms and conditions of the Stock Unit Plan which are of a
material nature or any changes to the terms of the Awards granted must be approved by the
shareholders of the Company in general meeting, except where the alterations or changes take
effect automatically under the existing terms of the Stock Unit Plan.
12. Termination
The Company by ordinary resolution in general meeting or the Board may at any time terminate
the Stock Unit Plan and in such event, no further Awards may be granted but in all other
respects the terms of the Stock Unit Plan shall remain in full force and effect in respect of
Awards which are granted during the Term and which remain unvested immediately prior to the
termination.
During the year ended 31 March 2016, the Company purchased 6,495,000 shares of the Company at
a cost of HK$170.68 million in connection with the Share Scheme and the Stock Unit Plan for eligible
employees and directors. The highest and the lowest purchase price paid per share were HK$27.15
and HK$22.75, respectively.

57
REPORT OF THE DIRECTORS
Movements in the number of unvested shares granted as of the date of this report under both the
Share Scheme and the Stock Unit Plan on a combined basis are as follows:
Number of unvested
shares granted (thousands)
Restricted
Stock Units
Performance
Stock Units Total
Unvested shares granted, as of 31 March 2015 4,518 5,530 10,048
Shares granted to Directors and employees
during the year 2,487 2,312 4,799
Shares vested to Directors and employees
during the year (1,275) (1,252) (2,527)
Forfeited during the year (122) (113) (235)
Unvested shares granted, as of 31 March 2016 5,608 6,477 12,085
Shares vested to Directors and employees in FY2016/17 (1,334) – (1,334)
Forfeited in FY2016/17 (141) (262) (403)
Unvested shares granted, as of the date of this report 4,133 6,215 10,348
The number of unvested shares are as follows:
Number of unvested
shares granted (thousands)
Vesting period
Restricted
Stock Units
Performance
Stock Units Total
FY2016/17 – 2,030 2,030
FY2017/18 1,336 2,009 3,345
FY2018/19 2,472 2,176 4,648
FY2019/20 325 – 325
Total unvested shares, as of the date of this report 4,133 6,215 10,348
Apart from the Share Scheme and the Stock Unit Plan mentioned above, there were no other
arrangements to which the Company or its subsidiaries was a party to enable the Directors of the
Company to acquire benefits by means of the acquisition of shares in, or debentures of, the Company
or any other body corporate.

58Johnson Electric Holdings Limited
Annual Report 2016
PURCHASE, SALE OR REDEMPTION OF SHARES
During the year ended 31 March 2016, the Company repurchased a total of 1,697,500 ordinary
shares of HK$0.05 each of the Company on the Stock Exchange. All of the shares repurchased were
subsequently cancelled. The number of issued shares of the Company as of 31 March 2016 was
878,844,605. Particulars of the shares repurchased are as follows:
Purchase price
paid per share Aggregate
consideration paid
HK$ million*
Month of
repurchase
Number of ordinary
shares repurchased
Highest
HK$
Lowest
HK$
November 2015 97,500 25.75 24.80 2.46
December 2015 250,500 27.40 26.85 6.80
February 2016 527,000 23.75 22.75 12.34
March 2016 822,500 23.40 22.60 18.97
1,697,500 40.57
* Excluding brokerage and cancellation fees of HK$0.1 million
The Directors consider the repurchases a constructive element in the prudent management of the
Company’s overall capital structure and in enhancing returns to shareholders over time.
Save as disclosed above, neither the Company nor any of its subsidiaries purchased, sold or
redeemed any of the Company’s shares during the year.
JOHNSON ELECTRIC GROUP TEN-YEAR SUMMARY
A summary of the results and of the assets and liabilities of the Group for the previous ten financial
years are set out on pages 162 to 163.
PRE-EMPTIVE RIGHTS
No pre-emptive rights exist under the laws of Bermuda in relation to issues of new shares by the
Company.
MAJOR SUPPLIERS AND CUSTOMERS
During the year, the Group purchased less than 30% of its goods and services from its five largest
suppliers and sold less than 30% of its goods and services to its five largest customers.

59
REPORT OF THE DIRECTORS
PERMITTED INDEMNITY PROVISION
During the financial year and up to the date of this report, subject to the applicable laws, the directors
of the Company and its subsidiaries are entitled to be indemnified pursuant to the provisions in force
for the benefit of directors against liabilities incurred in the execution and discharge of their duties in
accordance with the respective articles of associations or constitutional documents of the Company
and its subsidiaries.
PUBLIC FLOAT
Based on the information that is publicly available to the Company and within the knowledge of the
Directors of the Company, as of the date of this report, there is sufficient public float of more than
25% of the Company’s issued shares as required under the Listing Rules.
SENIOR MANAGEMENT
The profile of the senior management is set out in the Profile of Directors and Senior Management
section on pages 167 to 169.
CORPORATE GOVERNANCE
Principal corporate governance practices as adopted by the Company are set out in the Corporate
Governance Report on pages 37 to 49.
AUDITOR
The accounts have been audited by PricewaterhouseCoopers, who retire and, being eligible, offer
themselves for re-appointment.
On behalf of the Board
Patrick Shui-Chung Wang JP
Chairman and Chief Executive
Hong Kong, 17 May 2016

60Johnson Electric Holdings Limited
Annual Report 2016
FINAL DIVIDEND
The Board will recommend at the Annual General Meeting to be held on 14 July 2016 (Thursday) a
final dividend of 34 HK cents equivalent to 4.36 US cents per share (2015: 34 HK cents or 4.36 US
cents) payable on 12 August 2016 (Friday) to persons who are registered shareholders of the
Company on 3 August 2016 (Wednesday), making a total distribution of 49 HK cents equivalent to
6.28 US cents per share for the year ended 31 March 2016 (2015: 48 HK cents or 6.15 US cents).
CLOSING REGISTER OF SHAREHOLDERS
ATTENDING ANNUAL GENERAL MEETING
The Register of Shareholders of the Company will be closed from 12 July 2016 (Tuesday) to 14 July
2016 (Thursday) inclusive, during which no transfer of shares will be registered.
In order to qualify for attending and voting at the Annual General Meeting, all transfers accompanied
by the relevant share certificates must be lodged with the Company’s registrar in Hong Kong,
Computershare Hong Kong Investor Services Limited at Shops 1712-1716, 17th Floor, Hopewell
Centre, 183 Queen’s Road East, Wan Chai, Hong Kong (not the registrar in Bermuda) for registration,
not later than 4:30 p.m. on 11 July 2016 (Monday).
FINAL DIVIDEND
The Register of Shareholders of the Company will be closed from 1 August 2016 (Monday) to 3 August
2016 (Wednesday) inclusive, during which no transfer of shares will be registered.
In order to qualify for the proposed final dividend, all transfers accompanied by the relevant share
certificates must be lodged with the Company’s Registrar in Hong Kong, Computershare Hong Kong
Investor Services Limited at Shops 1712-1716, 17th Floor, Hopewell Centre, 183 Queen’s Road East,
Wan Chai, Hong Kong (not the registrar in Bermuda) for registration, not later than 4:30 p.m. on 29
July 2016 (Friday). Shares of the Company will be traded ex-dividend as from 28 July 2016 (Thursday).

61
STATEMENT OF ACCOUNTS
CONTENTS
INDEPENDENT AUDITOR’S REPORT 62
CONSOLIDATED BALANCE SHEET 64
CONSOLIDATED INCOME STATEMENT 66
CONSOLIDATED STATEMENT OF COMPREHENSIVE INCOME 67
CONSOLIDATED STATEMENT OF CHANGES IN EQUITY 68
CONSOLIDATED CASH FLOW STATEMENT 70
NOTES TO THE ACCOUNTS 72

62Johnson Electric Holdings Limited
Annual Report 2016
INDEPENDENT AUDITOR’S REPORT
TO THE SHAREHOLDERS OF JOHNSON ELECTRIC HOLDINGS LIMITED(incorporated in Bermuda with limited liability)
We have audited the consolidated financial statements of Johnson Electric Holdings Limited (the
“Company”) and its subsidiaries set out on pages 64 to 161, which comprise the consolidated
balance sheet as at 31 March 2016, and the consolidated income statement, the consolidated
statement of comprehensive income, the consolidated statement of changes in equity and the
consolidated cash flow statement for the year then ended, and a summary of significant accounting
policies and other explanatory information.
DIRECTORS’ RESPONSIBILITY FOR THE CONSOLIDATED FINANCIAL STATEMENTS
The directors of the Company are responsible for the preparation of consolidated financial statements
that give a true and fair view in accordance with Hong Kong Financial Reporting Standards issued by
the Hong Kong Institute of Certified Public Accountants, and the disclosure requirements of the Hong
Kong Companies Ordinance, and for such internal control as the directors determine is necessary to
enable the preparation of consolidated financial statements that are free from material misstatement,
whether due to fraud or error.
AUDITOR’S RESPONSIBILITY
Our responsibility is to express an opinion on these consolidated financial statements based on our
audit and to report our opinion solely to you, as a body, in accordance with section 90 of the
Companies Act 1981 of Bermuda and for no other purpose. We do not assume responsibility towards
or accept liability to any other person for the contents of this report.
We conducted our audit in accordance with Hong Kong Standards on Auditing issued by the Hong
Kong Institute of Certified Public Accountants. Those standards require that we comply with ethical
requirements and plan and perform the audit to obtain reasonable assurance about whether the
consolidated financial statements are free from material misstatement.
An audit involves performing procedures to obtain audit evidence about the amounts and disclosures
in the consolidated financial statements. The procedures selected depend on the auditor’s judgement,
including the assessment of the risks of material misstatement of the consolidated financial
statements, whether due to fraud or error. In making those risk assessments, the auditor considers
internal control relevant to the entity’s preparation of consolidated financial statements that give a

63
true and fair view in order to design audit procedures that are appropriate in the circumstances, but
not for the purpose of expressing an opinion on the effectiveness of the entity’s internal control. An
audit also includes evaluating the appropriateness of accounting policies used and the
reasonableness of accounting estimates made by the directors, as well as evaluating the overall
presentation of the consolidated financial statements.
We believe that the audit evidence we have obtained is sufficient and appropriate to provide a basis
for our audit opinion.
OPINION
In our opinion, the consolidated financial statements give a true and fair view of the financial position
of the Company and its subsidiaries as at 31 March 2016, and of their financial performance and
cash flows for the year then ended in accordance with Hong Kong Financial Reporting Standards and
have been properly prepared in compliance with the disclosure requirements of the Hong Kong
Companies Ordinance.
PricewaterhouseCoopers
Certified Public Accountants
Hong Kong, 17 May 2016

64Johnson Electric Holdings Limited
Annual Report 2016
CONSOLIDATED BALANCE SHEETAs of 31 March 2016
Note
2016
US$’000
2015
US$’000
Assets
Non-current assets
Property, plant and equipment 3 667,489 410,578
Investment property 4 91,530 82,035
Intangible assets 5 1,083,405 595,578
Investment in associates 6 37,897 2,720
Other financial assets 7 137,092 215,182
Defined benefit pension plan assets 14 8,410 7,156
Deferred income tax assets 15 48,650 43,500
Other non-current assets 19,099 9,679
2,093,572 1,366,428
Current assets
Inventories 8 270,692 222,029
Trade and other receivables 9 542,234 414,893
Non-current assets held for sale – 8,003
Other financial assets 7 38,434 60,072
Income tax recoverable 2,035 3,386
Pledged deposits 10 9,119 –
Cash and deposits 10 193,325 773,172
1,055,839 1,481,555
Current liabilities
Trade payables 11 250,240 206,161
Other payables and deferred income 224,257 175,319
Current income tax liabilities 34,892 37,244
Other financial liabilities 7 31,271 14,531
Borrowings 12 98,434 65,816
Provision obligations and other liabilities 14 29,033 21,713
668,127 520,784
Net current assets 387,712 960,771
Total assets less current liabilities 2,481,284 2,327,199

65
Note
2016
US$’000
2015
US$’000
Non-current liabilities
Other payables and deferred income 14,854 16,642
Other financial liabilities 7 111,848 72,189
Borrowings 12 121,706 28,214
Convertible bonds 13 202,387 197,345
Deferred income tax liabilities 15 103,487 69,821
Provision obligations and other liabilities 14 42,250 42,076
596,532 426,287
NET ASSETS 1,884,752 1,900,912
Equity
Share capital – Ordinary shares (at par value) 16 5,670 5,681
Shares held for incentive share schemes
(at purchase cost) 16 (75,450) (61,082)
Reserves 17 1,912,358 1,917,719
1,842,578 1,862,318
Non-controlling interests 42,174 38,594
TOTAL EQUITY 1,884,752 1,900,912
The notes on pages 72 to 161 form an integral part of these consolidated financial statements.
Patrick Shui-Chung Wang JP Winnie Wing-Yee Wang
Director Director

66Johnson Electric Holdings Limited
Annual Report 2016
CONSOLIDATED INCOME STATEMENTFor the year ended 31 March 2016
Note
2016
US$’000
2015
US$’000
Sales 2 2,235,945 2,136,052
Cost of goods sold (1,646,433) (1,503,647)
Gross profit 589,512 632,405
Other income and gains, net 18 28,454 17,918
Selling and administrative expenses 19 (410,763) (407,539)
Operating profit 207,203 242,784
Finance income 20 6,236 13,998
Finance costs 20 (9,416) (8,452)
Share of profit of associates 6 2,613 731
Profit before income tax 206,636 249,061
Income tax expense 22 (23,889) (29,249)
Profit for the year 182,747 219,812
Profit attributable to non-controlling interests (10,087) (8,918)
Profit attributable to shareholders 172,660 210,894
Basic earnings per share for profit attributable
to the shareholders during the year
(expressed in US cents per share) 23 20.09 24.11
Diluted earnings per share for profit attributable
to the shareholders during the year
(expressed in US cents per share) 23 19.75 23.60
The notes on pages 72 to 161 form an integral part of these consolidated financial statements.
The Board has recommended a final dividend of 34 HK cents (4.36 US cents) per share (FY2014/15:
34 HK cents or 4.36 US cents) equivalent to US$37.5 million (FY2014/15: US$37.8 million), details
are set out in Note 24.

67
CONSOLIDATED STATEMENT OF COMPREHENSIVE INCOMEFor the year ended 31 March 2016
Note2016
US$’0002015
US$’000
Profit for the year 182,747 219,812
Other comprehensive income / (expenses)
Items that will not be recycled to profit and loss:
Defined benefit plans
– remeasurements 14 & 17 1,932 (15,812)
– deferred income tax effect 15 & 17 753 1,553
Long service payment
– remeasurements 14 & 17 98 230
– deferred income tax effect 15 & 17 (17) (39)
Total items that will not be recycled to profit and loss 2,766 (14,068)
Items that will be recycled to profit and loss:
Hedging instruments
– raw material commodity contracts
– fair value losses, net 17 (51,268) (17,088)
– transferred to inventory and subsequently
recognised in income statement 17 20,878 8,107
– deferred income tax effect 15 & 17 5,014 1,482
– forward foreign currency exchange contracts
– fair value (losses) / gains, net 17 (67,676) 175,868
– transferred to income statement 17 (38,978) (17,104)
– deferred income tax effect 15 & 17 19,053 (23,790)
– net investment hedge
– fair value (losses) / gains, net 17 (13,422) 61,693
Currency translations of subsidiaries and associates 873 (103,858)
Total items that will be recycled to profit and loss (125,526) 85,310
Other comprehensive (expenses) / income for the year,
net of tax (122,760) 71,242
Total comprehensive income for the year, net of tax 59,987 291,054
Total comprehensive income attributable to:
Shareholders 52,169 281,659
Non-controlling interests
Share of profits for the year 10,087 8,918
Currency translations (2,269) 477
59,987 291,054
The notes on pages 72 to 161 form an integral part of these consolidated financial statements.

68Johnson Electric Holdings Limited
Annual Report 2016
CONSOLIDATED STATEMENT OF CHANGES IN EQUITYFor the year ended 31 March 2016
Attributable to shareholders of JEHL
Note
Sharecapital
US$’000
Otherreserves*US$’000
RetainedearningsUS$’000
TotalUS$’000
Non-controlling
interestsUS$’000
Totalequity
US$’000
As of 31 March 2015 (55,401) 138,937 1,778,782 1,862,318 38,594 1,900,912
Profit for the year – – 172,660 172,660 10,087 182,747Other comprehensive income / (expenses):
Hedging instruments– raw material commodity contracts
– fair value losses, net 17 – (51,268) – (51,268) – (51,268)– transferred to inventory and subsequently recognised
in income statement 17 – 20,878 – 20,878 – 20,878– deferred income tax effect 15 & 17 – 5,014 – 5,014 – 5,014
– forward foreign currency exchange contracts– fair value losses, net 17 – (67,676) – (67,676) – (67,676)– transferred to income statement 17 – (38,978) – (38,978) – (38,978)– deferred income tax effect 15 & 17 – 19,053 – 19,053 – 19,053
– net investment hedge– fair value losses, net 17 – (13,422) – (13,422) – (13,422)
Defined benefit plans– remeasurements 14 & 17 – – 1,932 1,932 – 1,932– deferred income tax effect 15 & 17 – – 753 753 – 753
Long service payment– remeasurements 14 & 17 – – 98 98 – 98– deferred income tax effect 15 & 17 – – (17) (17) – (17)
Investment property– revaluation surplus realised upon disposal 17 – (108) 108 – – –
Currency translations of subsidiaries and associates 17 – 3,142 – 3,142 (2,269) 873
Total comprehensive income / (expenses) for FY2015/16 – (123,365) 175,534 52,169 7,818 59,987
Transactions with shareholders:
Appropriation of retained earnings to statutory reserve 17 – 4,476 (4,476) – – –
Cancellation of issued capital 16 & 17 (11) (5,224) – (5,235) – (5,235)
Incentive share schemes– shares vested 16 & 17 7,646 (7,646) – – – –– value of employee services 17 & 26 – 9,734 – 9,734 – 9,734– purchase of shares 16 (22,014) – – (22,014) – (22,014)
Dividend paid to non-controlling shareholders of a subsidiary – – – – (4,238) (4,238)
FY2014/15 final dividend paid 17 – – (37,802) (37,802) – (37,802)FY2015/16 interim dividend paid 17 – – (16,592) (16,592) – (16,592)
Total transactions with shareholders (14,379) 1,340 (58,870) (71,909) (4,238) (76,147)
As of 31 March 2016 (69,780)** 16,912 1,895,446 1,842,578 42,174 1,884,752
* Other reserves mainly represent contributed surplus, capital reserve, property revaluation reserve, equity component of convertible bonds (net of taxes), statutory reserve, exchange reserve, share-based employee compensation reserve, hedging reserve and goodwill on consolidation.
** The total of US$(69.8) million is comprised by share capital of US$5.7 million and shares held for incentive share schemes of US$(75.5) million.
The notes on pages 72 to 161 form an integral part of these consolidated financial statements.

69
CONSOLIDATED STATEMENT OF CHANGES IN EQUITYFor the year ended 31 March 2015
Attributable to shareholders of JEHL
Note
Sharecapital
US$’000
Otherreserves*US$’000
RetainedearningsUS$’000
TotalUS$’000
Non-controlling
interestsUS$’000
Totalequity
US$’000
As of 31 March 2014 15,505 76,409 1,640,385 1,732,299 34,019 1,766,318
Profit for the year – – 210,894 210,894 8,918 219,812Other comprehensive income / (expenses):
Hedging instruments– raw material commodity contracts
– fair value losses, net 17 – (17,088) – (17,088) – (17,088)– transferred to inventory and subsequently
recognised in income statement 17 – 8,107 – 8,107 – 8,107– deferred income tax effect 15 & 17 – 1,482 – 1,482 – 1,482
– forward foreign currency exchange contracts– fair value gains, net 17 – 175,868 – 175,868 – 175,868– transferred to income statement 17 – (17,104) – (17,104) – (17,104)– deferred income tax effect 15 & 17 – (23,790) – (23,790) – (23,790)
– net investment hedge– fair value gains, net 17 – 61,693 – 61,693 – 61,693
Defined benefit plans– remeasurements 14 & 17 – – (15,812) (15,812) – (15,812)– deferred income tax effect 15 & 17 – – 1,553 1,553 – 1,553
Long service payment– remeasurements 14 & 17 – – 230 230 – 230– deferred income tax effect 15 & 17 – – (39) (39) – (39)
Investment property– revaluation surplus realised upon disposal 17 – (14) 14 – – –
Currency translations of subsidiaries and associate 17 – (104,335) – (104,335) 477 (103,858)
Total comprehensive income for FY2014/15 – 84,819 196,840 281,659 9,395 291,054
Transactions with shareholders:
Appropriation of retained earnings to statutory reserve 17 – 4,224 (4,224) – – –
Convertible bonds– equity component of convertible bonds issued 17 – 4,823 – 4,823 – 4,823– deferred income tax effect 15 & 17 – (3,868) – (3,868) – (3,868)
Cancellation of issued capital 16 & 17 (24,069) (30,926) – (54,995) – (54,995)
Incentive share schemes– shares vested 16 & 17 3,889 (3,889) – – – –– value of employee services 17 & 26 – 7,413 – 7,413 – 7,413– purchase of shares 16 (50,726) – – (50,726) – (50,726)
Share options– options lapsed 17 – (68) 68 – – –
Dividend paid to non-controlling shareholders of a subsidiary – – – – (4,820) (4,820)
FY2013/14 final dividend paid 17 – – (38,765) (38,765) – (38,765)FY2014/15 interim dividend paid 17 – – (15,522) (15,522) – (15,522)
Total transactions with shareholders (70,906) (22,291) (58,443) (151,640) (4,820) (156,460)
As of 31 March 2015 (55,401) 138,937 1,778,782 1,862,318 38,594 1,900,912
* Other reserves mainly represent contributed surplus, capital reserve, property revaluation reserve, equity component of convertible bonds (net of taxes), statutory reserve, exchange reserve, share-based employee compensation reserve, hedging reserve and goodwill on consolidation.

70Johnson Electric Holdings Limited
Annual Report 2016
CONSOLIDATED CASH FLOW STATEMENTFor the year ended 31 March 2016
Note
2016
US$’000
2015
US$’000
Cash flows from operating activities
Earnings before interest, taxes, depreciation and
amortisation 26 321,869 335,520
Other non-cash items and adjustments 26 4,870 (1,546)
Change in working capital 26 (46,352) (21,076)
Cash generated from operations 26 280,387 312,898
Interest paid (4,373) (2,583)
Income taxes paid (34,635) (43,172)
Net cash generated from operating activities 241,379 267,143
Investing activities
Purchase of property, plant and equipment and
capitalised expenditure of investment property, net of
subsidies (186,239) (119,875)
Proceeds from disposal of property, plant and
equipment and investment property 26 15,640 812
Capitalisation of engineering development costs 5 (6,144) (6,269)
Finance income received 6,236 13,998
(170,507) (111,334)
Business combination * 27 (671,184) (9,203)
Increase in pledged deposits (9,119)** –
Acquisition of non-controlling interests – (285)
Purchase of financial assets at fair value through
profit and loss – (3,257)
Proceeds from sale of financial assets at fair value
through profit and loss 179 4,373
Net cash used in investing activities (850,631) (119,706)
* On 27 October 2015, the Group acquired the Stackpole International group of companies (“Stackpole International”). In FY2015/16, cash
consideration net of cash in subsidiaries acquired in relation to this acquisition amounted to US$657.2 million. In addition, US$12.7 million
acquisition transaction costs (US$11.1 million current year charges and US$1.6 million prepaid) has been paid. For details, please refer to
Note 27.
During the year, the Group also spent US$1.3 million related to the acquisition of AML Systems.
In FY2014/15, the Group paid US$9.2 million to insource a sales agency in the UK.
** Pledged deposits of US$9.1 million relate to cash collateral for letters of credit issued in favour of the landlord to secure the interests of
Stackpole International under a pre-existing lease agreement for premises in Canada.

71
Note
2016
US$’000
2015
US$’000
Financing activities
Purchase of shares for cancellation of issued capital 16 (5,235) (54,995)
Purchase of shares held for incentive share schemes 16 (22,014) (50,726)
Proceeds from bank borrowings 72,680 (a) –
Proceeds from loan from International Finance
Corporation (“IFC”), net of transaction costs 74,173 (a) –
Proceeds from issuance of convertible bonds,
net of transaction costs – 197,300
Repayments of bank borrowings (22,484) (b) (10,751)
Repayments of finance leases (9,874) (b) –
Dividends paid to shareholders (54,394) (54,287)
Dividends paid to non-controlling interests (4,238) (4,820)
Net cash generated from financing activities 28,614 21,721
Net (decrease) / increase in cash and cash equivalents (580,638) 169,158
Cash and cash equivalents at beginning of the year 773,172 643,986
Currency translations on cash and cash equivalents 791 (39,972)
CASH AND CASH EQUIVALENTS
AT THE END OF THE YEAR 193,325 773,172
The reconciliation of liabilities arising from financial activities is as follows:
Borrowings
(current)
US$’000
Borrowings
(non-current)
US$’000
Convertible
bonds
US$’000
Finance
lease
liability
US$’000
Total
US$’000
As of 31 March 2015 65,816 28,214 197,345 3,710 295,085
Currency translations 1,718 23 – (129) 1,612
Cash flows
– inflow from financing activities 45,484 101,369 – – 146,853 (a)
– outflow from financing activities (22,484) – – (9,874) (32,358) (b)
– outflow from operating activities – – (2,000) – (2,000)
Non-cash changes
– business combination – – – 12,427 12,427
– finance costs – – 7,042 339 7,381
– reclassification 7,900 (7,900) – – –
As of 31 March 2016 98,434 121,706 202,387 6,473 429,000
The notes on pages 72 to 161 form an integral part of these consolidated financial statements.

72Johnson Electric Holdings Limited
Annual Report 2016
NOTES TO THE ACCOUNTS
1. GENERAL INFORMATION AND BASIS OF PREPARATION
The principal operations of Johnson Electric Holdings Limited (“JEHL”) and its subsidiaries
(together, “the Group”) are the manufacture and sale of motion systems. The Group has
manufacturing plants and sales operations throughout the world.
JEHL, the parent holding company, is a limited liability company incorporated in Bermuda. The
address of its registered office is Canon’s Court, 22 Victoria Street, Hamilton HM 12, Bermuda.
The shares of JEHL are listed on The Stock Exchange of Hong Kong Limited.
These consolidated financial statements are presented in US Dollars, unless otherwise stated
and has been approved for issue by the Board of Directors on 17 May 2016. They have been
prepared in accordance with all applicable Hong Kong Financial Reporting Standards (“HKFRS”)
using the historical cost convention, as modified by the revaluation of financial assets and
financial liabilities (including derivative instruments) at fair value through profit and loss, and
investment property, which are carried at fair value.
The preparation of financial statements in conformity with HKFRS requires the use of certain
critical accounting estimates. It also requires management to exercise its judgement in the
process of applying the Group’s accounting policies. The areas involving a higher degree of
judgement or complexity, or areas where assumptions and estimates are significant to the
consolidated financial statements, are disclosed in Note 35.
The principal accounting policies applied in the preparation of these consolidated financial
statements are set out in Note 34. In FY2015/16, the Group adopted new / revised standards
and interpretations of HKFRS effective for the first time in FY2015/16. The effects of adopting
the new / revised HKFRSs are disclosed in Note 36.

NOTES TO THE ACCOUNTS
73
2. SEGMENT INFORMATION
Operating segments are reported in a manner consistent with the internal reporting provided to
the chief operating decision maker (as defined in HKFRS). The chief operating decision maker
has been identified as the Group’s Executive Committee. The Group has one operating
segment.
The Group’s management assesses the performance of its operating segment based on the
measure of operating profit, excluding items which are not directly related to the segment
performance. These include non-operating income / (expenses) such as interest income and
expense, rental income, fair value gains / (losses) on investment property and gains / (losses)
on disposals of fixed assets and investments.
The reconciliation of the operating profit presented to management to the consolidated income
statement is as follows:
2016
US$’000
2015
US$’000
Operating profit presented to management 178,749 224,866
Other income and gains, net (Note 18) 28,454 17,918
Operating profit per consolidated income statement 207,203 242,784
Sales from external customers by business unit was as follows:
2016
US$’000
2015
US$’000
Automotive Products Group (“APG”) 1,423,196 1,457,448
Industry Products Group (“IPG”) 630,968 678,604
Acquired business 181,781 –
2,235,945 2,136,052
The Powertrain Cooling business (included in APG) is primarily engaged in the manufacture and
sale of cooling fan modules for OEM and Tier 1 customers. Sales for this business unit
accounted for 22% of the total sales of the Group for FY2015/16 (FY2014/15: 25%).

74Johnson Electric Holdings Limited
Annual Report 2016
2. SEGMENT INFORMATION (Cont’d)
Sales by geography
Sales to external customers by region of destination was as follows:
2016
US$’000
2015
US$’000
Europe* 870,597 891,355
People’s Republic of China (“PRC”) 557,131 582,303
North America 602,004 447,172
Asia (excluding PRC) 177,209 178,759
South America 22,987 32,567
Others 6,017 3,896
2,235,945 2,136,052
* Included in Europe are sales to external customers in Germany of US$218.3 million for FY2015/16 (FY2014/15: US$247.6 million).
No single external customer contributed 10% or more of the total Group sales.
Segment assets
For FY2015/16, the additions to non-current assets (other than deferred tax assets, other
financial assets and defined benefit pension plan assets) were US$212.4 million (FY2014/15:
US$139.3 million) excluding the additions from acquisition.
As of 31 March 2016, excluding goodwill, the total of non-current assets (other than deferred
tax assets, other financial assets and defined benefit pension plan assets) located in HK/PRC
was US$415.2 million (31 March 2015: US$364.7 million) and the total of these non-current
assets located in other countries was US$791.9 million (31 March 2015: US$303.8 million).

NOTES TO THE ACCOUNTS
75
3. PROPERTY, PLANT AND EQUIPMENT
Freehold land,
leasehold land
and buildings
US$’000
Machinery
and
equipment
US$’000
Assets
under
construction
US$’000
Moulds
and
tools
US$’000
Other
assets *
US$’000
Total
US$’000
As of 31 March 2014
Cost 239,568 596,129 54,043 285,041 140,793 1,315,574
Accumulated depreciation
and impairment (134,504) (464,035) (2,172) (226,632) (96,005) (923,348)
Net book amount 105,064 132,094 51,871 58,409 44,788 392,226
FY2014/15
As of 31 March 2014 105,064 132,094 51,871 58,409 44,788 392,226
Currency translations (8,749) (1,968) (5,398) (1,218) (388) (17,721)
Additions 4,900 26,919 71,967 10,039 3,935 117,760
Transfer 6,971 30,171 (54,024) 11,992 4,890 –
Transfer to non-current
asset held for sale (8,003) – – – – (8,003)
Disposals (220) (236) – (663) (114) (1,233)
Provision for impairment
(Note 21 & 26) – (84) – (598) (4) (686)
Depreciation (Note 21) (11,732) (30,432) – (20,745) (8,856) (71,765)
As of 31 March 2015 88,231 156,464 64,416 57,216 44,251 410,578
As of 31 March 2015
Cost 211,931 616,373 64,495 280,859 136,115 1,309,773
Accumulated depreciation
and impairment (123,700) (459,909) (79) (223,643) (91,864) (899,195)
Net book amount 88,231 156,464 64,416 57,216 44,251 410,578
* Other assets comprise computers, furniture and fixtures, motor vehicles and aircraft.

76Johnson Electric Holdings Limited
Annual Report 2016
3. PROPERTY, PLANT AND EQUIPMENT (Cont’d)
Freehold land,
leasehold land
and buildings
US$’000
Machinery
and
equipment
US$’000
Assets
under
construction
US$’000
Moulds
and
tools
US$’000
Other
assets*
US$’000
Total
US$’000
FY2015/16
As of 31 March 2015 88,231 156,464 64,416 57,216 44,251 410,578
Currency translations 4 (3,672) 643 (1,832) (618) (5,475)
Business combination
(Note 27) 9,999 105,821 32,733 2,948 1,456 152,957
Additions 10,347 32,874 135,976 12,847 4,676 196,720
Transfer 8,516 51,895 (80,459) 13,994 6,054 –
Disposals (315) (490) – (220) (95) (1,120)
Reversal of / (provision
for) impairment
(Note 21 & 26) 3,481** (336) (129) (1,659) (228) 1,129
Depreciation (Note 21) (12,188) (43,372) – (21,932) (9,808) (87,300)
As of 31 March 2016 108,075 299,184 153,180 61,362 45,688 667,489
As of 31 March 2016
Cost 235,754 863,685 153,380 300,767 144,617 1,698,203
Accumulated depreciation and
impairment (127,679) (564,501) (200) (239,405) (98,929) (1,030,714)
Net book amount 108,075 299,184 153,180 61,362 45,688 667,489
* Other assets comprise computers, furniture and fixtures, motor vehicles and aircraft.
** Included a reversal of impairment of US$4.3 million made in previous year for a Group’s property in Europe based on the latest
market valuation.
Freehold land is located in Europe, North America and South America.
The Group begins depreciating an item of property, plant and equipment when it is available for
use. Depreciation of property, plant and equipment is calculated using the straight-line method
to allocate their cost to their residual values over their estimated useful lives, as follows:
Leasehold land
Buildings on leasehold land
Buildings on freehold land
Machinery, equipment, moulds and tools
Furniture and fixtures and computers
Motor vehicles
Aircraft
Shorter of lease term or useful life
Shorter of lease term or useful life
10 to 50 years*
2 to 12 years
3 to 10 years
3 to 7 years
25 years
* 50 years for buildings in Hungary, Germany and Switzerland

NOTES TO THE ACCOUNTS
77
4. INVESTMENT PROPERTY
2016
US$’000
2015
US$’000
At beginning of the year 82,035 68,371
Currency translations (387) 77
Fair value gains (Note 18 & 26) 10,205 10,749
Capitalised expenditure 90 2,890
Disposals (413) (52)
At end of the year 91,530 82,035
The Group’s investment property portfolio in HK/PRC was valued on an open market basis as of
31 March 2016. The appraisals were performed by independent, professionally qualified valuers,
Chung, Chan & Associates, Chartered Surveyors.
As of 31 March 2016, the Group’s investment property portfolio has tenancies expiring in the
period from December 2016 to May 2027 (31 March 2015: from July 2015 to May 2027).

78Johnson Electric Holdings Limited
Annual Report 2016
5. INTANGIBLE ASSETS
Goodwill
US$’000
Technology
US$’000
Patents and
engineering
development
US$’000
Brands
US$’000
Client
relationships
US$’000
Land use
rights
US$’000
Total
US$’000
As of 31 March 2014
Cost 465,011 151,335 22,958 68,571 113,877 4,782 826,534
Accumulated amortisation
and impairment – (81,644) (12,512) (22,539) (57,888) (1,218) (175,801)
Net book amount 465,011 69,691 10,446 46,032 55,989 3,564 650,733
FY2014/15
As of 31 March 2014 465,011 69,691 10,446 46,032 55,989 3,564 650,733
Currency translations (32,975) (4,478) (2,323) (3,573) (5,319) 37 (48,631)
Business combination – – – – 9,203 – 9,203
Additions (Note 21) – – 6,269 – – – 6,269
Amortisation (Note 21 & 26) – (9,389) (926) (2,559) (8,283) (239) (21,396)
Provision for impairment
(Note 21 & 26) – – (600) – – – (600)
As of 31 March 2015 432,036 55,824 12,866 39,900 51,590 3,362 595,578
As of 31 March 2015
Cost 432,036 140,326 21,955 63,023 112,657 4,835 774,832
Accumulated amortisation
and impairment – (84,502) (9,089) (23,123) (61,067) (1,473) (179,254)
Net book amount 432,036 55,824 12,866 39,900 51,590 3,362 595,578
FY2015/16
As of 31 March 2015 432,036 55,824 12,866 39,900 51,590 3,362 595,578
Currency translations 6,765 673 379 1,000 3,783 (167) 12,433
Business combination
(Note 27) 253,527 30,372 – 39,943 173,335 – 497,177
Additions (Note 21) – – 6,144 – – – 6,144
Amortisation (Note 21 & 26) – (10,610) (2,812) (2,445) (11,620) (234) (27,721)
Provision for impairment (Note
21 & 26) – – – – – (206) (206)
As of 31 March 2016 692,328 76,259 16,577 78,398 217,088 2,755 1,083,405 *
As of 31 March 2016
Cost 692,328 171,677 28,192 104,032 290,089 4,579 1,290,897
Accumulated amortisation and
impairment – (95,418) (11,615) (25,634) (73,001) (1,824) (207,492)
Net book amount 692,328 76,259 16,577 78,398 217,088 2,755 1,083,405
* Total intangible assets by underlying currencies is shown on next page.

NOTES TO THE ACCOUNTS
79
5. INTANGIBLE ASSETS (Cont’d)
Total intangible assets as of 31 March 2016 and 31 March 2015 are denominated in the
following underlying currencies:
USD equivalent
2016
US$’000
2015
US$’000
In CAD 503,463 –
In CHF 471,188 487,726
In USD 82,423 82,204
In GBP 10,976 12,683
In EUR 12,600 9,603
In RMB 2,755 3,362
Total intangible assets 1,083,405 595,578
The amortisation charge was included in the “Selling and administrative expenses” in the
consolidated income statement.
Amortisation is calculated using the straight-line method to allocate the cost over the estimated
useful life. The estimated useful life for amortisation purposes is:
Technology, patents and engineering development
Brands
Client relationships
Land use rights
4 to 20 years
25 years / indefinite
15 to 20 years
Shorter of remaining lease term or
useful life
Impairment tests for brand with an indefinite useful life
As of 31 March 2016, the carrying amount of the brand name “Stackpole”, considered to have
an indefinite useful life, was US$40.9 million.
In accordance with the Group’s accounting policy on asset impairment, the carrying amount of
the brand was reviewed and tested for impairment as of 31 March 2016. The results of the
review and test indicated that no impairment charge was necessary.
Impairment testing for the brand is based on its fair value less cost of sales. Key assumptions
include the expected growth in revenue, royalty rate and discount rate.

80Johnson Electric Holdings Limited
Annual Report 2016
5. INTANGIBLE ASSETS (Cont’d)
Impairment tests for goodwill
Goodwill of the Group is managed at segment level for the purpose of testing goodwill
impairment in accordance with HKAS 36 “Impairment of Assets”. Goodwill is tested annually for
impairment or more frequently if events or changes in circumstances indicate a potential
impairment. Impairment test for goodwill is carried out by comparing the recoverable amount
(i.e. higher of value-in-use and the fair value less costs of disposal) of the segment assets to
the carrying amount of those assets as of the balance sheet date.
For the years ended 31 March 2016 and 2015, the recoverable amount of the Group is
determined based on value-in-use calculations. These calculations use pre-tax cash flow
projections based on the financial budget and future forecast respectively.
Forecast profitability is based on past performance and expected future changes in costs and
sales prices. Cash flow projections are based on long-range financial forecasts using an
estimated sales growth rate of 6% until 2021 and a 2% perpetual growth rate thereafter
(FY2014/15: 6% and 2% respectively) and operating margin of 10% (FY2014/15: 10%). Future
cash flows are discounted at a pre-tax rate of 11.6% (equivalent to post-tax weighted average
cost of capital of 10%) (FY2014/15: pre-tax rate of 11.6%).
There was no evidence of impairment arising from tests of reasonable variations of the key
assumptions used for the value-in-use calculations.

NOTES TO THE ACCOUNTS
81
6. INVESTMENT IN ASSOCIATES
2016
US$’000
2015
US$’000
At beginning of the year 2,720 2,202
Currency translations 36 32
Business combination (Note 27) 33,914 –
Share of associates’ profit for the year 2,613 731
Dividends received (1,386) (245)
At end of the year 37,897 2,720
Details of associates are shown in Note 38.
Set out below are the summarised financial information for the Group’s associates, Halla
Stackpole Corporation and Halla Stackpole Beijing Automotive Co Ltd (together “HALLA”) and
Shenzhen SMART Micromotor Co Ltd (“SMART”), which are accounted for using the equity
method.
2016 2015
HALLA
US$’000
SMART
US$’000
Group
US$’000
SMART
US$’000
Group
US$’000
Non-current assets 69,091 521 69,612 720 720
Current assets 76,342 6,560 82,902 6,416 6,416
Non-current liabilities (30,042) – (30,042) – –
Current liabilities (21,981) (1,670) (23,651) (1,586) (1,586)
Net assets 93,410 5,411 98,821 5,550 5,550
Sales 61,586 9,864 71,450 11,033 11,033
Expenses (55,260) (8,404) (63,664) (9,541) (9,541)
Net profit 6,326 1,460 7,786 1,492 1,492

82Johnson Electric Holdings Limited
Annual Report 2016
7. OTHER FINANCIAL ASSETS AND LIABILITIES
2016 2015
Assets
US$’000
(Liabilities)
US$’000
Net
US$’000
Assets
US$’000
(Liabilities)
US$’000
Net
US$’000
Cash flow hedge– raw material commodity contracts (Note a (i)) 1,164 (47,422) (46,258) 3,306 (21,794) (18,488)– forward foreign currency exchange contracts
(Note a (ii)) 142,881 (92,729) 50,152 221,648 (64,923) 156,725Net investment hedge (Note b)
– forward foreign currency exchange contracts to hedge European subsidiaries 23,384 – 23,384 48,616 – 48,616
– cross currency interest rate swaps – (2,203) (2,203) 1,541 – 1,541Fair value hedge (Note c)
– forward foreign currency exchange contracts to hedge EUR cash balance 7,825 – 7,825 – – –
Held for trading (Note d) 156 (645) (489) 19 (3) 16Others 116 (120) (4) 124 – 124
Total (Note e) 175,526 (143,119) 32,407 275,254 (86,720) 188,534
Current portion 38,434 (31,271) 7,163 60,072 (14,531) 45,541Non-current portion 137,092 (111,848) 25,244 215,182 (72,189) 142,993
Total 175,526 (143,119) 32,407 275,254 (86,720) 188,534
Note:
(a) Cash flow hedge
(i) Raw material commodity contractsCopper, silver and aluminium forward commodity contracts as per the table below are designated as cash flow hedges. Gains and losses initially recognised in the hedging reserve, will be transferred to balance sheet within inventories and subsequently recognised in the income statement in the period or periods in which the underlying hedged copper, silver and aluminium volumes are consumed and sold.
As of 31 March 2016, the Group had the following outstanding raw material commodity contracts:
Notional
amount
Settlement
value
(US$ million)
Weighted
average
contract
price
(US$)
Spot
price
(US$)
Mark-to-
market
rate
(US$)
Remaining
maturities
range
(months)
Liabilities,
net
carrying
value
(US$’000)
Cash flow hedge
contracts
Copper commodity 47,225 metric ton 274.0 5,802 4,856 4,865 1 – 72 (44,247)
Silver commodity 780,000 oz 14.1 18.05 15.38 15.69 1 – 48 (1,838)
Aluminium commodity 1,325 metric ton 2.2 1,667 1,492 1,536 1 – 19 (173)
Total (46,258)

NOTES TO THE ACCOUNTS
83
7. OTHER FINANCIAL ASSETS AND LIABILITIES (Cont’d)
(a) Cash flow hedge (cont’d)
(ii) Forward foreign currency exchange contracts
The EUR, HUF, PLN, ILS, HKD, JPY, CHF, CAD, MXN and RMB forward foreign
currency exchange contracts as per the table below are designated as cash flow
hedges. The Group has sales in EUR and JPY, thus it entered into EUR and JPY
forward foreign currency exchange contracts. The Group incurs majority of its
operating expenses (including conversion costs) in domestic currencies in China,
Hungary, Poland, Switzerland, Israel, Mexico and Hong Kong, hence, it entered into
forward foreign currency exchange contracts to hedge these expenses. Gains and
losses initially recognised in the hedging reserve, will be recognised in the income
statement in the period or periods in which the underlying hedged transactions
occur (cash realisation).
During the year, the Group acquired the Stackpole International group of
companies. The Group entered into CAD forward foreign currency exchange
contracts to hedge the consideration settled in CAD. Exchange losses of amount
US$9.5 million was adjusted to the consideration upon completion of the
acquisition. After the acquisition, the Group entered into sell CAD forward foreign
currency exchange contract to hedge the material purchase in USD for its
operations in Canada.
As of 31 March 2016, the Group had the following outstanding forward foreign
currency exchange contracts:
Settlementcurrency
Notionalvalue
(million)
Weighted average contract
rate*Spotrate
Mark-to-market
rate
Remainingmaturities
range(months)
Settlementvalue in
USDequivalent
(US$ million)
Assets /(liabilities),
netcarrying
value(US$’000)
Cash flow hedge contracts
Sell EUR forward USD EUR 630.5 1.41 1.13 1.20 1 – 69 887.0 130,942
Buy HUF forward EUR HUF 39,619.5 335.32 314.94 324.83 1 – 58 134.0 4,324
Buy PLN forward EUR PLN 345.4 4.52 4.27 4.42 1 – 60 86.7 1,980
Buy ILS forward USD ILS 17.0 3.95 3.78 3.75 1 – 12 4.3 232
Buy HKD forward USD HKD 47.4 7.90 7.75 7.76 10 – 15 6.0 107
Sell JPY forward USD JPY 651.0 113.52 112.49 110.31 1 – 30 5.7 (166)
Buy CHF forward EUR CHF 102.0 1.07 1.09 1.09 1 – 20 108.2 (1,908)
Sell CAD forward USD CAD 97.3 1.35 1.30 1.29 1 – 12 72.0 (3,179)
Buy MXN forward USD MXN 1,814.5 16.16 17.23 19.00 1 – 72 112.3 (16,766)
Buy RMB forward USD RMB 10,500.1 6.59 6.48 6.87 1 – 69 1,593.3 (65,414)
Total 50,152
* Weighted average contract rate is a ratio defined as notional value / settlement value except for the EUR to USD
which is stated in the inverse order.

84Johnson Electric Holdings Limited
Annual Report 2016
7. OTHER FINANCIAL ASSETS AND LIABILITIES (Cont’d)
(b) Net investment hedge
The EUR forward foreign currency exchange contracts and cross currency interest rate
swaps as per the table below are designated as net investment hedges. Gains and
losses recognised in the exchange reserve, will be released from equity to profit and loss
on the disposal or partial disposal of the foreign operation.
As of 31 March 2016, the Group had the following outstanding contracts:
Settlementcurrency
Notionalvalue
(million)
Weighted average contract
rate *Spotrate
Mark-to-market
rate
Remainingmaturities
range(months)
Settlementvalue in
USDequivalent
(US$ million)
Assets /(liabilities),
netcarrying
value(US$’000)
Net investment hedge contracts
Sell EUR forward USD EUR 111.0 1.40 1.13 1.19 21 – 45 155.9 23,384
Cross currency interest rate swaps
(sell EUR, buy USD) USD EUR 68.0 1.10 1.13 1.14 61 75.0 (2,203)
* Weighted average contract rate is a ratio defined as notional value / settlement value except for the EUR to USD which is
stated in the inverse order.
In April 2016, the Group entered a new cross currency interest rate swap contract to
hedge the EUR currency exposure of its investments in Europe. The notional value of the
contract is US$30 million and will be settled by EUR26.6 million in January 2022.
(c) Fair value hedge
The EUR forward foreign currency exchange contracts as per the table below are
designated as fair value hedge to hedge the EUR bank balance. Gains and losses were
recognised in the income statement.
As of 31 March 2016, the Group had the following outstanding contracts:
Settlementcurrency
Notionalvalue
(million)
Weightedaveragecontract
rate*Spotrate
Mark-to-market
rate
Remainingmaturities
range(months)
Settlementvalue in
USDequivalent
(US$ million)
Assets, netcarrying
value(US$’000)
Fair value hedge contracts
Sell EUR forward USD EUR 38.0 1.36 1.13 1.15 9 51.6 7,825
* Weighted average contract rate is a ratio defined as notional value / settlement value except for the EUR to USD which is
stated in the inverse order.
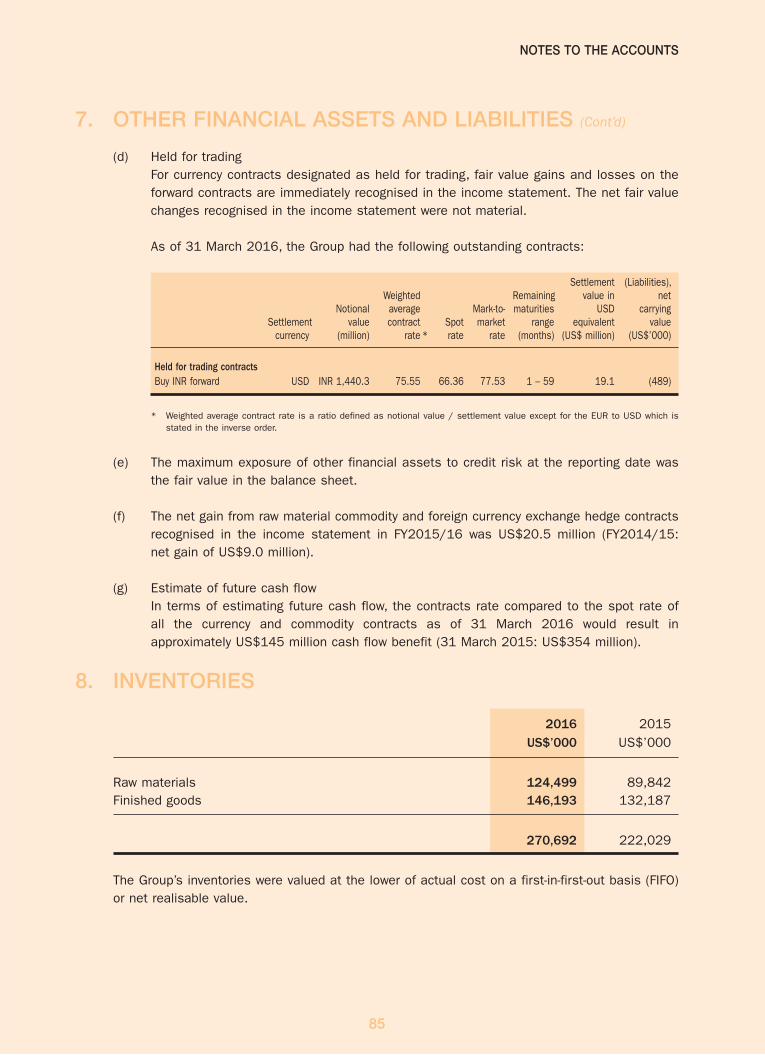
NOTES TO THE ACCOUNTS
85
7. OTHER FINANCIAL ASSETS AND LIABILITIES (Cont’d)
(d) Held for trading
For currency contracts designated as held for trading, fair value gains and losses on the
forward contracts are immediately recognised in the income statement. The net fair value
changes recognised in the income statement were not material.
As of 31 March 2016, the Group had the following outstanding contracts:
Settlementcurrency
Notionalvalue
(million)
Weighted average contract
rate *Spotrate
Mark-to-market
rate
Remainingmaturities
range(months)
Settlementvalue in
USDequivalent
(US$ million)
(Liabilities),net
carryingvalue
(US$’000)
Held for trading contracts
Buy INR forward USD INR 1,440.3 75.55 66.36 77.53 1 – 59 19.1 (489)
* Weighted average contract rate is a ratio defined as notional value / settlement value except for the EUR to USD which is
stated in the inverse order.
(e) The maximum exposure of other financial assets to credit risk at the reporting date was
the fair value in the balance sheet.
(f) The net gain from raw material commodity and foreign currency exchange hedge contracts
recognised in the income statement in FY2015/16 was US$20.5 million (FY2014/15:
net gain of US$9.0 million).
(g) Estimate of future cash flow
In terms of estimating future cash flow, the contracts rate compared to the spot rate of
all the currency and commodity contracts as of 31 March 2016 would result in
approximately US$145 million cash flow benefit (31 March 2015: US$354 million).
8. INVENTORIES
2016
US$’000
2015
US$’000
Raw materials 124,499 89,842
Finished goods 146,193 132,187
270,692 222,029
The Group’s inventories were valued at the lower of actual cost on a first-in-first-out basis (FIFO)
or net realisable value.

86Johnson Electric Holdings Limited
Annual Report 2016
9. TRADE AND OTHER RECEIVABLES
2016
US$’000
2015
US$’000
Trade receivables – gross 447,370 352,608
Less: impairment of trade receivables (2,073) (2,751)
Trade receivables – net 445,297 349,857
Prepayments and other receivables 96,937 65,036
542,234 414,893
All trade and other receivables were due within one year from the end of the reporting period.
Accordingly, the fair value of the Group’s trade and other receivables was approximately equal to
the carrying value.
Ageing of gross trade receivables
(a) The ageing of gross trade receivables based on invoice date was as follows:
2016
US$’000
2015
US$’000
1 – 30 days 325,892 190,873
31 – 90 days 98,879 139,491
Over 90 days 22,599 22,244
Total 447,370 352,608
(b) The Group normally grants credit terms ranging from 30 to 105 days to its trade
customers. The ageing of gross trade receivables based on overdue date was as follows:
2016
US$’000
2015
US$’000
Current 429,593 341,077
1 – 30 days overdue 12,452 7,606
31 – 90 days overdue 3,622 1,643
Over 90 days overdue 1,703 2,282
Total 447,370 352,608

NOTES TO THE ACCOUNTS
87
9. TRADE AND OTHER RECEIVABLES (Cont’d)
There was no concentration of credit risk with respect to trade receivables, as the Group has a
large number of customers and no single customer represents 10% or more of total
receivables.
The carrying amounts of the Group’s trade receivables were denominated in the following
currencies:
2016
US$’000
2015
US$’000
USD 161,486 148,251
EUR 132,937 114,665
RMB 96,999 80,209
CAD 43,492 –
Others 12,456 9,483
Total 447,370 352,608
Ageing of overdue trade receivables but not impaired
The Group has credit policies in place to review the credit worthiness of all existing and
potential customers. Credit terms range between 30 and 105 days normally. As of 31 March
2016, trade receivables of US$15.7 million (31 March 2015: US$8.8 million) were overdue but
not impaired. Management assessed the credit quality of this US$15.7 million by reference to
the repayment history and current financial position of the customers. Management believes
that no provision for impairment is necessary and these balances are expected to be fully
recovered.
The ageing of these overdue trade receivables but not impaired is as follows:
2016
US$’000
2015
US$’000
1 – 30 days overdue 12,011 6,891
31 – 90 days overdue 3,548 1,239
Over 90 days overdue 145 650
Total 15,704 8,780

88Johnson Electric Holdings Limited
Annual Report 2016
9. TRADE AND OTHER RECEIVABLES (Cont’d)
Impairment of trade receivables
Movements on the impairment of trade receivables were as follows:
2016
US$’000
2015
US$’000
At beginning of the year 2,751 9,186
Currency translations 144 (558)
Receivables written off during the year as uncollectible (272) (6,984)*
(Write back) for impairment / impairment of trade receivables /
bad debt expense (Note 21) (550) 1,107
At end of the year 2,073 2,751
* This write off was primarily due to a customer that entered into a court approved rehabilitation process.
The maximum exposure to credit risk at the reporting date is the fair value of the receivable
mentioned above.
10. CASH AND DEPOSITS AND PLEDGED DEPOSITS
2016
US$’000
2015
US$’000
Cash at bank and in hand 174,268 174,883
Short term bank deposits 19,057 598,289
Total cash and deposits 193,325 773,172
Pledged deposits 9,119 –
The carrying amounts of the Group’s cash and deposits and pledged deposits are denominated
in the following currencies:
2016
US$’000
2015
US$’000
EUR 98,331 59,710
RMB 42,721 269,762
CAD 28,329 –
USD 8,954 381,957
Others 24,109 61,743
Total 202,444 773,172

NOTES TO THE ACCOUNTS
89
11. TRADE PAYABLES
2016
US$’000
2015
US$’000
Trade payables 250,240 206,161
The fair value of the Group’s trade payables was approximately equal to the carrying value. The
ageing analysis of trade payables based on invoice date was as follows:
2016
US$’000
2015
US$’000
0 – 60 days 178,212 152,839
61 – 90 days 47,378 38,984
Over 90 days 24,650 14,338
Total 250,240 206,161
The carrying amounts of the Group’s trade payables are denominated in the following
currencies:
2016
US$’000
2015
US$’000
RMB 98,778 87,378
USD 74,333 55,549
EUR 47,008 37,987
HKD 22,913 20,824
CAD 3,925 –
Others 3,283 4,423
Total 250,240 206,161

90Johnson Electric Holdings Limited
Annual Report 2016
12. BORROWINGS
2016
US$’000
2015
US$’000
Loans based on trade receivables (Note (a)) 62,376 90,432
Loan from International Finance Corporation (“IFC”) (Note (b)) 74,173 –
Other borrowings – Non-current 35,333 714
– Current 48,258 2,884
Total borrowings 220,140 94,030
Current borrowings 98,434 65,816
Non-current borrowings 121,706 28,214
Note:
(a) Subsidiary companies have borrowed US$62.4 million in the USA, Europe and Hong Kong
as of 31 March 2016 (31 March 2015: US$90.4 million) based on trade receivables.
These loans are placed such that the interest expense will match the geography of the
operating income as follows:
• Unsecured borrowings in the USA of US$27.5 million, with a covenant that trade
receivables shall not be pledged to any parties (31 March 2015: US$27.5 million).
• Borrowings in Europe of US$22.7 million (EUR20.0 million) (31 March 2015:
US$43.3 million (EUR40.0 million)), which are secured by trade receivables and
require an over-collateralisation level of 20% of the amount loaned (US$27.2
million as of 31 March 2016 and US$52.0 million as of 31 March 2015).
• Unsecured borrowings in Hong Kong of US$12.2 million with a covenant that trade
receivables shall not be pledged to any parties (31 March 2015: US$19.6 million).
(b) Loan from IFC – US$74.2 million (principal US$75.0 million less US$0.8 million
transaction costs) was drawn in January 2016. This is an 8-year loan for projects in
Serbia, Mexico, Brazil and India with quarterly repayments beginning from April 2019 with
final maturity date of 15 January 2024.

NOTES TO THE ACCOUNTS
91
12. BORROWINGS (Cont’d)
The maturity of borrowings was as follows:
Bank borrowings Other loans
2016
US$’000
2015
US$’000
2016
US$’000
2015
US$’000
Less than 1 year 98,020 65,432 414 384
1 – 2 years 5,000 27,500 164 396
2 – 5 years 42,200 – 29,638 318
Over 5 years – – 44,704 –
145,220 92,932 74,920 1,098
As of 31 March 2016, the interest rate charged on outstanding balances ranged from 0.6% to
4.3% per annum (31 March 2015: 0.6% to 3.2% per annum) and the weighted average effective
interest rate of the borrowings was approximately 1.8% (31 March 2015: 0.7%). Interest
expense is disclosed in Note 20.
As of 31 March 2016, borrowings of subsidiary companies amounting to US$145.2 million (31
March 2015: US$92.9 million) were guaranteed by JEHL. The Group has financial covenants as
part of its various borrowing agreements. The Group was in compliance with all covenants as of
31 March 2016 and expects to remain compliant in future periods.
Moody’s Investors Service awarded Johnson Electric a “Baa1” investment grade rating with
stable outlook in May 2015. Also, Standard & Poor’s (S&P) Ratings Services awarded Johnson
Electric a “BBB” investment grade rating with stable outlook in December 2014. As of 31
March 2016, the Group maintained investment grade ratings from both agencies.
The fair value of borrowings approximately equals their carrying amount, as the impact of
discounting is not significant. The fair values are based on cash flows discounted using a rate
based on the borrowing rate and are within level 2 of the fair value hierarchy.
The carrying amounts of the borrowings (bank borrowings and other loans) were denominated in
the following currencies:
2016
US$’000
2015
US$’000
USD 165,874 49,600
RMB 30,844 –
EUR 23,422 44,430
Total borrowings 220,140 94,030

92Johnson Electric Holdings Limited
Annual Report 2016
13. CONVERTIBLE BONDS
2016
US$’000
2015
US$’000
Convertible Bonds (Liability component) 202,387 197,345
JEHL issued convertible bonds in an aggregate principal amount of US$200 million on 2 April
2014. These convertible bonds bear interest as cash coupon at the rate of 1% per annum,
payable semi-annually. They have a maturity of 7 years to 2 April 2021 and a 5 year put option
for the bondholders. The bondholders have the option of requiring JEHL to redeem all or some
of the convertible bonds on 2 April 2019 at 109.31% of the principal amount. Otherwise,
unless previously redeemed, converted or purchased and cancelled, JEHL will redeem each
convertible bond at 113.41% of its principal amount on the maturity date. The effective interest
rate of the liability component is 3.57%.
During the year, the funds raised by this bond issue were utilised for the acquisition of
Stackpole International.
The bondholders have the right to convert their bonds into ordinary shares of JEHL at the
conversion price at any time on or after 13 May 2014 up to the maturity date. No such
conversions had occurred as of 31 March 2016.
With effect from 16 July 2015, the conversion price was adjusted to HK$39.78 per share as a
result of the final dividend for FY2014/15. The conversion price was not adjusted for the
interim dividend for FY2015/16 since this event fell below the 1% threshold for adjustment as
per the terms and conditions of the Bond Offering. The effect of this interim dividend will be
accumulated and included in the next adjustment to the conversion price.
The fair value of the liability component of the Group’s convertible bonds was approximately
equal to its carrying value as of 31 March 2016. The fair values of convertible bonds are within
level 2 of the fair value hierarchy.

NOTES TO THE ACCOUNTS
93
14. PROVISION OBLIGATIONS AND OTHER LIABILITIES
Retirement
benefit
obligations
US$’000
Legal
and
warranty
US$’000
Restructuring
US$’000
Finance
lease
liability
US$’000
Long service
payment,
severance
and others
US$’000
Total
US$’000
As of 31 March 2014 10,057 22,528 6,398 4,618 3,926 47,527
Currency translations (1,786) (3,126) (1,242) – (152) (6,306)
Provisions / (release of provision)
(Note 19) 2,980 9,632 (682) – 5,040 16,970
Utilised (5,744) (5,240) (491) (908) (4,757) (17,140)
Remeasurements (Note 17)* 15,812 – – – (230) 15,582
As of 31 March 2015 21,319 23,794 3,983 3,710 3,827 56,633
Provision obligations and other liabilities:
Current portion – 16,217 3,983 1,020 493 21,713
Non-current portion 28,475 7,577 – 2,690 3,334 42,076
Defined benefit pension plan assets:
Non-current portion (7,156) – – – – (7,156)
As of 31 March 2015 21,319 23,794 3,983 3,710 3,827 56,633
As of 31 March 2015 21,319 23,794 3,983 3,710 3,827 56,633
Currency translations 1,614 401 179 (129) 1 2,066
Business combination (Note 27) (1,575) 485 – 12,427 – 11,337
Provisions (Note 19) 4,891 11,290 – 339 10,797 27,317
Utilised (4,736) (12,318) (250) (9,874) (5,272) (32,450)
Remeasurements (Note 17)* (1,932) – – – (98) (2,030)
As of 31 March 2016 19,581** 23,652 3,912 6,473 9,255 62,873
Provision obligations and other liabilities:
Current portion – 18,054 3,912 1,239 5,828 29,033
Non-current portion 27,991 5,598 – 5,234 3,427 42,250
Defined benefit pension plan assets:
Non-current portion (8,410) – – – – (8,410)
As of 31 March 2016 19,581 23,652 3,912 6,473 9,255 62,873
* Remeasurements represent actuarial gains and losses.
** The retirement benefit obligations were mainly denominated in CHF, GBP, EUR and CAD as of 31 March 2016. These retirement
benefit obligations of US$19.6 million (31 March 2015: US$21.3 million) comprised gross present value of obligations of US$149.7
million (31 March 2015: US$184.0 million) less fair value of plan assets of US$130.1 million (31 March 2015: US$162.7 million).

94Johnson Electric Holdings Limited
Annual Report 2016
14. PROVISION OBLIGATIONS AND OTHER LIABILITIES (Cont’d)
14.1 Retirement benefit obligations
Defined benefit pension plans
The Group operates defined benefit pension plans in various countries, providing benefits
to members in the form of a guaranteed level of pension payable for life. These defined
benefit plans are valued by independent external actuaries using the projected unit credit
method.
The Group’s defined benefit plans provide pensions to employees after meeting specific
retirement age / period of service. Pensions are based on specific pension rates applied
to the employees’ years of service. The assets of funded plans are held independently of
the Group’s assets in separate trustee administered funds.
The amounts recognised in the balance sheet were determined as follows:
2016
US$’000
2015
US$’000
Present value of obligations that are funded 135,728 169,635
Present value of obligations that are unfunded 14,006 14,415
Gross present value of obligations 149,734 184,050
Less: Fair value of plan (assets) (130,153) (162,731)
Total retirement benefit obligations – net liability 19,581 21,319
Represented by:
Defined benefit pension plan (assets) (8,410) (7,156)
Provisions obligations and other liabilities 27,991 28,475

NOTES TO THE ACCOUNTS
95
14. PROVISION OBLIGATIONS AND OTHER LIABILITIES (Cont’d)
14.1 Retirement benefit obligations (Cont’d)
The movement of the retirement benefit obligations were as follows:
Present valueof obligations
US$’000
Fair value ofplan (assets)
US$’000
Totalnet liability
US$’000
As of 31 March 2014 171,677 (161,620) 10,057
Current service cost 3,084 – 3,084Interest cost / (income) 4,255 (4,359) (104)
Net cost / (income) to the income statement (Note 21) 7,339 (4,359) 2,980
Remeasurements:– Gains from change in demographic assumptions (681) – (681)– Losses from change in financial assumptions 29,574 – 29,574– Experience (gains) / losses (2,307) 86 (2,221)– Return on plan assets, excluding amounts included in
interest income – (10,860) (10,860)
Losses / (gains) recognised in equity (Note 17) 26,586 (10,774) 15,812
Currency translations (16,026) 14,240 (1,786)Contributions by plan participants 2,707 (2,707) –Contributions by employer – (5,139) (5,139)Benefits paid (8,233) 7,628 (605)
As of 31 March 2015 184,050 (162,731) 21,319
As of 31 March 2015 184,050 (162,731) 21,319
Current service cost 4,471 – 4,471Interest cost / (income) 2,637 (3,111) (474)Past service cost 894 – 894
Net cost / (income) to the income statement (Note 21) 8,002 (3,111) 4,891
Remeasurements:– Gains from change in demographic assumptions (2,065) – (2,065)– Losses / (gains) from change in financial assumptions 124 (206) (82)– Experience (gains) / losses (9,454) 9 (9,445)– Return on plan assets, excluding amounts included in
interest income – 9,660 9,660
(Gains) / losses recognised in equity (Note 17) (11,395) 9,463 (1,932)
Currency translations 532 1,082 1,614Contributions by plan participants 2,694 (2,694) –Contributions by employer – (3,539) (3,539)Business combination (Note 27) 21,739 (23,314) (1,575)Benefits paid (5,819) 4,622 (1,197)Settlement (50,069) 50,069 –
As of 31 March 2016 149,734 (130,153) 19,581

96Johnson Electric Holdings Limited
Annual Report 2016
14. PROVISION OBLIGATIONS AND OTHER LIABILITIES (Cont’d)
14.1 Retirement benefit obligations (Cont’d)
The principal actuarial assumptions used were as follows:
2016
Percentage
2015
Percentage
Discount rate 0.4% – 3.8% 0.6% – 3.4%
Future pension growth rate 0% – 3.2% 0% – 3.3%
Sensitivity analysis
The sensitivity of the defined benefit obligation to changes in the weighted principal
assumptions was:
Impact on
defined benefit obligation
Increase in
assumption
Decrease in
assumption
Discount rate – change by 0.5% Decrease by 6.9% Increase by 7.9%
Future pension growth rate – increase by 0.25% Increase by 1.6% n/a
The above sensitivity analyses are based on a change in an assumption while holding all
other assumptions constant. In practice, this is unlikely to occur, and changes in some of
the assumptions may be correlated. When calculating the sensitivity of the defined
benefit obligation to significant actuarial assumptions, the same method (present value
of the defined benefit obligation calculated with the projected unit credit method at the
end of the reporting period) has been applied as when calculating the pension liability
recognised in the balance sheet.
The methods and types of assumptions used in preparing the sensitivity analysis did not
change compared to the previous period.
During the year, the decrease in the present value of funded defined benefit obligations
due to remeasurement gains comprised the experience gains arising from the settlement
to old pensioners for the pension plan in Switzerland, the gains from change in
demographic assumptions, offset by a net loss from change in financial assumptions
mainly due to change in discount rate as follow:
2016
Percentage
2015
Percentage
Switzerland 0.4% 0.6%
United Kingdom 3.8% 3.4%
Germany 1.9% 1.7%

NOTES TO THE ACCOUNTS
97
14. PROVISION OBLIGATIONS AND OTHER LIABILITIES (Cont’d)
14.1 Retirement benefit obligations (Cont’d)
The weighted average duration of the defined benefit obligations is 18.8 years (31 March 2015: 16.7 years).
The expected maturity analysis of undiscounted pension benefits as of 31 March 2016
and 31 March 2015 was:
2016
US$’000
2015
US$’000
Less than 1 year 3,985 6,3001 – 2 years 3,864 6,4602 – 5 years 12,377 20,009Over 5 years 271,597 292,360
291,823 325,129
Plan assetsPlan assets comprised the following:
2016 2015
US$’000 Percentage US$’000 Percentage
Quoted
EquitiesAsia 4,416 3% 3,842 2%Europe 15,949 12% 24,382 15%Americas 22,268 17% 9,338 6%Global 13,463 10% 24,547 15%
BondsEurope 30,222 23% 53,340 33%Americas 11,600 9% 1,060 1%Global 10,053 8% 5,039 3%
OthersAsia – 0% 534 0%Europe 7,390 6% 9,077 6%Americas – 0% 2,135 1%Global 7,253 6% – 0%
122,614 94% 133,294 82%
UnquotedProperty investment – Europe 7,255 6% 29,150 18%Others – Europe 284 0% 287 0%
7,539 6% 29,437 18%
130,153 100% 162,731 100%

98Johnson Electric Holdings Limited
Annual Report 2016
14. PROVISION OBLIGATIONS AND OTHER LIABILITIES (Cont’d)
14.1 Retirement benefit obligations (Cont’d)
Plan assets (Cont’d)
The plan asset mix is established through consideration of many factors including
assumptions of tolerance for fluctuations in market values, portfolio diversification and
the targeted long term rate of return for the assets. Foreign exchange risk is inherent in
the asset mix policy and foreign currency fluctuations may significantly affect the return
on the assets held by the trustees of the funds.
Asset-liability matching has been undertaken to reduce risk.
For the pension plan in Switzerland, Swiss law prescribes ranges of percentages within
which the assets have to be invested (bank, shares, bonds, real estate, etc.). This is to
ensure a segregation of risk. These ranges allow some room for investment decision but
have to be respected at all times.
For the pension plan in the United Kingdom, the trustees of the scheme invest the
assets in line with the statement of investment principles, which was established taking
into consideration the liabilities of the scheme and the investment risk that the trustees
are willing to accept. The trustees are required to carry out regular scheme funding
valuations and establish a schedule of contributions and a recovery plan if there is a
shortfall in the scheme.
The Group expects to make contributions of US$3.8 million to post-employment benefit
plans for fiscal year FY2016/17 (FY2015/16: US$3.5 million).
14.2 Defined contribution pension plans
The largest defined contribution schemes are in Hong Kong where the Group operates
two defined contribution schemes. These comply with all the respective requirements
under the Occupational Retirement Schemes Ordinance (“ORSO”) and the Mandatory
Provident Fund (“MPF”) Ordinance. All scheme assets are held separately from the Group
in independently administered funds. Contributions to the MPF Scheme follow the MPF
Ordinance while contributions made by the employer to the ORSO Scheme range between
5% and 12% of basic salary depending on level and years of service.
If employees leave the ORSO scheme prior to the contributions fully vesting, these may
be forfeited and the charge to income statement reduced accordingly. There were no
forfeited contributions as of 31 March 2016 (31 March 2015: nil).
The Group also operates other defined contribution retirement schemes which are
available to certain employees in the United States of America, PRC, the United Kingdom
and France.
Contributions made by the Group are charged to the income statement as incurred. The
charge to income statement for all defined contribution plans for FY2015/16 was US$5.0
million (FY2014/15: US$4.8 million) as shown in Note 21.

NOTES TO THE ACCOUNTS
99
14. PROVISION OBLIGATIONS AND OTHER LIABILITIES (Cont’d)
14.3 Finance lease liability
Property, plant and equipment included the following amounts held under finance leases:
2016
US$’000
2015
US$’000
Cost – capitalised finance lease 13,371 10,658
Accumulated depreciation and impairment (8,917) (8,424)
Net book amount 4,454 2,234
Gross finance lease obligation – minimum lease payments:
2016
US$’000
2015
US$’000
Less than 1 year 1,831 1,400
1 – 5 years 3,378 3,062
Over 5 years 5,361 –
10,570 4,462
Future finance charges on the finance lease (4,097) (752)
Present value of the finance lease liability 6,473 3,710
The present value of the finance lease liability was as follows:
2016
US$’000
2015
US$’000
Less than 1 year 1,239 1,020
1 – 5 years 2,016 2,690
Over 5 years 3,218 –
6,473 3,710
The addition in finance lease liability during the year is mainly due to the acquisition of
Stackpole International.
The Group’s finance leases expire over the period from May 2018 to September 2033.

100Johnson Electric Holdings Limited
Annual Report 2016
15. DEFERRED INCOME TAX
Deferred tax assets and liabilities are offset when the deferred income taxes relate to the
same fiscal authority and when there is a legally enforceable right to offset current tax assets
against current tax liabilities. Income tax expense is discussed in Note 22.
The following amounts, determined after appropriate offsetting within a tax jurisdiction, are
shown in the consolidated balance sheet:
2016
US$’000
2015
US$’000
Deferred income tax assets 48,650 43,500
Deferred income tax liabilities (103,487) (69,821)
Deferred income tax liabilities, net (54,837) (26,321)
The gross differences between book and tax accounting, before netting were as follows:
2016
US$’000
2015
US$’000
Gross deferred income tax assets 101,374 70,375
Gross deferred income tax liabilities (156,211) (96,696)
Deferred income tax liabilities, net (54,837) (26,321)

NOTES TO THE ACCOUNTS
101
15. DEFERRED INCOME TAX (Cont’d)
The movement in deferred income tax assets and liabilities during the year, without taking into
consideration the offsetting of balances within the same tax jurisdiction, was as follows:
Accruedliabilities
Accelerated taxdepreciation Tax losses
Fair value(gains) / losses Others Total
2016US$’000
2015US$’000
2016US$’000
2015US$’000
2016US$’000
2015US$’000
2016US$’000
2015US$’000
2016US$’000
2015US$’000
2016US$’000
2015US$’000
Defered income tax assets
At beginning of the year 19,149 16,118 4,747 3,242 20,424 17,173 16,625 8,713 9,430 8,975 70,375 54,221
Currency translations 90 (1,342) (111) (53) 78 (415) 38 – 346 (40) 441 (1,850)
Business combination 373 – 2,213 – 2 – 297 – 12,847 – 15,732* –
Credited / (charged) to income statement (650) 4,373 1,267 1,558 2,552 3,666 (733) (241) 1,644 (1,044) 4,080 8,312
Credited / (charged) to equity – – – – – – 10,874 8,153 (128) 1,539 10,746 9,692
Assets at end of
the year 18,962 19,149 8,116 4,747 23,056 20,424 27,101 16,625 24,139 9,430 101,374 70,375
Defered income tax (liabilities)
At beginning of
the year (4,737) (6,180) (4,826) (5,432) – – (68,524) (47,262) (18,609) (11,448) (96,696) (70,322)Currency
translations (132) 1,248 (494) 657 – – (1,293) 3,172 (3) 438 (1,922) 5,515Business
combination – – (17,890) – – – (57,722) – (574) – (76,186)* –Credited /
(charged) to income statement 3,039 195 292 (51) – – 5,409 6,027 (4,204) (3,706) 4,536 2,465
Credited / (charged) to equity – – – – – – 13,192 (30,461) 865 (3,893) 14,057 (34,354)
(Liabilities) at end
of the year (1,830) (4,737) (22,918) (4,826) – – (108,938) (68,524) (22,525) (18,609) (156,211) (96,696) Deferred income
tax assets / (liabilities), net 17,132 14,412 (14,802) (79) 23,056 20,424 (81,837) (51,899) 1,614 (9,179) (54,837) (26,321)
* Taking into consideration of offsetting of balances within the same tax jurisdiction, the deferred income tax assets and deferred
income tax liabilities acquired from business combination were US$2.7 million and US$(63.2) million respectively. Details please see
Note 27.
Deferred income tax liabilities of US$2.6 million (FY2014/15: US$0.6 million) have not been
recognised in respect of the withholding or other tax payable on the unremitted profits of
certain subsidiaries where JEHL controls the dividend policy and it has been determined that
these undistributed profits will not be distributed in the foreseeable future.

102Johnson Electric Holdings Limited
Annual Report 2016
15. DEFERRED INCOME TAX (Cont’d)
The movement table describes the component parts of the deferred income tax assets and
liabilities shown on the Balance Sheet.
Accrued liabilities:
Certain tax authorities do not allow accrued liabilities as deductions against current taxable
profit, which gives rise to a different basis for calculating accounting and taxable profit.
Accelerated tax depreciation:
This represents the difference between the rate of depreciation which is charged against
accounting profit and the accelerated rate of depreciation which is charged against taxable
profit.
Tax losses:
This represents the value of current tax losses that can be offset against future taxable profits
to reduce future taxation charges. As of 31 March 2016, the Group’s subsidiaries in USA,
Canada, UK and Japan had accumulated net operating losses carried forward of US$48.5
million, US$4.8 million, US$3.8 million and US$3.6 million respectively (31 March 2015:
US$48.2 million, US$2.4 million and US$4.2 million for subsidiaries in USA, UK and Japan
respectively) to offset future taxable income.
Fair value (gains) / losses:
The extent to which a change in value resulting from the reassessment of an asset’s carrying
value is not treated as current year taxable income.
Others:
This represents all other differences between the bases of valuation of assets and liabilities for
accounting and taxation purposes which give rise to a difference in accounting and taxable
profit.

NOTES TO THE ACCOUNTS
103
15. DEFERRED INCOME TAX (Cont’d)
The recoverability of the deferred tax assets and liabilities was as follows:
2016
US$’000
2015
US$’000
Deferred income tax assets:
Deferred income tax assets to be recovered after more than
twelve months 76,007 49,729
Deferred income tax assets to be recovered within twelve
months 25,367 20,646
Deferred income tax assets 101,374 70,375
Deferred income tax liabilities:
Deferred income tax liabilities to be settled after more than
twelve months (145,451) (79,050)
Deferred income tax liabilities to be settled within twelve
months (10,760) (17,646)
Deferred income tax liabilities (156,211) (96,696)
Deferred income tax liabilities, net (54,837) (26,321)
The movement on the deferred income tax account, net was as follows:
2016
US$’000
2015
US$’000
At beginning of the year, net (liability) (26,321) (16,101)
Currency translations (1,481) 3,665
Business combination (Note 27) (60,454) –
Transfer to income statement (Note 22) 8,616 10,777
Credited / (charged) to equity 24,803 (24,662)
At end of the year, net (liability) (54,837) (26,321)

104Johnson Electric Holdings Limited
Annual Report 2016
15. DEFERRED INCOME TAX (Cont’d)
The deferred income tax credited / (charged) to equity during the year was as follows:
2016
US$’000
2015
US$’000
Net fair value losses / (gains) of hedging instruments
(Note 17) 24,067 (22,308)
Remeasurements of long service payment (Note 17) (17) (39)
Remeasurements of defined benefit plans (Note 17) 753 1,553
Equity component of convertible bonds issued (Note 17) – (3,868)
24,803 (24,662)
Deferred income tax assets are recognised for tax losses carried forward to the extent that it is
probable that future taxable profit or temporary differences will be available against which the
unused tax losses can be utilised.
The movement in the Group’s unrecognised tax losses for FY2015/16 and FY2014/15 was
presented below:
2016
US$’000
2015
US$’000
At beginning of the year 78,121 112,127
Currency translations (187) (7,187)
Business combination 31,560 –
(Utilised / recognised) during the year (6,231) (15,695)
Addition / (reduction) for tax positions of prior years 1,793 (6,346)
Liquidation and other reductions – (4,778)
At end of the year 105,056 78,121
Deferred income tax assets in respect of tax losses amounting to US$105.1 million (FY2014/15:
US$78.1 million) have not been recognised primarily due to the uncertainty on availability of
future profit generation or temporary differences in the legal entities where such losses were
incurred.

NOTES TO THE ACCOUNTS
105
15. DEFERRED INCOME TAX (Cont’d)
The ageing of unrecognised tax losses by expiry date is as follows:
2016
US$’000
2015
US$’000
Less than 1 year 11 57
1 – 2 years 4,808 53
2 – 5 years 25,563 15,757
5 – 20 years 45,038 26,002
Unlimited 29,636 36,252
105,056 78,121
Deferred income tax assets have not been recognised with respect to other deductible
temporary differences amounting to US$1.9 million (FY2014/15: US$2.3 million) for which no
taxable profit or temporary differences will be available to offset the deductible temporary
difference.
16. SHARE CAPITAL
Number of shares (thousands)
Sharecapital –ordinaryshares
(at par value)
Sharesheld for the
incentive shareschemes
(at purchasecost) Total
As of 31 March 2014* 894,799 (6,968) 887,831
Repurchase and cancellation of issued capital (14,257) – (14,257)
Shares purchased by trustee for the incentive
share schemes – (13,749) (13,749)
Shares vested to Directors and employees for
the incentive share schemes – 1,609 1,609
As of 31 March 2015 880,542 (19,108) 861,434
Repurchase and cancellation of issued capital (1,697) – (1,697)
Shares purchased by trustee for the incentive
share schemes – (6,495) (6,495)
Shares vested to Directors and employees for
the incentive share schemes – 2,527 2,527
As of 31 March 2016 878,845 (23,076) 855,769
* As of 15 July 2014, the shares of JEHL were consolidated on 4 to 1 basis (“Share Consolidation”) and the number of shares for
prior year has been adjusted to reflect the impact of this consolidation.

106Johnson Electric Holdings Limited
Annual Report 2016
16. SHARE CAPITAL (Cont’d)
As of 31 March 2016, the total authorised number of ordinary shares was 1,760.0 million (31
March 2015: 1,760.0 million) with a par value of HK$0.05 per share (31 March 2015:
HK$0.05 per share). All issued shares were fully paid.
Share
capital –
ordinary
shares
(at par value)
US$’000
Shares
held for the
incentive
share
schemes
(at purchase
cost)
US$’000
Share
premium
US$’000
Total
US$’000
As of 31 March 2014 5,773 (13,896) 23,628 15,505
Repurchase and cancellation of
issued capital (92) – (23,977) (24,069)*
Shares purchased by trustee for the
incentive share schemes – (50,726) – (50,726)
Shares vested to Directors and
employees for the incentive share
schemes (Note 17) – 3,540 349 3,889
As of 31 March 2015 5,681 (61,082) – (55,401)
Repurchase and cancellation of
issued capital (11) – – (11)*
Shares purchased by trustee for the
incentive share schemes – (22,014) – (22,014)
Shares vested to Directors and
employees for the incentive share
schemes (Note 17) – 7,646 – 7,646
As of 31 March 2016 5,670 (75,450) – (69,780)
The total repurchase and cancellation of issued capital as shown in the “Consolidated
Statement of Changes in Equity” on pages 68 to 69 was recorded as a reduction in equity in
two parts as follows:
2016
US$’000
2015
US$’000
Share capital * 11 24,069
Other reserves 5,224 30,926
Total cost 5,235 54,995

NOTES TO THE ACCOUNTS
107
16. SHARE CAPITAL (Cont’d)
Cancellation of issued capital
A general mandate was approved and given to the Board by shareholders at JEHL’s AGM held
on 9 July 2015 empowering the Board to repurchase shares up to 10% (88.1 million shares) of
the aggregate nominal amount of the issued share capital of JEHL. This mandate which had
also existed in the previous year was extended to the next 12 month period. 1.7 million shares
were purchased in FY2015/16, for cancellation, at a total cost of US$5.2 million (HK$40.7
million) including brokerage and cancellation fees (FY2014/15: 14.3 million shares after taking
into account the effect of the Share Consolidation at a total cost of US$55.0 million (HK$426.4
million)).
Incentive share schemes
Share awards under the Long-Term Incentive Share Scheme (“Share Scheme”) are granted to
directors, senior management and other employees as recommended by the Chairman and
Chief Executive and approved by the Remuneration Committee of the Group. The Share Scheme
was approved by the shareholders on 24 August 2009 and was further amended and approved
by the shareholders on 20 July 2011.
On 9 July 2015, a new share scheme, the Johnson Electric Restricted and Performance Stock
Unit Plan (“Stock Unit Plan”) was approved by the shareholders and no further grants of share
awards under the Share Scheme could be made afterwards. The rules of the Stock Unit Plan
provide a better framework to support the use of equity-based compensation on a global scale
as Johnson Electric continues to grow its footprint. Unvested share awards granted under the
Share Scheme continue to be valid subject to the provisions of the Share Scheme. Under the
Stock Unit plan, the Board may grant time-vested units and performance-vested units to such
eligible Directors and employees of the Group as the Remuneration Committee may select at
its absolute discretion.
Senior management of the Group regularly receive annual grants of time-vested units (Restricted
Stock Units or RSUs) and performance-vested units (Performance Stock Units or PSUs).
According to current granting policy, time-vested units typically vest after three years.
Performance-vested units vest after three years, subject to achievement of performance
conditions over a three-year performance period. The primary performance condition consists of
the achievement of a three-year cumulative earnings per share target that is set at the time of
grant. If the primary condition is met in full, then the entire grant of PSUs will vest at the end of
the vesting period. If the primary performance condition is not met, then the secondary
performance conditions are considered. The secondary performance conditions consist of a
series of one-year earnings per share targets set at the beginning of each year of the three-year
performance period. Partial vesting occurs if one or more of the one-year earnings per share
targets are met.

108Johnson Electric Holdings Limited
Annual Report 2016
16. SHARE CAPITAL (Cont’d)
The three-year cumulative goal for earnings per share for the fiscal years of 2015/2016
through 2017/2018 is 77 US cents per share.
Once vested, the directors have the discretion to deliver either shares or the cash equivalent of
the vested shares to eligible employees.
JEHL makes grants of fully-vested shares to the Independent Non-Executive Directors (“INED”).
The shares granted must be held by each director for the remainder of the board term in which
the grant was made. Each year, JEHL grants each of the INED shares equivalent in value to
US$6,000 rounded up to the next multiple of 500 shares.
Movements in the number of unvested units granted were as follows:
Number of unvested
units granted (thousands)
Restricted
Stock Units
Performance
Stock Units Total
Unvested units granted, as of 31 March 2014* 3,624 4,300 7,924
Units granted to Directors and employees during the year 1,828 2,267 4,095
Units vested to Directors and employees during the year (794) (815) (1,609)
Forfeited during the year (140) (222) (362)
Unvested units granted, as of 31 March 2015 4,518 5,530 10,048
Units granted to Directors and employees during the year 2,487 2,312 4,799
Units vested to Directors and employees during the year (1,275) (1,252) (2,527)
Forfeited during the year (122) (113) (235)
Unvested units granted, as of 31 March 2016 5,608 6,477 12,085
* As of 15 July 2014, the shares of JEHL were consolidated on 4 to 1 basis and the number of shares for prior year has been
adjusted to reflect the impact of this consolidation.
The weighted average fair value of the unvested units granted during the year was HK$28.02
(US$3.59).

NOTES TO THE ACCOUNTS
109
16. SHARE CAPITAL (Cont’d)
As of 31 March 2016, the number of unvested units under both the Share Scheme and the
Stock Unit Plan on a combined basis was as follows:
Number of unvested
units granted (thousands)
Vesting year *
Restricted
Stock Units
Performance
Stock Units Total
FY2016/17 1,334 2,030 3,364
FY2017/18 1,398 2,153 3,551
FY2018/19 2,551 2,294 4,845
FY2019/20 325 – 325
Total unvested units granted 5,608 6,477 12,085
* Shares are typically vested on 1 June of the year

110Johnson Electric Holdings Limited
Annual Report 2016
17. RESERVES
Capital
reserve
US$’000
Goodwill on
consolidation
US$’000
Exchange
reserve
US$’000
Share-based
employee
compensation
reserve
US$’000
Hedging
reserve
US$’000
Miscellaneous
reserves*
US$’000
Retained
earnings
US$’000
Total
US$’000
As of 31 March 2015 23,477 (233,885) 169,473 13,926 114,837 51,109 1,778,782 1,917,719
Hedging instruments – raw material commodity contracts
– fair value losses, net – – – – (51,268) – – (51,268)– transferred to inventory and
subsequently recognised in income statement – – – – 20,878 – – 20,878
– deferred income tax effect (Note 15) – – – – 5,014 – – 5,014– forward foreign currency exchange
contracts – fair value losses, net – – – – (67,676) – – (67,676)– transferred to income statement – – – – (38,978) – – (38,978)– deferred income tax effect (Note 15) – – – – 19,053 – – 19,053
– net investment hedge – fair value losses, net – – (13,422) – – – – (13,422)
Defined benefit plans – remeasurements (Note 14) – – – – – – 1,932 1,932– deferred income tax effect (Note 15) – – – – – – 753 753
Long service payment – remeasurements (Note 14) – – – – – – 98 98– deferred income tax effect (Note 15) – – – – – – (17) (17)
Investment property – revaluation surplus realised upon
disposal – – – – – (108) 108 –
Currency translations of subsidiaries and associates – – 2,997 – 145 – – 3,142
Net income / (expenses) recognised directly in equity – – (10,425) – (112,832) (108) 2,874 (120,491)
Profit for the year – – – – – – 172,660 172,660
Total comprehensive income / (expenses) for the year – – (10,425) – (112,832) (108) 175,534 52,169
Appropriation of retained earnings to statutory reserve – – – – – 4,476 (4,476) –
Cancellation of issued capital (Note 16) (5,224) – – – – – – (5,224)
Incentive share schemes – shares vested (Note 16) (1,502) – – (6,144) – – – (7,646)– value of employee services (Note 26) – – – 9,734 – – – 9,734
FY2014/15 final dividend paid – – – – – – (37,802) (37,802)FY2015/16 interim dividend paid – – – – – – (16,592) (16,592)
(6,726) – (10,425) 3,590 (112,832) 4,368 116,664 (5,361)
As of 31 March 2016 16,751 (233,885) 159,048 17,516 2,005 55,477 1,895,446 1,912,358
Final dividend proposed (Note 24) – – – – – – 37,525 37,525Other 16,751 (233,885) 159,048 17,516 2,005 55,477 1,857,921 1,874,833
As of 31 March 2016 16,751 (233,885) 159,048 17,516 2,005 55,477 1,895,446 1,912,358
* Miscellaneous reserves mainly represent property revaluation reserve, equity component of convertible bonds (net of tax) and statutory reserve.

NOTES TO THE ACCOUNTS
111
17. RESERVES (Cont’d)
Contributed
surplus
US$’000
Capital
reserve
US$’000
Goodwill on
consolidation
US$’000
Exchange
reserve
US$’000
Share-based
employee
compensation
reserve
US$’000
Hedging
reserve
US$’000
Miscellaneous
reserves*
US$’000
Retained
earnings
US$’000
Total
US$’000
As of 31 March 2014 15,499 38,904 (233,885) 219,855 10,470 (20,378) 45,944 1,640,385 1,716,794
Hedging instruments– raw material commodity contracts
– fair value losses, net – – – – – (17,088) – – (17,088)– transferred to inventory and subsequently
recognised in income statement – – – – – 8,107 – – 8,107– deferred income tax effect (Note 15) – – – – – 1,482 – – 1,482
– forward foreign currency exchange contracts– fair value gains, net – – – – – 175,868 – – 175,868– transferred to income statement – – – – – (17,104) – – (17,104)– deferred income tax effect (Note 15) – – – – – (23,790) – – (23,790)
– net investment hedge– fair value gains, net – – – 54,037 – 7,656 – – 61,693
Defined benefit plans– remeasurements (Note 14) – – – – – – – (15,812) (15,812)– deferred income tax effect (Note 15) – – – – – – – 1,553 1,553
Long service payment– remeasurements (Note 14) – – – – – – – 230 230– deferred income tax effect (Note 15) – – – – – – – (39) (39)
Investment property– revaluation surplus realised upon disposal – – – – – – (14) 14 –
Currency translations of subsidiaries and associate – – – (104,419) – 84 – – (104,335)
Net income / (expenses) recognised directly in equity – – – (50,382) – 135,215 (14) (14,054) 70,765Profit for the year – – – – – – – 210,894 210,894
Total comprehensive income / (expenses) for the year – – – (50,382) – 135,215 (14) 196,840 281,659
Appropriation of retained earnings to statutory reserve – – – – – – 4,224 (4,224) –
Convertible bonds– equity component of convertible bonds issued – – – – – – 4,823 – 4,823– deferred income tax effect (Note 15) – – – – – – (3,868) – (3,868)
Cancellation of issued capital (Note 16) (15,499) (15,427) – – – – – – (30,926)
Incentive share schemes– shares vested (Note 16) – – – – (3,889) – – – (3,889)– value of employee services (Note 26) – – – – 7,413 – – – 7,413
Share options– options lapsed – – – – (68) – – 68 –
FY2013/14 final dividend paid – – – – – – – (38,765) (38,765)FY2014/15 interim dividend paid – – – – – – – (15,522) (15,522)
(15,499) (15,427) – (50,382) 3,456 135,215 5,165 138,397 200,925
As of 31 March 2015 – 23,477 (233,885) 169,473 13,926 114,837 51,109 1,778,782 1,917,719
Final dividend proposed (Note 24) – – – – – – – 37,768 37,768Other – 23,477 (233,885) 169,473 13,926 114,837 51,109 1,741,014 1,879,951
As of 31 March 2015 – 23,477 (233,885) 169,473 13,926 114,837 51,109 1,778,782 1,917,719
* Miscellaneous reserves mainly represent property revaluation reserve, equity component of convertible bonds (net of tax) and statutory reserve.

112Johnson Electric Holdings Limited
Annual Report 2016
18. OTHER INCOME AND GAINS, NET
2016
US$’000
2015
US$’000
Gross rental income from investment property 3,771 4,192
Gains / (losses) on investments, net 105 (120)
Gains / (losses) on disposal of property, plant and equipment
and investment property (Note 26) 5,949 (473)
Fair value gains on investment property (Note 4 & 26) 10,205 10,749
Fair value (losses) / gains on other financial assets / liabilities (433) 65
Subsidies and other income 8,857* 3,505
28,454 17,918
* US$4.7 million of subsidies received above were compensation for a forthcoming plant relocation and are an offset for certain
asset impairments, refer to Note 3.
19. SELLING AND ADMINISTRATIVE EXPENSES
2016
US$’000
2015
US$’000
Selling expenses 98,260 100,933
Administrative expenses 336,706 303,936
Legal and warranty (Note 14) 11,290 9,632
Net gains on realisation of other financial assets and liabilities
and revaluation of monetary assets and liabilities (Note 21) (35,493) (6,962)
410,763 407,539
Note: Selling and administrative expenses included operating lease payments for FY2015/16 of US$6.2 million (FY2014/15: US$6.7
million).
20. FINANCE INCOME / (COSTS), NET
2016
US$’000
2015
US$’000
Interest income 3,814 13,998
Other finance income 2,422 –
Interest expense (2,374) (1,584)
Interest expense on convertible bonds (Note 23) (7,042) (6,868)
Net finance (costs) / income (Note 26) (3,180) 5,546
Borrowings are discussed in Note 12. Convertible bonds are discussed in Note 13.

NOTES TO THE ACCOUNTS
113
21. EXPENSES BY NATURE
Operating profit was stated after crediting and charging the following:
2016
US$’000
2015
US$’000
Depreciation
Depreciation of property, plant and equipment (Note 3) 87,300 71,765
Less: amounts capitalised in assets under construction (988) (670)
Net depreciation (Note 26) 86,312 71,095
Engineering expenditure *
Engineering expenditure 131,231 127,830
Capitalisation of engineering development costs (Note 5) (6,144) (6,269)
Net engineering expenditure 125,087 121,561
Employee compensation
Wages and salaries 647,489 589,018
Share-based payments 9,699 7,373
Social security costs 59,308 56,444
Pension costs – defined benefit plans (Note 14.1) 4,891 2,980
Pension costs – defined contribution plans (Note 14.2) 4,959 4,757
726,346 660,572
Less: amounts capitalised in assets under construction (7,022) (5,167)
719,324 655,405
Other items:
Cost of goods sold ** 1,646,433 1,503,647
Auditors’ remuneration 2,516 2,458
Amortisation of intangible assets (Note 5 & 26) 27,721 21,396
(Reversal of) / provision for impairment of property, plant and
equipment (Note 3 & 26) (1,129) 686
Provision for impairment of intangible assets (Note 5 & 26) 206 600
Net gains on realisation of other financial assets and
liabilities and revaluation of monetary assets and liabilities
(Note 19) (35,493) (6,962)
(Write back) for impairment / impairment of trade receivables /
bad debt expense (Note 9) (550) 1,107
* Engineering expenditure as a percentage of sales was 5.9% in FY2015/16 (FY2014/15: 6.0%).
** Cost of goods sold comprised materials, direct labour costs (including their social costs) and production overheads including
operating lease payments of US$15.4 million (FY2014/15: US$14.7 million).

114Johnson Electric Holdings Limited
Annual Report 2016
22. INCOME TAX EXPENSE
The amount of taxation in the consolidated income statement represents:
2016
US$’000
2015
US$’000
Current income tax
Provision for the year 33,824 39,392
(Over) / under provision in prior years (1,319) 634
32,505 40,026
Deferred income tax (Note 15) (8,616) (10,777)
Total income tax expense 23,889 29,249
Effective tax rate 11.6% 11.7%
Tax has been provided at the applicable rates on the estimated assessable profit in the
respective countries of operations for the year. The overall global effective tax rate for
FY2015/16 was 11.6% (FY2014/15: 11.7%). The Group’s effective tax rate differed from the
statutory tax rate of Hong Kong of 16.5% as follows:
2016 2015
US$’000 US$’000
Profit before income tax 206,636 249,061
Tax charged at Hong Kong profits tax rate 16.5% 34,095 16.5% 41,095
Effect of different tax rates in other countries
– Countries with taxable profit 1.6% 3,348 0.6% 1,438
– Countries with taxable loss (1.0)% (2,146) (1.5)% (3,743)
Effect of income, net of expenses, not subject
to tax (4.6)% (9,572) (4.0)% (9,885)
Over provisions in prior years
(current and deferred) (0.9)% (1,861) (0.4)% (1,055)
Effect of tax losses (recognised), net of
(utilisation) (0.3)% (706) (1.2)% (2,945)
Other timing differences unrecognised as an
asset and other taxes * 0.3% 731 1.7% 4,344
11.6% 23,889 11.7% 29,249
* Net of (utilisation)

NOTES TO THE ACCOUNTS
115
23. EARNINGS PER SHARE
Basic earnings per share
Basic earnings per share was calculated by dividing the profit attributable to shareholders by
the weighted average number of ordinary shares in issue during the year excluding ordinary
shares purchased by JEHL and held for the incentive share schemes.
2016 2015
Profit attributable to shareholders (thousands US Dollar) 172,660 210,894
Weighted average number of ordinary shares in issue (thousands) 859,540 874,537
Basic earnings per share (US cents per share) 20.09 24.11
Basic earnings per share (HK cents per share) 155.83 186.98
Diluted earnings per share
Diluted earnings per share was calculated by adjusting the weighted average number of ordinary
shares as per basic earnings per share, to include the weighted average number of all the
dilutive potential ordinary shares.
2016 2015
Profit attributable to shareholders (thousands US Dollar) 172,660 210,894
Adjustments for convertible bonds
– Interest (thousands US Dollar) (Note 20) 7,042 6,868
– Deferred income tax effect (thousands US Dollar) (743) (714)
Adjusted profit attributable to shareholders (thousands US Dollar) 178,959 217,048
Weighted average number of ordinary shares issued and
outstanding (thousands) 859,540 874,537
Adjustments for incentive shares granted
– Incentive share schemes - Restricted Stock Units 4,972 3,954
– Incentive share schemes - Performance Stock Units 2,568 2,750
Adjustments for convertible bonds
– assumed conversion of convertible bonds 39,025 38,294
Weighted average number of ordinary shares (diluted) (thousands) 906,105 919,535
Diluted earnings per share (US cents per share) 19.75 23.60
Diluted earnings per share (HK cents per share) 153.21 183.02

116Johnson Electric Holdings Limited
Annual Report 2016
24. DIVIDEND
2016
US$’000
2015
US$’000
Interim, of 15 HK cents (1.92 US cents) per share, paid in
January 2016 (FY2014/15: 14 HK cents or 1.79 US cents) 16,592 15,522
Final, proposed, of 34 HK cents (4.36 US cents) per share,
to be paid in August 2016
(FY2014/15: 34 HK cents or 4.36 US cents) (Note 17) 37,525 * 37,768
54,117 53,290
* Proposed dividend is calculated based on the total number of ordinary shares as of 31 March 2016. Actual dividend will be paid on
12 August 2016 to shareholders whose names appear on the Register of Shareholders of JEHL on 3 August 2016.
Total dividend per share for the year is 49 HK cents (FY2014/15 was 48 HK cents).
At a meeting held on 17 May 2016 the Directors recommended a final dividend of 34 HK cents
(4.36 US cents) per share to be paid out in August 2016. The recommended final dividend will
be reflected as an appropriation of retained earnings for FY2016/17.
Dividends for the periods FY2009/10 through FY2015/16 are shown in the table below:
Interim
HK cents
per share
Final
HK cents
per share
Total
HK cents
per share
Total
dividend
US$’000
FY2009/10 * – 20.0 20.0 23,659
FY2010/11 * 12.0 24.0 36.0 42,488
FY2011/12 * 12.0 28.0 40.0 46,118
FY2012/13 * 12.0 32.0 44.0 50,396
FY2013/14 * 12.0 34.0 46.0 52,648
FY2014/15 14.0 34.0 48.0 53,290
FY2015/16 15.0 34.0** 49.0 54,117
* The interim and final dividends per share for prior periods have been adjusted to reflect the impact of Share Consolidation.
** Final dividend for FY2015/16 has been recommended by the Board of Directors and is subject to shareholder approval.

NOTES TO THE ACCOUNTS
117
25. COMMITMENTS
25.1 Capital commitments
2016
US$’000
2015
US$’000
Capital commitments for property, plant and equipment
Contracted but not provided for 48,782 18,884
25.2 Operating lease commitments
(i) The Group’s future aggregate minimum lease payments under non-cancellable
operating leases as of 31 March 2016 and 31 March 2015 were as follows:
2016 2015
Land and
buildings
US$’000
Others
US$’000
Land and
buildings
US$’000
Others
US$’000
Less than 1 year 20,562 2,171 17,965 1,3431 – 5 years 55,143 4,872 51,726 2,351Over 5 years 51,609 744 14,199 –
127,314 7,787 83,890 3,694
(ii) The Group’s future aggregate minimum lease rental receivable under non-cancellable
operating leases on land and buildings as of 31 March 2016 and 31 March 2015
were as follows:
2016
US$’000
2015
US$’000
Less than 1 year 1,360 1,323
1 – 5 years 5,138 5,293
Over 5 years 5,864 7,547
12,362 14,163
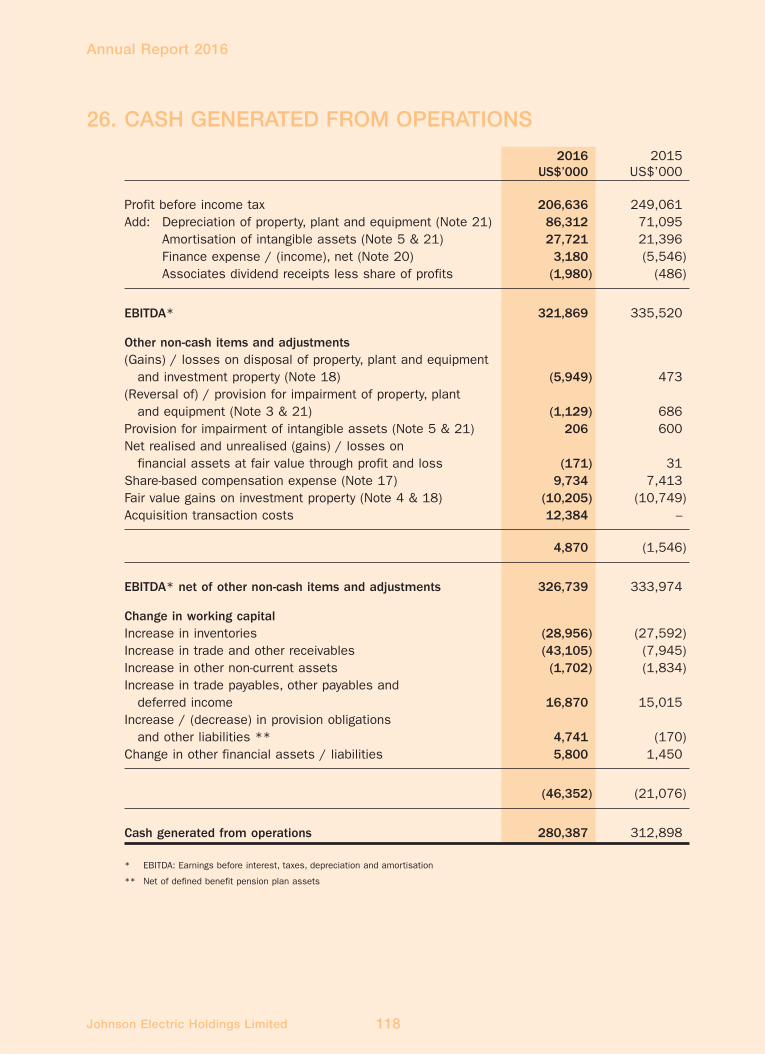
118Johnson Electric Holdings Limited
Annual Report 2016
26. CASH GENERATED FROM OPERATIONS
2016
US$’000
2015
US$’000
Profit before income tax 206,636 249,061
Add: Depreciation of property, plant and equipment (Note 21) 86,312 71,095
Amortisation of intangible assets (Note 5 & 21) 27,721 21,396
Finance expense / (income), net (Note 20) 3,180 (5,546)
Associates dividend receipts less share of profits (1,980) (486)
EBITDA* 321,869 335,520
Other non-cash items and adjustments
(Gains) / losses on disposal of property, plant and equipment
and investment property (Note 18) (5,949) 473
(Reversal of) / provision for impairment of property, plant
and equipment (Note 3 & 21) (1,129) 686
Provision for impairment of intangible assets (Note 5 & 21) 206 600
Net realised and unrealised (gains) / losses on
financial assets at fair value through profit and loss (171) 31
Share-based compensation expense (Note 17) 9,734 7,413
Fair value gains on investment property (Note 4 & 18) (10,205) (10,749)
Acquisition transaction costs 12,384 –
4,870 (1,546)
EBITDA* net of other non-cash items and adjustments 326,739 333,974
Change in working capital
Increase in inventories (28,956) (27,592)
Increase in trade and other receivables (43,105) (7,945)
Increase in other non-current assets (1,702) (1,834)
Increase in trade payables, other payables and
deferred income 16,870 15,015
Increase / (decrease) in provision obligations
and other liabilities ** 4,741 (170)
Change in other financial assets / liabilities 5,800 1,450
(46,352) (21,076)
Cash generated from operations 280,387 312,898
* EBITDA: Earnings before interest, taxes, depreciation and amortisation
** Net of defined benefit pension plan assets

NOTES TO THE ACCOUNTS
119
26. CASH GENERATED FROM OPERATIONS (Cont’d)
In the cash flow statement, proceeds from disposal of property, plant and equipment and
investment property comprise:
2016
US$’000
2015
US$’000
Net book amount 9,691 1,285
Gains / (losses) on disposal of property, plant and
equipment and investment property (Note 18) 5,949 (473)
Proceeds from disposal of property, plant and
equipment and investment property 15,640 812
27. BUSINESS COMBINATION
On 27 October 2015, the Group acquired the entire share capital of three companies which
together constitute the business of Stackpole International for a consideration of US$675.5
million (C$800 million enterprise value plus other considerations).
Stackpole International is a leading manufacturer of highly-engineered automotive engine and
transmission pumps and powder metal components and is headquartered in Ontario, Canada.
Acquiring Stackpole International’s pump technology and powder metal expertise will enable the
Group to provide integrated motorised pump solutions to customers in a rapidly growing market
segment within the automotive industry and increase the Group’s exposure to the North
American automotive market which is presently experiencing strong demand, as well as provide
attractive longer term growth platforms in Europe and Asia.
Acquisition transaction costs of US$11.1 million were incurred in FY2015/16 and recognised in
the income statement within selling and administrative expenses.
The acquired business contributed revenue of US$181.8 million and net profit of US$4.7
million (excluding transaction costs) to the Group for period from the date of acquisition to 31
March 2016.
If the acquisition had occurred on 1 April 2015, the Group’s consolidated income statement
would show pro forma revenue of US$2,481.5 million (Stackpole International 7 months:
US$245.6 million), EBITDA of US$368.3 million (Stackpole International 7 months: US$35.3
million) and net profit of US$191.7 million (Stackpole International 7 months: US$7.9 million).
This excluded acquisition transaction costs for Stackpole International of US$11.1 million.

120Johnson Electric Holdings Limited
Annual Report 2016
27. BUSINESS COMBINATION (Cont’d)
Details of net assets acquired and goodwill are as follows:
2016
US$’000
Purchase consideration 675,524
Fair value of net assets acquired – shown as below (421,997)
Goodwill * 253,527
Acquiree’s
carrying amount
US$’000
Fair Value
US$’000
Property, plant and equipment 153,298 152,957
Intangible assets 90,457 243,650
Investment in associates 29,997 33,914
Deferred income tax assets 2,653 2,739
Defined benefit pension plan assets 1,575 1,575
Inventories 27,337 28,075
Trade receivables and other receivables 85,231 85,231
Cash and deposits 18,357 18,357
Trade payables and other payables (67,319) (67,319)
Current income tax liabilities (1,077) (1,077)
Provision obligations and other liabilities (11,870) (12,912)
Deferred income tax liabilities (24,710) (63,193)
Net assets acquired 303,929 421,997
Purchase consideration settled in cash
Cash 675,524
Cash and deposits in subsidiaries acquired (18,357)
Cash outflow on acquisition 657,167
* None of the goodwill recognised is expected to be deductible for income tax purpose.
As of 31 March 2016, the Group has substantially completed the fair value assessments for
net assets acquired (including intangible assets) from the business combination activities. The
fair values of net assets stated above are on a provisional basis subject to the final valuation
of certain assets and liabilities.

NOTES TO THE ACCOUNTS
121
28. POST BALANCE SHEET EVENT
On 4 February 2016, a subsidiary of the Group entered into a put option agreement with the
shareholders of AML Développment to acquire the entire share capital of AML Développment.
Following the completion of the Work’s Council consultation process, the sellers exercised the
put option on 10 April 2016. The share purchase agreement was signed on 22 April 2016 for a
consideration of approximately EUR65 million, subject to post-closing adjustments and
transaction expenses incurred for the acquisition.
AML Développment together with its subsidiaries (“AML”) is a leading manufacturer of headlamp
levelers, smart actuators and headlamp cleaning systems for the automotive industry and is
headquartered in Le Bourget, France. Acquiring AML will complete Johnson Electric’s product
portfolio in the headlamp actuation segment. With AML’s know-how and over 20 years of
experience in the segment, the combined business will be able to offer solutions that improve
visibility and enhance safety of drivers and other road users.
This transaction is expected to close in May 2016, subject to customary conditions including
obtaining applicable regulatory approvals. The consideration is payable in cash at completion
and will be financed from the Group’s internal cash reserves and available credit facilities.
Because the process of fair valuing the AML business and the related purchase price allocation
has not been completed as of 17 May 2016, the initial accounting for the business combination
is incomplete as of the date of this report. As a result, it is impracticable to disclose the
goodwill and major class of assets acquired and liabilities assumed regarding the acquisition.
Acquisition transaction costs of US$1.3 million were incurred in FY2015/16 and recognised in
the income statement within selling and administrative expenses.

122Johnson Electric Holdings Limited
Annual Report 2016
29. BENEFITS AND INTERESTS OF DIRECTORS ANDSENIOR MANAGEMENT COMPENSATION
29.1 Directors’ remuneration
The remuneration of directors for FY2015/16 was as follows:
Name of directorFees
US$’000Salary*
US$’000
DiscretionaryBonus
US$’000
Share-based
paymentUS$’000
Employer’scontribution
to retirementbenefit
schemeUS$’000
TotalUS$’000
Yik-Chun Koo Wang 112 – – – – 112
Patrick Shui-Chung Wang – 912 1,317 – 109 2,338
Winnie Wing-Yee Wang – 642 464 – 77 1,183
Austin Jesse Wang – 340 125 – 37 502
Peter Kin-Chung Wang 47 – – – – 47
Peter Stuart Allenby
Edwards 42 – – 7 – 49
Patrick Blackwell Paul 59 – – 7 – 66
Michael John Enright 54 – – 7 – 61
Joseph Chi-Kwong Yam 44 – – 7 – 51
Christopher Dale Pratt 47 – – 7 – 54
405 1,894 1,906 35 223 4,463
The remuneration of directors for FY2014/15 was as follows:
Name of directorFees
US$’000Salary*
US$’000
DiscretionaryBonus
US$’000
Share-based
paymentUS$’000
Employer’scontribution
to retirementbenefit
schemeUS$’000
TotalUS$’000
Yik-Chun Koo Wang – 108 – – – 108
Patrick Shui-Chung Wang – 889 1,384 – 106 2,379
Winnie Wing-Yee Wang – 626 488 – 75 1,189
Austin Jesse Wang – 345 104 – 35 484
Peter Kin-Chung Wang 36 – – – – 36
Peter Stuart Allenby Edwards 37 – – 8 – 45
Patrick Blackwell Paul 49 – – 8 – 57
Michael John Enright 44 – – 8 – 52
Joseph Chi-Kwong Yam 34 – – 8 – 42
Christopher Dale Pratt 24 – – 8 – 32
224 1,968 1,976 40 216 4,424
* Salary included basic salaries, housing allowances and other benefits in kind.

NOTES TO THE ACCOUNTS
123
29. BENEFITS AND INTERESTS OF DIRECTORS ANDSENIOR MANAGEMENT COMPENSATION (Cont’d)
29.2 Senior management compensation
Other than the directors’ remuneration disclosed above, emoluments paid to 8 (FY2014/15:
10) senior management as set out in the section Profile of Directors and Senior Management
on pages 164 to 169 were as follows:
2016
US$’000
2015
US$’000
Salaries, allowances and other benefits 5,185 6,104
Retirement scheme contributions 492 524
Share-based payment 2,997 2,355
Bonuses 3,153 3,107
11,827 12,090
Remuneration bands
Number of individuals
2016 2015
US$897,001 – US$1,026,000
(HK$7,000,001 – HK$8,000,000) – 3
US$1,026,001 – US$1,154,000
(HK$8,000,001 – HK$9,000,000) 1 1
US$1,154,001 – US$1,282,000
(HK$9,000,001 – HK$10,000,000) 1 3
US$1,282,001 – US$1,410,000
(HK$10,000,001 – HK$11,000,000) 1 2
US$1,410,001 – US$1,538,000
(HK$11,000,001 – HK$12,000,000) 4 –
US$1,538,001 – US$1,666,000
(HK$12,000,001 – HK$13,000,000) – 1
US$2,307,001 – US$2,436,000
(HK$18,000,001 – HK$19,000,000) 1 –

124Johnson Electric Holdings Limited
Annual Report 2016
29. BENEFITS AND INTERESTS OF DIRECTORS ANDSENIOR MANAGEMENT COMPENSATION (Cont’d)
29.3 Five highest individuals compensation
Of the five highest paid individuals of the Group, one is a director of the Group whose
remuneration is included in Note 29.1 (FY2014/15: 1 director in the five highest paid
individuals). The compensation paid to the remaining 4 (FY2014/15: 4) highest paid
employees were as follows:
2016US$’000
2015US$’000
Salaries, allowances and other benefits 2,800 2,734
Retirement scheme contributions 279 255
Share-based payment 1,939 1,049
Bonuses 1,722 1,556
6,740 5,594
Remuneration bands
Number of individuals
2016 2015
US$1,218,001 – US$1,282,000(HK$9,500,001 – HK$10,000,000) – 1
US$1,282,001 – US$1,346,000(HK$10,000,001 – HK$10,500,000) – 1
US$1,346,001 – US$1,410,000(HK$10,500,001 – HK$11,000,000) – 1
US$1,410,001 – US$1,474,000(HK$11,000,001 – HK$11,500,000) 2 –
US$1,474,001 – US$1,538,000(HK$11,500,001 – HK$12,000,000) 1 –
US$1,602,001 – US$1,666,000(HK$12,500,001 – HK$13,000,000) – 1
US$2,307,001 – US$2,372,000(HK$18,000,001 – HK$18,500,000) 1 –
30. RELATED PARTY TRANSACTION
Details of substantial shareholders are shown in Disclosure of Interests in the Report of the
Directors. The Group had no material related party transactions during the year. Details of
directors’ remunerations and senior management compensation are disclosed in Note 29.

NOTES TO THE ACCOUNTS
125
31. FINANCIAL RISK MANAGEMENT
The Group’s activities expose it to a variety of financial risks: market risk (including foreign
exchange risk, interest rate risk, fair value interest rate risk and commodity price risk), customer
credit risk, liquidity risk and capital risk. The Group’s overall risk management program focuses
on the unpredictability of financial markets and seeks to minimise potential adverse effects on
the Group’s financial performance. The Group uses derivative financial instruments to hedge
certain risk exposures.
Risk management is carried out by a central treasury department (“Group Treasury”) according
to Group policy. Group Treasury identifies, evaluates and hedges financial risks in close co-
operation with the Group’s operating units.
31.1 Market risk
(a) Foreign exchange risk
The Group operates globally and is exposed to foreign exchange risk primarily
through sales and purchases transactions that are denominated in a currency
other than the functional currency of the subsidiaries.
For FY2015/16, of the sales, 43% (FY2014/15: 45%) were in USD, 31%
(FY2014/15: 34%) in EUR, 18% (FY2014/15: 18%) in RMB with the rest being in
other currencies including CAD and JPY.
The major currencies used for raw material commodity purchases, production
overhead costs and selling and administrative expenses are USD, HKD, RMB, EUR,
HUF, MXN, CHF, PLN, ILS and CAD.
Open foreign exchange exposures are hedged with forward foreign currency
exchange contracts, with a view to reducing the net exposure to currency
fluctuation. As of 31 March 2016, forward foreign currency exchange contracts had
durations of up to 72 months.
The Group’s most significant currency exposures relate to RMB and EUR. As of 31
March 2016, if USD had weakened / strengthened by 5% against RMB with all
other variables held constant, post-tax profit for the year would be 0.7%
(FY2014/15: 5.6%) higher / lower, mainly due to foreign exchange differences on
the translation of RMB denominated net current assets. If USD had weakened /
strengthened by 5% against EUR with all other variables held constant, post-tax
profit for the year would be 2.3% (FY2014/15: 1.8%) higher / lower, mainly a result
of foreign exchange differences on translation of EUR denominated net current
assets. The above sensitivity ignores the potential impact of cash flow hedges.

126Johnson Electric Holdings Limited
Annual Report 2016
31. FINANCIAL RISK MANAGEMENT (Cont’d)
31.1 Market risk (Cont’d)
(a) Foreign exchange risk (Cont’d)
The Group has operations in Europe and its net assets value is exposed to foreign
exchange risk denominated in Euro. This exposure is hedged with forward foreign
exchange contracts and cross currency interest rate swaps with durations up to 61
months at the year end.
(b) Interest rate risk
The Group’s interest rate risk mainly arises from interest-bearing borrowings.
The Group continues to monitor interest rate risk and will consider the use of both
fixed and floating interest rate borrowings in the functional currencies where the
Group operates.
Cash and deposits as of 31 March 2016 were US$193.3 million (31 March 2015:
US$773.2 million) bearing interest at a weighted average rate of approximately 0.4%
(31 March 2015: 1.8%). Other than cash and deposits, the Group has no significant
interest-bearing assets. Borrowings as of 31 March 2016 were US$220.1 million
(31 March 2015: US$94.0 million) bearing interest at a weighted average rate of
approximately 1.8% (31 March 2015: 0.7%). A 0.25% increase / decrease in
interest rate would decrease / increase the profit by US$0.6 million (31 March
2015: US$0.2 million).
(c) Commodity price risk
The Group is exposed to commodity price risk, mainly from fluctuations in steel,
copper, silver and aluminium prices. Price risk due to steel is reduced through
fixed price contracts up to 3 months forward with the Group’s suppliers. Price risk
due to copper, silver and aluminium is reduced by hedging through appropriate
financial instruments that have varying maturities ranging from 1 to 72 months
as of 31 March 2016. The Group also manages copper and silver prices by
way of incorporating appropriate clauses in certain customer contracts to pass
increases / decreases in raw material costs onto these customers.
The Group’s most significant commodity price risk exposure relates to copper. A
10% increase / decrease in the copper price would increase / decrease the equity
by US$23.0 million (31 March 2015: US$24.3 million), representing the change in
fair value of copper hedging contracts at the balance sheet date.

NOTES TO THE ACCOUNTS
127
31. FINANCIAL RISK MANAGEMENT (Cont’d)
31.2 Credit and customer collection risk
The Group’s credit and customer collection risk mainly arises from trade and other
receivables. The Group has no significant concentrations of credit risk. The Group
normally grants credit terms ranging from 30 to 105 days to trade customers. It has a
policy in place to evaluate customers’ credit risk by considering their current financial
position and past repayment history. Management reviews the collectability of the
overdue accounts receivable according to the Group’s credit and provision for doubtful
debt policies. The Group’s customer credit management has resulted in a continuing low
rate of bad debt.
The Group manages its deposits with banks and financial institutions and transactions
involving derivative financial instruments by monitoring credit ratings and limiting the
aggregate risk to any individual counterparty. The majority of the Group’s cash and
deposits are held with, and transactions involving derivative financial instruments were
made with, major financial institutions (e.g. the Group’s principal bankers) with strong
investment grade credit ratings.
As of 31 March 2016, JEHL’s exposure to credit risk for financial guarantees is US$145.2
million (31 March 2015: US$92.9 million).
31.3 Liquidity risk
Management believes the combination of cash on hand, available credit lines and
expected future operating cash flows is sufficient to satisfy the Group’s cash needs for
the current and planned level of operations for the foreseeable future and the anticipated
acquisition of AML Systems. Available credit lines include financing of trade receivables
by subsidiary companies in USA, Europe and Hong Kong, guaranteed by JEHL.
The Group had cash and cash equivalents of US$193.3 million as of 31 March 2016 (31
March 2015: US$773.2 million), which constitute 6% (31 March 2015: 27%) of its total
assets. As of 31 March 2016, The Group had US$172 million of committed and unutilised
facilities (31 March 2015: US$165 million) and US$292 million of uncommitted and
unutilised short term borrowing facilities provided by its principal bankers (31 March
2015: US$322 million). The Group also had US$112 million in uncommitted and
unutilised trade receivable financing lines (31 March 2015: US$91 million).

128Johnson Electric Holdings Limited
Annual Report 2016
31. FINANCIAL RISK MANAGEMENT (Cont’d)
31.3 Liquidity risk (Cont’d)
The table below analyses the Group’s borrowings and other financial assets / liabilities
into relevant maturity groupings based on the remaining period to the contractual maturity
date at the balance sheet date. The amounts disclosed in the table are the contractual
undiscounted cash flows. Balances due within 12 months equal their carrying balances,
as the impact of discounting is not significant.
Less than
1 year
US$’000
1 – 2 years
US$’000
2 – 5 years
US$’000
Over
5 years
US$’000
As of 31 March 2016
Borrowings 147,385 1,609 33,973 46,400
Convertible bonds 2,000 2,000 221,620 –
Other financial assets and liabilities
– Raw material commodity contracts 17,668 11,639 16,474 477
– Forward foreign exchange contracts
– Net settled (2,863) 2,622 23,272 4,972
– Gross settled:
– inflow (688,663) (467,135) (1,085,114) (114,243)
– outflow 670,143 441,595 976,509 90,612
– Net investment hedge
– Gross settled:
– inflow (1,290) (53,175) (107,836) (75,000)
– outflow – 43,084 82,767 77,083
– Fair value hedge
– Gross settled:
– inflow (51,557) – – –
– outflow 43,084 – – –
Finance lease 1,831 1,829 1,549 5,361
Trade and other payables 374,535 – – –
As of 31 March 2015
Borrowings 66,102 28,124 327 –
Convertible bonds 2,000 2,000 223,620 –
Other financial assets and liabilities
– Raw material commodity contracts 9,742 4,012 4,637 98
– Forward foreign exchange contracts
– Net settled (6,252) (3,948) 10,972 7,002
– Gross settled:
– inflow (530,275) (544,663) (1,119,914) (381,215)
– outflow 483,921 494,901 980,288 302,286
– Net investment hedge
– Gross settled:
– inflow (52,034) (52,822) (159,649) (76,898)
– outflow 41,165 41,165 120,246 73,649
Finance lease 1,400 1,400 1,662 –
Trade and other payables 272,434 – – –

NOTES TO THE ACCOUNTS
129
31. FINANCIAL RISK MANAGEMENT (Cont’d)
31.4 Capital risk management
As of 31 March 2016, the Group’s total debt to capital ratio was 18% compared to 13%
as of 31 March 2015.
Total debt to capital ratio as of 31 March 2016 and 31 March 2015 was as follows:
2016US$’000
2015US$’000
Borrowings - current (Note 12) 98,434 65,816
Borrowings - non-current (Note 12) 121,706 28,214
Convertible bonds (Note 13) 202,387 197,345
Total debt 422,527 291,375
Total equity 1,884,752 1,900,912
Total capital (equity + debt) 2,307,279 2,192,287
Total debt to capital ratio 18% 13%
The net cash position as of 31 March 2016 and 31 March 2015 was as follows:
Total debt (422,527) (291,375)
Cash and deposits (Note 10) 193,325 773,172
Net (debt) / cash (total debt less cash) (229,202) 481,797
Funding requirements for capital expenditure are expected to be met by cash on hand,
available credit lines and expected future operating cash flows.

130Johnson Electric Holdings Limited
Annual Report 2016
32. FAIR VALUE ESTIMATION
The fair value of the Group’s assets and liabilities is classified into a 3 levels hierarchy based
on measurement according to HKFRS 7 and HKFRS 13 requirements and disclosed as below:
Level 1 : No financial assets and liabilities of the Group are quoted in public markets.
Level 2 : The Group’s level 2 financial assets and liabilities are traded in the market and the
fair values are based on bank valuations. The Group’s level 2 investment property
is valued on an open market basis.
Level 3 : The Group’s level 3 investment property is not traded actively in the market and
the fair values are obtained by appraisals performed by independent, professional
qualified valuers. The fair values of the Group’s level 3 financial assets / liabilities
are based on the valuations issued by investment banks.

NOTES TO THE ACCOUNTS
131
32. FAIR VALUE ESTIMATION (Cont’d)
The following table presents the Group’s assets and liabilities that are measured at fair value
as of 31 March 2016 and 31 March 2015.
Level 1
US$’000
Level 2
US$’000
Level 3
US$’000
Total
US$’000
As of 31 March 2016
Assets
Investment property
– Commercial building – – 59,827 59,827
– Industrial property – – 25,895 25,895
– Residential property and car parks – 457 5,351 5,808
Other financial assets
– Derivatives used for hedging – 175,254 – 175,254
– Derivatives held for trading – 156 – 156
– Others – – 116 116
Total assets – 175,867 91,189 267,056
Liabilities
Other financial liabilities
– Derivatives used for hedging – 142,354 – 142,354
– Derivatives held for trading – 645 – 645
– Others – – 120 120
Total liabilities – 142,999 120 143,119
Level 1
US$’000
Level 2
US$’000
Level 3
US$’000
Total
US$’000
As of 31 March 2015
Assets
Investment property
– Industrial property – – 76,003 76,003
– Residential property and car parks – 681 5,351 6,032
Other financial assets
– Derivatives used for hedging – 275,111 – 275,111
– Derivatives held for trading – 19 – 19
– Others – – 124 124
Total assets – 275,811 81,478 357,289
Liabilities
Other financial liabilities
– Derivatives used for hedging – 86,717 – 86,717
– Derivatives held for trading – 3 – 3
Total liabilities – 86,720 – 86,720

132Johnson Electric Holdings Limited
Annual Report 2016
32. FAIR VALUE ESTIMATION (Cont’d)
There were no significant transfer of assets / liabilities between the level 1, level 2 and level 3
fair value hierarchy classifications during the year.
The following summarises the major methods and assumptions used in estimating the fair
values of the assets and liabilities classified as level 2 or 3 and the valuation process for
assets and liabilities classified as level 3:
(i) Investment property
Level 2
Fair values of car parks are generally derived using the direct comparison method. This
valuation method is based on comparing the property to be valued directly with other
comparable properties in close proximity, which have recently transacted. The most
significant input into this valuation approach is unit price per parking space.
Level 3
Fair values of commercial building, industrial property and residential property are derived
using the income capitalisation and market comparison method. Income capitalisation
method is based on the capitalisation of the net income and reversionary income
potential by adopting appropriate capitalisation rates, which are derived from analysis of
sale transactions and valuers’ interpretation of prevailing investor requirements or
expectations. The prevailing market rents adopted in the valuation have referenced to
valuers’ view of recent lettings, within the subject property and other comparable
property. The market comparison method takes into account properties that are similar in
nature in the general locality, which have recently transacted, with adjustments made on
factors such as size, age, location and condition. The most significant input in this
valuation approach is the price per square feet.
Discussion of valuation processes and results are held between the Group’s senior
management and valuers to validate the major inputs and validation process.
Significant inputs used to determine the fair value of investment property are as follows:
As of 31 March 2016 As of 31 March 2015
Property Valuation method
Market rate /
rent per month Market yield
Market rate /
rent per month Market yield
Commercial Market comparison HK$4,227/sq.ft HK$3,545/sq.ft
Industrial Income capitalisation HK$4.5 to
HK$7.0/sq.ft
7.4% to 11.0% HK$4.2 to
HK$7.0/sq.ft
7.4% to 11.0%
Residential Market comparison HK$17,920/sq.ft HK$18,138/sq.ft
Market rates / rents are estimated based on valuers’ view of recent lettings, within the
subject property and other comparable property. The higher the rents, the higher the fair
value.
Market yields are estimated by valuers based on the risk profile of the property being
valued. The lower the rates, the higher the fair value.

NOTES TO THE ACCOUNTS
133
32. FAIR VALUE ESTIMATION (Cont’d)
(ii) Other financial assets / liabilities
The majority of the Group’s other financial assets / liabilities are classified as level 2.
The Group relies on bank valuations to determine the fair value of financial assets /
liabilities which in turn are determined using discounted cash flow analysis. These
valuations maximise the use of observable market data. Commodity price and foreign
currency exchange prices are the key observable inputs in the valuation.
The following table presents the changes in level 3 assets / liabilities for FY2015/16 and
FY2014/15:
Investment property
Commercial
building
Industrial
property
Residential
property
Other financial
assets / (liabilities) Total
2016
US$’000
2015
US$’000
2016
US$’000
2015
US$’000
2016
US$’000
2015
US$’000
2016
US$’000
2015
US$’000
2016
US$’000
2015
US$’000
At beginning of the year – – 76,003 61,967 5,351 5,672 124 198 81,478 67,837
Currency translations – – (388) 77 – – – – (388) 77
Capitalised expenditure 90 – – 2,890 – – – – 90 2,890
Transfer 50,290 – (50,290) – – – – – – –
Disposal – – – – – – (183) (7) (183) (7)
Fair value gains / (losses)
recorded in income
statement 9,447 – 570 11,069 – (321) 55 (67) 10,072 10,681
At end of the year 59,827 – 25,895 76,003 5,351 5,351 (4) 124 91,069 81,478
Change in unrealised
gains / (losses) for the
year included in
income statement for
assets held at
balance sheet date 9,447 – 570 11,069 – (321) (53) (10) 9,964 10,738
Total gains / (losses) for the
year included in income
statement under “Other
income and gains, net” 9,447 – 570 11,069 – (321) 55 (67) 10,072 10,681

134Johnson Electric Holdings Limited
Annual Report 2016
33. FINANCIAL INSTRUMENTS BY CATEGORY
According to HKFRS 7 and HKFRS 9, financial assets represent assets with contractual rights to receive cash flows. Financial liabilities represent liabilities with contractual obligations to pay the cash flows to one or more recipients. The financial instruments of the Group are classified into 2 categories disclosed as below:
Financial assets /
(liabilities)
at amortised cost
US$’000
Financial assets /
(liabilities)
at fair value
US$’000
Total
US$’000
As of 31 March 2016
Assets as per balance sheet
Other non-current assets 4,850 – 4,850
Other financial assets – 175,526 175,526
Trade and other receivables
excluding prepayments 475,137 – 475,137
Pledged deposits 9,119 – 9,119
Cash and deposits 193,325 – 193,325
Total financial assets 682,431 175,526 857,957
Liabilities as per balance sheet
Other financial liabilities – (143,119) (143,119)
Trade payables (250,240) – (250,240)
Other payables (124,295) – (124,295)
Borrowings (220,140) – (220,140)
Convertible bonds (202,387) – (202,387)
Finance lease (6,473) – (6,473)
Total financial liabilities (803,535) (143,119) (946,654)
As of 31 March 2015
Assets as per balance sheet
Other non-current assets 4,785 – 4,785
Other financial assets – 275,254 275,254
Trade and other receivables
excluding prepayments 363,066 – 363,066
Cash and deposits 773,172 – 773,172
Total financial assets 1,141,023 275,254 1,416,277
Liabilities as per balance sheet
Other financial liabilities – (86,720) (86,720)
Trade payables (206,161) – (206,161)
Other payables (66,273) – (66,273)
Borrowings (94,030) – (94,030)
Convertible bonds (197,345) – (197,345)
Finance lease (3,710) – (3,710)
Total financial liabilities (567,519) (86,720) (654,239)

NOTES TO THE ACCOUNTS
135
34. PRINCIPAL ACCOUNTING POLICIES
The principal accounting policies applied in the preparation of these consolidated financial statements are set out below. These policies have been consistently applied to all of the years presented, unless otherwise stated. Certain comparative figures have been reclassified to conform with current year presentation.
34.1 Consolidation
The consolidated financial statements include the financial statements of JEHL and all of
its subsidiaries made up to 31 March 2016.
34.2 Subsidiaries
Subsidiaries are all entities over which the Group has control. The Group controls an
entity when the Group is exposed to, or has rights to, variable returns from its
involvement with the entity and has the ability to affect those returns through its power
over the entity.
Subsidiaries are fully consolidated from the date on which control is transferred to the
Group. They are de-consolidated from the date that control ceases.
The Group applies the acquisition method to account for business combinations. The
consideration transferred for the acquisition of a subsidiary is the fair values of the
assets and liabilities measured initially at their fair values at the acquisition date and the
equity interests issued by the Group. Acquisition transaction costs are expensed as
incurred. The Group recognises any non-controlling interest in the acquiree on an
acquisition-by-acquisition basis either at fair value or at the non-controlling interest’s
proportionate share of the recognised amounts of acquiree’s identifiable net assets.
In JEHL’s balance sheet, investments in subsidiaries are accounted for at cost less
impairment. Cost is adjusted to reflect changes in consideration arising from contingent
consideration amendments. Cost also includes direct attributable costs of investment.
The excess of the consideration transferred, the amount recognised for non-controlling
interest and any fair value of the Group’s previously held equity interests in the acquiree
over the identifiable net assets acquired is recorded as goodwill. If this is less than the
fair value of the net assets acquired, the difference is recognised directly in the income
statement.
Inter-company transactions, balances and unrealised gains/losses on transactions
between Group companies are eliminated.
When the Group ceases to have control, any retained interest in the entity is remeasured
to its fair value at the date when control is lost. Gains and losses arising on disposal is
recognised in income statement. In addition, any amounts previously recognised in other
comprehensive income in respect of that entity are reclassified to profit and loss.

136Johnson Electric Holdings Limited
Annual Report 2016
34. PRINCIPAL ACCOUNTING POLICIES (Cont’d)
34.3 Associates
Associates are all entities over which the Group has significant influence but not control,
generally accompanying a shareholding of between 20% and 50% of the voting rights.
Investments in associate are accounted for using the equity method of accounting. Under
the equity method, the investment is initially recognised at cost, and the carrying amount
is increased or decreased to recognise the investor’s share of the profit and loss of the
investee after the date of acquisition less dividends received. The Group’s investment in
associates includes goodwill identified on acquisition.
If the ownership interest in an associate is reduced but significant influence is retained,
only a proportionate share of the amounts previously recognised in other comprehensive
income is reclassified to profit and loss where appropriate.
The Group’s share of post-acquisition profits or losses is recognised in the income
statement, and its share of post-acquisition movements in other comprehensive income
is recognised in other comprehensive income with a corresponding adjustment to the
carrying amount of the investment. When the Group’s share of losses in an associate
equals or exceeds its interest in the associate, including any other long term unsecured
receivables, the Group does not recognise further losses, unless it has incurred legal or
constructive obligations or made payments on behalf of the associate.
Unrealised gains on transactions between the Group and its associate are eliminated to
the extent of the Group’s interest in the associate. Unrealised losses are also eliminated
unless the transaction provides evidence of an impairment of the asset transferred.
Accounting policies of associate have been changed where necessary to ensure
consistency with the policies adopted by the Group.

NOTES TO THE ACCOUNTS
137
34. PRINCIPAL ACCOUNTING POLICIES (Cont’d)
34.4 Foreign currency translation
(a) Functional and presentation currency
Items included in the financial statements of each of the Group’s entities are
measured using the currency of the primary economic environment in which the
entity operates (“the functional currency”). The consolidated financial statements
are presented in US Dollars, which is JEHL’s functional and the Group’s
presentation currency.
(b) Transactions and balances
Foreign currency transactions are translated into the functional currency using the
exchange rates prevailing at the dates of the transactions or valuation where items
are re-measured. Foreign exchange gains and losses resulting from the settlement
of such transactions and from the translation at year-end exchange rates of
monetary assets and liabilities denominated in foreign currencies are recognised
in the income statement, except when deferred in equity as qualifying cash flow
hedges or qualifying net investment hedges. The foreign exchange gains and
losses are recognised within “selling and administrative expenses” in the income
statement.
(c) Group companies
The results and financial position of all the Group entities (none of which has the
currency of a hyperinflationary economy) that have a functional currency different
from the presentation currency are translated into the presentation currency at the
year end closing rate for assets and liabilities and at average exchange rates for
the year for the income statement items. All resulting exchange differences are
recognised in other comprehensive income. On consolidation, exchange differences
arising from the translation of the net investment in foreign entities are taken to
other comprehensive income. When a foreign operation is partially disposed of or
sold, such exchange differences (that were recorded in equity) are transferred out
of the exchange reserve and are recognised in the income statement as part of
the gain or loss on disposal.

138Johnson Electric Holdings Limited
Annual Report 2016
34. PRINCIPAL ACCOUNTING POLICIES (Cont’d)
34.4 Foreign currency translation (Cont’d)
(d) Exchange rates
The following table summarises the exchange rates which are frequently used on
the consolidated financial statements.
Closing rate Average rate for the year
1 unit of foreign
currency to USD 2016 2015 2016 2015
Canadian Dollar CAD 0.77130 0.78900 0.73490 0.88150
Swiss Franc CHF 1.03620 1.03400 1.02920 1.07690
Euro EUR 1.13380 1.08330 1.10460 1.26960
British Pound GBP 1.43790 1.48100 1.50840 1.61370
Hong Kong Dollar HKD 0.12897 0.12895 0.12891 0.12897
Hungarian Forint HUF 0.00360 0.00362 0.00356 0.00411
Israeli Shekel ILS 0.26438 0.25176 0.25814 0.27207
Indian Rupee INR 0.01507 0.01597 0.01529 0.01636
Japanese Yen JPY 0.00889 0.00833 0.00833 0.00914
Mexican Peso MXN 0.05804 0.06552 0.06034 0.07309
Polish Zloty PLN 0.26540 0.26490 0.26160 0.30320
Chinese Renminbi RMB 0.15422 0.16286 0.15821 0.16143
Serbian Dinar RSD 0.00920 0.00900 0.00910 0.01090
34.5 Property, plant and equipment
Property, plant and equipment other than investment property (Note 34.6) and leasehold
land classified as finance lease are stated at cost less accumulated depreciation and
accumulated impairment losses. Freehold land is not amortised. No depreciation is
provided for assets under construction.
Subsequent costs are included in the asset’s carrying amount or recognised as a
separate asset, as appropriate, only when it is probable that future economic benefits
associated with the item will flow to the Group and the cost of the item can be measured
reliably.
The assets’ residual values and useful lives are reviewed, and adjusted if appropriate, at
the end of each reporting period. An asset’s carrying amount is written down immediately
to its estimated recoverable amount if this is lower.
Gains or losses arising from the disposal of property, plant and equipment are
determined as the difference between the net disposal proceeds and the carrying
amounts of those assets and are recognised within other income and gains, net in the
income statement.
The depreciation policy is set out in Note 3.

NOTES TO THE ACCOUNTS
139
34. PRINCIPAL ACCOUNTING POLICIES (Cont’d)
34.6 Investment property
Property that is held for long term rental yields or for capital appreciation or both, and
that is not occupied by the companies in the Group, is classified as investment property.
Investment property is measured initially at its cost, including related transaction costs.
After initial recognition, investment property is carried at fair value. Fair value is based on
active market prices, adjusted, if necessary, for any difference in the nature, location or
condition of the specific asset. These valuations are reviewed annually determined by
external appraisers. Changes in fair values are recognised in the income statement
within other income and gains, net.
Subsequent expenditure is charged to the asset’s carrying amount only when it is
probable that future economic benefits associated with the item will flow to the Group
and the cost of the item can be measured reliably.
If an item of property, plant and equipment becomes an investment property because its
use has changed, any difference resulting between the carrying amount and the fair value
of this item at the date of transfer is recognised in equity. Any balance of the decrease is
recognised as an expense in the income statement. If a fair value gain reverses a
previous impairment loss, the gain is recognised in the income statement.
34.7 Intangible assets
(a) Goodwill
Goodwill arising on the acquisition of subsidiaries and associates is initially
measured at cost and it represents the excess of the cost of acquisition over the
net fair value of the Group’s share of the net identifiable assets and the non-
controlling interest of the acquired subsidiary. Goodwill on acquisitions of
subsidiaries is included in intangible assets.
The policy for impairment tests of goodwill is set out in Note 5.
(b) Brands with an indefinite useful life
Brands that have an indefinite useful life are not subject to amortisation and are
tested annually for impairment.
The policy for impairment tests of brands with an indefinite useful life is set out in
Note 5.
(c) Land use rights
Up-front prepayments made for land use rights are expensed in the income
statement on a straight-line basis over the period of the lease, or, when there is
impairment, the impairment is expensed in the income statement.

140Johnson Electric Holdings Limited
Annual Report 2016
34. PRINCIPAL ACCOUNTING POLICIES (Cont’d)
34.7 Intangible assets (Cont’d)
(d) Research and development costs
Research and development costs are expensed as incurred and are only
recognised as an intangible asset where the technical feasibility and intention of
completing the product under development has been demonstrated and the
resources are available to do so, costs are identifiable, can be reliably measured
and there is an ability to sell or use the asset that will generate probable future
economic benefits. Research and development costs that do not meet the above
criteria are expensed as incurred.
(e) Other Intangible assets
Patents, technology, brands, client relationships that are acquired by the Group are
stated in the balance sheet at fair value at the date of acquisition less
accumulated amortisation and impairment losses.
The policy for amortisation of intangible assets is set out in Note 5.
34.8 Impairment of investments in subsidiaries, associate and non-financial assets
Assets that have an indefinite useful life (e.g. goodwill) and assets that are not subject
to amortisation and depreciation are tested annually for impairment. Assets are reviewed
for impairment whenever events or changes in circumstances indicate that the carrying
amount may not be recoverable. An impairment loss is recognised for the amount by
which the asset’s carrying amount exceeds its recoverable amount (the higher of an
asset’s fair value less costs to sell and the value in use). For the purpose of assessing
impairment, assets are grouped at the lowest levels for which there are separately
identifiable cash flows (cash-generating units). Non-financial assets other than goodwill
that suffered an impairment are reviewed for possible reversal of the impairment at each
reporting date.
Impairment testing of investments in subsidiaries or associate is required if the carrying
amount of the investment exceeds the carrying amount of the investee’s net assets
including goodwill.

NOTES TO THE ACCOUNTS
141
34. PRINCIPAL ACCOUNTING POLICIES (Cont’d)
34.9 Financial assets
The Group’s financial assets only comprise debt instruments, and it classifies its
financial assets (not part of a hedging relationship) in the following categories: those to
be measured at amortised cost, and those to be measured subsequently at fair value.
(a) Financial assets at amortised cost
A financial asset is classified as measured at ‘amortised cost’ only if both of the
following criteria are met: the objective is to hold the asset to collect the
contractual cash flows; and the contractual terms give rise on specified dates to
cash flows that are solely payments of principal and interest on the principal
outstanding. A gain or loss is recognised in profit and loss when the financial
asset is derecognised or impaired and through the amortisation process using the
effective interest rate method.
(b) Financial assets at fair value
If either of the two criteria above are not met, a financial asset is classified as
measured at ‘fair value through profit and loss’. The subsequent unrealised and
realised fair value changes are recognised in profit and loss.
At initial recognition, the Group measures a financial asset at its fair value plus, in
the case of a financial asset not at fair value through profit or loss, transaction
costs that are directly attributable to the acquisition of the financial assets.
Transaction costs of financial assets carried at fair value through profit or loss are
expensed in the income statement.
The financial asset is classified as a non-current asset when the remaining maturity of
the instrument is more than 12 months, and is classified as a current asset when the
remaining maturity of the instrument is less than 12 months.

142Johnson Electric Holdings Limited
Annual Report 2016
34. PRINCIPAL ACCOUNTING POLICIES (Cont’d)
34.10 Other financial assets and liabilities
(a) Other financial assets and liabilities related to hedging activities
Other financial assets and liabilities are forward and swap contracts related to
hedging activities.
Hedging instruments are initially recognised at fair value on the date a contract is
entered into and are subsequently remeasured at their fair value. The method of
recognising the resulting gain or loss depends on the nature of the item being
hedged:
• Hedges of a particular risk associated with a recognised asset or liability or
a highly probable forecast transaction (cash flow hedge); or
• Hedges of a net investment in a foreign operation (net investment hedge); or
• Hedges of the fair value of recognised assets or liabilities or a firm commitment
(fair value hedge).
The Group documents, at the inception of the transaction, the relationship between
hedging instruments and hedged items, as well as its risk management objectives
and strategy for undertaking various hedge transactions. The Group also
documents its assessment, both at hedge inception and on an ongoing basis, of
whether the hedging instruments that are used in hedging transactions are highly
effective in offsetting changes in fair values or cash flows of hedged items.
(i) Cash flow hedge
A cash flow hedge of the Group hedges a particular risk associated with a
highly probable forecast transaction. The effective portion of changes in the
fair value of financial instruments designated as cash flow hedges are
recognised in other comprehensive income. Amounts accumulated in equity
will be recognised in the income statement in the period or periods in which
the underlying hedged transaction occurred.
When a hedging instrument expires or is sold, or when a hedge no longer
meets the criteria for hedge accounting, any cumulative gain or loss existing
in equity at that time remains in equity and is recognised when the forecast
transaction is ultimately recognised in the income statement. When a
forecast transaction is no longer expected to occur, the cumulative gain or
loss that was reported in equity is immediately transferred to the income
statement within other income and gains, net.

NOTES TO THE ACCOUNTS
143
34. PRINCIPAL ACCOUNTING POLICIES (Cont’d)
34.10 Other financial assets and liabilities (Cont’d)
(a) Other financial assets and liabilities related to hedging activities (Cont’d)
(ii) Net investment hedge
A net investment hedge of the Group hedges net investments in foreign
operations. Any unrealised and realised gain or loss of the hedging
instrument is recognised in other comprehensive income within exchange
reserve.
Gains and losses accumulated in equity are recycled to income statement
when the foreign operation is partially disposed of or sold.
(iii) Fair value hedge
A fair value hedge of the Group hedges the EUR bank balance. Unrealised
and realised gain or loss of the hedging instrument is recognised in the
income statement to offset the loss or gain on the EUR bank balance
attributable to the risk being hedged.
(b) Financial instruments held for trading that do not qualify for hedge accounting
Financial instruments designated as held for trading do not qualify for hedge
accounting and are accounted for at fair value through profit and loss. Changes in
the fair value of these financial instruments are recognised immediately in the
income statement within other income and gains, net.
The fair values of various financial instruments used for hedging purposes are disclosed
in Note 7. Movements in the hedging reserve in shareholders’ equity are shown in Note
17. The full fair value of a hedging financial instrument is classified as a non-current
asset or liability when the remaining maturity of the hedge item is more than 12 months,
and is classified as a current asset or liability when the remaining maturing of the hedge
item is less than 12 months.
Hedge effectiveness is determined at the inception of the hedge relationship, and
through periodic prospective effectiveness assessments to ensure that an economic
relationship exists between the hedged item and hedging instrument.

144Johnson Electric Holdings Limited
Annual Report 2016
34. PRINCIPAL ACCOUNTING POLICIES (Cont’d)
34.11 Inventories
Inventories are stated at the lower of cost and net realisable value. Cost, calculated on a
first-in-first-out basis, comprises materials, direct labour and an appropriate proportion of
all production overhead expenditure. The value calculated approximates the weighted-
average actual cost. Net realisable value is the estimated selling price in the ordinary
course of business, less applicable variable selling expenses.
34.12 Trade and other receivables
Trade and other receivables are recognised initially at fair value and subsequently
measured at amortised cost using the effective interest method, less provision for
impairment. A provision for impairment of trade and other receivables is established
when there is objective evidence that the Group will not be able to collect all amounts
dues according to the original terms of receivables; that is, the difference between the
asset’s carrying amount and the present value of the estimated future cash flows,
discounted at the original effective interest rate. The impairment charge is recognised
within “selling and administrative expenses” in the income statement. When a trade
receivable is uncollectible, it is written off against the allowance account for trade
receivables. Subsequent recoveries are credited in the income statement.
34.13 Non-current assets held for sale
Non-current assets are classified as assets held for sale when their carrying amounts
are to be recovered principally through a sale transaction and a sale is considered highly
probable. They are stated at the lower of carrying amount and fair value less costs of
disposal.
34.14 Cash and deposits
Cash and deposits comprise cash on hand and demand deposits with banks that are
readily convertible into known amounts of cash and which are subject to an insignificant
risk of change in value, and with original maturities of three months or less.
34.15 Trade, other payables and deferred income
Trade and other payables are recognised initially at fair value and subsequently measured
at amortised cost using the effective interest method. Trade and other payables with
obligations to pay within 12 months are classified as current liabilities. Trade and other
payables with obligations to pay for at least 12 months after the end of reporting period
are classified as non-current liabilities.
The contribution received from the customer is recorded as deferred income in the
balance sheet and then recognised as income on a straight-line basis over the terms of
the agreement with the customer. Amount being released to income statement for the 12
months after the end of reporting period is classified as current liabilities. Amount being
released to income statement over 12 months after the end of reporting period is
classified as non-current liabilities.

NOTES TO THE ACCOUNTS
145
34. PRINCIPAL ACCOUNTING POLICIES (Cont’d)
34.16 Borrowings
Borrowings are initially recognised at fair value, net of transaction costs incurred and are
subsequently stated at amortised cost. Any difference between the proceeds (net of
transaction costs) and the redemption value is recognised in the income statement over
the period of the borrowings using the effective interest method.
Borrowings are classified as current liabilities unless the Group has an unconditional
right to defer settlement of the liability for at least twelve months after the end of
reporting period.
34.17 Convertible bonds
Convertible bonds are accounted for as the aggregate of (i) a liability component and (ii)
an equity component.
At initial recognition, the fair value of the liability component of the convertible bonds is
determined using a market interest rate for an equivalent non-convertible bond. The
remainder of the proceeds is allocated to the conversion option as an equity component,
recognised in shareholder’s equity in other reserve.
The liability component is subsequently carried at amortised cost, calculated using the
effective interest method, until extinguished on conversion or maturity.
34.18 Current and deferred income tax
The tax expense for the period comprises current and deferred tax. Tax is recognised in
the income statement, except to the extent that it relates to items recognised in
comprehensive income or directly in equity. In this case, the tax is also recognised in
comprehensive income or directly in equity.
The current income tax charge is calculated on the basis of the tax laws enacted or
substantively enacted at the balance sheet date in the countries where JEHL’s
subsidiaries and associate operate and generate taxable income. Management
periodically evaluates positions taken in tax returns with respect to situations in which
applicable tax regulation is subject to interpretation and establishes accruals where
appropriate on the basis of amounts expected to be paid to the tax authorities.
Deferred income tax is recognised, using the liability method, on temporary differences
arising between the tax bases of assets and liabilities and their carrying amounts in the
consolidated financial statements. However, the deferred income tax is not accounted for
if it arises from the initial recognition of an asset or liability in a transaction other than a
business combination that at the time of the transaction affects neither accounting nor
taxable profit and loss at the time of such a transaction. Deferred income tax is
determined using tax rates enacted or substantively enacted by the balance sheet date
or expected to be applied in future.

146Johnson Electric Holdings Limited
Annual Report 2016
34. PRINCIPAL ACCOUNTING POLICIES (Cont’d)
34.18 Current and deferred income tax (Cont’d)
Deferred income tax assets are recognised only to the extent that it is probable that
future taxable profit will be available against which the temporary differences can be
utilised.
Deferred income tax liability is recognised in respect of the undistributed profits of
subsidiaries which is expected to be distributed in the foreseeable future.
The policy for offsetting deferred income tax assets and liabilities is set out in Note 15.
34.19 Share capital
Ordinary shares are classified as equity. Incremental costs directly attributable to the
issue of new shares or options are shown in equity as a deduction, net of tax, from the
proceeds.
Where any Group company purchases JEHL’s equity share capital, the consideration paid,
including any directly attributable incremental costs (net of income taxes), is deducted
from equity until the shares are vested, cancelled or reissued. Where such shares are
subsequently sold or reissued, any consideration received (net of any directly attributable
incremental transaction costs and the related income tax effects) is included in equity
attributable to JEHL’s shareholders.
34.20 Employee compensation
(a) Pension obligations
Group companies operate various pension schemes. The schemes are generally
funded through payments to insurance companies or trustee-administered funds,
determined by periodic actuarial calculations. The Group has both defined
contribution and defined benefit plans.
(i) Defined contribution plan
For defined contribution plans, the Group and the employees pay fixed
contributions to publicly or privately administered pension insurance plans
on a mandatory, contractual or voluntary basis. The Group has no further
payment obligations once the contributions have been paid. Contributions
are recognised as employee compensation when they are due and are
reduced by contributions forfeited by those employees who leave the
scheme prior to vesting fully in the contributions.
(ii) Defined benefit plan
Defined benefit plans define an amount of pension benefit that an employee
will receive on retirement, usually dependent on one or more factors such as
age, years of service and compensation.

NOTES TO THE ACCOUNTS
147
34. PRINCIPAL ACCOUNTING POLICIES (Cont’d)
34.20 Employee compensation (Cont’d)
(a) Pension obligations (Cont’d)
(ii) Defined benefit plan (Cont’d)
The liability recognised in the balance sheet in respect of defined benefit
pension plans is the present value of the defined benefit obligation at the
end of the reporting period less the fair value of plan assets. The defined
benefit obligation is calculated annually by independent actuaries using the
projected unit credit method by discounting the estimated future cash
outflows using interest rates of high-quality corporate bonds that are
denominated in the currency in which the benefits will be paid and that have
terms to maturity approximating to the terms of the related pension liability.
Actuarial gains and losses arising from experience adjustments and changes
in actuarial assumptions are charged or credited to equity in other
comprehensive income in the period in which they arise.
Past-service costs are recognised immediately in the income statement.
(b) Share-based compensation
The Group operates a number of share-based compensation plans, settled by equity
or cash, under which the entity receives services from employees as consideration
for equity instruments of the Group. The fair value of such employee services is
recognised as an expense. The total amount to be expensed is determined by
reference to the fair value of the shares granted.
For share-based compensation settled by equity or cash, shares granted to eligible
employees for their services are charged as an expense based on the share price at
the grant date.
Non-market vesting conditions are included in assumptions about the number of
shares expected to vest. The total expense is recognised over the vesting period,
which is the period over which all of the specified vesting conditions are to be
satisfied. At the end of each reporting period, the entity revises its estimates of the
number of shares that are expected to vest. Any impact of the revision to original
estimates are recognised in the income statement, with a corresponding adjustment
to equity.
(c) Profit sharing and bonus plans
The Group recognise charges for profit sharing and bonus plans due wholly within
twelve months after balance sheet date when it has a legal or constructive
obligation as a result of services rendered by employees and a reliable estimate of
the obligation can be made.

148Johnson Electric Holdings Limited
Annual Report 2016
34. PRINCIPAL ACCOUNTING POLICIES (Cont’d)
34.21 Judgmental accruals, valuation allowances and provision obligations
Judgmental accruals, valuation allowances and provision obligations are recognised when
the company has a present legal or constructive obligation as a result of past events, it
is probable that an outflow of resources will be required to settle the obligation, and a
reliable estimate of the amount can be made.
34.22 Government grants
Grants from the government are recognised at their fair value where there is a reasonable
assurance that the grant will be received and the Group will comply with all attached
conditions.
Government grants relating to future operating costs are recognised in the income
statement over the period necessary to match them with the costs that they are intended
to compensate. Government grants that are receivable as compensation for expenses or
losses already incurred or for the purpose of giving immediate financial support to the
Group with no future related costs are recognised in income statement in the period in
which they become receivable.
Government grants relating to assets are included in liabilities as deferred government
grants and are credited to the income statement on a straight–line basis over the
expected lives of the related assets.
34.23 Revenue recognition
Revenue is shown net of valued-added tax, returns, rebates and discounts and after
eliminating sales within the Group.
(a) Sales of goods
Revenue from the sales of goods is recognised on the transfer of risks and
rewards of ownership, which generally coincides with the time when the goods are
delivered to the customer and title has passed.
(b) Interest income
Interest income is recognised when it is earned on a time-proportion basis using
the effective interest method.
(c) Rental income
Rental income is recognised on a straight-line basis over the period of the lease.

NOTES TO THE ACCOUNTS
149
34. PRINCIPAL ACCOUNTING POLICIES (Cont’d)
34.24 Leases
HKAS 17 defines a lease as being an agreement whereby the lessor conveys to the
lessee in return for a payment, or series of payments, the right to use an asset for an
agreed period of time.
(a) Finance leases as the lessee
The Group leases certain property, plant and equipment. Leases of property, plant
and equipment where the Group has substantially all the risks and rewards of
ownership are classified as finance leases. Finance leases are capitalised at the
lease’s commencement at the lower of the fair value of the leased property and
the present value of the minimum lease payments.
Each lease payment is allocated between interest charged to the financial
statement and reduction of liabilities based on the interest rate implied in the
lease contracts. The corresponding rental obligations, net of finance charges, are
included in other short term and other long term payables. The property, plant and
equipment acquired under finance leases is depreciated over the shorter of the
useful life of the asset and the lease term.
(b) Operating leases as the lessee
Leases where substantially all the risks and rewards of ownership of assets
remain with the leasing company are accounted for as operating leases. Payments
made under operating leases, net of any incentives from the leasing company, are
recognised in the income statement on a straight-line basis over the lease term.
34.25 Dividend distribution
Dividend distribution to JEHL’s shareholders is recognised as a liability in the Group’s and
JEHL’s financial statements in the period in which the dividends are approved by JEHL’s
shareholders or directors, where appropriate.
34.26 Contingent liabilities
A contingent liability is a possible obligation that arises from past events and whose
existence will only be confirmed by the occurrence or non-occurrence of one or more
uncertain future events not wholly within the control of the company. It can also be a
present obligation arising from past events that is not recognised because it is not
probable that outflow of economic resources will be required or the amount of obligation
cannot be measured reliably. A contingent liability is not recognised but is disclosed in
the notes to the accounts. When a change in the probability of an outflow occurs so that
the outflow is probable (more likely than not), it will then be recognised as a liability on
the balance sheet.

150Johnson Electric Holdings Limited
Annual Report 2016
34. PRINCIPAL ACCOUNTING POLICIES (Cont’d)
34.27 Financial guarantee contracts
A financial guarantee is a contract that requires the issuer to make specified payments
to reimburse the holder for a loss it incurs because a specified customer fails to make
payments when due in accordance with the original or modified terms of a debt
instrument. The Group does not recognise liabilities for financial guarantees at inception,
but performs a liability adequacy test at each reporting date by comparing its carrying
amount of the net liability regarding the financial guarantee with its present legal or
constructive obligation amount. If the carrying amount of the net liability is less than its
present legal or constructive obligation amount, the entire difference is recognised in the
income statement immediately.
35. ACCOUNTING ESTIMATES AND JUDGEMENTS
Estimates and judgements are continually evaluated and are made based on historical
experience and other factors, including expectations of future events that are believed to be
reasonable under the circumstances.
The Group makes estimates and assumptions concerning the future. The resulting accounting
estimates will, by definition, seldom equal the related actual results. The estimates and
assumptions that have a risk of causing a material adjustment to the carrying amounts of
assets and liabilities with the next financial year are addressed below.
(a) Assessment of goodwill impairment and brands with an indefinite useful life
The Group tests annually whether goodwill and brands with an indefinite useful life have
suffered any impairment and when there is indication that they may be impaired, in
accordance with the accounting policy stated in Note 5. In respect of brands with an
indefinite useful life, the recoverable amounts are the higher of the fair value less cost of
sales or value-in-use. For goodwill, the recoverable amounts of cash-generating units have
been determined based on value-in-use calculations. These calculations require the use
of estimates (Note 5).
(b) Income taxes and deferred tax assets
The Group is subject to income taxes in numerous jurisdictions. Significant judgement is
required in determining the worldwide provision for income taxes. There are many
transactions and calculations for which the ultimate tax determination is uncertain. The
Group recognises liabilities for anticipated tax audit issues when management assesses
that it is probable such issues will impact the current and deferred income tax assets
and liabilities.

NOTES TO THE ACCOUNTS
151
35. ACCOUNTING ESTIMATES AND JUDGEMENTS (Cont’d)
(b) Income taxes and deferred tax assets (Cont’d)
Deferred tax assets are recognised, particularly in respect of the tax losses, to the extent
that it is probable that future taxable profit or taxable temporary differences will be
available against which the deferred tax assets can be utilised. It involves significant
judgement when determining probable future taxable profits and temporary differences
for the realisation of the deferred tax assets.
(c) Warranty and claims
The Group generally offers warranties for its motors and other products. Provisions for
estimated expenses related to product warranty are made at the time products are sold.
These estimates are established using historical information about the nature, frequency
and average cost of warranty claim settlements as well as product manufacturing and
industry developments and recoveries from third parties. On specific claims brought
against the Group by customers, a provision is made based on the consideration of the
merits of a warranty claim against the Group, the existence of any obligation under the
warranty commitment and legal advice if appropriate. These warranty and claims typically
arise in the normal course of business and may include, but not be limited to,
commercial or contractual disputes with our customers and suppliers, intellectual
property matters, personal injury, product liability, environmental and employment claims.
(d) Useful lives and impairment assessments of property, plant and equipment and other
intangible assets
The Group’s management determine the estimated useful lives, residual values and
related depreciation and amortisation charges for property, plant and equipment and
other intangible assets by reference to the estimated periods that the Group intends to
derive future economic benefits from the use of these assets. Management will revise
the depreciation and amortisation charges where useful lives are different to those
previously estimated, or it will write-off or write-down technically obsolete or non-strategic
assets that have been abandoned or sold. Actual economic lives may differ from
estimated useful lives and actual residual values may differ from estimated residual
values. Periodic reviews could result in a change in depreciable lives and residual values
and therefore depreciation and amortisation expense in the future periods.
The Group reviews tangible and intangible assets for impairment whenever events or
changes in circumstances indicate that the related carrying amounts may not be
recovered. Assessing the impairment loss requires a determination of fair value which is
based on the best estimates and information available.

152Johnson Electric Holdings Limited
Annual Report 2016
35. ACCOUNTING ESTIMATES AND JUDGEMENTS (Cont’d)
(e) Fair value of other financial assets/liabilities
The fair value of other financial assets/liabilities is determined using various valuation
techniques such as discounted cash flow analysis. Copper, silver and aluminium prices
and foreign currency exchange price are the key inputs in the valuation.
(f) Fair value of investment property
The Group’s investment property is revalued at the balance sheet date on the open
market value basis by independent professional valuers. Such valuations are based on
certain assumptions, which are subject to uncertainty and might materially differ from the
actual results. In making the judgement on whether such valuations and assumptions
made by the valuers are reasonable, the Group considers information from comparable
current prices in an active market for similar property, capitalisation rates, terminal yield,
rental income from current leases and assumptions about rental from future leases and
the reversionary income potential and uses assumptions that are mainly based on
market conditions existing at each balance sheet date. The main assumptions have been
disclosed in Note 32.
(g) Business combination
The recognition of business combination requires the excess of the purchase price of
acquisitions over the net book value of assets acquired to be allocated to the assets
and liabilities of the acquired entity. The Group makes judgements and estimates in
relation to the fair value allocation of the purchase price. If any unallocated portion is
positive it is recognised as goodwill and if negative, it is recognised in the income
statement.
36. EFFECT OF ADOPTING NEW, REVISED AND AMENDED HKFRS
Standards, interpretations and amendments to published standards effective in FY2015/16
which are relevant to the Group
In FY2015/16, the Group adopted the following revised and amended standards of HKFRS below,
which are relevant to its operations and have an impact on the consolidated financial statements:
Annual improvement 2012 Annual improvements 2010-2012 reporting cycle
Annual improvement 2013 Annual improvements 2011-2013 reporting cycle
The adoption of such revised and amended standards did not have material impact on the
consolidated financial statements.

NOTES TO THE ACCOUNTS
153
36. EFFECT OF ADOPTING NEW, REVISED AND AMENDED HKFRS (Cont’d)
Standards and amendments to published standards that are not effective in FY2015/16
Certain new standards and amendments to existing standards have been published that are
mandatory for the Group’s accounting periods beginning on or after 1 April 2016 or later periods,
which the Group has not early adopted, are as follows:
HKAS 1 (amendment) Presentation of financial statement – Disclosure
initiative 1
HKAS 16 (amendment) and HKAS
38 (amendment)
Clarification of acceptable methods of depreciation and
amortisation 1
HKAS 16 (amendment) and HKAS
41 (amendment)
Agriculture: Bearer plants 1
HKAS 27 (amendment) Separate financial statements – Equity method in
separate financial statements 1
HKFRS 9 Financial instruments 3
HKFRS 10 (amendment) and HKAS
28 (amendment)
Sale or contribution of assets between an investor and
its associate or joint venture 4
HKFRS 10 (amendment) , HKFRS
12 (amendment) and HKAS 28
(amendment)
Investment entities: applying the consolidation
exception 1
HKFRS 11 (amendment) Accounting for acquisitions of interests in joint
operations 1
HKFRS 14 Regulatory deferral accounts 1
HKFRS 15 Revenue from contracts with customer 2
Annual improvements 2014 Annual improvements 2011-2014 reporting cycle 1
Note:(1) Effective for annual periods beginning on or after 1 January 2016(2) Effective for annual periods beginning on or after 1 January 2018(3) Effective for annual periods beginning on or after 1 January 2018, except for the 2010 version of HKFRS 9 and the new
requirements for hedge accounting issued in 2013, which the Group early adopted(4) To be determined
The Group is in the process of making an assessment of the impact of these amendments to
existing standards, new standards and new interpretations in the period of initial application. In
addition to the above, there are a number of minor amendments to HKAS/HKFRS under the
annual improvement project of HKICPA. These amendments are not likely to have a significant
impact on the Group’s financial statements and are not analysed in detail.

154Johnson Electric Holdings Limited
Annual Report 2016
37. JEHL COMPANY BALANCE SHEET
37.1 JEHL company balance sheet
2016
US$’000
2015
US$’000
Assets
Non-current assets
Interest in subsidiaries 1,477,635 996,397
Other financial assets 23,500 39,932
1,501,135 1,036,329
Current assets
Amounts due from subsidiaries 492,108 799,222
Other financial assets 7,825 10,349
Other receivables 809 345
Cash and deposits 43,188 37
543,930 809,953
Current liabilities
Amounts due to subsidiaries 1 1
Other payables 1,470 1,152
1,471 1,153
Non-current liabilities
Other financial liabilities 2,203 –
Borrowings 74,174 –
Convertible bonds 202,387 197,345
Deferred income tax liabilities 2,411 3,154
281,175 200,499
NET ASSETS 1,762,419 1,644,630
Equity
Share capital – Ordinary shares (at par value) 5,670 5,681
Shares held for incentive share schemes
(at purchase cost) (75,450) (61,082)
Reserves 1,832,199 1,700,031
TOTAL EQUITY 1,762,419 1,644,630
JEHL’s company balance sheet was approved by the Board of Directors on 17 May 2016
and was signed on this behalf.
Patrick Shui-Chung Wang JP Winnie Wing-Yee Wang
Director Director

NOTES TO THE ACCOUNTS
155
37. JEHL COMPANY BALANCE SHEET (Cont’d)
37.2 JEHL reserve
The reserve movements of JEHL for FY2015/16 and FY2014/15 are set below:
Contributedsurplus
US$’000
Share-basedemployee
compensationreserve
US$’000
Hedgingreserve
US$’000
Otherreserve
US$’000
RetainedearningsUS$’000
TotalUS$’000
As of 31 March 2014 95,273 10,470 (7,656) – 1,489,601 1,587,688
Hedging instruments
– net investment hedge
fair value gains, net – – 61,693 – – 61,693
Convertible bonds
– equity component of
convertible bonds
issued – – – 4,823 – 4,823
– deferred income tax
effect – – – (3,868) – (3,868)
Cancellation of issued
capital (30,926) – – – – (30,926)
Incentive share schemes
– shares vested – (3,889) – – – (3,889)
– value of employee
services – 7,413 – – – 7,413
Share options
– options lapsed – (68) – – 68 –
Profit for the year – – – – 131,384 131,384
FY2013/14 final dividend
paid – – – – (38,765) (38,765)
FY2014/15 interim
dividend paid – – – – (15,522) (15,522)
As of 31 March 2015 64,347 13,926 54,037 955 1,566,766 1,700,031
Final dividend proposed – – – – 37,768 37,768
Other 64,347 13,926 54,037 955 1,528,998 1,662,263
As of 31 March 2015 64,347 13,926 54,037 955 1,566,766 1,700,031
Hedging instruments
– net investment hedge
fair value losses, net – – (28,976) – – (28,976)
Cancellation of issued
capital (5,224) – – – – (5,224)
Incentive share schemes
– shares vested – (7,646) – – – (7,646)
– value of employee
services – 9,734 – – – 9,734
Profit for the year – – – – 218,674 218,674
FY2014/15 final dividend
paid – – – – (37,802) (37,802)
FY2015/16 interim
dividend paid – – – – (16,592) (16,592)
As of 31 March 2016 59,123 16,014 25,061 955 1,731,046 1,832,199
Final dividend proposed – – – – 37,525 37,525
Other 59,123 16,014 25,061 955 1,693,521 1,794,674
As of 31 March 2016 59,123 16,014 25,061 955 1,731,046 1,832,199

156Johnson Electric Holdings Limited
Annual Report 2016
38. PRINCIPAL SUBSIDIARIES AND ASSOCIATES
The following list contains particulars of subsidiaries and associates of the Group that in the
opinion of the directors, materially affect the results and assets of the Group:
Name Principal activities
Place of
incorporation/
establishment
and operation
Issued and
paid up capital
Effective
shareholding
by
JEHL
by
subsidiary
Subsidiaries
Changchun Ri Yong
JEA Gate Electric
Co., Ltd. #
Manufacturing,
sales and marketing
China RMB10,000,000 – 60%
Chengdu Ri Yong JEA Gate
Electric Co Ltd #
Manufacturing,
sales and marketing
China RMB20,000,000 – 60%
Easy Fortune (H.K.) Ltd. Property investment British Virgin
Islands
US$50,000 – 100%
Gate do Brasil Ltda. Manufacturing,
sales and marketing
Brazil BRL81,187,617.78 – 100%
Gate France SAS Manufacturing,
sales and marketing
France EUR382,000 – 100%
Harbour Sky (BVI) Ltd. Property investment British Virgin
Islands
US$50,000 – 100%
Hwa Sun (Guangdong)
Co Ltd *
Manufacturing,
sales and marketing
China US$15,200,000 – 100%
Johnson Electric
Asia Pacific Limited
Provision of service Hong Kong HK$2 – 100%
Johnson Electric
Asti S.r.l.
Manufacturing, sales
and marketing,
R&D, licensing
Italy EUR2,600,000 – 100%
Johnson Electric
(Beihai) Co Ltd *
Manufacturing,
sales and marketing
China US$12,000,000 – 100%
* Wholly foreign owned enterprises# Equity joint ventures

NOTES TO THE ACCOUNTS
157
38. PRINCIPAL SUBSIDIARIES AND ASSOCIATES (Cont’d)
Name Principal activities
Place of
incorporation/
establishment
and operation
Issued and
paid up capital
Effective
shareholding
by
JEHL
by
subsidiary
Subsidiaries
Johnson Electric
Birmingham Limited
Manufacturing United Kingdom GBP1 – 100%
Johnson Electric Doo
Niš
Manufacturing Serbia RSD1,371,076,608.42 – 100%
Johnson Electric
Germany GmbH &
Co. KG
Manufacturing, sales
and marketing,
R&D, licensing
Germany EUR15,338,800 – 100%
Johnson Electric
Group Mexico,
S. de R.L. de C.V.
Manufacturing Mexico MXN6,000 – 100%
Johnson Electric
(Guangdong) Co., Ltd. *
Manufacturing, sales
and marketing, R&D
China US$4,250,000 – 100%
Johnson Electric
Hungary Kft
Manufacturing, R&D,
provision of service
Hungary EUR160,130 – 100%
Johnson Electric
Industrial Manufactory,
Limited
Manufacturing, sales
and marketing
Hong Kong HK$3,010,609,091 100% –
Johnson Electric
International AG
Sales and marketing,
R&D, provision of
service, licensing
Switzerland CHF12,002,112 – 100%
Johnson Electric
International France
S.a.r.l.
Sales and marketing France EUR10,000 – 100%
Johnson Electric
International (IT) S.r.l.
Sales and marketing Italy EUR3,700,000 – 100%
* Wholly foreign owned enterprises# Equity joint ventures

158Johnson Electric Holdings Limited
Annual Report 2016
38. PRINCIPAL SUBSIDIARIES AND ASSOCIATES (Cont’d)
Name Principal activities
Place of
incorporation/
establishment
and operation
Issued and
paid up capital
Effective
shareholding
by
JEHL
by
subsidiary
Subsidiaries
Johnson Electric
International Limited
Provision of service,
investment holding
Hong Kong HK$80,000,000 – 100%
Johnson Electric
International (UK)
Limited
Licensing, sales and
marketing, R&D
United Kingdom GBP420,107,059 – 100%
Johnson Electric
Nanjing Co., Ltd. *
Manufacturing, sales
and marketing, R&D
China US$6,100,000 – 100%
Johnson Electric North
America, Inc.
Sales and marketing United States
of America
US$120,000 – 100%
Johnson Electric
Poland Sp.z o.o.
Manufacturing Poland PLN41,651,000 – 100%
Johnson Electric
Private Limited
Manufacturing, sales
and marketing
India INR1,044,096,500 – 100%
Johnson Electric
Services Italia S.r.l.
Provision of service Italy EUR10,000 – 100%
Johnson Electric
(Shanghai) Company
Limited *
Sales and marketing China US$200,000 – 100%
Johnson Electric
(Shenzhen) Co., Ltd. *
R&D China HK$30,000,000 – 100%
Johnson Electric
Switzerland AG
Manufacturing,
R&D
Switzerland CHF5,000,000 – 100%
Johnson Electric
Technology Service
(Shenzhen) Co Ltd *
Provision of service China USD130,000 – 100%
* Wholly foreign owned enterprises# Equity joint ventures

NOTES TO THE ACCOUNTS
159
38. PRINCIPAL SUBSIDIARIES AND ASSOCIATES (Cont’d)
Name Principal activities
Place of
incorporation/
establishment
and operation
Issued and
paid up capital
Effective
shareholding
by
JEHL
by
subsidiary
Subsidiaries
Johnson Electric
Trading Mexico,
S. de R.L. de C.V.
Sales and marketing Mexico MXN3,000 – 100%
Johnson Electric World
Trade Limited
Provision of service,
sales and marketing
Hong Kong HK$100,000 100% –
Johnson Medtech
(HK) Limited
Manufacturing, sales
and marketing, R&D
Hong Kong HK$1 – 100%
Johnson Medtech
LLC
Sales and marketing,
R&D
United States
of America
US$1,000,000 – 100%
Johnson Medtech
(Shenzhen) Co Ltd
Manufacturing,
sales and marketing
China US$2,100,000 – 100%
M.M.A. (Manufactura
de Motores
Argentinos) S.r.l.
Manufacturing,
sales and marketing
Argentina ARS3,880,000 – 100%
Nanomotion Ltd. Manufacturing, sales
and marketing, R&D
Israel US$737,877.75 – 100%
Parlex Pacific Limited Manufacturing, sales and
marketing, R&D
Hong Kong HK$10,000 – 100%
Parlex (Shanghai) Electronics
Co., Ltd. *
Manufacturing, sales
and marketing, R&D
China US$15,000,000 – 100%
Parlex USA LLC Manufacturing, sales
and marketing, R&D
United States
of America
US$88,319,640 – 100%
Saia-Burgess
Automotive
Actuators LLC
Manufacturing, sales
and marketing, R&D
United States
of America
US$8,000,000 – 100%
* Wholly foreign owned enterprises# Equity joint ventures

160Johnson Electric Holdings Limited
Annual Report 2016
38. PRINCIPAL SUBSIDIARIES AND ASSOCIATES (Cont’d)
Name Principal activities
Place of
incorporation/
establishment
and operation
Issued and
paid up capital
Effective
shareholding
by
JEHL
by
subsidiary
Subsidiaries
Saia-Burgess Benelux B.V. Sales and marketing Netherlands EUR135,000 – 100%
Saia-Burgess (China)
Ltd *
Manufacturing,
sales and marketing
China US$6,500,000 – 100%
Saia-Burgess LLC Manufacturing,
sales and marketing, R&D
United States
of America
US$12,600,126 – 100%
Shanghai Malu Ri Yong
JEA Gate Electric
Co Ltd #
Manufacturing, sales
and marketing, R&D
China RMB85,000,000 – 60%
Stackpole Automotive
Engineered Products
(Changzhou) Co Ltd *
Manufacturing,
sales and marketing
China US$15,000,000 – 100%
Stackpole International
Engineered
Products, Ltd.
Manufacturing, sales
and marketing, R&D
Canada CAD129,963,738 – 100%
Stackpole International
Global Holding,
Co., SA
Investment holding Luxembourg CAD8,401,525 – 100%
Stackpole International
Powder Metal, Ltd.
Manufacturing, sales and
marketing, R&D,
licensing
Canada CAD185,982,801 – 100%
Stackpole Powertrain
International GmbH
Sales and marketing,
R&D
Germany EUR25,000 – 100%
V Motor (China) Ltd * Manufacturing,
sales and marketing
China US$6,000,000 – 100%
* Wholly foreign owned enterprises# Equity joint ventures

NOTES TO THE ACCOUNTS
161
38. PRINCIPAL SUBSIDIARIES AND ASSOCIATES (Cont’d)
Name Principal activities
Place of
incorporation/
establishment
and operation
Issued and
paid up capital
Effective
shareholding
by
JEHL
by
subsidiary
Associates
Halla Stackpole Beijing
Automotive Co Ltd #
Manufacturing China US$14,000,000 – 30%
Halla Stackpole
Corporation
Manufacturing, sales and
marketing, R&D,
licensing
Korea KRW100,000,000 – 30%
Shenzhen SMART
Micromotor Co Ltd #
Manufacturing, sales
and marketing
China US$2,100,000 – 49%
* Wholly foreign owned enterprises# Equity joint ventures

162Johnson Electric Holdings Limited
Annual Report 2016
JOHNSON ELECTRIC GROUP TEN-YEAR SUMMARY
US$ million 2016 2015 2014 Consolidated income statement
Sales 2,235.9 2,136.1 2,097.6Earnings before interest and tax (EBIT) 1 209.8 243.5 233.9Profit before income tax 206.6 249.0 243.0Income tax (expense) / income (23.9) (29.2) (28.1)Discontinued operations – – –Profit for the year 182.7 219.8 214.9Non-controlling interests (10.0) (8.9) (7.0)Profit attributable to shareholders 172.7 210.9 207.9
Consolidated balance sheet
Fixed assets 759.0 492.6 460.6Goodwill and intangible assets 1,083.4 595.6 650.7Cash and deposits 193.3 773.2 644.0Other current and non-current assets 1,113.7 986.6 745.4
Total assets 3,149.4 2,848.0 2,500.7
Equity attributable to shareholders 1,842.6 1,862.3 1,732.3Non-controlling interests 42.2 38.6 34.0
Total equity 1,884.8 1,900.9 1,766.3Total debt 2 422.5 291.3 116.9Other current and non-current liabilities 842.1 655.8 617.5
Total equity and liabilities 3,149.4 2,848.0 2,500.7
Per share data 3
Basic earnings per share – continuing operations (US cents) 20.1 24.1 23.4Dividend per share (US cents) 6.3 6.2 5.9Closing stock price (HKD) 24.0 27.3 28.7
Other information
Free cash flow from operations 4 70.8 155.8 231.1Earnings before interest, tax, depreciation and amortisation (EBITDA) 321.9 335.5 321.8EBITDA to sales % 14.4% 15.7% 15.3%Capital expenditure (CAPEX) 186.2 119.9 92.2CAPEX to sales % 8.3% 5.6% 4.4%Market Capitalisation 2,643.3 3,032.5 3,282.2Enterprise Value (EV) 2,914.7 2,589.3 2,789.1EV / EBITDA 5 7.9 7.7 8.7
Ratios
EBIT to sales % 9.4% 11.4% 11.2%Return on average total equity % 6 9.7% 12.0% 12.8%Free cash flow from operations to debt % 17% 53% 198%Total debt to EBITDA (times) 5 1.1 0.9 0.4Total debt to capital % 18% 13% 6%Interest coverage (times) 7 22.3 28.8 127.8
1 Earnings before interest and tax (EBIT) is defined as operating profit (per accounts) plus share of profits / (losses) of associate
2 Total debt calculated as borrowings plus convertible bonds
3 Per share data had been adjusted to reflect the impact of 1 for 4 share consolidation on 15 July 2014
4 Net cash generated from operating activities plus interest received, less capital expenditure (net of proceeds from disposal of assets) and
capitalisation of engineering development costs
5 EV / EBITDA and Total debt to EBITDA is calculated using EBITDA adjusted to include 12 months of Stackpole on a pro forma basis for
FY2015/16, and excluding non-recurring items for FY2011/12
6 Return on average total equity is calculated as profit for the year over average total equity during the year
7 Interest coverage (times) is calculated by EBIT / interest expense

JOHNSON ELECTRIC GROUP TEN-YEAR SUMMARY
163
2013 2012 2011 2010* 2009 2008 2007
2,059.7 2,140.8 2,104.0 1,741.0 1,828.2 2,220.8 2,086.6213.2 221.6 235.8 110.5 47.0 188.9 157.5218.0 220.5 226.4 103.8 37.4 170.1 135.9(21.1) (31.6) (36.1) (16.4) 0.4 (31.9) (22.9)
– – – – (31.1) – –196.9 188.9 190.3 87.4 6.7 138.2 113.0
(5.6) (2.2) (8.6) (10.4) (4.1) (7.4) (3.3)191.3 186.7 181.7 77.0 2.6 130.8 109.7
425.6 433.1 457.5 440.6 428.3 471.3 439.0621.5 757.8 774.7 699.9 662.1 775.2 667.2480.9 385.1 354.7 367.1 302.0 268.0 149.3715.9 704.0 755.5 623.2 557.5 840.2 764.8
2,243.9 2,280.0 2,342.4 2,130.8 1,949.9 2,354.7 2,020.3
1,568.5 1,461.6 1,362.2 1,121.7 964.4 1,101.9 940.730.3 25.9 60.1 51.5 33.7 31.0 22.7
1,598.8 1,487.5 1,422.3 1,173.2 998.1 1,132.9 963.4125.0 205.4 313.7 408.7 528.9 564.5 573.5520.1 587.1 606.4 548.9 422.9 657.3 483.4
2,243.9 2,280.0 2,342.4 2,130.8 1,949.9 2,354.7 2,020.3
21.4 20.7 19.9 8.4 3.7 14.3 12.05.6 5.1 4.6 2.6 – 7.3 6.7
23.1 19.3 18.2 20.6 6.0 14.7 20.8
111.9 166.0 169.6 215.1 168.5 186.7 106.8304.3 314.3 322.5 197.9 136.2 279.5 246.014.8% 14.7% 15.3% 11.4% 7.4% 12.6% 11.8%
82.6 91.3 85.6 38.0 62.8 97.1 76.14.0% 4.3% 4.1% 2.2% 3.4% 4.4% 3.6%
2,646.2 2,229.5 2,134.4 2,426.3 704.3 1,732.3 2,439.22,320.5 2,075.6 2,153.4 2,519.4 964.9 2,059.8 2,886.1
7.6 6.3 6.7 12.7 7.1 7.4 11.7
10.4% 10.4% 11.2% 6.3% 2.6% 8.5% 7.5%12.8% 13.0% 14.7% 8.1% 0.6% 13.2% 12.4%
90% 81% 54% 53% 32% 33% 19%0.4 0.7 1.0 2.1 3.9 2.0 2.37% 12% 18% 26% 35% 33% 37%
79.0 32.1 18.2 12.4 3.0 7.2 5.5
* Historical data for FY2009/10 had been restated for the adoption of HKAS 12 (amendment) – deferred tax related to investment properties.
Historical data for FY2006/07 to FY2008/09 had not been restated in this summary.

164Johnson Electric Holdings Limited
Annual Report 2016
PROFILE OF DIRECTORS ANDSENIOR MANAGEMENT
DIRECTORS
Yik-Chun Koo Wang
Non-Executive Director
Honorary Chairman
Yik-Chun Koo Wang, age 98, is the Honorary Chairman of the Company and co-founder of the Group.
She was the Vice-Chairman of the Group from 1984 to 1996 and was actively involved in the
development of the Group in its early stages. Madam Wang is also the Honorary Chairlady of Tristate
Holdings Limited.
Patrick Shui-Chung Wang JP
Chairman and Chief Executive
Member of Nomination and Corporate Governance Committee
Patrick Shui-Chung Wang, age 65, obtained his Bachelor of Science and Master of Science degrees in
Electrical Engineering and received an Honorary Doctorate of Engineering from Purdue University in
Indiana, United States. He joined the Group in 1972 and became a director of the Company in 1976
and Managing Director in 1984. In 1996, he was elected Chairman and Chief Executive of the
Company. He also serves on the board of directors of various subsidiaries of the Company. Dr. Wang
was the Chairman and a director of the Hong Kong Applied Science and Technology Research Institute
Company Limited, however he retired from the aforesaid positions with effect from 21 October 2013.
Dr. Wang is an Independent Non-executive Director and a member of the Nomination Committee of
VTech Holdings Limited and a non-executive director of Tristate Holdings Limited. He is also a member
of the Hong Kong Sanatorium & Hospital’s Clinical Governance Committee. He ceased to be a non-
executive director and a member of the Audit Committee of The Hongkong and Shanghai Banking
Corporation Limited with effect from 31 December 2012. He is a son of the Honorary Chairman,
Madam Yik-Chun Koo Wang.
Winnie Wing-Yee Wang
Vice-Chairman
Member of Remuneration Committee
Winnie Wing-Yee Wang, age 69, obtained her Bachelor of Science degree from Ohio University in the
United States. She joined the Group in 1969. She became a director of the Company in 1971 and
Executive Director in 1984 and was elected the Vice-Chairman in 1996. She also serves on the board
of directors of various subsidiaries of the Company. Ms. Wang is a non-executive director of Tristate
Holdings Limited. She is a sister of the Chairman and Chief Executive, Dr. Patrick Shui-Chung Wang.

PROFILE OF DIRECTORS AND SENIOR MANAGEMENT
165
Austin Jesse Wang
Executive Director
Austin Jesse Wang, age 35, graduated from the Massachusetts Institute of Technology with Master of
Engineering and Bachelor of Science degrees in Computer Science and Electrical Engineering. He
joined the Group in 2006 and became a director of the Company in 2009. He is a Division Vice
President, IPG Engineering Programs. He also serves on the board of directors of various subsidiaries
of the Company. Mr. Wang is a committee member of the Shenzhen Committee of The Chinese
People’s Political Consultative Conference. He has previously worked as a consulting engineer in the
computing industry. Mr. Wang is the son of the Chairman and Chief Executive, Dr. Patrick Shui-Chung
Wang.
Peter Kin-Chung Wang
Non-Executive Director
Member of Audit Committee
Peter Kin-Chung Wang, age 62, has been a Non-Executive Director of the Company since 1982. He
obtained a Bachelor of Science degree in Industrial Engineering from Purdue University in Indiana,
United States and a Master of Business Administration degree from Boston University in
Massachusetts, United States. He is the Chairman and Chief Executive Officer of Tristate Holdings
Limited and the Chairman and Managing Director of Hua Thai Manufacturing Public Company Limited
which was formerly listed on The Stock Exchange of Thailand. Mr. Wang won the Young Industrialist
Award of Hong Kong in 1998. In 2005, he received the Outstanding Industrial Engineer Award from
the School of Industrial Engineering of Purdue University. He is a member of the Anhui Provincial
Committee of Chinese People’s Political Consultative Conference, the honorary chairman of the Hong
Kong Garment Manufacturers Association, a general committee member of the Textile Council of Hong
Kong Limited and a director of The Federation of Hong Kong Garment Manufacturers. He is a brother
of the Chairman and Chief Executive, Dr. Patrick Shui-Chung Wang.
Peter Stuart Allenby Edwards
Independent Non-Executive Director
Chairman of Nomination and Corporate Governance Committee
Peter Stuart Allenby Edwards, age 67, has been an Independent Non-Executive Director of the
Company since 1995. He is a solicitor and was Senior Partner of Johnson, Stokes & Master until he
retired on 30 September 1996. Mr. Edwards was the Chairman of the Hong Kong Branch of the
International Fiscal Association, the Chairman of the Revenue Law Committee of the Hong Kong Law
Society and a member of the Joint Liaison Committee on Taxation which advises the Government of
the Hong Kong Special Administrative Region. He is also a member of the International Academy of
Estate and Trust Law, an honorary lecturer in law at the University of Hong Kong and a director of a
number of investment and holding companies. He is a director of Martin Currie Pacific Trust plc.

166Johnson Electric Holdings Limited
Annual Report 2016
Patrick Blackwell Paul CBE, FCA
Independent Non-Executive Director
Chairman of Audit Committee and Member of Nomination and Corporate Governance Committee
Patrick Blackwell Paul, age 68, has been an Independent Non-Executive Director of the Company since
2002. He had been the Chairman and Senior Partner of PricewaterhouseCoopers in Hong Kong from
1994 to 2001. He is an independent non-executive director of The Hongkong and Shanghai Hotels,
Ltd. and Pacific Basin Shipping Limited. His civic commitments include chairing the Supervisory Board
of the British Chamber of Commerce in Hong Kong.
Michael John Enright
Independent Non-Executive Director
Chairman of Remuneration Committee and Member of Audit Committee
Michael John Enright, age 57, has been an Independent Non-Executive Director of the Company since
2004. He obtained his Bachelor of Arts (in Chemistry), Master of Business Administration, and Doctor
of Philosophy (in Business Economics) degrees all from Harvard University. He was formerly a
professor at the Harvard Business School. Prof. Enright is currently a professor at the University of
Hong Kong School of Business and a director at Enright, Scott & Associates, a Hong Kong-based
consulting firm.
Joseph Chi-Kwong Yam GBM, GBS, CBE, JP
Independent Non-Executive Director
Member of Remuneration Committee
Joseph Chi-Kwong Yam, age 67, has been an Independent Non-Executive Director of the Company
since 2010. He graduated from the University of Hong Kong with first class honours in 1970. Over
the years, he has received a number of honorary doctorate degrees and professorships from
universities in Hong Kong and overseas. Mr. Yam was awarded the highest honour of the Grand
Bauhinia Medal by the Government of the Hong Kong Special Administrative Region in 2009. He was
the Chief Executive of the Hong Kong Monetary Authority from 1993 to September 2009. He is the
Executive Vice President of the China Society for Finance and Banking, a society managed by the
People’s Bank of China, Distinguished Research Fellow of the Institute of Global Economics and
Finance at The Chinese University of Hong Kong and the Chairman of Macroprudential Consultancy
Limited. Mr. Yam is a member of the Board of Directors, the Corporate Culture and Responsibility
Committee and the Risk Committee of UBS Group AG, and a Board member and Chairman of
Compensation & Assessment Committee of UnionPay International Co., Ltd. He was formerly an
independent non-executive director, chairman of the Risk Management Committee and member of the
Strategic Development Committee of China Construction Bank Corporation but retired from these
positions with effect from 23 October 2013. Mr. Yam is also a member of the advisory committees of
a number of academic and private institutions focusing on finance.

PROFILE OF DIRECTORS AND SENIOR MANAGEMENT
167
Christopher Dale Pratt CBE
Independent Non-Executive Director
Members of Audit Committee and Remuneration Committee
Christopher Dale Pratt, age 59, has been an Independent Non-Executive Director of the Company since
2014. He obtained his honours degree in Modern History from Oxford University. He joined the Swire
group in 1978 and over the next 35 years worked in various of the group’s businesses in Hong Kong,
Australia and Papua New Guinea. From 2006 until his retirement in March 2014, he served as
Chairman of Cathay Pacific Airways Limited, Hong Kong Aircraft Engineering Company Limited, John
Swire & Sons (H.K.) Limited, Swire Pacific Limited and Swire Properties Limited. He was also a Director
of Swire Beverages, Air China Limited and The Hongkong and Shanghai Banking Corporation Limited.
Mr. Pratt is currently an Independent Non-Executive Director of PureCircle Limited, Noble Group Limited
and the Grosvenor Group Limited. He is also a senior advisor to Morgan Stanley Asia Limited. Mr. Pratt
has retired as Vice Chairman of The Hong Kong General Chamber of Commerce. He was appointed a
Commander of the Order of the British Empire (CBE) in 2000.
SENIOR MANAGEMENT
Tung-Sing Choi
Senior Vice President,
Global Manufacturing
Tung-Sing Choi, age 66, is responsible for the global manufacturing management of the Group. He
joined the Group in 1968 and has more than 40 years of experience in motor component
manufacturing, motor assembly processes and the utilisation of machines and fixtures.
James Randolph Dick
Senior Vice President,
Industry Products Group
James Randolph Dick, age 62, holds a Bachelor of Science in Electrical and Electronic Engineering
from the University of Paisley in Scotland. He is responsible for developing responses to macro
market issues and leading the Industry Products Group sales, business development and engineering
globally. He joined the Group in 1999. He has over 35 years of experience in high technology
management throughout the world. Prior to joining the Group, he held executive positions with Xerox in
the United States, IBM in Europe and with Astec (BSR) Plc, an Emerson Electric company, based in
Hong Kong.

168Johnson Electric Holdings Limited
Annual Report 2016
Michael Philip Gannon
Senior Vice President,
Human Resources
Michael Philip Gannon, age 61, holds a Bachelor of Industrial Administration degree from Kettering
University and a Master of Business Administration (Accounting) from the University of Michigan. He
joined the Group in 2013 and is responsible for global human resources, training and development
and environment and health and safety. Prior to joining the Group, he worked in the United States and
Europe for General Motors, Delphi and Nexteer Automotive, where he held positions in human
resources, business strategy and operations. Most recently, he was Senior Vice President of global
human resources and Chief Operations Officer of the Saginaw division for Nexteer Automotive.
Robert Allen Gillette
Senior Vice President,
Supply Chain Services
Robert Allen Gillette, age 50, holds a Bachelor of Science degree in Electrical Engineering from
Washington University in Missouri, United States and a Master of Business Administration
concentrating in Operations and Finance from Vanderbilt University in Tennessee, United States. He is
responsible for providing leadership and strategic direction in supply chain management for all
business units of the Group. Prior to joining the Group in 2007, he worked for Emerson Electric where
he held various operations, marketing and supply chain positions in North America and Asia.
Christopher John Hasson
Executive Vice President
Christopher John Hasson, age 53, was educated at the University of Manchester and London
Business School (Corporate Finance and Accounting). He is responsible for corporate business
development, mergers and acquisitions, corporate strategic planning and for supervision of the legal
and company secretarial functions. Prior to joining the Group in 2002, he was a partner at The Boston
Consulting Group.
Kam-Chin Ko
Senior Vice President,
Automotive Products Group
Kam-Chin Ko, age 50, holds a Master of Science degree in Manufacturing System Engineering from
the University of Warwick in the United Kingdom and a Doctor of Engineering from the Hong Kong
Polytechnic University in Hong Kong. He is responsible for the business and strategic objectives for
sales, business development and engineering of APG globally. He joined the Group in 1988 and in
previous positions led C&S and the Corporate Engineering function. He is a member of The Institute
of Engineering and Technology and a member of the Institute of Industrial Engineers.

PROFILE OF DIRECTORS AND SENIOR MANAGEMENT
169
Yue Li
Senior Vice President,
Corporate Engineering
Yue Li, age 56, obtained a Bachelor of Science degree from Tsinghua University in the PRC and also a
Doctor of Philosophy degree from the University of Wisconsin-Madison in Wisconsin, United States. He
is responsible for overall corporate technology, engineering operations and Value Innovation Programs.
Prior to joining the Group in 2004, he worked for Emerson Electric in St. Louis as director of new
products, for Carrier Corporation in Syracuse as director of power electronics and motor technologies
and for Emergency One Inc. in Florida as vice president of product management.
Jeffrey L. Obermayer
Executive Vice President and
Chief Financial Officer
Jeffrey L. Obermayer, age 61, has a Bachelor of Science degree (Hons.) in Business Administration
and a Master of Science degree in Accounting from the Illinois State University in Illinois, United
States. He also holds a Master of Business Administration degree from the Northwestern University in
Illinois, United States. He is a member of the American Institute of Certified Public Accountants, the
Institute of Management Accountants and the Institute of Internal Auditors. Prior to joining the Group
in 2010, he had 28 years of experience with BorgWarner Inc. in the United States and Germany,
where he held a variety of senior executive positions in finance, business development, treasury and
enterprise risk management, capital markets, pension plans and accounting. Prior to his last position
there as Vice President & Controller, Principal Accounting Officer, he was Vice President & Treasurer.
He also worked with Arthur Andersen & Co. in Chicago, United States.

170Johnson Electric Holdings Limited
Annual Report 2016
CORPORATE AND SHAREHOLDER INFORMATION
Johnson Electric Holdings Limited(Incorporated in Bermuda with limited liability)
CORPORATE INFORMATION
Board of Directors
Executive Directors
Patrick Shui-Chung Wang JP
Chairman and Chief Executive
Winnie Wing-Yee Wang
Vice-Chairman
Austin Jesse Wang
Non-Executive Directors
Yik-Chun Koo Wang
Honorary Chairman
Peter Kin-Chung Wang
Peter Stuart Allenby Edwards*
Patrick Blackwell Paul CBE, FCA*
Michael John Enright*
Joseph Chi-Kwong Yam
GBM, GBS, CBE, JP*
Christopher Dale Pratt CBE*
* Independent Non-Executive Director
Company Secretary
Lai-Chu Cheng
Auditor
PricewaterhouseCoopers
Registrars and Transfer Offices
Principal Registrar:
MUFG Fund Services (Bermuda)
Limited
The Belvedere Building
69 Pitts Bay Road
Pembroke HM 08
Bermuda
Registrar in Hong Kong:
Computershare Hong Kong
Investor Services Limited
Shops 1712 - 1716, 17th Floor
Hopewell Centre
183 Queen’s Road East
Wan Chai, Hong Kong
Registered Office
Canon’s Court
22 Victoria Street
Hamilton HM 12
Bermuda
Hong Kong Head Office
12 Science Park East Avenue, 6/F
Hong Kong Science Park
Shatin, New Territories
Hong Kong
Tel : (852) 2663 6688
Fax : (852) 2897 2054
Website : www.johnsonelectric.com
Principal Bankers
The Hongkong and Shanghai
Banking Corporation Limited
Commerzbank AG
Bank of China (Hong Kong) Limited
Mizuho Bank, Ltd.
The Bank of Tokyo-Mitsubishi UFJ, Ltd.
Hang Seng Bank Limited
Citibank, N.A.
JPMorgan Chase Bank, N.A.
BNP Paribas
Standard Chartered Bank
Rating agencies
Moody’s Investors Service
Standard & Poor’s Ratings Services
LISTING INFORMATIONShare Listing
The Company’s shares are listed on The Stock
Exchange of Hong Kong Limited.
Stock Code
The Stock Exchange of Hong Kong Limited : 179
Bloomberg : 179:HK
Reuters : 0179.HK
SHAREHOLDERS’ CALENDARAnnual General Meeting (AGM)
14 July 2016 (Thu)
Register of Shareholders
Closure of Register (both dates inclusive)
For attending AGM : 12 – 14 July 2016 (Tue – Thu)
For final dividend : 1 – 3 August 2016 (Mon – Wed)
Dividend (per Share)
Interim Dividend : 15 HK cents
Paid on : 6 January 2016 (Wed)
Final Dividend : 34 HK cents
Payable on : 12 August 2016 (Fri)

(Stock Code: 179)
Johnson Electric Holdings Limited
12 Science Park East Avenue, 6/F
Hong Kong Science Park
Shatin, New Territories
Hong Kong
Tel: (852) 2663 6688 Fax: (852) 2897 2054
www.johnsonelectric.com
Joh
nso
n E
lectric H
old
ing
s L
imited
A
nn
ual R
epo
rt 2016
Johnson Electric Holdings LimitedAnnual Report 2016