joint research centre - europasusproc.jrc.ec.europa.eu/taps_and_showers/docs/t&s... · joint...
TRANSCRIPT

www.jrc.ec.europa.eu
Serving society
Stimulating innovation
Supporting legislation
Joint Research Centre
The European Commission’s in-house science service
Barcelona, 27 June 2013
Kick-off meeting for the MEErP preparatory study on
Taps and Showers
Table of Contents
1. Questionnaire 2. Scope 3. Market analysis 4. Users and system aspects 5. Analysis of technologies 6. Environmental and economic assessment
Table of Contents
1. Questionnaire 2. Scope 3. Market analysis 4. Users and system aspects 5. Analysis of technologies 6. Environmental and economic assessment
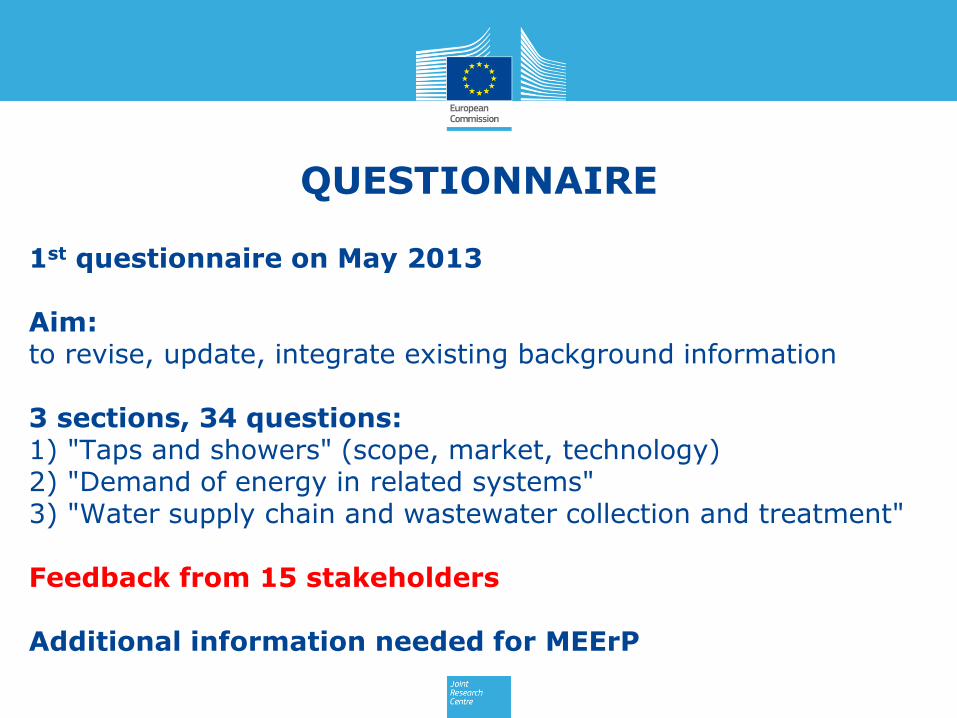
1st questionnaire on May 2013 Aim: to revise, update, integrate existing background information 3 sections, 34 questions: 1) "Taps and showers" (scope, market, technology) 2) "Demand of energy in related systems" 3) "Water supply chain and wastewater collection and treatment" Feedback from 15 stakeholders Additional information needed for MEErP
QUESTIONNAIRE
Table of Contents
1. Questionnaire 2. Scope 3. Market analysis 4. Users and system aspects 5. Analysis of technologies 6. Environmental and economic assessment
SCOPE
• Classification and definitions • Standards and methods • Legislation • Questions for stakeholders
8 28 June 2013
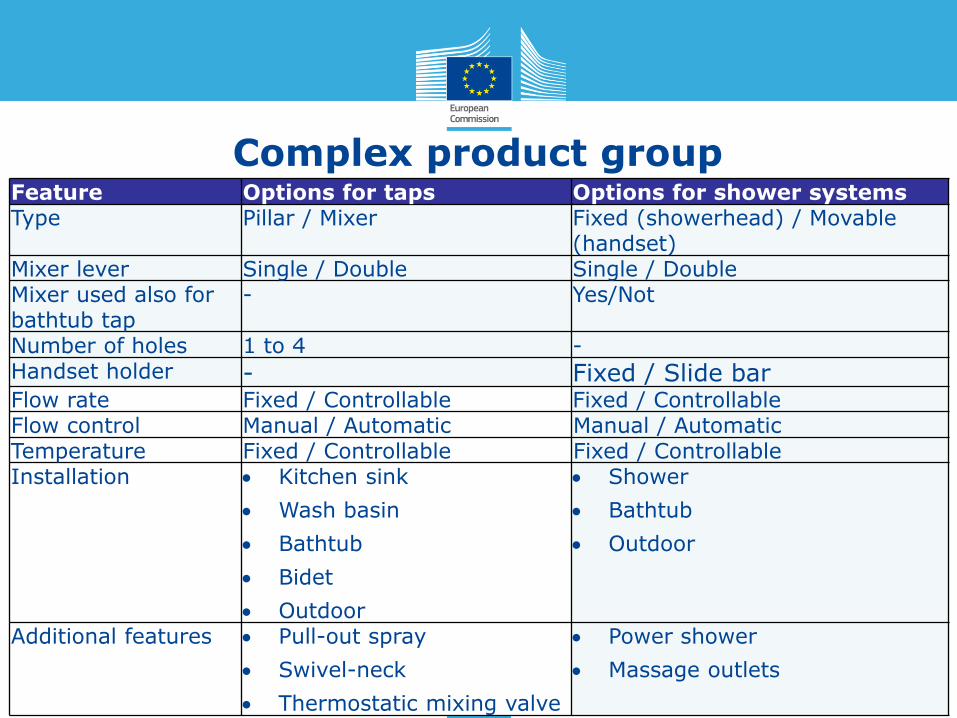
Complex product group Feature Options for taps Options for shower systems Type Pillar / Mixer Fixed (showerhead) / Movable
(handset) Mixer lever Single / Double Single / Double Mixer used also for bathtub tap
- Yes/Not
Number of holes 1 to 4 - Handset holder - Fixed / Slide bar Flow rate Fixed / Controllable Fixed / Controllable Flow control Manual / Automatic Manual / Automatic Temperature Fixed / Controllable Fixed / Controllable Installation Kitchen sink
Wash basin
Bathtub
Bidet
Outdoor
Shower
Bathtub
Outdoor
Additional features Pull-out spray
Swivel-neck
Thermostatic mixing valve
Power shower
Massage outlets

9 28 June 2013
PRODCOM / CN
• Differentiation between mixing valves (28.14.12.33 / 8481 80 11) and other valves (28.14.12.35 / 8481 80 19)
• No information about the use of the product
• Reference to showers is not explicit (22.23.12.90, 25.99.11.31, 25.99.11.35 and 25.99.11.37 for sanitary ware and parts of sanitary ware made of different materials).
NACE
Still more aggregated
Key importance for market analysis
• Quite aggregated • Only available
classifications • Pillar taps are not
covered
Classification of the product group – EU trade statistics

International standards (e.g. EN 200, EN 1112, EN 13904, BS 6100-7)
Labelling systems (e.g. EU Ecolabel for sanitary tapware)
10 28 June 2013
Definitions for the product group
• Main function: to deliver water that is of a quality that is fit for human consumption and that has a desired temperature.
• "Use" instead of "consumption"
• Quality, flow rate (and temperature) control, comfort (I)
• Safety (II)
• No common differentiation between I and II functional parameters
11 28 June 2013
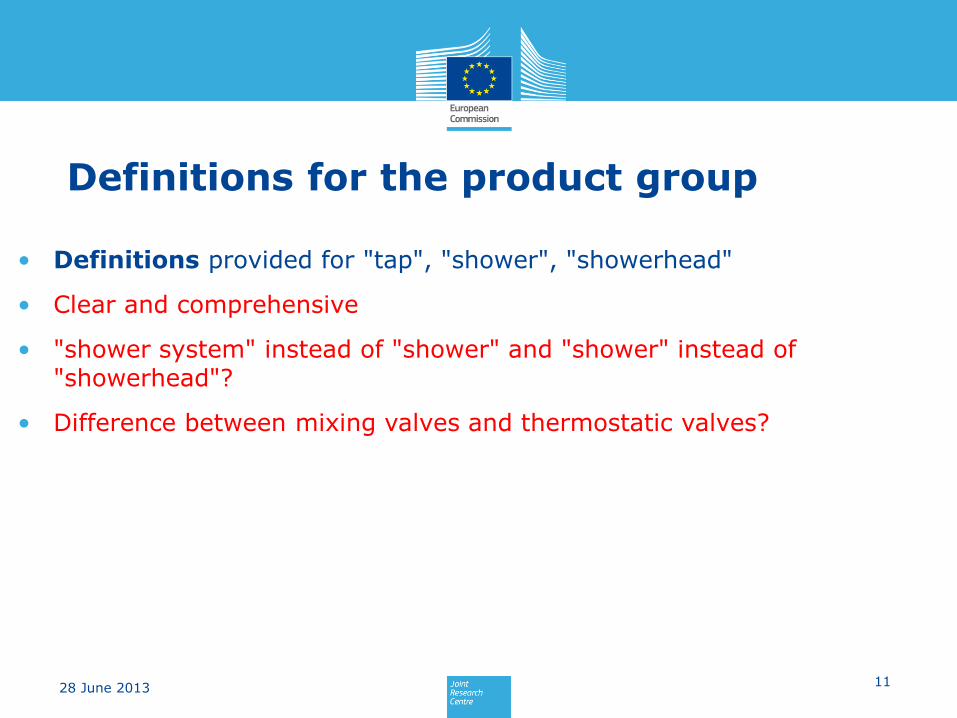
Definitions for the product group
• Definitions provided for "tap", "shower", "showerhead"
• Clear and comprehensive
• "shower system" instead of "shower" and "shower" instead of "showerhead"?
• Difference between mixing valves and thermostatic valves?

12 28 June 2013
Scope of the study
• Initial scope of this study: all urban applications for both domestic and non-domestic uses.
• Preliminarily out of the scope: bathtub taps and applications which need unrestricted water flow (e.g. laboratory safety taps and showers).
• Relevant to analyse (?):
- Instant hot water dispensers and electric shower heads
- Household Food Waste Disposers installed in sinks
- Shower heat exchanger
• Examples of niche products:
- Industrial kitchens taps and pre-rinse shower units
- Shower panels
28 June 2013
Focus on:
a) Functional performance parameters
b) Resources use
c) Water abstraction, treatment and supply
d) Waste production
e) Emission measurement:
f) Safety
g) Noise and vibrations
h) Waste-water collection, treatment and discharge
For:
• International and European Community;
• Member State;
• Third-Country. 13
Measurement methods and standards

Additional standards of potential interest:
• EN 806-1; -2; -3; -4; -5 on "Specifications for installations inside
buildings conveying water for human consumption"
• EN 12056-1;-2;-3;-4;-5 on "Gravity drainage systems inside
buildings"
• EN 15091:2007-03 on "Sanitary tapware - Electronic opening and
closing sanitary tapware"
• EN 16145:2012 on "Extractable outlets for sink and basin mixers
— General technical specification"
• EN 16146:2013 on "Extractable shower hoses for sanitary tapware
for supply systems type 1 and type 2 — General technical
specification"
• DIN 1988-100;-200;-300;-8;-500;-600;-7
14 28 June 2013

15 28 June 2013
a) Functional performance parameters
• Most of the functional performance parameters are covered by product-specific standards
• There is no EU harmonised standard yet concerning the fitness for contact with drinking water and for rinsing effectiveness of showers
b) Resources use (energy, water and other materials)
• EN 15804:2012 "Sustainability of construction works - Environmental product declarations - Core rules for the product category of construction products"
• EN 27842:1991-11 on Automatic steam traps; determination of discharge capacity; test methods
• DIN 1988-300:2012-05 on Codes of practice for drinking water installations-Part 300: Pipe Sizing
16 28 June 2013
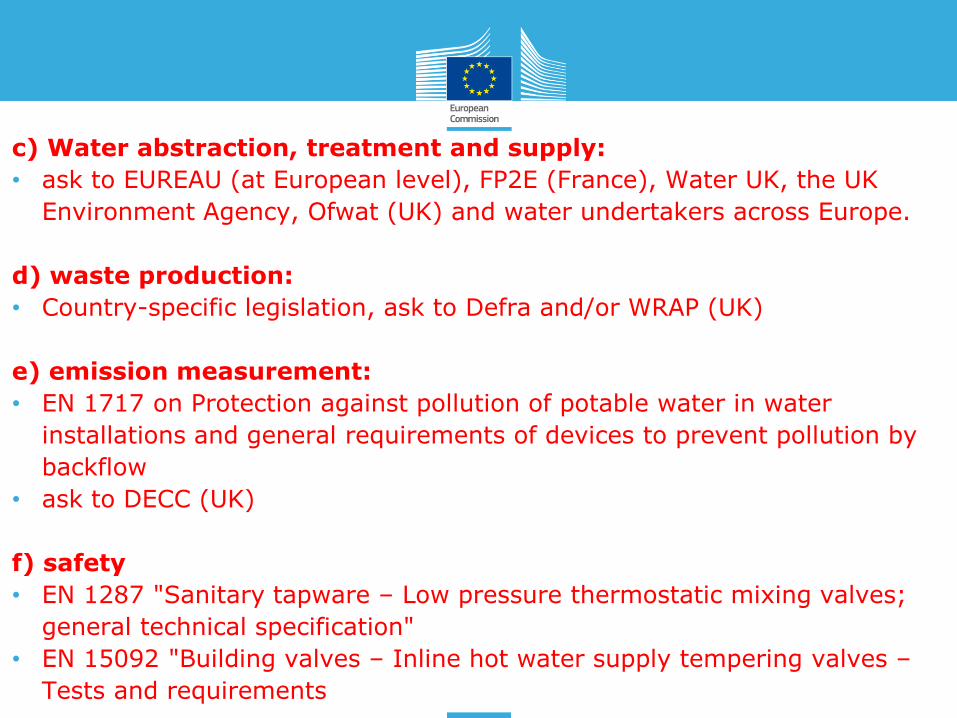
c) Water abstraction, treatment and supply:
• ask to EUREAU (at European level), FP2E (France), Water UK, the UK
Environment Agency, Ofwat (UK) and water undertakers across Europe.
d) waste production:
• Country-specific legislation, ask to Defra and/or WRAP (UK)
e) emission measurement:
• EN 1717 on Protection against pollution of potable water in water
installations and general requirements of devices to prevent pollution by
backflow
• ask to DECC (UK)
f) safety
• EN 1287 "Sanitary tapware – Low pressure thermostatic mixing valves;
general technical specification"
• EN 15092 "Building valves – Inline hot water supply tempering valves –
Tests and requirements

g) noise and vibrations
• EN 200: 2008-10 "Sanitary tapware – Single taps and combination taps
for water supply systems of type 1 and type 2 – General technical
specification"
• EN 1112:2008-06 "Sanitary tapware – Shower outlets for sanitary
tapware for water supply systems of type 1 and type 2-Gneral technical
specification"
• EN ISO 3822 on noise emission from appliances and equipment used in
water supply
h) waste-water collection, treatment and discharge
• EN 12056 and DIN 1986-30;-100
• Ask to EUREAU
17 28 June 2013

Focus on:
• Regulatory instruments (mandatory and voluntary)
• Labelling systems
• Voluntary agreements
For:
• International and European Community;
• Member State;
• Third-Country.
18 28 June 2013
Legislation
Ecodesing and Energy labelling
• EU mandatory legislation involving some WuP but not taps and showers.
• Additional information (e.g. water consumption, noise) can be included into the Commission's energy label.
Ecolabel
• EU Ecolabel criteria for sanitary tapware positively voted in November 2012.
19 28 June 2013

20 28 June 2013
EU Ecolabel criteria for sanitary tapware consider:
1. Water consumption and related energy saving
2. Materials in contact with drinking water
3. Excluded or limited substances and mixtures
4. Product quality and longevity
5. Packaging
6. User information
7. Information appearing on the EU Ecolabel
On water consumption and related energy savings:
• Maximum and lowest maximum available water flow rates
• Presence of a temperature management device / technical solution (where water supply is not temperature controlled)
• Guidelines on time control for taps and showers with time control devices
28 June 2013
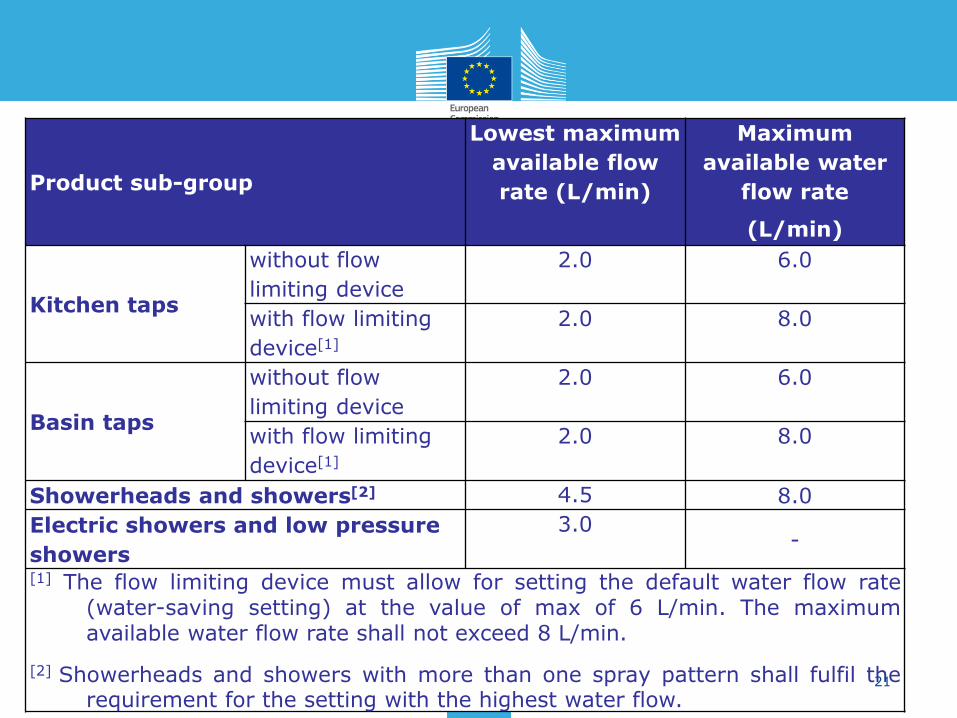
Product sub-group
Lowest maximum
available flow
rate (L/min)
Maximum
available water
flow rate
(L/min)
Kitchen taps
without flow
limiting device
2.0 6.0
with flow limiting
device[1]
2.0 8.0
Basin taps
without flow
limiting device
2.0 6.0
with flow limiting
device[1]
2.0 8.0
Showerheads and showers[2] 4.5 8.0
Electric showers and low pressure
showers
3.0 -
[1] The flow limiting device must allow for setting the default water flow rate (water-saving setting) at the value of max of 6 L/min. The maximum available water flow rate shall not exceed 8 L/min.
[2] Showerheads and showers with more than one spray pattern shall fulfil the requirement for the setting with the highest water flow.
21

Global overview for taps and showers:
• Mandatory measures are generally applied at regional or municipal level and in accordance with the national building code
• Several ecolabel schemes around the World
• Labelling based on pass-fail criteria or on water efficiency rating systems;
• Other voluntary measures: codes or guidelines for sustainable buildings;
• Mandatory only in some extra-EU countries (water efficiency labelling schemes, requirements due to building codes)
• Harmonisation between regulatory instruments and labels desired
22 28 June 2013

23 28 June 2013
Regulatory instruments of potential relevance:
• Schemes for the market approval of water using products (e.g. Austria – ÖVGW; Belgium – Belaqua; DK – VA approval and the new water drop; “approved for drinking water”; Germany- DVGW approval; Norway – Sintef; Switzerland – SVGW; UK - WRAS approval)
• The National Building Code of Finland
• French regulation on energy performance of buildings
• National regulations concerning products in contact with drinking water, such as the German Drinking Water Regulation
• The UK Water Technology List and, more in general, the UK Regulations for Water and Building.
Labelling of potential interest:
• The French “Marque NF”.
• Voluntary environmental labelling for buildings such as LEED(USA), BREEAM (GB), DNGB (Germany) and HQE (France)
• Quality schemes (DVGW, NF, KIWA…)
24 28 June 2013
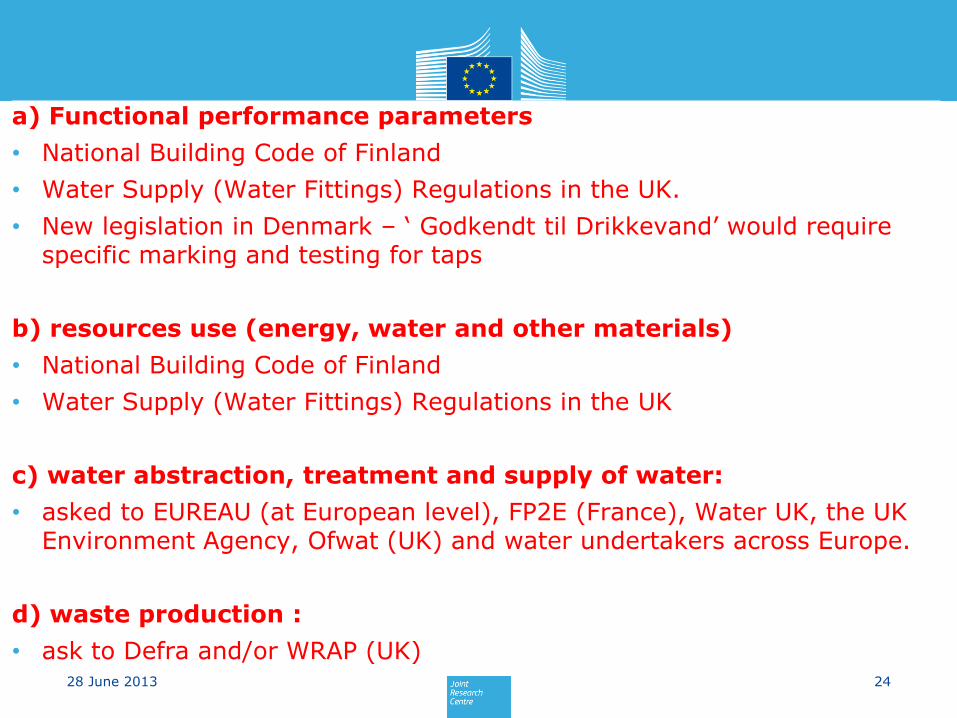
a) Functional performance parameters
• National Building Code of Finland
• Water Supply (Water Fittings) Regulations in the UK.
• New legislation in Denmark – ‘ Godkendt til Drikkevand’ would require specific marking and testing for taps
b) resources use (energy, water and other materials)
• National Building Code of Finland
• Water Supply (Water Fittings) Regulations in the UK
c) water abstraction, treatment and supply of water:
• asked to EUREAU (at European level), FP2E (France), Water UK, the UK Environment Agency, Ofwat (UK) and water undertakers across Europe.
d) waste production :
• ask to Defra and/or WRAP (UK)

e) emission measurement:
• ask to DECC (UK)
f) safety:
• French regulation
• Building regulations in the UK and delivery of hot water in healthcare premises (e.g. Model NHS engineering Specification D 08).
g) noise and vibrations
• no indications
h) waste-water collection, treatment and discharge
• The Building Regulations – Sustainable Drainage Requirements - controls this in the UK.
25 28 June 2013
26 28 June 2013
Questions
Classification and scope definition:
1) Recommendations on specific products to be included / excluded within the scope of the study? (rationale and definition to be provided)
• Instant hot water dispensers and electric shower heads
• Household Food Waste Disposers installed in sinks
• Shower heat exchanger
• Industrial kitchens taps and pre-rinse shower units
• Shower panels
• (Others)

27 28 June 2013
Methods and standards:
2) Last updated information provided by stakeholders, any additional recommendations?
a) Functional performance parameters b) resources use (energy, water and other materials) c) water abstraction, treatment and supply of water d) waste production e) emission measurement f) safety g) noise and vibrations h) waste-water collection, treatment and discharge
3) Any new standards being planned to be developed or mandates for the European Standards Organisation?
4) Any problems on accuracy (tolerances), reproducibility and representativeness?

28 28 June 2013
Regulatory instruments, labels and voluntary agreements
5) Last updated information provided by stakeholders, any additional recommendations?
a) Functional performance parameters b) resources use (energy, water and other materials) c) water abstraction, treatment and supply of water d) waste production e) emission measurement f) safety g) noise and vibrations h) waste-water collection, treatment and discharge

Table of Contents
1. Questionnaire 2. Scope 3. Market analysis 4. Users and system aspects 5. Analysis of technologies 6. Environmental and economic assessment
• EU production and trade volume
• Market and stock data
• Consumer expenditure base data
• Questions for stakeholders
MARKET ANALYSIS
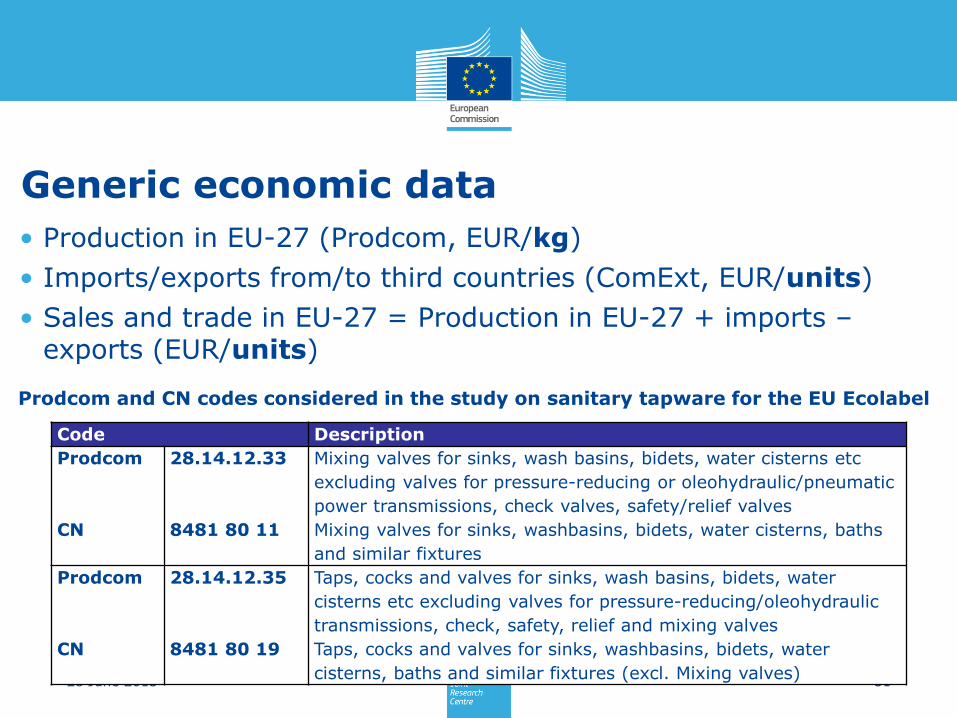
Generic economic data
• Production in EU-27 (Prodcom, EUR/kg)
• Imports/exports from/to third countries (ComExt, EUR/units)
• Sales and trade in EU-27 = Production in EU-27 + imports – exports (EUR/units)
31 28 June 2013
Code Description
Prodcom 28.14.12.33 Mixing valves for sinks, wash basins, bidets, water cisterns etc
excluding valves for pressure-reducing or oleohydraulic/pneumatic
power transmissions, check valves, safety/relief valves
CN 8481 80 11 Mixing valves for sinks, washbasins, bidets, water cisterns, baths
and similar fixtures
Prodcom 28.14.12.35 Taps, cocks and valves for sinks, wash basins, bidets, water
cisterns etc excluding valves for pressure-reducing/oleohydraulic
transmissions, check, safety, relief and mixing valves
CN 8481 80 19 Taps, cocks and valves for sinks, washbasins, bidets, water
cisterns, baths and similar fixtures (excl. Mixing valves)
Prodcom and CN codes considered in the study on sanitary tapware for the EU Ecolabel
EU Production
32 28 June 2013
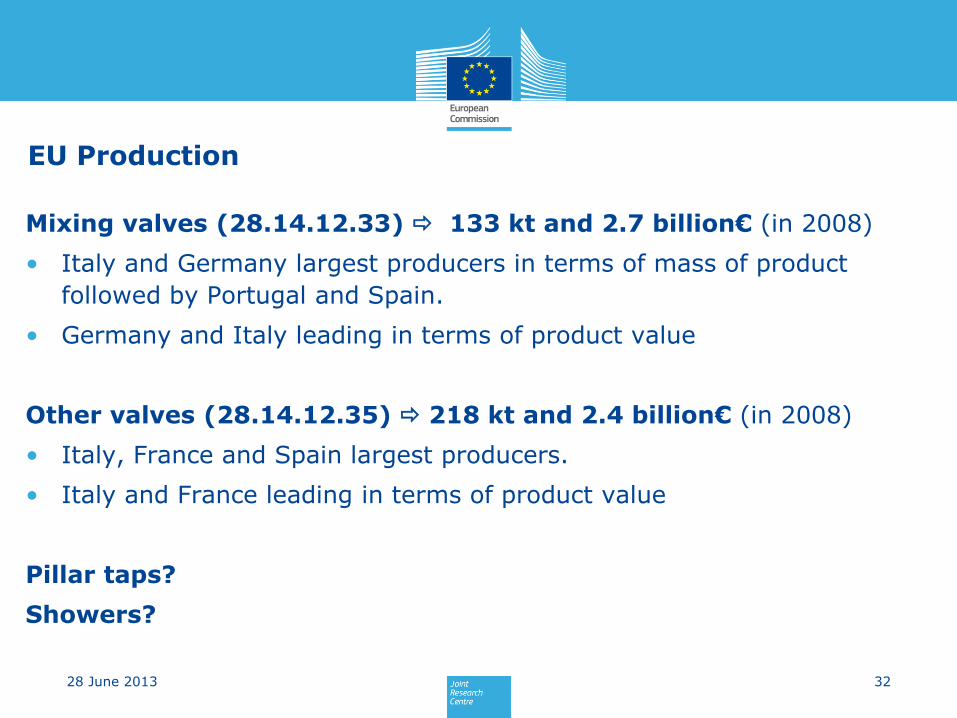
Mixing valves (28.14.12.33) 133 kt and 2.7 billion€ (in 2008)
• Italy and Germany largest producers in terms of mass of product
followed by Portugal and Spain.
• Germany and Italy leading in terms of product value
Other valves (28.14.12.35) 218 kt and 2.4 billion€ (in 2008)
• Italy, France and Spain largest producers.
• Italy and France leading in terms of product value
Pillar taps?
Showers?
Estimated production: 164.6 millions of taps and 54.9 millions of
showers
33 28 June 2013
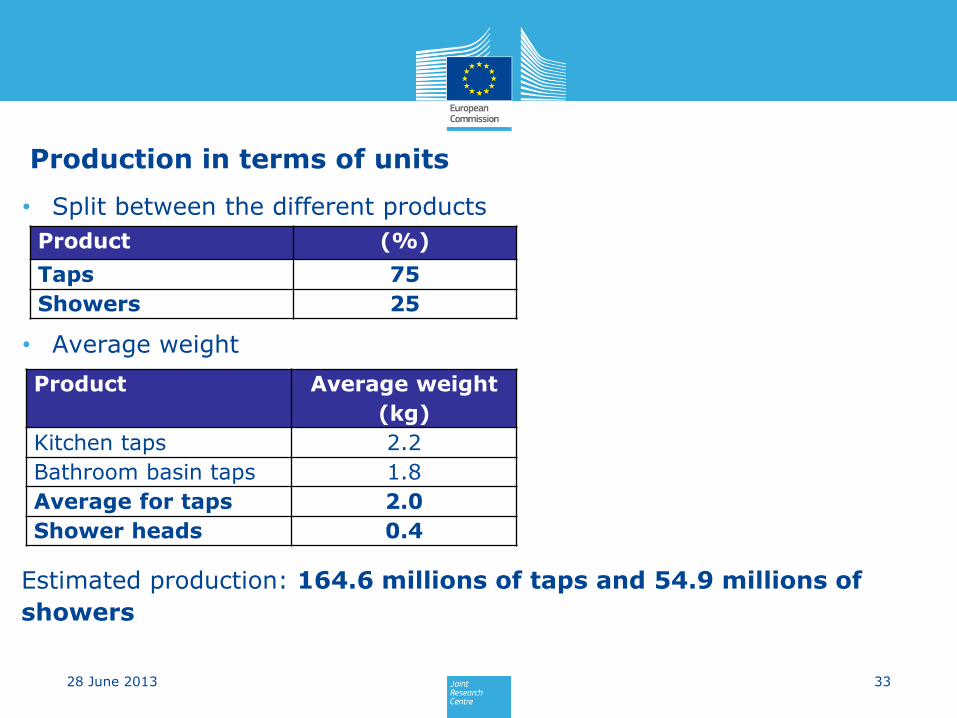
Product Average weight
(kg)
Kitchen taps 2.2
Bathroom basin taps 1.8
Average for taps 2.0
Shower heads 0.4
Product (%)
Taps 75
Showers 25
Production in terms of units
• Split between the different products
• Average weight

EU Trade
Total value of EU Trade
34 28 June 2013
Intra-EU Trade and Extra-EU Trade
Mixing Valves (CN 8481 8011)
• largest importers: Germany, France, Italy and the UK
• largest exporters: Germany, Italy, Portugal and Bulgaria
Other Valves (CN 8481 8019)
• largest importers: UK, Germany, Italy and Spain.
• largest exporter: Italy, Germany, Spain and the UK (in mass) – Italy,
Germany, France and Spain (in value).
Estimated trade
• Import: 101 millions of taps and 33.8 millions of showers
• Export: 80.5 millions of taps and 26.8 millions of showers

EU sales and trade
EU-27 sales and trade = production in EU-27 + imports to EU-27 – export
from EU-27
Apparent consumption for both taps and showers
• Italy (21.6% of the total)
• Germany (9.7%)
• France (8.4%)
35 28 June 2013

28 June 2013
Basic market data for EU-27 or specific Member States
France
• 8 millions of units of taps sold (also considering imports?) for
domestic use in 2009
• 1.85 millions of units of taps sold for non-domestic use in 2009
• 2.5% growth rate in value in 2012 according to MSI study . Volume in
units was however stable.
UK
• 7 million of taps sold in 2012, sales could decrease by 28% (when?)
• 2.3 million of showers (or showerheads?)
• sold in 2012, sales could decrease by 28%
Information provided also from 2 producers (market share?)
36

37 28 June 2013
Market composition in terms of companies' turnover and number of employees
Company Taps (%) Showers (%)
Showerheads (%)
SME(*) 50%, (trend to 0%)
100% for industrial kitchen taps in Germany
Large 50% (trend to 100%)
Key Players For industrial kitchen taps in Germany: Echtermann, Knauss, KWC Germany
(*) number of employees < 250 and annual turnover < 50 M€, and/or annual balance sheet < 43 M€
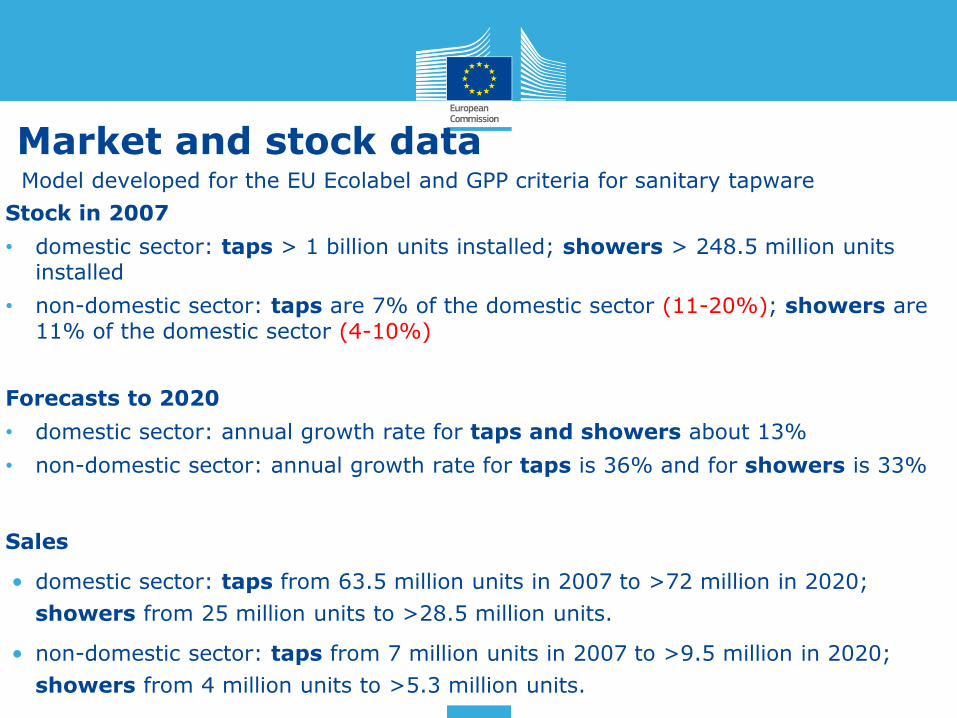
Market and stock data Model developed for the EU Ecolabel and GPP criteria for sanitary tapware
38 28 June 2013
Stock in 2007
• domestic sector: taps > 1 billion units installed; showers > 248.5 million units installed
• non-domestic sector: taps are 7% of the domestic sector (11-20%); showers are 11% of the domestic sector (4-10%)
Forecasts to 2020
• domestic sector: annual growth rate for taps and showers about 13%
• non-domestic sector: annual growth rate for taps is 36% and for showers is 33%
Sales
• domestic sector: taps from 63.5 million units in 2007 to >72 million in 2020;
showers from 25 million units to >28.5 million units.
• non-domestic sector: taps from 7 million units in 2007 to >9.5 million in 2020;
showers from 4 million units to >5.3 million units.
Consumers expenditure base data
39 28 June 2013
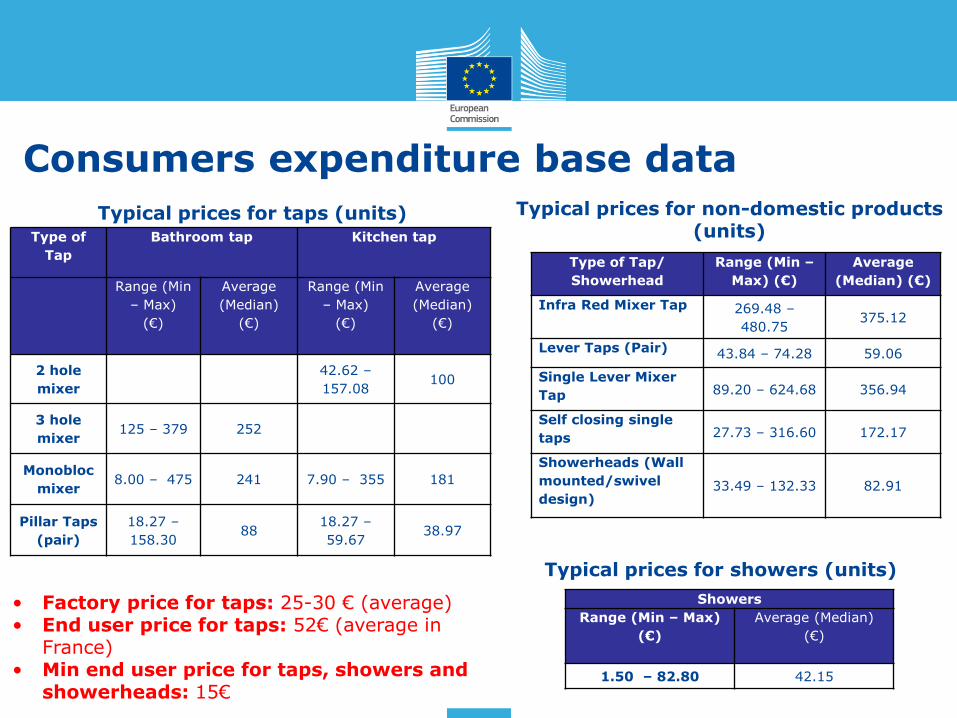
Type of
Tap
Bathroom tap Kitchen tap
Range (Min
– Max)
(€)
Average
(Median)
(€)
Range (Min
– Max)
(€)
Average
(Median)
(€)
2 hole
mixer
42.62 –
157.08 100
3 hole
mixer 125 – 379 252
Monobloc
mixer 8.00 – 475 241 7.90 – 355 181
Pillar Taps
(pair)
18.27 –
158.30 88
18.27 –
59.67 38.97
Typical prices for taps (units)
Showers
Range (Min – Max)
(€)
Average (Median)
(€)
1.50 – 82.80 42.15
Typical prices for showers (units)
Type of Tap/
Showerhead
Range (Min –
Max) (€)
Average
(Median) (€)
Infra Red Mixer Tap 269.48 –
480.75 375.12
Lever Taps (Pair) 43.84 – 74.28 59.06
Single Lever Mixer
Tap 89.20 – 624.68 356.94
Self closing single
taps 27.73 – 316.60 172.17
Showerheads (Wall
mounted/swivel
design) 33.49 – 132.33 82.91
Typical prices for non-domestic products (units)
• Factory price for taps: 25-30 € (average) • End user price for taps: 52€ (average in
France) • Min end user price for taps, showers and
showerheads: 15€
40 28 June 2013
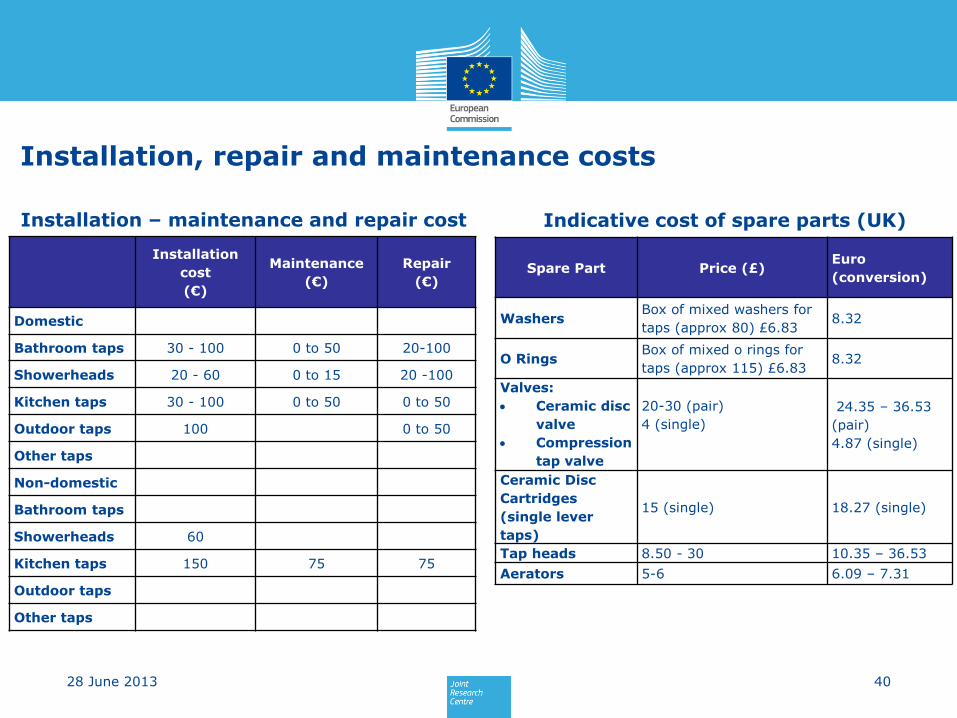
Installation, repair and maintenance costs
Installation
cost
(€)
Maintenance
(€)
Repair
(€)
Domestic
Bathroom taps 30 - 100 0 to 50 20-100
Showerheads 20 - 60 0 to 15 20 -100
Kitchen taps 30 - 100 0 to 50 0 to 50
Outdoor taps 100 0 to 50
Other taps
Non-domestic
Bathroom taps
Showerheads 60
Kitchen taps 150 75 75
Outdoor taps
Other taps
Installation – maintenance and repair cost
Spare Part Price (£) Euro
(conversion)
Washers Box of mixed washers for
taps (approx 80) £6.83 8.32
O Rings Box of mixed o rings for
taps (approx 115) £6.83 8.32
Valves:
Ceramic disc
valve
Compression
tap valve
20-30 (pair)
4 (single)
24.35 – 36.53
(pair)
4.87 (single)
Ceramic Disc
Cartridges
(single lever
taps)
15 (single) 18.27 (single)
Tap heads 8.50 - 30 10.35 – 36.53
Aerators 5-6 6.09 – 7.31
Indicative cost of spare parts (UK)

41 28 June 2013
Disposal Tariffs
• No information were found. However, it seems that this products are
usually recycled.
Gas and Electricity Prices
• Reference to Eurostat/MEErP
Water Prices
• Task 2 report for Ecodesing of Washing Machines considered an
average price of 3.7 Euro/m3 for household water supply and
sewage in Europe
• Alternatively, reference to Eurostat/MEErP
Interest and Inflation Rates • Reference to Eurostat/MEErP
42 28 June 2013
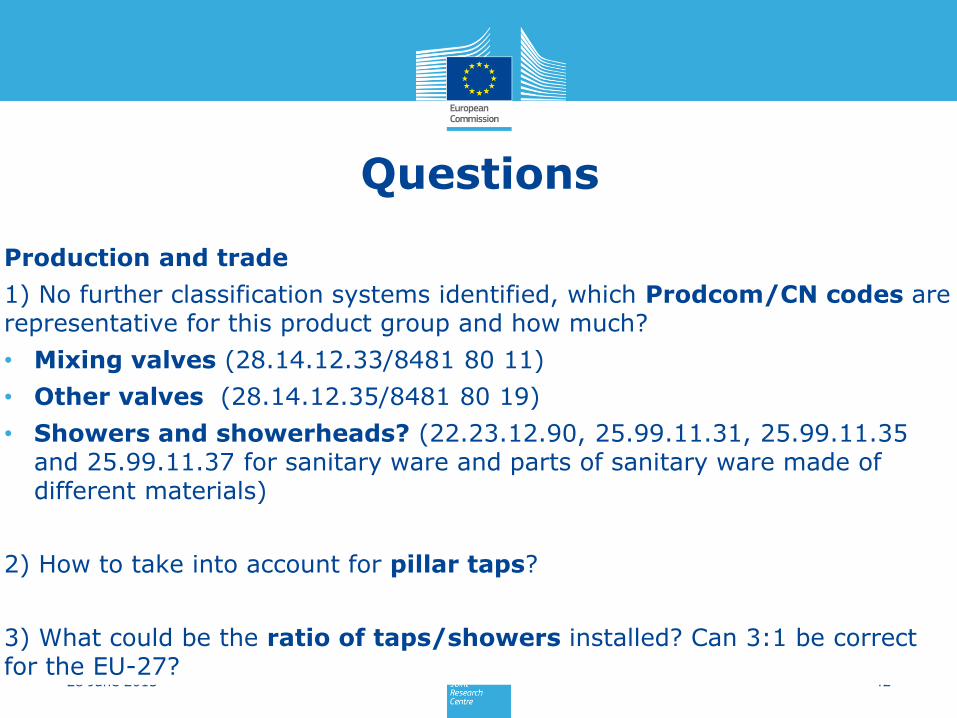
Questions
Production and trade
1) No further classification systems identified, which Prodcom/CN codes are representative for this product group and how much?
• Mixing valves (28.14.12.33/8481 80 11)
• Other valves (28.14.12.35/8481 80 19)
• Showers and showerheads? (22.23.12.90, 25.99.11.31, 25.99.11.35 and 25.99.11.37 for sanitary ware and parts of sanitary ware made of different materials)
2) How to take into account for pillar taps?
3) What could be the ratio of taps/showers installed? Can 3:1 be correct for the EU-27?

43 28 June 2013
4a) The average weight for taps was considered equal to 2.0 kg (range: 1.8-2.2).
• Is the average weight correct? Can you provide weight distribution range?
• Can a tap weight 0.8 kg?
4b) The average weight for showerheads was considered equal to 0.4 kg
• Is the average weight correct? Can you provide weight distribution range?
• Can you provide values for showers?
5) Some data on production, sales, trade and stock have been reported for France, the UK and for 2 companies. Do you have additional information at EU-27/Country level?

44 28 June 2013
6) Which is the share of overall taps and showers installed in non-domestic premises?
• Taps: 7% (stock-model) or 11-20%
• Showers: 11% (stock-model) or 4-10%
7) Which are the main market channels, the market structure and the major players (associations, large companies, share SMEs, employment)?
8) Can you revise/provide average costs/prices and range, possibly at
regional level, for:
a) Factory prices
b) End consumer prices
c) Installation, maintenance and repair
d) Consumables
e) Disposal tariffs.

Table of Contents
1. Questionnaire 2. Scope 3. Market analysis 4. Users and system aspects 5. Analysis of technologies 6. Environmental and economic assessment

• Water consumption and user behaviour
• Use, maintenance and End-of-Life
• Water supply and waste water treatment
• Affected energy system(s)
• Questions for stakeholders
USERS AND SYSTEM ASPECTS

Water consumption
In average:
• 173 L/person/day
• 75 L/person/day for taps
and showers
47 28 June 2013
Domestic water consumption in EU-27:
Non-domestic water consumption: very little information is available
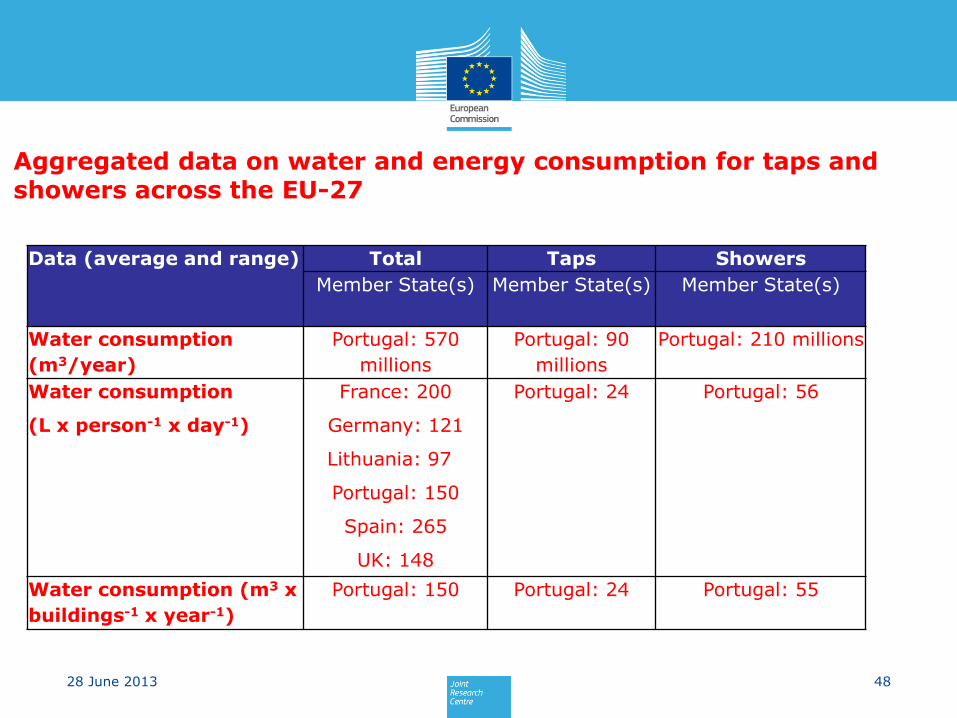
48 28 June 2013
Aggregated data on water and energy consumption for taps and showers across the EU-27
Data (average and range) Total Taps Showers
Member State(s) Member State(s) Member State(s)
Water consumption
(m3/year)
Portugal: 570
millions
Portugal: 90
millions
Portugal: 210 millions
Water consumption
(L x person-1 x day-1)
France: 200
Germany: 121
Lithuania: 97
Portugal: 150
Spain: 265
UK: 148
Portugal: 24 Portugal: 56
Water consumption (m3 x
buildings-1 x year-1)
Portugal: 150 Portugal: 24 Portugal: 55

49 28 June 2013
User behaviours
Calculation of total water use in taps & showers
domestic applications:
• 2.5 persons per household (Eco-design EuP Boilers Study)
• 76% of water used for taps and 24% for showers (Anglian100 project)
• 5 taps and 1.25 showers per household
• 10,402 litres per tap per year
• 13,140 litres per shower per year
non-domestic applications (IPTS Scoping Document, Feb 2010)
• Basin and kitchen taps: 3.6 billion m3/year
• For bathtub/showers: 0.7 billion m3/year
• Units of showerheads : units of bathtubs = 1:1
• 51,783 litres per tap per year
• 12,953 litres per shower per year
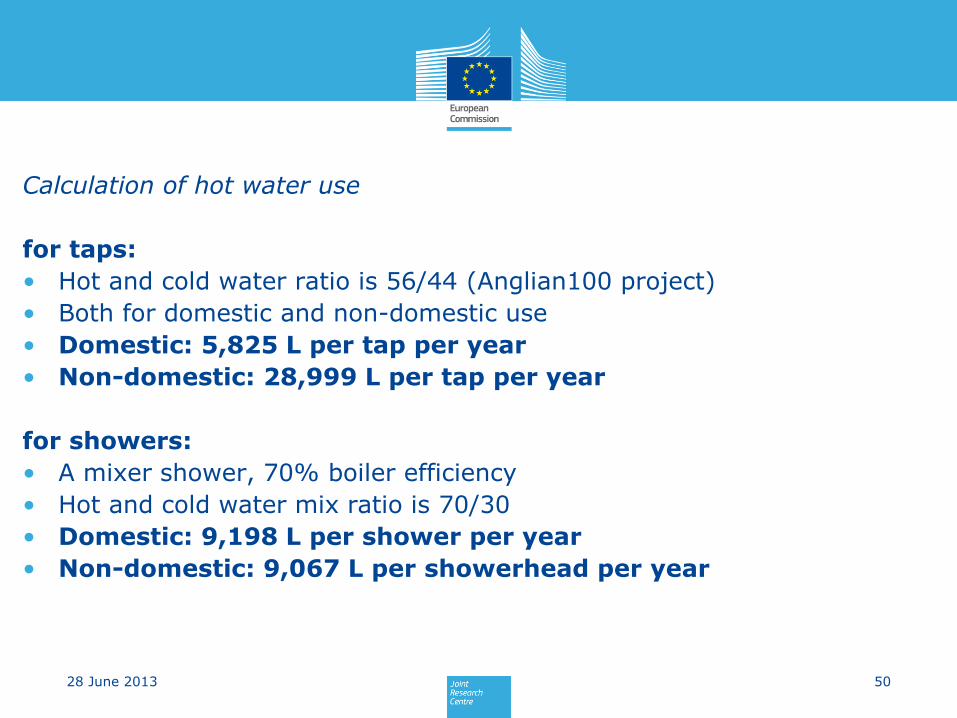
50 28 June 2013
Calculation of hot water use
for taps:
• Hot and cold water ratio is 56/44 (Anglian100 project)
• Both for domestic and non-domestic use
• Domestic: 5,825 L per tap per year
• Non-domestic: 28,999 L per tap per year
for showers:
• A mixer shower, 70% boiler efficiency
• Hot and cold water mix ratio is 70/30
• Domestic: 9,198 L per shower per year
• Non-domestic: 9,067 L per showerhead per year

51 28 June 2013
Water and energy consumption of products on the market
Product Water flow
(L/min)
Hot water av.
cons. (% of tot)
Average temp.
of hot water (ºC)
Kitchen tap
Bathroom tap (water efficient) 4.3-13 L/min
at 3 bar
Inlet water: 71.5ºC at 3 bar
Outlet water:
• 56-71.5ºC
• 14.6-45.8ºC (central position)
Showers (water efficient) 4.2-18.3 L/min
at 3 bar
• Inlet water: 36ºC at 0.1 bar; Outlet
water: 34.6-37ºC
• Inlet water: 42ºC at 0.1 bar; Outlet
water: 40.8-42ºC
Sink, pot or kettle filling tap 30-100 L/min 25% 60°C
Pre-rinse spray unit 12-15 L/min 75% 60°C
Additional sources of information: Standard figures are extractable from charts in EN 806 and DIN 1988
No information on:
• water consumption (L/person/day)
• electricity consumption (kWh/L)

52 28 June 2013
Description of user behaviour practices
Product Daily frequency of use
per person
(nr. use/person)
Average time for
each single use
(min)
Water wasted
due to wrong
user behaviour
practices
(% of water
used)
Water wasted
due to inherent
characteristics
of the system
(e.g. waiting for
hot-water)
(% of water
used)
Kitchen tap ? ? ?
Bathroom tap (*) 6 1 50%
Showers (*) 1 10 50%
Sink, pot or kettle filling
tap
3–4 times a day to cook a
meal
5- 10 min per
kettle filling
n/a n/a
Pre-rinse spray unit 10 times a day up to
permanent use
1 min per batch
for the dish
washing machine
n/a n/a
(*) estimations, no aggregated data for Portugal, Spain, Italy and Belgium
Positive influence of user guidance and water saving technologies without reducing comfort

53 28 June 2013
Examples of studies concerning user behaviour
• Finnish Environment Institute, HINKU report, Helsinki, 22 October 2012, showing that decrease of water consumption associated with electronic touchless faucets.
• Reports from Defra, Watwerwise, Environment Agency, WRc and Energy Saving Trust (UK)

Lifetime
54 28 June 2013
Real Lifetime (years)
Domestic (average) non-domestic (average)
Kitchen taps 5-20 (16) 5-20 (10)
Bathroom taps 5-20 (16) 5-20 (10)
Outdoor taps 10-30 (16) 5-20 (10)
Showers and showerheads 5-15 (10) 5-10 (7)

55 28 June 2013
• Problem of water scarcity in: South of Europe (Cyprus, Greece, Italy, Portugal, Spain); the UK.
• Water availability not an issue in: Austria, Germany and Switzerland
• Water distribution systems (Portugal)
End user: 150 L/person/day
Water supply efficiency: 75% (200L/person/day)
Wastewater to the treatment plant: 120 L/person/day (20% losses)
• Water purification (Portugal, small/medium cities)
Capacity: 95% population; 185 L/person/day
• Municipal wastewater treatment (Portugal, small/medium cities)
Capacity: 80% population; 150 L/person/day
Water supply and wastewater treatment
• Pipeline design, addition of water to eventually compensate reduced water flow (where needed)

Affected energy system(s)
56 28 June 2013
Energy for water heating with electric boilers:
• Inlet temperature: 60ºC, temperature increase: 55ºC
• 70% boiler efficiency
• 0.092 kWh/L
• Taps: 71ºC at 3 bar
• Showers: 36-42 ºC at 0.1 bar
Parameter Domestic Tap
Non Domestic
Tap
Domestic
Showerhead
Non Domestic
Showerhead
Electricity consumption
(kWh/year) (1)
536
(222-986)
2668 846
(350-1557)
834
Water consumption
(m3/year) (1)
10.4
(4.30-19.14)
51.8 13.14
(5.43-24.18)
12.95
(1) Range reported within brackets
• Reference to Ecodesing of water heaters (VHK, 2007)
• Heating 1 m3 of water = 1.1€ (solar panel) to 8€ (piped propane boiler)

57 28 June 2013
Related system in which energy is demanded
Sub-system Heat consumption
(MJ/L)
Electricity consumption
(kWh/L)
a) Water abstraction, impoundment, storage, treatment and distribution
232(1)
b) Water supply at the user c) Water heating 0.03(1)
d) Waste-water collection and treatment
227(1)
References:
(1) SILVA‐AFONSO, A.; RODRIGUES, F.; PIMENTEL‐RODRIGUES, C. – “Water efficiency in buildings: Assessment of its impact on energy efficiency and reducing GHG emissions” – Recent Researches in Energy & Environment (6th IASME/WSEAS International Conference on Energy & Environment – EE’11). Cambridge: WSEAS Press, 2011. ISSN 1792‐8230. ISBN 978‐960‐474-274‐5. pp. 191‐195.
58 28 June 2013
Questions
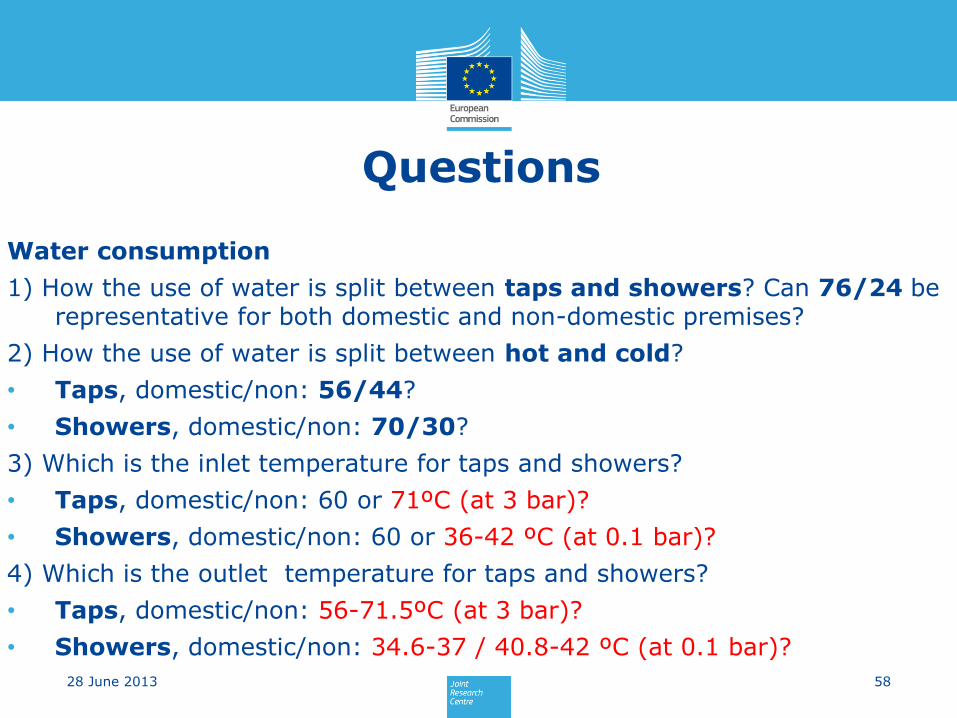
Water consumption
1) How the use of water is split between taps and showers? Can 76/24 be representative for both domestic and non-domestic premises?
2) How the use of water is split between hot and cold?
• Taps, domestic/non: 56/44?
• Showers, domestic/non: 70/30?
3) Which is the inlet temperature for taps and showers?
• Taps, domestic/non: 60 or 71ºC (at 3 bar)?
• Showers, domestic/non: 60 or 36-42 ºC (at 0.1 bar)?
4) Which is the outlet temperature for taps and showers?
• Taps, domestic/non: 56-71.5ºC (at 3 bar)?
• Showers, domestic/non: 34.6-37 / 40.8-42 ºC (at 0.1 bar)?

59 28 June 2013
User behaviour
5) Which are daily frequency of use, average time for single use and waste of water for the following applications?
• Kitchen taps?
• Bathroom taps: 6 use per person per day for 1 minute, 50% water wasted?
• Showers: 1 use per person per day for 10 minute, 50% water wasted?
6) Do you have any comments and/or additional information on the use of water in different products? (e.g. water flow, energy consumption)
7) Do you have any additional references on studies on the influence of user behaviour?

60 28 June 2013
Lifetime
8) Which are technical and real lifetime for taps and showers in domestic
and non-domestic premises?
Real lifetime:
• Taps domestic: average 16 years (range 5-30)?
• Taps non-domestic: 10 years (5-20)?
• Showers and showerheads domestic: 10 years (5-15)?
• Showers and showerheads non-domestic: 7 years (5-10)?
• Showers?
• Showerheads?
Technical lifetime declared?

61 28 June 2013
Water supply and waste water treatment
9) Do you have comments and/or information representative for other
countries than Portugal?
10) Do you have additional information on energy demand and costs
associated?
Water heating systems
11) Which heating systems are typically installed in different MSs?
12) Is it reference to VHK appropriate for boilers?
13) Do you have information on costs associated with heating? 1.1-8 €/m3
(solar panel - propane boiler)

Table of Contents
1. Questionnaire 2. Scope 3. Market analysis 4. Users and system aspects 5. Analysis of technologies 6. Environmental and economic assessment

ANALYSIS OF TECHNOLOGIES
• Information on conventional products • Water/energy saving technologies • Production, use, end-of-life • Questions for stakeholders
Information on conventional products
• Variety of designs, materials and functionality for taps and showers
• Taps designed for the pressure system they are to be used with
• Spindle vs. Ceramic disc taps
• Shower systems = showerhead + valve
• Design of new product lines every 2 years for domestic appliances
• Increasing number of water/energy-efficient taps and showers
64 28 June 2013

65 28 June 2013
Segmentation and expected trends in terms of water control devices • Single lever, single outlet
62% in France, market penetration increasing
25% in the UK , +3% expected over next five years
• Double lever, single outlet
10% in France, market penetration decreasing
43% in the UK , -2% expected over next five years
• Double outlet
0% in France, market penetration decreasing
30% in the UK , -2% expected over next five years
• Infrared sensors
1.8% in France, market penetration increasing
• Push button and non-manual controls
8% in France, market stable
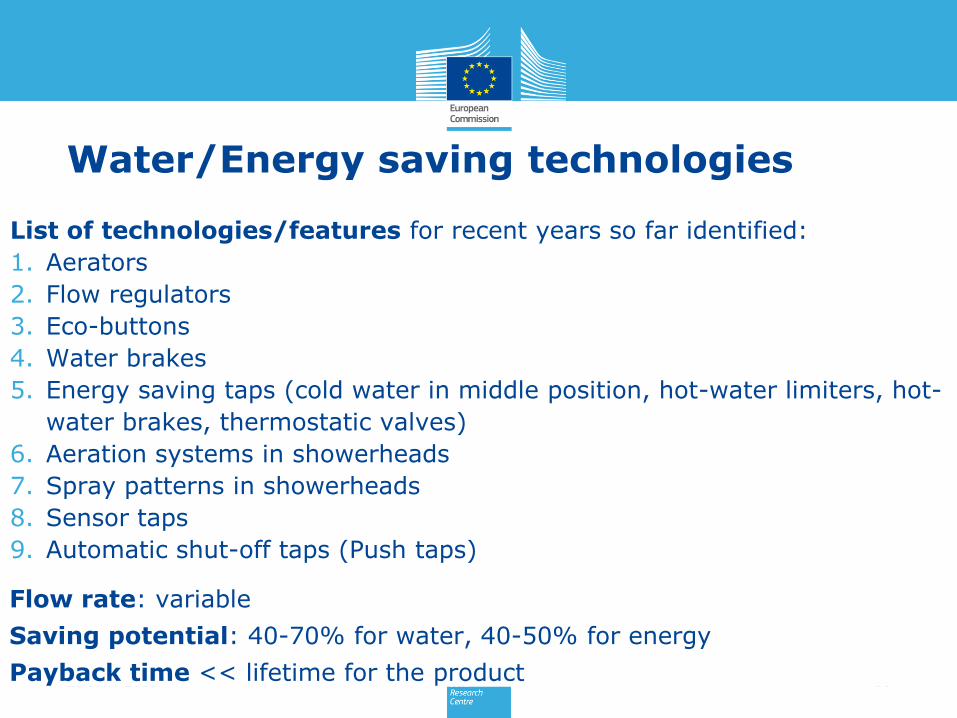
Water/Energy saving technologies
List of technologies/features for recent years so far identified:
1. Aerators
2. Flow regulators
3. Eco-buttons
4. Water brakes
5. Energy saving taps (cold water in middle position, hot-water limiters, hot-
water brakes, thermostatic valves)
6. Aeration systems in showerheads
7. Spray patterns in showerheads
8. Sensor taps
9. Automatic shut-off taps (Push taps)
66 28 June 2013
Flow rate: variable
Saving potential: 40-70% for water, 40-50% for energy
Payback time << lifetime for the product

Degree of diffusion
Taps Showers
Showerheads
Commonly used • Aerators (100% in France and for 1 global retailer; 75% for industrial kitchen in Germany)
• Automatic shut-off taps (8% France)
• Sensor taps (1.8% in France) • Water brake (100% for 1 global
retailer, 80% for 1 producer)
• Flow regulators
• Thermostatic taps for bath and showers (18-26% in France, increasing)
• Aerators
• Flow regulators
Innovative but not widely spread yet
• Aerators with flow switch option.
• Cold water in middle position
• Hot water brake (100% for 1 global retailer, 80% for 1 producer)
• Thermostatic taps for basin or kitchen (10% for industrial kitchen in Germany)
• Flow limiters (between showerhead and hose or between hose and bath tap)
• Flow switch
Still in pilot stage
• Electronic controlled kettle filling taps
67 28 June 2013
Identification of water and energy savings technologies

Flow Rate
(L/min)
Taps
(kitchen taps excluded)
Showers
1.7 3
3 3
3.5 2
4 21
4.7 35
5 67
6 36 2
8 19
9 2 5
12 N/A 1
68 28 June 2013
Key information but limited and diverging information
Number of products registered in the BMAs labelling scheme (updated at Sep 2011)
Segmentation and expected trends in terms of water flow rate
Water flow in L/min Taps (%) Showers (%)
Lowest maximum flow rate • 2-6 L/min • 4.5-6 L/min
Highest flow rate • 12-30 L/min
• 110 L/min in industrial kitchen taps
• > 30 L/min

69 28 June 2013
Expected trends and innovations: • Mixer taps over pillar taps
• Materials for ensuring hygiene quality standards
• Presence of more electronics (e.g. water saving programs or data
gathering)
• Increasing number of automatic taps and faucets in private households
• Using a shower as a wellness application
• Influence on aerator change and cleaning
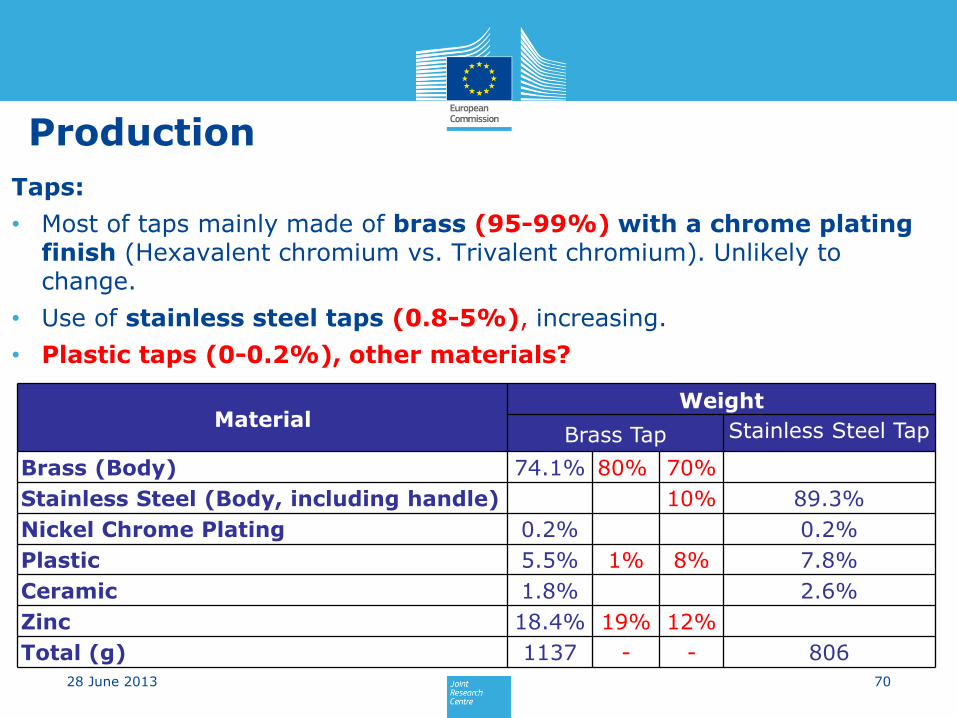
Production
Taps:
• Most of taps mainly made of brass (95-99%) with a chrome plating finish (Hexavalent chromium vs. Trivalent chromium). Unlikely to change.
• Use of stainless steel taps (0.8-5%), increasing.
• Plastic taps (0-0.2%), other materials?
70 28 June 2013
Material Weight
Brass Tap Stainless Steel Tap
Brass (Body) 74.1% 80% 70%
Stainless Steel (Body, including handle) 10% 89.3%
Nickel Chrome Plating 0.2% 0.2%
Plastic 5.5% 1% 8% 7.8%
Ceramic 1.8% 2.6%
Zinc 18.4% 19% 12%
Total (g) 1137 - - 806

Showers and showerheads
• A range of plastic and metals can be used for showers and showerheads
• The use of plastic is increasing.
• 100% of showers mainly made of brass in Germany (?)
• 5% of showerheads mainly made of brass and 95% of stainless steel in Germany (?)
71 28 June 2013
Material Weight
Plastic Showerhead Metal Shower
Brass (Body) 82.8% 80%
Nickel
Chrome
Plating
1.1% 0.1%
Plastic 98.9% 100% 17.1% 20%
Total (g) 179 - 2297 -

Product distribution
Limited information available on packaging and volume of the product
Default packaging dimensions/volume for purchased products are:
• Length: 38.5 cm;
• Width: 18 cm;
• Height: 13 cm;
• Volume: 9.009 L.
Taps and showers are predominately supplied in cardboard with smaller
amounts of plastic (e.g. LDPE bags).
72 28 June 2013

73 28 June 2013
Installation and Maintenance
• Product specific
• Influence on the durability of the products.
Examples on installation:
• Place of installation and cleaning cycles of kitchens have a big influence on
the durability of industrial taps.
• Parameters as temperature, hardness and velocity of water can have a
great influence on the installation.
Examples on maintenance:
• Aerator cleaning is usually made by the user
• Seals/Valve /Diverter/Thermostatic cartridge change done by the plumber
• Engineering services provided that repairs products as soon as these
present a problem.
• Some producers provide spare parts for repairing.

End-of-life practices
74 28 June 2013
• Taps and showers are usually collected by installers and recycled, due to
the value of their metal content.
• Increasing amount of waste separation at the source when disposed by
the user
• Metals and alloys can be extensively recycled. Indicatively, 90-95% of
brass-based products are recycled
• Few barriers: recycling of nickel-containing stainless steels and lead and
nickel containing copper alloys
• Landfill (or recycling?) is the most probable end-of-life scenario for plastic
showerheads

75 28 June 2013
Questions
Technical product description (information on performance, price, resources/emissions impact)
1) Is the list of technologies comprehensive or there are other technologies to include? water/energy saving, electronics, …
2) Do you have information on technical specifications for those technologies (e.g. technical description, water flow, saving potential, costs, payback time)?
3) Do you have information on barriers and opportunities associated with them?
4) Do you have information on their market penetration and trends?
5) Do you have information on the distribution of products in terms of water flow?
6) What is the typical design cycle for this product group? 2 years?
28 June 2013 76
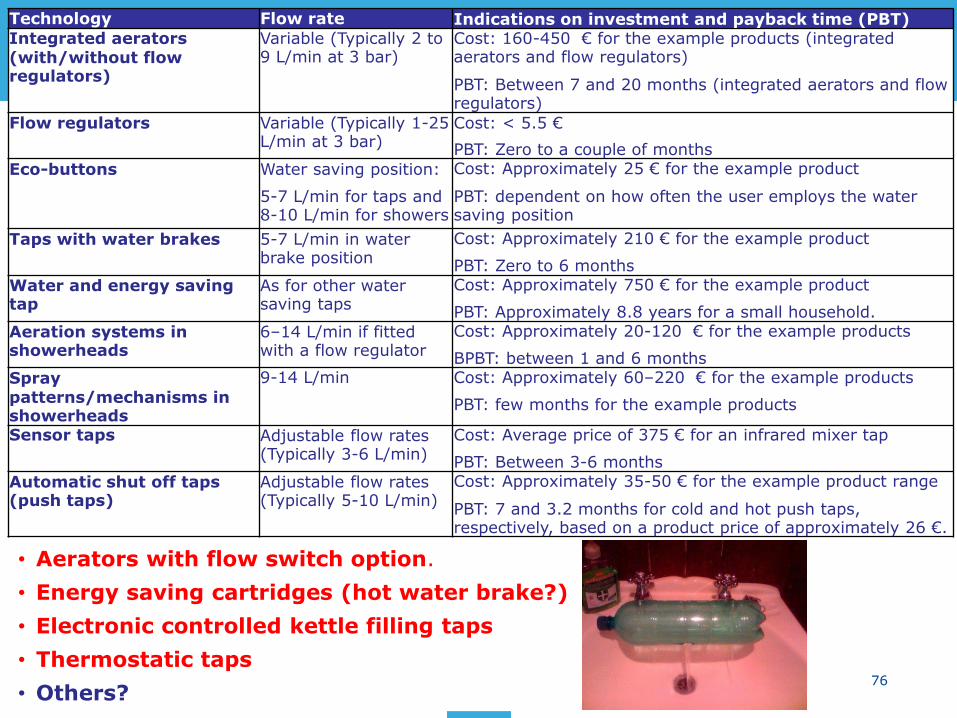
Technology Flow rate Indications on investment and payback time (PBT) Integrated aerators (with/without flow regulators)
Variable (Typically 2 to 9 L/min at 3 bar)
Cost: 160-450 € for the example products (integrated aerators and flow regulators)
PBT: Between 7 and 20 months (integrated aerators and flow regulators)
Flow regulators
Variable (Typically 1-25 L/min at 3 bar)
Cost: < 5.5 €
PBT: Zero to a couple of months Eco-buttons
Water saving position:
5-7 L/min for taps and 8-10 L/min for showers
Cost: Approximately 25 € for the example product
PBT: dependent on how often the user employs the water saving position
Taps with water brakes
5-7 L/min in water brake position
Cost: Approximately 210 € for the example product
PBT: Zero to 6 months Water and energy saving tap
As for other water saving taps
Cost: Approximately 750 € for the example product
PBT: Approximately 8.8 years for a small household. Aeration systems in showerheads
6–14 L/min if fitted with a flow regulator
Cost: Approximately 20-120 € for the example products
BPBT: between 1 and 6 months Spray patterns/mechanisms in showerheads
9-14 L/min Cost: Approximately 60–220 € for the example products
PBT: few months for the example products
Sensor taps Adjustable flow rates (Typically 3-6 L/min)
Cost: Average price of 375 € for an infrared mixer tap
PBT: Between 3-6 months Automatic shut off taps (push taps)
Adjustable flow rates (Typically 5-10 L/min)
Cost: Approximately 35-50 € for the example product range
PBT: 7 and 3.2 months for cold and hot push taps, respectively, based on a product price of approximately 26 €.
• Aerators with flow switch option.
• Energy saving cartridges (hot water brake?)
• Electronic controlled kettle filling taps
• Thermostatic taps
• Others?

77 28 June 2013
Production
7) Which is the market share of taps/showers/showerheads in terms
of main construction materials (brass, stainless steel, Zinc-Al alloys,
plastics)?
8) Which are average weights and compositions of
taps/showers/showerheads?
9) Can you provide BoM for example products, including products with
installed water/energy saving technologies?
10) Which plastics are used?
11) Which is the primary scrap production during sheet metal
manufacturing?
12) What is the amount of energy demanded and the amount of waste
produced during the product manufacturing?

78 28 June 2013
Distribution
13) Which materials are used for packaging and how much? Which is the
dimension of the packed product?
14) Which means of transport are employed in shipment of components,
sub-assemblies and finished products? For how long on average?
Installation/Maintenance
15) How installation and maintenance can affect durability?
16) Which product components and spare parts need to be replaced or
fixed before the end-of-life and how? Which are the costs associated?
End of Life
17) Which end-of-life scenarios (%) for taps, showers and showerheads?
18) Costs associated and incomes from recycling?
19) Which barriers to recycling and how these can be solved?

Table of Contents
1. Questionnaire 2. Scope 3. Market analysis 4. Users and system aspects 5. Analysis of technologies 6. Environmental and economic assessment

ENVIRONMENTAL AND ECONOMIC ASSESSMENT OF DESIGN OPTIONS
• EU Ecolabel case studies • MEEuP key results • Identification of scenarios • Next steps according to MEErP • Questions for stakeholders

EU Ecolabel case studies
Taps:
• Chrome-plated brass (most common product)
• Stainless steel (alternative option)
Showerheads:
• Metal
• Metal/Plastic
Domestic vs. Non-domestic applications
UK context
Examples still relevant but to be extended 81 28 June 2013

82 28 June 2013
Parameter Units Production Distribution Use End of Life Total
% of total % of total % of total % of total % of total
Total Energy (GER) MJ 0.06% 0.07% 99.86% 0.01% 100.00%
of which, electricity (in primary MJ) MJ 0.01% 0.00% 99.99% 0.00% 100.00%
Water (process) ltr 0.00% 0.00% 100.00% 0.00% 100.00%
Water (cooling) ltr 0.01% 0.00% 99.99% 0.00% 100.00%
Waste, non-haz./ landfill g 2.79% 0.05% 97.09% 0.07% 100.00%
Waste, hazardous/ incinerated g 0.05% 0.05% 96.96% 2.90% 100.00%
Emissions (Air)
Greenhouse Gases in GWP100 kg CO2 eq. 0.08% 0.13% 99.80% 0.00% 100.00%
Ozone Depletion, emissions mg R-11 eq. neg
Acidification, emissions g SO2 eq. 0.16% 0.06% 99.78% 0.00% 100.00%
Volatile Organic Compounds (VOC) g 0.00% 0.00% 100.00% 0.00% 100.00%
Persistent Organic Pollutants (POP) ng i-Teq 5.74% 0.00% 94.26% 0.00% 100.00%
Heavy Metals mg Ni eq. 5.37% 0.18% 94.33% 0.12% 100.00%
PAHs Mg Ni eq. 1.63% 1.63% 96.20% 0.00% 100.00%
Particulate Matter (PM, dust) g 0.37% 5.75% 91.84% 2.04% 100.00%
Emissions (Water)
Heavy Metals mg Hg/20 1.36% 0.00% 98.64% 0.17% 100.00%
Eutrophication g PO4 0.00% 0.00% 100.00% 0.00% 100.00%
Persistent Organic Pollutants (POP) ng i-Teq neg neg neg neg neg
Results for brass tap (domestic use)
83
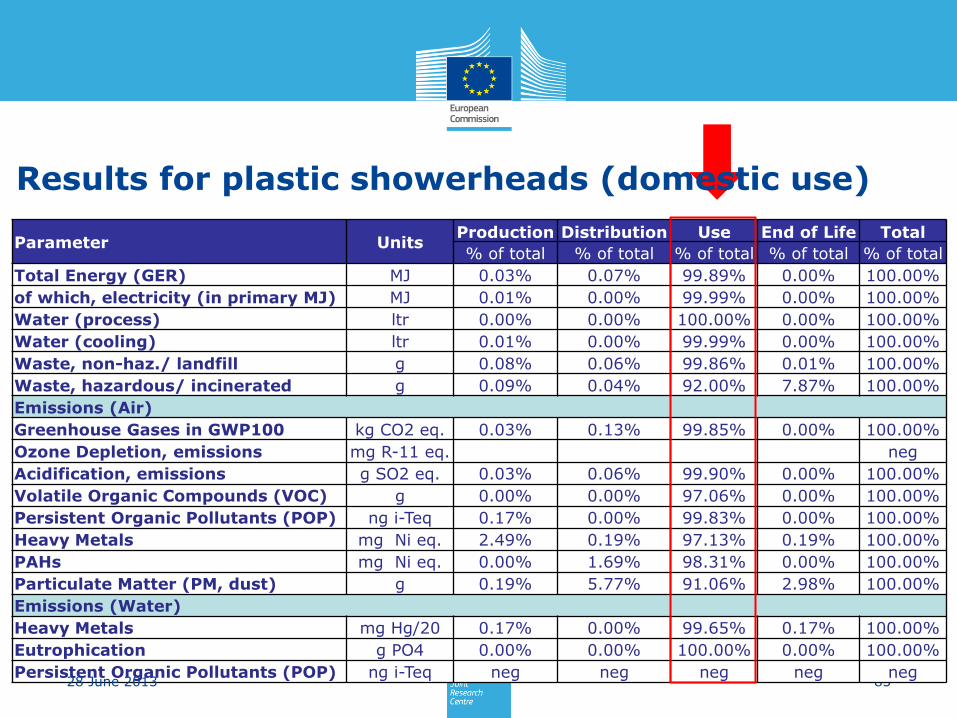
Parameter Units Production Distribution Use End of Life Total
% of total % of total % of total % of total % of total
Total Energy (GER) MJ 0.03% 0.07% 99.89% 0.00% 100.00%
of which, electricity (in primary MJ) MJ 0.01% 0.00% 99.99% 0.00% 100.00%
Water (process) ltr 0.00% 0.00% 100.00% 0.00% 100.00%
Water (cooling) ltr 0.01% 0.00% 99.99% 0.00% 100.00%
Waste, non-haz./ landfill g 0.08% 0.06% 99.86% 0.01% 100.00%
Waste, hazardous/ incinerated g 0.09% 0.04% 92.00% 7.87% 100.00%
Emissions (Air)
Greenhouse Gases in GWP100 kg CO2 eq. 0.03% 0.13% 99.85% 0.00% 100.00%
Ozone Depletion, emissions mg R-11 eq. neg
Acidification, emissions g SO2 eq. 0.03% 0.06% 99.90% 0.00% 100.00%
Volatile Organic Compounds (VOC) g 0.00% 0.00% 97.06% 0.00% 100.00%
Persistent Organic Pollutants (POP) ng i-Teq 0.17% 0.00% 99.83% 0.00% 100.00%
Heavy Metals mg Ni eq. 2.49% 0.19% 97.13% 0.19% 100.00%
PAHs mg Ni eq. 0.00% 1.69% 98.31% 0.00% 100.00%
Particulate Matter (PM, dust) g 0.19% 5.77% 91.06% 2.98% 100.00%
Emissions (Water)
Heavy Metals mg Hg/20 0.17% 0.00% 99.65% 0.17% 100.00%
Eutrophication g PO4 0.00% 0.00% 100.00% 0.00% 100.00%
Persistent Organic Pollutants (POP) ng i-Teq neg neg neg neg neg 28 June 2013
Results for plastic showerheads (domestic use)

• Ecoreport tool updated from MEEuP to MEErP
• Hot-spot = use phase
• Except water consumption, 90-100% energy
• LCC (not shown here): 244-1193 € per product can be saved over its
lifetime with only water saving measures
• Key importance of product technologies and user practices
• Other parameters: boiler types and efficiency and product lifetime,
weight and composition
84 28 June 2013
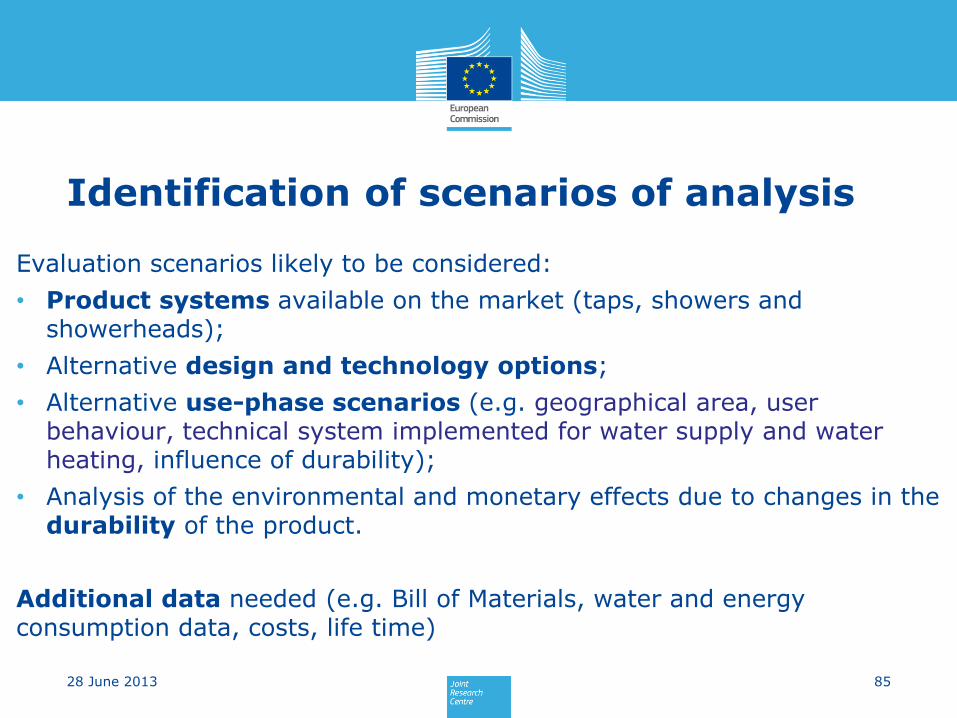
Identification of scenarios of analysis
85 28 June 2013
Evaluation scenarios likely to be considered:
• Product systems available on the market (taps, showers and showerheads);
• Alternative design and technology options;
• Alternative use-phase scenarios (e.g. geographical area, user behaviour, technical system implemented for water supply and water heating, influence of durability);
• Analysis of the environmental and monetary effects due to changes in the durability of the product.
Additional data needed (e.g. Bill of Materials, water and energy consumption data, costs, life time)
86 28 June 2013
Questions
Definition of base cases and design/scenarios options
1. Which products proposed to evaluate as base cases?
2. Which technology/design options proposed to evaluate?
3. Which scenarios of analysis proposed to evaluate? (e.g. heating systems)

Barcelona, 27 June 2013
Kick-off meeting for the MEErP preparatory study on
Taps and Showers
THANKS FOR YOUR ATTENTION