joint staff report concerning commercial seasons
TRANSCRIPT
2009 JOINT STAFF REPORT CONCERNING
STOCK STATUS AND FISHERIES FOR STURGEON AND SMELT
Joint Columbia River Management Staff
Oregon Department of Fish and Wildlife Washington Department of Fish and Wildlife
December 9, 2008

TABLE OF CONTENTS INTRODUCTION .......................................................................................................................... 4 THE COMPACT ............................................................................................................................ 4 STURGEON MANAGEMENT AND FISHERIES DOWNSTREAM FROM BONNEVILLE
DAM .................................................................................................................................... 4 Stock Status .....................................................................................................................................4 Fishery Management Actions ..........................................................................................................5
Past Management Actions ..................................................................................................... 6 Washington and Oregon White Sturgeon Management Agreements .................................... 6 Adjustments for Harvest Outside the Mainstem Columbia River ....................................... 10
Sturgeon Fisheries..........................................................................................................................11 Past Commercial Sturgeon Fisheries ................................................................................... 11 2008 Commercial Fishery.................................................................................................... 11 Past Recreational Sturgeon Fisheries................................................................................... 14 2008 Recreational Sturgeon Fishery.................................................................................... 15
Above Wauna (non-Estuary) ......................................................................................... 15 Below Wauna (Estuary)................................................................................................. 16 Summary of 2008 Recreational Harvest ........................................................................ 16
2009 Non-Indian Sturgeon Fisheries Expectations .......................................................................17 Commercial Fisheries .......................................................................................................... 17 Recreational Fisheries.......................................................................................................... 17
STURGEON MANAGEMENT AND FISHERIES UPSTREAM FROM BONNEVILLE DAM.. ................................................................................................................................... 18
Stock Status ...................................................................................................................................18 Fishery Management Actions ........................................................................................................18 Sturgeon Fisheries..........................................................................................................................19
2008 Fisheries ...................................................................................................................... 19 2008 Setline Fisheries .......................................................................................................... 19 2008 Gillnet Fishery ............................................................................................................ 19 2008 Subsistence Fishery..................................................................................................... 19 2008 Recreational Fishery ................................................................................................... 20
2009 Zone 6 Sturgeon Fisheries Expectations...............................................................................20 SMELT MANAGEMENT AND FISHERIES ............................................................................. 21 Stock Status ...................................................................................................................................21
Adult Returns ....................................................................................................................... 21 Juvenile Production.............................................................................................................. 22 Ocean Survival..................................................................................................................... 22
Smelt Fishery Management ...........................................................................................................23 Washington and Oregon Eulachon Management Plan ........................................................ 24
Smelt Fisheries...............................................................................................................................25 Past Commercial and Recreational Fisheries....................................................................... 25 2008 Commercial Fisheries ................................................................................................. 26 2008 Recreational Fisheries................................................................................................. 26
2009 Smelt Fishery Expectations ..................................................................................................26
1

ENDANGERED SPECIES ACT (ESA)....................................................................................... 27 Salmon and Steelhead ....................................................................................................................27 Eulachon Smelt ..............................................................................................................................27 Green Sturgeon ..............................................................................................................................27 Marbled Murrelet ...........................................................................................................................28
2
LIST OF TABLES Table 1. Estimated Abundance of 42-60 Inch White Sturgeon in the Lower Columbia River, 1987-2007. .................................................................................................................................... 29 Table 2. Annual Recreational Catches of White Sturgeon in the Lower Columbia River and Comparisons to Catch Guidelines, 1993-2008. ............................................................................ 29 Table 3. Summary of Recreational White Sturgeon Management Guidelines and Harvest, 2003-2008. .................................................................................................................................... 30 Table 4. Commercial Catch of White Sturgeon by Season, Annual Commercial Catch, and Comparisons to Catch Guidelines, 1993-2008. ........................................................................... 31 Table 5. Summary of Combined Recreational and Commercial White Sturgeon Harvest, 1997-2008. ................................................................................................................................... 31 Table 6. Fishing Periods, Gear, and Associated Sturgeon Catch for Mainstem Columbia River Commercial Seasons, 2008........................................................................................................... 32 Table 7. History of Sturgeon Regulations for the Lower Columbia River Recreational Fishery. . ...................................................................................................................................... 33 Table 8. Estimated Catch of White Sturgeon (in 1000's) in 1-Foot Legal Length Groups in Mainstem Lower Columbia River Commercial and Recreational Fisheries, 1977-2008............. 34 Table 9. Recreational and Commercial Sturgeon Catch (in 1,000’s) and White Sturgeon Catch Sharing Percentages in the Lower Columbia River, 1977-2008. ................................................. 35 Table 10. Annual 3-6 Foot Abundance Estimates by Reservoir in the Zone 6, 1976-2007......... 36 Table 11. Treaty Indian Commercial and Subsistence, and Non-Indian Recreational Catch of White Sturgeon Zone 6 (1000's of fish), 1999-2008. ................................................................... 36 Table 12. Treaty Indian Commercial Setline and Gill Net Seasons and White Sturgeon Catch in Zone 6, 2004-2008. ....................................................................................................................... 37 Table 13. Recreational Fishery Retention Restrictions in Zone 6, 1999-2008. ........................... 38 Table 14. Annual Catch Estimates and Guidelines for Commercial and Recreational Fisheries in the Zone 6, 1999-2008. ................................................................................................................ 38 Table 15. Treaty Indian Season Specific Landings by Pool and Associated Catch Guidelines, 2008. ...................................................................................................................................... 39 Table 16. Columbia River and Tributary Smelt Commercial Landings (in thousands of pounds), 1938-2008. .................................................................................................................................... 39 Table 17. Weekly and Total Smelt CPUE's and Smelt Catch in Columbia River Commercial Fisheries, 1988-2008..................................................................................................................... 40 Table 18. Results of Larval Sampling Program in the Lower Columbia River Basin, 1986-2008. .................................................................................................................................... 40 Table 19. Age Composition of Eulachon Bycatch in the West Vancouver Island Shrimp Fishery, 1999-2008. .................................................................................................................................... 41 Table 20. Mainstem Columbia River Commercial Smelt Seasons, 1960-2008. .......................... 42 Table 21. Washington and Oregon Tributary Commercial Smelt Seasons, 2000-2008. ............. 43 Table 22. Lower Columbia River Basin Recreational Smelt Seasons, 1960-2008. ..................... 44
3
INTRODUCTION
This report describes sturgeon and smelt fisheries in the mainstem Columbia River and includes summaries of stock status, current management plans and guidelines, and past management actions and strategies. Additionally, this report contains information concerning smelt abundance and fisheries in Columbia River tributaries. This report is part of an annual series produced by the Joint Columbia River Management Staff of the Oregon Department of Fish & Wildlife (ODFW) and Washington Department of Fish & Wildlife (WDFW) prior to each major Columbia River Compact/Joint State hearing. The hearing for 2009 sturgeon and smelt management will begin at 10 AM, Thursday December 18, 2008 at the Cowlitz County Historical Museum, 405 Allen Street, Kelso, Washington. Members of the US v Oregon Technical Advisory Committee (TAC) have reviewed this report.
THE COMPACT
The Columbia River Compact is charged by congressional and statutory authority to adopt seasons and rules for Columbia River commercial fisheries. In recent years, the Compact has consisted of the Oregon and Washington agency directors, or their delegates, acting on behalf of the Oregon Fish and Wildlife Commission (OFWC) and the Washington Fish and Wildlife Commission (WFWC). In addition, the Columbia River treaty tribes have authority to regulate treaty Indian fisheries. When addressing commercial seasons for Columbia River fisheries, the Compact must consider the effect of the commercial fishery on escapement, treaty rights, and the impact on species listed under the Endangered Species Act (ESA). Working together under the Compact, the states have the responsibility to address the allocation of limited resources between recreational, commercial and treaty Indian fishers. This responsibility has become increasingly demanding in recent years. The states maintain a conservative management approach when considering Columbia River fisheries that will affect species listed under the ESA.
STURGEON MANAGEMENT AND FISHERIES DOWNSTREAM FROM BONNEVILLE DAM
Stock Status
Sturgeon abundance in the lower Columbia River collapsed at the end of the 19th century due to over fishing and remained depressed through the first half of the 20th century. The population began to rebound only after the adoption of management actions aimed at reducing overall harvest and protecting broodstock, particularly the 6-foot maximum size limit regulation. Since that time, white sturgeon abundance in the lower Columbia River has increased significantly and the population is considered healthy. Joint state tagging and recovery programs were initiated in 1986 to provide data necessary to estimate the annual abundance of white sturgeon inhabiting the lower Columbia River. Abundance estimates, based on tagging conducted in one year and mark sampling extending into the following year, have been produced since 1987 with the exception of 1994 and 2004 (the estimates are referred to by the year of tagging). Abundance estimates for harvestable size fish (42-60 inches total length 1) 1 References to sturgeon length are in total length (inches) unless otherwise noted.
4

steadily increased from 1991 through 1995, then declined through 2002 before increasing in 2003 and 2005 (Table 1). The estimates since 1998 have been of similar magnitude, ranging between 121,600-140,700 fish, suggesting that the harvestable-size population has remained relatively stable over this period. The estimate of 131,700 fish for 2007 is very close to the 1998-2006 average of 131,300 fish. Numbers of 42-inch to 48-inch white sturgeon declined from an average of 126,900 fish for 1996-2000 to an average of 95,400 fish for 2001-2007, while the number of fish between 48 and 60 inches increased from an average of 24,000 fish for 1996-2000 to 33,300 fish for 2001-2007 (Table 1). An alternative indicator of legal-size abundance, harvest per angler trip in recreation fisheries, has remained relatively stable since 1995. An increase in harvest per angler trip in estuary and gorge fisheries has been countered by a decrease in harvest per trip in the mid-river area. Contrary to the stable trend in harvestable-size fish, catch per angler trip of sublegal (<42 inches) white sturgeon has decreased annually since 2004 following eight years of mostly steady increases and is viewed as a harbinger of future recruitment trends. A new and growing threat to white sturgeon population stability has been losses from predation by sea lions, especially losses of broodstock-size white sturgeon to Steller sea lion predation. Observers for the U.S. Army Corps of Engineers report a steady increase in the number of Steller sea lions at Bonneville Dam, from zero animals in 2002 to seventeen animals by 2008. Observations of predation of broodstock-size fish by WDFW and ODFW employees in the vicinity of Beacon Rock peaked during December 2005 through March 2006, with over 50 kills reported. Activity decreased following initiation of a hazing program in March 2006 that successfully moved the Steller sea lions out of the area by early April. Hazing was initiated again in February 2007 and December 2008, however, these efforts were not as effective as in 2006. Crews were able to distract individuals from feeding, but they were not successful in driving them from the gorge. Hazing is scheduled for January-February 2009. Predation on smaller white sturgeon throughout the river by both Steller and California sea lions also appears to be increasing in frequency based on observations by staff and reports from anglers and commercial fishers. Loss of juvenile fish to predation may be impacting sub-legal-size abundance and recruitment to fisheries. Loss of broodstock fish is expected to lead to lower population productivity and eventual reduced recruitment to fisheries. In 2008, ODFW initiated a process designed to develop an Oregon White Sturgeon Management and Conservation Plan (WSMCP) for the lower Columbia River. WDFW staff has been involved in this process. Concurrent with ODFW’s effort, WDFW is developing of a Comprehensive Statewide White Sturgeon Management Plan (CSWSMP) for Washington state waters. The intent is for both plans to be complimentary in addressing lower Columbia River white sturgeon management. The Oregon WSMCP will examine factors and threats that are limiting the abundance and productivity of lower Columbia River white sturgeon and identify critical unknowns and data gaps pursuant to these factors and threats. Population goals and objectives will be refined and strategies and actions will be developed to address the limiting factors and threats. A preliminary draft of the WSMCP is due to be completed in April 2009.
Fishery Management Actions
Sturgeon fishery management focused on the commercial fishery during the early 1900's and expanded to encompass recreational fisheries beginning in 1940. Regulations for recreational and
5

commercial fisheries became increasingly restrictive and complex as the popularity and importance of sturgeon as a target species increased for both fisheries.
Past Management Actions
Sturgeon management actions were initiated in 1899 with the adoption of a 4-foot minimum size limit for commercially-landed sturgeon. During 1899-1908, commercial sturgeon sales were prohibited and beginning in 1909, commercial sturgeon sales were only allowed during salmon seasons. Between 1940 and 1989, fishery management actions primarily consisted of modifying catch limits for the recreational fishery and legal size restrictions for recreational and commercial fisheries. Most notable was the adoption of a 6-foot (72-inch) maximum size limit regulation in 1950. The purpose of the maximum size limit restriction was to protect broodstock and aid recovery of the Columbia River white sturgeon population. Additionally, commercial sturgeon setline seasons established in 1975 were replaced by target sturgeon gillnet seasons during 1983-1988. Since 1989, lower Columbia River white sturgeon fisheries have been managed for optimum sustained yield (OSY). This management strategy is intended to optimize harvest while allowing for the continued rebuilding of the white sturgeon population. Significant management actions taken during 1985-1996 to restrict catch rates to sustainable levels included (1) increasing the minimum size limit in recreational fisheries, (2) reducing the maximum size limit in all fisheries, (3) reducing daily and annual catch limits for recreational fisheries, and (4) adopting annual catch guidelines for commercial fisheries. In 1985, recreational regulations allowed for a daily catch limit of three fish between 36 and 72 inches with no annual catch limit. Recreational catches dropped from a peak of 62,400 fish in 1987 to a low of 17,300 fish in 1990, primarily due to angling regulation changes. During the same period, commercial catches also dropped from a peak of 11,600 fish in 1986 to a low of 3,800 fish in 1991, due to reductions in fishing opportunities. The maximum size limit for all white sturgeon fisheries was reduced from 72 inches to 66 inches in 1993. In 1996, recreational regulations were further restricted with a daily catch limit of one fish between 42 and 66 inches and a ten fish annual catch limit. The maximum size limit for both fisheries was reduced from 66 inches to 60 inches in 1997. These regulation changes culminated in adoption of Washington Fish and Wildlife Commission (WFWC) policy C-3001 on Lower Columbia Sturgeon Management and in a series of three-year Joint State Management Agreements (Accords) between Washington and Oregon that have guided Columbia River sturgeon management since 1997. Table 7 describes sport regulation milestones and seasons.
Joint State White Sturgeon Management Agreements
The Joint State agreements have contained a variety of fishery regulations including (1) size limits for recreational and commercial fisheries, (2) daily and annual catch limits for recreational anglers (3) gear restrictions for recreational and commercial fisheries, and (4) the allowance of target sturgeon seasons in the commercial fishery. The cornerstone of the agreement is the adoption of a three-year average harvestable number to ensure that harvest does not exceed what is sustainable. This harvestable number has been allocated 80% for recreational fisheries and 20% for commercial fisheries since 1997. The tenets of the agreements also allowed for modifications if new information suggested that a change was warranted. Since adoption of the first sturgeon agreement, additional management actions have been necessary. Abundance did not increase as expected during the first two years of
6
the agreement, and based on this new information, the annual harvestable number was reduced from 67,300 white sturgeon to 50,000 fish for 1999 fisheries. The ODFW and WDFW also adopted a no-fishing sanctuary just downstream from Bonneville Dam in 1996 to protect spawning white sturgeon. A boat-based catch-and-release fishery targeting over-legal size (oversize) fish had been intensifying in this area since 1990. Angling for sturgeon from boats was prohibited during May and June within this sanctuary, which extended 4.5 miles downstream to Beacon Rock. In 2000, this closure was extended through mid-July to provide additional protection to the broodstock population. In December 2002, the WFWC and OFWC (Commissions) established sturgeon management protocol to help guide the development of recreational and commercial fisheries during 2003-2005. Due to the declining trend in abundance, the Commissions adopted a reduction in the harvestable number from 50,000 fish to 40,000 fish for 2003-2005. The harvest allocation was 32,000 fish for the recreational fishery and 8,000 fish for the commercial fishery. This reduction generated a conflict in season-shaping preferences among competing recreational interests for the areas downstream (estuary) and upstream (non-estuary) of the Wauna powerline crossing at River Mile 40. In addressing this issue, the Commissions differed on how to allocate the 32,000 fish recreational share, with the OFWC favoring a sharing formula that assigned 58% of the catch to the estuary fishery, while the WFWC favored a formula that assigned 65% of the catch to the estuary fishery. In response, the Director’s of ODFW and WDFW agreed to a one-year recreational fishery management package for 2003, while pursuing concurrence for the remaining two years. The one-year agreement allotted 60% of the recreational share to the estuary fishery and 40% to the non-estuary fishery. In early 2004, the Director’s agreed to maintain the 2003 estuary/non-estuary sharing formula through 2005. Work with the Columbia River Recreational Fisheries Advisory Group (CRRAG) had established that goals tended to differ for those who participated in the estuary fishery compared to those who participated in the non-estuary fishery. Proponents of the non-estuary fishery above the Wauna powerlines emphasized the importance of providing retention opportunity throughout as much of the year as possible and placed a special emphasis on the spring and fall timeframes. A days-per-week approach was adopted to achieve this, with retention allowed on Thursdays, Fridays, and Saturdays, and catch–and-release allowed on non-retention days. Retention was prohibited during August and September to insure that the annual harvest guideline lasted through the fall timeframe. Proponents of the estuary fishery emphasized the importance of providing retention opportunity seven days per week, and in achieving a retention season that lasted at least through July 4. To achieve this, the minimum size limit for this area was increased to 45 inches after April 2004 to slow catch rates in the estuary and prolong the retention season. Other changes to recreational fishery regulations enacted during 2004-2005 included reducing the annual limit from ten fish to five fish, requiring anglers to use one single-point barbless hook, and adoption of additional measures designed to protect broodstock white sturgeon. The duration of the fishing prohibition within the spawning sanctuary was extended through July, and the bank fishery was incorporated into the closure. Washington adopted a regulation extending the sanctuary boundary an additional 1.6 miles further downstream to U.S Coast Guard (USCG) Navigation Marker 85. Oregon did not adopt this change, and Washington rescinded the regulation in order to maintain concurrence with Oregon. Instead, the Joint State Agreement was modified to include a “Best Fishing Practices” program that identified angling practices designed to maximize post-release survival rates in the oversize catch-and-release fishery.
7
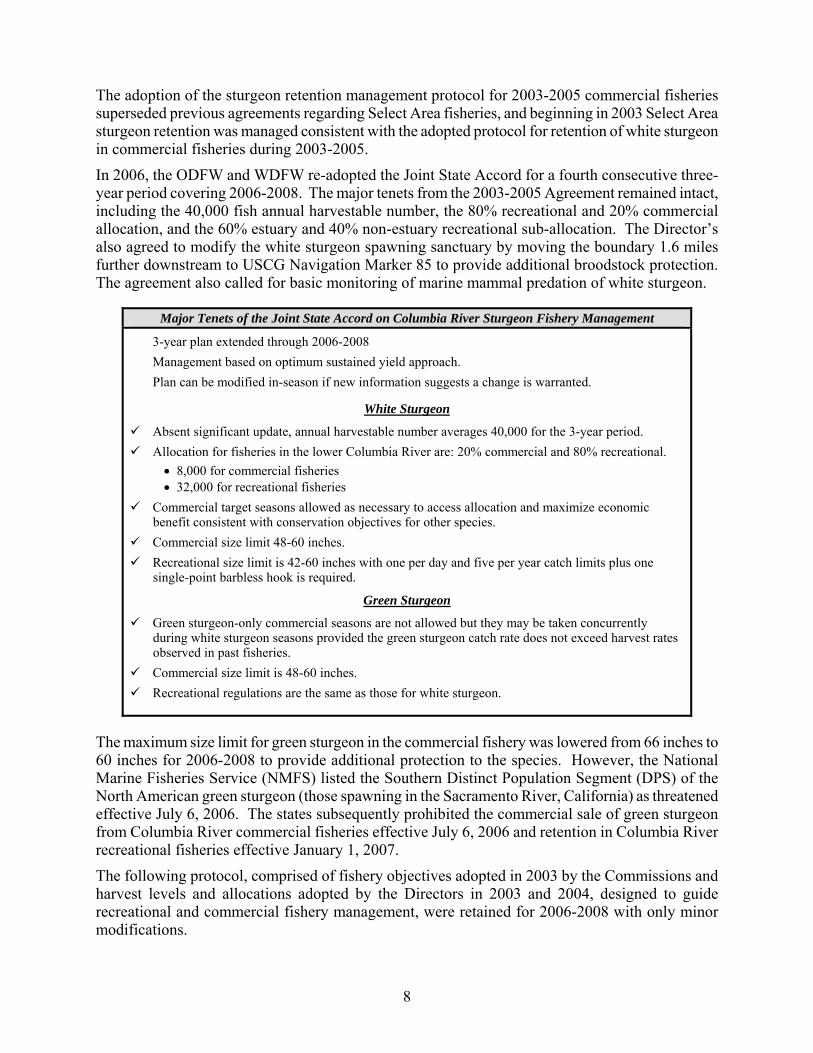
The adoption of the sturgeon retention management protocol for 2003-2005 commercial fisheries superseded previous agreements regarding Select Area fisheries, and beginning in 2003 Select Area sturgeon retention was managed consistent with the adopted protocol for retention of white sturgeon in commercial fisheries during 2003-2005. In 2006, the ODFW and WDFW re-adopted the Joint State Accord for a fourth consecutive three-year period covering 2006-2008. The major tenets from the 2003-2005 Agreement remained intact, including the 40,000 fish annual harvestable number, the 80% recreational and 20% commercial allocation, and the 60% estuary and 40% non-estuary recreational sub-allocation. The Director’s also agreed to modify the white sturgeon spawning sanctuary by moving the boundary 1.6 miles further downstream to USCG Navigation Marker 85 to provide additional broodstock protection. The agreement also called for basic monitoring of marine mammal predation of white sturgeon.
Major Tenets of the Joint State Accord on Columbia River Sturgeon Fishery Management
3-year plan extended through 2006-2008 Management based on optimum sustained yield approach. Plan can be modified in-season if new information suggests a change is warranted.
White Sturgeon
Absent significant update, annual harvestable number averages 40,000 for the 3-year period. Allocation for fisheries in the lower Columbia River are: 20% commercial and 80% recreational.
• 8,000 for commercial fisheries • 32,000 for recreational fisheries
Commercial target seasons allowed as necessary to access allocation and maximize economic benefit consistent with conservation objectives for other species.
Commercial size limit 48-60 inches. Recreational size limit is 42-60 inches with one per day and five per year catch limits plus one
single-point barbless hook is required.
Green Sturgeon
Green sturgeon-only commercial seasons are not allowed but they may be taken concurrently during white sturgeon seasons provided the green sturgeon catch rate does not exceed harvest rates observed in past fisheries.
Commercial size limit is 48-60 inches. Recreational regulations are the same as those for white sturgeon.
The maximum size limit for green sturgeon in the commercial fishery was lowered from 66 inches to 60 inches for 2006-2008 to provide additional protection to the species. However, the National Marine Fisheries Service (NMFS) listed the Southern Distinct Population Segment (DPS) of the North American green sturgeon (those spawning in the Sacramento River, California) as threatened effective July 6, 2006. The states subsequently prohibited the commercial sale of green sturgeon from Columbia River commercial fisheries effective July 6, 2006 and retention in Columbia River recreational fisheries effective January 1, 2007. The following protocol, comprised of fishery objectives adopted in 2003 by the Commissions and harvest levels and allocations adopted by the Directors in 2003 and 2004, designed to guide recreational and commercial fishery management, were retained for 2006-2008 with only minor modifications.
8

Protocol for Regulations Regarding White Sturgeon Retention in Recreational Fisheries During 2006-2008.
Fishery Objectives
Minimize emergency in-season action.
Balance catch between estuary and non-estuary and maintain diverse recreational fishing opportunities.
Maintain fishery monitoring and management capabilities.
Catch Guideline and Allocation
Manage recreational fisheries for a 30,000 fish catch to provide a 2,000 fish buffer for management flexibility and to reduce need for in-season emergency actions.
Allocate the 30,000 catch guideline 60% (18,000 fish) for fisheries below the Wauna powerlines (estuary) and 40% (12,000 fish) for fisheries above the Wauna powerlines.
• The estuary fishery will be managed with a 45-inch minimum size limit instead of the 42-inch minimum during the spring/summer retention season.
• The spring/summer season is expected to begin the second Saturday in May and continue through July 4 or until the harvest guideline is achieved.
• The estuary management target of 18,000 fish from 42-60 inches translates into 15,000 fish from 45-60 inches. The 19,200 fish harvest guideline (management target plus buffer) for the estuary translates to 16,000 fish from 45-60 inches.
Retention restrictions include Youngs Bay and the Willamette River upstream to Willamette Falls.
Protocol For Management of White Sturgeon Retention in Commercial Fisheries During 2006-2008.
Commercial fisheries should be managed to provide some level of white sturgeon harvest in each of the following seasons:
• Winter-spring season (January-June 15) to include sturgeon and salmon directed fisheries, • Summer season (June 16-July 31), • Early fall season (August), • Late fall season (September-October).
Landings during SAFE fisheries are not to exceed 400 white sturgeon for the entire year with winter/spring/summer fisheries not to exceed 300.
Allow some level of incidental sturgeon harvest to occur during all target salmon seasons.
Conduct limited target sturgeon fisheries during winter and early fall timeframes if feasible.
Conduct target sturgeon fisheries during October if necessary to access commercial allocation.
Adopt white sturgeon possession and landing limits if necessary to remain within season-specific catch expectations or to provide white sturgeon for harvest during subsequent salmon seasons.
Green sturgeon retention is prohibited.
Joint Staff will conduct an annual post-season evaluation of white sturgeon fisheries with industry.
The current Joint State Accord on 2006-2008 Columbia River Sturgeon Management expires at the end of this year. The Joint Staff intends to recommend to the respective Commissions that the current three-year sturgeon management agreement be renewed for one year (2009) while the Oregon WSMCP and the Washington CSWSMP are being developed, and the two agencies jointly refine a strategy for long-term lower Columbia River white sturgeon management.
9

Adjustments for Harvest Outside the Mainstem Columbia River Harvest guidelines and allocations identified in the Joint State management agreements pertain specifically to harvest in the mainstem Columbia River (and Select Areas) downstream of Bonneville Dam. However, white sturgeon from the lower Columbia River migrate into, and are harvested in, various Columbia River tributaries and coastal estuaries. The harvest outside the Columbia is generally low, averaging 2.6% based on 1996-2007 tag recovery data but can be higher as observed in 1996 when tag recoveries from outside the Columbia River increased to 5.3%. During that year, harvest of white sturgeon along the coast correspondingly peaked at a level more than double the average harvest for the previous decade. Because this phenomenon was recognized as a concern , the harvest guideline for the Columbia River (identified in the original 1997-1999 Joint State Management Agreement) was adopted with the contingency that it could change with a substantial increase in harvest outside the Columbia system. To assure that future harvest guidelines and allocations remained equitable, the Oregon and Washington Fish and Wildlife commissions adopted policy in the 2000-2002 and subsequent Joint State agreements, calling for management of sturgeon harvest outside the mainstem Columbia River to be consistent with Columbia River conservation and management needs. The premise is that harvest in these areas, especially recreational harvest in the lower Willamette River and commercial harvest in Willapa and Grays bays, would remain at or below baseline levels. The 2000 Willapa Bay Fishery Management Framework (plan) was developed to address the Joint State agreement policy. The Willapa Framework incorporated white sturgeon harvest guidelines for commercial and recreational fisheries based on the historic relationship between Willapa Bay and Columbia River harvest levels adjusted by the same 20% reduction made to the Columbia River guideline in 2003. Since adoption of the plan, non-Indian commercial harvest in Willapa Bay has declined; however, treaty harvest in Grays Bay and tributaries has generally increased. Collectively, the combined harvest has remained fairly consistent with baseline levels. Since 2004, there has been a significant shift in the winter and early spring recreational sturgeon harvest from the mainstem Columbia into the Willamette River. This shift may be due to warmer (2-5°F higher) winter water temperatures in the Willamette and generally poor smelt returns to the Columbia over the last several years that appear to be attracting more fish (and recreational fishers) to the Willamette River during January-May. Based on punch card data, annual white sturgeon harvest in the Willamette River averaged 1,531 fish (range 989-2,206) during 1986-1996, 1,871 fish (range 1,263-2,811) during 1997-2003, and 3,791 fish (range 2,703-4,532) during 2004-2006. Due to lack of a year-round sturgeon creel program in the Willamette (March-June only), in-season adjustments to the above Wauna guideline to account for harvest in the Willamette River were not attempted except in 2004, when a 1,481 fish adjustment was applied to the above Wauna harvest to account for observed high harvest in the Willamette River. Because of this increasing trend, staff has recently re-calculated harvest estimates (and adjusted guidelines) for the Willamette recreational fishery for 2003-2008 to account for harvest in excess of the 1986-1996 baseline level. These adjusted estimates for the Willamette River have been added to the above Wauna fishery to more accurately reflect the total recreational harvest as it applies to the above Wauna guideline. Based on information available from the March-June ODFW creel survey and angler punch card data, these adjustments equate to an additional 246 fish in 2003; 2,510 fish in 2004; 1,088 fish in 2005; 2,152 fish in 2006; 4,641 fish in 2007; and a projected 5,798 fish in 2008 (Table 3). Annual estimates for the Willamette were calculated by expanding the estimated harvest during March-June (creel data) by the monthly distribution of catch based on year-specific punch cards. Since punch card data for 2008 is not yet available, the annual catch was projected using the
10
2007 monthly punch card catch distribution to expand the March-June creel data. Staff will continue to review the methodologies developed for estimating sturgeon harvest in the lower Willamette River and may revise catch estimates as additional information becomes available. In addition, staff intends to continue monitoring coastal white sturgeon harvest trends as required in the Joint State agreement to determine if a similar adjustment is needed for fisheries occurring in these areas.
Sturgeon Fisheries
Reduced salmon fishing opportunities during the mid-1970’s through the late 1990’s greatly increased the popularity and importance of sturgeon for both commercial and recreational fisheries. The healthy white sturgeon population allowed the commercial industry to develop stable fisheries in a time when commercial salmon fishing opportunities had been drastically reduced. A similar lack of predictable recreational salmon fisheries, and increased recognition of white sturgeon as a sport fish have resulted in increased popularity of sturgeon angling since the mid-1980’s. In recent years, reduced white sturgeon catch guidelines have impacted the stability of all Columbia River sturgeon fisheries.
Past Commercial Sturgeon Fisheries Since the late 19th century, commercial catch of sturgeon remained very low until the mid-1940’s. Catches did not exceed 5,000 fish annually until 1969 and have since exceeded 5,000 fish annually in all years except 1991. Catches peaked in the late 1970’s and early 1980’s with annual landings ranging from 9,400 to 22,800 fish. During the 1990’s, catches ranged from a low of 3,800 fish in 1991 to a high of 13,900 fish in 1998 (Table 4). Since 1997, commercial sturgeon fisheries have been managed to remain within catch guidelines while maximizing economic benefit and achieving conservation objectives for other species. Annual plans for distribution of the commercial harvest allocation are developed with input from the Columbia River Commercial Fisheries Advisory Group (CRCAG), to provide more predictable commercial fishing opportunities throughout the year while maintaining optimum market value. Weekly landing limits have remained a valuable tool in maintaining consistent commercial fisheries since first adopted in 2002.
2008 Commercial Fishery Commercial fisheries in 2006 harvested 8,312 white sturgeon, 312 fish above the 8,000 fish quota (Table 5). After meeting with the CRCAG in December 2006, the Joint Staff elected to split the ~300 fish overage equally among the remaining two years of the 2006-2008 agreement. This lowered the 2007 and 2008 commercial quotas to 7,850; however, the 2008 commercial harvest guideline increased to 7,927 once 2006-2007 landings were updated (Table 5). Protocol for management of white sturgeon retention in commercial fisheries during 2008 was developed based on input from the CRRAG and was adopted in December 2007 by the Compact. Fisheries were managed for white sturgeon catch expectations of 1,800 during the winter/spring timeframe (1,600 for the winter sturgeon and 200 for winter/spring salmon) and 500 white sturgeon allocated for the summer season. The early fall (August) season were allocated 2,000 white sturgeon and the remaining 3,150 fish were allocated to the late fall season. Any unused allocation from winter/spring/summer mainstem fisheries were to re-distributed equally between the early fall and late fall fisheries (50% to each fishery). As in recent years, 400 white sturgeon were allocated to Select Area commercial fisheries, with a target 300 fish during winter/spring/summer seasons and 100 fish for the fall season.
11

Commercial fisheries in 2008 (Table 6) were initiated with a winter target sturgeon season consisting of six 24-hour and two 18-hour fishing periods between January 8 and February 13 in Zones 1-5. An additional three 18-hour fishing periods occurred between February 21 and 29 in Zones 4-5, between the Hayden Island Powerlines and the commercial fishing boundary at Beacon Rock. Gear regulations in all periods included a 9-inch minimum (and 9¾-inch maximum per permanent rule) mesh size restriction to target sturgeon and minimize the handle of spring Chinook and winter steelhead. Landings during the 2008 winter target sturgeon fishery were less than expected, with a total catch of 869 white sturgeon landed. Weekly landing limits were not used during winter fisheries. Three 10-16 hour commercial spring Chinook salmon seasons occurred during April 1-15. Fisheries in April were restricted to the area from the Hayden Island Powerlines upstream to the commercial fishing boundary at Beacon Rock, and limited to 4 ¼-inch maximum mesh (tangle-net) gear. Sales of sturgeon were allowed throughout the salmon fishery. A total of 17 white sturgeon were landed during the spring fishery, bringing the mainstem winter/spring season sturgeon catch total to 886 fish. A commercial gill net fishery occurred during the summer of 2008 to harvest summer Chinook. Three nighttime fishing periods of 10-hours each took place between June 24 and July 8 in Zones 1-5. The fishery was restricted to the use of 8-inch minimum mesh size to reduce the handle of steelhead and sockeye. Weekly sturgeon landing limits were set at five sturgeon per vessel for all summer fishing periods. During this fishery, 523 white sturgeon were landed, bringing the 2008 total to 1,409 for mainstem fisheries. A target sockeye fishery occurred in Area 2S from noon to 6 PM on June 30. This fishery was restricted to 4 ½-inch maximum mesh un-slackened nets, and only two deliveries were made, with 213 sockeye and 0 sturgeon landed. Landings of white sturgeon in 2008 Select Area winter-spring commercial fisheries were higher than recent years and required in-season action to manage harvest to the target of 300 fish for winter-summer SAFE fisheries. The three white sturgeon (per vessel per week) landing limit that had been used in recent years was lifted following February fisheries based on a request from industry which resulted in higher landings especially in Tongue Point. A total 337 white sturgeon were harvested in Select Area winter-spring fisheries prior to sturgeon retention being prohibited effective June 4-July 31, leaving 63 white sturgeon available for harvest in fall seasons. The early-August mainstem commercial fishery consisted of four 12-hour fishing periods (August 3-11) in Zones 1-5 and one 12-hour period (August 14-15) in Zones 2-5. The weekly landing limit was 10 sturgeon per vessel per week and gear was restricted to 9-inch minimum mesh size to minimize the handle of summer steelhead. An estimated 2,706 white sturgeon were landed in early-August mainstem commercial fisheries. The late-August season consisted of one fishing period during August19-20 from 8 PM to 6 AM, and a second period during August 24-25 from 11 PM to 5 AM. Both periods occurred in Zones 4-5 with 9-inch minimum and 9¾-inch maximum mesh gear, and weekly sturgeon landing limits were three sturgeon per vessel. Catch in these periods was 103 white sturgeon, bringing the annual total mainstem harvest to 4,218 white sturgeon. Late fall fisheries began on September 18 and were completed on October 31. Fisheries through mid-October mainly targeted Chinook and white sturgeon, while late October fisheries provided some opportunity for Chinook, coho, and white sturgeon. Weekly landing limits began at 10 sturgeon per vessel but were reduced to three per vessel beginning October 8. The mainstem sturgeon catch for late-fall totaled 3,170, and the total mainstem sturgeon catch for 2008 was 7,388 fish.
12
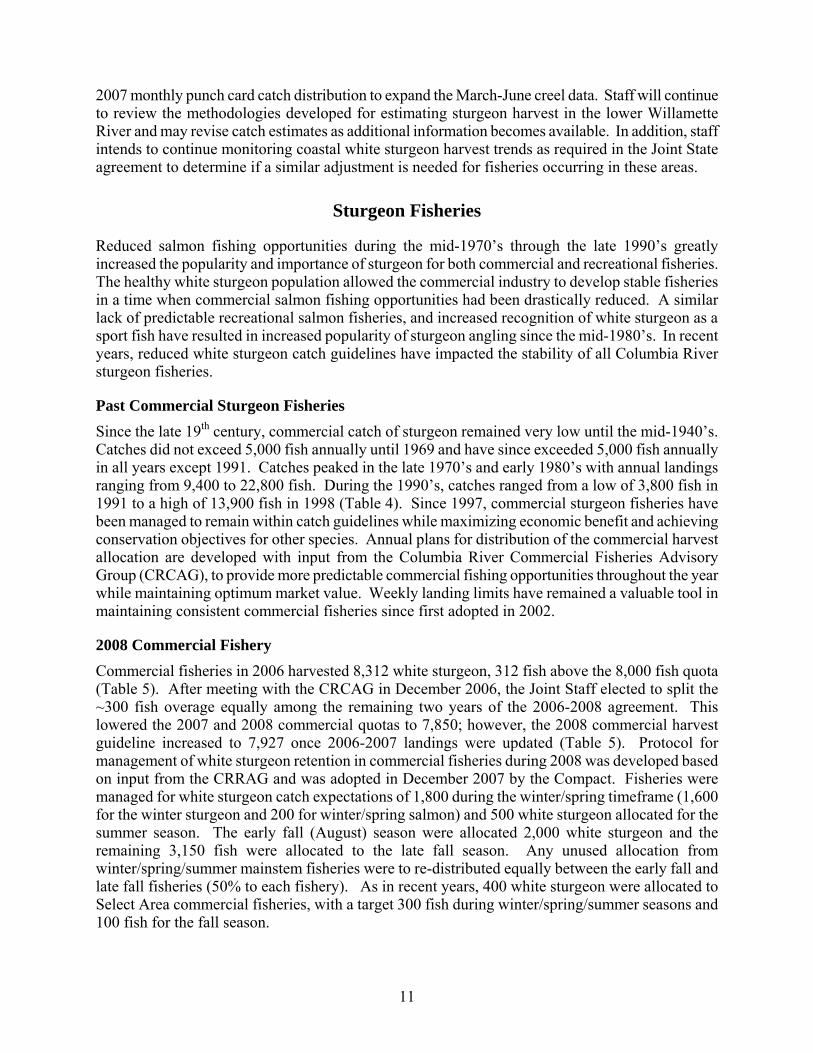
Retention of white sturgeon in SAFE fisheries resumed August 1 but was prohibited after September 10 in an effort to remain within the annual 400 fish target. Fall Select Area fisheries harvested 134 white sturgeon, bringing the total 2008 Select Area harvest to 471 fish, or 118% of the annual target. A preliminary total of 7,859 white sturgeon were landed in combined commercial fisheries in 2008, which is 68 fish less than the available commercial quota of 7,927. Mainstem fisheries landed 94% of the white sturgeon catch (7,388 fish) while Select Area fisheries landed 6% (471 fish). Mainstem landings and seasons for 2008 are summarized in Table 6. Landings for Select Area commercial seasons are included in Table 4.
Mainstem Commercial Seasons Harvesting White Sturgeon During 1997-2008.
Winter
Target sturgeon fisheries consisted of two 30-hour fishing periods per week during the 2nd week of January through mid-February in all of Zones 1-5 during 1997-2002. In 2003 only three 30-hour fishing periods (one per week) followed by one 12-hour period occurred during January. In 2004, five 24-hour fishing periods occurred from mid-January through mid-February. Seven 24-hour fishing periods occurred during January through late February, 2005. In January-February 2006, ten fishing periods targeting white sturgeon occurred in Zones 1-5. Seven of these were 24 hours long, and three were 12 hours long. Nine winter sturgeon fisheries took place in 2007. Seven of these fisheries were 24 hours long, and two were 18 hours long. Zones 1-5 were open for all openers and weekly landing limits were not enacted until mid-February. In 2008, 11 winter sturgeon fisheries took place. Six of these were 24 hours long and five were 18 hours long. Three of these openers were restricted to portions of Zones 4-5 and the remainder occurred in Zones 1-5.
Sturgeon catch also occurs in spring Chinook fisheries. Annual protocol adopted for the Winter/Spring season typically includes 200 sturgeon be set aside for these fisheries. In most years, weekly landing limits for sturgeon are not utilized in winter fisheries; however, landing limits are typically enacted for spring fisheries. In 2008, 17 white sturgeon were harvested during spring Chinook fisheries.
Summer
During 2004, two 12-hour fishing periods occurred during late-June and early-July targeting sockeye and summer Chinook. In 2005, six 10-hour fishing periods occurred during late June through late July targeting summer Chinook. In 2006, three 10-hour and ten 12-hour fishing periods occurred from late June through July 31 targeting summer Chinook. Retention of green sturgeon in commercial fisheries was prohibited effective July 6, 2006. Two 10-hour summer Chinook fishing periods occurred in Zones 1-5 in 2007. Three 10-hour summer Chinook fishing periods occurred in Zones 1-5 during 2008. A 6-hour target sockeye fishery also occurred in Area 2S on June 30, 2008. The weekly landing limit was five white sturgeon per vessel for all 2007-2008 summer seasons.
13
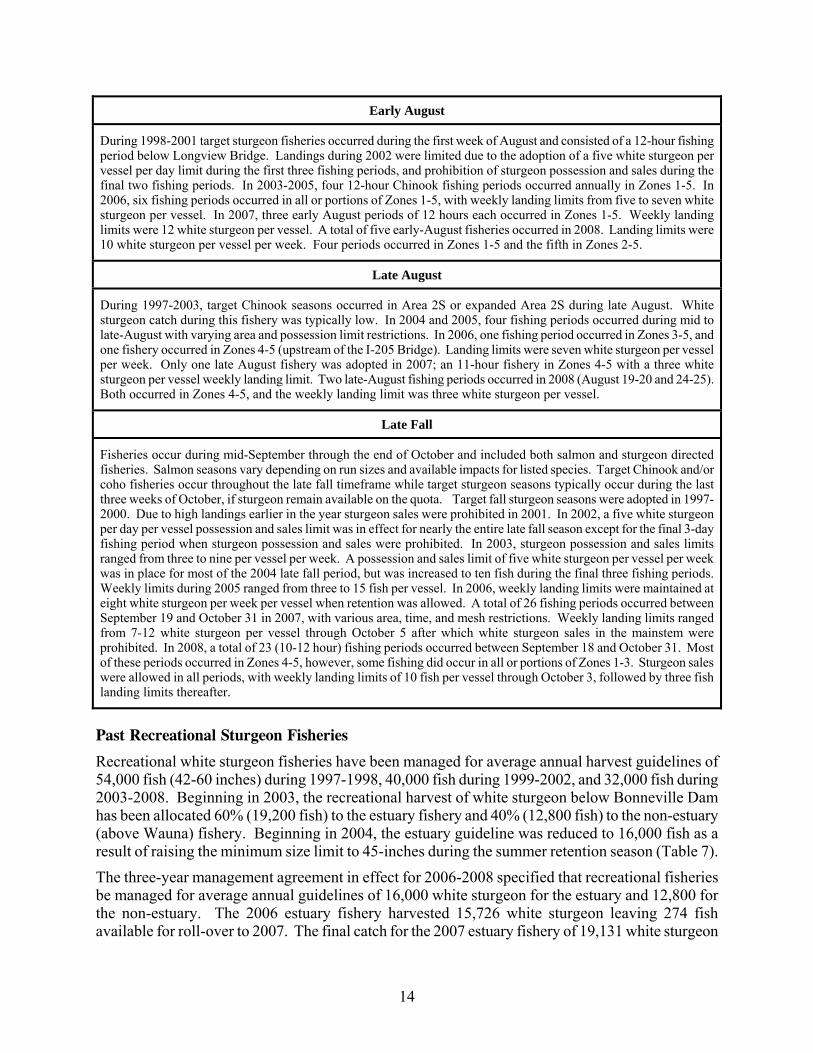
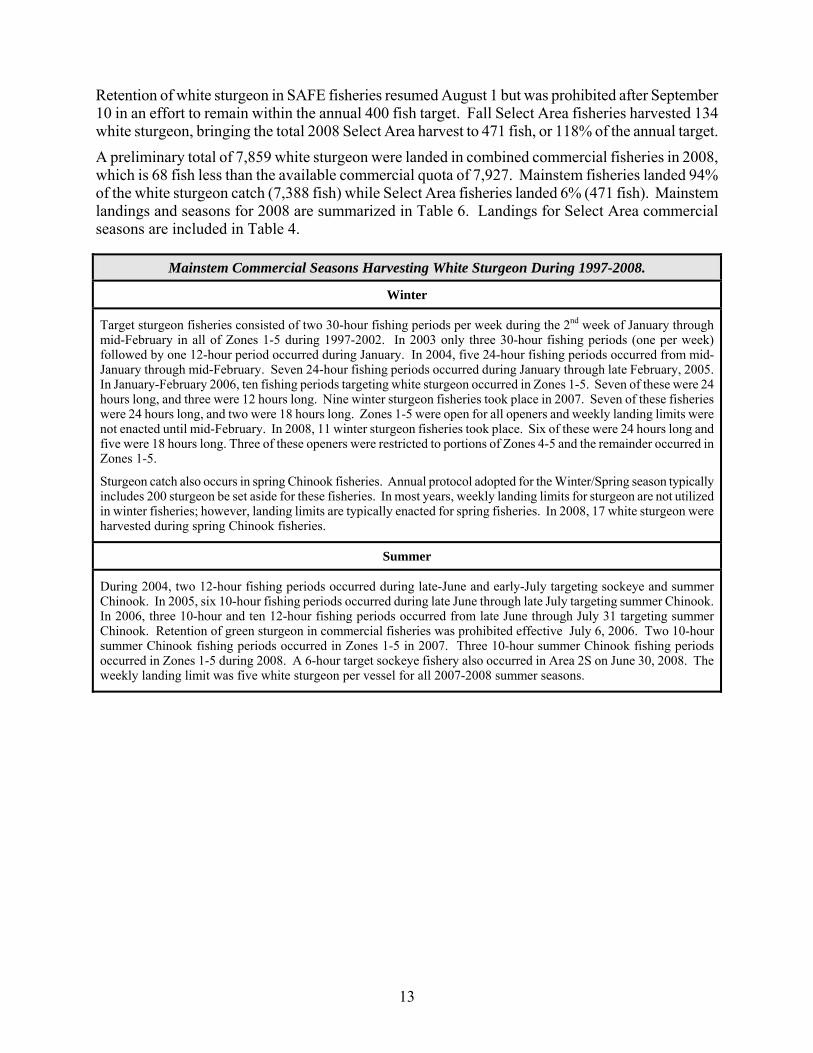
Early August
During 1998-2001 target sturgeon fisheries occurred during the first week of August and consisted of a 12-hour fishing period below Longview Bridge. Landings during 2002 were limited due to the adoption of a five white sturgeon per vessel per day limit during the first three fishing periods, and prohibition of sturgeon possession and sales during the final two fishing periods. In 2003-2005, four 12-hour Chinook fishing periods occurred annually in Zones 1-5. In 2006, six fishing periods occurred in all or portions of Zones 1-5, with weekly landing limits from five to seven white sturgeon per vessel. In 2007, three early August periods of 12 hours each occurred in Zones 1-5. Weekly landing limits were 12 white sturgeon per vessel. A total of five early-August fisheries occurred in 2008. Landing limits were 10 white sturgeon per vessel per week. Four periods occurred in Zones 1-5 and the fifth in Zones 2-5.
Late August
During 1997-2003, target Chinook seasons occurred in Area 2S or expanded Area 2S during late August. White sturgeon catch during this fishery was typically low. In 2004 and 2005, four fishing periods occurred during mid to late-August with varying area and possession limit restrictions. In 2006, one fishing period occurred in Zones 3-5, and one fishery occurred in Zones 4-5 (upstream of the I-205 Bridge). Landing limits were seven white sturgeon per vessel per week. Only one late August fishery was adopted in 2007; an 11-hour fishery in Zones 4-5 with a three white sturgeon per vessel weekly landing limit. Two late-August fishing periods occurred in 2008 (August 19-20 and 24-25). Both occurred in Zones 4-5, and the weekly landing limit was three white sturgeon per vessel.
Late Fall
Fisheries occur during mid-September through the end of October and included both salmon and sturgeon directed fisheries. Salmon seasons vary depending on run sizes and available impacts for listed species. Target Chinook and/or coho fisheries occur throughout the late fall timeframe while target sturgeon seasons typically occur during the last three weeks of October, if sturgeon remain available on the quota. Target fall sturgeon seasons were adopted in 1997-2000. Due to high landings earlier in the year sturgeon sales were prohibited in 2001. In 2002, a five white sturgeon per day per vessel possession and sales limit was in effect for nearly the entire late fall season except for the final 3-day fishing period when sturgeon possession and sales were prohibited. In 2003, sturgeon possession and sales limits ranged from three to nine per vessel per week. A possession and sales limit of five white sturgeon per vessel per week was in place for most of the 2004 late fall period, but was increased to ten fish during the final three fishing periods. Weekly limits during 2005 ranged from three to 15 fish per vessel. In 2006, weekly landing limits were maintained at eight white sturgeon per week per vessel when retention was allowed. A total of 26 fishing periods occurred between September 19 and October 31 in 2007, with various area, time, and mesh restrictions. Weekly landing limits ranged from 7-12 white sturgeon per vessel through October 5 after which white sturgeon sales in the mainstem were prohibited. In 2008, a total of 23 (10-12 hour) fishing periods occurred between September 18 and October 31. Most of these periods occurred in Zones 4-5, however, some fishing did occur in all or portions of Zones 1-3. Sturgeon sales were allowed in all periods, with weekly landing limits of 10 fish per vessel through October 3, followed by three fish landing limits thereafter.
Past Recreational Sturgeon Fisheries
Recreational white sturgeon fisheries have been managed for average annual harvest guidelines of 54,000 fish (42-60 inches) during 1997-1998, 40,000 fish during 1999-2002, and 32,000 fish during 2003-2008. Beginning in 2003, the recreational harvest of white sturgeon below Bonneville Dam has been allocated 60% (19,200 fish) to the estuary fishery and 40% (12,800 fish) to the non-estuary (above Wauna) fishery. Beginning in 2004, the estuary guideline was reduced to 16,000 fish as a result of raising the minimum size limit to 45-inches during the summer retention season (Table 7). The three-year management agreement in effect for 2006-2008 specified that recreational fisheries be managed for average annual guidelines of 16,000 white sturgeon for the estuary and 12,800 for the non-estuary. The 2006 estuary fishery harvested 15,726 white sturgeon leaving 274 fish available for roll-over to 2007. The final catch for the 2007 estuary fishery of 19,131 white sturgeon
14

kept (118% of the management guideline) from 50,071 angler trips exceeded the adjusted guideline of 16,274 white sturgeon by 2,857 fish (Table 3). Based on early catch estimates for the 2006 above Wauna fishery of 9,800 fish white sturgeon, approximately 3,000 fish were available for rollover to 2007-2008 fisheries in this area. Both staff and CRRAG recommended spreading this balance equally over the remaining two years of the management period resulting in expected guidelines of 14,300 for both 2007 and 2008. However, revised punch card data available in 2007 resulted in an increased Willamette harvest estimate for 2006, which reduced the number of fish available for 2007. The early catch estimate for the 2007 non-estuary fishery was 14,750 white sturgeon kept (10,950 in the mainstem Columbia and 3,800 fish in excess of the Willamette River baseline), leaving an expected roll-over of 1,100 sturgeon for harvest in 2008 fisheries above Wauna (Table 3).
2008 Recreational Sturgeon Fishery
Recreational fishery options were considered at the December 13, 2007 Joint State hearing when the states adopted sturgeon fishing regulations for 2008. Based on a preseason expected guideline of 13,900 white sturgeon for the non-estuary fishery in 2008, the states adopted a four-day per week retention season (Thursday-Sunday) during January 1-July 31 and October 1-December 31 for the fishery above Wauna (Table 7). Since the estuary fishery had approximately 2,900 fewer fish for harvest in 2008 (13,143 guideline), the states adopted a summer retention season during May 10-June 24, which represented a 10-day reduction from the 2007 fishery (Table 7).
Above Wauna (non-Estuary) The Columbia River above the Wauna power lines (River Mile 40) including all adjacent Washington tributaries and the Willamette River downstream of Willamette Falls including Multnomah Channel was open to the retention of sturgeon four days per week (Thursday-Sunday) during January 1-July 31 and October 1-December 31. Sturgeon retention was prohibited three days per week (Monday-Wednesday) during January 1-July 31 and October 1-December 31, and everyday during August 1-September 30. Catch-and-release angling was allowed during all retention closures. The 2008 recreational fishery above Wauna started slowly with only 1,003 sturgeon landed from 18,330 angler trips through the end of May. Similar to the start of the 2004-2007 seasons, cold water temperatures and a poor smelt return contributed to the very low catch rates, and anglers concentrated their efforts in the Willamette River where catch rates were higher. Catch rates in the Columbia River remained poor during June and July when only 223 sturgeon were landed resulting in a cumulative catch of 1,226 sturgeon from 30,569 trips, which was the lowest cumulative catch total for this area through July on record. Prior to the scheduled August-September closure, the states met on July 24 and opened the non-estuary fishery to retention four days per week (Thursday-Sunday) during August 1-September 30, when retention was originally scheduled to be closed. Catches improved during this time as anglers landed 2,630 sturgeon in 26,044 trips. Angler effort and catch rates during October were high, with a catch of 2,965 white sturgeon from 16,028 angler trips. During November, anglers kept 1,138 white sturgeon from 7,782 angler trips with an additional 160 fish expected to be caught in December. The total catch for the 2008 fishery above Wauna is projected to be 8,121 white sturgeon, or 50% of the management guideline from 82,000 angler trips. Management decisions throughout the majority of 2008 were based on a projected Willamette catch
15

of 2,500 white sturgeon in excess of the baseline. An update based on March-June 2008 creel data increased the estimated harvest to 5,575 fish. In addition, preliminary 2007 punch card data became available in late 2008 and increased the Willamette harvest estimate for 2007 to 4,641 fish and the final projection for 2008 to 5,798 fish. Given these Willamette harvest adjustments, the estimated combined catch in the above Wauna fishery is 15,316 white sturgeon for 2007 and 13,919 for 2008. For the 2006-2008 management period, the projected catch for the non-estuary fishery is 39,932 white sturgeon, or 1,532 fish in excess of the 38,400 harvest guideline (Table 3).
Below Wauna (Estuary) Regulations allowed sturgeon retention seven days per week during January 1-April 30 and May 10-June 24. For the May 10-June 24 retention season, the minimum size limit was increased from 42” to 45” (Table 7). Sturgeon retention below Wauna was prohibited from May 1-9 and June 25- December 31 (catch-and-release angling was allowed during all retention closures). The recreational sturgeon season below Wauna began slowly with only 22 white sturgeon caught through the end of April from 535 angler trips. Effort was high when the estuary fishery reopened on Saturday May 10, but catch rates were somewhat below expectations averaging 0.17 fish/angler for the month. The final catch for May in the estuary was 1,689 sturgeon from 9,671 angler trips. Angler effort continued to build during June with a peak count of 578 private and 27 charter boats on Saturday June 21, but catch rates remained lackluster averaging 0.27 fish/angler during the month compared to 0.39 and 0.42 fish/angler in 2006 and 2007, respectively. The final catch for June was 7,368 white sturgeon from 27,148 angler trips, which brought the cumulative catch to 9,079 fish compared to the guideline of 13,143. On June 27, 2008 the states met to adopt additional retention days in the estuary sturgeon fishery and presented several options. Testimony from the public favored adding days to compliment the ocean salmon fishery, which was open Sunday-Thursday during June 29-September 30. The states adopted eight additional fishing days on July 10-12, July 17-19, and July 26-27 for sturgeon retention in the estuary. Other size and bag limit regulations remained the same as during May 10-June 24. Effort and catch rates exceeded expectations during July with 670 private boats observed on Saturday July 19 and a catch rate of 0.41 fish/angler during the month, both of which were the highest of the season. The catch through the first two open periods was 3,500, which brought the cumulative total to 12,579 or 96% of the guideline. On July 24, the states met and allowed the fishery to continue as scheduled on July 26 but rescinded the final retention day slated for Sunday July 27. The final catch for July 10-12, 17-19 and 26 was 4,535 sturgeon from 11,079 angler trips, which brought the cumulative catch to 13,614 white sturgeon from 48,433 angler trips. For the 2006-2008 management period, the estimated catch for this area was 48,471 white sturgeon, or 471 fish in excess of the 48,000 harvest guideline (Table 3). The estimated handle of green sturgeon in the estuary during 2008 was 61 fish released and zero kept.
Summary of 2008 Recreational Harvest The total recreational catch estimate for the mainstem Columbia River below Bonneville Dam in 2008 is projected to be 21,735 white sturgeon from 130,600 angler trips. The 2008 recreational catch is projected to be 49% (10,500 fish) in the 3-4 foot size class and 51% (11,100 fish) in the 4-5 foot size class, as compared to the 2001-2007 averages of 63% and 37%, respectively (Table 8). An additional 5,798 white sturgeon in excess of background levels were estimated harvested from the Willamette River, for a combined total of 27,533 fish or 102% of the preseason guideline or 108% of the adjusted 25,530 fish guideline for 2008 (Tables 2, 3 and 5).
16
2009 Non-Indian Sturgeon Fisheries Expectations With the 2006-2008 sturgeon management agreement expiring and the process to develop a new Joint State sturgeon management agreement ongoing, the Joint Staff has not developed proposals for 2009 fisheries at this time. The Joint Staff are recommending that the current three-year sturgeon management agreement be renewed for one additional year (2009). The WFWC is scheduled to make a decision on this recommendation at the December 12-13 Commission meeting and the OFWC is scheduled to do the same at a separate December 12 meeting. Any substantive change to key tenants of the agreement could extend negotiations and delay consideration of fishing seasons for 2009 until after the December 18, 2008 Compact/Joint State hearing. Commercial Fisheries In accordance with the commercial white sturgeon retention protocol, a post-season meeting occurred on December 2, 2008 with the CRCAG to evaluate the currently adopted protocol and develop a white sturgeon fishing plan for 2009. The 2006-2008 protocol identifies that some level of harvest should be provided in each of the winter-spring, summer and fall seasons. Staff and CRRAG developed the following sub-allocation of white sturgeon available for commercial harvest in 2009: 1,700 white sturgeon for the winter sturgeon fishery (no specific allocation for the winter salmon fishery), 600 fish for summer fisheries, 2,000 fish for early fall (August) fisheries, and 3,300 fish for the late fall timeframe. Any remaining fish from winter/spring/summer will be rolled over to fall fisheries and split evenly between the early and late fall seasons. Select Area fisheries will be managed for a 400 fish annual target, with no more than 300 fish to be harvested in the winter-summer timeframe and 100 fish set aside for fall fisheries. The 2009 sub-allocation (which is similar to that adopted in 2008) is dependent upon extension of the existing management agreement by the Commissions. Based on the results of the December OFWC and WFWC meetings, the Joint Staff will provide season recommendations consistent with 2009 commercial sturgeon retention protocol at the December 18, 2008 (or subsequent) Compact hearing.
Recreational Fisheries The Joint Staff met with the CRRAG on December 2, 2008 to provide and discuss season options available for both the estuary and the non-estuary fisheries, based on the harvestable number of fish available to recreational fisheries in 2009. The Joint Staff has not developed formal proposals for the 2009 recreational fishery at this time. The Joint Staff will propose sport fishery recommendations at the December 18, 2008 (or subsequent) Joint State meeting, depending on results of the December WFWC/OFWC meetings. Fishery recommendations will be consistent with management objectives and catch allocations adopted by the Commissions and the Directors of the Oregon and Washington Departments of Fish and Wildlife.
Fork Length Effective January 1, 2009, Oregon and Washington will convert from a total length to a fork-length measurement standard for all non-Indian fisheries. The conversions for current slot measurements are as follows: 42-inch total length = 38-inch fork length 45-inch total length = 41-inch fork length 48-inch total length = 43-inch fork length 60-inch total length = 54-inch fork length
17

STURGEON MANAGEMENT AND FISHERIES UPSTREAM FROM BONNEVILLE DAM
Stock Status
The healthy white sturgeon population in the lower Columbia River historically ranged into areas above the current location of Bonneville Dam; however, with the construction of Bonneville Dam in 1938, the population became segregated and fish residing above Bonneville Dam could no longer migrate freely between freshwater and marine environments. The population became further segregated with the completion of McNary Dam in 1953, The Dalles Dam in 1957, and John Day Dam in 1968, resulting in functionally separate populations in Bonneville, The Dalles, and John Day pools. Inaccessibility to the marine environment and habitat alterations, primarily due to hydroelectric development, has rendered these populations less productive than those residing below Bonneville Dam. Abundance of white sturgeon populations in each of the three Zone 6 reservoirs (between Bonneville and McNary dams) is estimated every three years to monitor the effects of hydro-system operations and fishery management strategies. Mark-recapture population estimates are derived using directed sampling with gill nets and setlines. Significant harvest reductions were enacted beginning in 1988 and populations in all three reservoirs increased as a result of reduced catch and other mitigation efforts. The most recent assessments estimated the abundance of three- to six-foot sturgeon to be 12,700 in The Dalles Reservoir (2005), 42,100 in Bonneville Reservoir ( 2006), and 23,900 in John Day Reservoir (2007; Table 10).
Fishery Management Actions
The Sturgeon Management Task Force (SMTF) consists of representatives from Oregon, Washington, and the Columbia River treaty Indian tribes (Nez Perce, Umatilla, Warm Springs, and Yakama). The SMTF was formed in 1987 in response to concerns over increasing catch rates (non-Indian recreational and treaty Indian commercial and subsistence) and declining white sturgeon abundance in the Zone 6 area (Bonneville Dam upstream to McNary Dam). The purpose of the SMTF is to review the status of sturgeon and provide harvest management recommendations for fisheries occurring in the Zone 6 management area. The current harvest allocation is approximately 43 percent recreational and 57 percent tribal for Zone 6, although reservoir-specific guidelines are shaped to meet fishery demands. The recreational fishery is allowed a greater share of the Bonneville Pool catch, while the treaty Indian fishery is allowed a greater share of the catch in The Dalles and John Day pools. Treaty Indian fishers may continue to take sturgeon for subsistence purposes after commercial seasons have been completed, and this catch is not included in the commercial catch guidelines. Subsistence catch is estimated through a monitoring program conducted by the Yakama Indian Nation, and for the past decade has averaged nearly 300 sturgeon annually (Table 11).
18

Sturgeon Fisheries
Sturgeon fisheries in Zone 6 consist of treaty-Indian commercial and subsistence fisheries and non-Indian recreational fisheries. Non-Indian fishing is restricted to hook-and-line recreational fishing only, while treaty Indian commercial fishing is conducted with three types of gear: hook-and-line, setlines, and gill nets. Each year, the Columbia River Compact and the tribes set specific seasons for commercial gillnet fisheries (Table 12). Under permanent regulations, treaty setline fisheries are open in all three Zone 6 reservoirs during January 1-31. Setline seasons target sturgeon, while gillnet seasons usually target steelhead; however, in recent years the winter gillnet season has shifted to a target sturgeon season due to poor prices for steelhead. Treaty Indian subsistence seasons are open the entire year, as were recreational seasons prior to 1994. Since 1994, the sturgeon recreational fishery and treaty Indian commercial fisheries have been managed under reservoir-specific quotas. Catch-and-release recreational fishing is allowed once recreational quotas are reached (Table 13).
2008 Fisheries Fisheries occurring in Zone 6 during 2008 included treaty subsistence, treaty Indian commercial setline and gillnet, and non-Indian recreational fisheries. Zone 6 commercial and recreational fisheries were managed in accordance with catch guidelines set forth by the SMTF (Table 14). As has been the case since 1997, commercial sturgeon fisheries were restricted to a 48-60 inch size limit in The Dalles and John Day pools. In Bonneville Pool, a 45-60 inch size limit has been in place since 2004. This slot limit was in place for the 2008 setline fishery (January 1-31) but was modified to 42-60 inches for subsequent 2008 fisheries. Recreational fishery size limits have been 42-60 inches in Bonneville Pool, and 48-60 inches in The Dalles and John Day pools since 1997.
2008 Setline Fisheries The treaty Indian winter setline fishery produced no sturgeon landings in any of the Zone 6 pools (Table 15).
2008 Gillnet Fishery The treaty Indian winter gillnet season commercial fishery was open from February 1 through February 29 in Bonneville Pool, through March 3 in The Dalles Pool, and through March 10 in John Day Pool. These seasons resulted in landings of 744 sturgeon in Bonneville Pool, 571 sturgeon in The Dalles Pool, and 277 sturgeon in John Day Pool (Table 15). Catches in Bonneville and The Dalles pools during the winter commercial gillnet season exceeded harvest guidelines, and harvest in John Day Pool was 83% of the guideline (Table 12). The combined landings of 1,592 white sturgeon is 124% of the combined Zone 6 treaty guideline of 1,285 fish. No additional commercial sturgeon fisheries occurred in 2008.
2008 Subsistence Fishery Treaty Indian subsistence sturgeon fishing is open year-round, with sanctuary closures around dams and tributaries. The subsistence fishery catch in 2008 is estimated to be 226 fish, 40% more fish than the 161 fish landed in 2007, and about 75% of the 1997-2006 average of 300 white sturgeon (Table 11).
19

2008 Recreational Fishery Recreational retention seasons for each Zone 6 pool began January 1 and remained open until catch guidelines were reached. Retention of fish was allowed through July 11 in Bonneville Pool, through March 14 in The Dalles Pool, and through March 25 in the John Day Pool (Table 13) with preliminary catches of 841, 128, and 164 fish, respectively (Table 14). The combined Zone 6 recreational catch of 1,133 was 117% of the combined guideline of 965 white sturgeon.
2009 Zone 6 Sturgeon Fisheries Expectations
As per permanent regulations, treaty Indian commercial setline seasons are scheduled for January 1-31, 2009. The SMTF is expected to meet in January 2009 to review 2008 harvests, the 2008 stock assessment in The Dalles Pool, and to discuss management options for 2009, including catch guidelines. In January, the tribes are expected to propose winter season commercial gillnet fisheries to begin in early February. As per permanent regulations, Zone 6 recreational seasons are scheduled to begin January 1, 2009 and to continue until guidelines are met. Given the recent early season closures in the both The Dalles and John Day pools, staff will likely pursue public input regarding alternative season structures that may extend these fisheries.
20

SMELT MANAGEMENT AND FISHERIES
Stock Status Eulachon smelt annually ascend the Columbia River to spawn in the mainstem Columbia River and its tributaries downstream of Bonneville Dam. The fish typically enter the Columbia River in early to mid-January, followed by tributary entry in mid- to late January. Smelt typically spawn every year in the Cowlitz River, with inconsistent runs and spawning events occurring in the Grays, Elochoman, Lewis, Kalama, and Sandy rivers. Peak tributary abundance is usually in February, with variable abundance through March, and an occasional showing in April. Smelt return to freshwater at 3, 4, and 5 years of age. Spawning can occur in the lower Columbia River Basin soon after freshwater entry. Smelt are broadcast spawners preferring areas with a coarse sandy bottom. Females produce 20,000-60,000 eggs and the adults die following spawning. The adhesive eggs settle to the bottom, and incubate for about 30-40 days, depending on water temperature. Young smelt larvae are about 4.0 mm in length and drift with the current to sea. Recent mixed-stock analysis of the British Columbia eulachon catch has shown that eulachon stocks belong to three distinct genetic groups, which are separated geographically. Stocks returning to the Columbia and Fraser rivers tend to mix in southern coastal waters, and compose one of these genetic groups.
Adult Returns The smelt fishery can be traced back to the late 1800’s and landings can be used to index relative annual abundance. Although commercial landings are not applicable for developing annual population estimates, due to consumer demand, season structure, and environmental conditions, landings do provide a useful measure of the relative annual run strength (Tables 16 and 17). As indexed by commercial landings, run sizes have remained relatively stable for several decades until landings dropped in the early 1990’s and remained low for several years. Commercial landings from 1938-1989 averaged 2.1 million pounds annually. In 1993, smelt strayed to many Washington coastal streams and bays due to cold Columbia River water temperature, and only 500,000 pounds were landed in the Columbia River Basin. Landings in 1994 were also very low, and beginning in 1995, fishery restrictions were enacted. Due to reduced seasons during 1995-2000, landings in those years are not comparable with previous years; however, it is apparent that the abundance of smelt in the Columbia River Basin was low during 1994-2000 (Table 16). Although total commercial landings remained low in 2000, other abundance indices such as (1) improved CPUE in the commercial fishery, (2) excellent recreational dipping during a portion of the season, and (3) high larval abundance over wide areas during an extended period of time, suggested that the 2000 return was significantly improved in comparison to extremely poor returns of 1994-1999. The 2001 return continued the trend of increasing abundance, and was the first year since 1988 in which smelt returned to the Sandy River. In spite of limited fishing opportunities in 2001, landings from commercial fisheries in the Columbia and Cowlitz rivers were the third largest since 1992 with a high CPUE in the Columbia River fishery. Commercial fishery landings in the Columbia River and tributaries continued to increase in 2002 and 2003, indicating improved run sizes compared to the 1990’s. Observed CPUE’s in 2003 were much greater than those observed during 1994-2000 (Table 17). The 2003 season was the first since 1988 in which smelt were commercially landed from the Sandy River.
21

Total commercial landings in 2004 were the lowest since 2000, and were about 20% of 2003 landings (Table 16), despite a liberal season and favorable market. Likewise, the 2004 observed CPUE was the lowest since 2000, and was less than half that observed in 2003 (Table 17). The decline in landings was even more precipitous in 2005. The commercial landings for 2005, 2006, 2007, and 2008 were the lowest, sixth lowest, second lowest, and fourth lowest recorded since 1938, respectively (Table 16). A similar precipitous drop occurred in the 2005 Canadian Department of Fisheries and Oceans’ (CDFO) New Westminster eulachon test fishery and in 2006 the northern stock (e.g. Skeena River), and central stock (e.g. Bella Coola River) groups collapsed as well as the southern stock (Fraser River and Columbia River) group. On November 9, 2007, the Cowlitz Indian Tribe (CIT) petitioned the NMFS to designate populations of eulachon smelt south of the international border of the United States and Canada as a DPS, and further to list this DPS as threatened or endangered pursuant to the ESA. The NOAA Fisheries has not made a determination at the time this document was prepared.
Juvenile Production
Beginning in the early 1990’s, monitoring of juvenile emigration was initiated to identify timing of peak out-migration and relative spawning success in order to develop a more direct measure of brood-year strength, rather than relying on landings in the commercial fishery. A sampling program that measures larval smelt densities (averaged across stations and depths at selected index sites) was initiated in 1994 for the Cowlitz River, and was expanded to include the Kalama River in 1995, the mainstem Columbia River in 1996, Elochoman and Lewis rivers in 1997, and the Grays and Sandy rivers in 1998. Larval sampling was also conducted in the Cowlitz River in 1986 (Table 18). Information on spawning success coupled with recreational and commercial fisheries data provides an indication of the relative annual run strength. In past years, larval sampling techniques on the mainstem Columbia River did not include repeat sampling of the same area over the duration of the out-migration period. This could result in the data not accurately reflecting the overall abundance or peak out-migration. Beginning in 2003, multiple collections throughout the out-migration season were conducted at the Price Island and Clifton Channel sites (Table 18), which eventually will provide the data necessary to identify the peak timing and duration of the out-migration from the bulk of the production areas. Low larval densities at Columbia River index sites during the 2004 winter out-migration suggests poor production for the Age 5 component of the 2009 run. Larval densities at the Columbia River index sites during 2005 were the lowest ever observed since surveys began in 1996, suggesting very poor production for the Age 4 component of the 2009 run. Good productivity has not always corresponded to high returns, and poor ocean conditions during any part of the smelt’s marine life-stage may negate favorable spawning and out-migration conditions (implied by high larval densities). For example, 2004-2008 returns were poor, despite good 2000-2003 larval production.
Ocean Survival All Oregon/Washington/British Columbia stock groups have remained depressed since the 2006 coast-wide collapse, suggesting that protracted poor ocean conditions were prevalent along the whole West Coast of North America. Scientists have developed various indices of oceanic environmental conditions. Of these, the Pacific Decadal Oscillation (PDO) Index and the Southern Oscillation Index (SOI) are useful in estimating how well smelt survive their ocean-phase.
22
The PDO is an index based on North Pacific sea surface temperature and pressure that correlates with changes in northeast Pacific marine ecosystem productivity. Warm PDO eras have coincided with enhanced coastal ocean biological productivity in Alaska and inhibited productivity off the west coast of the contiguous United States, while cold PDO eras have coincided with the opposite pattern. Pacific climate changes observed from late 1998 through early 2002 indicate favorable productivity in the coastal waters where eulachon migrate. These conditions, especially during the first year of ocean residency, would improve larvae-spawner survival rates. The increased eulachon returns to the Columbia River during 2001-2003 support this hypothesis; however, this relationship did not hold true during 2004-2008. Consistent warm ocean conditions between late 2002 and late 2004 probably had greater impacts on survival of the 1999-2003 broods than anticipated. While October-December PDO indices were cool, the annual average PDO indices for 2004-2006 were warm. Starting in 2007, ocean conditions cooled; however, it is unlikely that this will make up for the loss from the warm years. Recent trends in eulachon abundance also follow the SOI, which describes El Niño and La Niña events. In 1977, the index changed from a regular oscillation of El Niño and La Niña anomalies to fairly persistent El Niño conditions continuing through 1988. Eulachon returns were variable during this time. The period of 1990-1998 was dominated by extreme and persistent El Niño conditions, and during this time eulachon returns declined precipitously. Eulachon returns to the Columbia River remained at record low levels during 1993-2000. Beginning in 1998, La Niña conditions developed, and eulachon returns began increasing in 2001, in response to improved ocean rearing conditions. The sharp decline (1993-2000) and subsequent increase (2001-2003) in spawner abundance follow the onset of persistent El Niño and La Niña conditions by about three to four years, which is the dominant life cycle of eulachon. Unfavorable El Niño conditions returned in April 2001, and have persisted through early 2007. This may explain the poor returns in 2004-2008. These unfavorable ocean conditions likely impacted the survival of the 2004-2006 broods that will comprise the 2009 run. Starting in 2007 a weak La Niña condition has developed; however, it is unlikely that this will make up for the loss from the El Niño years. A more direct measure of ocean survival of smelt can be obtained from marine harvest data. Columbia River smelt are caught in the spring shrimp fisheries off the West Coast of Vancouver Island (WCVI); therefore, bycatch and test fishery information gathered by the CDFO during their annual spring shrimp surveys can be used as an indicator of Columbia River returns. Estimates of smelt bycatch biomass in the WCVI shrimp fisheries (Table 19) show that the biomass for 2005-2008 has been a degree of magnitude less than 2000-2004. This implies that the winter 2009 return of smelt to the Columbia River will be small.
Smelt Fishery Management
Prior to 1997, the Joint State’s smelt management and stock assessment activities had included commercial landings accounting, onboard monitoring of commercial fisheries, sampling of catch for biological data and age structure, and indexing larval production. Since 1997, a monitoring program has been in place that focuses primarily on the lower Columbia River commercial fishery. Data gathered during catch sampling and fishery monitoring included daily landings, CPUE, length, weight, sex, and allowed for analysis of trends in catch by time and area, run timing, and sex and age composition. Otoliths were collected annually from 1987-1999 to provide age class data in order to develop a better understanding of the population dynamics and parent/recruit relationships of Columbia River smelt.. These data work in conjunction to provide managers with the tools to monitor annual abundance and stock status.
23

Washington and Oregon Eulachon Management Plan In 2001, the WDFW, with input from ODFW, completed the Washington and Oregon Eulachon Management Plan (WOEMP) that contains recommended policies concerning smelt fishery management. These policies are wise-use management precepts that are consistent with the need to maintain an ecosystem approach to resource decisions.
Policy Recommendations for Eulachon Conservation and Fishery Management from the Washington and Oregon Eulachon Management Plan
Conservation Policy
Maintain healthy populations of eulachon while assuring the integrity of the ecosystem and habitat upon which they depend.
Management actions will consider the role of eulachon in both the marine and freshwater ecosystems and the need to maintain sufficient populations of eulachon for proper ecosystem functioning.
A precautionary approach to resource management shall be utilized. Consider the best scientific information available and strive to improve the information base for eulachon.
Fishery Management Recommendations Maintain commercial and recreational fishing opportunity in the lower Columbia River, to include opportunities in both mainstem and tributaries for both fleets.
The management plan includes recommendations concerning fisheries occurring in the mainstem Columbia River and its tributaries below Bonneville Dam. Fishery recommendations have been separated into three separate levels depending on run size expectations based on (1) parental run strength as indexed by fishery landings, (2) juvenile production as indicated by larval sampling, and (3) estimates of ocean productivity. Columbia River smelt fishing seasons have been adopted in accordance with the WOEMP since 2001.
Excerpts from the Washington and Oregon Eulachon Management Plan Describing Fisheries Recommended at Varying Run Size Expectations.
Level One Fisheries
Level One fisheries are recommended when there is great uncertainty in run strength or indications for a poor return. Level One fisheries would be the most conservative, and should be scheduled to effect a harvest rate of 10% or less. Data obtained from these fisheries should give us a better index of run strength and productivity. The purpose of Level One fisheries would be to gain some insight on spawning returns to the lower Columbia River and its tributaries. The intent would be to capture some of the variability of eulachon returns and further develop a fishery database while minimizing the risk of overexploiting the return.
The Joint Staff recommends one 12 - 24 hour fishing period per week for the mainstem Columbia River commercial fishery. Recreational and commercial dipnet fisheries consisting of one 12-24 hour fishing period per week would be used to monitor returns to the Cowlitz River. The daily bag limit for Washington tributaries should be ten pounds per person at these low levels of abundance. The Joint Staff recommends these fisheries be adopted for the January through March time frame with fisheries closed during the remainder of the year, except December as described below, as per permanent rules. These fisheries would be used to gain some real time insight of run size strength. Days and hours to be fished should be developed with the respective participants. The commercial fishery can be shaped to maximize marketing opportunities and the recreational fishery could, for instance, be conducted during a weekend day to maximize opportunity. Fishery monitoring data would be one factor used to make in-season decisions about increase of the fisheries to Level Two or Three. December opportunity should be allowed 24 hours a day and seven days per week in the mainstem Columbia commercial and recreational fisheries, as previously noted.
24
Level Two Fisheries
When fishery data indicates a promising abundance in the spawning return and productivity indices are favorable, yet it is still uncertain whether the run is moderate or strong, then fishing time would be increased to collect additional data concerning relative eulachon abundance. The trigger to extend the fishery from Level One to Two should be carefully deliberated. The Joint Staff does not currently have a specific recommendation for a Level Two trigger. We believe evidence of increased run strength beyond what was observed solely in Level One fisheries (e.g., the presence of significant concentrations of birds and marine mammals attending the run) should be considered as well when ramping up fisheries.
The Joint Staff recommends a two or three day commercial fishery in the mainstem Columbia River. The recreational and commercial dipnet fisheries in the Cowlitz River should be similarly increased to two or three days. Managers could also consider whether to expand recreational and commercial fisheries to lower Columbia tributaries other than the Cowlitz River. The Joint Staff recommends these fisheries be adopted for the January through March time frame with fisheries closed during the remainder of the year, except December in the mainstem, as per permanent rules. Fishery monitoring data would be one factor used to decide if it would be appropriate to increase fisheries to Level Three or decrease fisheries to Level One.
Level Three Fisheries
Level Three fisheries are the most liberal that the Joint Staff would recommend. The decision to adopt Level Three fishing opportunity would be based on very positive indicators of strong abundance and productivity and therefore a very low risk of overexploitation.
The Joint Staff recommends that Level Three fisheries be conducted up to four days per week in the Columbia River with additional commercial opportunity of up to four days per week in all lower Columbia River tributaries. Recreational fishing would be open in all tributaries for four to seven days per week. The Joint Staff recommends these fisheries be adopted for the January through March time frame with fisheries closed during the remainder of the year, except for December in the mainstem when fisheries are open with no daily closures, as per permanent rules. Increasing the daily bag limit for Washington recreational dippers from ten pounds per person per day is appropriate at this level of fishing. The increase could range from 15 to 25 pounds; the latter value would be consistent with Oregon regulations. Fishery monitoring data would be one factor used to decide if it would be appropriate to decrease fisheries to Level Two or One.
Smelt Fisheries
Smelt fisheries occur in the mainstem Columbia River and several tributaries, primarily the Cowlitz River. Mainstem fisheries consist primarily of a commercial fishery using gill nets with some commercial fishers using small trawls. Recreational dip net fishing is allowed, but nearly non-existent in the mainstem Columbia River. Tributary fisheries include both recreational and commercial fisheries with the Cowlitz River providing the most consistent fishing opportunities. Commercial and recreational tributary fisheries both use dip nets to capture smelt, with most recreational fisheries being bank fisheries and most commercial fisheries occurring by boat. Tribal harvest is minimal. The CITs lands have not been formally defined yet, so that group has not exerted fishing pressure on the resource. A minor harvest by the Yakama Nation typically occurs each year for subsistence purposes.
Past Commercial and Recreational Fisheries During 1960-1977, commercial smelt fisheries were open year-round 3½ days per week, except for 1965 and 1966 when the season was expanded to 4½ days per week. During 1978-1994, the commercial season was expanded to seven days per week but the season was reduced to the December-March time frame beginning in 1986 to better reflect the run timing of Columbia River smelt (Table 20). Large trawl gear was also prohibited in 1986. As Columbia River smelt abundance began to decline during the early 1990’s, fishery managers recognized the need to restrict fisheries to increase escapement to spawning areas. Lower Columbia River mainstem and tributary commercial fisheries were greatly reduced beginning in 1995 due to
25

exceptionally poor landings in 1993 and 1994 (Table 16). During 1995 and 1996, commercial fisheries were restricted to fewer fishing days per week, but the season was extended through the end of March. During 1997-2000, commercial fisheries were further restricted to test fisheries with limited days fished per week and a short season. These test fisheries were intended to allow minimal smelt catch and collection of biological data to provide fishery managers with data necessary to assess the annual run strength. Recreational fisheries in Washington tributaries were closed early during 1997-1999 in response to continued poor smelt returns to the Columbia River (Table 22). Tributaries in Washington State were closed to commercial fishing during 1999 and 2000; however, returns in 2001 were strong and both commercial and recreational fisheries were liberalized inseason consistent with the WOEMP (Table 21). The recreational smelt fishery is a longstanding fishery that occurs almost exclusively in the tributaries. Prior to 1997, the recreational fishery in Washington tributaries was open seven days per week the entire year (Table 22). Smelt dippers in Washington were allowed 20 pounds per person each day, but beginning in late 1998 the limit has sometimes been ten pounds per person. In Oregon the daily limit remains 25 pounds per person with the season open throughout the year. The recreational dip net fishery is very popular, drawing thousands of participants. Smelt are used for human consumption and are also in great demand for sturgeon bait. Annual recreational catch estimates are not available; however, limited past creel census information suggests that the recreational catch may equal the commercial landings in some years when smelt are abundant for a long period of time.
2008 Commercial Fisheries As per permanent regulations, the Columbia River is open seven days per week during December 2007. The Compact adopted a Level One fishery for the 2008 season. During January 1 – March 31, 2008, the mainstem Columbia River commercial fishery was open from 7 AM-4 PM on Mondays and Thursdays. The Cowlitz River was open from 6 PM to Midnight on Sundays and Wednesdays. The Sandy River was open year-round, seven days a week, 24 hours a day, per permanent regulations. Mainstem landings of 11,381 pounds were better than in 2007, but still very low relative to landings prior to 1995 and 2001-2004 (Table 16). Tributary landings totaled 5,900 pounds from the Cowlitz River. All other Washington tributaries were closed. No landings were reported from Oregon tributaries (i.e., Sandy River).
2008 Recreational Fisheries The mainstem Columbia River was open to both Washington and Oregon recreational fishers seven days per week on a 24-hour basis, with a bag limit of 25 pounds per person under Level One restrictions. The Washington tributary season was restricted to the Cowlitz River from 6 AM-10 PM on Saturdays with a bag limit of ten pounds per person. All Oregon tributaries were open to recreational dipping seven days per week the entire year as per permanent regulations. Recreational fishing was poor due to low abundance.
2009 Smelt Fishery Expectations Based on projections for poor smelt returns to the Columbia River in 2008-2009, the Joint Staff is recommending that 2008-2009 smelt fisheries operate consistent with Level One fisheries as described in the Washington and Oregon Eulachon Management Plan. Specific dates and times will be proposed at the December 18, 2008 Compact hearing. Level One fisheries should be adopted when there is either great uncertainty in run strength or indications of a poor return. The Joint Staff
26

looks at various indicators of abundance. Positive abundance indicators for 2009 include: (1) improved ocean survival rates due to cooling ocean conditions and a weak La Nina in 2008; (2) a slight increase in total smelt biomass tonnage in the Canadian ocean shrimp fisheries in 2008; and, (3) a low but improving level of Age 2 bycatch in the Canadian ocean shrimp fisheries during 2008. Negative abundance indices for 2009 include (1) low mainstem Columbia River larval densities during the winters of 2004 through 2006, (2) a significant decline in smelt bycatch in the Canadian ocean shrimp fisheries since 2002, and (3) low levels of Age 1 bycatch in Canadian ocean shrimp fisheries during 2004-2007. While the positive indicators suggest that things might improve in coming years, the negative indicators suggest a poor return to the Columbia River in 2009 is likely.
ENDANGERED SPECIES ACT (ESA)
Salmon and Steelhead Status reviews occurring since 1991 have resulted in the majority of Columbia Basin salmon and steelhead stocks being listed under the ESA. The TAC has prepared biological assessments (BAs) for combined fisheries based on relevant U.S. v Oregon management plans and agreements. The TAC has completed BAs of impacts to all ESA-listed salmonid stocks (including steelhead) for all mainstem Columbia River fisheries since January 1992, and for Snake River Basin fisheries since January 1993. The parties to U.S. v Oregon have re-negotiated a new plan covering Columbia River treaty Indian and non-Indian fisheries occurring from January 2008 through December 2017. This agreement titled “2008-2017 U.S. v Oregon Management Agreement” (2008-2017 MA) provides specific fishery management constraints for fall Chinook, steelhead, and coho. A BA concerning fishery-related impacts to ESA-listed species/stocks from Columbia River treaty Indian and non-Indian fisheries as described in the 2008-2017 MA was submitted to the NMFS and a Biological Opinion (BO) has been issued. This BO covers mainstem fisheries through December 31, 2017. Impacts to listed salmonid species from fisheries described in this report are expected to be de minimus.
Eulachon Smelt
At the time this document was prepared, NOAA Fisheries had not made a determination to list the Eulachon smelt; however, there should be one made prior to the December public hearing for winter 2009 smelt fisheries.
Green Sturgeon
On April 5, 2005, the NMFS filed a proposed rule to list the Southern DPS of the North American green sturgeon (those spawning in the Sacramento River, California) as threatened (70 FR 17386) and subsequently listed the Southern DPS as threatened (71 FR 17757) on April 7, 2006, effective July 6, 2006. The BO covering non-Indian fisheries described in the “2008-2017 U.S. v Oregon Management Agreement” also addresses impacts to green sturgeon. Given that (1) green sturgeon are essentially absent from the Columbia River during the winter and spring months, (2) commercial sale of green sturgeon from Columbia River commercial fisheries was prohibited effective July 6 2006, and (3) the retention of green sturgeon in Columbia River recreational fisheries was prohibited
27
28
effective January 1, 2007, impacts to green sturgeon from fisheries described in this report are expected to be de minimus.
Marbled Murrelet
The threatened status of the marbled murrelet has not changed since initially listed October 1, 1992. Fisheries described in this report are not likely to adversely affect this species.

Table 1. Estimated Abundance of 42-60 Inch White Sturgeon in the Lower Columbia River, 1987-2007. T o t a l L e n g t h I n t e r v a l (inches)
Year 42-48 48-60 42-60 1987 75,900 28,100 104,000 1988 34,400 33,700 68,100 1989 31,900 16,800 48,700 1990 25,800 12,000 37,800 1991 32,500 11,700 44,200 1992 70,400 8,700 79,100 1993 115,500 14,200 129,700 1994 1 N/A N/A N/A 1995 143,200 59,000 202,200 1996 137,100 33,500 170,600 1997 146,600 27,700 174,300 1998 116,800 23,900 140,700 1999 116,800 17,700 134,500 2000 117,300 17,400 134,700 2001 102,200 25,300 127,500 2002 87,400 34,200 121,600 2003 85,000 46,200 131,200 2004 1 N/A N/A N/A 2005 106,900 30,000 136,900 2006 88,100 35,300 123,400 2007 2 102,800 28,900 131,700
1. Abundance estimates for 1994 and 2004 were not developed due to data collection and modeling concerns. 2. Preliminary.
Table 2. Annual Recreational Catches of White Sturgeon in the Lower Columbia River and Comparisons to Catch Guidelines, 1993-2008¹. Below Wauna Above Wauna Combined
Year Catch
1. Recreational catch estimates for 1993-2002 are above and below the western tip of Puget Island. 2. Represents combined estimated harvest in the Columbia and Willamette rivers. Willamette River harvest is the amount
in excess of 1986-1996 baseline (1,225). 3. Final Willamette River harvest estimates were not available until 2008. 4. Actual in-season guidelines were different than represented here. 5. Projected.
Guideline Catch Adjusted Catch 23
AdjustedGuideline Catch Catch 2 Guideline
1993 20,107 Na 17,780 Na 37,900 1994 15,578 Na 17,893 Na 33,500 1995 29,714 Na 15,423 Na 45,100 1996 27,694 Na 15,068 Na 42,800 1997 24,511 Na 13,646 Na 38,200 53,840 1998 30,303 Na 11,293 Na 41,600 53,840 1999 29,238 Na 10,561 Na 39,800 40,000 2000 24,267 Na 16,238 Na 40,500 40,000 2001 21,619 Na 19,597 Na 41,200 39,500 2002 26,234 Na 12,045 Na 38,300 38,300 2003 18,367 19,200 13,565 13,811 12,800 31,932 32,178 32,000 2004 15,050 16,000 10,519 13,029 12,800 25,569 28,079 28,800 2005 17,911 17,783 11,891 12,979 11,560 4 29,802 30,890 29,343 2006 15,726 16,000 8,545 10,697 12,800 24,271 26,423 28,800 2007 19,131 16,274 10,675 15,316 13,852 4 29,806 34,447 30,126 2008 13,614 13,143 8,121 5 13,919 5 12,387 45 21,735 5 27,5335 25,530
29

Table 3. Summary of Recreational White Sturgeon Management Guidelines and Harvest, 2003-2008. Area 2003 2004 2005 2003-05
LCR Guideline 32,000 28,800 29,343 89,600 Harvest 32,178 28,079 30,890 91,147 No. remaining from guideline - 178 + 721 - 1,547 - 1,547
Above Wauna Management target 12,000 12,000 12,800 Management buffer + 800 + 800 0 No. remaining from guideline 0 0 -1,240 Guideline 12,800 12,800 11,560 Willamette harvest adjustment 1 -246 - 2,510 - 1,088 Mainstem harvest -13,565 -10,519 -11,891 No. remaining from guideline - 1,011 - 229 - 1,419
Below Wauna Management target 18,000 15,000 16,000 No. remaining from guideline 0 0 +1,783 Management buffer +1,200 +1,000 0 Guideline 19,200 16,000 17,783 Harvest -18,367 -15,050 -17,911 No. remaining from guideline + 833 + 950 - 128
Area 2006 2007 2008 2006-08
LCR Guideline 28,800 30,126 25,530 86,400 Harvest - 26,423 - 34,447 -27,533 -88,403 No. remaining from guideline + 2,377 - 4,321 -2,003 -2,003
Above Wauna Management target 12,000 12,000 12,800 Management buffer + 800 + 800 0 No. remaining from guideline 0 + 1,052 -413 Guideline 12,800 13,8522 12,3872 Willamette harvest adjustment 3 - 2,152 - 4,641 -5,798 Mainstem Harvest (proj. for 2008) - 8,545 -10,675 -8,1214 No. remaining from guideline + 2,103 - 1,464 -1,532
Below Wauna Management target 15,000 15,000 16,000 Management buffer +1,000 +1,000 0 No. remaining from guideline 0 + 274 - 2,857 Guideline 16,000 16,274 13,143 Harvest -15,726 -19,131 13,614 No. remaining from guideline + 274 - 2,857 -471
1. Harvest originally estimated at 0;1,418; and 0 for 2003-2005, respectively but was increased to 246; 2,510; and 1,088 based on final creel and punch card estimates for 2003-2005. The guideline for2005 has been adjusted accordingly.
2. 2007 and 2008 guidelines were initially adjusted to 14,900 based on a roll-over (~50% for each year) of un-harvested fish from 2006 prior to realization of the need to adjust for Willamette River harvest in excess of baseline levels. Given final estimates for 2006 Willamette River harvest, the actual adjusted annual guidelines for 2007 and 2008 should have been 13,852 and 13,851; respectively. However, the 2008 guideline was further decreased to 12,387 based on combined overages from 2006-2007.
3. Estimated Willamette River harvest (in excess of 1986-1996 baseline) based on harvest estimates from the Willamette creel program (March-June) expanded for non-observed months using angler punch card data.
4. Preliminary. Mainstem harvest estimated through November 2008 and projected for December 2008.
30
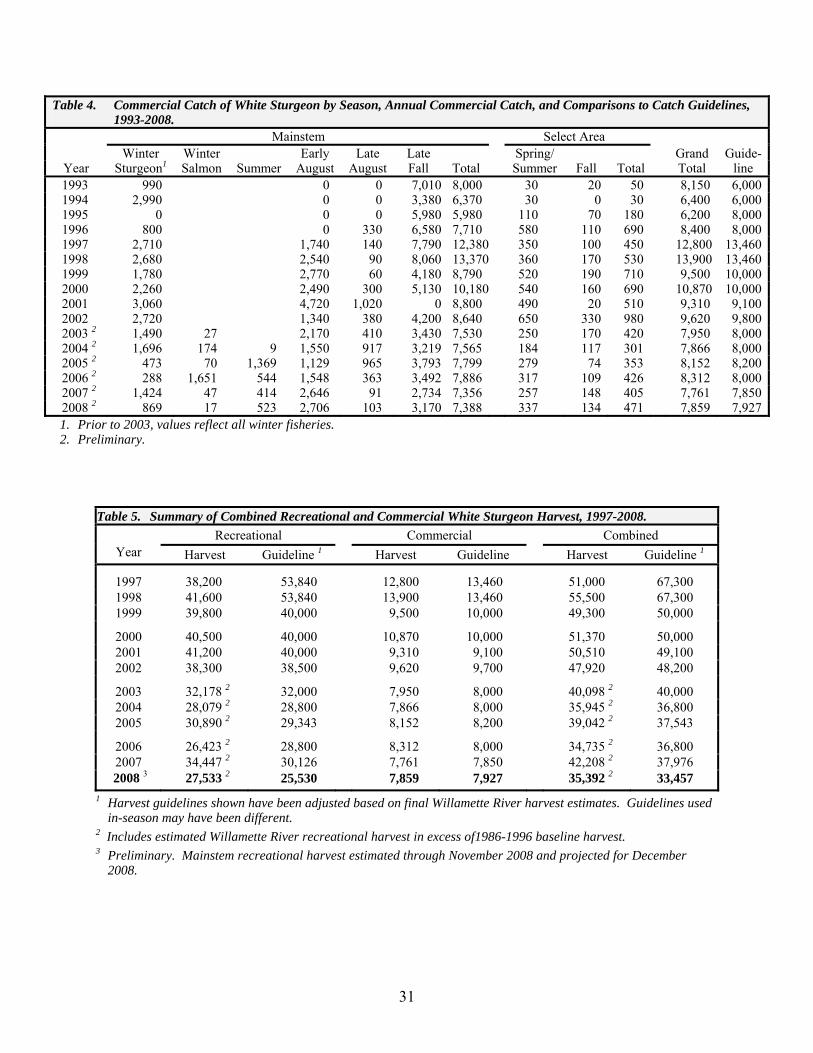
31
Table 4. Commercial Catch of White Sturgeon by Season, Annual Commercial Catch, and Comparisons to Catch Guidelines, 1993-2008. Mainstem Select Area
Winter Winter Early Late Late Spring/ Grand Guide-Year Sturgeon1 Salmon Summer August August Fall Total Summer Fall Total Total line
1993 990 0 0 7,010 8,000 30 20 50 8,150 6,0001994 2,990 0 0 3,380 6,370 30 0 30 6,400 6,0001995 0 0 0 5,980 5,980 110 70 180 6,200 8,0001996 800 0 330 6,580 7,710 580 110 690 8,400 8,0001997 2,710 1,740 140 7,790 12,380 350 100 450 12,800 13,4601998 2,680 2,540 90 8,060 13,370 360 170 530 13,900 13,4601999 1,780 2,770 60 4,180 8,790 520 190 710 9,500 10,0002000 2,260 2,490 300 5,130 10,180 540 160 690 10,870 10,0002001 3,060 4,720 1,020 0 8,800 490 20 510 9,310 9,1002002 2,720 1,340 380 4,200 8,640 650 330 980 9,620 9,8002003 2 1,490 27 2,170 410 3,430 7,530 250 170 420 7,950 8,0002004 2 1,696 174 9 1,550 917 3,219 7,565 184 117 301 7,866 8,0002005 2 473 70 1,369 1,129 965 3,793 7,799 279 74 353 8,152 8,2002006 2 288 1,651 544 1,548 363 3,492 7,886 317 109 426 8,312 8,0002007 2 1,424 47 414 2,646 91 2,734 7,356 257 148 405 7,761 7,8502008 2 869 17 523 2,706 103 3,170 7,388 337 134 471 7,859 7,9271. Prior to 2003, values reflect all winter fisheries. 2. Preliminary.
Table 5. Summary of Combined Recreational and Commercial White Sturgeon Harvest, 1997-2008.
Recreational Commercial Combined Year Harvest Guideline 1 Harvest Guideline Harvest Guideline 1
1997 38,200 53,840 12,800 13,460 51,000 67,300 1998 41,600 53,840 13,900 13,460 55,500 67,300 1999 39,800 40,000 9,500 10,000 49,300 50,000
2000 40,500 40,000 10,870 10,000 51,370 50,000 2001 41,200 40,000 9,310 9,100 50,510 49,100 2002 38,300 38,500 9,620 9,700 47,920 48,200
2003 32,178 2 32,000 7,950 8,000 40,098 2 40,000 2004 28,079 2 28,800 7,866 8,000 35,945 2 36,800 2005 30,890 2 29,343 8,152 8,200 39,042 2 37,543
2006 26,423 2 28,800 8,312 8,000 34,735 2 36,800 2007 34,447 2 30,126 7,761 7,850 42,208 2 37,976 2008 3 27,533 2 25,530 7,859 7,927 35,392 2 33,457
1 Harvest guidelines shown have been adjusted based on final Willamette River harvest estimates. Guidelines used in-season may have been different.
2 Includes estimated Willamette River recreational harvest in excess of1986-1996 baseline harvest. 3 Preliminary. Mainstem recreational harvest estimated through November 2008 and projected for December
2008.

Table 6. Fishing Periods, Gear, and Associated Sturgeon Catch for Mainstem Columbia River Commercial Seasons, 2008. Season Fishing Period Hours Zones Mesh STG Limit1 Deliveries WSTG
6 PM Jan. 8 – 6 PM Jan. 9 24 1-5 9-9¾” no limit 10 55 6 PM Jan. 15 – 6 PM Jan. 16 24 1-5 9-9¾” no limit 8 68 6 PM Jan. 22 – 6 PM Jan. 23 24 1-5 9-9¾” no limit 9 44 6 PM Jan. 29– 6 PM Jan. 30 24 1-5 9-9¾” no limit 8 113 6 PM Jan. 31 – noon Feb. 1 18 1-5 9-9¾” no limit 5 60 6 PM Feb. 5 – 6 PM Feb. 6 24 1-5 9-9¾” no limit 9 138 6 PM Feb. 7 – noon Feb. 8 18 1-5 9-9¾” no limit 6 123 6 PM Feb. 12 – 6 PM Feb. 13 24 1-5 9-9¾” no limit 14 79 6 PM Feb. 21 – noon Feb. 22 18 4-5 2 9-9¾” no limit 5 16 6 PM Feb. 26 – noon Feb. 27 18 4-5 2 9-9¾” no limit 3 118 6 PM Feb. 28 – noon Feb. 29 18 4-5 2 9-9¾” no limit 4 55
Winter Sturgeon
Winter Season Totals (and average deliveries) 7 869 1 PM – 11 PM Apr 1 10 4-5 2 <4¼” no limit 27 1 7 AM – 11 PM Apr 8 16 4-5 2 <4¼” no limit 64 4 3 AM – 3 PM Apr 15 12 4-5 2 <4¼” no limit 84 12
Spring Salmon
Spring Season Totals (and average deliveries) 58 17 Noon - 6 PM Jun. 30 6 4-5 3 <4½” 5 3 0 Sockeye
Sockeye Season Totals (and average deliveries) 3 0 7 PM June 24 – 5 AM June 25 10 1-5 8-9¾” 5 92 209 7 PM July 1 – 5 AM July 2 10 1-5 8-9¾” 5 66 181 Summer 7 PM July 7 – 5 AM July 8 10 1-5 8-9¾” 5 55 133
Summer Season Totals (and average deliveries) 71 523 7 PM Aug. 3 – 7 AM Aug. 4 12 1-5 9-9¾” 10 134 872 7 PM Aug. 5 – 7 AM Aug. 6 12 1-5 9-9¾” 10 105 281 7 PM Aug. 7 – 7 AM Aug. 8 12 1-5 9-9¾” 10 140 242 7 PM Aug. 10 – 7 AM Aug. 11 12 1-5 9-9¾” 10 179 1,009 7 PM Aug. 14 – 7 AM Aug. 15 12 2-5 9-9¾” 10 116 302 8 PM Aug. 19 – 6 AM Aug. 20 10 4-5 9-9¾” 3 56 38
August
11 PM Aug. 24 – 5 AM Aug. 25 6 4-5 9-9¾” 3 92 65 August Season Totals (and average deliveries) 117 2,809
7 AM - 7 PM Sep. 18 12 1-5 9-9¾” 10 115 1,021 7 PM Sep. 21 - 7 AM Sep. 22 12 1-5 8-9¾” 10 151 973 9 PM Sep 23 - 7 AM Sep. 24 10 4-5 8-9¾” 10 45 76 7 PM Sep 24 - 7 AM Sep. 25 12 4-5 8-9¾” 10 26 60 7 AM - 7 PM Sep 25 12 1-5 9-9¾” 10 48 194 7 PM Sep 25- 7 AM Sep 26 12 4-5 8-9¾” 10 20 22 7 PM Sep 28- 7 AM Sep 29 12 4-5 8-9¾” 10 48 308 7 PM Sep 29- 7 AM Sep 30 12 4-5 8-9¾” 10 39 153 7 PM Sep 30 - 7 AM Oct. 1 12 4-5 8-9¾” 10 25 26 7 PM Oct 1 - 7 AM Oct. 2 12 4-5 8-9¾” 10 28 58 7 PM Oct 2 - 7 AM Oct. 3 12 4-5 8-9¾” 10 21 1 7 PM Oct 8 - 7 AM Oct. 9 12 4-5 8-9¾” 3 19 46 7 PM Oct. 9 - 7 AM Oct. 10 12 4-5 8-9¾” 3 19 30 6 PM Oct. 15 - 6 AM Oct. 16 12 4-5 8-9¾” 3 12 32 7 AM - 7 PM Oct. 16 12 1-5 4 <9¾” 3 106 54 8 PM Oct. 16 - 8 AM Oct. 17 12 4-5 8- 9¾” 3 7 7 7 PM Oct. 21 - 7 AM Oct. 22 12 4-5 <9¾” 3 8 22 7 AM - 7 PM Oct. 22 12 1-3 5 <9¾” 3 49 27 7 PM Oct. 23 - 7 AM Oct. 24 12 4-5 <9¾” 3 3 1 7 PM Oct. 26- 7 AM Oct. 27 12 4-5 <9¾” 3 3 6 7 PM Oct. 28 - 7 AM Oct. 29 12 4-5 <9¾” 3 4 14 7 AM - 7 PM Oct. 29 12 1-3 5 <9¾” 3 27 33
Late Fall
7 PM Oct. 30 - 7 AM Oct. 31 12 4-5
1. White Sturgeon possession and sales limit (per vessel per week). The retention of green sturgeon is prohibited.
<9¾” 3 4 6 Late-Fall Season Totals (and average deliveries) 36 3,170
2. From Hayden Island powerlines (west towers) upstream to the upper end of the Zone 5 commercial fishing boundary at Beacon Rock.
3. Area 2S (from a true north/south line through navigation marker #50 near the mouth of Sandy River upstream to the upper end of the Zone 5 boundary at Beacon Rock).
4. Zones 1-3 upstream to the Longview Bridge and Zones 4-5. 5. Zones 1-3 upstream to the Longview Bridge.
32

Table 7. History of Sturgeon Regulations for the Lower Columbia River Recreational Fishery. Daily Annual Size
Year Bag Limit Bag Limit Restrictions Other Regulations Pre-1940 None None None None
1940 Only 3 < 4' " " "
1942 Five, (3 < 4' and 2 ≥ 4') " " "
1950 " " " 30" min.-72" max. " 1951 3 Fish " " " 1957 " " " Cannot remove head or tail in the field. 1958 " " 36" min.-72" max. 1986 2 Fish OR-30 " OR--required sturgeon tag: WA--no gaffing.
1989 " OR-30, WA-15 40" min.-72" max. WA--required sturgeon tag. New minimum size limit effective April 1.
1990 " 15 " Single-point barbless hooks required. OR--no gaffing.
1991 "1 and 1" slot limit " " Daily limit changed to one fish 40-<48" and one fish 48-72".
WA--60" max. length effective April 16, 1992-April 15,1993. WA--Beacon Rock to Bonneville Dam sturgeon spawning sanctuary (boat and bank) April 16-June 15, 1992. 1992 " " "
1994 " 10 42" min.-66" max. Daily limit changed to one fish 42-<48" and one fish 48-66".
1995 " " " LCR closed to retention September 1-December 31. One 42-66" fish daily bag limit effective April 1. Closed to boat angling from Beacon Rock to Bonneville Dam May 1-June 30. 1996 1 Fish " "
1997 " " 42" min.-60" max. 80% allocation of 67,300 annual harvest guideline to sport fishery (53,840). Harvest guideline adjusted to 50,000 in-season (40,000 sport). U.S. Army Corps implements Bonneville Boat Restricted Zone from Robins Is. to Hamilton Is. boat ramp. 1999 " " " Retention disallowed below Wauna powerlines April 1-30. Beacon Rock-Bonneville boat angling closure extended through 7/15. Annual limit 10 fish even if licensed in both states. 2000 " " "
2001 " " " LCR closed to retention August 1-September 30. LCR closed to retention on Sundays and Mondays during March 3-May 13 and seven days per week during July 25-November 22. 2002 " " "
2003 " " "
32,000 annual harvest guideline split 40% above Wauna and 60% below Wauna. Retention allowed above Wauna January 1-March 23 and July 1-October 31, and below Wauna January 1-June 27.
2004 " 5
42" min.-60" max. 45" min. below Wauna during May 15-July 3
28,800 annual harvest guideline split 12,800 above Wauna and 16,000 below Wauna. Retention allowed above Wauna January 1-31, then three days per week (Thur.-Sat.) during February 1-July 31 and October 1-December 31. Retention allowed below Wauna January 1-April 30 under permanent rules, then May 15-July 3 with a 45" minimum size limit. Closed to boat and bank angling from Beacon Rock to Bonneville Dam May 1-July 31. Annual limit reduced to five sturgeon.
2005 " "
42" min.-60" max. 45" min. below
Wauna during May 14-July 10- and
July 15-August 15
30,600 annual harvest guideline split 12,800 above Wauna and 17,800 below Wauna. Retention allowed above Wauna three days per week (Thur.-Sat.) January 1-July 31 and October 1-December 31. Retention allowed below Wauna January 1-April 30 under permanent rules, then May 14-July 10 and July 15-August 15 with a 45" minimum size limit.
2006 " "
42" min.-60" max. 45" min. below Wauna during May 13-July 4
28,800 annual harvest guideline split 12,800 above Wauna and 16,000 below Wauna. Retention allowed above Wauna three days per week (Thur.-Sat.) during January 1-July 31 and October 1-December 31. Retention allowed below Wauna January 1-April 30 under permanent rules, then May 13-July 4 with a 45" minimum size limit. Closed to boat and bank angling from Navigation Marker 85 to Bonneville Dam May 1-July 31.
2007 “ “
42" min.-60" max. 45" min. below Wauna during May 12-July 4
30,600 harvest guideline split 14,300 above Wauna and 16,274 below Wauna. Retention allowed above Wauna three days per week (Thur.-Sat.) January 1-31 and four days per week (Thur-Sun.) February 1-July 31 and seven days per week August 18-December 31. Sturgeon retention allowed below Wauna January 1-April 30 under permanent rules then May 12-July 4 with a 45” minimum size limit. Retention of green sturgeon prohibited.
33
2008 “ “
42" min.-60" max. 45" min. below Wauna during
May 10-July 26
Retention allowed above Wauna four days per week (Thur-Sun.) January 1-December 31. Sturgeon retention allowed below Wauna January 1-April 30 under permanent rules then May 10-June 24, July 10-12, July 17-19, and July 26 with a 45” minimum size limit. Retention of green sturgeon prohibited.

Table 8. Estimated Catch of White Sturgeon (in 1000's) in 1-Foot Legal Length Groups in Mainstem Lower Columbia River Commercial and Recreational Fisheries, 1977-2008. 1 Recreational Fisheries 2 Commercial Fisheries 3 3-4 Ft . 4-5 Ft . 5-6 Ft . 4-5 Ft 5-6 Ft
Year No. % No. % No. % Total No. % No. % Total 1977 20.1 78 4.4 17 1.3 5 25.8 9.1 94 0.6 6 9.7 1978 23.1 76 5.7 19 1.6 5 30.4 9.2 94 0.6 6 9.8 1979 23.5 75 6.1 19 1.8 6 31.4 19.2 94 1.3 6 20.5
1977-1979 Average 22.2 76 5.4 18 1.6 5 29.2 12.5 94 0.8 6 13.3
1980 21.3 79 4.1 15 1.6 6 27.0 9.1 97 0.3 3 9.4 1981 21.3 78 4.5 17 1.4 5 27.2 14.2 95 0.7 5 14.9 1982 19.7 78 4.3 17 1.1 4 25.1 10.8 93 0.8 7 11.6 1983 26.2 73 7.2 20 2.6 7 36.0 11.2 90 1.2 10 12.4 1984 34.2 81 6.5 15 1.2 3 42.0 16.1 92 1.4 8 17.5
1980-1984 Average
24.5 78 5.3 15 1.6 5 31.5 12.3 93 0.9 7 13.2
1985 37.0 84 5.3 12 1.5 3 43.8 7.6 90 0.8 10 8.4 1986 42.3 85 6.0 12 1.5 3 49.8 10.4 90 1.1 9 11.6 1987 55.0 88 5.9 9 1.6 3 62.4 8.8 91 0.8 8 9.7 1988 37.5 87 4.2 9 1.5 3 43.1 6.2 91 0.6 9 6.8 1989 20.8 82 3.5 14 1.0 4 25.4 4.5 90 0.5 10 5.0
1985-1989 Average 38.5 86 5.0 11 1.4 3 44.9 7.5 90 0.8 10 8.3
1990 14.0 81 2.5 14 0.7 4 17.3 4.6 87 0.6 11 5.3 1991 19.6 86 2.2 10 0.8 4 22.7 3.4 89 0.3 8 3.8 1992 34.9 87 4.2 10 1.0 3 40.1 6.0 97 0.2 3 6.2 1993 33.4 88 3.9 10 0.6 2 37.9 7.9 98 0.2 2 8.1 1994 25.9 77 7.0 21 0.6 2 33.5 6.3 98 0.1 2 6.4
1990-1994 Average 25.6 84 4.0 13 0.7 2 30.3 5.6 93 0.3 5 6.0
1995 35.9 80 8.9 20 0.3 1 45.1 6.1 98 0.1 2 6.2 1996 30.7 72 11.4 27 0.6 1 42.8 8.3 99 0.1 1 8.4 1997 29.0 76 9.1 24 <0.1 <1 38.2 12.8 100 0.0 0 12.8 1998 32.1 77 9.4 23 0.1 <1 41.6 13.9 100 0.0 0 13.9 1999 31.9 80 7.9 20 <0.1 <1 39.8 9.5 100 0.0 0 9.5
1995-1999 Average
31.9 77 9.3 22 0.2 <1 41.5 10.1 99 <0.1 <1 10.2
2000 33.3 82 7.2 18 <0.1 <1 40.5 10.9 100 0.0 0 10.9 2001 31.4 76 9.8 24 <0.1 <1 41.2 9.3 100 0.0 0 9.3 2002 29.9 78 8.4 22 <0.1 <1 38.3 9.8 100 0.0 0 9.8 20034 21.0 65 10.9 35 <0.1 <1 31.9 8.0 100 0.0 0 8.0 20044 13.6 53 12.0 47 <0.1 <1 25.6 7.9 100 0.0 0 7.9
2000-2004 Average 25.8 71 9.7 29 <0.1 <1 35.5 9.2 100 0.0 0 9.2
20054 17.2 58 12.6 42 0.1 <1 29.8 8.2 100 0.0 0 8.2 20064 13.9 57 10.4 43 <0.1 <1 24.3 8.3 100 0.0 0 8.3 2007 16.9 55 13.8 45 <0.1 <1 30.8 7.8 100 0.0 0 7.8 20085 10.5 49 11.1 51 <0.1 <1 21.7 7.9 100 0.0 0 7.9
1. Individual columns may not add up to total column due to rounding errors. Recreational harvest in the Willamette River is not included.
2. White sturgeon legal size limits were 36"-72" during 1977-1988, 40"-72" during 1989-1993, 42"-66" during 1994-1996, and 42"-60" thereafter.
3. White sturgeon legal size limits were 48"-72" during 1977-92, 48"-66" during 1993-96, and 48"-60" thereafter. 4. Commercial data is preliminary. 5. Preliminary data.
34

Table 9. Recreational and Commercial Sturgeon Catch (in 1,000’s) and White Sturgeon Catch Sharing Percentages in the Lower Columbia River, 1977-2008. W h i t e S t u r g e o n G r e e n S t u r g e o n
Recreational 1 Commercial 2 Total Recreational Commercial1 Total Year Catch % Catch % Catch Catch Catch Catch1977 25.8 73 9.7 27 35.5 0.0 0.8 0.8 1978 30.4 76 9.8 24 40.2 0.0 1.7 1.7 1979 31.4 61 20.5 39 51.9 0.0 1.2 1.2
1977-1979 Average
29.2 70 13.3 30 42.5 0.0 1.2 1.2
1980 27.0 74 9.4 26 36.4 0.0 1.7 1.7 1981 27.2 65 14.9 35 42.1 0.0 0.2 0.2 1982 25.1 68 11.6 32 36.7 0.0 0.8 0.8 1983 36.0 74 12.4 26 48.4 0.1 0.7 0.8 1984 42.0 71 17.5 29 59.5 0.1 2.7 2.8
1980-1984 Average
31.5 70 13.2 30 44.6 <0.1 1.2 1.3
1985 43.8 84 8.4 16 52.2 0.5 1.6 2.1 1986 49.8 81 11.6 19 61.4 0.4 6.0 6.4 1987 62.4 87 9.7 13 72.1 0.2 4.9 5.1 1988 43.1 86 6.8 14 49.9 0.1 3.3 3.4 1989 25.4 84 5.0 16 30.4 0.1 1.7 1.8
1985-1989 Average
44.9 84 8.3 16 53.2 <0.1 3.5 3.8
1990 17.3 77 5.3 23 22.6 0.1 2.2 2.3 1991 22.7 86 3.8 14 26.5 <0.1 3.2 3.2 1992 40.1 87 6.2 13 46.3 0.1 2.2 2.3 1993 37.9 82 8.1 18 46.0 <0.1 2.2 2.2 1994 33.5 84 6.4 16 39.9 0.1 0.2 0.3
1990-1994 Average
30.3 83 6.0 17 36.3 0.1 2.0 2.1
1995 45.1 88 6.2 12 51.3 <0.1 0.4 0.4 1996 42.8 84 8.4 16 51.2 0.1 0.6 0.7 1997 38.2 75 12.8 25 51.0 <0.1 1.6 1.6 1998 41.6 75 13.9 25 55.5 0.1 0.7 0.8 1999 39.8 80 9.5 20 49.3 0.1 0.8 0.9
1995-1999 Average
41.5 80 10.2 20 51.7 0.1 0.8 0.9
2000 40.5 79 10.9 21 51.4 <0.1 1.2 1.3 2001 41.2 82 9.3 18 50.5 0.1 0.3 0.4 2002 38.3 80 9.6 20 47.9 0.1 0.2 0.2
2003 3 32.2 80 8.0 20 40.2 0.1 <0.1 0.1 2004 3 28.1 78 7.9 22 35.9 <0.1 0.1 0.1 2000-2004 3
Average 36.1 80 9.1 20 45.2 <0.1 0.4 0.4
2005 3 30.9 79 8.2 21 39.0 0.1 0.1 0.2 2006 3 26.4 76 8.3 24 34.7 0.1 <0.1 0.1 2007 3 34.4 82 7.8 18 42.2 <0.1 0.0 <0.1 2008 4 27.5 78 7.9 22 35.4 0 0 0
1. Includes Willamette River harvest in excess of 1986-1996 baseline (1,225). 2. Includes Youngs Bay (1979-present) and other Select Area landings (1998-present). 3. Commercial landings are preliminary. 4. Preliminary data.
35

36
Table 10. Annual 3-6 Foot Abundance Estimates by Reservoir in the Zone 6, 1976-2007 Bonneville Pool The Dalles Pool John Day Pool
Abundance Abundance Abundance Year(s) Estimate Year Estimate Year Estimate
1976-1978 5,400 1987 18,900 1990 2,200 1989 17,900 1988 6,300 1996 24,100 1994 19,800 1994 6,500 2001 14,200 1999 45,600 1997 46,800 2004 12,800 2003 34,220 2002 20,600 2007 29,600 2006 42,100 2005 12,700
2008 pending
Table 11. Treaty Indian Commercial and Subsistence, and Non-Indian Recreational Catch of White Sturgeon
Zone 6 (1000's of fish), 1999-2008. Treaty Indian Commercial Treaty Indian Non-Indian Year Gill Net Setline Total Subsistence 1 Recreational
1999 1.7 1.4 3.1 0.2 2.4
2000 2.2 1.1 3.3 0.3 2.5
2001 2.4 0.9 3.3 0.5 2.4
2002 1.5 0.5 2.0 0.4 2.6
2003 1.3 0.2 1.5 0.4 2.1
2004 1.7 0.0 1.7 0.3 1.6
2005 1.6 0.1 1.7 0.3 1.1
2006 0.8 <0.1 0.9 0.2 1.0
2007 1.1 <0.1 1.1 0.2 1.0
20082 1.6 0.0 1.6 0.2 1.1
1. Numbers prior to 1999 are available in previous Winter Joint Staff Reports. 2. Preliminary estimates.
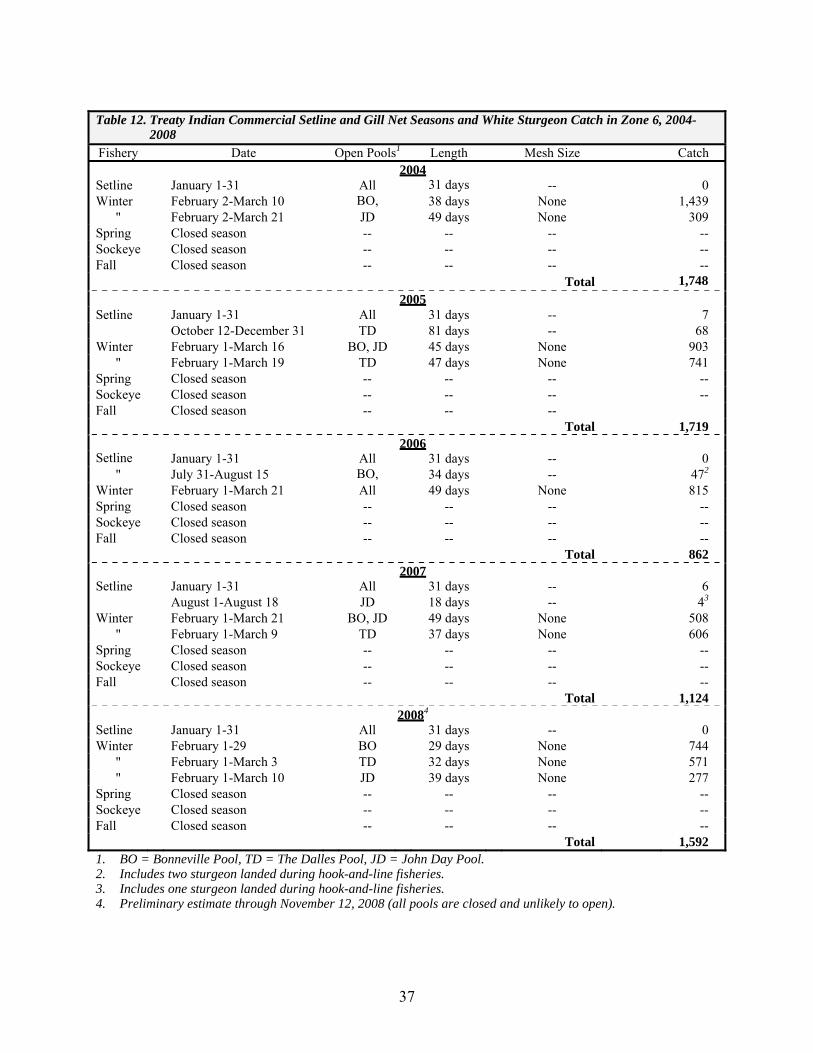
37
Table 12. Treaty Indian Commercial Setline and Gill Net Seasons and White Sturgeon Catch in Zone 6, 2004-
2008 Fishery Date Open Pools1 Length Mesh Size Catch 2004 Setline January 1-31 All 31 days -- 0 Winter February 2-March 10 BO, 38 days None 1,439
" February 2-March 21 JD 49 days None 309 Spring Closed season -- -- -- -- Sockeye Closed season -- -- -- -- Fall Closed season -- -- -- -- Total 1,748 2005 Setline January 1-31 All 31 days -- 7 October 12-December 31 TD 81 days -- 68 Winter February 1-March 16 BO, JD 45 days None 903
" February 1-March 19 TD 47 days None 741 Spring Closed season -- -- -- -- Sockeye Closed season -- -- -- -- Fall Closed season -- -- -- Total 1,719 2006 Setline January 1-31 All 31 days -- 0
" July 31-August 15 BO, 34 days -- 472 Winter February 1-March 21 All 49 days None 815 Spring Closed season -- -- -- -- Sockeye Closed season -- -- -- -- Fall Closed season -- -- -- -- Total 862 2007 Setline January 1-31 All 31 days -- 6
August 1-August 18 JD 18 days -- 43 Winter February 1-March 21 BO, JD 49 days None 508
" February 1-March 9 TD 37 days None 606 Spring Closed season -- -- -- -- Sockeye Closed season -- -- -- -- Fall Closed season -- -- -- -- Total 1,124 20084 Setline January 1-31 All 31 days -- 0 Winter February 1-29 BO 29 days None 744
" February 1-March 3 TD 32 days None 571 " February 1-March 10 JD 39 days None 277
Spring Closed season -- -- -- -- Sockeye Closed season -- -- -- -- Fall Closed season -- -- -- -- Total 1,592 1. BO = Bonneville Pool, TD = The Dalles Pool, JD = John Day Pool. 2. Includes two sturgeon landed during hook-and-line fisheries. 3. Includes one sturgeon landed during hook-and-line fisheries. 4. Preliminary estimate through November 12, 2008 (all pools are closed and unlikely to open).
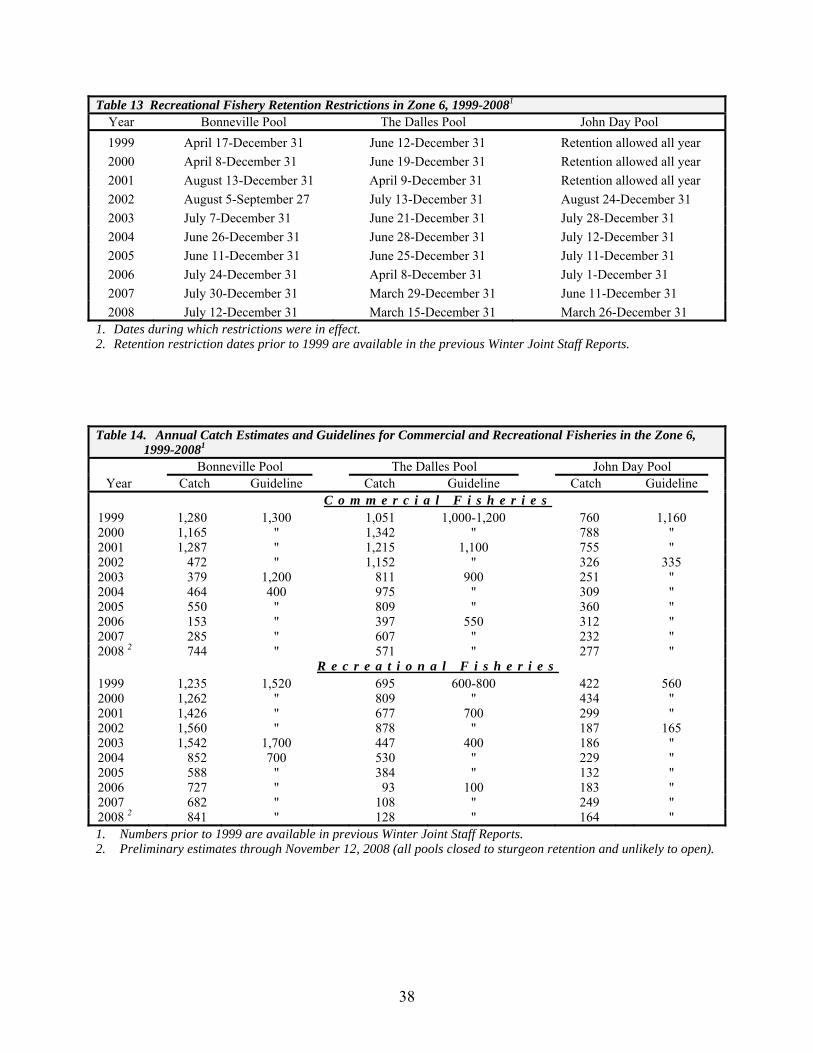
38
Table 13 Recreational Fishery Retention Restrictions in Zone 6, 1999-20081
Year Bonneville Pool The Dalles Pool John Day Pool 1999 April 17-December 31 June 12-December 31 Retention allowed all year 2000 April 8-December 31 June 19-December 31 Retention allowed all year 2001 August 13-December 31 April 9-December 31 Retention allowed all year 2002 August 5-September 27 July 13-December 31 August 24-December 31 2003 July 7-December 31 June 21-December 31 July 28-December 31 2004 June 26-December 31 June 28-December 31 July 12-December 31 2005 June 11-December 31 June 25-December 31 July 11-December 31 2006 July 24-December 31 April 8-December 31 July 1-December 31 2007 July 30-December 31 March 29-December 31 June 11-December 31 2008 July 12-December 31 March 15-December 31 March 26-December 31
1. Dates during which restrictions were in effect. 2. Retention restriction dates prior to 1999 are available in the previous Winter Joint Staff Reports. Table 14. Annual Catch Estimates and Guidelines for Commercial and Recreational Fisheries in the Zone 6,
1999-20081 Bonneville Pool The Dalles Pool John Day Pool
Year Catch Guideline Catch Guideline Catch Guideline C o m m e r c i a l F i s h e r i e s 1999 1,280 1,300 1,051 1,000-1,200 760 1,160 2000 1,165 " 1,342 " 788 " 2001 1,287 " 1,215 1,100 755 " 2002 472 " 1,152 " 326 335 2003 379 1,200 811 900 251 " 2004 464 400 975 " 309 " 2005 550 " 809 " 360 " 2006 153 " 397 550 312 " 2007 285 " 607 " 232 " 2008 2 744 " 571 " 277 " R e c r e a t i o n a l F i s h e r i e s 1999 1,235 1,520 695 600-800 422 560 2000 1,262 " 809 " 434 " 2001 1,426 " 677 700 299 " 2002 1,560 " 878 " 187 165 2003 1,542 1,700 447 400 186 " 2004 852 700 530 " 229 " 2005 588 " 384 " 132 " 2006 727 " 93 100 183 " 2007 682 " 108 " 249 " 2008 2 841 " 128 " 164 " 1. Numbers prior to 1999 are available in previous Winter Joint Staff Reports. 2. Preliminary estimates through November 12, 2008 (all pools closed to sturgeon retention and unlikely to open).

Table 15. Treaty Indian Season Specific Landings by Pool and Associated Catch Guidelines, 2008. 1 January Winter Summer Fall Commercial Reservoir Setline Gill Net Setline Setline Total Guideline Bonneville 0 744 0 0 744 400 The Dalles 0 571 0 0 571 550 John Day 0 277 0 0 277 335
Total 0 1,592 0 0 1,592 1,285 1. Preliminary through November 12, 2008 (all pools closed to sturgeon retention and unlikely to open). Table 16. Columbia River and Tributary Smelt Commercial Landings (in thousands of pounds), 1938-2008. Columbia Grays Cowlitz Kalama Lewis Sandy
Year(s) River River River River River River Total 1938-1949 Range 200-1,000 0-59 1-3,000 0-77 0-2,000 0-1,400 1,000-5,700
Average 610 18 1,400 13 300 300 3,000 1950-1959 Range 400-1,300 0-16 0-2,000 0-44 0-900 0-500 1,300-2,600
Average 800 3 700 11 200 100 1,800 1960-1969 Range 100-800 0-53 1,000 0-0 0-82 0-0 800-1,500
Average 700 10 600 0 8 0 1,100 1970-1979 Range 900 0-6 100 0-300 0-900 0-800 500-3,200
Average 300 1 1,400 4 100 100 2,000 1980-1989 Range 53-500 0-35 100-3,700 0-8 0-2,700 0-300 500-3,800 Average 200 4 2,500 1 600 59 2,400
1990 6.4 0.0 2,756.2 0.0 21.6 0.0 2,784.2 1991 5.8 0.0 2,944.6 0.0 0.0 0.0 2,950.4 1992 0.8 0.0 3,673.0 0.0 0.0 0.0 3,673.8 1993 33.2 0.0 413.9 66.8 0.0 0.0 513.9 1994 0.2 0.0 43.2 0.0 0.0 0.0 43.4 1995 7.7 0.0 431.4 0.9 0.0 0.0 440.0 1996 7.1 0.0 2.0 0.0 0.0 0.0 9.1 1997 37.1 0.0 21.5 0.0 0.0 0.0 58.6 1998 11.9 0.0 0.2 0.0 0.0 0.0 12.1 1999 20.9 0.0 0.0 0.0 0.0 0.0 20.9 2000 31.0 0.0 0.0 0.0 0.0 0.0 31.0 2001 158.8 0.0 154.3 0.0 0.0 0.0 313.1 2002 58.0 0.0 169.6 0.0 493.6 0.0 721.2 2003 66.9 0.0 464.4 0.0 529.1 23.0 1,083.4 2004 15.4 0.0 216.2 0.0 0.0 0.0 231.7 2005 0.1 0.0 0.1 0.0 0.0 0.0 0.2 2006 13.1 0.0 0.0 0.0 0.0 0.0 13.1 2007 7.1 0.0 1.2 0.0 0.0 0.0 8.3 2008 11.4 0.0 5.9 0.0 0.0 0.0 17.3
1. Season totals may contain landings from previous December.
39

Table 17. Weekly and Total Smelt CPUE's and Smelt Catch in Columbia River Commercial Fisheries, 1988-2008.1
C P U E ’ s b y S t a t i s t i c a l W e e k Season Totals Year 1 2 3 4 5 6 7 8 CPUE Catch2
1988 0 0 125 702 78 214 0 0 535 14,500 1989 0 0 0 101 0 0 0 0 1,396 58,600 1990 0 409 445 1,650 0 0 0 0 709 6,400 1991 0 0 86 113 0 107 685 0 389 5,800 1992 0 0 0 0 0 232 290 0 192 2,300 1993 0 0 0 0 18 0 224 2,136 1,841 29,500 1994 0 53 0 0 0 0 0 0 59 235 1995 150 59 8 48 550 157 265 31 180 7,600 1996 50 46 41 151 124 0 445 59 95 7,100 1997 0 22 79 94 168 216 672 214 304 37,100 1998 0 0 40 223 94 30 17 0 134 11,800 1999 0 25 21 123 146 183 297 110 172 20,800 2000 151 37 195 63 371 123 312 266 185 31,040 2001 0 0 0 0 0 520 1,604 2,322 1,985 158,800 2002 27 371 733 3,925 1,433 1,041 164 0 1,567 57,990 2003 64 497 1,260 0 445 590 778 4,350 1,133 66,880 2004 0 0 0 0 100 845 70 26 477 14,788 2005 0 0 0 0 25 28 0 0 27 108 2006 132 113 144 172 194 209 14 0 156 13,099 2007 53 285 37 10 0 0 0 204 122 7,087 2008 17 388 1,505 50 0 758 7,634 577 129 11,381 1. CPUE = pounds per delivery. These statistical weeks typically represent the first eight calendar weeks of the year
(about January 1 through February 15). 2 . Season total catch may include catch during the previous December
Table 18. Results of Larval Sampling Program in the Lower Columbia River Basin, 1986-2008. 1 C a t c h ( L a r v a e p e r c u b i c m e t e r ) 2
Mainstem Cowlitz Grays Elochoman Kalama Lewis Sandy Year Columbia River River River River River River 1986 N/S 8.1 N/S N/S N/S N/S N/S
1994 N/S 0.7 N/S N/S N/S N/S N/S 1995 N/S 19.7 N/S N/S 32.4 N/S N/S 1996 0.8 1.2 N/S N/S 0.2 N/S N/S 1997 3.9 0.7 N/S 1.5 0.3 0.0 N/S 1998 0.9 0.5 2.8 22.1 0.3 0.0 0.1 1999 0.7 0.2 0.6 0.8 0.4 0.0 0.1 2000 1.3 41.6 25.7 3.5 0.1 0.2 0.1 2001 42.1 192.0 24.4 0.0 5.5 17.6 N/S 2002 28.2 283.0 N/S N/S 0.5 0.6 N/S 2003 12.3 1.4 N/S 24.5 N/S 36.2 0.1 2004 3.5 0.9 20.4 N/S N/S N/S N/S 2005 0.3 N/A 0.6 N/S N/S N/S N/S 2006 0.7 0.1 0.0 N/S N/S N/S N/S 2007 0.7
1. Inter-annual comparisons of abundance are tentative as sampling has not been systematic from year to year. Mainstem Columbia River data since 2003 includes multiple collections at Price Island and Clifton Channel sites.
2. N/S = not sampled.
2.8 N/S N/S N/S 0.3 N/S 2008 1.1 6.2 44.0 3.3 N/S <0.1 N/S
40
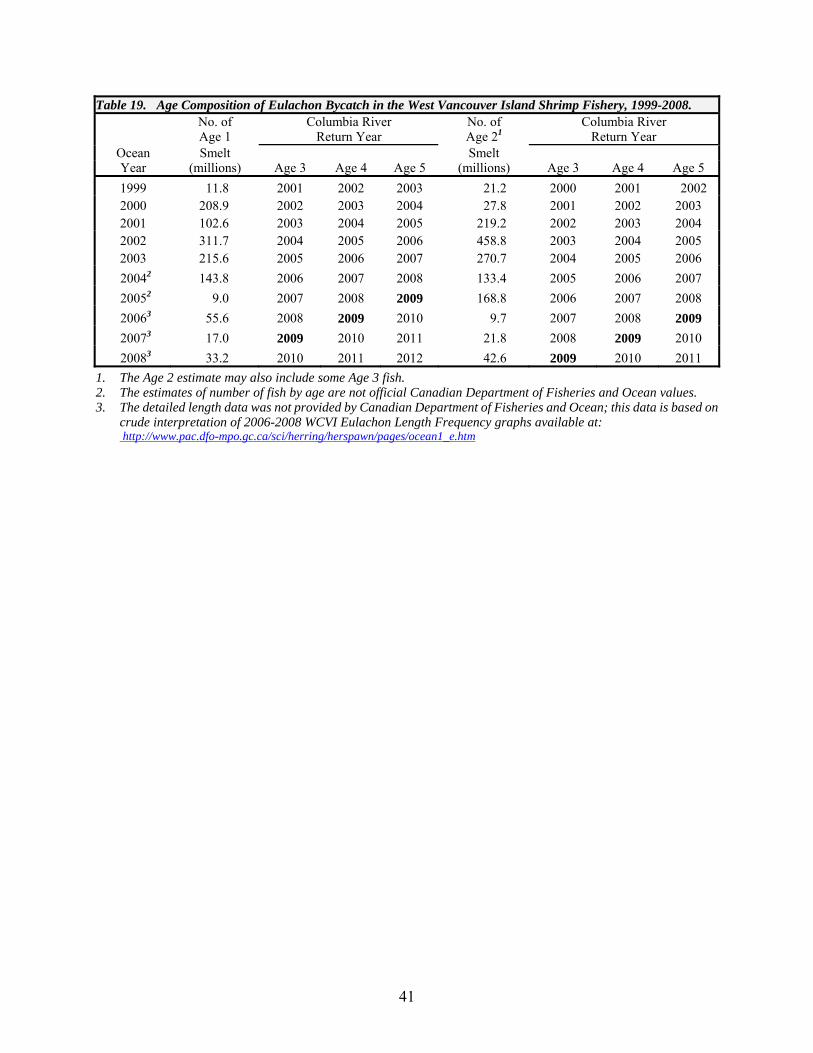
41
Table 19. Age Composition of Eulachon Bycatch in the West Vancouver Island Shrimp Fishery, 1999-2008. No. of Columbia River No. of Columbia River Age 1 Return Year Age 21 Return Year
Ocean Smelt Smelt Year (millions) Age 3 Age 4 Age 5 (millions) Age 3 Age 4 Age 5 1999 11.8 2001 2002 2003 21.2 2000 2001 2002 2000 208.9 2002 2003 2004 27.8 2001 2002 2003 2001 102.6 2003 2004 2005 219.2 2002 2003 2004 2002 311.7 2004 2005 2006 458.8 2003 2004 2005 2003 215.6 2005 2006 2007 270.7 2004 2005 2006 20042 143.8 2006 2007 2008 133.4 2005 2006 2007 20052 9.0 2007 2008 2009 168.8 2006 2007 2008 20063 55.6 2008 2009 2010 9.7 2007 2008 2009 20073 17.0 2009 2010 2011 21.8 2008 2009 2010 20083 33.2 2010 2011 2012 42.6 2009 2010 2011
1. The Age 2 estimate may also include some Age 3 fish. 2. The estimates of number of fish by age are not official Canadian Department of Fisheries and Ocean values. 3. The detailed length data was not provided by Canadian Department of Fisheries and Ocean; this data is based on
crude interpretation of 2006-2008 WCVI Eulachon Length Frequency graphs available at: http://www.pac.dfo-mpo.gc.ca/sci/herring/herspawn/pages/ocean1_e.htm

Table 20. Mainstem Columbia River Commercial Smelt Seasons, 1960-2008.
Year Season Fishery Level1 Weekly Period Days Open 1960-1964 Jan. 1 – Dec. 31 -- 12 PM Sat – 12 AM Wed ~255 1965-1966 Jan. 1 – Dec. 31 -- 12 AM Sat – 12 AM Thu ~307 1967-1977 Jan. 1 – Dec. 31 -- 12 PM Sat – 12 AM Wed ~255 1978-1984 Jan. 1 – Dec. 31 -- 7 days/week 365
1985 Jan. 1 – Dec. 31 -- 7 days/week 365 (Feb. 22 – Mar.1) (Lower deadline at Cowlitz R) 1986-1994 Dec. 1 – Mar. 31 -- 7 days/week 121 1994/1995 Dec. 7 – Jan. 7 -- 7 days/week 38
Jan. 7 – Mar. 31 -- 8 PM Sat – 8 AM Wed 48 1995/1996 Dec. 1 – Feb. 2 -- 7 days/week 64
Feb. 3 – Mar. 31 -- Noon Mon – 6 PM Fri 32 1996/1997 Dec. 1 – Jan. 27 -- 7 days/week 58 Jan. 30 – Feb. 21 -- 6 AM Thu – 6 PM Fri 8 1997/1998 Dec. 1 – Dec. 31 -- 7 days/week 31 Jan. 2 – Feb. 13 -- 6 AM – 6 PM Mon & Fri 13 1998/1999 Dec. 1 - Dec. 23 -- 7 days/week 23
Dec. 30 - Feb. 102 -- 7 AM - 7 PM Wed 7 1999/2000 Dec 1 - Dec 26 -- 7 days/week 26
Dec. 29 Feb. 23 -- 7 AM - 7 PM Wed 9 Dec 1 - Dec 31 --3 7 days/week 31 2000/2001
Jan. 3 - Mar. 7 One 3 AM - 9 PM Wed 10 Mar. 12 - Mar. 31 Two (3/06) 3 AM - 9 PM Mon & Wed 6
Dec. 1 - Dec. 31 --3 7 days/week 31 2001/2002 Jan. 2 - Jan. 31 Two 3 AM - 9 PM Sun & Wed 9 Feb. 1 - Mar. 31 Two (1/31) 3 AM - 9 PM Sun, Wed & Fri 26
Dec. 1 - Dec. 31 --3 7 days/week 31 2002/2003 Jan. 1- Mar. 31 Three 3 AM - 9 PM Sun, Tues, Thurs, & Fri 51
Dec. 1- Dec. 31 --3 7 days/week 31 2003/2004 Jan. 1 - Mar. 21 Three 3 AM – 9PM Sun, Tues, Thurs, & Fri 34 Mar. 22- Mar. 31 Two (3/18) 3 AM – 9 PM Fri, & Sun 2
Dec. 1 - Dec. 31 --3 7 days/week 31 2004/2005 Jan. 1- Feb. 23 Two 3 AM - 9 PM Mon, & Thurs 15 Feb. 24 – Mar. 31 One (2/23) 3 AM – 9 PM Thurs 6
Dec. 1 – Dec. 31 --3 7 days/week 31 2005/2006 Jan. 1 – Mar. 2 One 7 AM - 4 PM Mon, & Thurs 20 Mar. 7 One (3/08) 7 AM - 4 PM Mon 1 Mar. 13 – Mar. 31 One (3/08) 7 AM - 4 PM Mon, & Thurs 6
Dec. 1 - Dec. 31 --3 7 days/week 31 2006/2007 Jan. 1 - Mar. 31 One 7 AM - 4 PM Mon, & Thurs 20 Mar. 11 One (3/05) 7 AM - 4 PM Sun 1 Mar. 15- Mar. 31 One (3/05) 7 AM - 4 PM Mon, & Thurs 5
Dec. 1 - Dec. 31 --3 7 days/week 31 2007/2008 Jan. 1 - Mar. 31 One 7 AM - 4 PM Mon, & Thurs 26
1. Fisheries levels are described in the Washington and Oregon Eulachon Management Plan. 2. Also, a second reduced test fishery (1-3 boats with State observers onboard) occurred on January 31, February 7, and
February 18, 1999 during daylight hours. 3. Under permanent rules, December 1-31 is open 7 days/week, 24 hours/day.
42
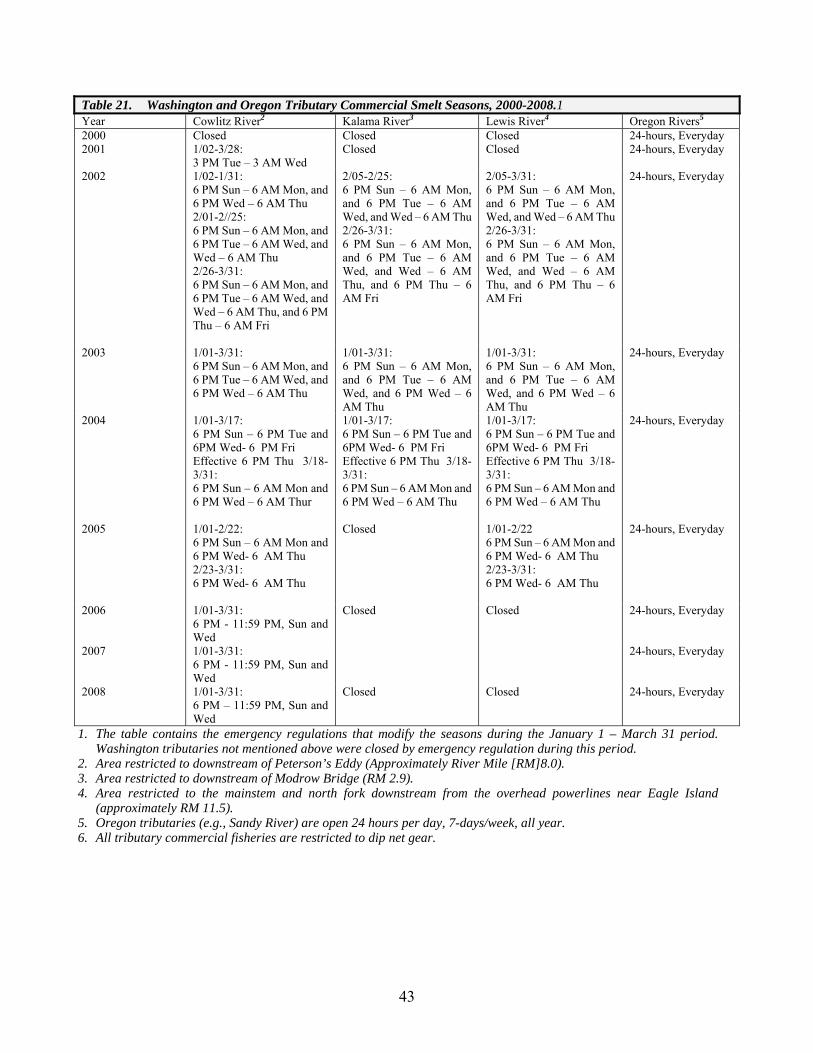
Table 21. Washington and Oregon Tributary Commercial Smelt Seasons, 2000-2008.1 Year Cowlitz River2 Kalama River3 Lewis River4 Oregon Rivers5 2000 Closed Closed Closed 24-hours, Everyday 2001 1/02-3/28:
3 PM Tue – 3 AM Wed Closed Closed 24-hours, Everyday
2002 1/02-1/31: 6 PM Sun – 6 AM Mon, and 6 PM Wed – 6 AM Thu 2/01-2//25: 6 PM Sun – 6 AM Mon, and 6 PM Tue – 6 AM Wed, and Wed – 6 AM Thu 2/26-3/31: 6 PM Sun – 6 AM Mon, and 6 PM Tue – 6 AM Wed, and Wed – 6 AM Thu, and 6 PM Thu – 6 AM Fri
2/05-2/25: 6 PM Sun – 6 AM Mon, and 6 PM Tue – 6 AM Wed, and Wed – 6 AM Thu 2/26-3/31: 6 PM Sun – 6 AM Mon, and 6 PM Tue – 6 AM Wed, and Wed – 6 AM Thu, and 6 PM Thu – 6 AM Fri
2/05-3/31: 6 PM Sun – 6 AM Mon, and 6 PM Tue – 6 AM Wed, and Wed – 6 AM Thu 2/26-3/31: 6 PM Sun – 6 AM Mon, and 6 PM Tue – 6 AM Wed, and Wed – 6 AM Thu, and 6 PM Thu – 6 AM Fri
24-hours, Everyday
2003 1/01-3/31: 6 PM Sun – 6 AM Mon, and 6 PM Tue – 6 AM Wed, and 6 PM Wed – 6 AM Thu
1/01-3/31: 6 PM Sun – 6 AM Mon, and 6 PM Tue – 6 AM Wed, and 6 PM Wed – 6 AM Thu
1/01-3/31: 6 PM Sun – 6 AM Mon, and 6 PM Tue – 6 AM Wed, and 6 PM Wed – 6 AM Thu
24-hours, Everyday
2004 1/01-3/17: 6 PM Sun – 6 PM Tue and 6PM Wed- 6 PM Fri Effective 6 PM Thu 3/18-3/31: 6 PM Sun – 6 AM Mon and 6 PM Wed – 6 AM Thur
1/01-3/17: 6 PM Sun – 6 PM Tue and 6PM Wed- 6 PM Fri Effective 6 PM Thu 3/18-3/31: 6 PM Sun – 6 AM Mon and 6 PM Wed – 6 AM Thu
1/01-3/17: 6 PM Sun – 6 PM Tue and 6PM Wed- 6 PM Fri Effective 6 PM Thu 3/18-3/31: 6 PM Sun – 6 AM Mon and 6 PM Wed – 6 AM Thu
24-hours, Everyday
2005 1/01-2/22: 6 PM Sun – 6 AM Mon and 6 PM Wed- 6 AM Thu 2/23-3/31: 6 PM Wed- 6 AM Thu
Closed 1/01-2/22 6 PM Sun – 6 AM Mon and 6 PM Wed- 6 AM Thu 2/23-3/31: 6 PM Wed- 6 AM Thu
24-hours, Everyday
2006 1/01-3/31: 6 PM - 11:59 PM, Sun and Wed
Closed Closed 24-hours, Everyday
24-hours, Everyday 2007 1/01-3/31: 6 PM - 11:59 PM, Sun and Wed
2008 1/01-3/31: 6 PM – 11:59 PM, Sun and Wed
Closed Closed 24-hours, Everyday
1. The table contains the emergency regulations that modify the seasons during the January 1 – March 31 period. Washington tributaries not mentioned above were closed by emergency regulation during this period.
2. Area restricted to downstream of Peterson’s Eddy (Approximately River Mile [RM]8.0). 3. Area restricted to downstream of Modrow Bridge (RM 2.9). 4. Area restricted to the mainstem and north fork downstream from the overhead powerlines near Eagle Island
(approximately RM 11.5). 5. Oregon tributaries (e.g., Sandy River) are open 24 hours per day, 7-days/week, all year. 6. All tributary commercial fisheries are restricted to dip net gear.
43
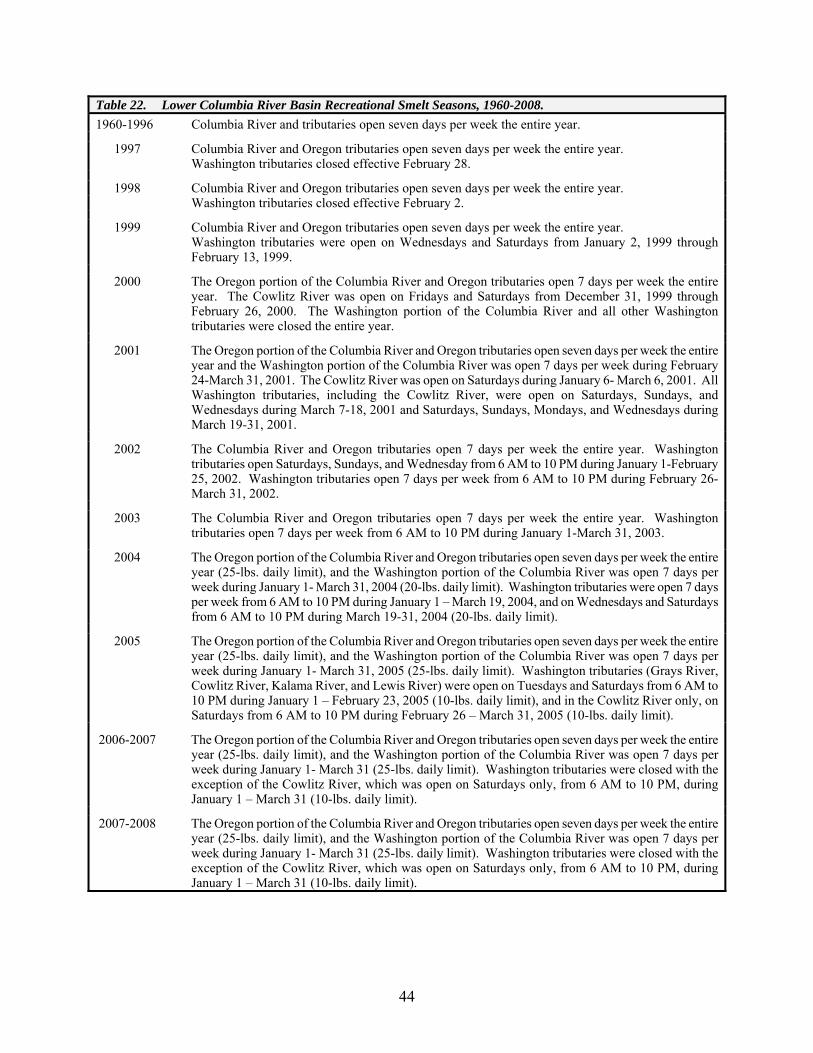
Table 22. Lower Columbia River Basin Recreational Smelt Seasons, 1960-2008. 1960-1996 Columbia River and tributaries open seven days per week the entire year.
1997 Columbia River and Oregon tributaries open seven days per week the entire year. Washington tributaries closed effective February 28.
1998 Columbia River and Oregon tributaries open seven days per week the entire year. Washington tributaries closed effective February 2.
1999 Columbia River and Oregon tributaries open seven days per week the entire year. Washington tributaries were open on Wednesdays and Saturdays from January 2, 1999 through February 13, 1999.
2000 The Oregon portion of the Columbia River and Oregon tributaries open 7 days per week the entire year. The Cowlitz River was open on Fridays and Saturdays from December 31, 1999 through February 26, 2000. The Washington portion of the Columbia River and all other Washington tributaries were closed the entire year.
2001 The Oregon portion of the Columbia River and Oregon tributaries open seven days per week the entire year and the Washington portion of the Columbia River was open 7 days per week during February 24-March 31, 2001. The Cowlitz River was open on Saturdays during January 6- March 6, 2001. All Washington tributaries, including the Cowlitz River, were open on Saturdays, Sundays, and Wednesdays during March 7-18, 2001 and Saturdays, Sundays, Mondays, and Wednesdays during March 19-31, 2001.
2002 The Columbia River and Oregon tributaries open 7 days per week the entire year. Washington tributaries open Saturdays, Sundays, and Wednesday from 6 AM to 10 PM during January 1-February 25, 2002. Washington tributaries open 7 days per week from 6 AM to 10 PM during February 26-March 31, 2002.
2003 The Columbia River and Oregon tributaries open 7 days per week the entire year. Washington tributaries open 7 days per week from 6 AM to 10 PM during January 1-March 31, 2003.
2004 The Oregon portion of the Columbia River and Oregon tributaries open seven days per week the entire year (25-lbs. daily limit), and the Washington portion of the Columbia River was open 7 days per week during January 1- March 31, 2004 (20-lbs. daily limit). Washington tributaries were open 7 days per week from 6 AM to 10 PM during January 1 – March 19, 2004, and on Wednesdays and Saturdays from 6 AM to 10 PM during March 19-31, 2004 (20-lbs. daily limit).
2005 The Oregon portion of the Columbia River and Oregon tributaries open seven days per week the entire year (25-lbs. daily limit), and the Washington portion of the Columbia River was open 7 days per week during January 1- March 31, 2005 (25-lbs. daily limit). Washington tributaries (Grays River, Cowlitz River, Kalama River, and Lewis River) were open on Tuesdays and Saturdays from 6 AM to 10 PM during January 1 – February 23, 2005 (10-lbs. daily limit), and in the Cowlitz River only, on Saturdays from 6 AM to 10 PM during February 26 – March 31, 2005 (10-lbs. daily limit).
2006-2007 The Oregon portion of the Columbia River and Oregon tributaries open seven days per week the entire year (25-lbs. daily limit), and the Washington portion of the Columbia River was open 7 days per week during January 1- March 31 (25-lbs. daily limit). Washington tributaries were closed with the exception of the Cowlitz River, which was open on Saturdays only, from 6 AM to 10 PM, during January 1 – March 31 (10-lbs. daily limit).
2007-2008 The Oregon portion of the Columbia River and Oregon tributaries open seven days per week the entire year (25-lbs. daily limit), and the Washington portion of the Columbia River was open 7 days per week during January 1- March 31 (25-lbs. daily limit). Washington tributaries were closed with the exception of the Cowlitz River, which was open on Saturdays only, from 6 AM to 10 PM, during January 1 – March 31 (10-lbs. daily limit).
44