joint technical summit on reliability impacts of extreme ... impacts of climate change...joint...
TRANSCRIPT
Electric Power Research Institute 3420 Hillview Avenue, Palo Alto, California 94304-1338 • PO Box 10412, Palo Alto, California 94303-0813 USA
800.313.3774 • 650.855.2121 • [email protected] • www.epri.com
Electric Power Research Institute 3420 Hillview Avenue, Palo Alto, California 94304-1338 • PO Box 10412, Palo Alto, California 94303-0813 USA
800.313.3774 • 650.855.2121 • [email protected] • www.epri.com
Joint Technical Summit on Reliability Impacts of Extreme Weather and Climate Change

EPRI Project Manager R. Entriken K. Forsten
ELECTRIC POWER RESEARCH INSTITUTE 3420 Hillview Avenue, Palo Alto, California 94304-1338 • PO Box 10412, Palo Alto, California 94303-0813 • USA
800.313.3774 • 650.855.2121 • [email protected] • www.epri.com
Joint Technical Summit on Reliability Impacts of Extreme Weather and Climate Change
1016095
Proceedings, December 2008
Co-Sponsors North American Electricity Reliability Corporation 116-390 Village Boulevard Princeton, NJ 08540-5721 Project Manager M. Lauby Power Systems Engineering Research Center Arizona State University 577 Engineering Research Center Box 878606 Tempe, AZ 85287-8606 Project Manager W. Jewell
DISCLAIMER OF WARRANTIES AND LIMITATION OF LIABILITIES
THIS DOCUMENT WAS PREPARED BY THE ORGANIZATION(S) NAMED BELOW AS AN ACCOUNT OF WORK SPONSORED OR COSPONSORED BY THE ELECTRIC POWER RESEARCH INSTITUTE, INC. (EPRI). NEITHER EPRI, ANY MEMBER OF EPRI, ANY COSPONSOR, THE ORGANIZATION(S) BELOW, NOR ANY PERSON ACTING ON BEHALF OF ANY OF THEM:
(A) MAKES ANY WARRANTY OR REPRESENTATION WHATSOEVER, EXPRESS OR IMPLIED, (I) WITH RESPECT TO THE USE OF ANY INFORMATION, APPARATUS, METHOD, PROCESS, OR SIMILAR ITEM DISCLOSED IN THIS DOCUMENT, INCLUDING MERCHANTABILITY AND FITNESS FOR A PARTICULAR PURPOSE, OR (II) THAT SUCH USE DOES NOT INFRINGE ON OR INTERFERE WITH PRIVATELY OWNED RIGHTS, INCLUDING ANY PARTY'S INTELLECTUAL PROPERTY, OR (III) THAT THIS DOCUMENT IS SUITABLE TO ANY PARTICULAR USER'S CIRCUMSTANCE; OR
(B) ASSUMES RESPONSIBILITY FOR ANY DAMAGES OR OTHER LIABILITY WHATSOEVER (INCLUDING ANY CONSEQUENTIAL DAMAGES, EVEN IF EPRI OR ANY EPRI REPRESENTATIVE HAS BEEN ADVISED OF THE POSSIBILITY OF SUCH DAMAGES) RESULTING FROM YOUR SELECTION OR USE OF THIS DOCUMENT OR ANY INFORMATION, APPARATUS, METHOD, PROCESS, OR SIMILAR ITEM DISCLOSED IN THIS DOCUMENT.
ORGANIZATION(S) THAT PREPARED THIS DOCUMENT
Electric Power Research Institute (EPRI)
NOTE
For further information about EPRI, call the EPRI Customer Assistance Center at 800.313.3774 or e-mail [email protected].
Electric Power Research Institute, EPRI, and TOGETHER…SHAPING THE FUTURE OF ELECTRICITY are registered service marks of the Electric Power Research Institute, Inc.
COPYRIGHT © 2008 ELECTRIC POWER RESEARCH INSTITUTE, INC. ALL RIGHTS RESERVED.
iii
CITATIONS
This report was prepared by
Electric Power Research Institute (EPRI) 3420 Hillview Avenue Palo Alto, California 94304
Principal Investigators R. Entriken K. Forsten
Organizing Committee T. Burgess, FirstEnergy K. Forsten, EPRI W. Jewell, University of Wichita M. Lauby, NERC
This report describes research sponsored by EPRI, the North American Electric Reliability Corporation (NERC), and the Power Systems Engineering Research Center (PSERC)..
The report is a corporate document that should be cited in the literature in the following manner:
Joint Technical Summit on Reliability Impacts of Extreme Weather and Climate Change. EPRI, Palo Alto, CA, NERC, Princeton, NJ, and PSERC, Tempe, AZ: 2008. 1016095.


v
PRODUCT DESCRIPTION
This report provides proceedings from a workshop on the potential effects of climate change and extreme weather on power system reliability. The workshop was held October 14-15, 2008, in Portland, Oregon, and was sponsored by Power Systems Engineering Research Center (PSERC), the North American Electric Reliability Corporation (NERC), and the Electric Power Research Institute (EPRI).
Results and Findings The workshop included 32 attendees who participated in four panel discussions, which are covered in individual chapters of this report.
1. Where Are We, and What Does the Future Hold? (Chapter 2)
2. Impacts on Utility Decision-Making (Chapter 3)
3. Strategic Response (Chapter 4)
4. Next Steps for Research and Development (Chapter 5)
Challenges and Objective(s) As transmission and distribution systems become more constrained with growth in energy and demand along with increasing integration of high levels of variable/intermittent renewable resources, concerns about the impact of climate change on system reliability and performance increase. Along with the expected increase in average temperature, the volatility of weather is also expected to increase. Experience gained from events such as the heat storm experienced throughout California in the summer of 2006 and the drought condition in the Southeast in 2007, prompt increased consideration of the range and timing of potential reliability impacts. The presentations and discussions during the conference are intended to focus on these key issues and to draw up an agenda for action.
Applications, Values, and Use This report provides valuable information to industry policy makers, executives, power system planners, operators, and risk assessment personnel addressing effects of climate change and extreme weather on power system reliability.
EPRI Perspective While climate change and extreme weather has industry regulation aspects, this workshop concentrated on the potential impact these emerging issues might have on system design and planning decisions as well as potential operational decisions being made in the near term. For instance, will the weather in 50 years be increasingly volatile, will extremes of weather conditions increase, and should the system be planned, designed, and operated to anticipate these

vi
changes? In what ways do demand response, increasing renewables, distributed generation (and storage) and variable generation integration initiatives contribute toward addressing or compounding challenges in dealing with extreme weather conditions? Can we effectively forecast and account for demand response, integration of diverse resource mixes and accommodate extreme weather conditions while ensuring long-term reliability of the system? What R&D needs are there to better anticipate, plan, and design for the long-term risk management and enhancement of bulk power system reliability?
Approach The workshop’s goals were to discuss and document both the current and emerging needs for research, development, demonstration and decision-making activities of industry, academia, and government institutions anticipating the impact of climate change, energy efficiency, and demand response on electric power system reliability.
Keywords Climate change Bulk power system reliability System planning and operations Risk assessment
vii
ABSTRACT
This report provides proceedings from a workshop on the effects of climate change and extreme weather on power system reliability. The workshop was held October 14-15, 2008, in Portland, Oregon, and was sponsored by Power Systems Engineering Research Center (PSerc), the North American Electric Reliability Corporation (NERC), and the Electric Power Research Institute (EPRI). Workshop participants came from academia, government, research institutes, consulting organizations and electric utilities.
As transmission and distribution systems become more constrained with growth in energy and demand, and increasing integration of high levels of variable/intermittent renewable resources, concerns about the impact of climate change on system reliability and performance increase.
The workshop’s presentations and discussions identified key issues associated with extreme weather and reliability, and helped draw up an agenda for action. Presentations covered a range of topics, including utilities’ direct experiences with extreme weather events; modeling of weather phenomena; the potential impacts of extreme weather and climate change on power system infrastructure and utility decision-making; and further R&D and reliability assessment needs.
An appendix provides additional perspective from interviews with EPRI project managers in the areas of equipment failure data collection, reliability metrics, asset management, transmission substations, nuclear power, transmission systems, distribution systems, and transmission and increased power flow.

ix
ACKNOWLEDGMENTS
Authors wish to thank the meeting presenters and participating organizations for their support of the Technical Summit and the commitment on their part to produce these Proceedings. Additionally, Lisa Wolfenbarger and Robin Pitts helped organize and run the Technical Summit; Dave Boutecoff produced the draft from meeting notes and Nesha Bjelovitic and Michael Gulevich managed and edited the publication.
Cover image: Houston after Tropical Storm Allison in June 2001.
.


xi
CONTENTS
1 INTRODUCTION ....................................................................................................................1-1 Purpose and focus ................................................................................................................1-1 Sponsoring organizations......................................................................................................1-2 Welcoming Remarks .............................................................................................................1-2 Electric Utilities Must Increase and Focus R&D to Meet Challenges ....................................1-3 Meeting Goals .......................................................................................................................1-8 Bulk Power System Reliability: Emerging Issues & Trends ..................................................1-9
2 PANEL 1: WHERE ARE WE AND WHAT DOES THE FUTURE HOLD?.............................2-1 Changes in Weather and Climate Extremes in a Changing Climate.....................................2-1 Changes in Surface Winds Over the Georgia Basin-Puget Sound Region Using a Regional Climate Model ......................................................................................................2-10
Projected (1990-2060) Changes in Surface Winds over the Georgia Basin-Puget Sound Region Using a Regional Climate Model ............................................................2-10
Summary ...................................................................................................................2-10 Potential Impact of Climate Change on Transportation Systems: Gulf Coast Study...........2-11
3 PANEL 2: IMPACTS ON UTILITY DECISION-MAKING .......................................................3-1 Historic Reactions to Extreme Weather Events in PJM ........................................................3-1 The Impact of Climate Change on Distribution Engineering Decisions.................................3-8 Mitigation and Adaptation Priorities and Strategies for Utilities...........................................3-19 WECC: July 24, 2006 Extreme Temperature Event............................................................3-29 Forecasting Hurricane Impacts on Critical Infrastructure ....................................................3-39
4 PANEL 3: STRATEGIC RESPONSE.....................................................................................4-1 Extreme Weather Impacts on Reliability: Joint Coordinated System Planning Study Implications ...........................................................................................................................4-1 Strategic Response.............................................................................................................4-16 Climate Change and the Baseline Planning Initiative of Hydro Quebec .............................4-20

xii
Effects of Climate Change on California’s Energy Security ................................................4-27
5 PANEL 4: NEXT STEPS FOR RESEARCH & DEVELOPMENT AND RELIABILITY ASSESSMENT ..........................................................................................................................5-1
Summary of the NERC/PSERC/EPRI Workshop on Reliability and Climate ........................5-1 Discussion.............................................................................................................................5-3
Next Steps ........................................................................................................................5-4
6 SUMMARY .............................................................................................................................6-1 PSERC ...................................................................................................................................6-1 NERC ....................................................................................................................................6-2
Reliability Metrics Working Group: Reliability Measurement Framework and Indicators ..........................................................................................................................6-2 Load Forecasting Working Group: Temperature Impacts on Reliability ...........................6-2 Special Assessment: Reliability Impacts of Climate Change Initiatives............................6-2
EPRI......................................................................................................................................6-3
7 REFERENCES .......................................................................................................................7-1
A APPENDIX: DISCUSSION OF RELIABILITY TRENDS....................................................... A-1 Introduction .......................................................................................................................... A-1 Equipment Failure Data Collection....................................................................................... A-1 Reliability Metrics ................................................................................................................. A-2 Asset Management .............................................................................................................. A-2 Transmission Substations .................................................................................................... A-3 Nuclear Power...................................................................................................................... A-3 Transmission Systems ......................................................................................................... A-3 Distribution Systems............................................................................................................. A-4 Transmission Substations .................................................................................................... A-4 Transmission and Increased Power Flow ............................................................................ A-5
1-1
1 INTRODUCTION
On October 14-15, 2008, the Power Systems Engineering Research Center (PSERC), the North American Electric Reliability Corporation (NERC) and the Electric Power Research Institute (EPRI) sponsored a workshop on the effects of climate change and extreme weather on power system reliability. Thirty-two attendees listened to presentations in four panels, which are covered in individual chapters of this report:
1. Where Are We, and What Does the Future Hold? (Chapter 2)
2. Impacts on Utility Decision-Making (Chapter 3)
3. Strategic Response (Chapter 4)
4. Next Steps for Research and Development (Chapter 5)
This introduction describes the workshop’s purpose and focus, explains the roles of the sponsoring organizations, and summarizes the introductory presentations of Terry Oliver, Chief Technology Officer at Bonneville Power Authority (BPA), Tom Burgess, Director of FERC Compliance at FirstEnergy and EPRI Program 172 Chair, and Mark Lauby, Manager of Reliability Assessment at NERC.
Purpose and focus
The workshop’s purpose was to discuss and document both the current and emerging needs for research, demonstration, development, and decision-making activities of industry, academia, and government institutions anticipating the impact of climate change, energy efficiency, and demand response on electric power system reliability.
As transmission and distribution systems become more constrained with growth in energy and demand, and increasing integration of high levels of variable/intermittent renewable resources, concerns about the impact of climate change on system reliability and performance increase. Experience from events like the heat storm experienced throughout California in the summer of 2006 and the drought condition in the Southeast in 2007, among others, prompt increased attention to understanding the range and timing of potential reliability. The presentations and discussions during the conference are intended to focus on these key issues and to draw up an agenda for action.
While this subject has regulation policy aspects, this workshop concentrated on the potential impact that these emerging issues have on system design and planning decisions as well as potential operational decisions being implemented in the near term. For instance, will the weather in 50 years be increasingly volatile, will extremes of weather conditions increase, and
Introduction
1-2
should we change the way the system is designed, planned, and operated to anticipate these changes? In what ways do demand response, increasing renewables, and variable generation integration initiatives contribute toward addressing or compound the challenges in dealing with extreme weather conditions? How can we effectively forecast and account for demand response, integration of diverse resource mixes, accommodate extreme weather conditions, as well as ensure long-term reliability of the system? What R&D needs are there to better anticipate, plan, and design for the long-term risk management and enhancement of bulk power system reliability?
Sponsoring organizations
EPRI is working with industry stakeholders to identify the development needs associated with the potential impact of climate change on transmission and distribution system operations, maintenance and planning. Implications may be associated with sustained increased temperature, more frequent and severe weather changes, rare but high-impact events and changes in electrical demand patterns. EPRI has highlighted here the results of the surveys conducted prior to and during the workshop, which are being shared now with the greater power industry community as a public benefit.
NERC, as the organization tasked with ensuring the reliability of the bulk power system in North America, has been keeping abreast of emerging issues and trends that may affect reliability and subsequently highlighting them in its summer/winter seasonal and annual long-term reliability assessments [1] supported by the Planning Committee. This year, greenhouse gas reductions, including deliberations on climate change initiatives, were ranked as the number one emerging issue for consideration in the 2008 Long-Term Reliability Assessment. NERC shared a summary of responses from its recent industry survey on Reliability Impacts of Climate Change Initiatives [2].
PSERC previously conducted basic research in the area of climate change and issued a report titled, The Electric Power Industry and Climate Change: Power Systems Research Possibilities [4]. In response to increasing concerns over global climate change, this report identifies possible research needs for the industry to pursue that are related to interactions between the power industry and global climate change. PSERC has highlighted its conclusions during the forum.
Welcoming Remarks
Terry Oliver offered welcoming remarks as a speech, without power point slides. The text of his remarks is reproduced below, verbatim. During his speech, Terry referenced the collection of Technology Roadmaps [5] - [9] prepared by BPA. Mr. Oliver’s presentation identified the need for public funded research and development promoting access to results. Along with the use of public funds comes the responsibility for the public institutions to provide a means to explain the benefits of R&D expenditures. The roadmaps help assure that this information is shared and intellectual property (IP) issues and commercialization are reviewed to ensure that new technologies are widely used.
Introduction
1-3
Electric Utilities Must Increase and Focus R&D to Meet Challenges
Terry Oliver, Bonneville Power Administration
Electric utilities today face a troubling and complex set of challenges. On one hand, we, along with many other sectors, face the financial challenges of repairing past underinvestment in the infrastructure needed to successfully conduct our business. On the other hand, we are facing the prospect of new additional costs arising from the need for new low-carbon resources such as energy efficiency and renewable energy, and the carbon-related costs of our embedded resources. And overlaying this all is the blunt fact that we are facing unprecedented challenges to meet the needs of a global society, for climate change isn’t only a U.S. problem, or only a China problem, or a Philippine problem; it is a global problem with a diverse set of issues.
We in the United States are facing a large challenge of de-carbonizing our energy use. Yet many countries face nearly overwhelming particulate and sulfur pollution challenges in addition to CO2. We in the US are facing well-documented reliability challenges. And yet many countries also face societal electrification needs. And we in the US feel burdened by escalating energy costs. And yet many countries face a cost of electricity sold one battery at a time.
Meeting the needs of society in electrification—to allow citizens to participate in our economies; meeting the needs of society to provide our product with sufficient reliability—to allow industry to thrive; meeting the needs of society to provide our product at a reasonable cost—so that citizens and businesses and industry can lift up our economies; and meeting the needs of society to protect our current and future environment—so that future generations can prosper on our investment just as we have prospered on our forbearer’s investments. If the former challenges weren’t enough, it is this latter challenge, protecting our current and future environment, which is the most daunting. And it is a challenge that cannot be met with a complacent and parsimonious approach to research and development.
The electric utility industry around the world has rested on a research foundation laid down by the pioneers of our industry. Pioneers who created the technologies we use today, and invested heavily in the first half of the last century to make the energy systems we now use possible. Systems like high-voltage alternating current transmission, finely tuned generation from coal-fired power plants with small percentages of former emissions to advanced combustion turbines with phenomenal efficiencies capable of meeting a full range of energy demands, and a new generation of a research and development foundation that’s led to a burgeoning wind electricity generation industry, a growing photovoltaic electricity generation industry, and a “negawatt” electricity industry comprised of highly efficient electric motors, compact fluorescent lamps, insulation materials, advanced computer-based building and industrial controls, highly efficient ventilation and air-conditioning systems, and advanced building codes that internalize the externalities wasteful energy use imposes on the rest of society. These were (and are) great achievements, and we have benefited from their toils, their science, their technical skill and perseverance.
In the Pacific Northwest region of the United States, at the Bonneville Power Administration, we pioneered computer programs that enable the control of large grids. We pioneered high-voltage direct current transmission systems and built one of the very first long-distance DC transmission

Introduction
1-4
circuits from Oregon to Los Angeles. We pioneered phasor measurement systems that allow better understanding of the grid. We pioneered energy efficiency, negawatts, as the definitive cheapest electric resource. Over the last 30 years the Pacific Northwest has built a 3 GW energy efficiency power plant; each megawatt came on line just in time, and each cost us just about ½ the cost of a competing coal-fired power plant.
But our industry has rested too long on these achievements. We face daunting technical challenges, but our research budgets have shrunk. We’ve even lost the capability to conduct research and to manage research. The business world has advanced the means of defining research agendas. Technology roadmaps, stage gates, and portfolios have entered the business world’s R&D lexicon. But US electric utilities have not kept up with the advancing knowledge of how to engage in research. We’ve not advanced our ability to engage in research.
Now there are only remnants of a once robust government, utility, and industry research partnership. Remnants inside the electricity industry, with few utilities still investing in R&D; remnants in the research portfolios of our industrial partners like ABB, General Electric, and Siemens; and remnants in industry collaboratives such as the Electric Power Research Institute and the International Council on Large Electric Systems (CIGRE), mere shadows of their former selves.
There are a few exceptions to this dismal picture, a few utilities that have never ceased their investment in research and development, the Japanese utilities Tokyo Electric & Kansai Electric, and Electricité de France, and Hydro Quebec in Canada. And a few exceptions in government support for research and development, notably Japan, and Europe, and by the way – here in California.
In the heydays in the 1960s and earlier, utility R&D budgets hovered between 1% to perhaps a little over 1.5% of revenues. But, beginning in the early 1990s, that picture changed. And it changed globally. The new influence was the global movement toward markets in place of monopolies. Electric utilities around the world began withdrawing from research investments, in part in fear of costs that would make them uncompetitive, and in part in the naive belief that our government and industrial partners and our suppliers would perform the needed R&D on our behalf.
That hope proved futile. Government sponsored electricity research investments faltered and our supplier research was devoted to vendor lock-in strategies, making our infrastructure needs even more expensive.
Laboratory facilities, which at Bonneville Power included a high-voltage laboratory to deal with transmission from 500 kV upwards to 1100 kV, a mechanical laboratory to test conductor, insulators, etc., under a variety of mechanical and environmental conditions, a medium voltage laboratory, and a chemical laboratory, all now lie moribund. At Georgia Power the laboratory has been hived off to a university consortium.
Budgets have shrunk to less than 1/10th of 1% of revenues. Compared to an all industry average globally of between 3 and 5% of revenues, 1/10th of 1% is hardly sufficient to solve the coming problems. Indeed, the dog food industry invests more in R&D than does the electric utility industry.
Introduction
1-5
And yet the future we face, this daunting global challenge -- climate change -- is going to require much of electric utilities; and much of our R&D investment.
This investment, the magnitude of which we have never experienced, is not to delay action on climate change; for there are many things that electric utilities can and must do immediately to help with climate change. It is needed to successfully transition to a low-carbon energy world. It is needed to successfully deliver the fuel for an economic engine while reducing the carbon and climate impact of that engine. It is needed to successfully integrate new low carbon technologies, like wind, wave, photovoltaic, biomass, and to integrate these energy producing technologies, that present such different challenges, that require changes in how utilities operate, because these technologies have radically different characteristics from those utilities are used to.
Characteristics like intermittency, that require electric utilities to be able to operate the whole of their electric system from end-use through distribution, to the wide variety of transmission and generation technologies, in ways not possible before the computer age; and like decentralization, that require a new understanding of net load patterns and variations through days and seasons.
The emission of greenhouse gases against the clock of the planet’s climate balance is the environmental threat of our time. But it is not the only threat. Local pollution from electricity generation is still a problem in many parts of the world. And there is a continuing threat of armed conflict acts that disrupt global energy supply systems. It will take continued vigilance on all fronts.
And it will require a radical restructuring of the uses of energy, including radical improvements in the efficiencies of energy use to adequately address these threats.
In my remarks today I am not predicting that we will deal with these adequately. In fact as I just noted the utility industry globally is ill prepared to effectively engage in the research needed to accomplish the degree of change needed.
In most of the world, the electric delivery system is the region or country’s largest machine; it operates at the speed of light; and it is mechanically controlled by slow humans. It depends critically on over-investment in generation, transmission, and distribution capacity to make up for mechanical, electrical, and human weaknesses, resulting in a diversion of revenues and investments into maintaining grid infrastructure. An electric infrastructure that, in large part, Edison, Tesla, and Westinghouse would still recognize more than 100 years later.
All realistic strategies that would deal adequately with these challenges begin with energy efficiency improvements -- for they are the only actions that offer any significant near-term progress against the magnitude of the potential harm that these threats present; and with technology advancements -- particularly in the electric sector -- for they are the only actions that can create the kinds of options and flexibility that will position enterprises in the future to move quickly with the changing threat environment.
We in the electric utility industry are beginning to understand the profound magnitude of the change that we must embrace and advances as our part of the response to these threats, as well as the magnitude of resources that this will require. To say that we recognize that business will not be “as usual” is to grossly understate the way the landscape is changing for the industry.
Introduction
1-6
In the US, utilities are 40% of greenhouse gas emissions, but we are the sector that many other sectors of the economy are thinking of relying on as their principal means of reducing the magnitude of the climate threat. So we are talking about a possible radical electrification of industry and transportation, and a simultaneous radical reduction in the amount of greenhouse gas emissions that we, the electric power industry, release as we attempt to meet our existing loads and this new demand.
Only a new global collaborative effort on a scale never before attempted in our industry can achieve the needed technology advances, and their early business deployment, in the timeframe of our anticipated societal need.
What might that collaborative effort look like?
The Electric Power Research Institute, a global research and development collaborative of the electric power industry -- with members from Japan, Europe, Africa, and the US, and a budget of US $300 million per year) analysis suggests the following path:
Get back to 1990 CO2 levels by 2030, and get on the path to the decarbonization of power production by 2050, a 55% reduction from the US emissions base case. Or, put another way 35% below current levels while the electric industry handles 40% more demand.
EPRI’s studies suggest a least cost path involving four quadrants (the quadrants are common to all utilities contributions to climate solutions but the specific numbers mentioned are unique to the US).
Quadrant 1 is efficiency, demand management, distributed generation -- what needs to happen on the consumer side of the retail meter. It requires reducing load growth by 1% per year, every year. And distributed generation -- small-scale solar, micro-turbines, etc.--becomes 5% of US base load up from less than 1/10th of 1% in the base case. The technology keys to this are: Smart grid - real-time, intelligent, interactive; with a standard communications architecture and universal language; and Smart devices such as Grid Friendly™ appliances
Quadrant 2 is renewable energy -- large grid-connected resources, smaller consumer renewable energy resources are included in the first quadrant. It requires 70,000 MW or 70 GW from wind, solar, bio-fuels, geothermal -- up from 30 GW in the base case (for reference, 1000 MW equals 1 GW equals one nuclear power plant equals the load of Seattle Washington). The technology keys to this are conquering intermittency with Storage -- not massive but batteries compressed air pump Hydro, Smoothing -- capacitors, flywheels, and Backup -- in many cases natural gas. There are still several fundamental problems including the fact that wind is a fuel displacer, not a capacity resource, and bio-fuel problems - especially fuel food conflicts. Diverting corn to ethanol is a scandal -- it is not reducing carbon; it is not lessening petrol dependencies; it is a diversion from new food production; and it’s happening just as China’s and India’s protein consumption is jumping.
Quadrant 3 is Nuclear -- and requires 64 GW -- up from 12 GW of the base case. The technology keys to this are safe processing and waste storage, both “political will” issues.
Introduction
1-7
Quadrant 4 is Coal -- and the need is for more efficient heat rates with CO2 capture and storage sequestration). Coal is one half of current US generation. The US is the Saudi Arabia of coal and the US electric industry has never imagined a future without it; South Africa hasn’t either; and neither has China. Fixing current plants requires 150 GW of plant upgrades to enable 25-50% CO2 capture; it’s hoped to improve heat rates 3-5%. Longer term, EPRI sees carbon capture and sequestration applied to all coal after 2020, with 90% capture of CO2 in the new fleet with a modest 25% increase in coal use. The technology keys to this are new coal plants that look an awful lot like chemical plants (integrated gasification combined-cycle plants, IGCC, in which gasification is combined with power generation) and reducing regulatory and liability uncertainty around long-term carbon storage.
This won’t be free. Although there are other economic benefits, the costs of the path to 2030 in the US electric price will likely be a 50% increase in the real cost of delivered electricity. That would be like gasoline suddenly going from $2.50 a gallon to $3.75 per gallon. That was recently considered an unlikely future, however petrol is now well over $4.00 per gallon in the US.
What does this require of electric utilities? First and foremost, it requires recognition that to be part of the solution, we must invest in creating the solutions. How much is enough? Well certainly zero is not enough. Let’s move from there. The non-utility industry average R&D investment in the US is about 2.3% of revenues. Current typical utility R&D investment is less that 1/10th of 1% of revenues. In contrast Electricité de France is over 6/10th of 1%. This suggests that a reasonable starting point is between 0.5% and 1% with room for some movement upward if required. Such a change would quadruple US electric industry investments in R&D.
Second, it requires that utilities recognize that the solutions that private industry creates for us are not always in our best interests. We too easily fall prey to the silo effect of proprietary systems. Anti-silo provisions need to be incorporated into our research agenda, e.g. supporting interoperability and open standards based approaches, and in our equipment purchase frameworks, e.g. specifying IEC standard 61850 (interoperability of substation equipment) and other relevant standards for equipment purchases.
Thirdly, it requires utilities to identify, and to publicly articulate a research agenda. Only in that way do we discover our mutual interests and find opportunities to collaborate. BPA’s technology roadmaps (Transmission, Energy Efficiency, Renewable Energy, Physical Security, and Hydro) are all available on BPA’s public web site. Further, we base our internal and external funding decisions on the proposal’s conformance - or cogent argument with - our technology roadmaps. In this way, we focus our research investments in topics that matter to BPA, while inviting a critical review of the roadmap contents.
Finally, it requires an engagement with the legislative and regulatory authorities to renew confidence in the efficacy of utility R&D investments and to renew permission to include these costs in tariffs as an appropriate investment in the future.
In conclusion, we electric utilities face a new very large challenge and a compelling need to participate in creating new low-carbon sustainable energy systems. It is a challenge that requires renewed discipline in defining our research challenge, our research agenda, and in conducting
Introduction
1-8
our research. It is a challenge that requires a new level of both public and private investment. And it is a challenge that Bonneville Power Administration, at least, is willing to undertake.
Meeting Goals
Thomas Burgess, FirstEnergy
Mr. Tom Burgess, Chair of EPRI Program 172 and Vice Chair of the NERC Planning Committee offered his comments on the goals for the workshop, summarized in the notes below:
• How can we do a better job providing the foundation and tools to make better decisions?
• How can we provide a quantifiable perspective? We have to make sure that we stay practical, keep our hands around what can be implemented.
• What are the reliability impacts associated with Climate Change and Extreme Weather? Given what we need to achieve in order to understand a sound foundation for the range and timing of reliability impacts, there will be a need for adoption of enhanced planning and strategic utility execution.
• There is much discussion about changing weather in terms of drought, heat storms, etc. This understanding and foundation needs to be quantified, rather than anecdotal. What impacts prompt changes in design, planning, and operations? When do these changes need to take place? What is the pace of change in the drivers? Will the climate change stimulate extremes? When do extremes occur?
• When do we need to change our planning methods, operational modes, and system designs? Is there a range of conditions that we can understand better?
• What is the economic consequence? How can that be determined in a manageable way in terms of investment and regulatory tolerance for increased costs?
Discussion of emerging issues is becoming a part of the discussion for inclusion in the LTRA.
As EPRI Program 172 Chair, Mr. Burgess is leading the research effort to understand options for strategic utility implementation to reduce the overall carbon footprint of the T&D system from its current levels.
GOALS: Energy for intellectual enthusiasm. Find a way to identify and bound a range of consequences. What are the next steps and when do they need to happen? Better basis for what we can measure and do something about. There is room for improvement in Planning and Operations, particularly in scenario analysis. Load forecasting needs to better include consequences. While risk management is increasingly pervading aspects of strategic utility decision-making, the overall goal is to determine an effective game plan for weaving a sound understanding of the potential climate change impacts into enhanced options and planning/operations of the bulk-power system for customers, regulators, and utilities.

Introduction
1-9
Bulk Power System Reliability: Emerging Issues & Trends
Mark Lauby, NERC
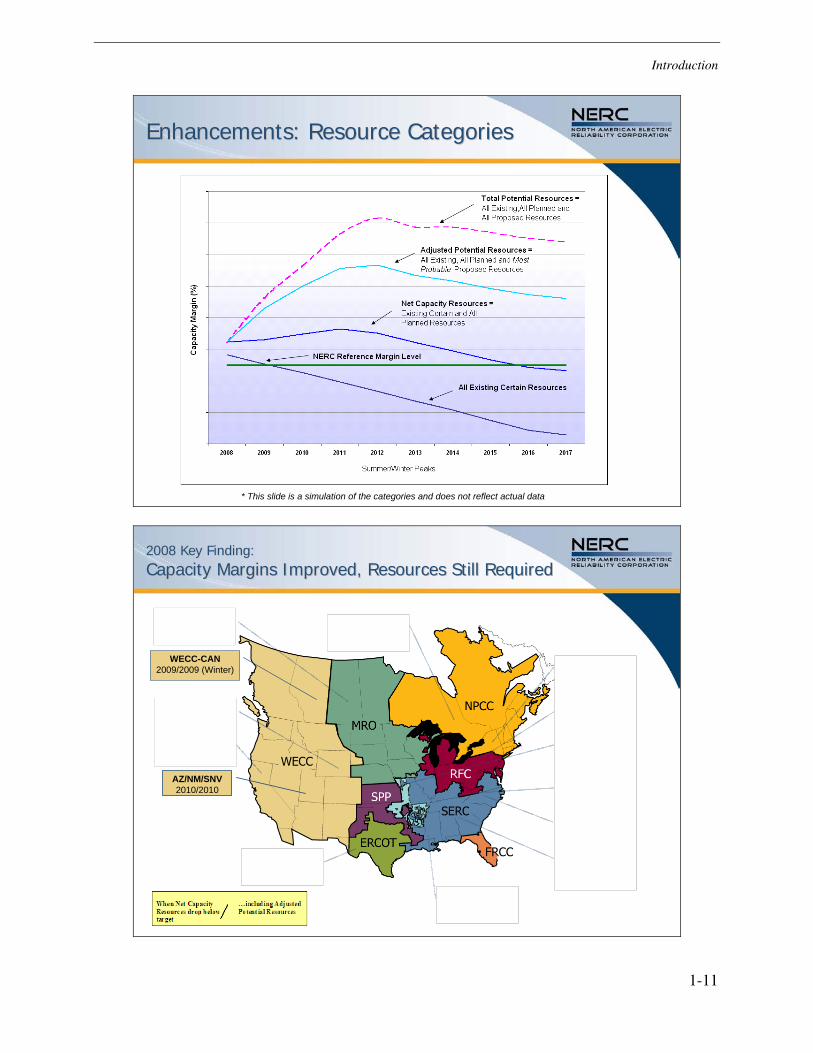
Mr. Mark Lauby covered key findings of NERC’s 2008 Long Term Reliability Assessment (LTRA) [1], including the reliability impacts of environmental initiatives, and emerging issues. Following are notes of this presentation and then the accompanying slides.
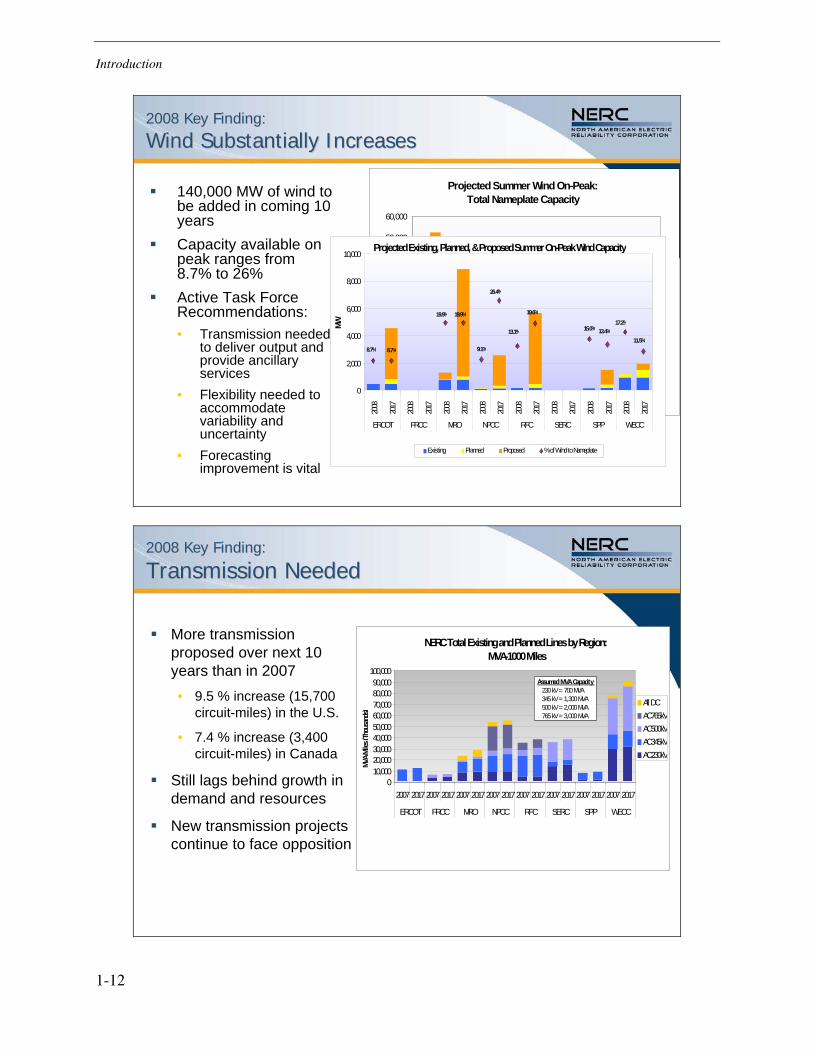
A key 2008 LTRA finding is a substantial increase in wind generation for the 2007-2017 timeframe. Based on a recent Department of Energy Report [3], it is expected to cost 2,000 G$ for a 20% wind infrastructure. The NERC Reliability Assessment Subcommittee (RAS) uses a reference case to develop potential scenarios and measure reliability impacts. The time frame for industry action on climate change is long, but the immediate potential is for increased extremes.
The transmission system must be designed and built to be flexible, because of the large uncertainties and rapid technical changes across the supply chain. Demand response (DR) is increasing in quantity, but in some cases decreasing as a percentage of system load. Wind needs a “dance partner” and DR is a good candidate. Energy efficiency is growing, contributing to reduced peak demand.
Regulations are emerging to mandate power plant cooling water be based on closed-cycle, rather than open. We need to understand where new resources are expected to be connected and how the fuel mix is changing, especially tracking down demand response locations, to ensure bulk power system reliability.
Capacity assessment incorporating potential climate change and extreme conditions can use traditional methods. However, energy analysis may become more prominent as many prospective technologies provide more energy than capacity.
The traditional reliability measure of one-day-in-ten comes from judgment and computational limitations of the computers in the 1960s. The measure can be computed over different time frames and is used in terms of events and time durations in different areas. There is an effort to define this term consistently, so comparative analysis can be performed to measure the incorporation of climate hardening technologies and new demand/generating technologies.
Reliability Assessment issues are listed in Slide 12. Extreme weather is being considered in the Resource Adequacy context.
Introduction
1-10
Bulk Power System Reliability:Bulk Power System Reliability:Emerging Issues & TrendsEmerging Issues & Trends
NERC/PSERC/EPRI
Technical Summit: Extreme Weather Impacts on Reliability
Portland, Oregon
October 14-15, 2008
OverviewOverview
Key Findings in NERC’s LTRA for 2008
Reliability Impacts of Environmental Initiatives
Emerging Issues for 2008
Introduction
1-11
Enhancements: Resource CategoriesEnhancements: Resource Categories
* This slide is a simulation of the categories and does not reflect actual data
2008 Key Finding:2008 Key Finding:Capacity Margins Improved, Resources Still RequiredCapacity Margins Improved, Resources Still Required
ERCOT2013/2017+
New England2013/2013
AZ/NM/SNV2010/2010
California2014/2014
Rocky Mtn2015/2015
SPP2013/2017+
MRO-US2010/2017+
RFC2013/2017
WECC-CAN2009/2009 (Winter)
Ontario2015/2017+
Central2011/2015
VACAR2013/2014
Southeastern2010/2017+
Delta2008/2017+
Introduction
1-12
2008 Key Finding:2008 Key Finding:
Wind Substantially IncreasesWind Substantially Increases
140,000 MW of wind to be added in coming 10 yearsCapacity available on peak ranges from 8.7% to 26%Active Task Force Recommendations:• Transmission needed
to deliver output and provide ancillary services
• Flexibility needed to accommodate variability and uncertainty
• Forecasting improvement is vital
Projected Summer Wind On-Peak:
Total Nameplate Capacity
0
10,000
20,000
30,000
40,000
50,000
60,000
2008
2017
2008
2017
2008
2017
2008
2017
2008
2017
2008
2017
2008
2017
2008
2017
ERCOT FRCC MRO NPCC RFC SERC SPP WECCM
W
Existing Planned Proposed
Projected Existing, Planned, & Proposed Summer On-Peak Wind Capacity
8.7% 9.1%
15.0%
8.7%
19.9% 19.9%
26.4%
13.1%
19.6%
13.4%17.2%
11.5%
0
2,000
4,000
6,000
8,000
10,000
2008
2017
2008
2017
2008
2017
2008
2017
2008
2017
2008
2017
2008
2017
2008
2017
ERCOT FRCC MRO NPCC RFC SERC SPP WECC
MW
Existing Planned Proposed % of Wind to Nameplate
2008 Key Finding:2008 Key Finding:
Transmission NeededTransmission Needed
More transmission proposed over next 10 years than in 2007• 9.5 % increase (15,700
circuit-miles) in the U.S.
• 7.4 % increase (3,400 circuit-miles) in Canada
Still lags behind growth in demand and resources
New transmission projects continue to face opposition
NERC Total Existing and Planned Lines by Region: MVA-1000 Miles
010,00020,00030,00040,00050,00060,00070,00080,00090,000
100,000
2007201720072017200720172007201720072017200720172007201720072017
ERCOT FRCC MRO NPCC RFC SERC SPP WECC
MVA-M
iles (
Thou
sand
s)
All DCAC765kVAC500kVAC345kVAC230kV
Assumed MVA Capacity 230 kV = 700 MVA 345 kV = 1,300 MVA 500 kV = 2,000 MVA 765 kV = 3,000 MVA
Introduction
1-13
2008 Key Finding:2008 Key Finding:
Demand Response GrowsDemand Response Grows
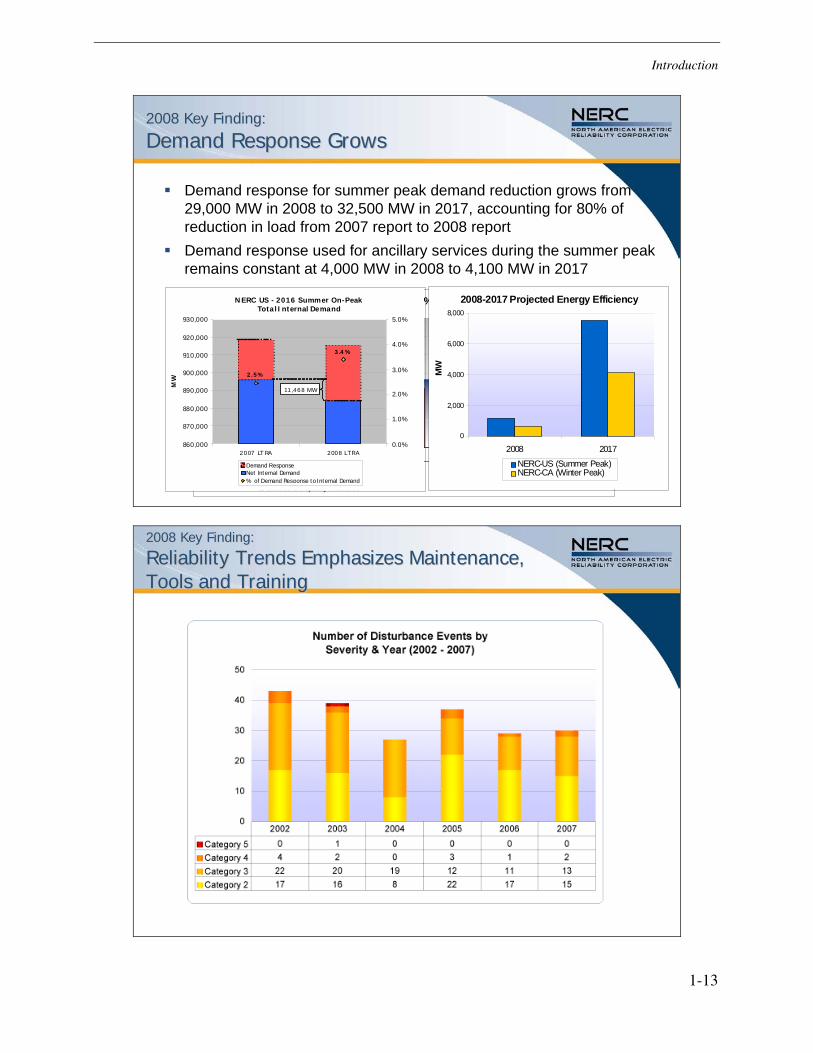
Demand response for summer peak demand reduction grows from 29,000 MW in 2008 to 32,500 MW in 2017, accounting for 80% of reduction in load from 2007 report to 2008 report Demand response used for ancillary services during the summer peak remains constant at 4,000 MW in 2008 to 4,100 MW in 2017
Capacity Demand Response as a % of Summer Peak Demand
WECCSPPSERCRFCNPCCMROFRCCERCOT0.0%
1.0%
2.0%
3.0%
4.0%
5.0%
6.0%
7.0%
% o
f Dem
and
Res
pons
e to
Tot
al In
tern
al
Dem
and
0.0%
1.0%
2.0%
3.0%
4.0%
5.0%
6.0%
7.0%
Total Capacity Demand Response Direct Control Load ManagementContractually Interruptible (Curtailable) Critical Peak-Pricing with ControlLoad as a Capacity Resource
2017
2008
NERC US - 2016 Summer On-Peak Total Internal Demand
2.5%
3.4 %
860,000
870,000
880,000
890,000
900,000
910,000
920,000
930,000
2007 LT RA 2008 LTRA
MW
0.0%
1.0%
2.0%
3.0%
4.0%
5.0%
Demand ResponseNet Internal Demand% of Demand Response to Internal Demand
11 ,468 MW
2008-2017 Projected Energy Efficiency
0
2,000
4,000
6,000
8,000
2008 2017M
W
NERC-US (Summer Peak)NERC-CA (Winter Peak)
2008 Key Finding:2008 Key Finding:
Reliability Trends Emphasizes Maintenance, Reliability Trends Emphasizes Maintenance, Tools and Training Tools and Training
Introduction
1-14
2008 Key Finding:2008 Key Finding:
Reliability Trends Emphasizes Maintenance, Reliability Trends Emphasizes Maintenance, Tools and Training Tools and Training
Special Assessments: Special Assessments:
Reliability Impacts of Environmental InitiativesReliability Impacts of Environmental Initiatives
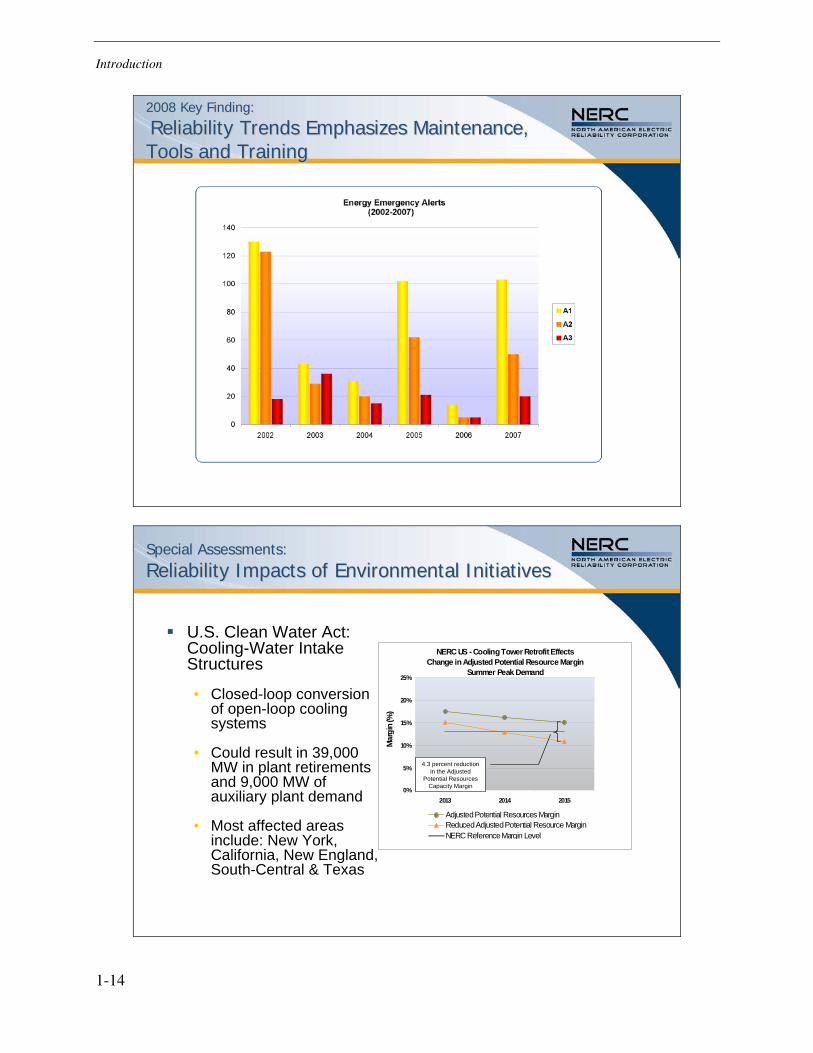
U.S. Clean Water Act: Cooling-Water Intake Structures
• Closed-loop conversion of open-loop cooling systems
• Could result in 39,000 MW in plant retirements and 9,000 MW of auxiliary plant demand
• Most affected areas include: New York, California, New England, South-Central & Texas
NERC US - Cooling Tower Retrofit EffectsChange in Adjusted Potential Resource Margin
Summer Peak Demand
0%
5%
10%
15%
20%
25%
2013 2014 2015
Mar
gin
(%)
Adjusted Potential Resources MarginReduced Adjusted Potential Resource MarginNERC Reference Margin Level
4.3 percent reduction in the Adjusted
Potential Resources Capacity Margin
Introduction
1-15
Special Assessments: Special Assessments:
Reliability Impacts of Environmental InitiativesReliability Impacts of Environmental Initiatives
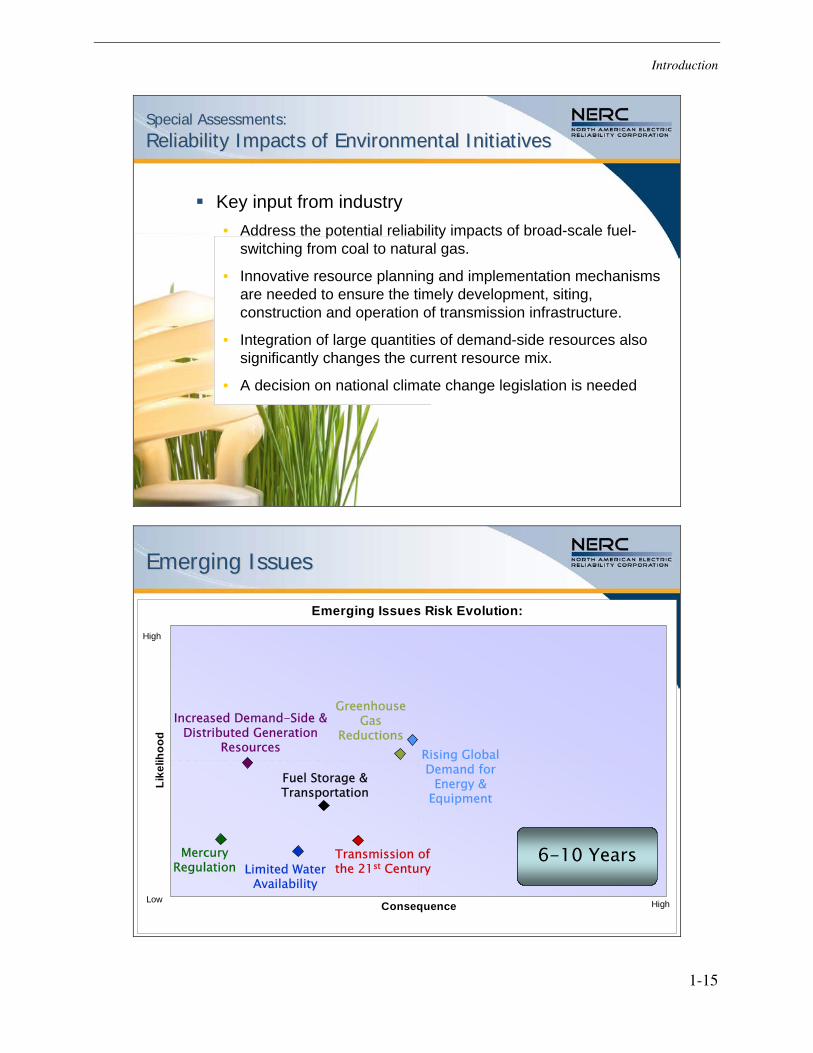
Key input from industry• Address the potential reliability impacts of broad-scale fuel-
switching from coal to natural gas.
• Innovative resource planning and implementation mechanisms are needed to ensure the timely development, siting, construction and operation of transmission infrastructure.
• Integration of large quantities of demand-side resources also significantly changes the current resource mix.
• A decision on national climate change legislation is needed
Emerging IssuesEmerging Issues
Emerging Issues Risk Evolution:
Consequence
Like
lihoo
d
High
HighLow
Greenhouse Gas
Reductions
Fuel Storage & Transportation
Rising Global Demand for
Energy & Equipment
Increased Demand-Side & Distributed Generation
Resources
Transmission of the 21st CenturyLimited Water
Availability
Mercury Regulation
1-5 Years6-10 Years

2-1
2 PANEL 1: WHERE ARE WE AND WHAT DOES THE FUTURE HOLD?
The workshop’s first panel discussion included the following presentations:
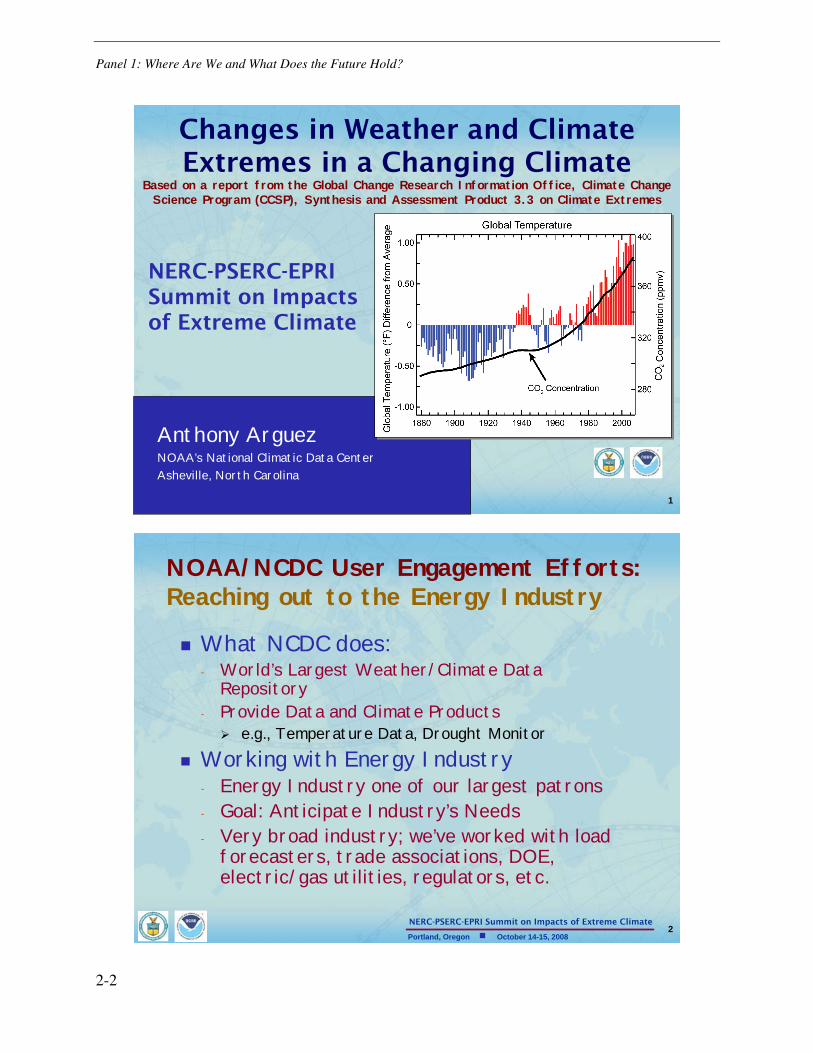
• Changes in Weather and Climate Extremes in a Changing Climate – Anthony Arguez, NOAA
• Changes in Surface Winds Over the Georgia Basin-Puget Sound Region Using a Regional Climate Model – Charles Curry, Canadian Centre for Climate Modeling and Analysis
• Potential Impact of Climate Change on Transportation Systems: Gulf Coast Study – Rob Hyman, Cambridge Systematics
Moderator: Ward Jewell, PSERC.
Changes in Weather and Climate Extremes in a Changing Climate
Anthony Arguez, NOAA’s National Climate Data Center
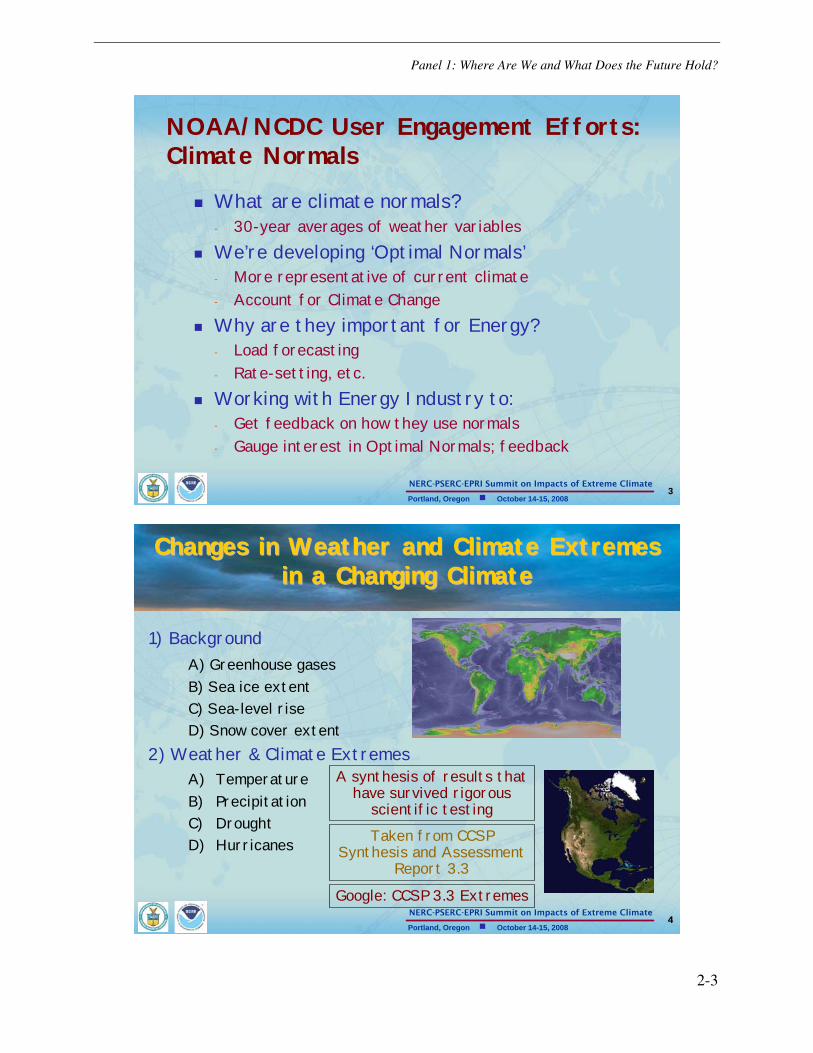
The National Climate Data Center (NCDC) is a climate data repository and seeks to support and anticipate the energy industry’s needs for climate information. Changes in extreme weather and climate events have significant impacts and are among the most serious challenges to the energy industry.
The use of climate normals (30-year averages of weather variables) is important for load forecasting, rate settings, and investment decisions. NCDC is developing “optimal normals” that are more representative of current climate and account for climate change, and is working with the energy industry to get feedback on how the industry uses normals and its interest in optimal normals.
The presentation was based on a June 2008 report, U.S. Climate Change Science Program Synthesis and Assessment Product 3.3 [10]. The presentation outlined the impacts of observed and projected climate changes including an increase in sea level rise of almost 3 mm per year compared to a 20th century rate of 1.8 mm/year, more frequent and intense heavy downpours; more frequent heat waves, and more intense hurricanes.
Panel 1: Where Are We and What Does the Future Hold?
2-2
11Portland, Oregon October 14-15, 2008
NERC-PSERC-EPRI Summit on Impacts of Extreme Climate
Anthony ArguezNOAA’s National Climatic Data CenterAsheville, North Carolina
Changes in Weather and Climate Extremes in a Changing Climate
Based on a report from the Global Change Research Information Office, Climate Change Science Program (CCSP), Synthesis and Assessment Product 3.3 on Climate Extremes
11
NERC-PSERC-EPRI Summit on Impacts of Extreme Climate
22Portland, Oregon October 14-15, 2008
NERC-PSERC-EPRI Summit on Impacts of Extreme Climate
NOAA/NCDC User Engagement Efforts:Reaching out to the Energy Industry
What NCDC does:- World’s Largest Weather/Climate Data
Repository- Provide Data and Climate Products
e.g., Temperature Data, Drought MonitorWorking with Energy Industry- Energy Industry one of our largest patrons- Goal: Anticipate Industry’s Needs- Very broad industry; we’ve worked with load
forecasters, trade associations, DOE, electric/gas utilities, regulators, etc.
Panel 1: Where Are We and What Does the Future Hold?
2-3
33Portland, Oregon October 14-15, 2008
NERC-PSERC-EPRI Summit on Impacts of Extreme Climate
NOAA/NCDC User Engagement Efforts:Climate Normals
What are climate normals?- 30-year averages of weather variablesWe’re developing ‘Optimal Normals’- More representative of current climate- Account for Climate ChangeWhy are they important for Energy?- Load forecasting- Rate-setting, etc.Working with Energy Industry to:- Get feedback on how they use normals- Gauge interest in Optimal Normals; feedback
44Portland, Oregon October 14-15, 2008
NERC-PSERC-EPRI Summit on Impacts of Extreme Climate
1) BackgroundA) Greenhouse gasesB) Sea ice extentC) Sea-level riseD) Snow cover extent
2) Weather & Climate ExtremesA) TemperatureB) PrecipitationC) DroughtD) Hurricanes
44
Changes in Weather and Climate Extremes Changes in Weather and Climate Extremes in a Changing Climatein a Changing Climate
A synthesis of results that have survived rigorous
scientific testingTaken from CCSP
Synthesis and Assessment Report 3.3
Google: CCSP 3.3 Extremes

Panel 1: Where Are We and What Does the Future Hold?
2-4
55Portland, Oregon October 14-15, 2008
NERC-PSERC-EPRI Summit on Impacts of Extreme Climate
The NOAA Annual Greenhouse Gas Index The NOAA Annual Greenhouse Gas Index (AGGI)(AGGI)
Calculated from the total direct radiative forcing normalized to 1990, the baseline year of the Kyoto Protocol (Source: D. Hoffman, NOAA/ESRL)
Greenhouse Gas Concentrations are Continuing to Increase
66Portland, Oregon October 14-15, 2008
NERC-PSERC-EPRI Summit on Impacts of Extreme Climate
SeaSea--Level RiseLevel Rise
Trend is significantly higher than 20th century rate of 1.8 ±0.3 mm from tide gauge measurements over the past 50-100 years
Geographical patterns similar to upper ocean heat content change- Suggests that regional sea-level
changes are largely controlled by thermal processes
Global Sea-Level Changes from Satellite Altimeter Observations
Oceans are rising almost 3 mm/yr
Panel 1: Where Are We and What Does the Future Hold?
2-5
77Portland, Oregon October 14-15, 2008
NERC-PSERC-EPRI Summit on Impacts of Extreme Climate
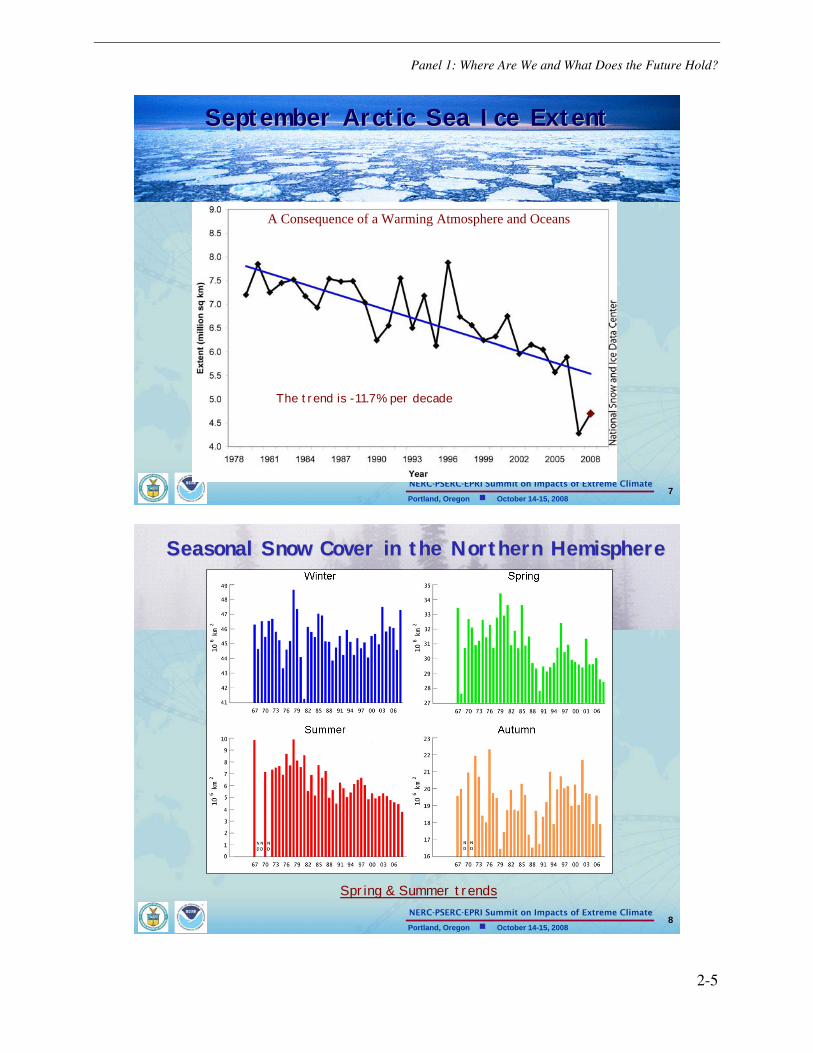
September Arctic Sea Ice ExtentSeptember Arctic Sea Ice Extent
The trend is -11.7% per decade
A Consequence of a Warming Atmosphere and Oceans
88Portland, Oregon October 14-15, 2008
NERC-PSERC-EPRI Summit on Impacts of Extreme Climate
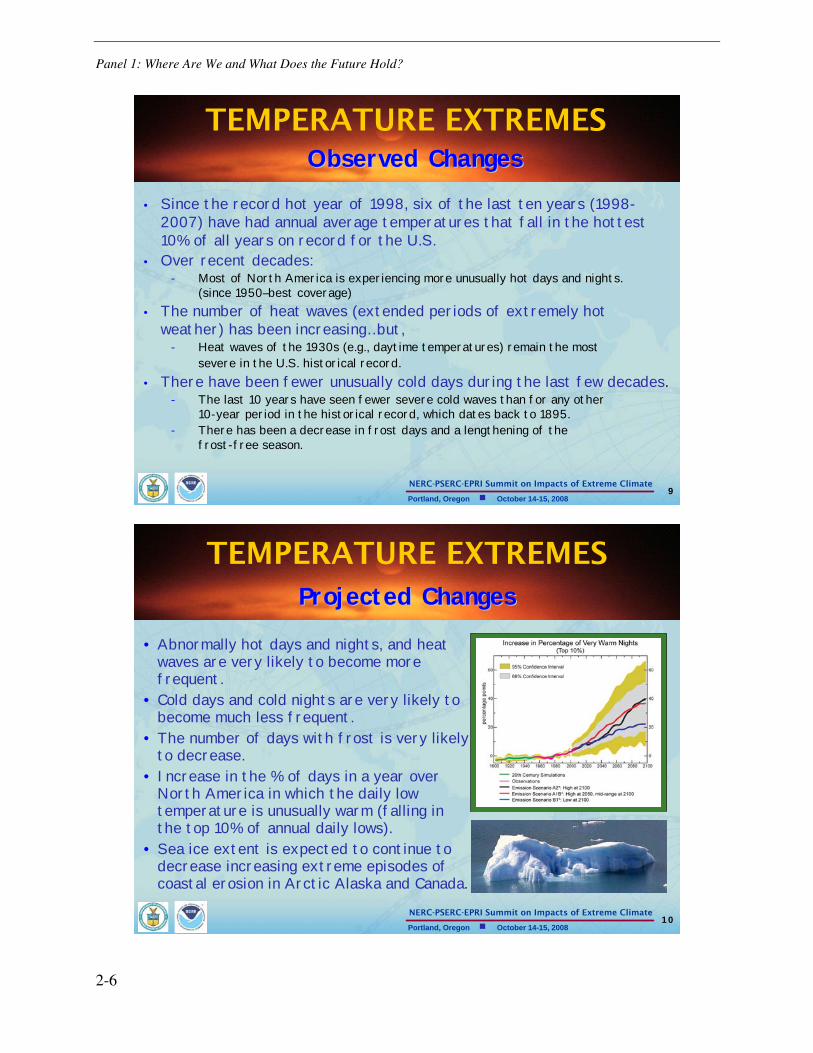
Seasonal Snow Cover in the Northern HemisphereSeasonal Snow Cover in the Northern Hemisphere
Spring & Summer trends
Panel 1: Where Are We and What Does the Future Hold?
2-6
99Portland, Oregon October 14-15, 2008
NERC-PSERC-EPRI Summit on Impacts of Extreme Climate
TEMPERATURE EXTREMESObserved ChangesObserved Changes
• Since the record hot year of 1998, six of the last ten years (1998-2007) have had annual average temperatures that fall in the hottest 10% of all years on record for the U.S.
• Over recent decades:- Most of North America is experiencing more unusually hot days and nights.
(since 1950–best coverage)• The number of heat waves (extended periods of extremely hot
weather) has been increasing…but,- Heat waves of the 1930s (e.g., daytime temperatures) remain the most
severe in the U.S. historical record.• There have been fewer unusually cold days during the last few decades.
- The last 10 years have seen fewer severe cold waves than for any other 10-year period in the historical record, which dates back to 1895.
- There has been a decrease in frost days and a lengthening of thefrost-free season.
1010Portland, Oregon October 14-15, 2008
NERC-PSERC-EPRI Summit on Impacts of Extreme Climate
Projected ChangesProjected Changes
• Abnormally hot days and nights, and heat waves are very likely to become more frequent.
• Cold days and cold nights are very likely to become much less frequent.
• The number of days with frost is very likely to decrease.
• Increase in the % of days in a year over North America in which the daily low temperature is unusually warm (falling in the top 10% of annual daily lows).
• Sea ice extent is expected to continue to decrease increasing extreme episodes of coastal erosion in Arctic Alaska and Canada.
TEMPERATURE EXTREMES
Panel 1: Where Are We and What Does the Future Hold?
2-7
1111Portland, Oregon October 14-15, 2008
NERC-PSERC-EPRI Summit on Impacts of Extreme Climate
Observed ChangesObserved ChangesObserved Changes
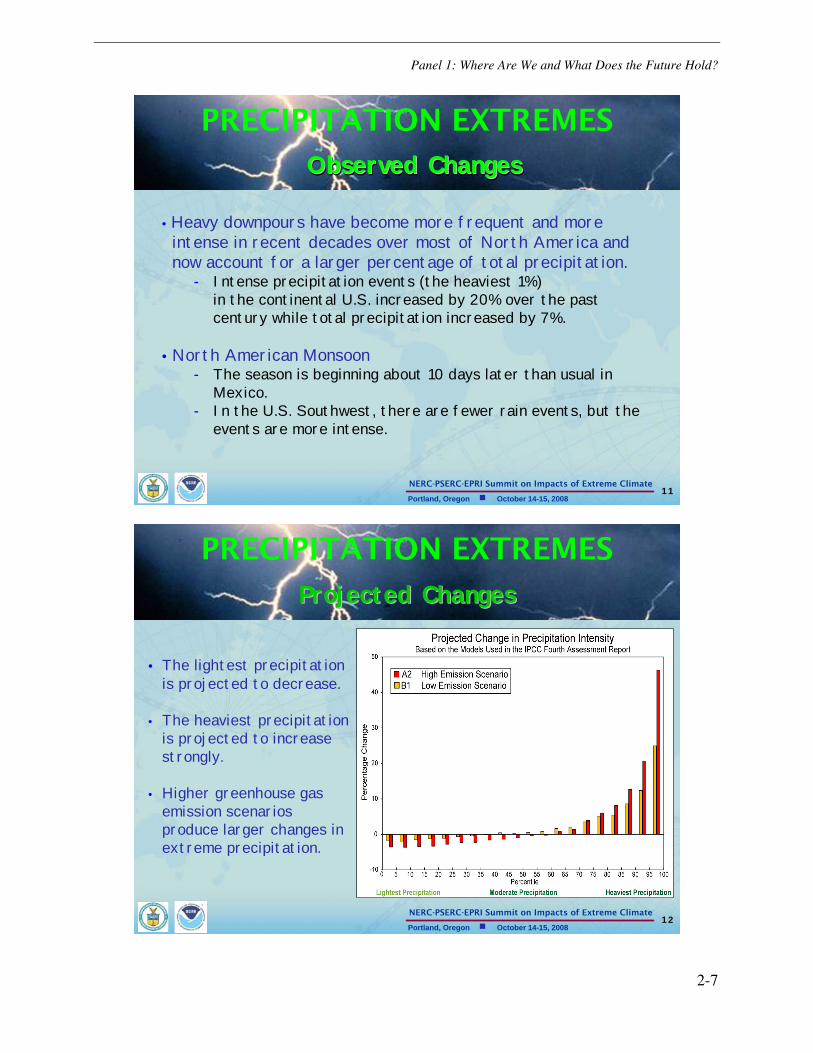
• Heavy downpours have become more frequent and more intense in recent decades over most of North America and now account for a larger percentage of total precipitation.
- Intense precipitation events (the heaviest 1%) in the continental U.S. increased by 20% over the past century while total precipitation increased by 7%.
• North American Monsoon- The season is beginning about 10 days later than usual in
Mexico.- In the U.S. Southwest, there are fewer rain events, but the
events are more intense.
PRECIPITATION EXTREMES
1212Portland, Oregon October 14-15, 2008
NERC-PSERC-EPRI Summit on Impacts of Extreme Climate
Projected ChangesProjected Changes
• The lightest precipitationis projected to decrease.
• The heaviest precipitationis projected to increasestrongly.
• Higher greenhouse gasemission scenarios produce larger changes inextreme precipitation.
PRECIPITATION EXTREMES
Panel 1: Where Are We and What Does the Future Hold?
2-8
1313Portland, Oregon October 14-15, 2008
NERC-PSERC-EPRI Summit on Impacts of Extreme Climate
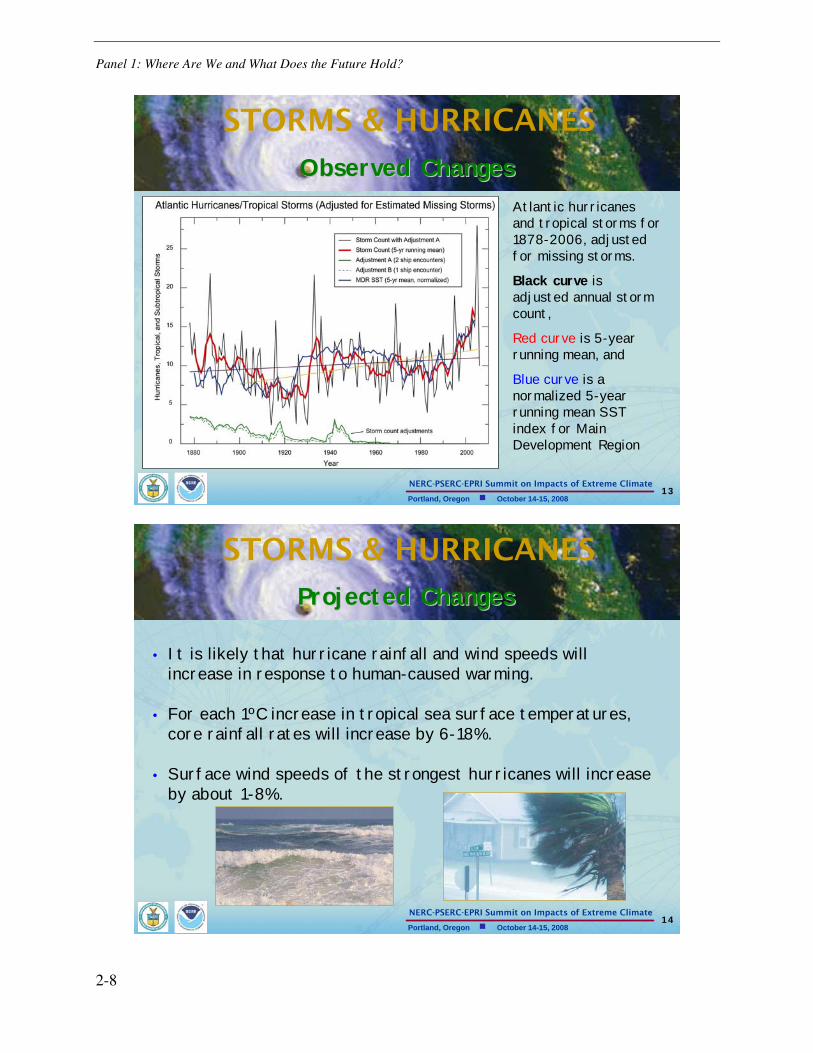
Atlantic hurricanes and tropical storms for 1878-2006, adjusted for missing storms.
Black curve is adjusted annual storm count,
Red curve is 5-year running mean, and
Blue curve is a normalized 5-year running mean SST index for Main Development Region
STORMS & HURRICANES
Observed ChangesObserved Changes
1414Portland, Oregon October 14-15, 2008
NERC-PSERC-EPRI Summit on Impacts of Extreme Climate
• It is likely that hurricane rainfall and wind speeds will increase in response to human-caused warming.
• For each 1ºC increase in tropical sea surface temperatures, core rainfall rates will increase by 6-18%.
• Surface wind speeds of the strongest hurricanes will increase by about 1-8%.
STORMS & HURRICANES
Projected ChangesProjected Changes
Panel 1: Where Are We and What Does the Future Hold?
2-9
1515Portland, Oregon October 14-15, 2008
NERC-PSERC-EPRI Summit on Impacts of Extreme Climate
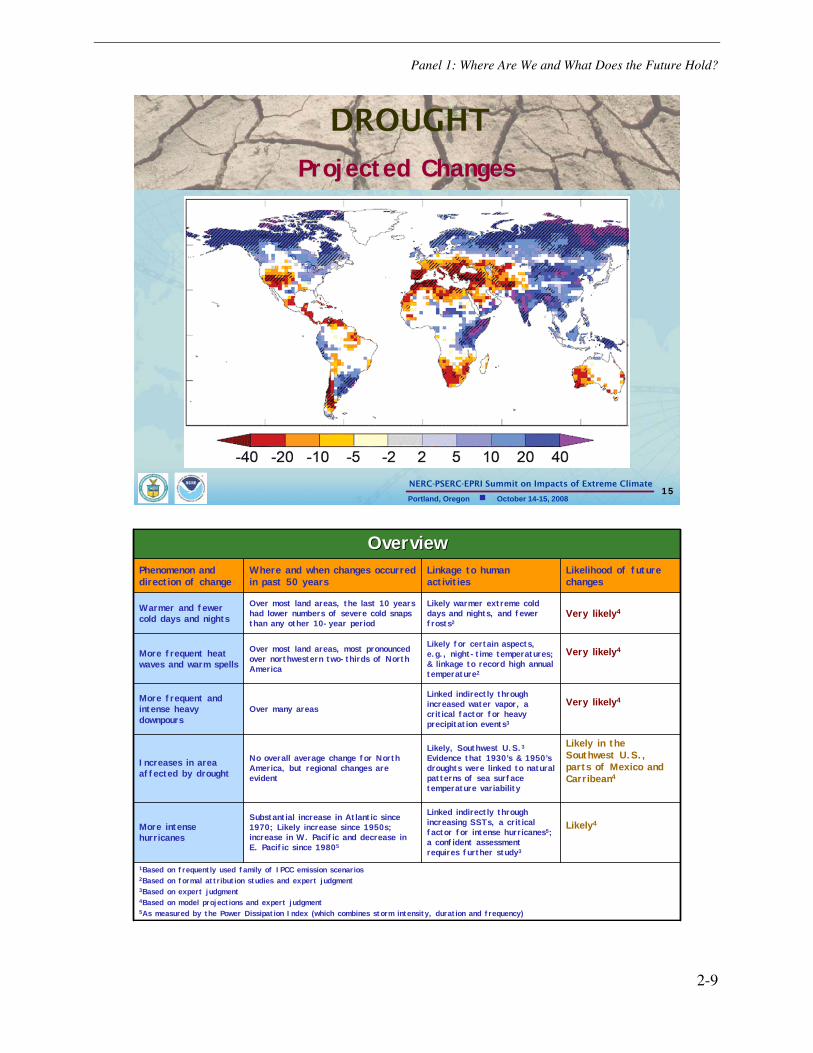
DROUGHTPercent Change in Annual Runoff (2090-2099)
Percent change in Annual Runoff (2090-2099)
DROUGHT
Projected ChangesProjected Changes
1Based on frequently used family of IPCC emission scenarios 2Based on formal attribution studies and expert judgment3Based on expert judgment4Based on model projections and expert judgment 5As measured by the Power Dissipation Index (which combines storm intensity, duration and frequency)
Likely4Linked indirectly through increasing SSTs, a critical factor for intense hurricanes5; a confident assessment requires further study3
Substantial increase in Atlantic since 1970; Likely increase since 1950s; increase in W. Pacific and decrease in E. Pacific since 19805
More intense hurricanes
Likely in the Southwest U.S., parts of Mexico and Carribean4
Likely, Southwest U.S.3Evidence that 1930’s & 1950’s droughts were linked to natural patterns of sea surface temperature variability
No overall average change for North America, but regional changes are evident
Increases in area affected by drought
Very likely4Linked indirectly through increased water vapor, a critical factor for heavy precipitation events3
Over many areasMore frequent and intense heavy downpours
Very likely4Likely for certain aspects, e.g., night-time temperatures; & linkage to record high annual temperature2
Over most land areas, most pronounced over northwestern two-thirds of North America
More frequent heat waves and warm spells
Very likely4Likely warmer extreme cold days and nights, and fewer frosts2
Over most land areas, the last 10 years had lower numbers of severe cold snaps than any other 10-year period
Warmer and fewer cold days and nights
Likelihood of future changes
Linkage to human activities
Where and when changes occurred in past 50 years
Phenomenon and direction of change
OverviewOverview

Panel 1: Where Are We and What Does the Future Hold?
2-10
Changes in Surface Winds Over the Georgia Basin-Puget Sound Region Using a Regional Climate Model
Charles Curry (Canadian Centre for Climate Modeling & Analysis)
This presentation described a focused regional study of wind. The objective is to investigate the changes in mean and extreme wind over Southern British Columbia. The study combines wind observations with wind models in order to project wind behavior into the future.
Some of the global-scale forces are greenhouse gases and particulate emissions. Resolution is at 50 km, but all regional efforts are striving for higher resolutions. When viewing results, using the 90th percentile statistics tends to be robust and leave the 10% statistics as useful [11]. We still do not know the extent of the tail. The 95th percentile changes in average wind speed are from -4% to +10% at 10m. The time between the extremes and the extreme values would be useful. These numbers could be extracted out of the simulations.
We need to know current climate conditions before presenting the changes. Wind speeds generally increase in the winter, which is the period with highest winds. Wind speed in the summer is expected to decrease, when they are typically calm. Having wind energy content is more useful for utility applications than wind speed.
Wind changes at 80 to 100m are very different than at 10m. Turbines are affected by winds in the 80m to 100m range. Wind speed changes in certain ranges strongly affect wind turbines and other effects. Wind and effects on heating and cooling is important for load forecasting.
This model is used for monthly average changes in wind. It can be enhanced to have gusting information. Digging deeper into the current model could reveal wind speed ranges at different elevations.
Considering that his presentation included preliminary results, not yet ready for publication, we include the abstract, rather than the presentation itself, below.
Projected (1990-2060) Changes in Surface Winds over the Georgia Basin-Puget Sound Region Using a Regional Climate Model
Charles L. Curry
University of Victoria and the Canadian Centre for Climate Modeling and Analysis, Meteorological Service of Canada, Victoria, British Columbia, Canada
Summary
The objective of this work is to investigate the changes in mean and extreme wind over a specific region, namely, Southern British Columbia-Northern Washington. The study combines wind observations with wind models in order to project wind behavior into the future. The main tool used is the Canadian Regional Climate Model (CRCM4), with a spatial resolution of 45 km,
Panel 1: Where Are We and What Does the Future Hold?
2-11
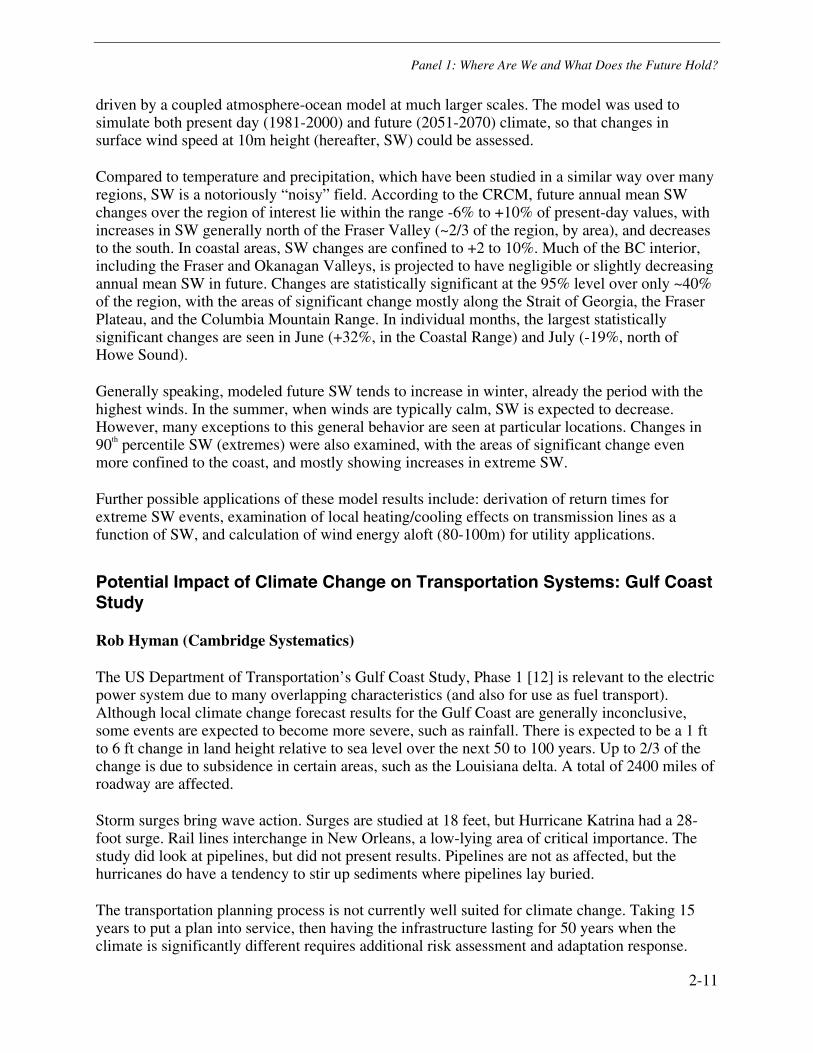
driven by a coupled atmosphere-ocean model at much larger scales. The model was used to simulate both present day (1981-2000) and future (2051-2070) climate, so that changes in surface wind speed at 10m height (hereafter, SW) could be assessed.
Compared to temperature and precipitation, which have been studied in a similar way over many regions, SW is a notoriously “noisy” field. According to the CRCM, future annual mean SW changes over the region of interest lie within the range -6% to +10% of present-day values, with increases in SW generally north of the Fraser Valley (~2/3 of the region, by area), and decreases to the south. In coastal areas, SW changes are confined to +2 to 10%. Much of the BC interior, including the Fraser and Okanagan Valleys, is projected to have negligible or slightly decreasing annual mean SW in future. Changes are statistically significant at the 95% level over only ~40% of the region, with the areas of significant change mostly along the Strait of Georgia, the Fraser Plateau, and the Columbia Mountain Range. In individual months, the largest statistically significant changes are seen in June (+32%, in the Coastal Range) and July (-19%, north of Howe Sound).
Generally speaking, modeled future SW tends to increase in winter, already the period with the highest winds. In the summer, when winds are typically calm, SW is expected to decrease. However, many exceptions to this general behavior are seen at particular locations. Changes in 90th percentile SW (extremes) were also examined, with the areas of significant change even more confined to the coast, and mostly showing increases in extreme SW.
Further possible applications of these model results include: derivation of return times for extreme SW events, examination of local heating/cooling effects on transmission lines as a function of SW, and calculation of wind energy aloft (80-100m) for utility applications.
Potential Impact of Climate Change on Transportation Systems: Gulf Coast Study
Rob Hyman (Cambridge Systematics)
The US Department of Transportation’s Gulf Coast Study, Phase 1 [12] is relevant to the electric power system due to many overlapping characteristics (and also for use as fuel transport). Although local climate change forecast results for the Gulf Coast are generally inconclusive, some events are expected to become more severe, such as rainfall. There is expected to be a 1 ft to 6 ft change in land height relative to sea level over the next 50 to 100 years. Up to 2/3 of the change is due to subsidence in certain areas, such as the Louisiana delta. A total of 2400 miles of roadway are affected.
Storm surges bring wave action. Surges are studied at 18 feet, but Hurricane Katrina had a 28-foot surge. Rail lines interchange in New Orleans, a low-lying area of critical importance. The study did look at pipelines, but did not present results. Pipelines are not as affected, but the hurricanes do have a tendency to stir up sediments where pipelines lay buried.
The transportation planning process is not currently well suited for climate change. Taking 15 years to put a plan into service, then having the infrastructure lasting for 50 years when the climate is significantly different requires additional risk assessment and adaptation response.
Panel 1: Where Are We and What Does the Future Hold?
2-12
A good example for where to place emphasis for resilience that could be translated to the power sector is the CalTRANS review of bridges and other critical infrastructure [13]. Distribution engineering uses pre-1930 weather with 40-year service. Engineers use manuals to govern standard procedures and these may be soon outdated. Funding for roads comes from Federal and State funds. This contrasts with the power system.
Climate Change and Transportation
KentuckyKentucky’’s 2008s 2008
Regional Air Quality ConferenceRegional Air Quality Conference
Mike SavonisMike SavonisTeam Leader for Air QualityTeam Leader for Air Quality
FHWA, US Department of TransportationFHWA, US Department of Transportation
Panel 1: Where Are We and What Does the Future Hold?
2-13
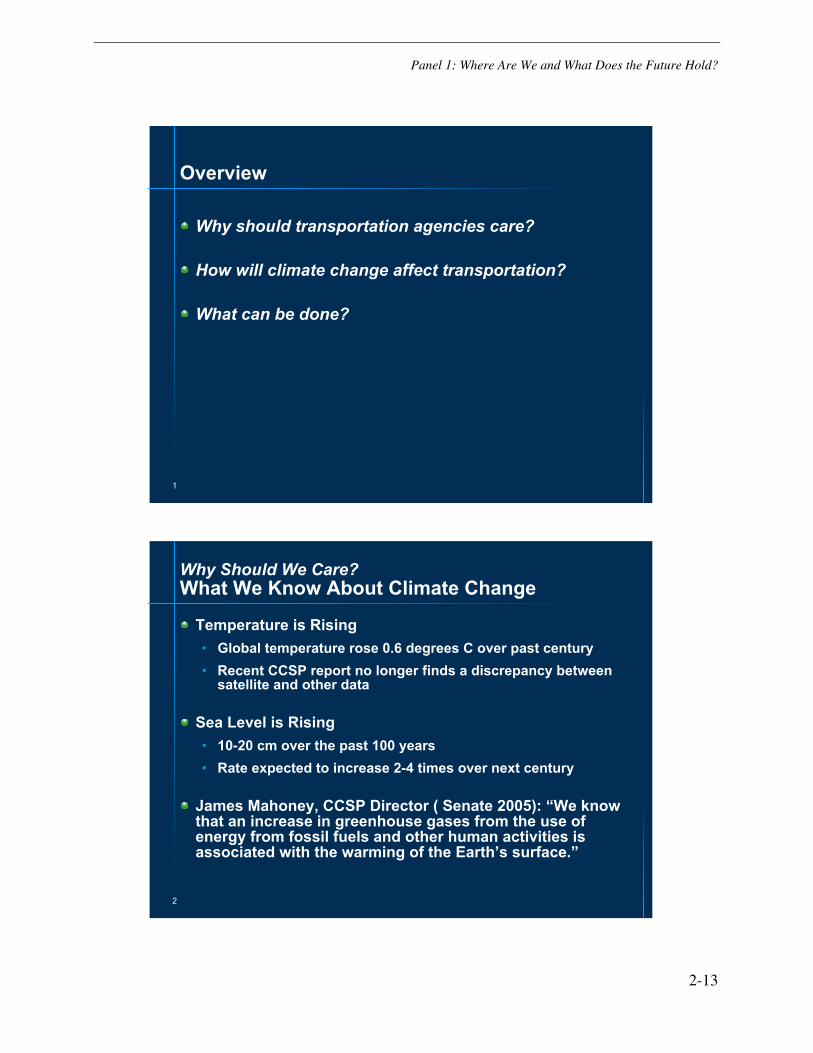
1
Overview
Why should transportation agencies care?
How will climate change affect transportation?
What can be done?
2
Why Should We Care?What We Know About Climate Change
Temperature is Rising• Global temperature rose 0.6 degrees C over past century• Recent CCSP report no longer finds a discrepancy between
satellite and other data
Sea Level is Rising• 10-20 cm over the past 100 years• Rate expected to increase 2-4 times over next century
James Mahoney, CCSP Director ( Senate 2005): “We know that an increase in greenhouse gases from the use of energy from fossil fuels and other human activities is associated with the warming of the Earth’s surface.”
Panel 1: Where Are We and What Does the Future Hold?
2-14
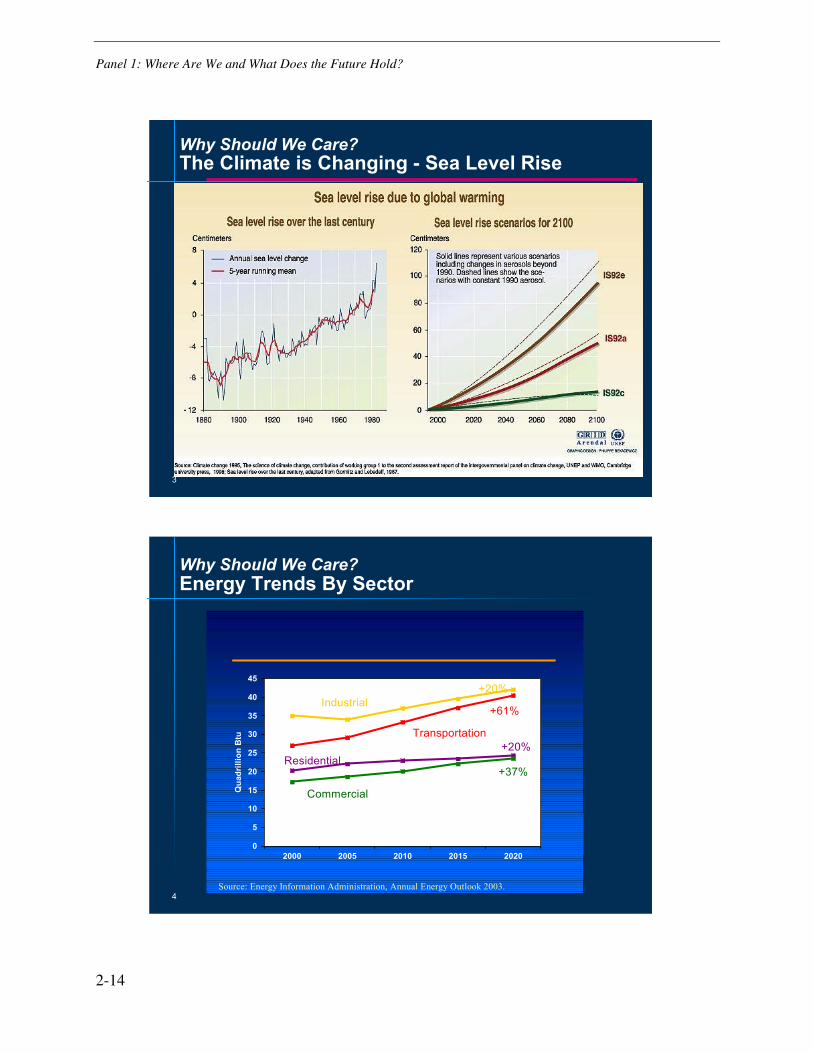
3Credit: David Easterling, National Climate Data Center, NOAA
Why Should We Care?The Climate is Changing - Sea Level Rise
4
Why Should We Care?Energy Trends By Sector
0
5
10
15
20
25
30
35
40
45
2000 2005 2010 2015 2020
Qua
drill
ion
Btu
Source: Energy Information Administration, Annual Energy Outlook 2003.
+20%
+61%
+20%
+37%
Industrial
Transportation
Residential
Commercial
Panel 1: Where Are We and What Does the Future Hold?
2-15
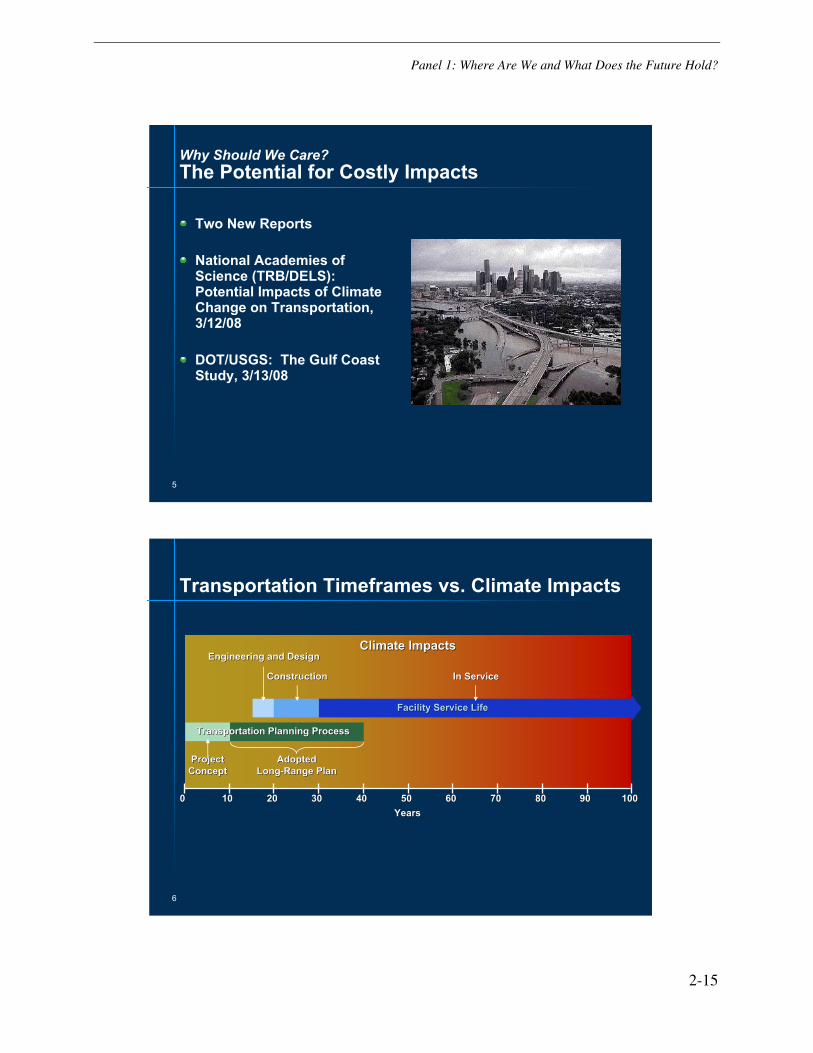
5
Why Should We Care?The Potential for Costly Impacts
Two New Reports
National Academies of Science (TRB/DELS): Potential Impacts of Climate Change on Transportation, 3/12/08
DOT/USGS: The Gulf Coast Study, 3/13/08
6
Transportation Timeframes vs. Climate Impacts
00 1010 2020 3030 4040 5050 6060 7070 8080 9090 100100
ProjectProjectConceptConcept
ConstructionConstruction In ServiceIn Service
Engineering and DesignEngineering and Design
AdoptedAdoptedLongLong--Range PlanRange Plan
YearsYears
Transportation Planning ProcessTransportation Planning Process
Facility Service LifeFacility Service Life
Climate ImpactsClimate Impacts
Panel 1: Where Are We and What Does the Future Hold?
2-16
7
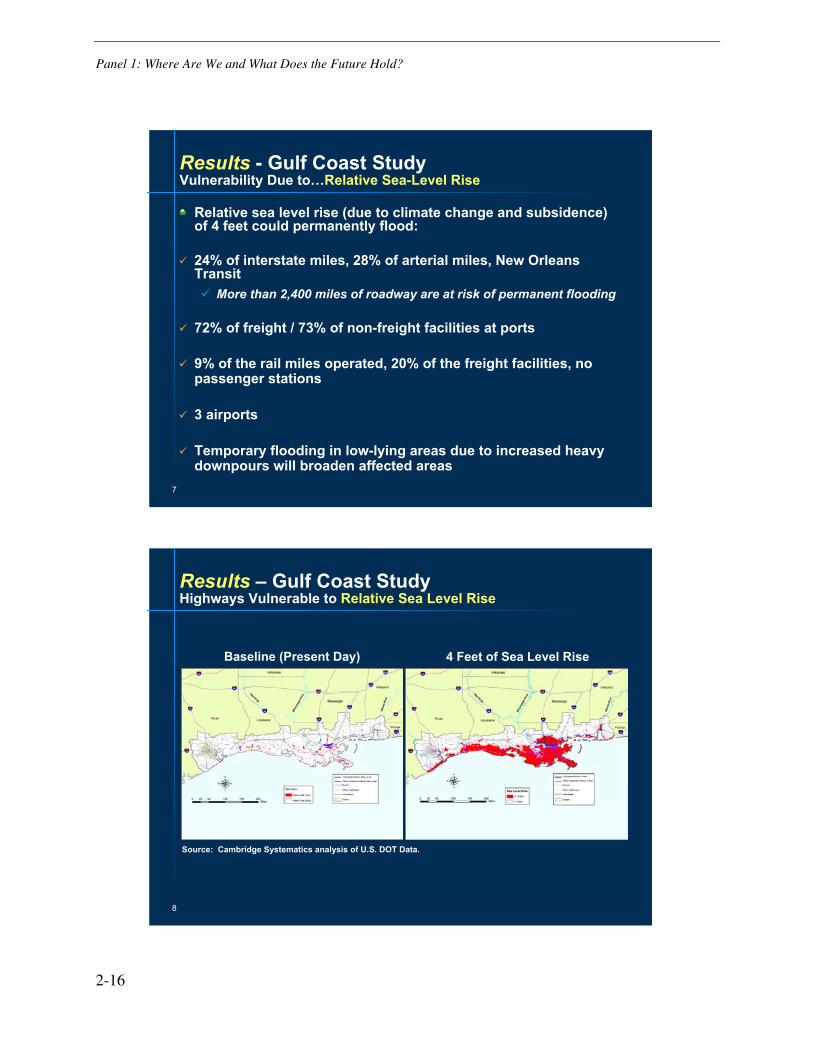
Results - Gulf Coast StudyVulnerability Due to…Relative Sea-Level Rise
Relative sea level rise (due to climate change and subsidence) of 4 feet could permanently flood:
24% of interstate miles, 28% of arterial miles, New Orleans Transit
More than 2,400 miles of roadway are at risk of permanent flooding
72% of freight / 73% of non-freight facilities at ports
9% of the rail miles operated, 20% of the freight facilities, nopassenger stations
3 airports
Temporary flooding in low-lying areas due to increased heavy downpours will broaden affected areas
8
Results – Gulf Coast StudyHighways Vulnerable to Relative Sea Level Rise
Source: Cambridge Systematics analysis of U.S. DOT Data.
Baseline (Present Day) 4 Feet of Sea Level Rise
Panel 1: Where Are We and What Does the Future Hold?
2-17
9
Results – Gulf Coast StudyVulnerability Due to…Storm Surge
Transportation infrastructure that is vulnerable to 18 feet of storm surge includes:
51% of interstate miles, 56% of arterial miles, and most transit authorities
98% of port facilities vulnerable to surge and 100% to wind
33% of rail miles operated, 43% of freight facilities
22 airports in the study area at or below 18 feet MSL
Potentially significant damage to offshore facilities
10
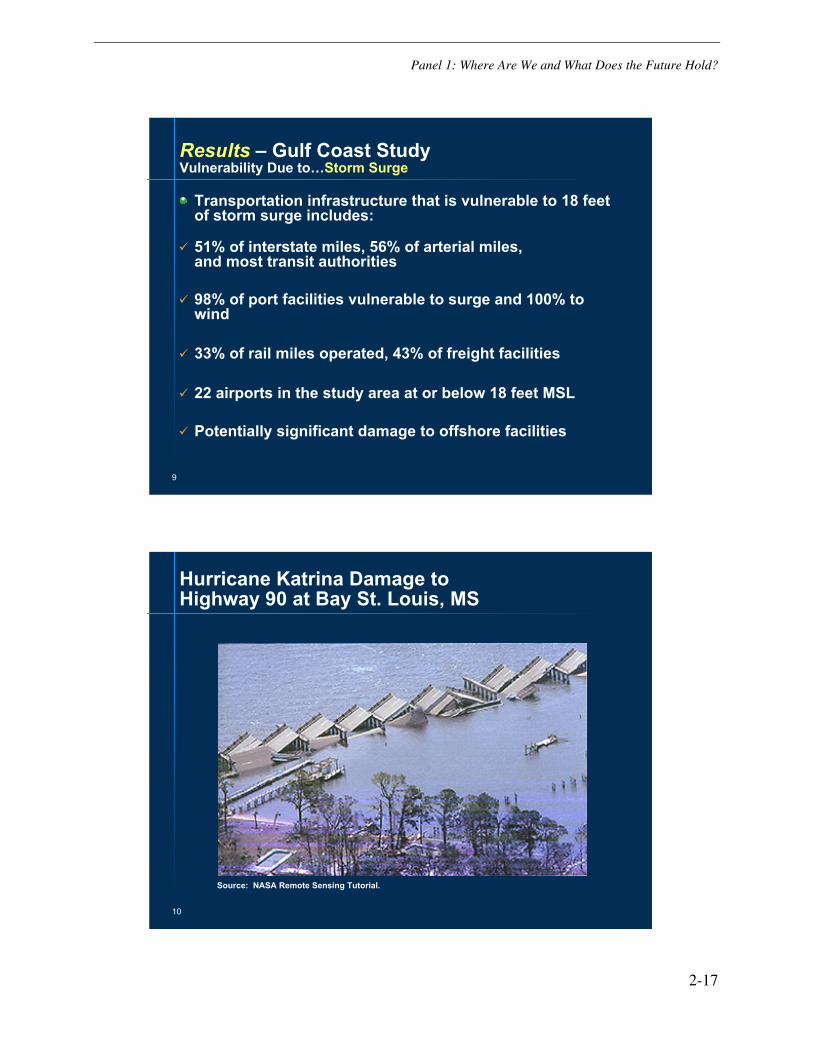
Hurricane Katrina Damage to Highway 90 at Bay St. Louis, MS
Source: NASA Remote Sensing Tutorial.
Panel 1: Where Are We and What Does the Future Hold?
2-18
11
Results – Gulf Coast StudyVulnerability Due to…Temperature increases
As temperatures increase, operations will be affected:• Potential change in maintenance and construction practices• Increased use of energy for refrigerated storage
• Potential rise in rail buckling
• May result in impacts to aircraft performance and runway
utilization
12
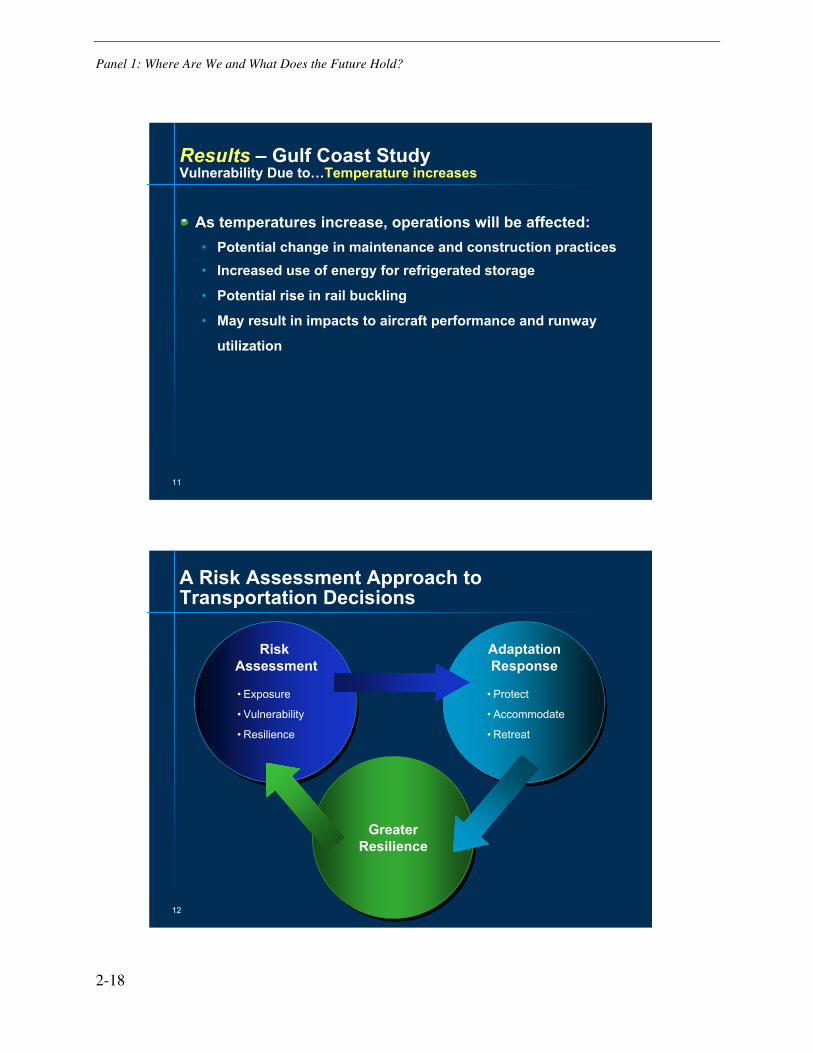
A Risk Assessment Approach to Transportation Decisions
Risk Assessment
AdaptationResponse
• Exposure
• Vulnerability
• Resilience
• Protect
• Accommodate
• Retreat
GreaterResilienceGreater
Resilience

Panel 1: Where Are We and What Does the Future Hold?
2-19
13
What can be done to reduce greenhouse gases?DOT Center for Climate Change
Center Research
Impacts of Climate Variability and
Change on Transportation
Effects of Transportation on Climate Change
14
What can be done to reduce Greenhouse Gases?Transportation Strategies—“three-legged stool”
Raise vehicle energy efficiency
Reduce carbon content of fuels
Improve energy efficiency of transportation systems • VMT, higher occupancy, transit,
land use, etc.
Panel 1: Where Are We and What Does the Future Hold?
2-20
15
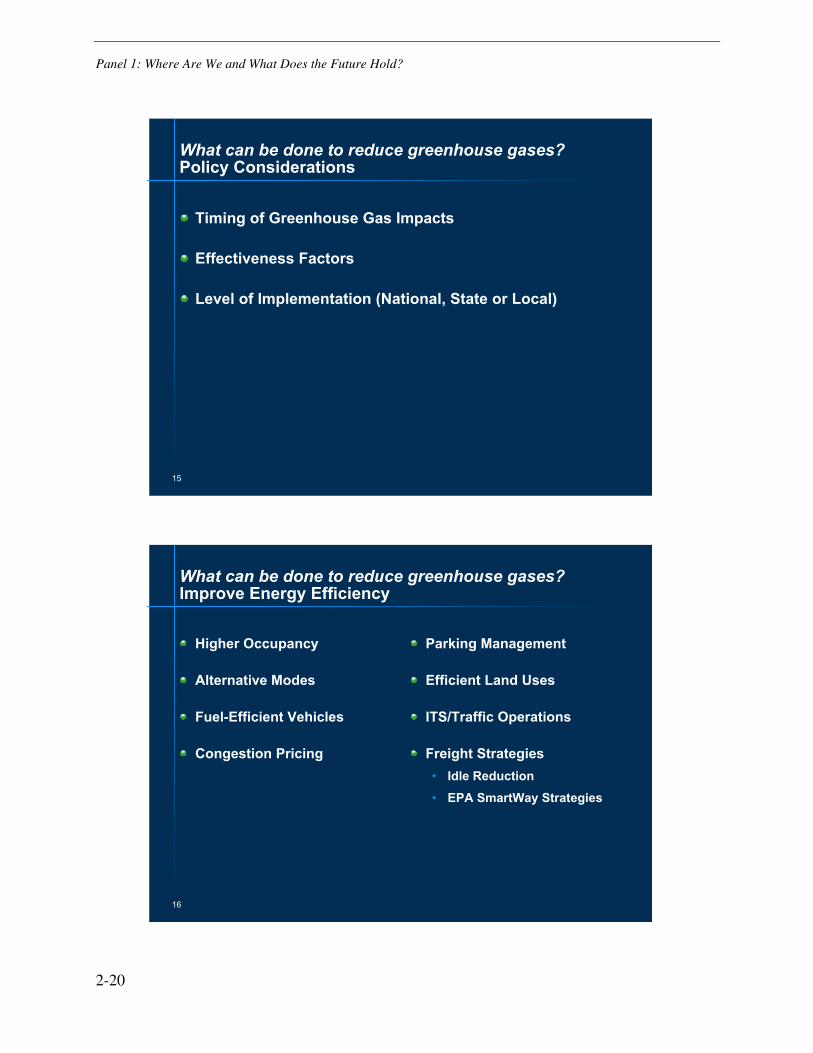
What can be done to reduce greenhouse gases?Policy Considerations
Timing of Greenhouse Gas Impacts
Effectiveness Factors
Level of Implementation (National, State or Local)
16
What can be done to reduce greenhouse gases?Improve Energy Efficiency
Higher Occupancy
Alternative Modes
Fuel-Efficient Vehicles
Congestion Pricing
Parking Management
Efficient Land Uses
ITS/Traffic Operations
Freight Strategies• Idle Reduction
• EPA SmartWay Strategies
Panel 1: Where Are We and What Does the Future Hold?
2-21
17
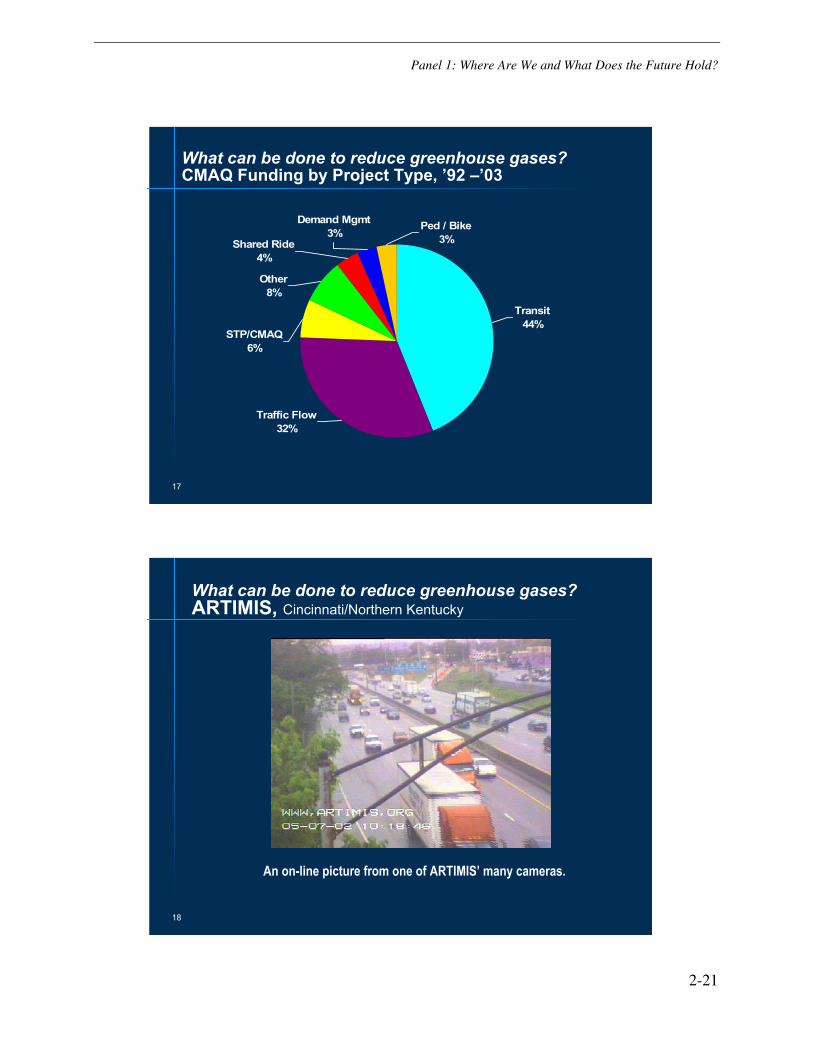
What can be done to reduce greenhouse gases?CMAQ Funding by Project Type, ’92 –’03
Demand Mgmt3%
Shared Ride4%
Traffic Flow32%
STP/CMAQ6%
Other8%
Transit44%
Ped / Bike3%
18
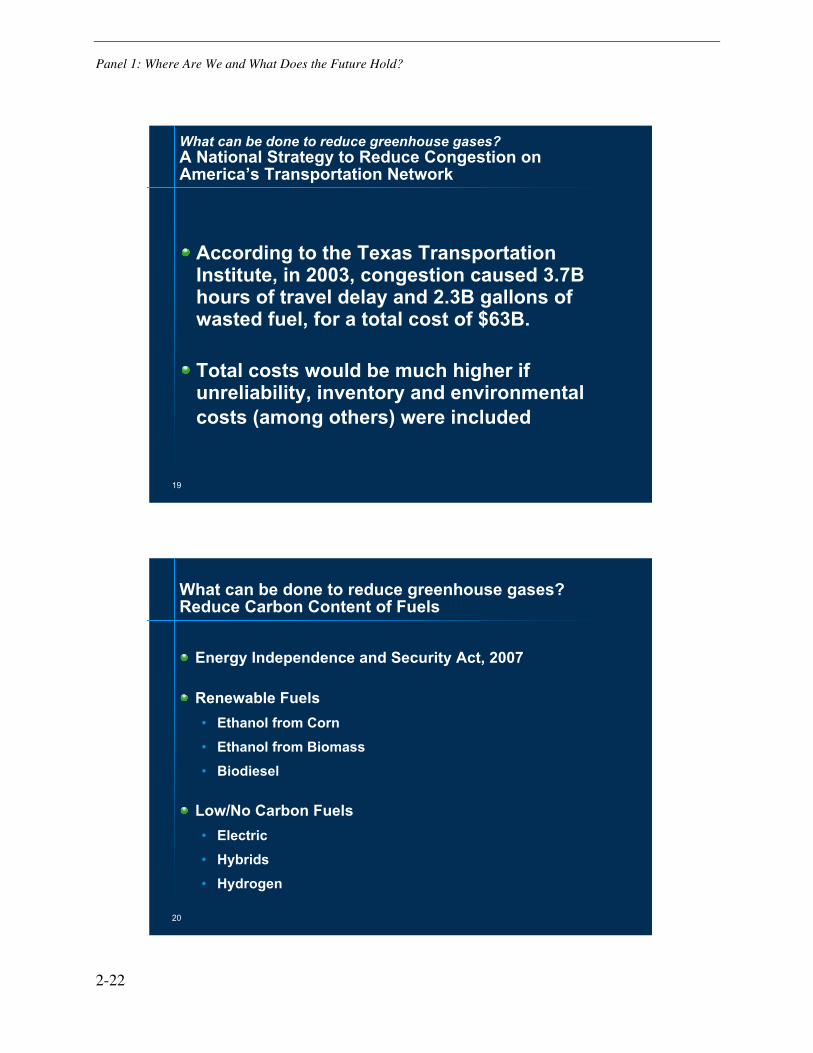
What can be done to reduce greenhouse gases? ARTIMIS, Cincinnati/Northern Kentucky
An on-line picture from one of ARTIMIS’ many cameras.
Panel 1: Where Are We and What Does the Future Hold?
2-22
19
What can be done to reduce greenhouse gases? A National Strategy to Reduce Congestion on America’s Transportation Network
According to the Texas Transportation Institute, in 2003, congestion caused 3.7B hours of travel delay and 2.3B gallons of wasted fuel, for a total cost of $63B.
Total costs would be much higher if unreliability, inventory and environmental costs (among others) were included.
20
What can be done to reduce greenhouse gases?Reduce Carbon Content of Fuels
Energy Independence and Security Act, 2007
Renewable Fuels• Ethanol from Corn• Ethanol from Biomass• Biodiesel
Low/No Carbon Fuels• Electric• Hybrids• Hydrogen
Panel 1: Where Are We and What Does the Future Hold?
2-23
21
What can be done to reduce greenhouse gases?Vehicle Fuel Economy Improvements
CAFÉ
Markets• Hybrids
Policy Measures• Incentives (e.g. SAFETEA-LU provisions)
22
What can be done to reduce greenhouse gases?Challenges
US anthropogenic sources of CO2 are roughly 6 billion tons per year
Ambient concentrations will likely continue to rise• “Wedge Analysis” seeks to limit concentrations to a
doubling of carbon dioxide
Many transportation strategies are long term or locally implemented
Panel 1: Where Are We and What Does the Future Hold?
2-24
23
What can be done to reduce greenhouse gases?Opportunities
Multiple benefits of many transportation strategies• Air pollution reduction• Congestion relief/Enhanced mobility• Greater livability• Enhanced sustainability
Advances US technologies worldwide
24
Other New Developments in Air Quality
CMAQ• New provisions under the Energy Independence and
Security Act
Mobile Source Air Toxics• New HEI Report• MSAT Settlement Study
New Ozone Air Quality Standards
3-1
3 PANEL 2: IMPACTS ON UTILITY DECISION-MAKING
Key questions addressed in this panel are:
• What are the reliability impacts on the power system that result from expected changes in climate?
• What planning and operations decisions are likely affected?
• When is it that we need to be prepared for these changes?
Operational issues include reserve requirements and procurement, load forecasting, the use of transmission in limiting GHG emissions, changes in thermal ratings of transmission lines as temperatures rise, and other equipment de-rating.
Planning issues include the need for fuel diversity, load forecasting, the role of new transmission lines for limiting GHG emissions, the role of energy storage, reliability of carbon capture and sequestration infrastructure and systems, and the potential for population migration.
This workshop panel included the following presentations:
• Historic Reactions to Extreme Weather Events in PJM – Mark Kuras, PJM
• The Impact of Climate Change on Distribution Engineering Decisions – Jerry Heydt, Arizona State
• Mitigation and Adaptation Priorities and Strategies for Utilities – Jim McConnach, IEEE-PES Climate Change Group and Policy Development Coordinating Committee
• WECC: July 24, 2006 Extreme Temperature Event – Mary Johannis, BPA
• Forecasting Hurricane Impacts on Critical Infrastructure – Silvio Flaim, LANL
Historic Reactions to Extreme Weather Events in PJM
Mark Kuras (PJM)
Mr. Kuras (also Vice- Chair of the Reliability Assessment Subcommittee) presented the impacts of and lessons learned from several extreme weather events on the PJM system, including severe summer and winter conditions, storms, and solar magnetic disturbances. Following are notes of the presentation and then the slides.
During the July 2006 event, PJM had approximately 147,000 MW of actual connected load. All Transmission Operator (TO) areas peaked at the same time, which had never happened before.

Panel 2: Impacts on Utility Decision-Making
3-2
Statistically this is a 1 in 97 year event. The combined load seen on that day is not expected again until 2012. Despite being an extreme weather event, no significant outages occurred.
During the summer 1999 heat event, there was a long-term voltage depression, which re-occurred some days later. A number of transformers failed, removing load and alleviating the operator from having to reduce load. Dynamic reactive capability of on-line generation was affected by the high temperatures and were not able to produce VARs at rating. The heat wave also promoted increased imports leading to lower internal dynamic VAR support. The industry response was annual verification of reactive capability and prompt notification of all changes. Alternative operating mode for Heavy Load Voltage Schedule: more generators on line with more control of capacitors. This increases the dynamic reactive capability.
The event in the winter of 1994 led to severe fuel transport and availability problems. The response has been to pre-positioning fuel and release frozen supplies in advance of anticipated cold weather. Some line heating is done to relieve transmission lines from ice.
Anticipated solar magnetic storms have also led to modified operating modes.
One of the main conclusions of the presentation was that the industry has time now to make adjustments before new extreme weather related problems occur.
PJM ©2008
Historic Reactions to Extreme Weather Events in PJM
Mark KurasPJM - NERC and Regional Coordination
NERC/PSERC/EPRI Workshop on Reliability and ClimateOctober 14-15, 2008
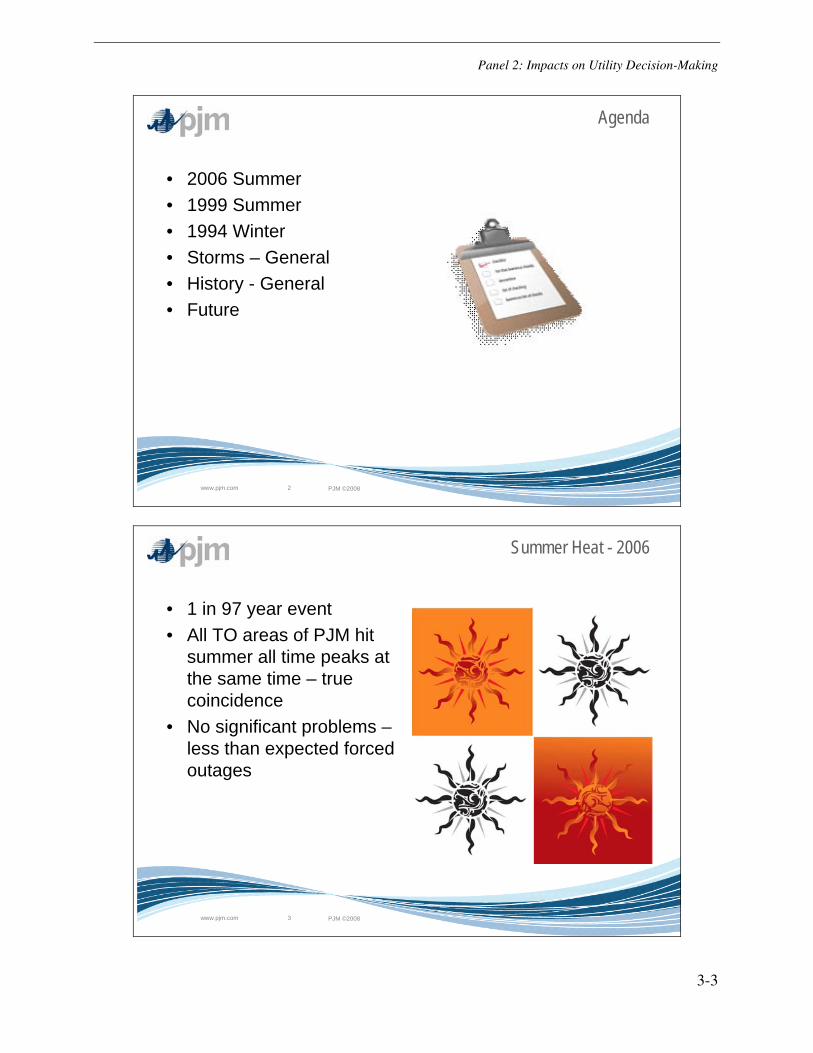
Panel 2: Impacts on Utility Decision-Making
3-3
PJM ©2008www.pjm.com 2
Agenda
• 2006 Summer• 1999 Summer• 1994 Winter• Storms – General• History - General• Future
PJM ©2008www.pjm.com 3
Summer Heat - 2006
• 1 in 97 year event• All TO areas of PJM hit
summer all time peaks at the same time – true coincidence
• No significant problems –less than expected forced outages
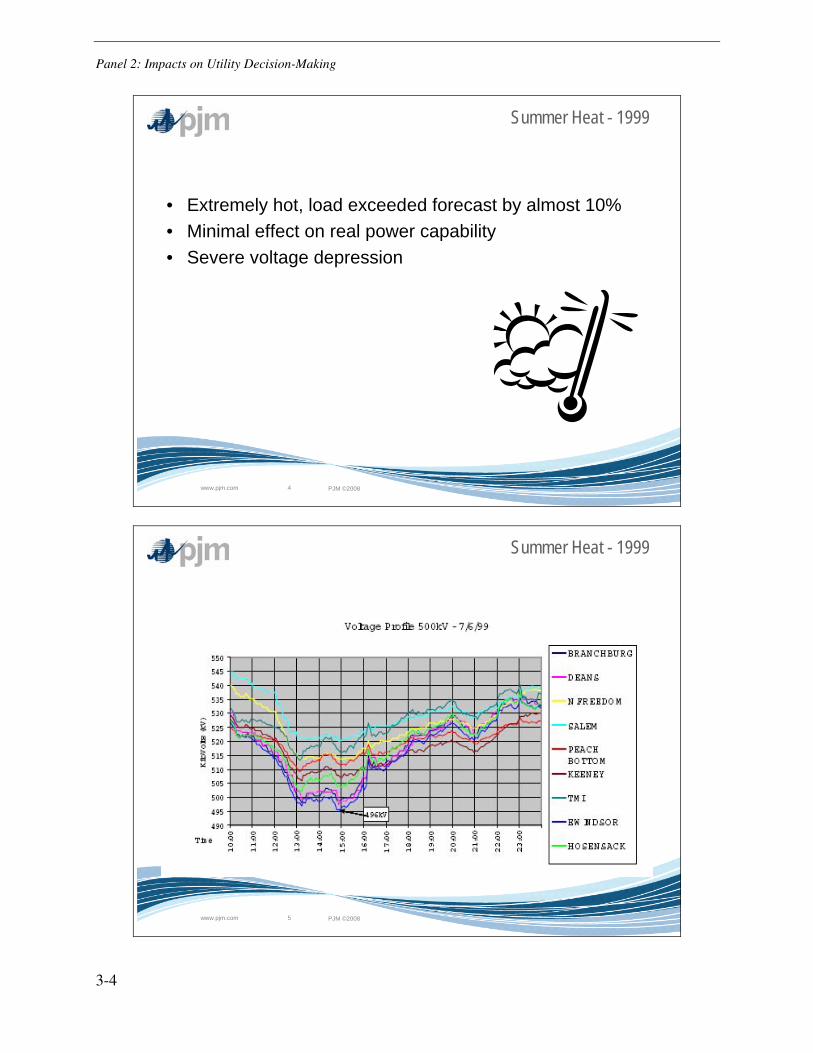
Panel 2: Impacts on Utility Decision-Making
3-4
PJM ©2008www.pjm.com 4
Summer Heat - 1999
• Extremely hot, load exceeded forecast by almost 10%• Minimal effect on real power capability• Severe voltage depression
PJM ©2008www.pjm.com 5
Summer Heat - 1999

Panel 2: Impacts on Utility Decision-Making
3-5
PJM ©2008www.pjm.com 6
Summer Heat -1999
PJM ©2008www.pjm.com 7
Summer Heat - 1999
• Problem– Effects on dynamic reactive capability– 2,000 MVAR were not available on operating units– High transfers, cheaper to bring in power rather than generate
• Response– Verification of reactive capability now required– Reporting of reactive capability changes– Heavy Load Voltage Schedule
• More generators on line• Caps on-line including distribution caps
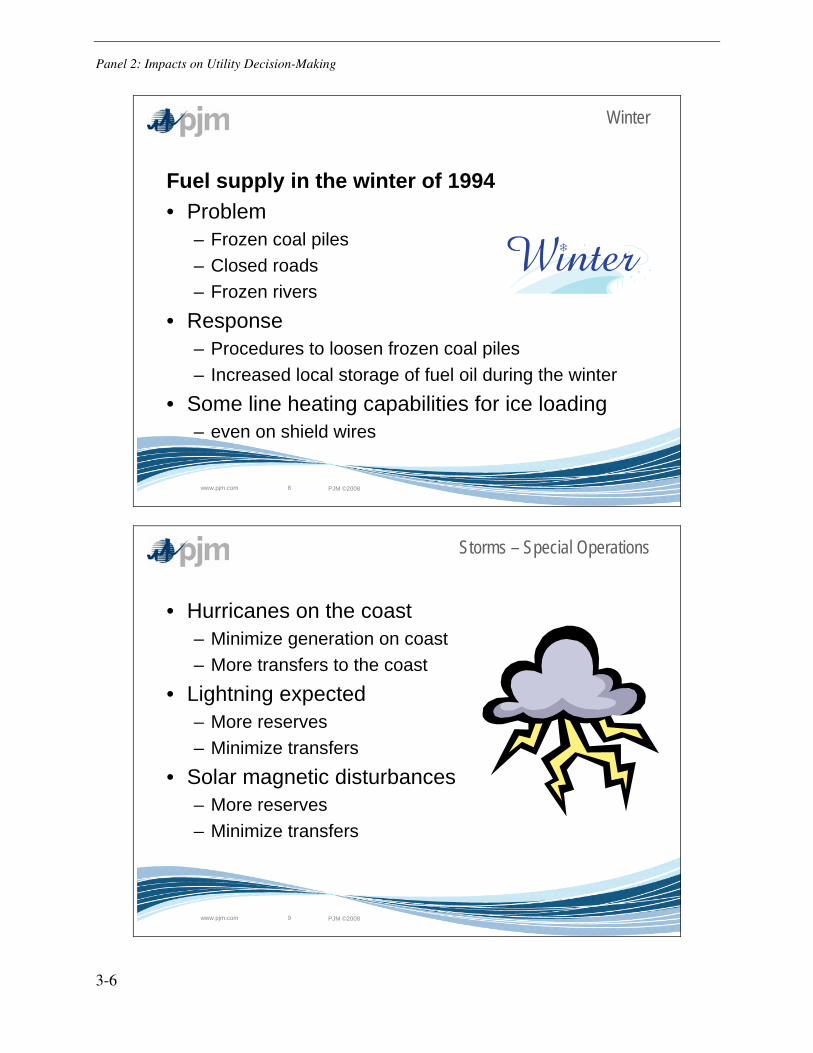
Panel 2: Impacts on Utility Decision-Making
3-6
PJM ©2008www.pjm.com 8
Winter
Fuel supply in the winter of 1994• Problem
– Frozen coal piles– Closed roads– Frozen rivers
• Response– Procedures to loosen frozen coal piles– Increased local storage of fuel oil during the winter
• Some line heating capabilities for ice loading– even on shield wires
PJM ©2008www.pjm.com 9
Storms – Special Operations
• Hurricanes on the coast– Minimize generation on coast– More transfers to the coast
• Lightning expected– More reserves– Minimize transfers
• Solar magnetic disturbances– More reserves– Minimize transfers
Panel 2: Impacts on Utility Decision-Making
3-7
PJM ©2008www.pjm.com 10
History
• Not been effected by drought– Little hydro
• How has this history affected decision making– Failures reinforced so they don’t happen again– Without the history, probably could have not gotten
these things through the approval process
PJM ©2008www.pjm.com 11
What the Future Holds in PJM
• Decisions for future development will be reactionary to policy making from the government– We still have lots of coal in the PJM generator interconnection
queues - 9,000 MW• Reality of the situation - it’s up to the developers, no PJM
intervention• Because of the amount of fossil fuels we use
– If mandates become extreme and with short timelines, there could be problems
– PJM is working with state governments to minimize reliability concerns with extreme mandates if enacted
– Must keep an eye on the costs, utilities have failed in this economy

Panel 2: Impacts on Utility Decision-Making
3-8
PJM ©2008www.pjm.com 12
Questions
The Impact of Climate Change on Distribution Engineering Decisions
Gerald Heydt, Arizona State
This is a presentation of climate impacts on power distribution systems. Following are notes of the presentation and then the slides.
The largest power system monetary investment is in distribution systems, and the largest impact on these systems appears to be in an ambient temperature rise. In Phoenix, urbanization is a large driver for ambient temperature.
Slide 7 has a typo, and it should read 40/sqrt(2). Failures and temperature relations are driven by chemical reactions. The relation is according to Dakin’s rule. 84% of loss of life (LOL) occurs in daytime. Increasing ambient temperature by 1°C causes a 7% increase in LOL. With a 40-year life span, the changes in temperature are forecast to be 1 to 5°C increase. Service life reduces from 40 to about 30 years, as a result of 1°C ambient temperature increase. Adding more copper and iron increases efficiency and cost, but gets a 40-year lifetime.
The intensity of lightning strikes is measured in kA/strike, and higher intensities lead to insulator flashes and damage. We need to know the intensity of windstorms to gauge cost/benefit of overhead versus underground. FPL has done a study in this regard.
Panel 2: Impacts on Utility Decision-Making
3-9
System Average Duration Index (SADI) and System Average Frequency Index (SAFI), values are 1. Underground gives a factor ten improvement. Measuring weather variance seems to provide reliable statistics. The largest cause of outage events is weather.
PHEV charging at night will limit nighttime cooling and require a reinforced transformer design basis. Are the reliability targets realistic?
1
The Impact of Climate Change on Distribution Engineering
Decisions G. T. Heydt
Arizona State University
NERC / PSerc / EPRI Workshop on Reliability and Climate
Portland Oregon
October 2008
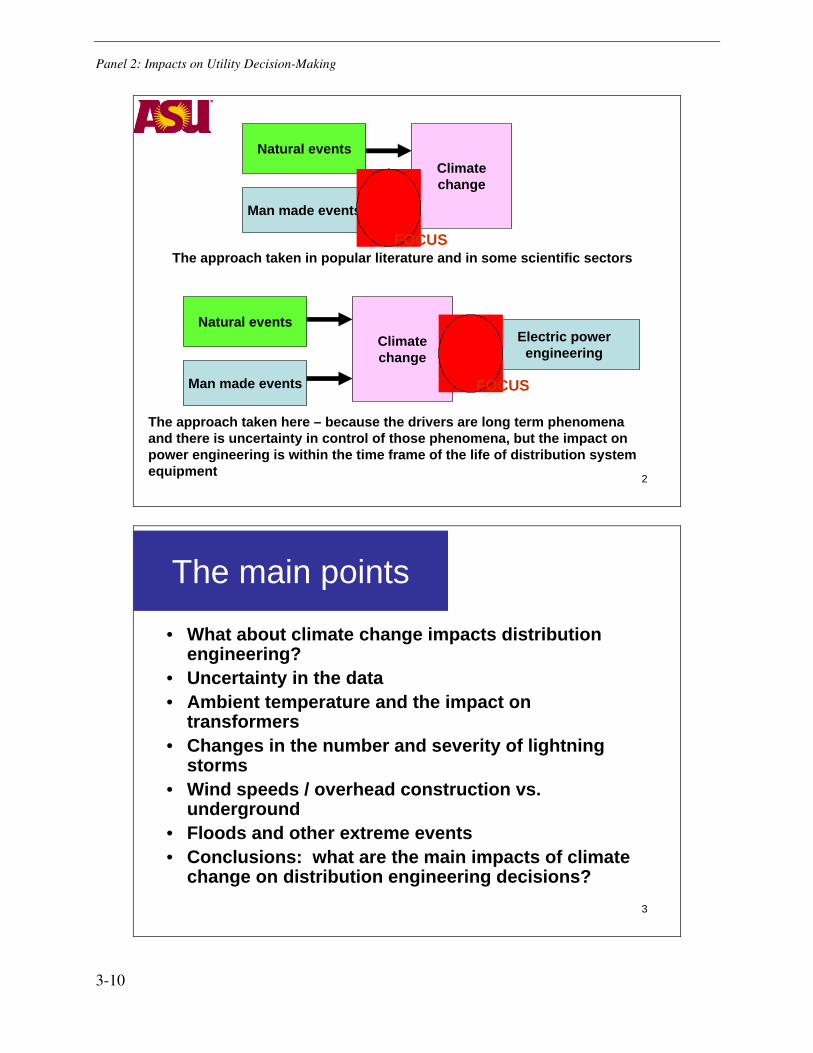
Panel 2: Impacts on Utility Decision-Making
3-10
2
Natural events
Man made events
Climatechange
Electric powerengineering
Natural events
Man made events
Climatechange
The approach taken in popular literature and in some scientific sectors
The approach taken here – because the drivers are long term phenomena and there is uncertainty in control of those phenomena, but the impact on power engineering is within the time frame of the life of distribution system equipment
FOCUS
FOCUS
3
The main points
• What about climate change impacts distribution engineering?
• Uncertainty in the data• Ambient temperature and the impact on
transformers• Changes in the number and severity of lightning
storms• Wind speeds / overhead construction vs.
underground• Floods and other extreme events• Conclusions: what are the main impacts of climate
change on distribution engineering decisions?
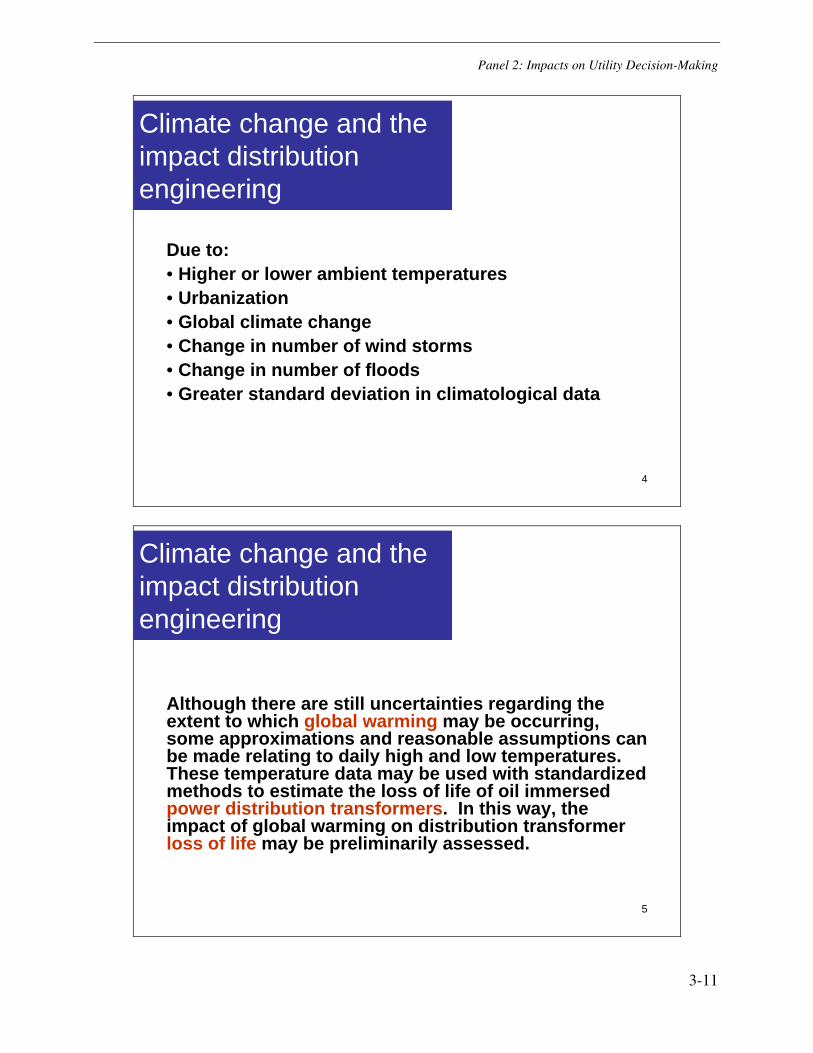
Panel 2: Impacts on Utility Decision-Making
3-11
4
Climate change and the impact distribution engineering
Due to:• Higher or lower ambient temperatures• Urbanization• Global climate change• Change in number of wind storms• Change in number of floods• Greater standard deviation in climatological data
5
Climate change and the impact distribution engineering
Although there are still uncertainties regarding the extent to which global warming may be occurring, some approximations and reasonable assumptions can be made relating to daily high and low temperatures. These temperature data may be used with standardized methods to estimate the loss of life of oil immersed power distribution transformers. In this way, the impact of global warming on distribution transformer loss of life may be preliminarily assessed.

Panel 2: Impacts on Utility Decision-Making
3-12
6
Ambient temperature and the impact on transformers
The ANSI / IEEE Standard C.57.91 gives a calculation method of the loss of life of a standard mineral-oil-immersed overhead and pad-mounted power distribution transformer,
)10(100⎥⎦⎤
⎢⎣⎡ +−
= TBA
tLOL
( ) ,...)(2
)10ln()10ln(
)()10ln(1
24
22
3
2
⎟⎟⎠
⎞+∆−⎥
⎦
⎤⎢⎣
⎡+
⎜⎝⎛ +∆−+=
aa
aagw
TB
TB
TBLOLLOL
θθ
θθ
where t is the study time horizon in hours for which the load is constant, A (hours) and B (hours / kelvin) are constants taken from a life expectancy curve of the transformer and T is the absolute temperature in kelvin. The entire analysis is based on steady state operation,
7
• Dakin’s famous rule: loss of life occurs at the rate of ½for every 10 degrees C temperature rise
• Based on Arrhenius’ law for chemical reactions• A transformer whose expected lifetime is 40 years will
experience a loss of life of years (i.e., expected life drops to 11.7 years) if a 5oC ambient temperature rise is experienced
• Dakin-related analysis gives similar results to the IEEE C57-based analysis, but not identical results.
• Simple application of Dakin-related analysis does not account for time of exposure to higher ambient temperatures
3.2840*2 =
A Dakin-based approach to the calculation of transformer loss of life
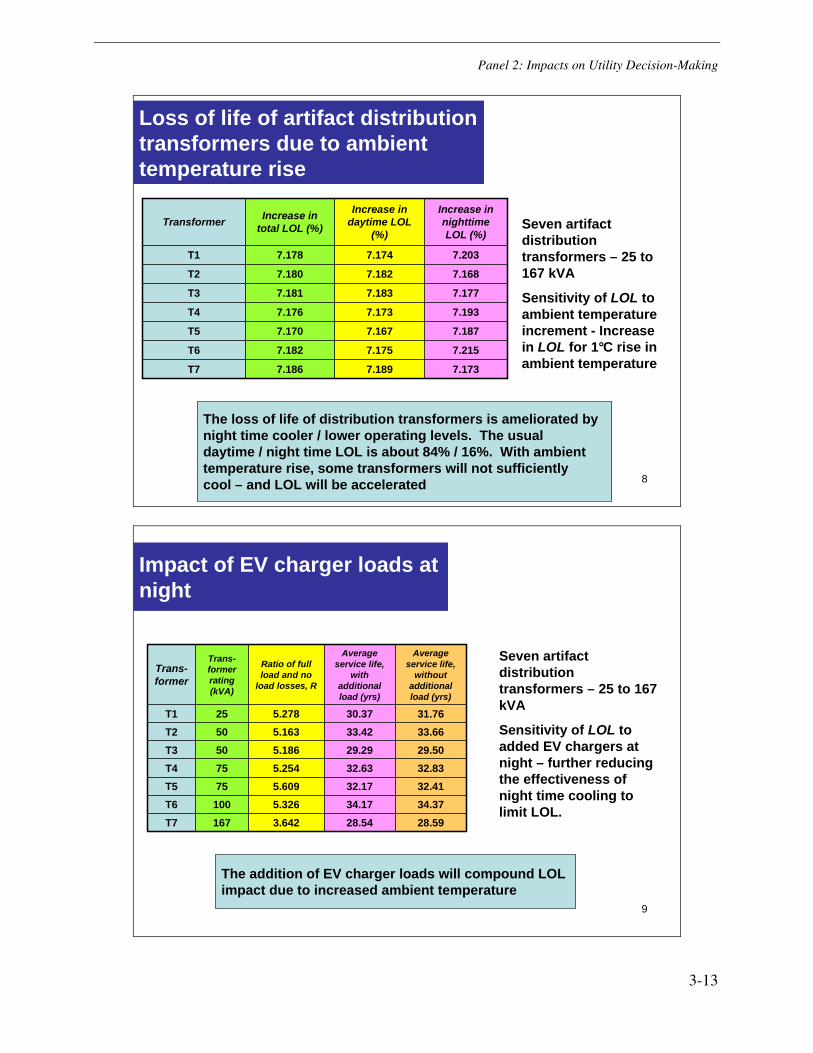
Panel 2: Impacts on Utility Decision-Making
3-13
8
Loss of life of artifact distribution transformers due to ambient temperature rise
7.1737.1897.186T7
7.2157.1757.182T6
7.1877.1677.170T5
7.1937.1737.176T4
7.1777.1837.181T3
7.1687.1827.180T2
7.2037.1747.178T1
Increase in nighttime LOL (%)
Increase in daytime LOL
(%)
Increase in total LOL (%)Transformer Seven artifact
distribution transformers – 25 to 167 kVA
Sensitivity of LOL to ambient temperature increment - Increase in LOL for 1°C rise in ambient temperature
The loss of life of distribution transformers is ameliorated by night time cooler / lower operating levels. The usualdaytime / night time LOL is about 84% / 16%. With ambienttemperature rise, some transformers will not sufficientlycool – and LOL will be accelerated
9
Impact of EV charger loads at night
28.5928.543.642167T734.3734.175.326100T632.4132.175.60975T532.8332.635.25475T429.5029.295.18650T333.6633.425.16350T231.7630.375.27825T1
Average service life,
without additional load (yrs)
Average service life,
with additional load (yrs)
Ratio of full load and no
load losses, R
Trans-former rating(kVA)
Trans-former
Seven artifact distribution transformers – 25 to 167 kVA
Sensitivity of LOL to added EV chargers at night – further reducing the effectiveness of night time cooling to limit LOL.
The addition of EV charger loads will compound LOLimpact due to increased ambient temperature
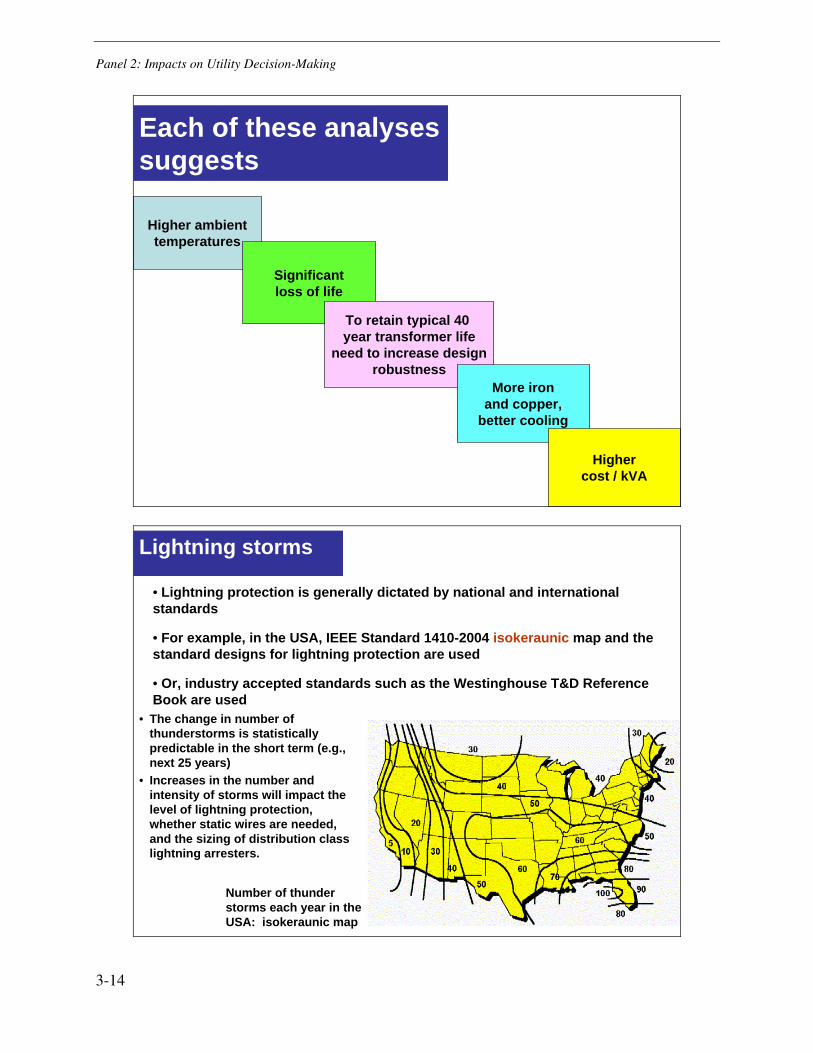
Panel 2: Impacts on Utility Decision-Making
3-14
10
Higher ambienttemperatures
Significantloss of life
To retain typical 40 year transformer life
need to increase designrobustness
More ironand copper,
better cooling
Highercost / kVA
Each of these analyses suggests
11
Lightning storms
• Lightning protection is generally dictated by national and international standards
• For example, in the USA, IEEE Standard 1410-2004 isokeraunic map and the standard designs for lightning protection are used
• Or, industry accepted standards such as the Westinghouse T&D Reference Book are used
Number of thunder storms each year in the USA: isokeraunic map
• The change in number of thunderstorms is statistically predictable in the short term (e.g., next 25 years)
• Increases in the number and intensity of storms will impact the level of lightning protection, whether static wires are needed, and the sizing of distribution class lightning arresters.

Panel 2: Impacts on Utility Decision-Making
3-15
12
• Historical data can be extrapolated to form models of number and intensity of wind storms
• The weather models can be overlaid on existing primary distribution systems to determine the cost / benefit of using more robust distribution designs, or even underground designs
• The main conclusions of such studies are that average losses can be mitigated by utilizing underground distribution designs more frequently than at present – especially in the ‘Gulf states’
Wind speeds / overhead construction vs. underground
13
•There is a need to quantify the cost / benefit of increase reliability. Will customers tolerate higher costs for greater reliability?
• There is a need to examine auxiliary systems and components, for example: effect of ambient temperature on overhead bare conductor splices; penetration of air conditioning loads and the impact on voltage stability
•There are limits to the use of high variance weather data
Things to consider in climate – energy research
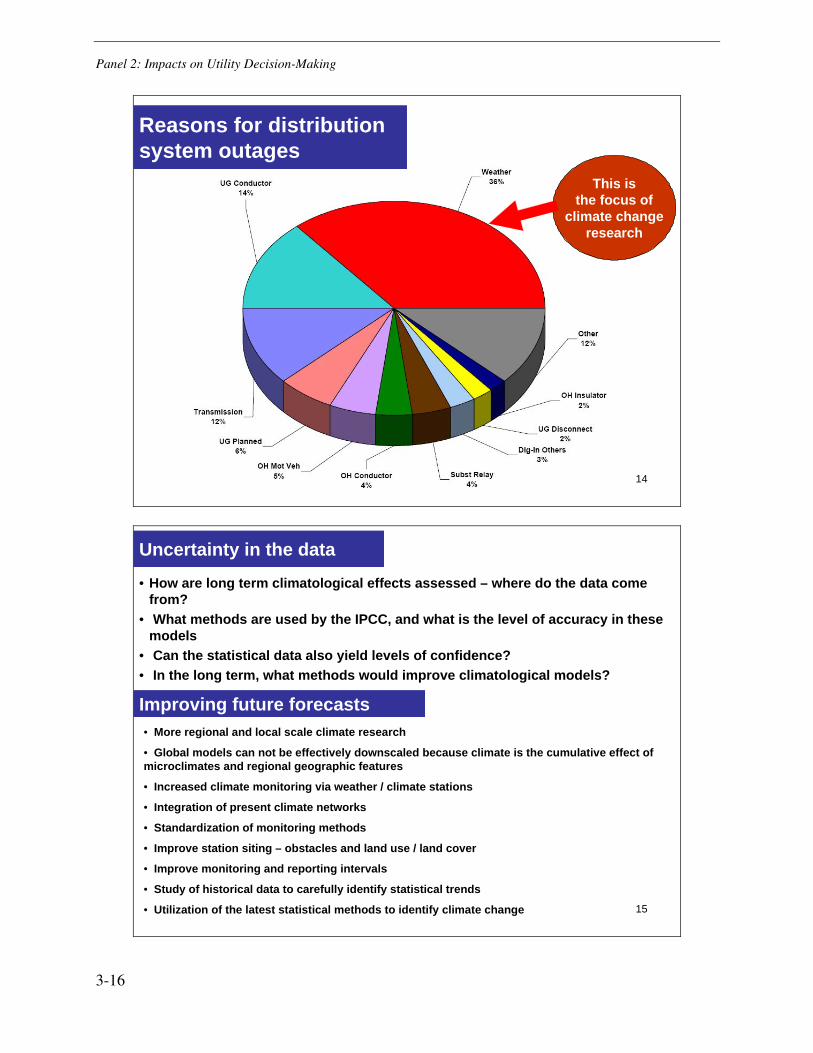
Panel 2: Impacts on Utility Decision-Making
3-16
14
This isthe focus of
climate changeresearch
Reasons for distribution system outages
15
Uncertainty in the data
• How are long term climatological effects assessed – where do the data come from?
• What methods are used by the IPCC, and what is the level of accuracy in these models
• Can the statistical data also yield levels of confidence?• In the long term, what methods would improve climatological models?
Improving future forecasts• More regional and local scale climate research
• Global models can not be effectively downscaled because climate is the cumulative effect of microclimates and regional geographic features
• Increased climate monitoring via weather / climate stations
• Integration of present climate networks
• Standardization of monitoring methods
• Improve station siting – obstacles and land use / land cover
• Improve monitoring and reporting intervals
• Study of historical data to carefully identify statistical trends
• Utilization of the latest statistical methods to identify climate change

Panel 2: Impacts on Utility Decision-Making
3-17
16
Where to go from here
• Revisit the entire subject of lightning protection – a technology that was developed in the 1930s
• Assess the impact of networked and doubly fed distribution systems
• Develop standardized methods for cost / benefit analyses of overhead vs. underground distribution systems. Perhaps this could be based on the System Average Interruption Duration Index (SAIDI) and the System Average Interruption Frequency Index (SAIFI)
17
• Identify accurate models for climate (temperature extremes, variance, mean, overnight lows, wind storms, thunderstorms) for the next 10, 25, and 50 years
• Identify accurate methods of derating components versus ambient temperature rise
• Gather data on existing overhead distribution systems and overlay them with wind storm models
Where to go from here
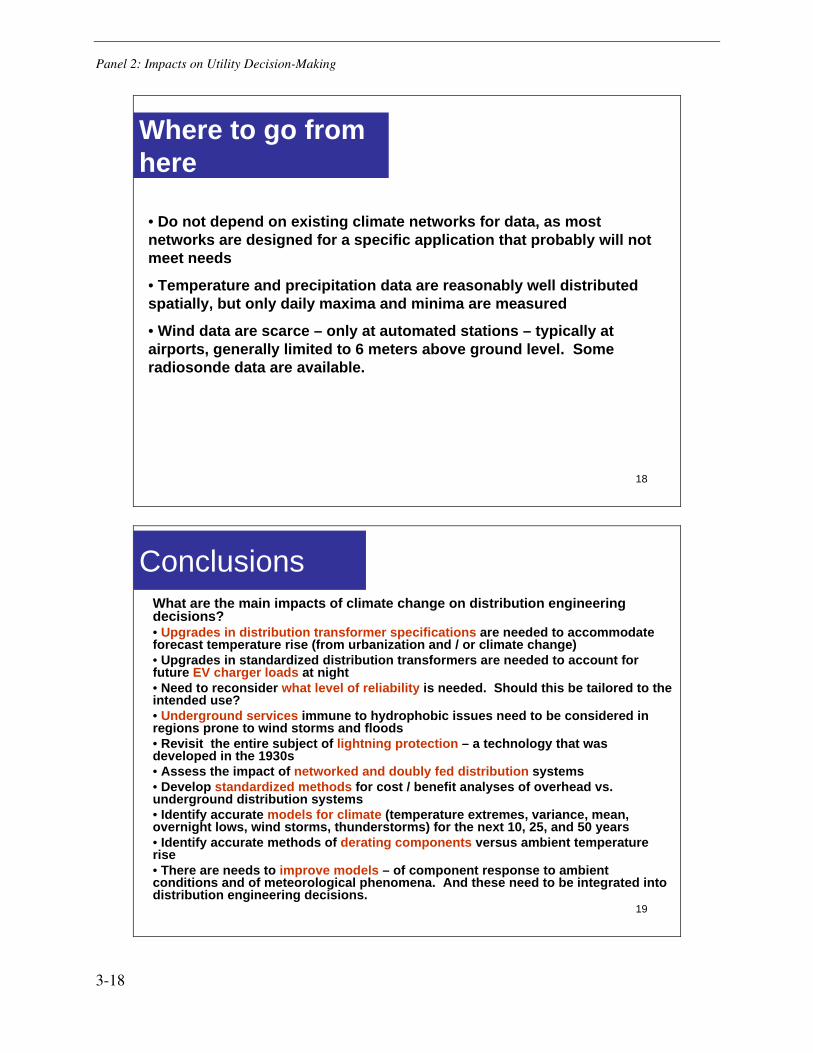
Panel 2: Impacts on Utility Decision-Making
3-18
18
• Do not depend on existing climate networks for data, as most networks are designed for a specific application that probably will not meet needs
• Temperature and precipitation data are reasonably well distributed spatially, but only daily maxima and minima are measured
• Wind data are scarce – only at automated stations – typically at airports, generally limited to 6 meters above ground level. Some radiosonde data are available.
Where to go from here
19
Conclusions What are the main impacts of climate change on distribution engineering decisions?• Upgrades in distribution transformer specifications are needed to accommodate forecast temperature rise (from urbanization and / or climate change)• Upgrades in standardized distribution transformers are needed to account for future EV charger loads at night• Need to reconsider what level of reliability is needed. Should this be tailored to the intended use?• Underground services immune to hydrophobic issues need to be considered in regions prone to wind storms and floods • Revisit the entire subject of lightning protection – a technology that was developed in the 1930s• Assess the impact of networked and doubly fed distribution systems• Develop standardized methods for cost / benefit analyses of overhead vs. underground distribution systems• Identify accurate models for climate (temperature extremes, variance, mean, overnight lows, wind storms, thunderstorms) for the next 10, 25, and 50 years• Identify accurate methods of derating components versus ambient temperature rise• There are needs to improve models – of component response to ambient conditions and of meteorological phenomena. And these need to be integrated into distribution engineering decisions.

Panel 2: Impacts on Utility Decision-Making
3-19
Mitigation and Adaptation Priorities and Strategies for Utilities
Jim McConnach (IEEE-PES)
This is a presentation advocating a risk management approach to studying climate change impacts on system planning and operational decision-making. Following are notes of the presentation and then the slides.
The complexities and uncertainties surrounding our current-day body of knowledge of climate science and the natural and man-made affects on climate change motivates a risk management approach. Major impacts, risks and costs to the power grid infrastructure are considered. Risks also come from such factors as over-dependence on fossil fuels, uncertainty about the regulatory structure, intermittent resource behavior, the aging infrastructure and its capability to handle new demand patterns (e.g. charging electric vehicles), the implementation and schedule for a smart grid, and the level of investment applied to renewing the infrastructure. A risk assessment and risk management approach will naturally help to prioritize strategies for flexibility and hedge against these risks.
Adaptation costs to cope with gradual changes in climate can be orders of magnitude less than mitigation costs to reduce GHG emissions. This suggests having a balanced approach between the two. Some strategies and priorities for mitigation and adaptation measures are suggested along with the benefits of these to the power industry. The main conclusion is to have a balanced and flexible combination of mitigation and adaptation measures to manage the costs and risks.
Mitgation & Adaptation Priorities & Strategies for Utilities
Presented by
Jim McConnachChair, IEEE-PES Climate Change WG
NERC-EPRI-PSERC Technical Summit Portland, Oregon, Oct. 14-15
Panel 2: Impacts on Utility Decision-Making
3-20
NERC-EPRI-PSERC Technical Summit, Oct. 14-15, 2008
SummaryIntroduction - Need for Action Climate Change Impacts/Risks for the GridOther Risks and ConsiderationsStrategies for UtilitiesRisk Management StrategyMitigation and Adaptation PrioritiesBenefits to Power IndustryConclusions
1
NERC-EPRI-PSERC Technical Summit, Oct. 14-15, 2008
IntroductionGrowing evidence of Climate Change (CC) and related risks to Grid reliability Need action to Mitigate and AdaptPower industry is major part of the problem -must be part of solution and show leadershipMajor challenges, complexity and uncertainties require a risk management approach to utility decision makingA balanced combination of mitigation and adaptation measures is recommended
2
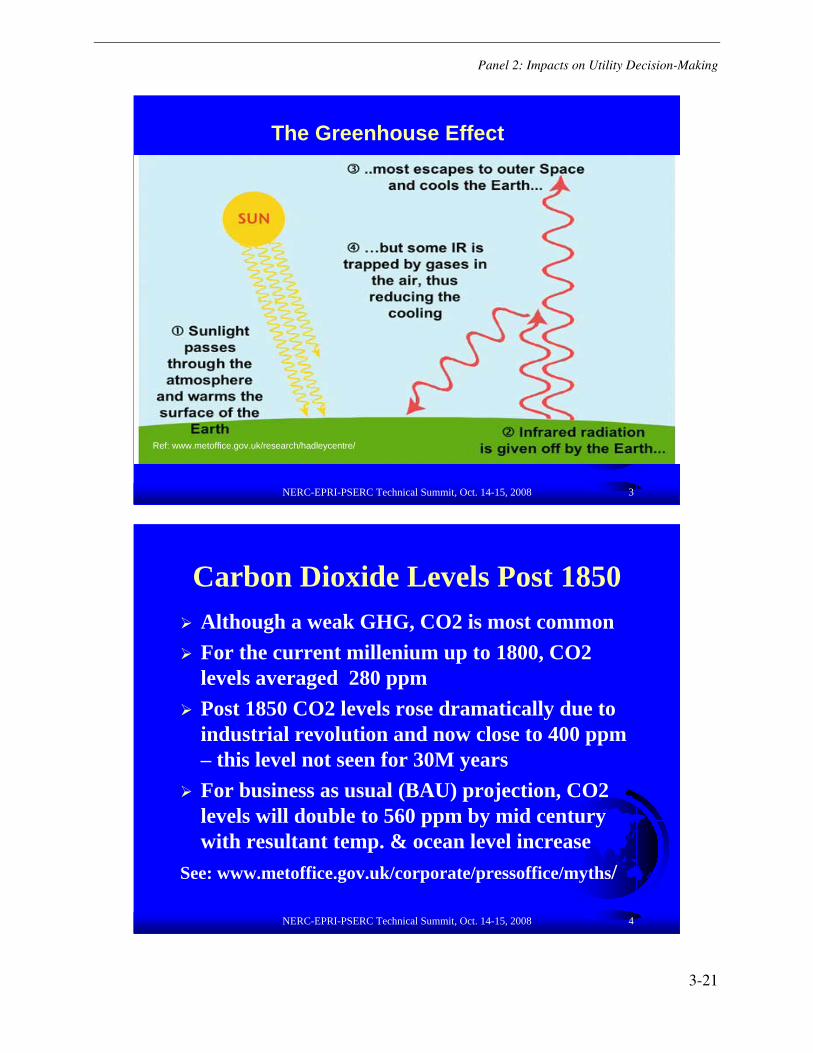
Panel 2: Impacts on Utility Decision-Making
3-21
NERC-EPRI-PSERC Technical Summit, Oct. 14-15, 2008
The Greenhouse Effect
Ref: www.metoffice.gov.uk/research/hadleycentre/
3
Carbon Dioxide Levels Post 1850Although a weak GHG, CO2 is most commonFor the current millenium up to 1800, CO2 levels averaged 280 ppmPost 1850 CO2 levels rose dramatically due to industrial revolution and now close to 400 ppm – this level not seen for 30M yearsFor business as usual (BAU) projection, CO2 levels will double to 560 ppm by mid century with resultant temp. & ocean level increase
See: www.metoffice.gov.uk/corporate/pressoffice/myths/
NERC-EPRI-PSERC Technical Summit, Oct. 14-15, 2008 4
Panel 2: Impacts on Utility Decision-Making
3-22
Direct Observations of Recent Climate Change
“Warming of the climate system is unequivocal,as is now evident from observations of increasesin global average air and ocean temperatures,widespread melting of snow and ice, and risingglobal mean sea level.”
Source: IPCC WG1 Report 2007
NERC-EPRI-PSERC Technical Summit, Oct. 14-15, 2008 5
Consequences if no action
“Continuing to increase emissions beyond the next 20 years will create an atmospheric composition not experienced since the age of the dinosaurs, with increasing potential for severe and predictable climatic and environmental change.”
Quote from Royal Society of Edinburgh Report on “Inquiry into Energy Issues in Scotland”, June 2006
NERC-EPRI-PSERC Technical Summit, Oct. 14-15, 2008 6

Panel 2: Impacts on Utility Decision-Making
3-23
Natural Causes of Climate ChangeNatural GHG cyclesSunspot cyclesOcean Currents – regional impactsAxial tilt – ice age cyclesVolcanic eruptions – particulatesFeedbacks – eg cloudsOther??
Bottom line: A complex emerging science with inherent uncertainties and risks- Need Risk Management approach
NERC-EPRI-PSERC Technical Summit, Oct. 14-15, 2008 7
The Population Growth Effect
Current Global Population: 6 BillionGlobal energy use per capita: 1.2ToeForecast Population 2050: 9 BillionSo even if per capita energy use held constant, global energy demand will increase by 50% by 2050
NERC-EPRI-PSERC Technical Summit, Oct. 14-15, 2008 8
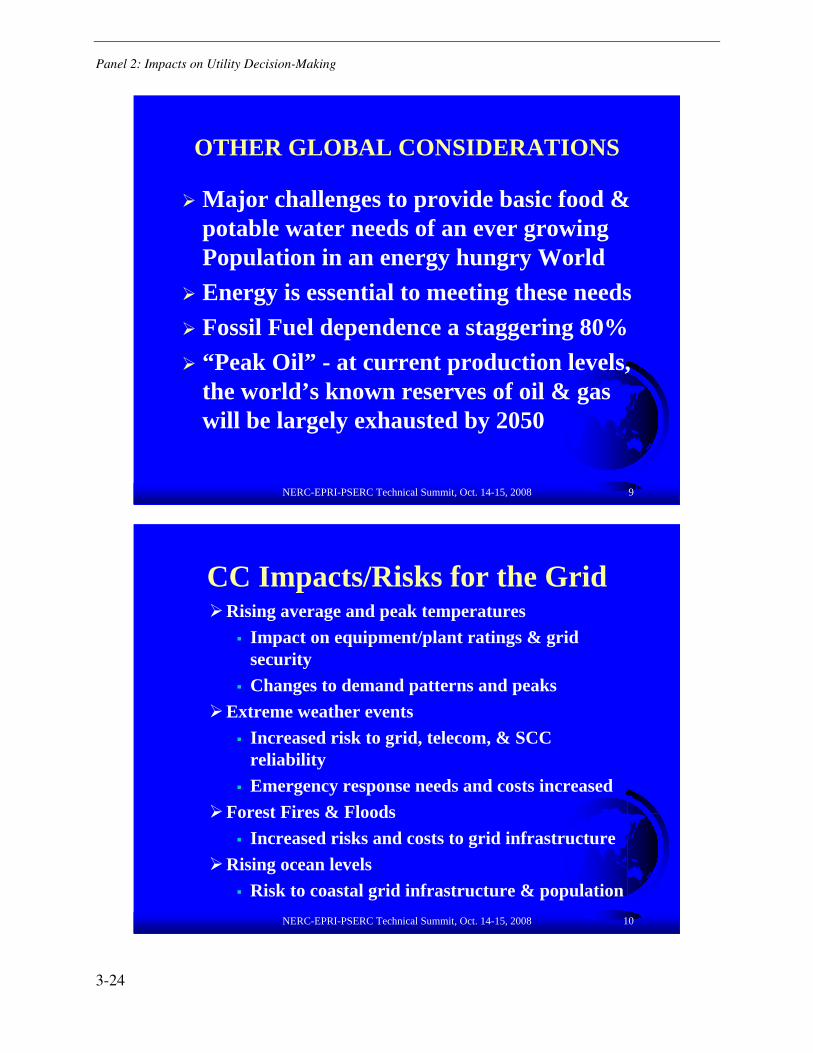
Panel 2: Impacts on Utility Decision-Making
3-24
OTHER GLOBAL CONSIDERATIONS
Major challenges to provide basic food & potable water needs of an ever growing Population in an energy hungry WorldEnergy is essential to meeting these needs Fossil Fuel dependence a staggering 80%“Peak Oil” - at current production levels, the world’s known reserves of oil & gas will be largely exhausted by 2050
NERC-EPRI-PSERC Technical Summit, Oct. 14-15, 2008 9
NERC-EPRI-PSERC Technical Summit, Oct. 14-15, 2008
CC Impacts/Risks for the GridRising average and peak temperatures
Impact on equipment/plant ratings & grid securityChanges to demand patterns and peaks
Extreme weather eventsIncreased risk to grid, telecom, & SCC reliabilityEmergency response needs and costs increased
Forest Fires & FloodsIncreased risks and costs to grid infrastructure
Rising ocean levelsRisk to coastal grid infrastructure & population
10
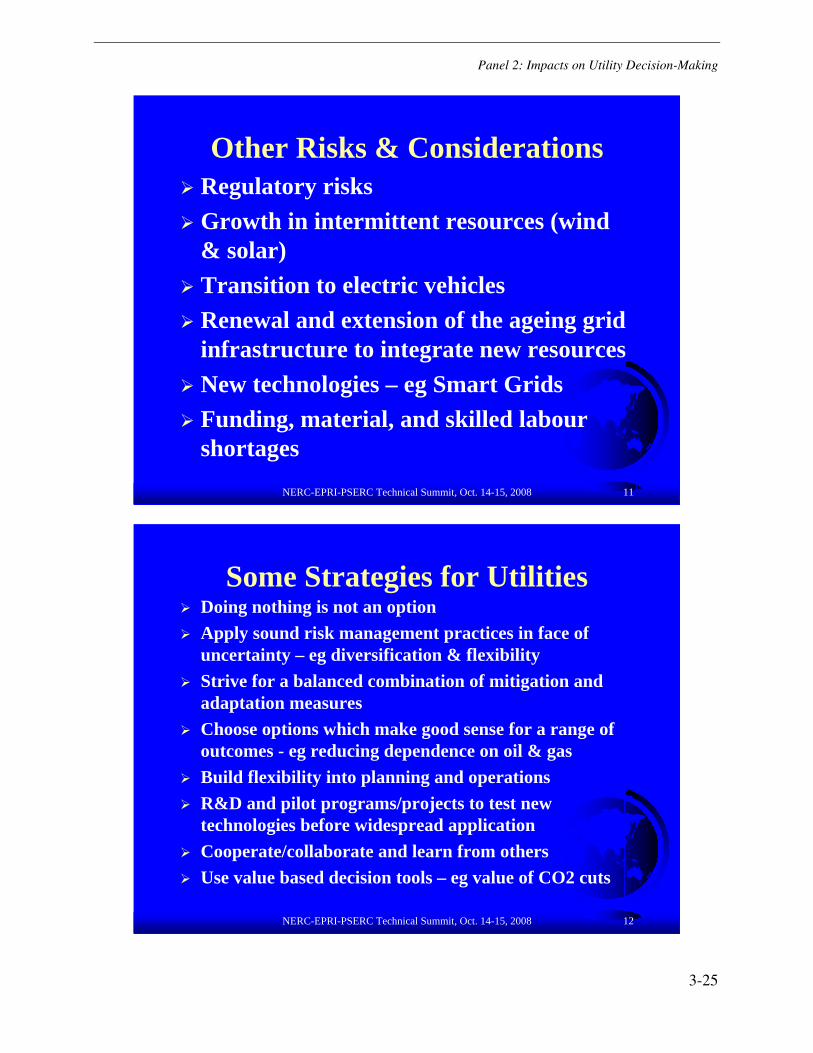
Panel 2: Impacts on Utility Decision-Making
3-25
Other Risks & ConsiderationsRegulatory risksGrowth in intermittent resources (wind & solar)Transition to electric vehiclesRenewal and extension of the ageing grid infrastructure to integrate new resourcesNew technologies – eg Smart GridsFunding, material, and skilled labour shortages
NERC-EPRI-PSERC Technical Summit, Oct. 14-15, 2008 11
Some Strategies for UtilitiesDoing nothing is not an optionApply sound risk management practices in face of uncertainty – eg diversification & flexibilityStrive for a balanced combination of mitigation and adaptation measuresChoose options which make good sense for a range of outcomes - eg reducing dependence on oil & gasBuild flexibility into planning and operationsR&D and pilot programs/projects to test new technologies before widespread applicationCooperate/collaborate and learn from othersUse value based decision tools – eg value of CO2 cuts
NERC-EPRI-PSERC Technical Summit, Oct. 14-15, 2008 12
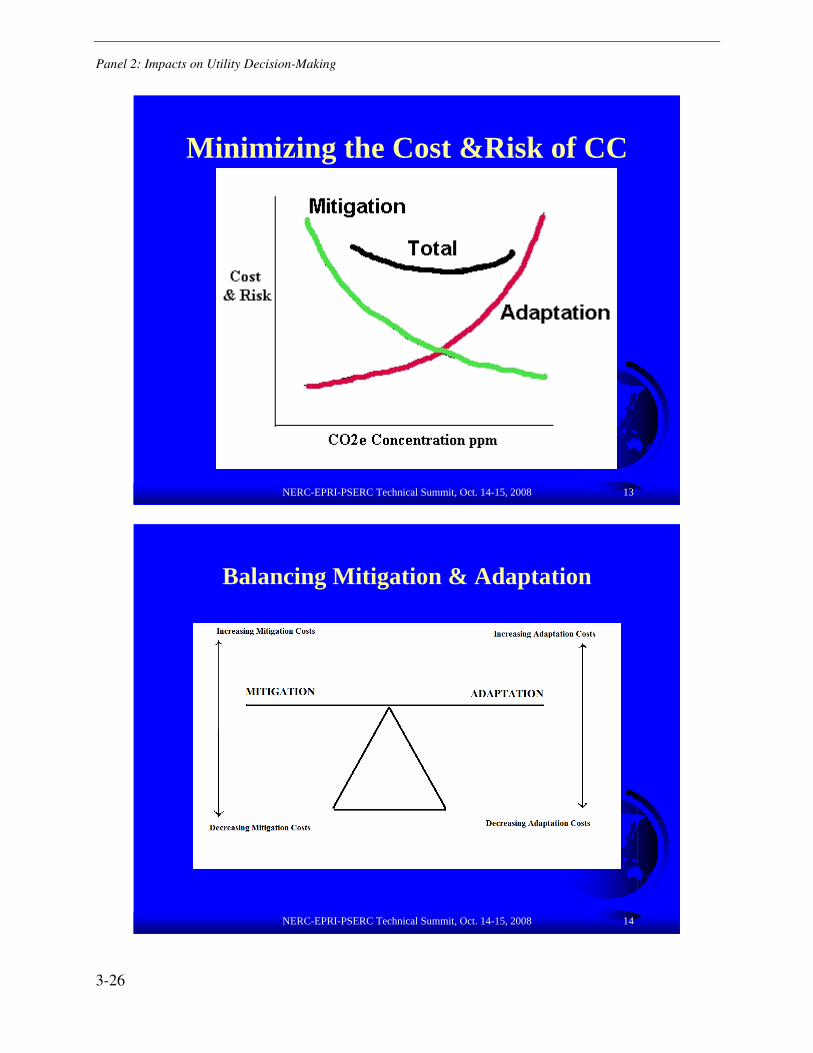
Panel 2: Impacts on Utility Decision-Making
3-26
NERC-EPRI-PSERC Technical Summit, Oct. 14-15, 2008
Minimizing the Cost &Risk of CC
13
Balancing Mitigation & Adaptation
NERC-EPRI-PSERC Technical Summit, Oct. 14-15, 2008 14
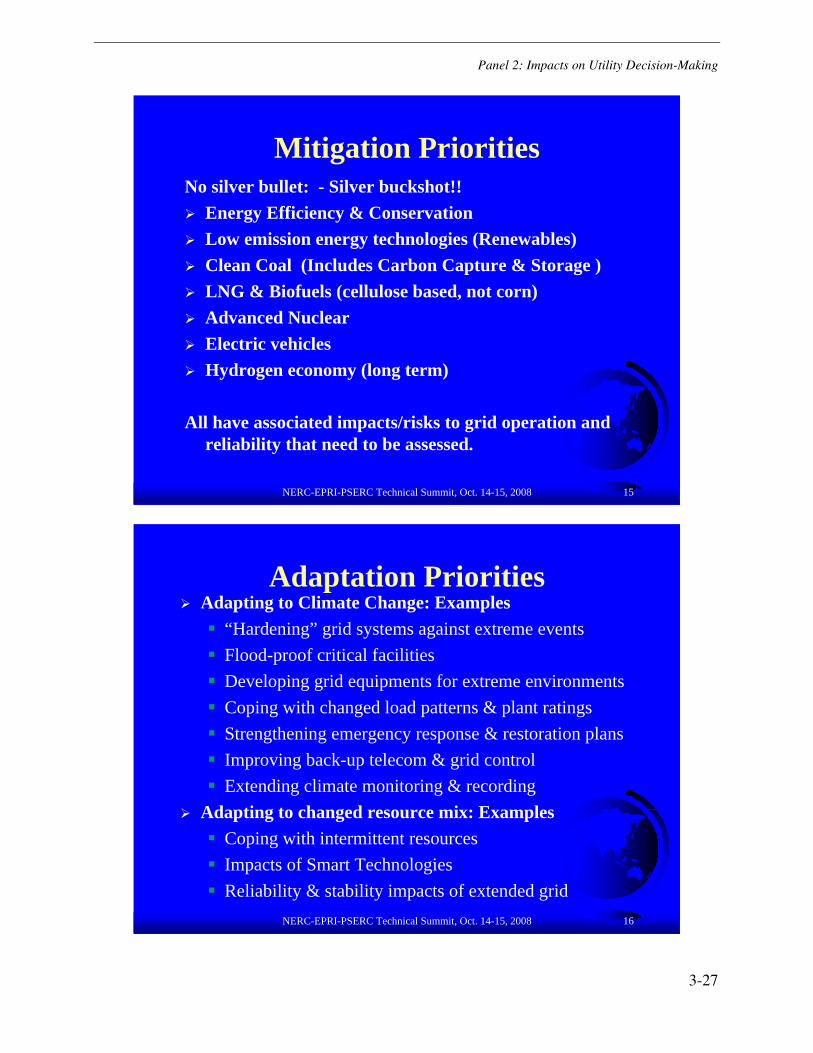
Panel 2: Impacts on Utility Decision-Making
3-27
NERC-EPRI-PSERC Technical Summit, Oct. 14-15, 2008
Mitigation PrioritiesNo silver bullet: - Silver buckshot!!
Energy Efficiency & ConservationLow emission energy technologies (Renewables)Clean Coal (Includes Carbon Capture & Storage )LNG & Biofuels (cellulose based, not corn) Advanced NuclearElectric vehiclesHydrogen economy (long term)
All have associated impacts/risks to grid operation and reliability that need to be assessed.
15
NERC-EPRI-PSERC Technical Summit, Oct. 14-15, 2008
Adaptation Priorities Adapting to Climate Change: Examples
“Hardening” grid systems against extreme eventsFlood-proof critical facilitiesDeveloping grid equipments for extreme environmentsCoping with changed load patterns & plant ratings Strengthening emergency response & restoration plansImproving back-up telecom & grid controlExtending climate monitoring & recording
Adapting to changed resource mix: ExamplesCoping with intermittent resourcesImpacts of Smart TechnologiesReliability & stability impacts of extended grid
16

Panel 2: Impacts on Utility Decision-Making
3-28
NERC-EPRI-PSERC Technical Summit, Oct. 14-15, 2008
Benefits for Power IndustryOpportunity to showcase technologies Access new markets / investment opportunitiesCommercialize climate-friendly technologiesDemonstrate environmental leadershipEmission reduction credits = revenue streamHelp meet global GHG reduction targetsReduce overall costs and risksIncreased capability to cope and adapt
17
NERC-EPRI-PSERC Technical Summit, Oct. 14-15, 2008
Conclusions IGrowing evidence of CC and other risks to the grid Need action now to Mitigate and Adapt to reduce grid reliability risks – doing nothing is not an optionAction must be global, prompt & strong*Power industry is major part of the problem and must be part of solution and show leadershipMuch has been done - global, national, state programsUrgency to do much more to reduce costs/risks and increase capacity to adapt Power industry partners and governments must work together to minimize risks & costs
*See Stern Report at: www.hm_treasury.gov.uk/stern_review_climate_change.htm
18
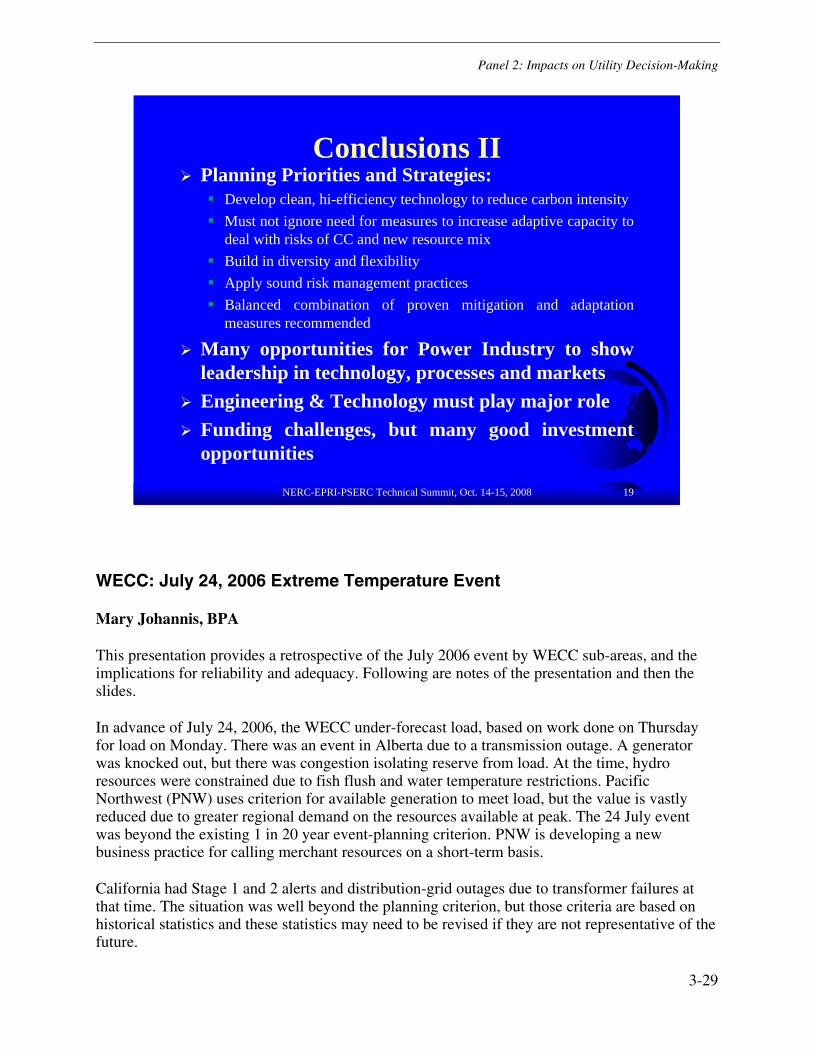
Panel 2: Impacts on Utility Decision-Making
3-29
NERC-EPRI-PSERC Technical Summit, Oct. 14-15, 2008
Conclusions IIPlanning Priorities and Strategies:
Develop clean, hi-efficiency technology to reduce carbon intensityMust not ignore need for measures to increase adaptive capacity to deal with risks of CC and new resource mixBuild in diversity and flexibilityApply sound risk management practicesBalanced combination of proven mitigation and adaptation measures recommended
Many opportunities for Power Industry to show leadership in technology, processes and marketsEngineering & Technology must play major role Funding challenges, but many good investment opportunities
19
WECC: July 24, 2006 Extreme Temperature Event
Mary Johannis, BPA
This presentation provides a retrospective of the July 2006 event by WECC sub-areas, and the implications for reliability and adequacy. Following are notes of the presentation and then the slides.
In advance of July 24, 2006, the WECC under-forecast load, based on work done on Thursday for load on Monday. There was an event in Alberta due to a transmission outage. A generator was knocked out, but there was congestion isolating reserve from load. At the time, hydro resources were constrained due to fish flush and water temperature restrictions. Pacific Northwest (PNW) uses criterion for available generation to meet load, but the value is vastly reduced due to greater regional demand on the resources available at peak. The 24 July event was beyond the existing 1 in 20 year event-planning criterion. PNW is developing a new business practice for calling merchant resources on a short-term basis.
California had Stage 1 and 2 alerts and distribution-grid outages due to transformer failures at that time. The situation was well beyond the planning criterion, but those criteria are based on historical statistics and these statistics may need to be revised if they are not representative of the future.
Panel 2: Impacts on Utility Decision-Making
3-30
Criteria for planning are more stringent in local California areas, rather than statewide planning criteria, which are remaining unchanged.
Demand response was useful in this period. In many areas, DR is dispatched after Stage 2 or 3.
WECC: July 24, 2006Extreme Temperature Event:
Potential Implications for Reliability & Adequacy
Mary JohannisBonneville Power Administration
October 14, 2008
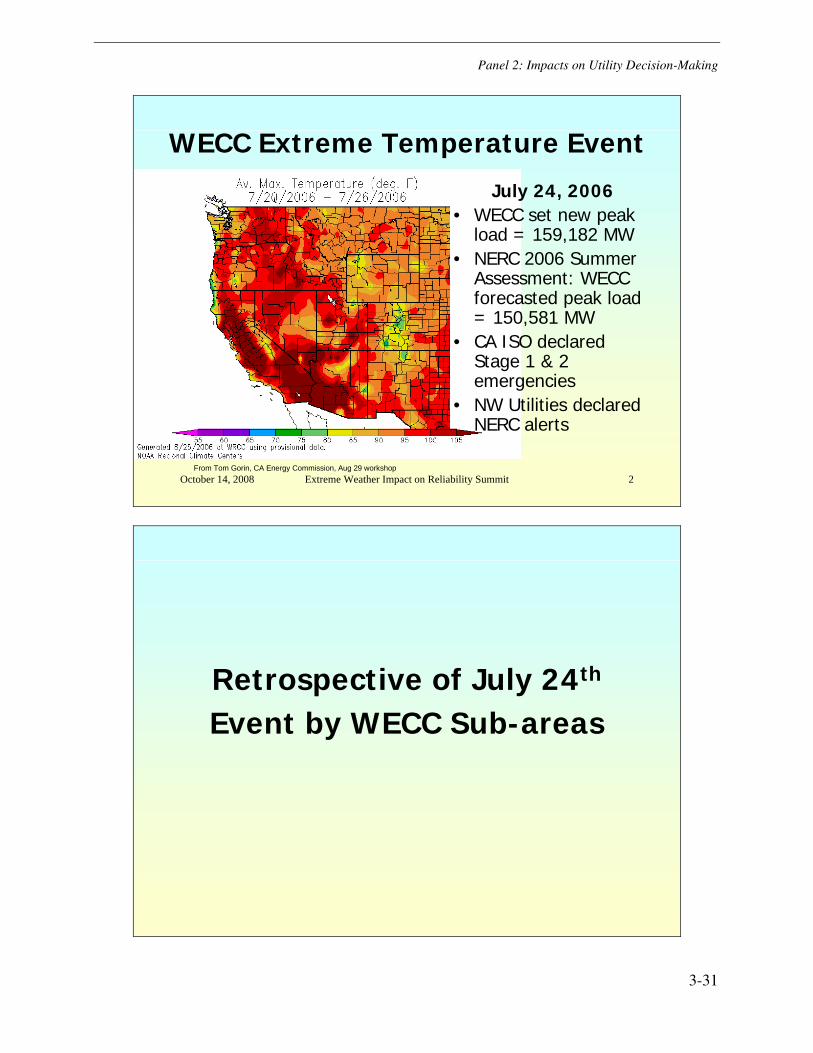
Panel 2: Impacts on Utility Decision-Making
3-31
October 14, 2008 Extreme Weather Impact on Reliability Summit 2
WECC Extreme Temperature Event
From Tom Gorin, CA Energy Commission, Aug 29 workshop
July 24, 2006• WECC set new peak
load = 159,182 MW• NERC 2006 Summer
Assessment: WECC forecasted peak load = 150,581 MW
• CA ISO declared Stage 1 & 2 emergencies
• NW Utilities declared NERC alerts
Retrospective of July 24th
Event by WECC Sub-areas
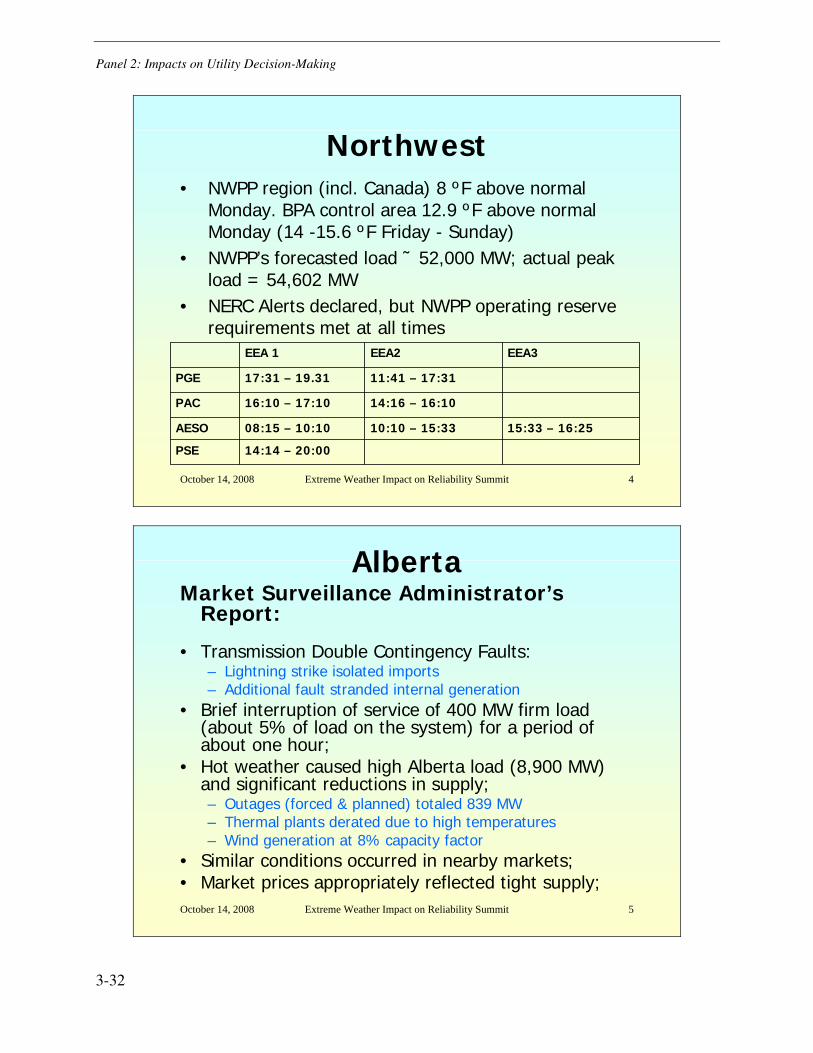
Panel 2: Impacts on Utility Decision-Making
3-32
October 14, 2008 Extreme Weather Impact on Reliability Summit 4
Northwest• NWPP region (incl. Canada) 8 ºF above normal
Monday. BPA control area 12.9 ºF above normal Monday (14 -15.6 ºF Friday - Sunday)
• NWPP’s forecasted load ˜ 52,000 MW; actual peak load = 54,602 MW
• NERC Alerts declared, but NWPP operating reserve requirements met at all times
14:14 – 20:00PSE
15:33 – 16:2510:10 – 15:3308:15 – 10:10AESO
14:16 – 16:1016:10 – 17:10PAC
11:41 – 17:3117:31 – 19.31PGE
EEA3EEA2EEA 1
October 14, 2008 Extreme Weather Impact on Reliability Summit 5
AlbertaMarket Surveillance Administrator’s
Report:
• Transmission Double Contingency Faults:– Lightning strike isolated imports– Additional fault stranded internal generation
• Brief interruption of service of 400 MW firm load (about 5% of load on the system) for a period of about one hour;
• Hot weather caused high Alberta load (8,900 MW) and significant reductions in supply;– Outages (forced & planned) totaled 839 MW– Thermal plants derated due to high temperatures– Wind generation at 8% capacity factor
• Similar conditions occurred in nearby markets;• Market prices appropriately reflected tight supply;
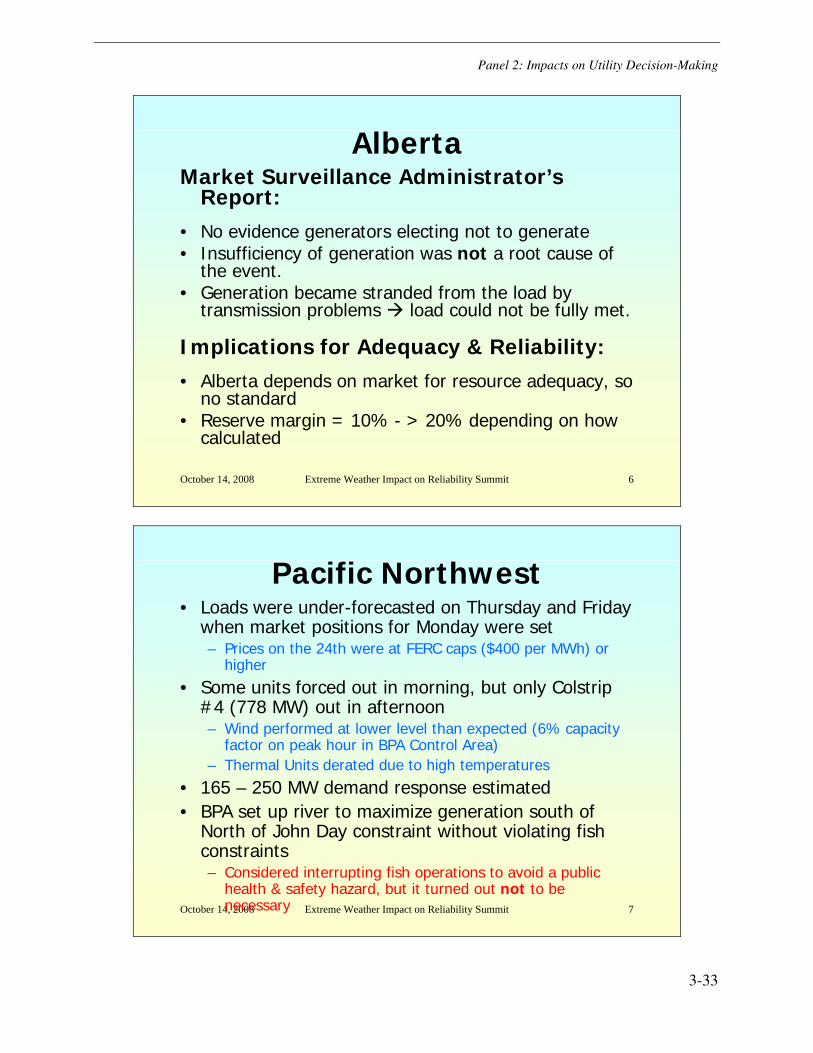
Panel 2: Impacts on Utility Decision-Making
3-33
October 14, 2008 Extreme Weather Impact on Reliability Summit 6
AlbertaMarket Surveillance Administrator’s
Report:• No evidence generators electing not to generate• Insufficiency of generation was not a root cause of
the event.• Generation became stranded from the load by
transmission problems load could not be fully met.
Implications for Adequacy & Reliability:• Alberta depends on market for resource adequacy, so
no standard• Reserve margin = 10% - > 20% depending on how
calculated
October 14, 2008 Extreme Weather Impact on Reliability Summit 7
Pacific Northwest• Loads were under-forecasted on Thursday and Friday
when market positions for Monday were set– Prices on the 24th were at FERC caps ($400 per MWh) or
higher• Some units forced out in morning, but only Colstrip
#4 (778 MW) out in afternoon– Wind performed at lower level than expected (6% capacity
factor on peak hour in BPA Control Area)– Thermal Units derated due to high temperatures
• 165 – 250 MW demand response estimated• BPA set up river to maximize generation south of
North of John Day constraint without violating fish constraints – Considered interrupting fish operations to avoid a public
health & safety hazard, but it turned out not to be necessary
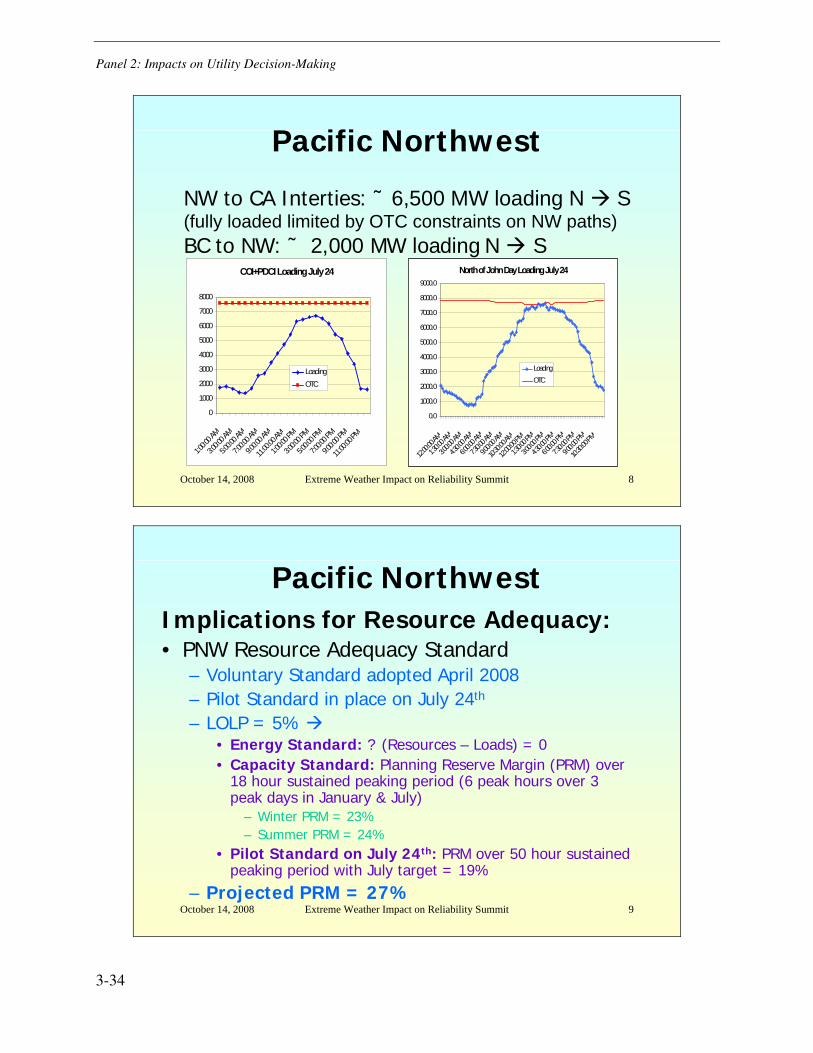
Panel 2: Impacts on Utility Decision-Making
3-34
October 14, 2008 Extreme Weather Impact on Reliability Summit 8
Pacific Northwest
COI+PDCI Loading July 24
0
1000
2000
3000
4000
5000
6000
7000
8000
1:00:0
0 AM
3:00:0
0 AM
5:00:0
0 AM
7:00:0
0 AM
9:00:0
0 AM
11:00:
00 AM
1:00:0
0 PM
3:00:0
0 PM
5:00:0
0 PM
7:00:0
0 PM
9:00:0
0 PM
11:00:
00 PM
LoadingOTC
North of John Day Loading July 24
0.0
1000.0
2000.0
3000.0
4000.0
5000.0
6000.0
7000.0
8000.0
9000.0
12:00:
00 AM
1:30:0
0 AM
3:00:0
0 AM
4:30:0
0 AM
6:00:0
0 AM
7:30:0
0 AM
9:00:0
0 AM
10:30:
00 AM
12:00:
00 PM
1:30:0
0 PM
3:00:0
0 PM
4:30:0
0 PM
6:00:0
0 PM
7:30:0
0 PM
9:00:0
0 PM
10:30:
00 PM
LoadingOTC
NW to CA Interties: ˜ 6,500 MW loading N S (fully loaded limited by OTC constraints on NW paths)BC to NW: ˜ 2,000 MW loading N S
October 14, 2008 Extreme Weather Impact on Reliability Summit 9
Pacific NorthwestImplications for Resource Adequacy:• PNW Resource Adequacy Standard
– Voluntary Standard adopted April 2008– Pilot Standard in place on July 24th
– LOLP = 5% • Energy Standard: ? (Resources – Loads) = 0• Capacity Standard: Planning Reserve Margin (PRM) over
18 hour sustained peaking period (6 peak hours over 3 peak days in January & July)
– Winter PRM = 23%– Summer PRM = 24%
• Pilot Standard on July 24th: PRM over 50 hour sustained peaking period with July target = 19%
– Projected PRM = 27%
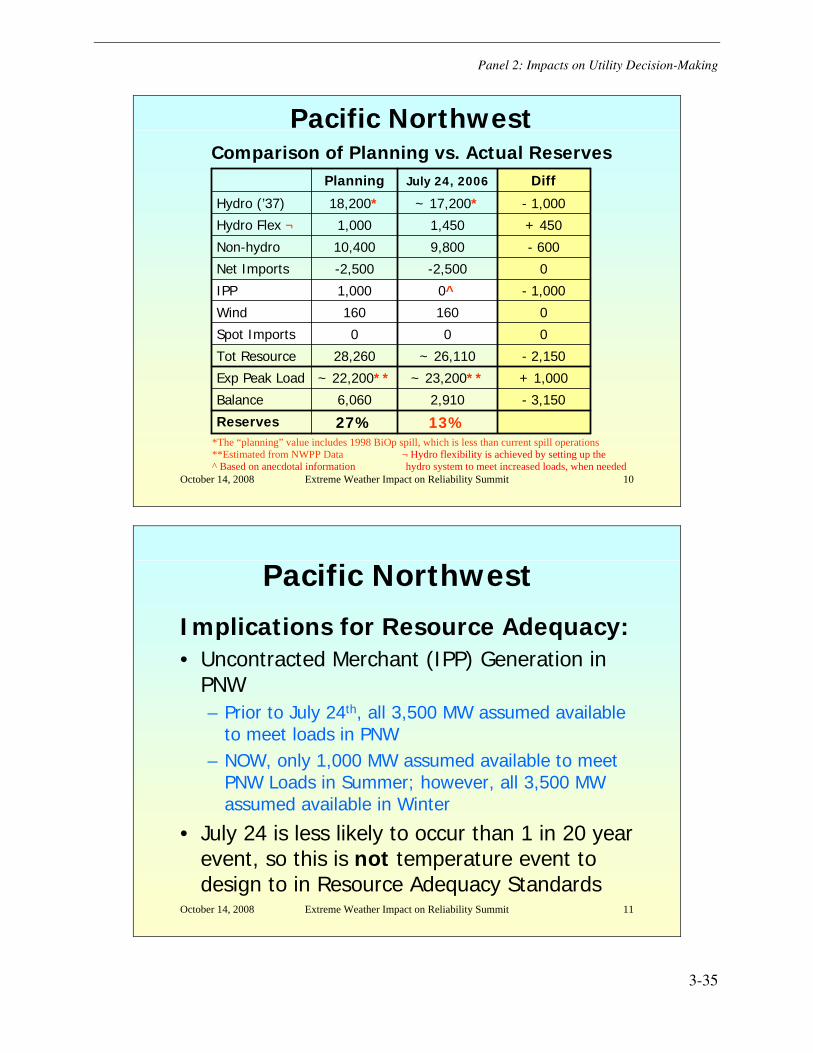
Panel 2: Impacts on Utility Decision-Making
3-35
October 14, 2008 Extreme Weather Impact on Reliability Summit 10
Pacific NorthwestComparison of Planning vs. Actual Reserves
13%2,910
~ 23,200**
~ 26,110
0
160
0^
-2,500
9,800
1,450
~ 17,200*
July 24, 2006
- 3,150
+ 1,000
- 2,150
0
0
- 1,000
0
- 600
+ 450
- 1,000
Diff
27%6,060
~ 22,200**
28,260
0
160
1,000
-2,500
10,400
1,000
18,200*
Planning
Hydro Flex ¬
IPP
Wind
Exp Peak Load
Reserves
Balance
Tot Resource
Spot Imports
Net Imports
Non-hydro
Hydro (’37)
*The “planning” value includes 1998 BiOp spill, which is less than current spill operations**Estimated from NWPP Data ¬ Hydro flexibility is achieved by setting up the^ Based on anecdotal information hydro system to meet increased loads, when needed
October 14, 2008 Extreme Weather Impact on Reliability Summit 11
Pacific Northwest
Implications for Resource Adequacy:• Uncontracted Merchant (IPP) Generation in
PNW– Prior to July 24th, all 3,500 MW assumed available
to meet loads in PNW– NOW, only 1,000 MW assumed available to meet
PNW Loads in Summer; however, all 3,500 MW assumed available in Winter
• July 24 is less likely to occur than 1 in 20 year event, so this is not temperature event to design to in Resource Adequacy Standards
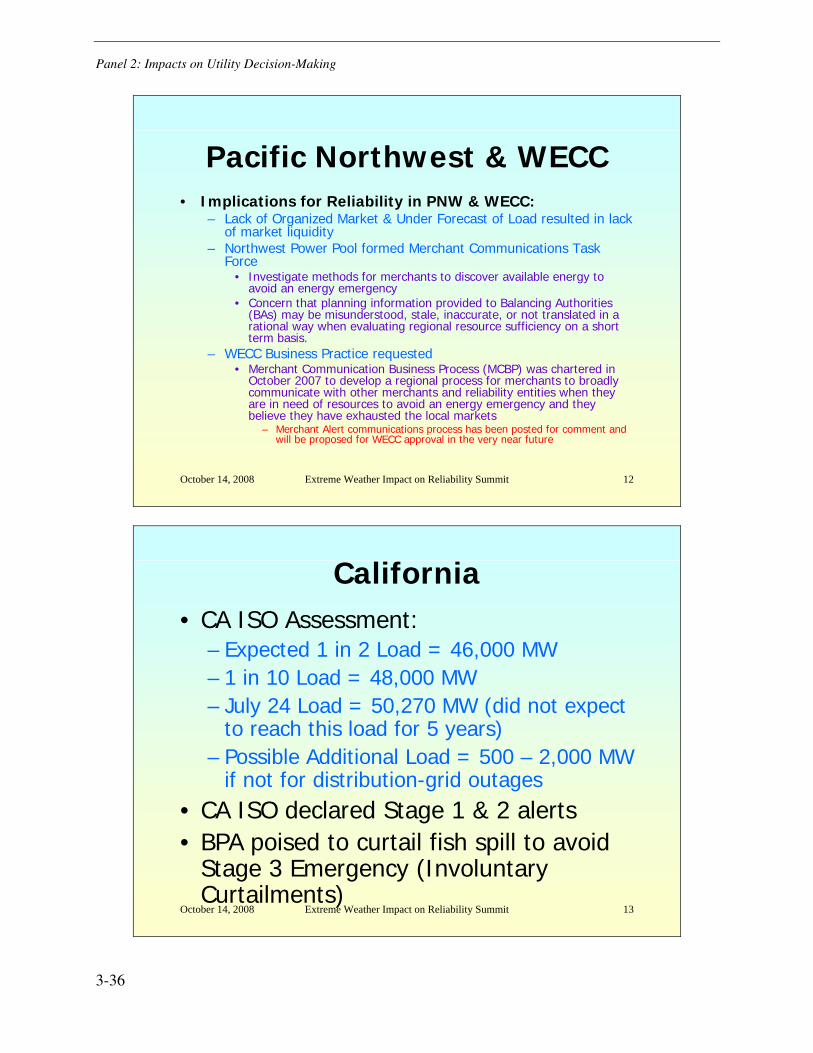
Panel 2: Impacts on Utility Decision-Making
3-36
October 14, 2008 Extreme Weather Impact on Reliability Summit 12
Pacific Northwest & WECC• Implications for Reliability in PNW & WECC:
– Lack of Organized Market & Under Forecast of Load resulted in lack of market liquidity
– Northwest Power Pool formed Merchant Communications Task Force
• Investigate methods for merchants to discover available energy to avoid an energy emergency
• Concern that planning information provided to Balancing Authorities (BAs) may be misunderstood, stale, inaccurate, or not translated in a rational way when evaluating regional resource sufficiency on a short term basis.
– WECC Business Practice requested• Merchant Communication Business Process (MCBP) was chartered in
October 2007 to develop a regional process for merchants to broadly communicate with other merchants and reliability entities when they are in need of resources to avoid an energy emergency and they believe they have exhausted the local markets
– Merchant Alert communications process has been posted for comment and will be proposed for WECC approval in the very near future
October 14, 2008 Extreme Weather Impact on Reliability Summit 13
California• CA ISO Assessment:
– Expected 1 in 2 Load = 46,000 MW– 1 in 10 Load = 48,000 MW– July 24 Load = 50,270 MW (did not expect
to reach this load for 5 years)– Possible Additional Load = 500 – 2,000 MW
if not for distribution-grid outages• CA ISO declared Stage 1 & 2 alerts• BPA poised to curtail fish spill to avoid
Stage 3 Emergency (Involuntary Curtailments)
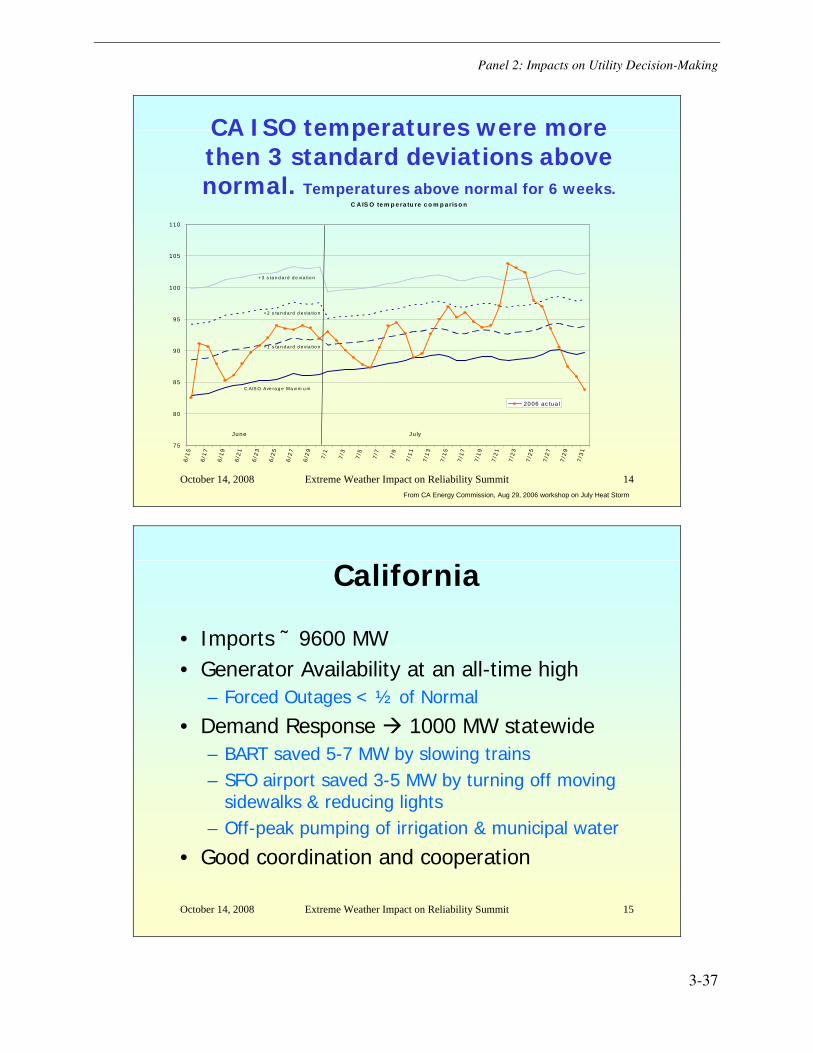
Panel 2: Impacts on Utility Decision-Making
3-37
October 14, 2008 Extreme Weather Impact on Reliability Summit 14
CA ISO temperatures were more then 3 standard deviations above normal. Temperatures above normal for 6 weeks.
C A IS O te m p e ra tu re c o m p a ris o n
75
80
85
90
95
100
105
110
6/15
6/17
6 /19
6/21
6/2
3
6 /2
5
6 /2
7
6/2
9
7/1
7/ 3
7/5
7/ 7
7/9
7/11
7/13
7 /15
7/17
7 /19
7/21
7/23
7/2
5
7 /2
7
7/2
9
7 /3
1
20 06 ac tua l
C AIS O Ave ra g e Ma xim u m
+ 1 s ta n d a rd d e via tio n
+ 2 s ta n d a rd d e via tio n
+ 3 s ta n d a rd d e via tio n
June Ju ly
From CA Energy Commission, Aug 29, 2006 workshop on July Heat Storm
October 14, 2008 Extreme Weather Impact on Reliability Summit 15
California
• Imports ˜ 9600 MW• Generator Availability at an all-time high
– Forced Outages < ½ of Normal
• Demand Response 1000 MW statewide– BART saved 5-7 MW by slowing trains– SFO airport saved 3-5 MW by turning off moving
sidewalks & reducing lights – Off-peak pumping of irrigation & municipal water
• Good coordination and cooperation
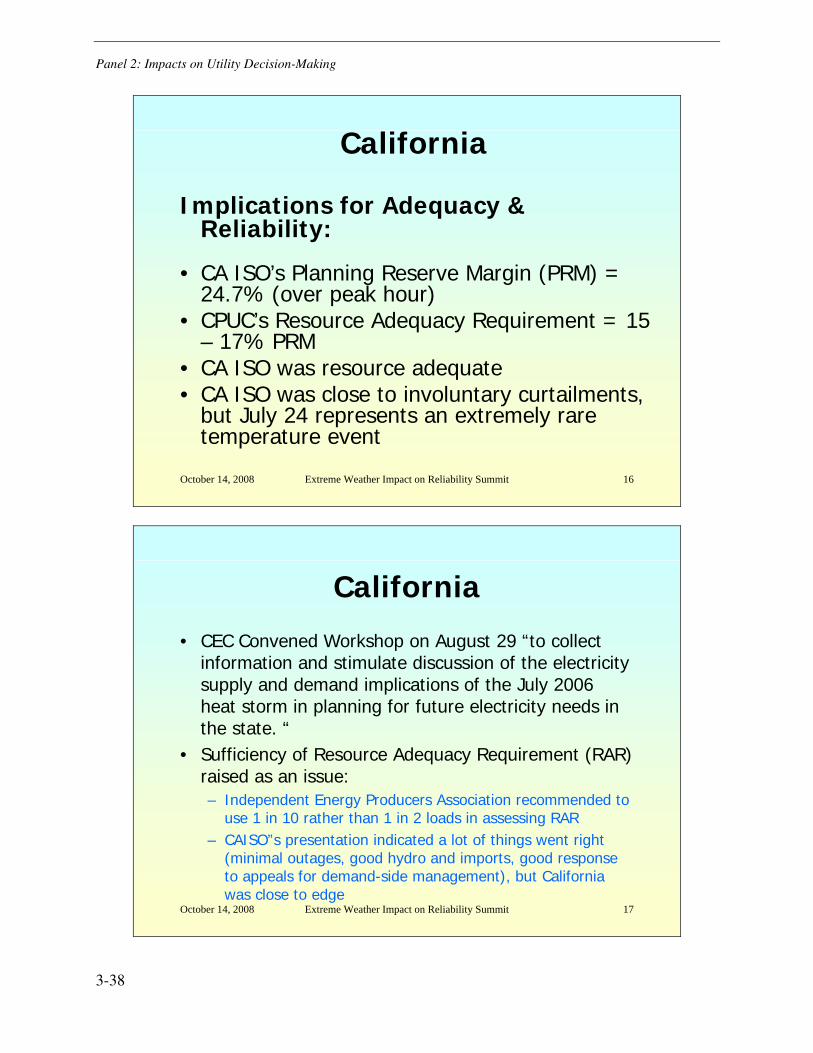
Panel 2: Impacts on Utility Decision-Making
3-38
October 14, 2008 Extreme Weather Impact on Reliability Summit 16
California
Implications for Adequacy & Reliability:
• CA ISO’s Planning Reserve Margin (PRM) = 24.7% (over peak hour)
• CPUC’s Resource Adequacy Requirement = 15 – 17% PRM
• CA ISO was resource adequate• CA ISO was close to involuntary curtailments,
but July 24 represents an extremely rare temperature event
October 14, 2008 Extreme Weather Impact on Reliability Summit 17
California
• CEC Convened Workshop on August 29 “to collect information and stimulate discussion of the electricity supply and demand implications of the July 2006 heat storm in planning for future electricity needs in the state. “
• Sufficiency of Resource Adequacy Requirement (RAR) raised as an issue:– Independent Energy Producers Association recommended to
use 1 in 10 rather than 1 in 2 loads in assessing RAR– CAISO”s presentation indicated a lot of things went right
(minimal outages, good hydro and imports, good response to appeals for demand-side management), but California was close to edge
Panel 2: Impacts on Utility Decision-Making
3-39
Forecasting Hurricane Impacts on Critical Infrastructure
Silvio Flaim, Los Alamos National Laboratory
This presentation describes a study of the US Gulf Coast and the potential impact that severe hurricanes will have on critical infrastructure. Following are short notes along with the slides.
This work is being done for the U.S. Department of Energy (DOE), Department of Defense (DoD), and Department of Homeland Security (DHS). Models have detail to substation level and representations of transportation. The model incorporates damage to equipment and cascading effects. It is used to generate scenarios and estimate recovery processes.
Economic impacts can be estimated through sensitivity analysis of damage estimates. Predictions in advance of oncoming storms can be used to preposition response. Storms include hurricanes and ice storms.
Interested parties should consider the Homeland Infrastructure Foundation-Level Data (HIFLD) Working Group for access to models on interruptions [14].
Forecasting Hurricane Impacts on
Critical Infrastructures
B. W. Bush
Presentation to the NOAA SAB HIRWG
1 March 2006
Energy & Infrastructure Analysis Group
Los Alamos National Laboratory
Research Applications Laboratory and
Computational & Information Systems Laboratory
National Center for Atmospheric Research

Panel 2: Impacts on Utility Decision-Making
3-40
Acknowledgements & Thanks
• Collaborators
– National Center for Atmospheric Research (NCAR)
Jennifer Boehnert
Chris Davis
Greg Holland
Joe Klemp
Yubao Liu
Bill Mahoney
Rich Wagoner
Wei Wang
. . .
– Los Alamos National Laboratory (LANL)
Steve Fernandez
Austin Ivey
Fred Roach
Loren Toole
. . .
• Sponsors
Critical Infrastructure Projects & Technologies
SP
ON
SO
RS
PR
OJE
CT
ST
EC
HN
OLO
GIE
S
IEIS
S
UP
MoS
T
AdH
opN
et
EpiS
imS
WIS
E
CO
LLA
BO
RA
TO
RS
TR
AN
SIM
S
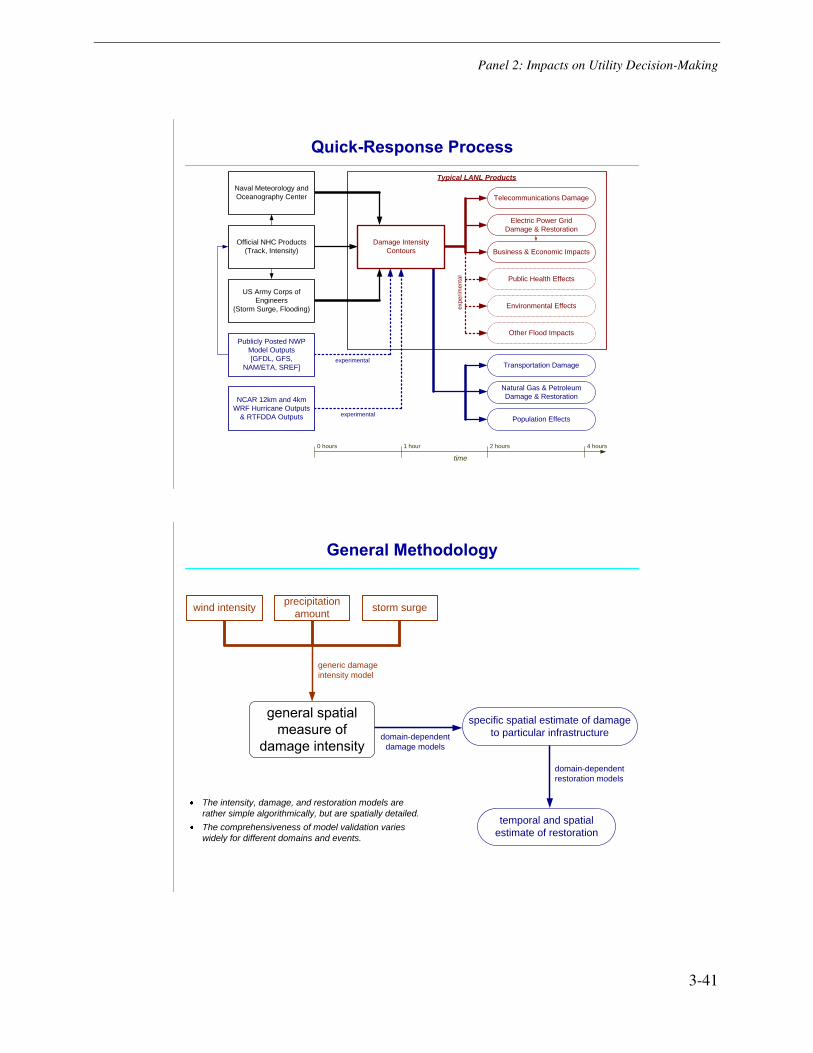
Panel 2: Impacts on Utility Decision-Making
3-41
Quick-Response Process
Typical LANL Products
experimental
experimental
exp
eri
men
tal
time
0 hours 1 hour 4 hours2 hours
Naval Meteorology and
Oceanography Center
Official NHC Products
(Track, Intensity)
NCAR 12km and 4km
WRF Hurricane Outputs
& RTFDDA Outputs
Damage Intensity
Contours
Electric Power Grid
Damage & Restoration
Telecommunications Damage
Business & Economic Impacts
Publicly Posted NWP
Model Outputs
[GFDL, GFS,
NAM/ETA, SREF]
US Army Corps of
Engineers
(Storm Surge, Flooding)
Population Effects
Natural Gas & Petroleum
Damage & Restoration
Transportation Damage
Public Health Effects
Environmental Effects
Other Flood Impacts
General Methodology
generic damage
intensity model
domain-dependent
damage models
domain-dependent
restoration models
wind intensityprecipitation
amountstorm surge
specific spatial estimate of damage
to particular infrastructure
temporal and spatial
estimate of restoration
The intensity, damage, and restoration models are
rather simple algorithmically, but are spatially detailed.
The comprehensiveness of model validation varies
widely for different domains and events.

Panel 2: Impacts on Utility Decision-Making
3-42
Geographic Information Engineering
form
at
convers
ion
Infrastructure Data Sets
Energy networks
Transportation networks
Emergency management facilities
Public health facilities
Demographics (daytime/nighttime)
Business locations and activity
Geographic Coverage
Full CONUS coverage is regularly
maintained.
Limited specialized (e.g., OCONUS)
coverage exists, but most is out-of-
date unless it is from a recent analysis.
GRIB
netCDF
imagery
raster
vector
ESRI-
Compatible
Formatson internal servers
(shape, raster,
and grid files)
relational
Infrastructure Analysis Software
(Java, C++, Visual Basic)
Analysis Productson collaborative web sites
(Documents, Presentations, Video)
Geoanalysis Software
(ArcInfo, ArcMap, MapInfo, custom)
Typical Applications
• Situational awareness
• Contingency planning
• Independent assessment & verification
• Event reconstruction
• Consequence assessment
• Recovery & restoration operations
• Security & reliability improvement
• Deployment of protective forces

Panel 2: Impacts on Utility Decision-Making
3-43
2 days 4 days 7 days
28 days21 days14 days
45 days 60 days
Typical Products for Katrina (2005)
Electric Power Damage Telecommunications Damage
Electric Power
RestorationFlood Depth
Electric Power Restoration Comparison to Actual Restoration
Entergy Inc. supplied data
at 7 days prior to LANL-predicted restoration
PRELIMINARY RESULTS:
Do Not Cite
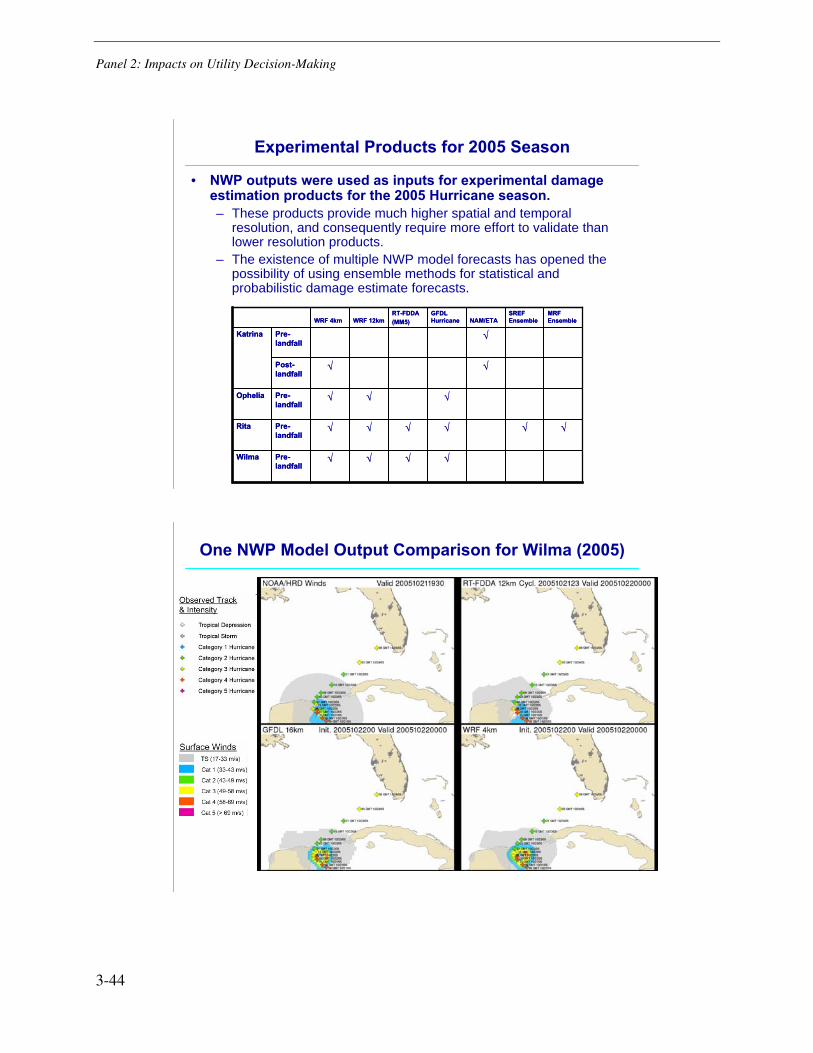
Panel 2: Impacts on Utility Decision-Making
3-44
Experimental Products for 2005 Season
• NWP outputs were used as inputs for experimental damage estimation products for the 2005 Hurricane season.
– These products provide much higher spatial and temporal resolution, and consequently require more effort to validate than lower resolution products.
– The existence of multiple NWP model forecasts has opened the possibility of using ensemble methods for statistical and probabilistic damage estimate forecasts.
Pre-
landfall
Rita
Pre-
landfall
Wilma
Pre-
landfall
Ophelia
Post-
landfall
Pre-
landfall
Katrina
MRF
Ensemble
SREF
EnsembleNAM/ETA
GFDL
Hurricane
RT-FDDA
(MM5)WRF 12kmWRF 4km
Pre-
landfall
Rita
Pre-
landfall
Wilma
Pre-
landfall
Ophelia
Post-
landfall
Pre-
landfall
Katrina
MRF
Ensemble
SREF
EnsembleNAM/ETA
GFDL
Hurricane
RT-FDDA
(MM5)WRF 12kmWRF 4km
One NWP Model Output Comparison for Wilma (2005)
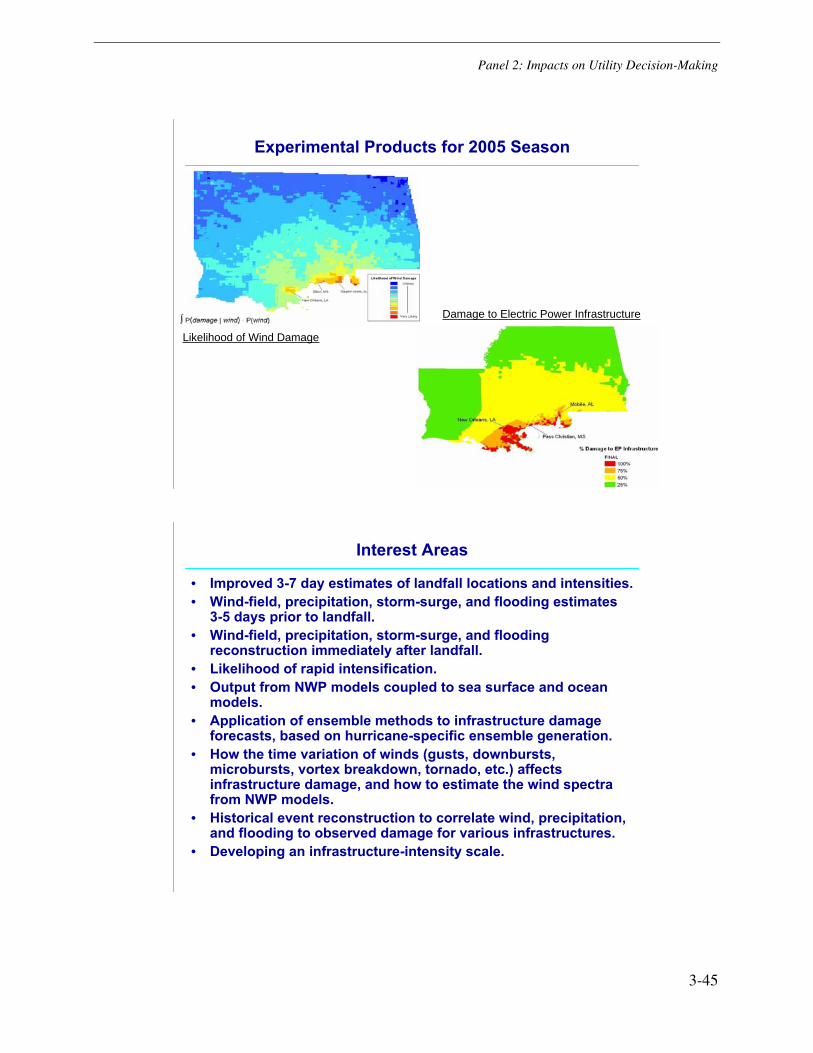
Panel 2: Impacts on Utility Decision-Making
3-45
Experimental Products for 2005 Season
Likelihood of Wind Damage
Damage to Electric Power Infrastructure
Interest Areas
• Improved 3-7 day estimates of landfall locations and intensities.
• Wind-field, precipitation, storm-surge, and flooding estimates 3-5 days prior to landfall.
• Wind-field, precipitation, storm-surge, and flooding reconstruction immediately after landfall.
• Likelihood of rapid intensification.
• Output from NWP models coupled to sea surface and ocean models.
• Application of ensemble methods to infrastructure damage forecasts, based on hurricane-specific ensemble generation.
• How the time variation of winds (gusts, downbursts, microbursts, vortex breakdown, tornado, etc.) affects infrastructure damage, and how to estimate the wind spectra from NWP models.
• Historical event reconstruction to correlate wind, precipitation, and flooding to observed damage for various infrastructures.
• Developing an infrastructure-intensity scale.
Panel 2: Impacts on Utility Decision-Making
3-46
Challenges
• The damage heuristic models were created to work with the
coarse wind and precipitation forecasts published by the
National Hurricane Center (NHC).
– These impact forecasting models need to reworked and recalibrated
to handle the higher resolution forecasts from NWP models. This
requires significant research and field data.
• How can we effectively use the ad hoc ensemble consisting of
GFDL, WRF/ARW, RT-FDDA(MM5), etc.?
– What statistical framework is best suited for this synthesis?
– What are the most effective ways of communicating and visualizing
infrastructure impact forecasts based on multiple NWP models?
• How can we best disseminate infrastructure impact forecasts?
– Official channels are reluctant to disseminate impact forecasts
based on non-NHC-sanctioned outputs such as raw NWP output.
– Numerous stakeholders have requested access to the NWP-based
damage forecasts, despite their experimental nature.

4-1
4 PANEL 3: STRATEGIC RESPONSE
Two potential areas of advance response to prepare for impacts to the electric power system from changes in the climate are to 1) fortify the system and 2) plan to maintain the system once it is damaged. System fortification involves an evolving basis for system design, wherein utilities define the acceptable equipment to use in each area of their system. Utilities generally already have much experience with extreme weather; what is expected is that individual utilities may more likely see events outside of their historic practice, necessitating a reassessment of the design basis criteria. Equipment may be designed to be more flexible and multi-purposed.
Planned maintenance involves keeping track of spare parts inventory and having prepared-in- advance recovery plans. Changes may be made to maintenance scheduling, due to reduced equipment cooling at night from higher overnight temperatures. An advanced approach is to design and build systems to be self-healing under harsh conditions.
The presentations in this chapter are:
• Extreme Weather Impacts on Reliability: Joint Coordinated System Planning Study Implications – John Lawhorn, MISO
• Strategic Response – William Bojorquez, Chair RAS
• Climate Change and the Baseline Planning Initiative of Hydro Quebec – Yves Nadeau, Hydro Quebec Distribution
• Effects of Climate Change on California’s Energy Security – Silvio J. Flaim, LANL
Extreme Weather Impacts on Reliability: Joint Coordinated System Planning Study Implications
John Lawhorn, Midwest Independent System Operator
This presentation describes the Joint Coordinated System Planning (JCSP08), which is an ongoing project [16]. Following are notes of the presentation and then the slides.
Formally initiated on November 1, 2007, the Joint Coordinated System Planning (JCSP08) study began as collaboration between the Midwest ISO, Pennsylvania, New Jersey, Maryland Interconnection (PJM), Southwest Power Pool (SPP) and the Tennessee Valley Authority (TVA) to meet the requirements of the Joint Operating Agreements each organization has with the Midwest ISO. Subsequent to the initial four parties the ISO New England, New York ISO and the MAPP all joined the study as formal participants.
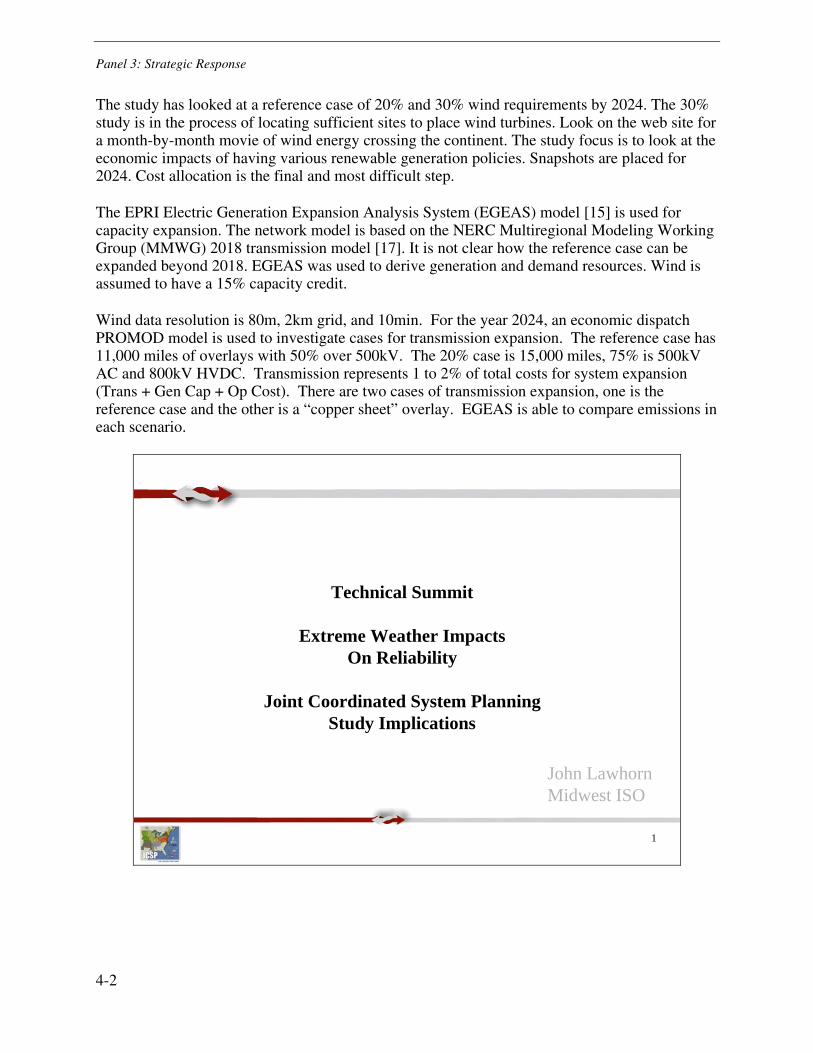
Panel 3: Strategic Response
4-2
The study has looked at a reference case of 20% and 30% wind requirements by 2024. The 30% study is in the process of locating sufficient sites to place wind turbines. Look on the web site for a month-by-month movie of wind energy crossing the continent. The study focus is to look at the economic impacts of having various renewable generation policies. Snapshots are placed for 2024. Cost allocation is the final and most difficult step.
The EPRI Electric Generation Expansion Analysis System (EGEAS) model [15] is used for capacity expansion. The network model is based on the NERC Multiregional Modeling Working Group (MMWG) 2018 transmission model [17]. It is not clear how the reference case can be expanded beyond 2018. EGEAS was used to derive generation and demand resources. Wind is assumed to have a 15% capacity credit.
Wind data resolution is 80m, 2km grid, and 10min. For the year 2024, an economic dispatch PROMOD model is used to investigate cases for transmission expansion. The reference case has 11,000 miles of overlays with 50% over 500kV. The 20% case is 15,000 miles, 75% is 500kV AC and 800kV HVDC. Transmission represents 1 to 2% of total costs for system expansion (Trans + Gen Cap + Op Cost). There are two cases of transmission expansion, one is the reference case and the other is a “copper sheet” overlay. EGEAS is able to compare emissions in each scenario.
1
Technical Summit
Extreme Weather ImpactsOn Reliability
Joint Coordinated System PlanningStudy Implications
John LawhornMidwest ISO

Panel 3: Strategic Response
4-3
2
JCSP Economic Planning Process
Step 1 – Multi-Future Regional Resource Forecasting
(Nov 07’ – Jan 08’)
Step 4 – Test Transmission Plans for Robustness
(July 08’ – Dec 08’)
Step 7 - Cost Allocation Analysis
(Sept - Oct 09)
Step 3 – Design Prelim. Trans. Plans for each Future(March 08’ – June08’)
Step 2 – Site Generation and Place in Powerflow Model
(Jan 08’ - Feb 08’)
Step 5 –Consolidate Transmission Plans(July 08’ – Dec 08’)
Step 6 – Perform Reliability Assessment / Final Design
(Jan 09’ – Aug 09’)
Next JCSPTracking and Carry Forward
3
Define the PROBLEM - Future Scenarios
Reference Future• Models the Status Quo. This future models the power
system as it exists today with reference values and trends based on recent historical data while preserving existing standards for resource adequacy, existing renewable mandates and environmental legislation.
20% Wind Mandate Future• Requires 20% of the energy consumption come from wind by
2024. Regional Capacity Factors of new units applied toward mandate, and 15% of Maximum Capacity counted toward Reserve Margin Calculations. Existing Wind mandates accounted for in Reference Future are applied to all futures.
30% Wind Mandate Future• Requires 30% of the energy consumption come from wind by
2024. Same additional conditions as listed in 20% case above.
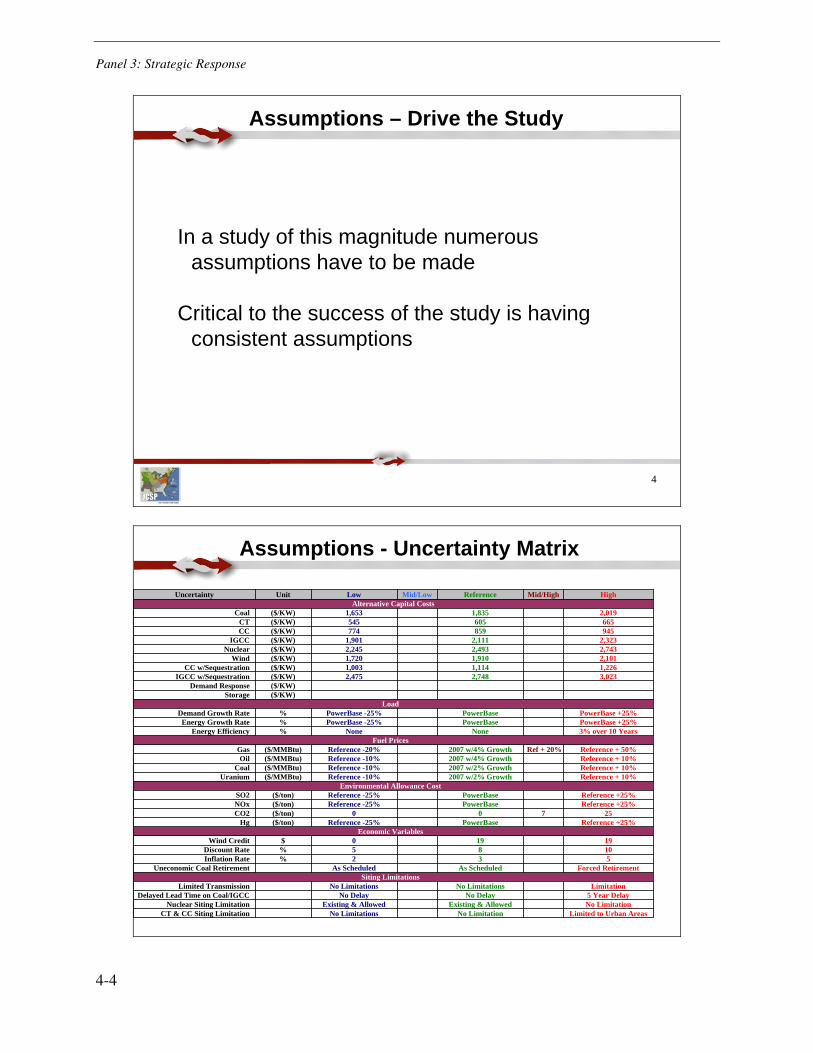
Panel 3: Strategic Response
4-4
4
Assumptions – Drive the Study
In a study of this magnitude numerous assumptions have to be made
Critical to the success of the study is having consistent assumptions
5
Assumptions - Uncertainty Matrix
Limited to Urban AreasNo LimitationNo LimitationsCT & CC Siting LimitationNo LimitationExisting & Allowed Existing & Allowed Nuclear Siting Limitation5 Year DelayNo DelayNo DelayDelayed Lead Time on Coal/IGCC
LimitationNo LimitationsNo LimitationsLimited TransmissionSiting Limitations
Forced RetirementAs ScheduledAs ScheduledUneconomic Coal Retirement532%Inflation Rate
1085%Discount Rate19190$Wind Credit
Economic VariablesReference +25%PowerBaseReference -25%($/ton)Hg
25700($/ton)CO2Reference +25%PowerBaseReference -25%($/ton)NOx Reference +25%PowerBaseReference -25%($/ton)SO2
Environmental Allowance CostReference + 10%2007 w/2% GrowthReference -10%($/MMBtu)UraniumReference + 10%2007 w/2% GrowthReference -10%($/MMBtu)CoalReference + 10%2007 w/4% GrowthReference -10%($/MMBtu)OilReference + 50%Ref + 20%2007 w/4% GrowthReference -20%($/MMBtu)Gas
Fuel Prices3% over 10 YearsNoneNone%Energy EfficiencyPowerBase +25%PowerBasePowerBase -25%%Energy Growth RatePowerBase +25%PowerBasePowerBase -25%%Demand Growth Rate
Load($/KW)Storage($/KW)Demand Response
3,0232,7482,475($/KW)IGCC w/Sequestration1,2261,1141,003($/KW)CC w/Sequestration2,1011,9101,720($/KW)Wind2,7432,4932,245($/KW)Nuclear2,3232,1111,901($/KW)IGCC945859774($/KW)CC665605545($/KW)CT
2,0191,8351,653($/KW)CoalAlternative Capital Costs
HighMid/HighReferenceMid/LowLowUnitUncertainty
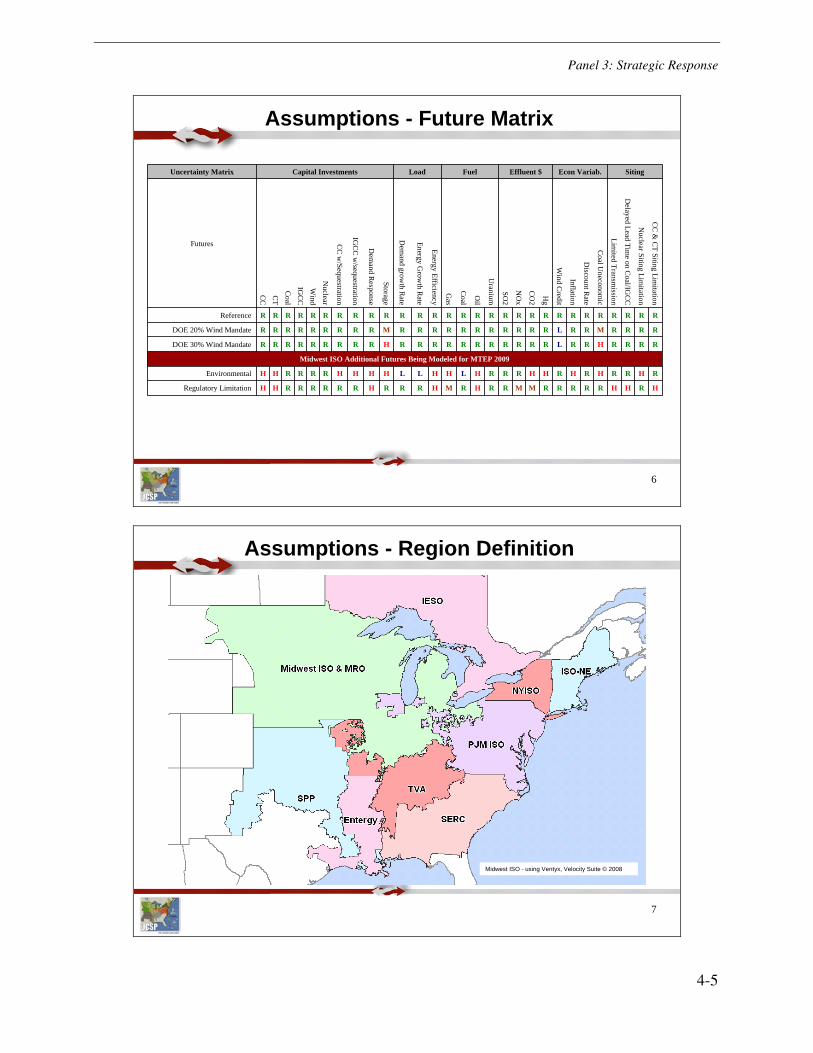
Panel 3: Strategic Response
4-5
6
Assumptions - Future Matrix
Midwest ISO Additional Futures Being Modeled for MTEP 2009
HRHHRRRRRMMRRHRMHRRRHRRRRRRHHRegulatory Limitation
RHRRHRHRHHRRRHLHHLLHHHHRRRRHHEnvironmental
RRRRHRRLRRRRRRRRRRRHRRRRRRRRRDOE 30% Wind Mandate
RRRRMRRLRRRRRRRRRRRMRRRRRRRRRDOE 20% Wind Mandate
RRRRRRRRRRRRRRRRRRRRRRRRRRRRRReference
CC
& C
T Siting Limitation
Nuclear Siting Lim
itation
Delayed Lead Tim
e on Coal/IG
CC
Limited Transm
ission
Coal U
neconomic
Discount R
ate
Inflation
Wind C
redit
Hg
CO
2
NO
x
SO2
UraniumO
il
Coal
Gas
Energy Efficiency
Energy Grow
th Rate
Dem
and growth R
ate
Storage
Dem
and Response
IGC
C w
/sequestration
CC
w/Sequestration
Nuclear
Wind
IGC
C
Coal
CT
CC
Futures
SitingEcon Variab.Effluent $FuelLoadCapital InvestmentsUncertainty Matrix
7
Assumptions - Region Definition
Midwest ISO - using Ventyx, Velocity Suite © 2008
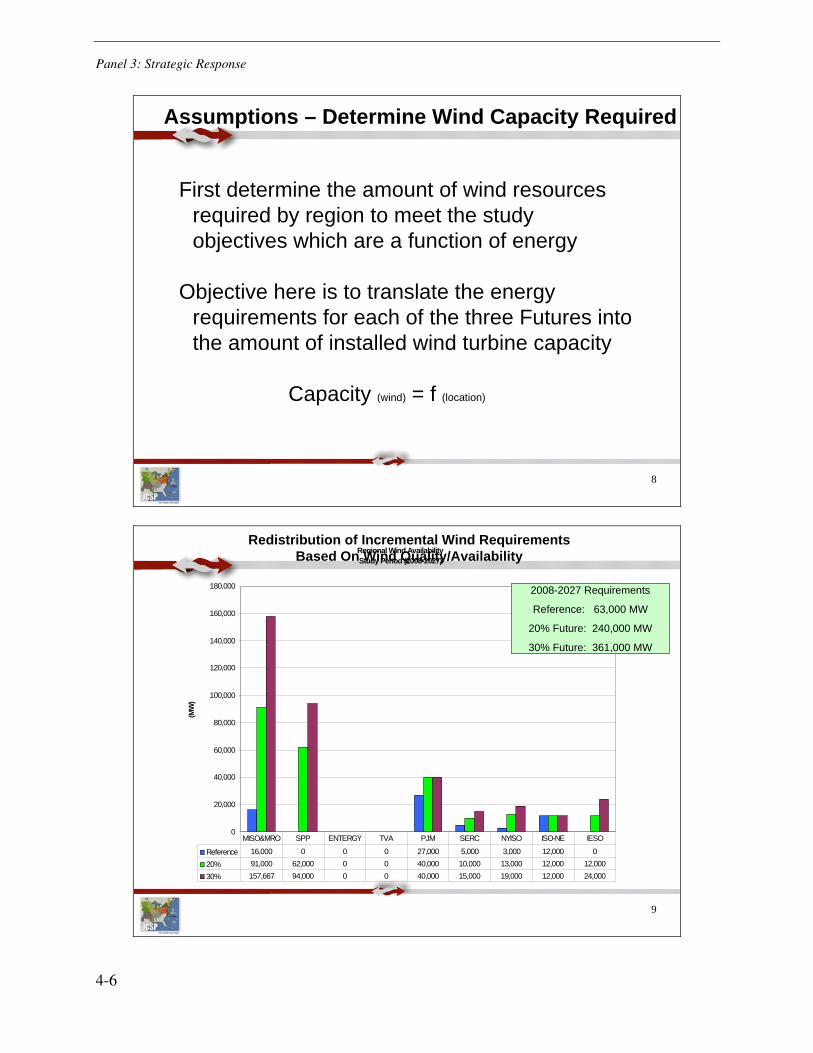
Panel 3: Strategic Response
4-6
8
First determine the amount of wind resources required by region to meet the study objectives which are a function of energy
Objective here is to translate the energy requirements for each of the three Futures into the amount of installed wind turbine capacity
Capacity (wind) = f (location)
Assumptions – Determine Wind Capacity Required
9
Redistribution of Incremental Wind RequirementsBased On Wind Quality/AvailabilityRegional Wind Availability
Study Period (2008-2027)
0
20,000
40,000
60,000
80,000
100,000
120,000
140,000
160,000
180,000
(MW
)
Reference 16,000 0 0 0 27,000 5,000 3,000 12,000 020% 91,000 62,000 0 0 40,000 10,000 13,000 12,000 12,00030% 157,667 94,000 0 0 40,000 15,000 19,000 12,000 24,000
MISO&MRO SPP ENTERGY TVA PJM SERC NYISO ISO-NE IESO
2008-2027 Requirements
Reference: 63,000 MW
20% Future: 240,000 MW
30% Future: 361,000 MW
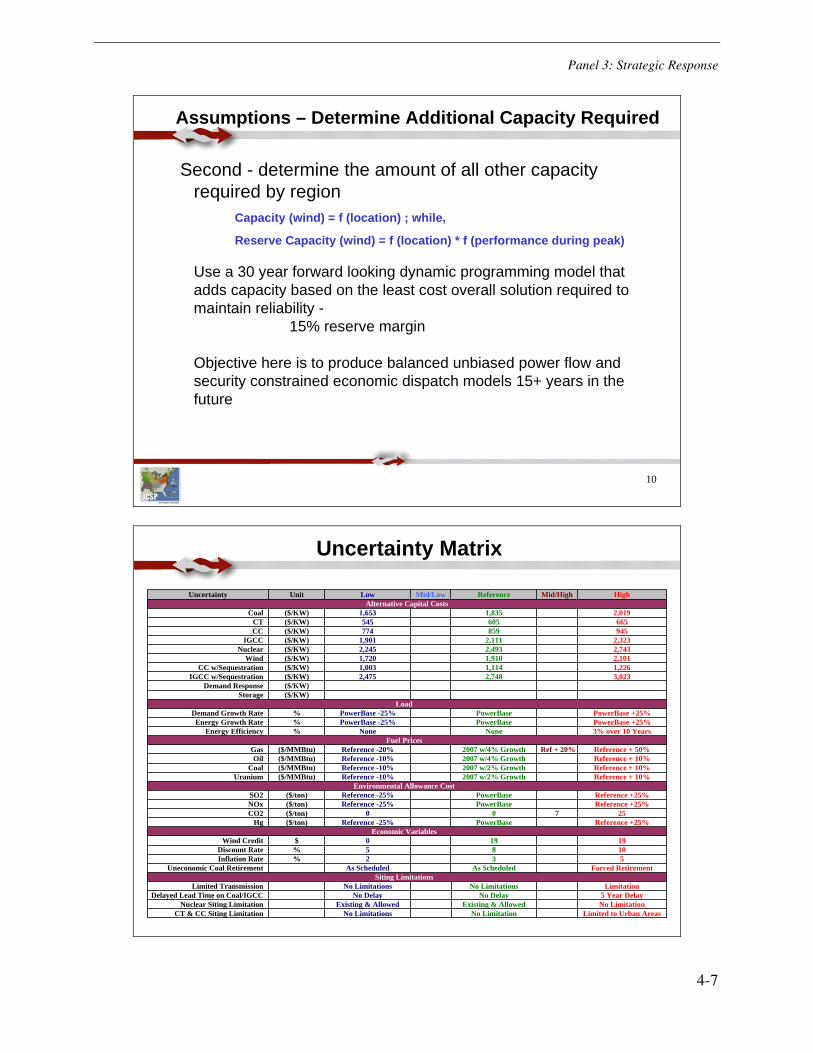
Panel 3: Strategic Response
4-7
10
Second - determine the amount of all other capacity required by region
Capacity (wind) = f (location) ; while,
Reserve Capacity (wind) = f (location) * f (performance during peak)
Use a 30 year forward looking dynamic programming model that adds capacity based on the least cost overall solution required to maintain reliability -
15% reserve margin
Objective here is to produce balanced unbiased power flow and security constrained economic dispatch models 15+ years in the future
Assumptions – Determine Additional Capacity Required
11
Uncertainty Matrix
Limited to Urban AreasNo LimitationNo LimitationsCT & CC Siting LimitationNo LimitationExisting & Allowed Existing & Allowed Nuclear Siting Limitation5 Year DelayNo DelayNo DelayDelayed Lead Time on Coal/IGCC
LimitationNo LimitationsNo LimitationsLimited TransmissionSiting Limitations
Forced RetirementAs ScheduledAs ScheduledUneconomic Coal Retirement532%Inflation Rate
1085%Discount Rate19190$Wind Credit
Economic VariablesReference +25%PowerBaseReference -25%($/ton)Hg
25700($/ton)CO2Reference +25%PowerBaseReference -25%($/ton)NOx Reference +25%PowerBaseReference -25%($/ton)SO2
Environmental Allowance CostReference + 10%2007 w/2% GrowthReference -10%($/MMBtu)UraniumReference + 10%2007 w/2% GrowthReference -10%($/MMBtu)CoalReference + 10%2007 w/4% GrowthReference -10%($/MMBtu)OilReference + 50%Ref + 20%2007 w/4% GrowthReference -20%($/MMBtu)Gas
Fuel Prices3% over 10 YearsNoneNone%Energy EfficiencyPowerBase +25%PowerBasePowerBase -25%%Energy Growth RatePowerBase +25%PowerBasePowerBase -25%%Demand Growth Rate
Load($/KW)Storage($/KW)Demand Response
3,0232,7482,475($/KW)IGCC w/Sequestration1,2261,1141,003($/KW)CC w/Sequestration2,1011,9101,720($/KW)Wind2,7432,4932,245($/KW)Nuclear2,3232,1111,901($/KW)IGCC945859774($/KW)CC665605545($/KW)CT
2,0191,8351,653($/KW)CoalAlternative Capital Costs
HighMid/HighReferenceMid/LowLowUnitUncertainty

Panel 3: Strategic Response
4-8
12
Midwest ISO West Region
Generation Nameplate Expansion 2008-2024
5,490
7,200 6,000 4,800
1,2001,200 2,400
1,122
7,000 10,000
16,000
928
928
5,4905,4902,180
1,815374
928
29,618
5,490
21,81823,618
0
5,000
10,000
15,000
20,000
25,000
30,000
35,000
MISOW Base Line/Planned Queue MISOW Reference MISOW 20% Mandate MISOW 30% Mandate
Nam
epla
te E
xpan
sion
(MW
)
Queue/Planned Coal Nuclear CC CT Wind IGCC IGCC/Seq DR
13
Midwest ISO East Region
Generation Nameplate Expansion 2008-2024
1,746
4,8002,400 1,200
1,563
3,600
3,6003,600
17,000
26,000
1,7461,746183
128
128
128
32,674
1,746
10,274
24,874
0
5,000
10,000
15,000
20,000
25,000
30,000
35,000
MISOE Base Line/Planned Queue MISOE Reference MISOE 20% Mandate MISOE 30% Mandate
Nam
epla
te E
xpan
sion
(MW
)
Queue/Planned Coal Nuclear CC CT Wind IGCC IGCC/Seq DR
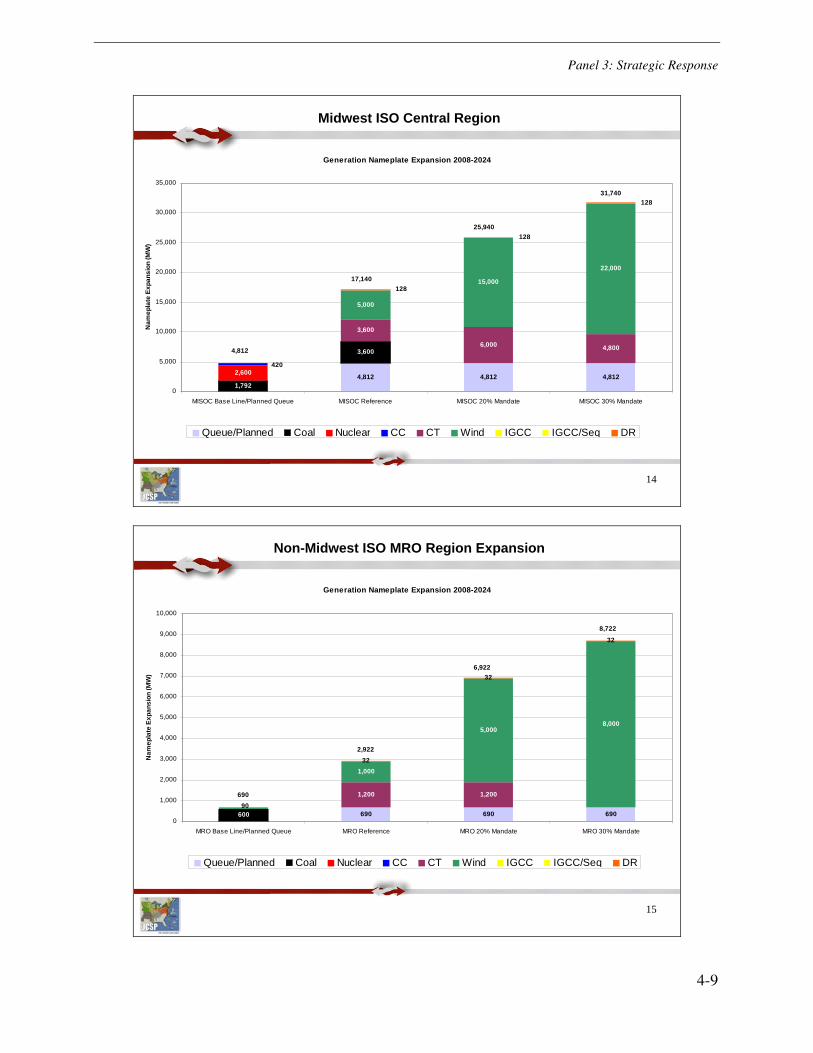
Panel 3: Strategic Response
4-9
14
Midwest ISO Central Region
Generation Nameplate Expansion 2008-2024
4,812
3,600
2,600
3,600
6,000 4,800
5,000
15,000
22,000
4,8124,8121,792
420
128
128
128
31,740
4,812
17,140
25,940
0
5,000
10,000
15,000
20,000
25,000
30,000
35,000
MISOC Base Line/Planned Queue MISOC Reference MISOC 20% Mandate MISOC 30% Mandate
Nam
epla
te E
xpan
sion
(MW
)
Queue/Planned Coal Nuclear CC CT Wind IGCC IGCC/Seq DR
15
Non-Midwest ISO MRO Region Expansion
Generation Nameplate Expansion 2008-2024
690
1,000
5,0008,000
32
32
32
690690600
1,2001,200
90
8,722
690
2,922
6,922
0
1,000
2,000
3,000
4,000
5,000
6,000
7,000
8,000
9,000
10,000
MRO Base Line/Planned Queue MRO Reference MRO 20% Mandate MRO 30% Mandate
Nam
epla
te E
xpan
sion
(MW
)
Queue/Planned Coal Nuclear CC CT Wind IGCC IGCC/Seq DR

Panel 3: Strategic Response
4-10
16
Eastern Interconnect Expansion
Generation Nameplate Expansion 2008-2024
70,909
75,60036,000 14,400
40,80061,200
69,600
7,030
57,000
229,000
340,000
70,90970,9099,693
34,915
4,8006,000
12,343
6,000
4,181
5,920
5,920
5,920
505,629
70,909
256,229
409,029
0
100,000
200,000
300,000
400,000
500,000
600,000
Eastern Interconnect Base Line/PlannedQueue
Eastern Interconnect Reference Eastern Interconnect 20% Mandate Eastern Interconnect 30% Mandate
Nam
epla
te E
xpan
sion
(MW
)
Queue/Planned Coal Nuclear CC CT Wind IGCC IGCC/Seq DR
17
JCSP Economic Planning Process
Step 1 – Multi-Future Regional Resource Forecasting
(Nov 07’ – Jan 08’)
Step 4 – Test Transmission Plans for Robustness
(July 08’ – Dec 08’)
Step 7 - Cost Allocation Analysis
(Sept - Oct 09)
Step 3 – Design Prelim. Trans. Plans for each Future(March 08’ – June08’)
Step 2 – Site Generation and Place in Powerflow Model
(Jan 08’ - Feb 08’)
Step 5 –Consolidate Transmission Plans(July 08’ – Dec 08’)
Step 6 – Perform Reliability Assessment / Final Design
(Jan 09’ – Aug 09’)
Next JCSPTracking and Carry Forward
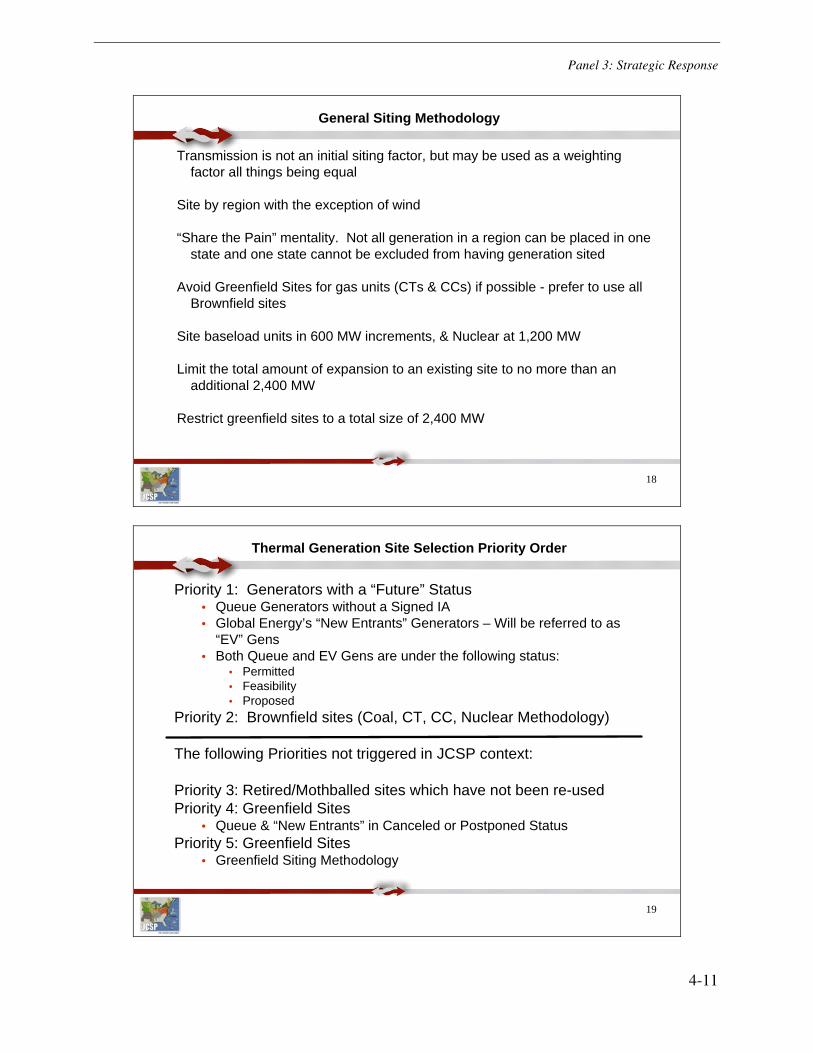
Panel 3: Strategic Response
4-11
18
General Siting Methodology
Transmission is not an initial siting factor, but may be used as a weighting factor all things being equal
Site by region with the exception of wind
“Share the Pain” mentality. Not all generation in a region can be placed in onestate and one state cannot be excluded from having generation sited
Avoid Greenfield Sites for gas units (CTs & CCs) if possible - prefer to use all Brownfield sites
Site baseload units in 600 MW increments, & Nuclear at 1,200 MW
Limit the total amount of expansion to an existing site to no more than an additional 2,400 MW
Restrict greenfield sites to a total size of 2,400 MW
19
Thermal Generation Site Selection Priority Order
Priority 1: Generators with a “Future” Status• Queue Generators without a Signed IA• Global Energy’s “New Entrants” Generators – Will be referred to as
“EV” Gens• Both Queue and EV Gens are under the following status:
• Permitted• Feasibility• Proposed
Priority 2: Brownfield sites (Coal, CT, CC, Nuclear Methodology)
The following Priorities not triggered in JCSP context:
Priority 3: Retired/Mothballed sites which have not been re-usedPriority 4: Greenfield Sites
• Queue & “New Entrants” in Canceled or Postponed StatusPriority 5: Greenfield Sites
• Greenfield Siting Methodology

Panel 3: Strategic Response
4-12
20
Reference Future Siting
Midwest ISO - using Ventyx, Velocity Suite © 2008
21
Renewable Future Siting (20% Wind Mandate)
Midwest ISO - using Ventyx, Velocity Suite © 2008
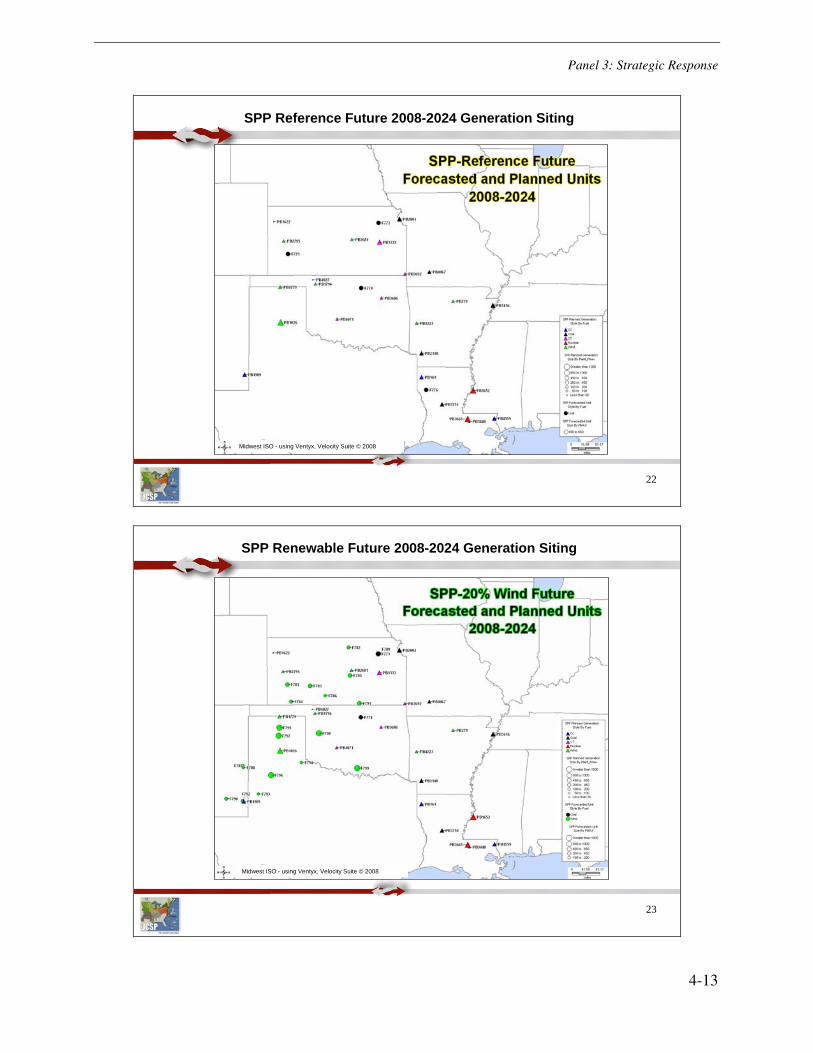
Panel 3: Strategic Response
4-13
22
SPP Reference Future 2008-2024 Generation Siting
Midwest ISO - using Ventyx, Velocity Suite © 2008
23
SPP Renewable Future 2008-2024 Generation Siting
Midwest ISO - using Ventyx, Velocity Suite © 2008
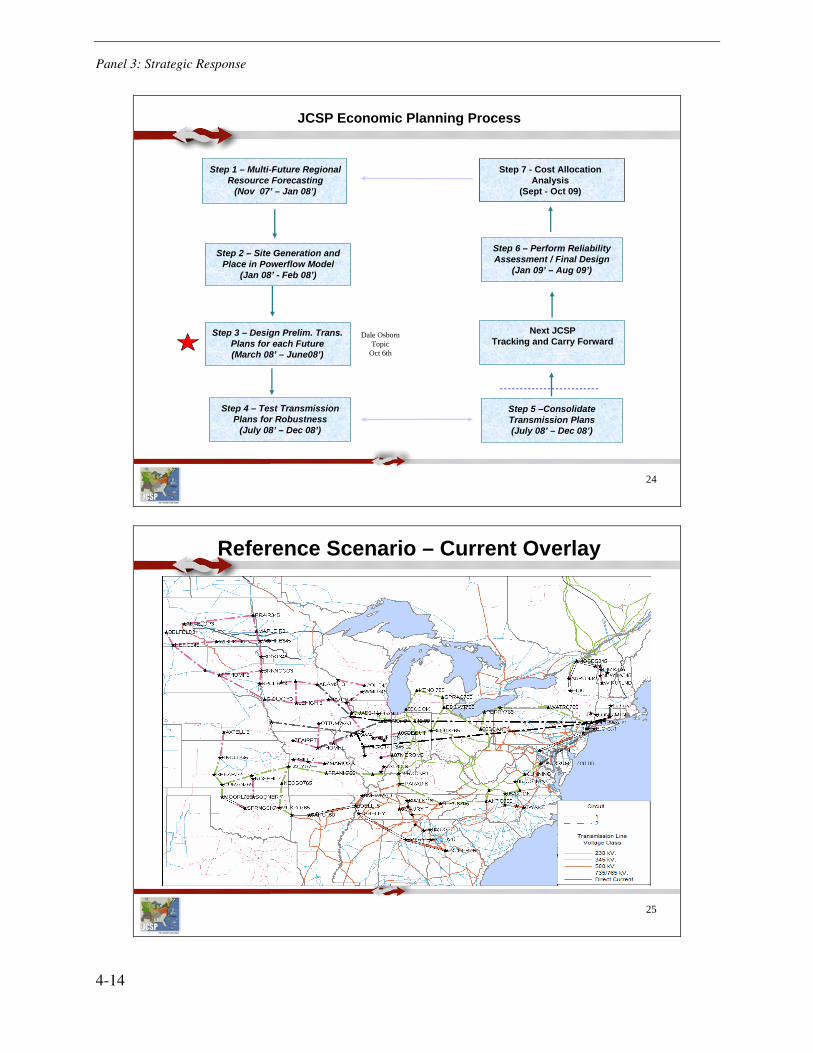
Panel 3: Strategic Response
4-14
24
JCSP Economic Planning Process
Step 1 – Multi-Future Regional Resource Forecasting
(Nov 07’ – Jan 08’)
Step 4 – Test Transmission Plans for Robustness
(July 08’ – Dec 08’)
Step 7 - Cost Allocation Analysis
(Sept - Oct 09)
Step 3 – Design Prelim. Trans. Plans for each Future(March 08’ – June08’)
Step 2 – Site Generation and Place in Powerflow Model
(Jan 08’ - Feb 08’)
Step 5 –Consolidate Transmission Plans(July 08’ – Dec 08’)
Step 6 – Perform Reliability Assessment / Final Design
(Jan 09’ – Aug 09’)
Next JCSPTracking and Carry Forward
Dale OsbornTopic
Oct 6th
25
Reference Scenario – Current Overlay
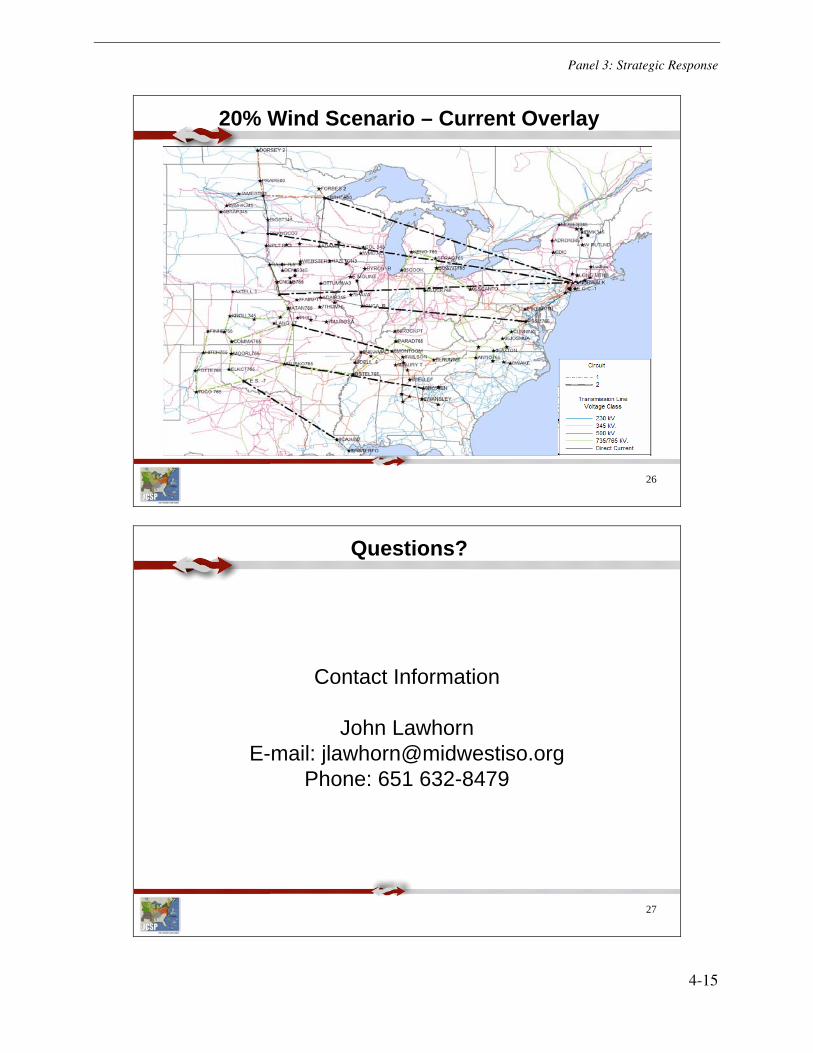
Panel 3: Strategic Response
4-15
26
20% Wind Scenario – Current Overlay
27
Questions?
Contact Information
John LawhornE-mail: [email protected]
Phone: 651 632-8479

Panel 3: Strategic Response
4-16
Strategic Response
William Bojorquez, Hunt Transmission
Mr. Bojorquez (also Chair, NERC Reliability Assessment Subcommittee) offered the outline of a strategic plan for responding to the needs identified in the earlier panel sessions. Following are notes of the presentation and the slides.
Current requirements do not include planning for extreme weather events; most analysis is conducted after the event has occurred. It would be difficult to increase the stringency of planning standards. Silos are being created around regions in order to focus on regional problems. Right now, having additional interties is not seen as a solution to regional issues, due to the difficulty of allocating costs.
With a focus on reliability, there can be support for collaborative efforts. We suggest an EPRI/PSERC “Climate Hardening” Study. It investigates the ability to serve weather-driven demand, added flexibility and adaptability to climate change and extreme weather, neighboring support for reliability. This is potentially an international project involving Canada and Mexico. Such a study may identify gaps in reliability standards.
The existing situation does not seem to support reliability in the short term, when long-term studies seem to have higher reliability standards. Practice has neglected long-term planning over the recent past. The way we plan for operations under current adequacy standards does not match actual conditions. Nameplate capacity does not include the operational constraints that are now becoming more prevalent.
www.huntpower.com 1
Technical Summit on Reliability Impacts of Extreme Weather and
Climate Changes:Strategic Response Panel
Technical Summit on Reliability Impacts of Extreme Weather and
Climate Changes:Strategic Response Panel
Bill BojorquezOctober 15, 2008
Bill BojorquezOctober 15, 2008

Panel 3: Strategic Response
4-17
www.huntpower.com - 2
Is the present 1 in 10 year (90/10) load forecast load flow analysis sufficient?Industry is not required to plan for more severe events (i.e. severe heat/cold snaps, hurricanes, earthquakes, tornadoes, etc.)When event does occur, responsible entities scramble to repair, harden, and studyAs it stands today, proposing NERC Standards or developing a NERC assessment request would not be supported by the electric industry
How do we Improve Analysis?
www.huntpower.com - 3
Historically industry coordinated and planned for emergency events and infrastructure New barriers exist for regional and inter-regional transmission and other support solutionsInstead of helping neighbors, we have more separation then every before….driven by cost and benefit argumentsCreated regional and sub-regional silos fueled by debates over cost assignment and transmission jurisdictionCoordinate fuel interdependency studies are not pursued
History & Current Barriers

Panel 3: Strategic Response
4-18
www.huntpower.com - 4
Improve intra- and inter-regional collaboration• Focus on reliability, not financial interest• Collaboratively review catastrophic events
and potential solutionsHeavy-handed approaches will not workEntity like EPRI/PSERC to develop a framework to address catastrophic eventsEPRI/PSERC could start with sample modifications that support the hardening of the grid
Potential Solutions
www.huntpower.com - 5
Climate Hardening includes:• Ability to serve increased demand driven by weather
patterns• Increase options to help neighbors during and after
severe natural events• Inter-ties that ignore national, state and regional
boundaries• Equipment upgrades: transformers, substation
equipment, Underground/Overhead decisions, etc.• Preparation to manage fuel disruptions and other
system interdependencies• Assessing impacts on demand and water availability
Response: Climate Hardening
Panel 3: Strategic Response
4-19
www.huntpower.com - 6
Improved bulk power system reliability for normal and high probability eventsBetter prepared for low probability/high impact eventsResponse to threats to critical infrastructureLong debated fuel disruptions are finally addressedIncrease ability to economically serve demand
Benefits of Climate Hardening
www.huntpower.com - 7
EPRI/PSERC propose a North American-wide study to interested stakeholders and NERC’s Board of Trustees and/or DOE/NEB• Help shape industry-wide response• Foundation for industry action• Time to refresh technology solutions for
Climate Hardening (advanced transformers, HVDC, OH/UG technologies, smart grids, etc).Risk assessment tools
Way Forward
Panel 3: Strategic Response
4-20
www.huntpower.com - 8
Questions?
Climate Change and the Baseline Planning Initiative of Hydro Quebec
Yves Nadeau, Hydro Quebec Distribution
This presentation describes a study conducted by Hydro Quebec Distribution (HQD) to determine more adequate normal weather assumptions for load forecasting. Following are notes of the presentation and the slides.
Defining normal weather is required for baseline load forecasting, as heating and cooling demand account for up to 20% of electric demand in the Quebec market. Normal weather scenarios include a reference period, a climate change beginning, and a warming trend. An independent survey revealed that most utilities use rolling periods for averaging temperature. Their numbers divide evenly between period lengths longer and shorter than 20 years.
HQD has set forth a process of improving its normal weather scenario. As recent as the year 2000, the reference period has been updated and a warming trend was introduced. The approach retained in 2007 by HQD is a non-rolling window from 1971 to 2006, with climate change beginning in 1970 at a pace of +0,3°C per 10 years. The warming scenario resulted from a study with 39 simulations from 1901 to 2040 (17 global climate models with up to 3 greenhouse gas scenarios). The net result is a 0.5°C increase in current and forecasted average temperatures with significant variations through the months. Base annual energy is reduced by 0.4 % and peak load reduced by 0.1 %.
Panel 3: Strategic Response
4-21
Climatic uncertainty is modeled with 36 years of hourly climatic conditions (1971 through 2006) under the actual load forecast conditions. Historical data is shifted as much as ± 3 days to produce series data for each weekday’s climatic conditions. Such an exercise generates a set of 252 different hourly load scenarios. The arithmetic averages of these 252 scenarios are the hourly normal weather conditions.
Technical Summit on Extreme Weather Impacts on Reliability
Climate change and normals Planning issue initiative of Hydro-Québec Distribution
Yves Nadeau
EPRI, NERC, PSERCPortland, OregonOctober 15, 2008
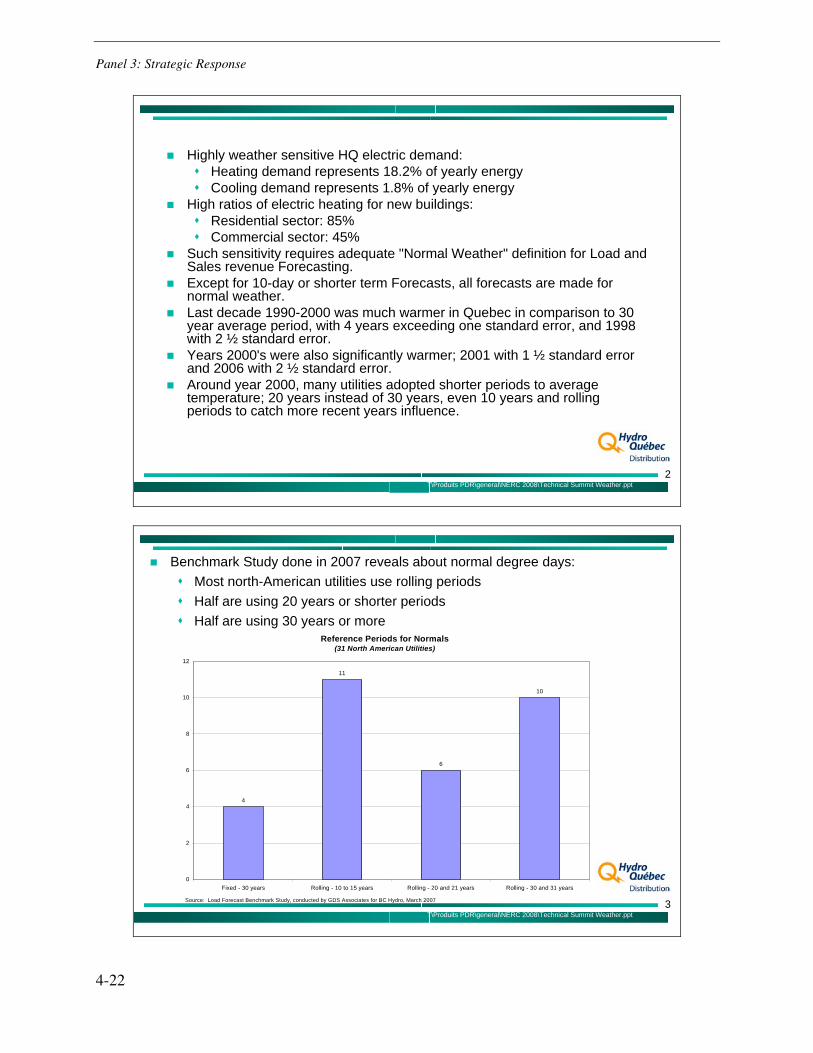
Panel 3: Strategic Response
4-22
T\Produits PDR\general\NERC 2008\Technical Summit Weather.ppt2
Highly weather sensitive HQ electric demand:Heating demand represents 18.2% of yearly energyCooling demand represents 1.8% of yearly energy
High ratios of electric heating for new buildings:Residential sector: 85%Commercial sector: 45%
Such sensitivity requires adequate "Normal Weather" definition for Load and Sales revenue Forecasting.Except for 10-day or shorter term Forecasts, all forecasts are made for normal weather.Last decade 1990-2000 was much warmer in Quebec in comparison to 30 year average period, with 4 years exceeding one standard error, and 1998 with 2 ½ standard error.Years 2000's were also significantly warmer; 2001 with 1 ½ standard error and 2006 with 2 ½ standard error.Around year 2000, many utilities adopted shorter periods to average temperature; 20 years instead of 30 years, even 10 years and rolling periods to catch more recent years influence.
T\Produits PDR\general\NERC 2008\Technical Summit Weather.ppt3
Benchmark Study done in 2007 reveals about normal degree days:Most north-American utilities use rolling periodsHalf are using 20 years or shorter periodsHalf are using 30 years or more
Reference Periods for Normals(31 North American Utilities)
4
11
6
10
0
2
4
6
8
10
12
Fixed - 30 years Rolling - 10 to 15 years Rolling - 20 and 21 years Rolling - 30 and 31 years
Source: Load Forecast Benchmark Study, conducted by GDS Associates for BC Hydro, March 2007
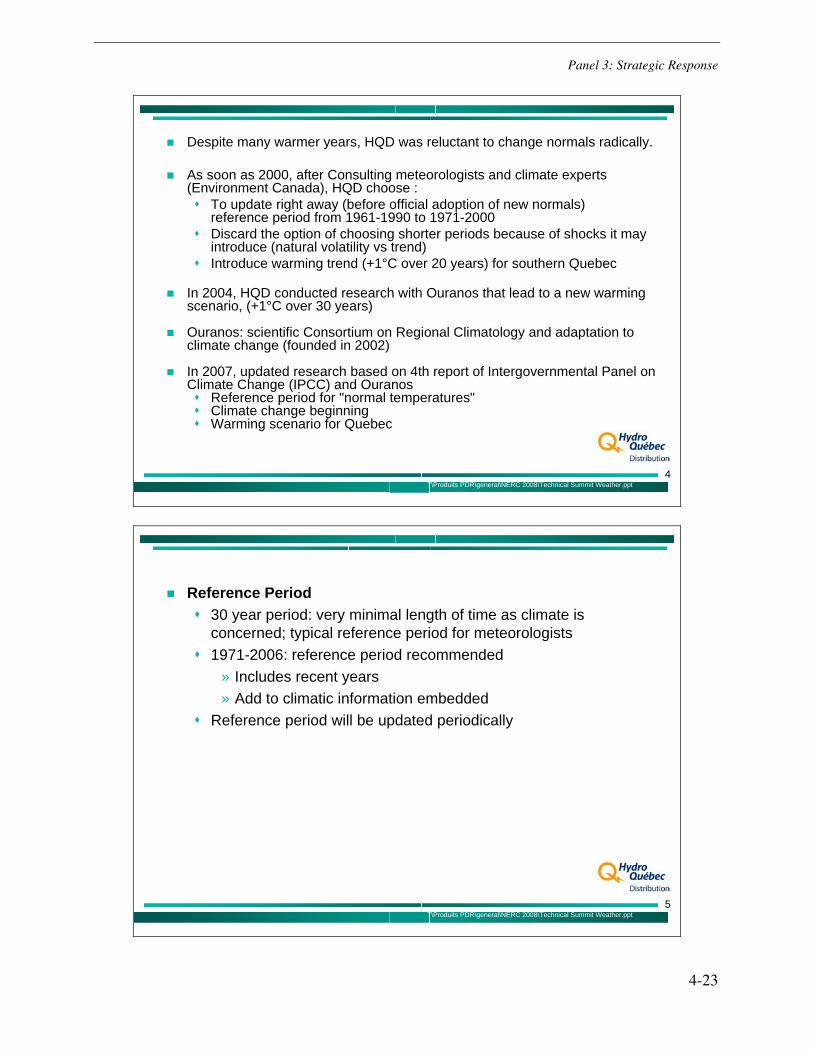
Panel 3: Strategic Response
4-23
T\Produits PDR\general\NERC 2008\Technical Summit Weather.ppt4
Despite many warmer years, HQD was reluctant to change normals radically.
As soon as 2000, after Consulting meteorologists and climate experts (Environment Canada), HQD choose :
To update right away (before official adoption of new normals) reference period from 1961-1990 to 1971-2000Discard the option of choosing shorter periods because of shocks it may introduce (natural volatility vs trend)Introduce warming trend (+1°C over 20 years) for southern Quebec
In 2004, HQD conducted research with Ouranos that lead to a new warming scenario, (+1°C over 30 years)
Ouranos: scientific Consortium on Regional Climatology and adaptation to climate change (founded in 2002)
In 2007, updated research based on 4th report of Intergovernmental Panel on Climate Change (IPCC) and Ouranos
Reference period for "normal temperatures"Climate change beginningWarming scenario for Quebec
T\Produits PDR\general\NERC 2008\Technical Summit Weather.ppt5
Reference Period30 year period: very minimal length of time as climate is concerned; typical reference period for meteorologists1971-2006: reference period recommended
» Includes recent years» Add to climatic information embedded
Reference period will be updated periodically
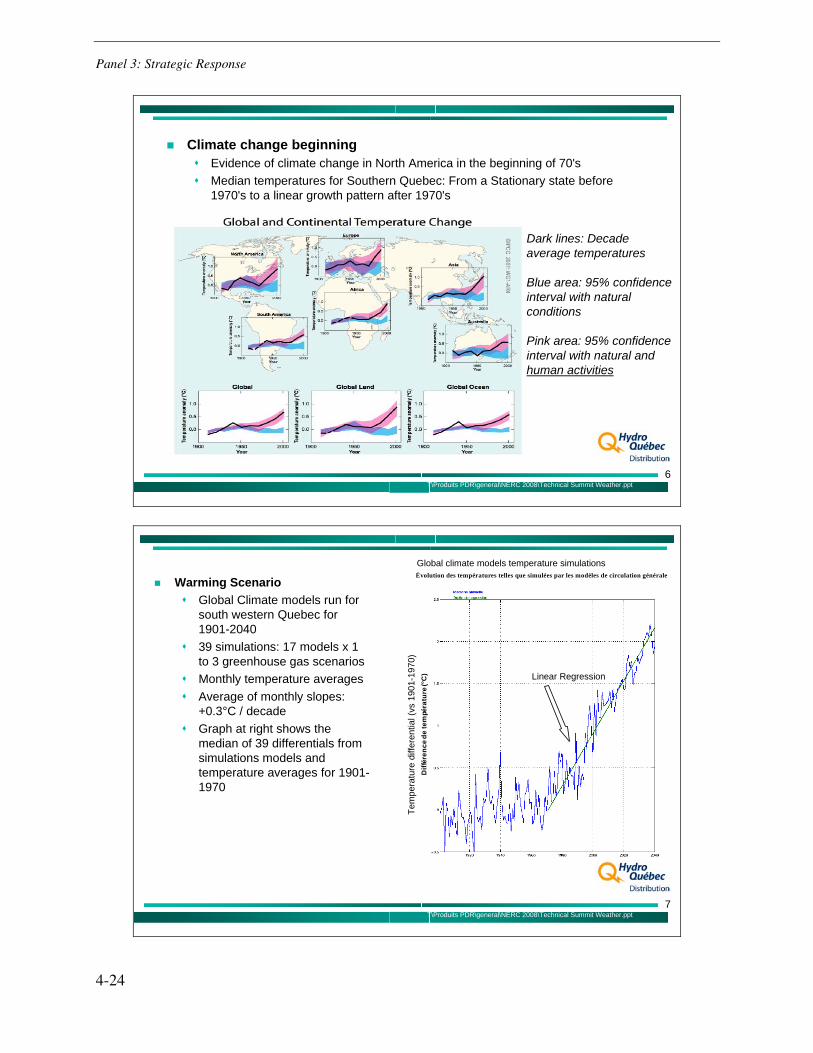
Panel 3: Strategic Response
4-24
T\Produits PDR\general\NERC 2008\Technical Summit Weather.ppt6
Climate change beginningEvidence of climate change in North America in the beginning of 70'sMedian temperatures for Southern Quebec: From a Stationary state before 1970's to a linear growth pattern after 1970's
Dark lines: Decade average temperatures
Blue area: 95% confidence interval with natural conditions
Pink area: 95% confidence interval with natural and human activities
T\Produits PDR\general\NERC 2008\Technical Summit Weather.ppt7
Warming Scenario Global Climate models run for south western Quebec for 1901-204039 simulations: 17 models x 1 to 3 greenhouse gas scenariosMonthly temperature averagesAverage of monthly slopes: +0.3°C / decadeGraph at right shows the median of 39 differentials from simulations models and temperature averages for 1901-1970
Évolution des températures telles que simulées par les modèles de circulation générale
Diff
éren
cede
tem
péra
ture
(°C
) Linear Regression
Tem
pera
ture
diff
eren
tial (
vs 1
901-
1970
)
Global climate models temperature simulations
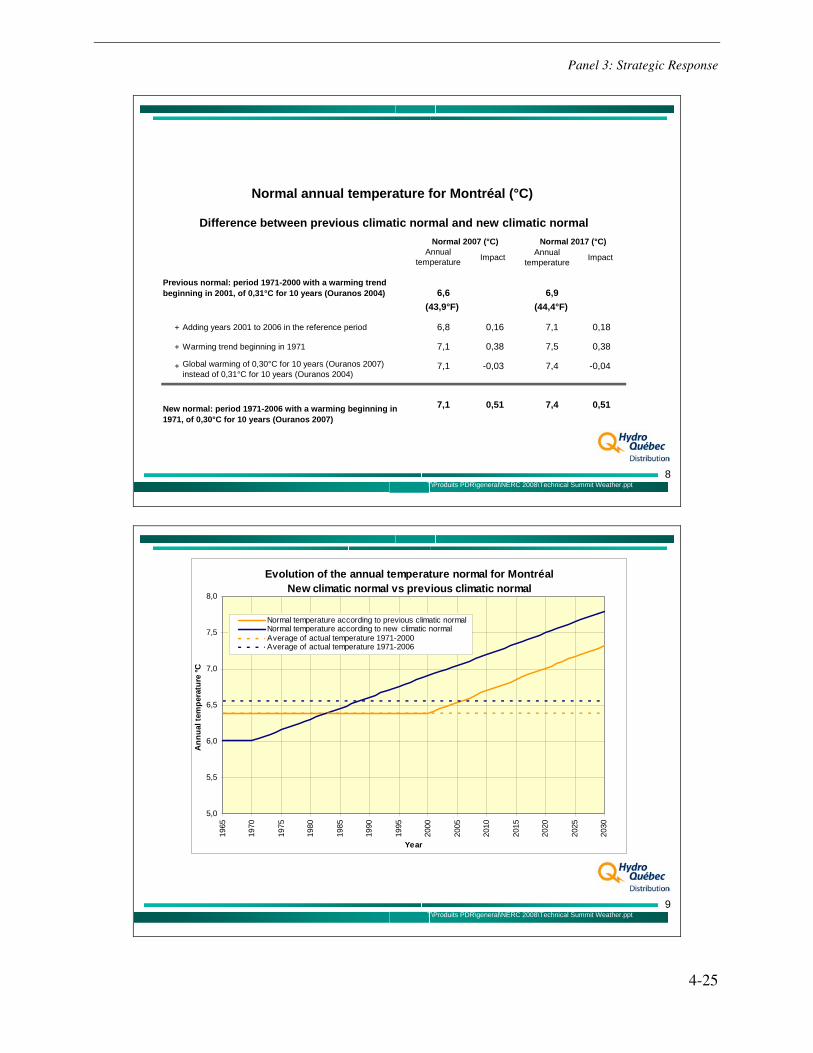
Panel 3: Strategic Response
4-25
T\Produits PDR\general\NERC 2008\Technical Summit Weather.ppt8
Annual temperature Impact Annual
temperature Impact
6,6 6,9 (43,9°F) (44,4°F)
+ Adding years 2001 to 2006 in the reference period 6,8 0,16 7,1 0,18
+ Warming trend beginning in 1971 7,1 0,38 7,5 0,38
+ Global warming of 0,30°C for 10 years (Ouranos 2007) instead of 0,31°C for 10 years (Ouranos 2004)
7,1 -0,03 7,4 -0,04
7,1 0,51 7,4 0,51
Previous normal: period 1971-2000 with a warming trend beginning in 2001, of 0,31°C for 10 years (Ouranos 2004)
New normal: period 1971-2006 with a warming beginning in 1971, of 0,30°C for 10 years (Ouranos 2007)
Normal annual temperature for Montréal (°C)
Difference between previous climatic normal and new climatic normal Normal 2007 (°C) Normal 2017 (°C)
T\Produits PDR\general\NERC 2008\Technical Summit Weather.ppt9
Evolution of the annual temperature normal for MontréalNew climatic normal vs previous climatic normal
5,0
5,5
6,0
6,5
7,0
7,5
8,0
1965
1970
1975
1980
1985
1990
1995
2000
2005
2010
2015
2020
2025
2030
Year
Ann
ual t
empe
ratu
re °C
Normal temperature according to previous climatic normalNormal temperature according to new climatic normalAverage of actual temperature 1971-2000Average of actual temperature 1971-2006

Panel 3: Strategic Response
4-26
T\Produits PDR\general\NERC 2008\Technical Summit Weather.ppt10
Normal Weather ConditionsHourly parameters from 1971 to 2006: temperature, wind speed, cloud cover and precipitationWeekly calendar: shifting +/- 3 days36 years x 7 days = 252 hourly load scenariosNormal weather / hour = average of 252 scenarios
T\Produits PDR\general\NERC 2008\Technical Summit Weather.ppt11
Unequal warming through the year (°C / 10 years)
0.300.390.280.250.280.270.260.230.260.280.270.360.45New Climatic Normal (Ouranos 2007)
AnnualDecNovOctSepAugJulyJuneMayAprMarFebJan
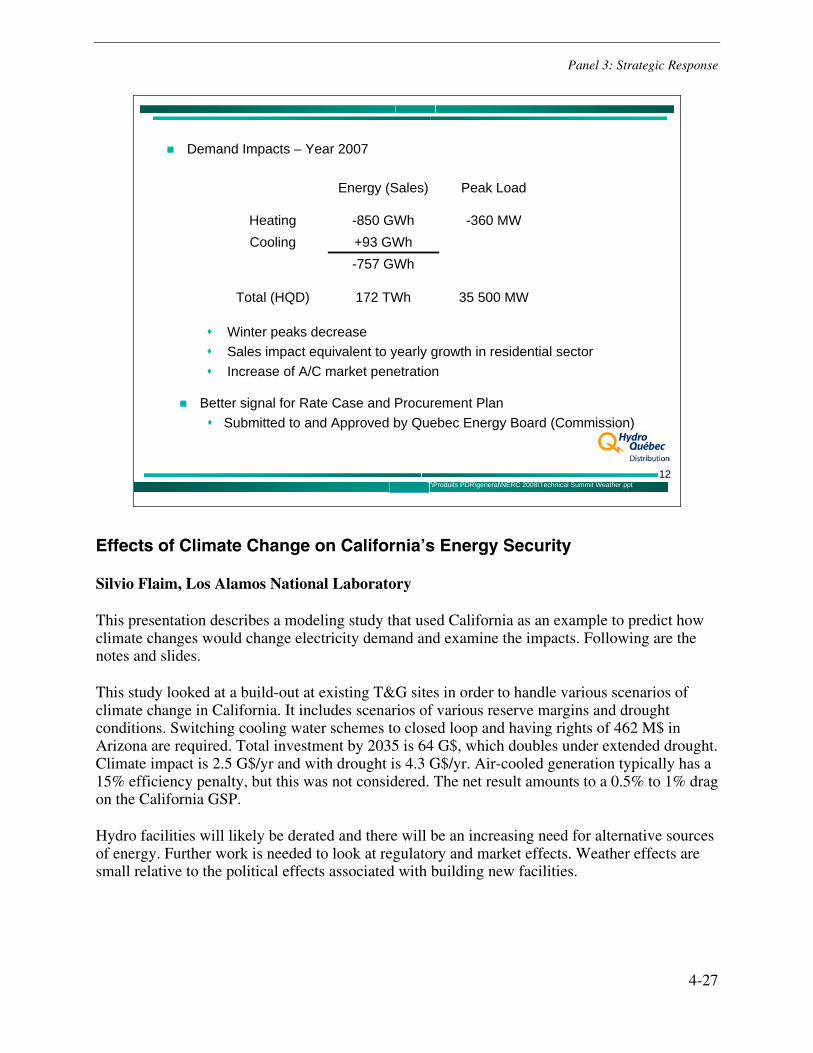
Panel 3: Strategic Response
4-27
T\Produits PDR\general\NERC 2008\Technical Summit Weather.ppt12
Demand Impacts – Year 2007
35 500 MW172 TWhTotal (HQD)
-757 GWh+93 GWhCooling
-360 MW-850 GWhHeating
Peak LoadEnergy (Sales)
Better signal for Rate Case and Procurement PlanSubmitted to and Approved by Quebec Energy Board (Commission)
Winter peaks decreaseSales impact equivalent to yearly growth in residential sectorIncrease of A/C market penetration
Effects of Climate Change on California’s Energy Security
Silvio Flaim, Los Alamos National Laboratory
This presentation describes a modeling study that used California as an example to predict how climate changes would change electricity demand and examine the impacts. Following are the notes and slides.
This study looked at a build-out at existing T&G sites in order to handle various scenarios of climate change in California. It includes scenarios of various reserve margins and drought conditions. Switching cooling water schemes to closed loop and having rights of 462 M$ in Arizona are required. Total investment by 2035 is 64 G$, which doubles under extended drought. Climate impact is 2.5 G$/yr and with drought is 4.3 G$/yr. Air-cooled generation typically has a 15% efficiency penalty, but this was not considered. The net result amounts to a 0.5% to 1% drag on the California GSP.
Hydro facilities will likely be derated and there will be an increasing need for alternative sources of energy. Further work is needed to look at regulatory and market effects. Weather effects are small relative to the political effects associated with building new facilities.
Panel 3: Strategic Response
4-28
1
Effects of Climate Change onEffects of Climate Change on
California Energy SecurityCalifornia Energy Security
LA-UR-05-5871
2
Study ObjectivesStudy Objectives
Using California as an example, how would predicted
climatic changes in the mid-latitudes of the Northern
Hemisphere change the demand for electric energy
and what are the impacts?
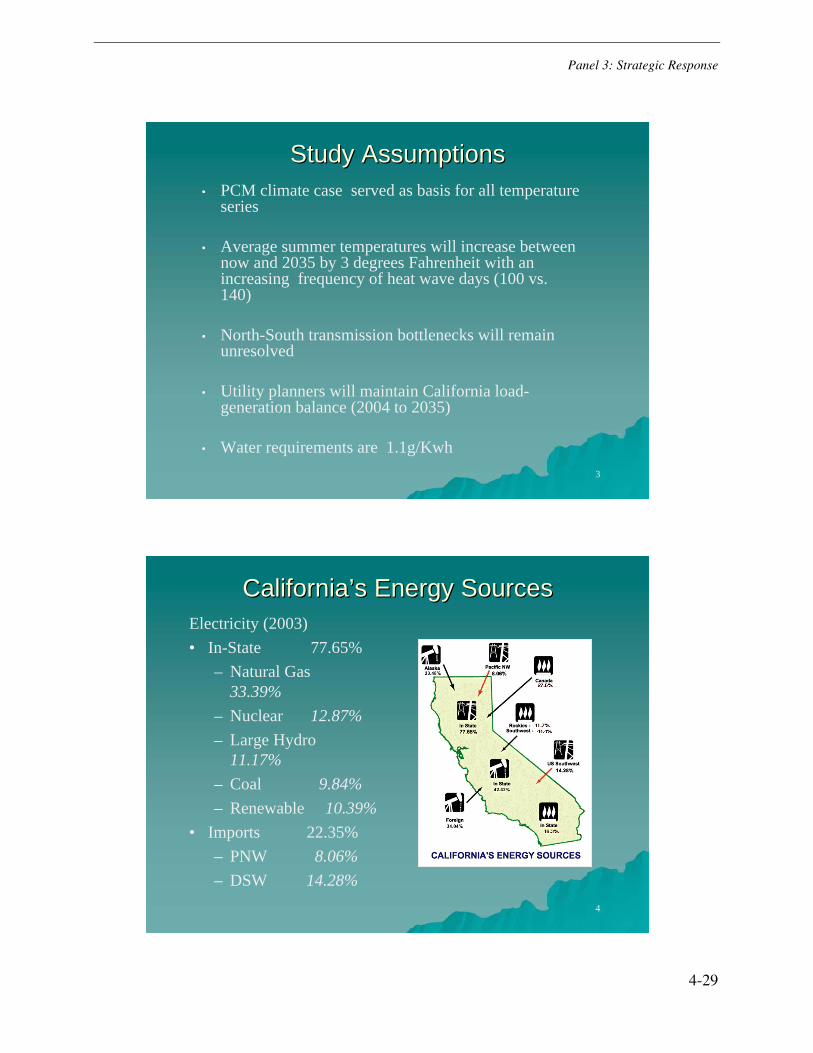
Panel 3: Strategic Response
4-29
3
Study AssumptionsStudy Assumptions
• PCM climate case served as basis for all temperatureseries
• Average summer temperatures will increase betweennow and 2035 by 3 degrees Fahrenheit with anincreasing frequency of heat wave days (100 vs.140)
• North-South transmission bottlenecks will remainunresolved
• Utility planners will maintain California load-generation balance (2004 to 2035)
• Water requirements are 1.1g/Kwh
4
CaliforniaCalifornia’’s Energy Sourcess Energy Sources
Electricity (2003)
• In-State 77.65%
– Natural Gas
33.39%
– Nuclear 12.87%
– Large Hydro
11.17%
– Coal 9.84%
– Renewable 10.39%
• Imports 22.35%
– PNW 8.06%
– DSW 14.28%

Panel 3: Strategic Response
4-30
5
California Service AreasCalifornia Service Areas
• Service areas
form a loosely-
connected
statewide entity
6
California Transmission SystemCalifornia Transmission System
•Bottlenecks exist in
the transmission
system ex. Path 15
•Transfer Limits
prevent unlimited
power flow from
south to north: a
stabilizing feature of
the system
Path 15
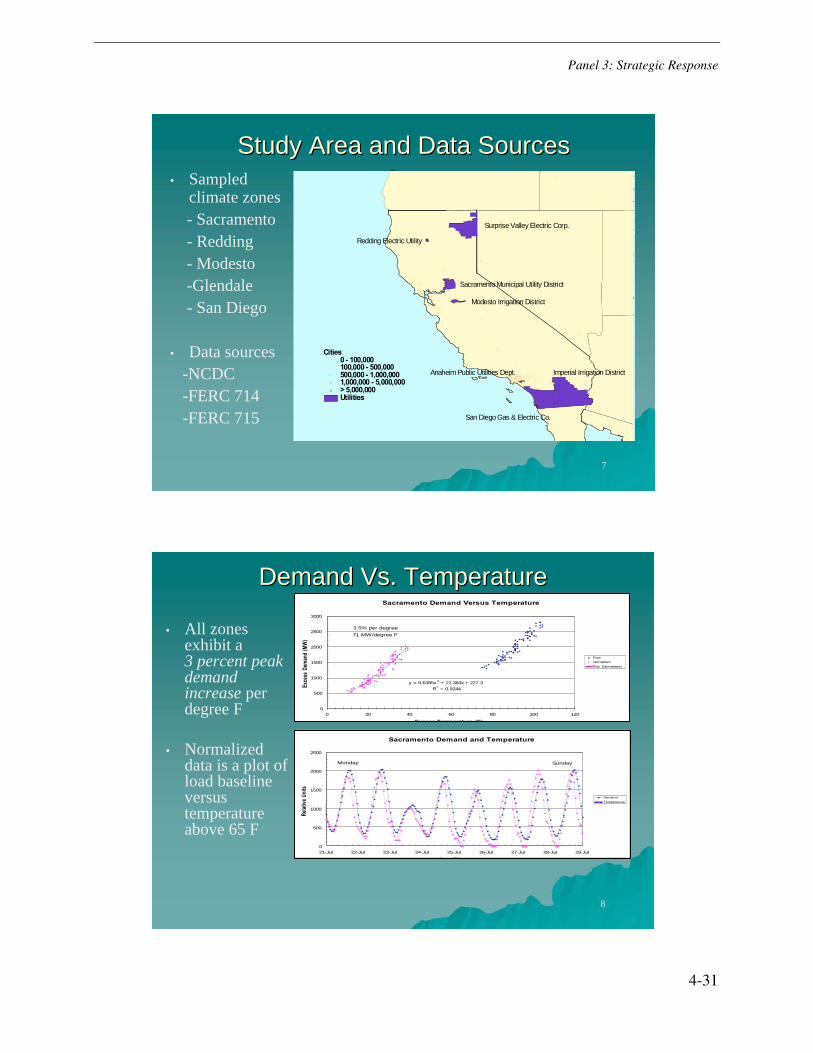
Panel 3: Strategic Response
4-31
7
Study Area and Data SourcesStudy Area and Data Sources
• Sampledclimate zones
- Sacramento
- Redding
- Modesto
-Glendale
- San Diego
• Data sources
-NCDC
-FERC 714
-FERC 715
#
##
#
#
#
#
#
#
##
#
#
#
#
#
#
##
#
###
# ### #
##
#
#
#
#
# #### #
##
#
# #
#### ##
##
# #
#
##
#
# ##
####
###
# ## ## # # ##
#
##
## #
##
###
#
#
# ##
#
#
##
###
# ## ## #
# # ##
###
# ###
##
# ##
#
###
##
##
### # #
# ##
#
# ##
#
#
#
##
##
## #
#
#
#
#
###
### #
#
#
##
##
## #
#
##
# ##
#
#
#
# #
#
#
#
#
#
## #
#
## #
#
#
#
#
#
##
#
### #
##
#
### #
# ## ## #
## ## ## #
## # # ### ## ## ## ### # ### # ##
## # ## # #### # ###### #
## ## # ##### #
## ## # #### ## ## #
## ## #### #
# ## # ## # # ### ##### ###
# ## ## # # ####
### ## ### ### # #### # ### #
#### #
## #####
## #### #
##
# ###
##
##
##
#
#
# ##
# ##
# #
# ##
# #
## ##
##
##
# ###
# #
#
Surprise Valley Electric Corp.
Sacramento Municipal Utility District
Modesto Irrigation District
Redding Electric Utility
San Diego Gas & Electric Co.
Imperial Irrigation DistrictAnaheim Public Utilities Dept.
Utilities
Cities# 0 - 100,000# 100,000 - 500,000# 500,000 - 1,000,000# 1,000,000 - 5,000,000# > 5,000,000
8
Demand Vs. TemperatureDemand Vs. Temperature
• All zonesexhibit a3 percent peakdemandincrease perdegree F
• Normalizeddata is a plot ofload baselineversustemperatureabove 65 F
Sacramento Demand Versus Temperature
y = 0.6385x2 + 21.383x + 227.3
R2 = 0.9244
0
500
1000
1500
2000
2500
3000
0 20 40 60 80 100 120
Excess Temperature (F)
Exc
ess
Dem
and
(MW
)
Raw
Normalized
Poly. (Normalized)
71 MW/degree F
3.5% per degree
Sacramento Demand and Temperature
0
500
1000
1500
2000
2500
21-Jul 22-Jul 23-Jul 24-Jul 25-Jul 26-Jul 27-Jul 28-Jul 29-Jul
D t /Ti
Rel
ativ
e U
nits
Demand
Temperature
Monday Sunday
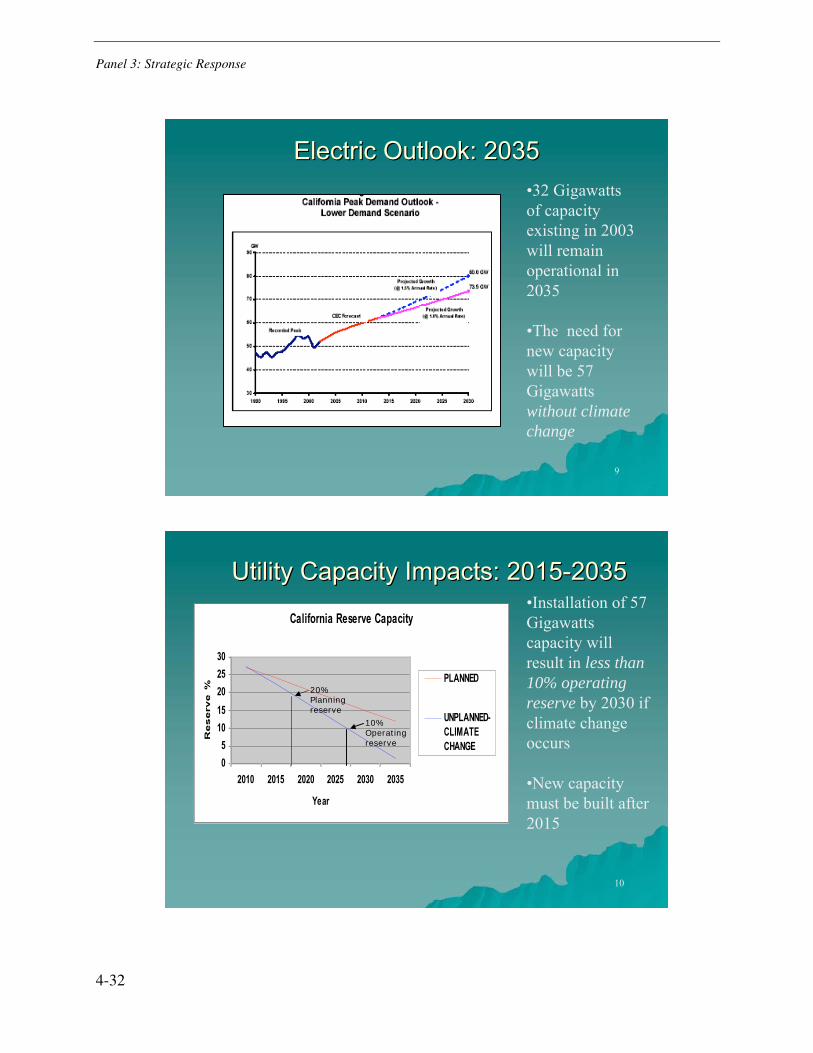
Panel 3: Strategic Response
4-32
9
Electric Outlook: 2035Electric Outlook: 2035•32 Gigawattsof capacityexisting in 2003will remainoperational in2035
•The need fornew capacitywill be 57Gigawattswithout climate
change
10
•Installation of 57Gigawattscapacity willresult in less than
10% operating
reserve by 2030 ifclimate changeoccurs
•New capacitymust be built after2015
California Reserve Capacity
05
1015202530
2010 2015 2020 2025 2030 2035
Year
Re
se
rve
%
PLANNED
UNPLANNED-CLIMATECHANGE
20%Planningreserve
10%Operatingreserve
Utility Capacity Impacts: 2015-2035Utility Capacity Impacts: 2015-2035
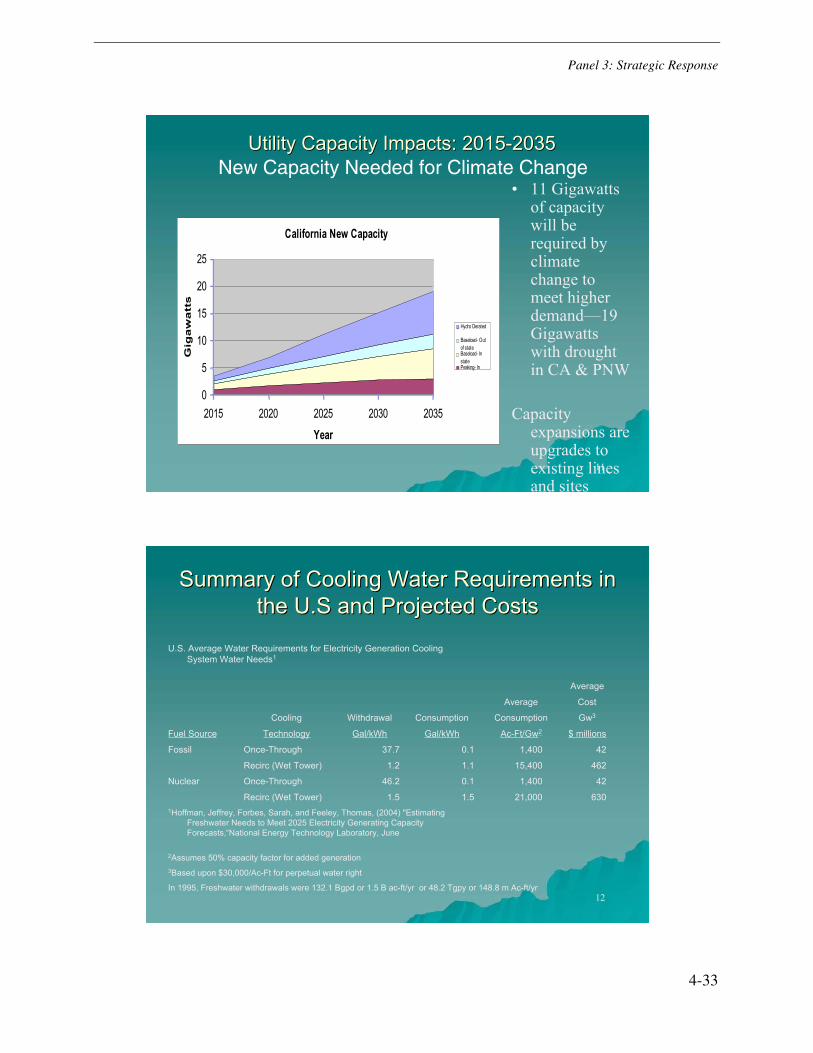
Panel 3: Strategic Response
4-33
11
Utility Capacity Impacts: 2015-2035Utility Capacity Impacts: 2015-2035
• 11 Gigawattsof capacitywill berequired byclimatechange tomeet higherdemand—19Gigawattswith droughtin CA & PNW
Capacityexpansions areupgrades toexisting linesand sites
California New Capacity
0
5
10
15
20
25
2015 2020 2025 2030 2035
Year
Gig
aw
att
s
Hydro Derated
Baseload- Outof stateBaseload- InstatePeaking- In
New Capacity Needed for Climate Change
12
Summary of Cooling Water Requirements inSummary of Cooling Water Requirements inthe U.S and Projected Coststhe U.S and Projected Costs
In 1995, Freshwater withdrawals were 132.1 Bgpd or 1.5 B ac-ft/yr or 48.2 Tgpy or 148.8 m Ac-ft/yr
3Based upon $30,000/Ac-Ft for perpetual water right
2Assumes 50% capacity factor for added generation
1Hoffman, Jeffrey, Forbes, Sarah, and Feeley, Thomas, (2004) "EstimatingFreshwater Needs to Meet 2025 Electricity Generating CapacityForecasts,“National Energy Technology Laboratory, June
630 21,0001.51.5Recirc (Wet Tower)
42 1,4000.146.2Once-ThroughNuclear
462 15,4001.11.2Recirc (Wet Tower)
42 1,4000.137.7Once-ThroughFossil
$ millionsAc-Ft/Gw2Gal/kWhGal/kWhTechnologyFuel Source
Gw3ConsumptionConsumptionWithdrawalCooling
CostAverage
Average
U.S. Average Water Requirements for Electricity Generation CoolingSystem Water Needs1
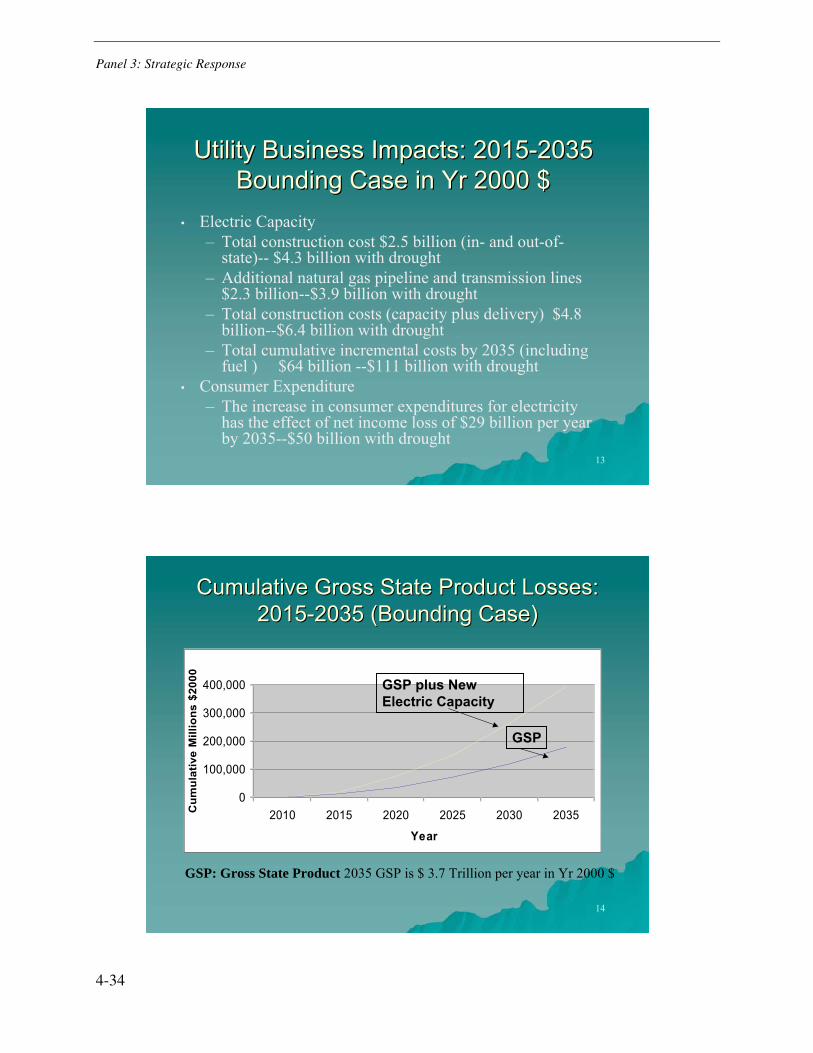
Panel 3: Strategic Response
4-34
13
Utility Business Impacts: 2015-2035Utility Business Impacts: 2015-2035Bounding Case in Yr 2000 $Bounding Case in Yr 2000 $
• Electric Capacity– Total construction cost $2.5 billion (in- and out-of-
state)-- $4.3 billion with drought– Additional natural gas pipeline and transmission lines
$2.3 billion--$3.9 billion with drought– Total construction costs (capacity plus delivery) $4.8
billion--$6.4 billion with drought– Total cumulative incremental costs by 2035 (including
fuel ) $64 billion --$111 billion with drought• Consumer Expenditure
– The increase in consumer expenditures for electricityhas the effect of net income loss of $29 billion per yearby 2035--$50 billion with drought
14
Cumulative Gross State Product Losses:Cumulative Gross State Product Losses:2015-2035 (Bounding Case)2015-2035 (Bounding Case)
0
100,000
200,000
300,000
400,000
2010 2015 2020 2025 2030 2035
Year
Cum
ulat
ive
Mill
ions
$20
00
GSP
GSP plus NewElectric Capacity
GSP: Gross State Product 2035 GSP is $ 3.7 Trillion per year in Yr 2000 $
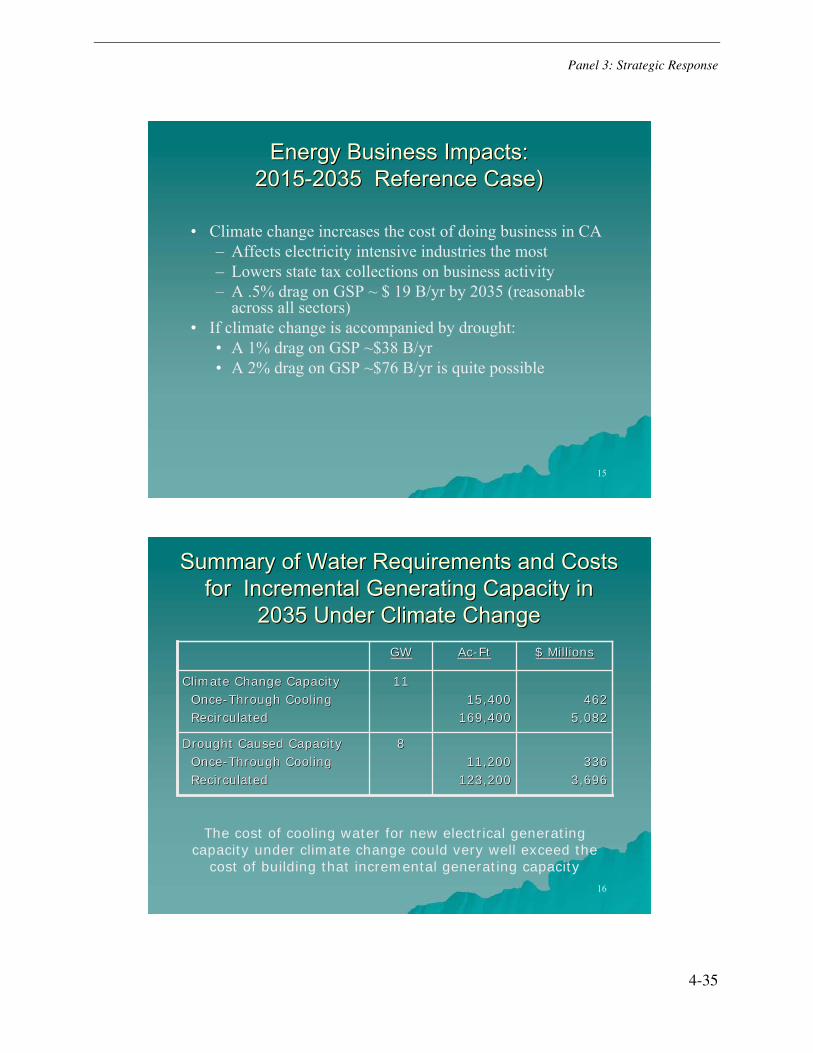
Panel 3: Strategic Response
4-35
15
Energy Business Impacts:Energy Business Impacts:2015-2035 Reference Case)2015-2035 Reference Case)
• Climate change increases the cost of doing business in CA– Affects electricity intensive industries the most– Lowers state tax collections on business activity– A .5% drag on GSP ~ $ 19 B/yr by 2035 (reasonable
across all sectors)• If climate change is accompanied by drought:
• A 1% drag on GSP ~$38 B/yr• A 2% drag on GSP ~$76 B/yr is quite possible
16
Summary of Water Requirements and CostsSummary of Water Requirements and Costsfor Incremental Generating Capacity infor Incremental Generating Capacity in
2035 Under Climate Change2035 Under Climate Change
336336
3,6963,696
11,20011,200
123,200123,200
88Drought Caused CapacityDrought Caused Capacity
Once-Through Cooling Once-Through Cooling
Recirculated Recirculated
462462
5,0825,082
15,40015,400
169,400169,400
1111Climate Change CapacityClimate Change Capacity
Once-Through Cooling Once-Through Cooling
Recirculated Recirculated
$ Millions$ MillionsAc-FtAc-FtGWGW
The cost of cooling water for new electrical generatingcapacity under climate change could very well exceed the
cost of building that incremental generating capacity

Panel 3: Strategic Response
4-36
17
Conclusions Energy, Water &Conclusions Energy, Water &Economic ImpactsEconomic Impacts
• Climate change resulting in higher ambient temperatures andhigher rainfall variability will force utilities to de-rate existinghydropower generation and accelerate new generation andtransmission capacity by 2010 instead of 2022- Additional 19Gigawatts of capacity will likely be needed by 2035
• Required 20-year construction costs for new capacity is on theorder of $5 billion and the water required for cooling thatcapacity is likely to be equivalent and perhaps higher due toincreasing demand for water by in-migrating population
• Climate change will cause a significant economic drag on stateGSP from .5 to 2% per year
18
Regulatory & Market FrameworkRegulatory & Market Framework
If electricity markets in CA remain heavily regulatedIf electricity markets in CA remain heavily regulated–– Costs of new capacity will be averaged in with existing capacityCosts of new capacity will be averaged in with existing capacity
(consistent with study assumptions)(consistent with study assumptions)
–– Full marginal cost price signals do not reach customersFull marginal cost price signals do not reach customers
–– Novel solutions such as demand reduction not permittedNovel solutions such as demand reduction not permitted
–– Effects of climate variability exacerbatedEffects of climate variability exacerbated
There are many opportunities to apply LANL electricalThere are many opportunities to apply LANL electricalsystem modeling capabilities, economics and financesystem modeling capabilities, economics and financeexpertise to mitigate these problemsexpertise to mitigate these problems
If water markets fail to develop in CAIf water markets fail to develop in CA–– Water will be wastedWater will be wasted
–– Energy will be wastedEnergy will be wasted
To the detriment of the environmentTo the detriment of the environment
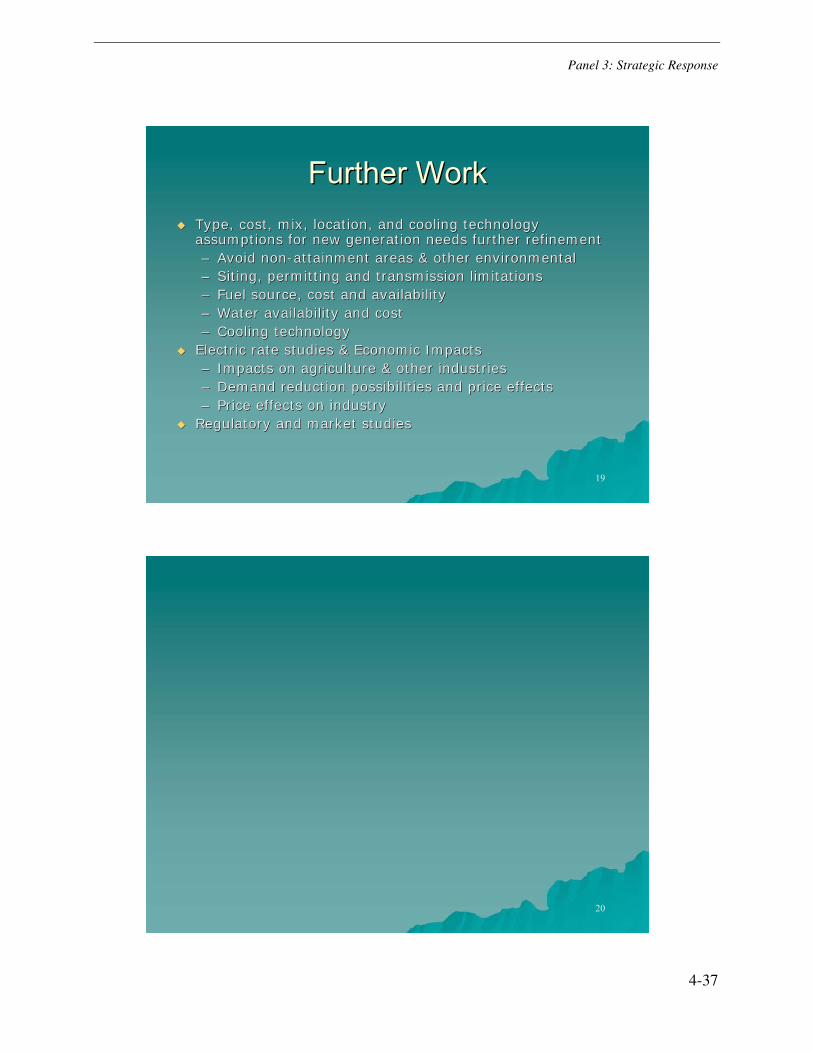
Panel 3: Strategic Response
4-37
19
Further WorkFurther WorkType, cost, mix, location, and cooling technologyType, cost, mix, location, and cooling technologyassumptions for new generation needs further refinementassumptions for new generation needs further refinement
–– Avoid non-attainment areas & other environmentalAvoid non-attainment areas & other environmental
–– Siting, permitting and transmission limitationsSiting, permitting and transmission limitations
–– Fuel source, cost and availabilityFuel source, cost and availability
–– Water availability and costWater availability and cost
–– Cooling technologyCooling technology
Electric rate studies & Economic ImpactsElectric rate studies & Economic Impacts
–– Impacts on agriculture & other industriesImpacts on agriculture & other industries
–– Demand reduction possibilities and price effectsDemand reduction possibilities and price effects
–– Price effects on industryPrice effects on industry
Regulatory and market studiesRegulatory and market studies
20

5-1
5 PANEL 4: NEXT STEPS FOR RESEARCH & DEVELOPMENT AND RELIABILITY ASSESSMENT
Summary of the NERC/PSERC/EPRI Workshop on Reliability and Climate
Ward Jewell, Professor, University of Wichita
The workshop’s final panel was a discussion of further R&D and reliability assessment needs. To begin the final session, Ward Jewell of PSERC provided the following summary of industry needs related to climate and reliability.
To be able to evaluate and mitigate how variability and extremes of weather will affect system reliability, accurate regional climate and weather models, incorporating the expected effects of climate change, are needed. The models need to accurately predict extremes and variability over long- and short-term planning horizons. They must apply to ISO/RTO-sized and utility-sized planning regions. Models should address the following issues:
Temperature
• Averages
• Extremes
• Heat and cold waves
• Day vs. night
Precipitation
• Rainfall
• Snow
• Ice
• Runoff
Wind
• Averages
• Time distributions
• Extremes
• Geographical changes
Panel 4: Next Steps for Research & Development and Reliability Assessment
5-2
Extreme weather
• Hurricanes, tornadoes, ice storms (frequency and magnitude)
Wildfires
In addition to the conventional uses of weather and climate models in system planning, the models should be used to forecast changes in system loads:
• Cooling and heating loads
• Changes, caused by climate change, to industries
• Population shifts due to industry changes or water availability
Other load shifts, such as an increase in electric vehicles resulting from climate change regulations on transportation, should also be included in load forecasts.
The regional climate models and resulting load forecasts should then be used for resource assessments:
• Availability of the renewable resources for wind, hydro, and solar generation
• Transmission congestion and adequacy for shifting loads and resources
• Equipment stress due to increased temperatures, increased loads, and reduced wind-induced equipment cooling
Resource assessments should include limits on resources resulting from climate change regulations.
Models, load forecasts, and resource assessments should then be combined into risk assessments for the system:
• Blackouts
• Equipment failures and maintenance
• Uncertainty in forecasts and regulations
• Availability of technologies (e.g. for climate change mitigation or renewable generation)
• Time period of changes vs. planning horizons
Risk assessment should then lead to risk reduction through planning for
• Resources
• Transmission
• System Survivability
• System Restoration (self-healing systems)
Panel 4: Next Steps for Research & Development and Reliability Assessment
5-3
Finally, these must all be brought together into comprehensive system simulations encompassing all the factors. Accurate, time-varying regional climate change forecasts, with identified and quantified uncertainties, coupled with full ac simulations of the power system, will be the basis of these simulations. The simulations must consider all possible resources and loads in order to minimize risk to the grid.
Discussion
Moderator Tom Burgess, FirstEnergy
The final session of the workshop was a discussion of the major learnings and issues, categorized by research areas. The discussion was unstructured and the following notes follow this course.
The increased penetration of Electric Vehicles (EVs) including plug-in hybrids in 5 to 10 years may have strong impacts on system operations and motivate changes in planning processes. There may be new limitations placed on resources due to climate change regulation. Fuel shifts and resource shifts affect load flows. This would need to be accounted for in transmission planning exercises.
How will renewables be integrated? Optimal Power Flow (OPF) studies typically use hourly time steps, but ramping occurs on much finer time scales. Studies conducted at PNNL, and PNW are looking at this new requirement.
Survivability and restoration are the main strategic issues to consider when renewing business decision-making processes.
Due to the broad effect of climate, there will me more need to coordinate study results and capabilities (DOE, LANL, JCSP). Active sharing of experiences and learning is an effective, low-cost response.
Important events are defined by the combination of probability and impact. Impacts occurring within planning horizons of 30 to 40 years may significantly affect decisions. Both probability and impact assessments require better methods, tools, and understanding. Risk appetite is not well known for different entities and at aggregated levels. How can important issues best be addressed in the absence of this information, or how can risk appetites be expressed effectively to allow the proper combination of individual and aggregated responses.
Cost impacts still need to be assessed and effectively communicated. This will help prioritize issues and potential solutions and responses. Critical infrastructure assessments can also help guide impact assessments.
Cascading effects are at tails of historic distributions and not well addressed by statistical methods. What methods are appropriate? When widespread impacts occur for one system, like transportation, interactions with other critical systems can lead to a cascade of system failures.
Planning for extreme events and return time of these events will strongly affect strategies and how recovery is managed. LANL is using agent simulations to allow large number of cases to be explored, including rare events in the tails of typical distributions.
Panel 4: Next Steps for Research & Development and Reliability Assessment
5-4
Long-term, slow change is important too, despite a tendency of the general populace to ignore the change. How do you rationalize additional expenditures now for subtle, long-term changes? National leadership is important to have coordinated efforts, rather than piece-meal efforts. There is a basis for the socialization of costs for public benefit.
Aging infrastructure with replacement cycles of 40 to 50 years is offering a new opportunity to change design bases to proactively design for the future.
There is increased uncertainty, but we lack tools to communicate how this uncertainty affects plans. Definitive benchmarks are needed that relate quantifiable climate changes with system impacts. Part of this communication challenge is to determine what criteria should be measured to assess increasing uncertainty.
Advanced meters are coming into the system. By assigning differential pricing for particular loads (at the appliance level) planners could create a system that has “differential reliability” for demand. This may mitigate some climate effects.
One of the tools to deal with uncertainty is flexibility. What research is available to show how plans become more flexible under increasing uncertainty having more importance? One example is that the EGEAS tool represents uncertainty in operations and can be used to address particular aspects of this problem. Reserve for ramping is sometimes combined with energy costs. Another tool is diversification. Strategies that reduce over-dependence on particular fuels make good sense as a hedge against supply uncertainties.
Operational variations of system frequency can allow for more flexibility. Interruptible rates and calling for interruptions adds flexibility. These are examples of existing capabilities that may be underutilized. Demand-side controlled load and price signaling can contribute to reliability when used properly. Average energy consumers experience little impact from these types of decisions.
The intensity of icing, lightning, rainfall, and winds are expected to increase. What does it take technically to “climate harden” a system?
Next Steps
• Coordinate efforts with research areas like smart grid, wind integration, and demand response.
• Identify comparative advantages of each research area and allocate responsibilities for a coordinated response.
• The NERC Reliability Assessment Subcommittee (RAS) has regional representatives from NERC Regions, ISOs, IOUs, etc. RAS is interested in what Phase 2 of this EPRI project looks like.
• Three agreeable terms: increasing transparency, harmonization, and greater understanding/foundation for reliability impacts of climate change to make sound long-range decisions.
6-1
6 SUMMARY
Being a new area of research for EPRI and the electric industry more generally, the success of this project was not assured. The project team endeavored to proceed from a dead stop to cruising speed. Fortunately, much work has been done outside of the electric industry, like that by the U.S. Department of Transportation, and inside the industry, like that at Hydro Quebec. This set the stage for a diverse and complete agenda.
The meeting enjoyed excellent participation from a wide variety of people with different backgrounds and thus different experiences and perspectives on the potential impacts of changing climate on power system reliability. Participants came from academia, government, research institutes, consulting organizations, and electric utilities. As a result there was much interesting and enjoyable discussion, making the meeting a success in terms of interest and discussion.
Based on the participants’ and organizers’ feedback, the most fruitful avenues for further work in this area are the following:
1. Explore data collection and analysis methods to measure impacts and trends.
2. Develop methods and benchmarks that quantify the relation between climate change and system impacts.
3. Extend existing research on impacts with reliability, cost, and risk assessments.
4. Develop a decision-making framework to balance reliability, costs, benefits, and risks of responses such as survivability and restoration. Include measures of the value of increased flexibility compared to its cost.
5. Identify likely macroeconomic shifts over the long term affecting planning.
6. Integrate and coordinate efforts of this group with others doing work in this area.
7. Survey methods for stress testing of designs to account for future extreme weather events.
Next are three sections describing the relative roles of PSERC, NERC, and EPRI, along with their activities in the coming year related to this Technical Summit.
PSERC
PSERC is soliciting and evaluating proposals from academic research institutions for long-term research to models that can accurately predict extremes and variability in weather and resulting power system conditions for planning purposes. These models can then be used in a variety of studies, such as resource adequacy, transmission planning, system design basis adjustments,
Summary
6-2
equipment design, and equipment aging. PSERC envisions a toolbox of planning models that then contribute to an overall risk management, wherein, for instance, survivability and recovery strategies can be balanced. For more details on their recommended research, see the section in Chapter 5 titled “Summary of the NERC/PSERC/EPRI Workshop on Reliability and Climate.”
NERC
NERC has many activities under way focused on its mandate to ensure power system reliability. The Planning Committee work is most relevant to the EPRI project and following are a few of the projects, either under way or in development, related to the reliability impacts of climate change.
Reliability Metrics Working Group: Reliability Measurement Framework and Indicators
The NERC Reliability Metrics Working Group (LFWG) has a project to devise measures of Reliability Adequacy and operational reliability, which will eventually lead to data collection and a reliability dashboard. The metrics and data collection by this group is intended to measure system reliability against benchmark performance, but can also help in the assessment of long-term trends, once a sufficient history has been established.
Load Forecasting Working Group: Temperature Impacts on Reliability
The NERC Load Forecasting Working Group (LFWG) has a project to look at the impact of extreme temperature events (hot or cold) on resource availability and performance. They are developing an issue list and plan to produce a white paper in 2009.
Special Assessment: Reliability Impacts of Climate Change Initiatives
NERC recognizes that federal, state, and provincial CO2 legislation is pending throughout North America and proposed changes in electric power regulation can have a significant effect on reliability. NERC proposes to conduct a special reliability assessment to evaluate a variety of CO2 legislative scenarios and their impact on bulk power system reliability. This project involves:
• Developing credible scenarios, and
• Ensuring that the project addresses fuel switching, transmission requirements, demand-side resources, and additional reliability considerations as they arise.
While the proposed NERC project lies outside the scope of EPRI’s work related to the Technical Summit, there is very likely to be synergies in the impact assessment and risk mitigation strategies.

Summary
6-3
EPRI
EPRI plans to provide strategic information to assess the implications of climate change on transmission systems and develop risk management strategies. This is intended to help the electric power industry to improve its asset risk management and improve reliability modeling, making performance more reliable. This also helps improve the life expectancy of major transmission components through enhanced loading practices, reduce CO2 generation through true integrated resource planning, and improve load forecasting and reliability through transmission and feeder load relief.
As power systems become more constrained with increasing load growth and demand, concerns about the impact of frequent and extreme weather conditions—both hot and cold—increase. This project builds on work in 2008 related to the impact of extreme weather conditions on component failures and on forecasting methods. The 2009 project will address the effects of extreme weather conditions on design criteria, required equipment capabilities, challenges in maintenance and required strategies to accommodate them, and the economic implications of maintaining reliability at acceptable values. Since these may require changes in well-established paradigms, work will focus on minimizing disruption and economic impact.
Based on results of 2008 work, this project will address changes in the following areas:
• Power system designs that accommodate stresses of extreme weather conditions, including higher flows and possible equipment failures.
• Changes in equipment capabilities to be dictated by higher load factors and challenging load shapes.
• Changes in maintenance strategies, which are based on knowing the risks involved and using that knowledge to establish priorities and strategies for successful and economical maintenance management.
EPRI, PSERC, and NERC plan to coordinate their current research and development agendas, because in the long run this coordination is a more effective use of resources and capabilities. These organizations also seek to increase their discussion and collaboration with other organizations like the U.S. government (Department of Energy, Department of Transportation, and National Oceanographic and Atmospheric Association) and related international efforts. While pressing action is not recommended, the issues are timely and require continued R&D focus to ensure that the electricity industry keeps track of the situation, is aware of the potential for changes as they occur, and retains the option to make adjustments at a welcome pace.

7-1
7 REFERENCES
[1] NERC (2008). “2008 Long-Term Resource Adequacy,” North American Electricity Reliability Corporation. http://www.nerc.com/files/LTRA2008.pdf
[2] NERC (2008). “Reliability Impacts of Climate Change Initiatives”, North American Electricity Reliability Corporation http://www.nerc.com/files/2008-Climate-Initiatives-Report.pdf
[3] DOE (2008). 20% Wind Energy by 2030 Increasing Wind Energy’s Contribution to U.S. Electricity Supply, DOE/GO-102008-2567, July 2008 http://www.20percentwind.org/20percent_wind_energy_report_revOct08.pdf
[4] Overbye, T., et al (2007). “The Electric Power Industry and Climate Change: Power Systems Research Possibilities,” PSERC Publication 07-16 http://www.pserc.org/ecow/get/publicatio/reports/2007report/pserc_climate_change_final_rpt_june07.pdf
[5] BPA (2006). Energy Efficiency Technology Road Map, Bonneville Power Authority. http://www.bpa.gov/corporate/business/innovation/docs/2006/RM-06_EnergyEfficiency-Final.pdf
[6] BPA (2006). Transmission Technology Road Map, Bonneville Power Authority. http://www.bpa.gov/corporate/business/innovation/docs/2006/RM-06_Transmission.pdf
[7] BPA (2007). Physical Security Technology Road Map, Bonneville Power Authority. http://www.bpa.gov/corporate/business/innovation/docs/RFP_739/RM-06_PhysicalSecurityFinal.pdf
[8] BPA (2008). Power Services Technology Road Map, Bonneville Power Authority. http://www.bpa.gov/corporate/business/innovation/docs/2008/RM-08_HydroOperations.pdf
[9] BPA (2008). Renewable Energy Technology Road Map, Bonneville Power Authority. http://www.bpa.gov/corporate/business/innovation/docs/2008/RM-08_Renewables_Updated.pdf
[10] CCSP (2008). Weather and Climate Extremes in a Changing Climate. Regions of Focus: North America, Hawaii, Caribbean, and U.S. Pacific Islands. A Report by the U.S. Climate Change Science Program and the Subcommittee on Global Change Research. [Thomas R. Karl, Gerald A. Meehl, Christopher D. Miller, Susan J. Hassol, Anne M.
References
7-2
Waple, and William L. Murray (eds.)]. http://downloads.climatescience.gov/sap/sap3-3/sap3-3-final-all.pdf
[11] Gubel, E.J. (2004). Statistics of Extremes, Dover Publications. ISBN-10: 0486436047.
[12] US DOT (2008) Impacts of Climate Change and Variability on Transportation Systems and Infrastructure: Gulf Coast Study, Phase I http://www.climatescience.gov/Library/sap/sap4-7/final-report/sap4-7-final-all.pdf
[13] CALTrans (2007). Bridge Inspection Questions and Answers, California Department of Transportation http://www.dot.ca.gov/Documents/Inspection_and_Rating_Q_and_A_Final2.pdf
[14] The Homeland Infrastructure Foundation-Level Data (HIFLD) Working Group http://www.hifldwg.org/
[15] EPRI (2007). EGEAS: Electric Generation Expansion Analysis System, Version 9.02B. Product Identifier 1011221.
[16] Midwest ISO (2008). Joint Coordinated Study Plan Documents website www.jcspstudy.org
[17] NERC MMWG (2007). NERC Multi-regional Model Working Group FTP site ftp://ftp.nerc.com/pub/sys/all_updl/pc/mmwg/
[18] CEC (2006). Committee Workshop on the July 2006 California Heat Storm http://www.energy.ca.gov/2006_summer_outlook/documents/index.html
[19] NERC LFWG (2008). Load Forecasting Survey and Recommendations ftp://ftp.nerc.com/pub/sys/all_updl/docs/pubs/NERC_Load_Forecasting_Survey_LFWG_Report_111907.pdf
[20] Daniel McCarthy and Joseph Schaefer (2004). Tornado Trends over the Past Thirty Years, 14th Conference on Applied Climatology. http://www.spc.noaa.gov/publications/mccarthy/tor30yrs.pdf
[21] William H. Bartley (2002). An Analysis of Transformer Failures, Part 1 — 1988 through 1997, The Locomotive, http://www.hsb.com/thelocomotive/Story/FullStory/ST-FS-LOTRANS1.html
[22] William H. Bartley (2002). An Analysis of Transformer Failures, Part 2 — Causes, Prevention and Maximum Service Life http://www.hsb.com/thelocomotive/Story/FullStory/ST-FS-LOTRANS2.html
[23] William H. Bartley (2004). An Analysis of International Transformer Failures, http://www.hsb.com/thelocomotive/Story/FullStory/ST-FS-LOTRAN04.html
[24] William H. Bartley (2004). An International Analysis of Transformer Failures, Part 2 http://www.hsb.com/thelocomotive/Story/FullStory/ST-FS-LOTRAN04-2.html
References
7-3
[25] IDF (2008). Energy and Utilities Summit: The Role of Intelligent Technologies in Addressing Climate Change Conference, http://www.idc.com/getdoc.jsp?containerId=IDC_P15578
[26] IPCC (2007). Climate Change 2007: The Physical Science Basis. Contribution of Working Group I to the Fourth Assessment Report of the Intergovernmental Panel on Climate Change [Solomon, S., D. Qin, M. Manning, Z. Chen, M. Marquis, K.B. Avery, M. Tignor and H.L. Miller (eds.)]. Cambridge University Press, Cambridge, United Kingdom and New York, NY, USA. http://www.gcrio.org/ipcc/ar4/wg1/faq/ar4wg1_FAQs_Full.pdf
[27] Live Science (2008). Top Ten Tornadoes http://www.livescience.com/environment/top10_killer_tornadoes.html
[28] US National Academy of Sciences (2008). Potential Impacts of Climate Change on U.S. Transportation: Special Report 290, Committee on Climate Change and U.S. Transportation, National Research Council http://www.nap.edu/catalog/12179.html
[29] New York AG (2000). Con Edison's July 1999 electric service outages: a report to the people of the State of New York from the Office of the Attorney General, LAW 119-4 CONEJ 200-6225 http://nysl.nysed.gov/uhtbin/cgisirsi/PEVY7ol4cc/NYSL/258370020/523/5648
[30] Thomas E. Croley II (2001). Climate-Biased Storm-Frequency Estimation, http://www.glerl.noaa.gov/pubs/fulltext/2001/20010002.pdf
[31] J. L. Putnam (2005). Typical Approach: Electric Utility Distribution Planning California Energy Commission. http://www.energy.ca.gov/distgen_oii/documents/2005-04-29_workshop/2005-04-22_PLANNING.PDF
[32] Jim Titus (2002). Does Sea Level Rise Matter to Transportation Along the Atlantic Coast? USDOT Workshop on the Potential Impacts of Climate Change on Transportation http://www.epa.gov/climatechange/effects/downloads/Transportation_Paper.pdf
[33] NARCCAP (2008). North American Regional Climate Change Assessment Program Web Site http://www.narccap.ucar.edu/
[34] TEPPC (2008). Transmission Expansion Planning Policy Committee Web Site http://www.wecc.biz/index.php?module=pagesetter&func=viewpub&tid=4&pid=14
[35] K. Coughlin and C. Goldman (2008). Physical Impacts of Climate Change on the Western US Electricity System: A Scoping Study, Ernest Orlando Lawrence Berkeley National Laboratory, Report LBNL-1249E. http://eetd.lbl.gov/ea/EMS/reports/lbnl-1249e.pdf

A-1
A APPENDIX: DISCUSSION OF RELIABILITY TRENDS
Introduction
In June 2008, EPRI’s Robert Entriken conducted a series of discussions with EPRI project managers on the potential impacts of extreme weather events on power system reliability.
Individual discussions addressed the following areas:
• Equipment failure data collection
• Reliability metrics
• Asset management
• Transmission substations
• Nuclear power
• Transmission systems
• Distribution systems
• Transmission and increased power flow
Following are notes from these discussions.
Equipment Failure Data Collection
Attendees: Nick Abi Samra, Robert Entriken (EPRI)
Agenda: Equipment Failures, Data Collection, And Physical Attributes
Heat storms in the Western US led to failures in many pole-mounted transformers. Nick performed a study of this type of event. There have been extreme events with snow and ice in the East Coast and Canada, but it is difficult to define what is normal.
Are there trends in reliability and weather? To assess this, we would need data going back at least three (3) years extending to five (5) or seven (7) years. Transformers tend to be better documented. We would need to know size, vintage, manufacturer, voltage, MVAR rating, etc.
Appendix: Discussion of Reliability Trends
A-2
EPRI experts in this area are Bhavin Desai, Luke van der Zel, Andrew Phillips, Paul Zayicek and Matt Olearczyk. Bhavin is working on a cable database, where most failures occur under elevated load conditions.
Partners for the distribution reliability aspects could be NRECA, NARUC, and PSERC. International partners could be EdF, PPGC, Italy, and South Africa.
Reliability Metrics
Attendees: Ram Adapa, Robert Entriken (EPRI)
Agenda: TADS, Utility Benchmarking Study
The NERC Transmission Availability Data System (TADS) is defined and has just started collecting data this year. Jason Shaver has been involved in this project and is the chair of the Reliability Metrics Working Group (RMWG).
There is an EPRI project called the Utility Benchmarking Study. The contractor is Gregg Spindler1, a one-main company. They have 10 to 15 years worth of data.
TVA has conducted two benchmarking studies. Gary Bulloch, Roger Thorn, and Scott Clemons2 are involved in these studies.
Asset Management
Paul Myrda, Robert Entriken (EPRI)
Agenda: Design Basis, Distribution Equipment, and Transmission Equipment
Extreme weather happens routinely in areas with electric power systems. There are power systems operating in extreme cold and ice and wind. There are systems operated under heavy lightning conditions. There are systems with high heat, whether humid or dry.
The key determinant of reliability under extreme conditions is the “design basis”, which takes the form of a standard catalog of acceptable equipment to be procured and specifications for their use.
The opportunity for a contribution, under this thesis, is to help regions under changing climate conditions to learn from the design and operational experience of regions where extreme events are part of routine design and operations.
1 2008 SGS Transmission Reliability Benchmarking Study: http://www.sgsstat.com/StudyInfo.html
Appendix: Discussion of Reliability Trends
A-3
Another fallout of this thesis is to include the design basis within the collected data when looking for trends. One manifestation of a trend could be that there may be a pattern of evolution of regional design bases as a result of increased risk of extreme events.
Distribution equipment to look for effects of extreme events could be 1) transformers affected by heat and 2) poles affected by heat, humidity, water table, wind. Data should include fields for service life, history of maintenance, installation date, loading, customer class being served, load factor, etc.
Transmission equipment parameters to collect would be: design spec, span length, sag, clearance, how often sag/thermal limits are hit, and presence of weak links.
Transmission Substations
Attendees: Luke van der Zel, Robert Entriken (EPRI)
Agenda: Thinner Margins, Transmission Substations, and Industry Database
Cold weather can liquefy SF6, leading to failures of circuit breakers. Hot weather affects transformers if the cooling system is stressed, inadequate, or underpowered. The main effect of heat storms is to reduce the lifetime of equipment. So, an event may not have an immediate, obvious effect on reliability. In the follow-up period the rate of failure can be observed to increase, but it will take time to establish that statistic.
High winds could damage porcelain insulators. Lightning affects transformers and breakers (which are a commodity). The EPRI Industry Database (IDB) project has transformer failure data. Wayne Johnson in the Nuclear division could have additional data regarding transformer events at nuclear plants.
Nuclear Power
Attendees: Christine King, Robert Entriken (EPRI)
Agenda: Nuclear Reliability Monitoring
Rick Easterling has a program and staff working on event databases, and the NRC has on-line databases: See event notification report. For instance, there was a tornado event at Davis-Besse Nuclear Power Station in 1998. INPO has operating experience. Tracy Wilson is a reference.
Transmission Systems
Attendees: John Chan, Robert Entriken (EPRI)
Agenda: Icing and Wind Impacts, Other Contacts, Design versus Recovery Balance, Extreme Weather Zones
Appendix: Discussion of Reliability Trends
A-4
Great Northern utilities have long experience with icing and strong winds. The icing is not much of an issue, since design can largely avoid outages. Winds occur just below the strength of a tornado (130 km/hr). Tip Godwin of the US Commission on High Winds is a good contact for further information.
Often the solution for adapting to extreme weather impacts is to find the right balance between up-front investments to build a robust system and back-end investments to improve the restoration process. For instance, easy access to spare parts and other important maintenance resources can be a cost-effective alternative to system reinforcements, while maintaining certain levels of reliability. The access to maintenance resources can include agreements of mutual support among regional utilities.
Detailed geographic knowledge of weather is useful for conducting studies of weather impacts. Often, local regions are more susceptible to extreme impacts and should garner special attention and treatment. This can be an effective aspect of allocating scarce resources.
Distribution Systems
Attendees: Matt Olearczyk, Robert Entriken (EPRI)
Agenda: Planning Perspective, Likely Data Sources
Distribution planning is the point at which extreme weather events affect utility decision-making. The main driver in distribution planning is the forecast of load growth and the result is a set of criteria for operation of the distribution system. The planning horizon could be using criteria of 1-in-10, 1-in-50, 1-in-100 year equipment failure, or some similar measure. These criteria depend on the expected lifetime of the equipment and the current expectations with respect to the operating environment. Loading and weather events are large factors of the operating environment. Ultimately, the expected loading and weather impacts help define specifications of equipment.
Often the expectations of future weather impacts are based on historic information, and this is valid to the extent that future weather is like past weather. Under a trend of changing weather, this method can be cause to update distribution-planning methodologies.
Likely organizations to have data to contribute to a trend analysis are ConEd, NE Utilities, Southern Co, KCPL, Exelon, and PSE&G. Matt recommends speaking to Tom Short for further information on this subject.
Transmission Substations
Attendees: Bhavin Desai, Robert Entriken (EPRI)
Agenda: Equipment Demographics, Time Resolution, and Loading Information
Appendix: Discussion of Reliability Trends
A-5
The Industry Database (IDB) project’s vision is to document the demographics of transmission system equipment for the purpose of estimating failure rates. These failure-rate estimates then are used as input for further analysis. Ratings are assigned to equipment families for various design, operations, and maintenance purposes. Equipment is studied for the following purposes:
• Transformers for replacement.
• Circuit breakers for cost effective management.
• Relays and switches for design
• Distribution transformers for design
Time resolution of event data is important in determining the fit-for-purpose of the data. For instance, the transformer database has time resolution greater than hours, which means that it may be difficult to correlate weather and reliability using this database. See [1] for the data model used in the transformer database. This database has information from 1974 to today, including loading and operating data.
It is important to know the loading and weather of the given day. Bernie Neenan is doing a project on Dynamic Thermal Circuit Rating that could help with trend analysis.
EPRI’s Reliability and System Integrity Task Forces discuss reliability trends.
References
[1] Equipment Performance Database with Common Information Model (CIM) Data Models and Performance Data for Transformers. EPRI, Palo Alto, CA: 2005. 1010592.
Transmission and Increased Power Flow
Attendees: Andrew Philips, Robert Entriken (EPRI)
Agenda: Transmission and Increased Power Flow, Lightning, Contamination, Tighter Margins, Heat Impacts
The EPRI project on Transmission and Increased Power Flow can be a good source of information on weather impacts. Bernie Claremont has been conducting studies on transmission line ratings and could have information about trends in line ratings and methods.
Lightning can affect reliability. Having a map of lightning versus system performance could show a trend over time. Weather and lightning are dominated by the 11-year solar cycle. Lightning in drought conditions causes wildfires.
When extended heat and drought hit a region not accustomed to this, contaminating dust can build up on conductors. Changes in design basis may be called for in areas newly experiencing drought.

Appendix: Discussion of Reliability Trends
A-6
Tighter operating margins are occurring throughout the year, making maintenance scheduling more difficult. Extreme heat during traditional maintenance periods can impact the hours that work crews can work.
Dampers are placed on lines as part of design criteria. They can reduce galloping under icing conditions.

Electric Power Research Institute 3420 Hillview Avenue, Palo Alto, California 94304-1338 • PO Box 10412, Palo Alto, California 94303-0813 USA
800.313.3774 • 650.855.2121 • [email protected] • www.epri.com
The Electric Power Research Institute (EPRI), with major
locations in Palo Alto, California; Charlotte, North Carolina; and
Knoxville, Tennessee, was established in 1973 as an independent,
nonprofit center for public interest energy and environmental
research. EPRI brings together members, participants, the Institute’s
scientists and engineers, and other leading experts to work
collaboratively on solutions to the challenges of electric power. These
solutions span nearly every area of electricity generation, delivery,
and use, including health, safety, and environment. EPRI’s members
represent over 90% of the electricity generated in the United States.
International participation represents nearly 15% of EPRI’s total
research, development, and demonstration program.
Together...Shaping the Future of Electricity
© 2008 Electric Power Research Institute (EPRI), Inc. All rights reserved. Electric Power Research Institute, EPRI, and TOGETHER...SHAPING THE FUTURE OF ELECTRICITY are registered service marks of the Electric Power Research Institute, Inc.
Printed on recycled paper in the United States of America
Electric Power Research Institute 3420 Hillview Avenue, Palo Alto, California 94304-1338 • PO Box 10412, Palo Alto, California 94303-0813 USA
800.313.3774 • 650.855.2121 • [email protected] • www.epri.com
Program:
Efficient Transmission and Distribution Systems for a Carbon
Constrained World
1016095