jorge soares - rilem 2016 - 08-06-2016 · 1981 flexible pavement design method review (official)...
TRANSCRIPT

Workshop: New approaches to address pavement failure more realistically in asphaltic pavement design methods
… to promote a discussion about different approaches to address pavement failure, primarily cracking, in design methods.
Jorge Soares & Michael Wistuba
June 8th, 2016
Pavementdesign:past,present,future,whereisthecrack?byDr.LaurentPorot
(TheNetherlands)
Germandesignandmanagementapproachesaddressingasphaltpavementcracking,
byDr.MichaelWistuba(Germany)
FaGguecrackingwithinthenewmechanisGc-empiricalpavementdesignmethod
inBrazil,byDr.JorgeSoares(Brazil)
RecentDevelopmentsinAcceleratedPavementTesGng(APT)asaPavementDesign
ToolinCostaRica,byDr.LuisLoria-Salazar(CostaRica)
Considera*onsofuse
Que
stfo
rfund
amen
talund
erstan
ding
Edison
PasteurBohr
Pasteur’s Quadrant Good Science, Well Appplied

Fatigue cracking prediction within the new M-E pavement design guide
in Brazil
Workshop: New approaches to address pavement failure more realistically in asphaltic pavement design methods
Jorge Soares Luis Nascimento
June 8th, 2016
Nooffi
cial
metho
d
PhDThesis:Nascimento(2015),NCSUExperimentalSec*ons/Na*onwideDataBaseM-EPavementDesignGuide
1966 AASHORoadTest+USACE;EngineerMurilloLopesdeSouza;EmpiricalPavementDesignMethod(Official)
2016
1950 EngineerHenryMills-CBRandIGDesign
1928 Rio-PetrópolisHighway
1861 BrazilEmpire-UniãoeIndústriaRoad
1981 �FlexiblePavementDesignMethod�Review(Official)
1983PhDThesis:Preussler�ResilientMethod�inpavementrehabilita\ondesign(towardsmechanis\cal)
BrazilianPavem
entD
esignEvolu\
on
1991 PhDThesis:LauraMo]a�ResilientMethod�inNewflexiblepavementDesign(towardsmechanis\cal)
2007 PhDThesis:FelipeFrancoSISPAV(computa\onalframework;newflexiblepavements)
Empiricalofficialm
etho
d

Pavement Analysis Background in Brazil
-Empiricalapproacheswithoutthoroughvalida\on
-M-EpavementdesignguideunderdevelopmentbytheAsphaltResearchNetwork(Petrobrassince2005)è16universi*es+DNIT(BrazilianFHWA)
-VECDmodelforasphaltmixturecharacteriza\onandpavementdamageanalysis
OBJECTIVES:
-Tobuildandtoevaluatethefieldperformanceofasphaltpavementsec\onsthroughoutthecountry,subjectedtorealtrafficloading
-Todevelopand/ortovalidatepavementmaterialsperformancemodels;Todevelopananalysisframeworktool
Brazilian Database
TS Location Traffic,
number of ESALs
(first year)
Cracked area at last survey, %
Construction technique
Designed asphalt
thickness, mm Asphalt mixture
UFSM 1 Santa Maria, RS 4.49E+05 32.9 Overlay, no milling 50 UFSM 50/70 2 UFSM 3 Santa Maria, RS 8.72E+05 0.0 New pavement 70 UFSM 50/70 1
UFRGS 2 Porto Alegre, RS 7.60E+06 0.0 New pavement 50 UFRGS 60/85 USP 4 Ribeirão Preto, SP 1.40E+05 0.0 New pavement 40 USP 50/70 USP 5 Ribeirão Preto, SP 1.40E+05 0.0 New pavement 40 USP 30/45 ND 1 Aparecida do Norte, SP 2.56E+06 9.0 Overlay, partial milling 140 ND 15/25 ND 2 Aparecida do Norte, SP 2.56E+06 3.0 Overlay, partial milling 200 ND 15/25 ND 3 Aparecida do Norte, SP 2.56E+06 4.8 Overlay, partial milling 140 ND 15/25 ND 4 Aparecida do Norte, SP 2.56E+06 12.5 Overlay, partial milling 200 ND 15/25 ND 5 Aparecida do Norte, SP 2.56E+06 19.0 Overlay, partial milling 200 ND HM 1 ND 6 Aparecida do Norte, SP 2.56E+06 5.9 Overlay, partial milling 200 ND HM 1 ND 7 Aparecida do Norte, SP 2.56E+06 10.0 Overlay, partial milling 140 ND HM 1 ND 8 Aparecida do Norte, SP 2.56E+06 0.0 Overlay, partial milling 140 ND HM 2 ND 9 Aparecida do Norte, SP 2.56E+06 0.0 Overlay, partial milling 200 ND HM 2
ND 10 Aparecida do Norte, SP 2.56E+06 0.0 Overlay, partial milling 140 ND HM 2 UFSC 2 Araranguá, SC 1.33E+07 20.0 New pavement 150 UFSC 50/70
UFSC 3 Araranguá, SC 1.33E+07 0.0 New pavement 114 (top) 56 (bottom)
UFSC 50/70 (top) UFSC RA (bottom)

Pavement Analysis Background in Brazil
Basic Level Advanced Level
Flow Number (traffic)
Flow Number (traffic)
(confinement?) Permanent Deformation
Fatigue
Microcracking described by state
variable S
Typical evolution of a
damage test
ViscoelasGcConGnuum
DamageTheory
VECDModel
Mode-of-loading independent !!!
Widerangeofasphaltmixtures
E=E’ < E0

Controlled-strain Fatigue Testing Simulation
S-VECD+GR-basedfailurecriterion
NfèPredictedvs.Experimental
Inputs
Outputs
Pavementresponses
Damagecontours
Materialsproper6es
Traffic/climate
ComputacionalFramework
Layered ViscoElastic Pavement Analysis for Critical Distresses (1.1Beta program)
GR(Nf)
E*MastercurveShiiFactors

Analysis Framework (FaGgueCracking)
Transfer Function
New Pavement Rehabilitation
Climate (EICM)
Traffic (Load and Volume Distribution)
Materials Properties (E* Mastercurve
Shift Factors)
Damage Contour
Fatigue Analysis S-VECD Model
(asphalt mixture characterization)
LVECD Program
INPU
T St
ruct
ural
A
naly
sis
Rel
iabi
lity-
Bas
ed
Perf
orm
ance
A
naly
sis
% Fatigue Cracking prediction
Damage Index Stresses & Strains Output
Final Output
LVECD Validation and Calibration in Brazil-44pavementsec*onsèRiodeJaneiro,SãoPaulo,SantaCatarina,RioGrandedoSul,andCeará-Widerangeofpavementstructuresandtrafficlevels-Differentdamagelevelsèfa\guecrackedareas-Asphaltlayersthicknesses:40mmto200mm-Widerangeofasphaltmixtures-Materialsanddataavailability
TS ESALs(firstyear)
Crackedarea,%
Overlaytechnique
Designedoverlaythickness,mm Asphaltmixture
19 7.28E+05 7.0 Fullmilling 5060
30/4519.1mm(top)65/9019.1mm(bo]om)
34 1.11E+06 42 Par\almilling 70 30/4519.1mm37 1.18E+06 87 Par\almilling 50 30/4512.5mm
40 1.39E+06 0 SAM/Nomilling 50 30/4512.5mm

Damage Index Proposed
-N/Nfra\ovaluesunderneaththeloadedareaareaveragedusingMiner’slaw
Gridof110points(10x11) Averageddamagevs.TimeCrackPredic*on:
pavementstructure;traffic;materials;climate
Averaged Damage vs. Time
(a)
(b)
Differentaverageddamagegrowthpa]erns:-Asphaltmixtureproper\esandthicknesses-Pavementstructure-Trafficlevel

Averageddamagevs.\me
Crackedareavs.Averageddamage
Thehighertheini\aldamagegrowthrate(fastercracking),thehigherthedamagelevelwhenthecrackingbegins
Crackedareavs.numberofESALs
èFa\guecrack“start”
Averaged Damage vs. Time
Averaged Damage vs. Cracked Area
Averageddamagevs.Crackedarea:Canwecollapseofallthecurvesatonesinglecorrela\on?
Semi-logscale
Arithme\cscale
LVECDsimula6on
Fieldobserva6on

Fatigue Cracking Starting Point Averaged Damage Growth Rate Dependency
T0.35èsimulated\meforaverageddamage(N/Nf)of0.35
N/Nf@10%ofobservedcrackedarea(field)vs.T0.35(simula6on)
-T0.35isstronglycorrelatedtotheaverageddamagewhencrackingstarts-ForT0.35>80months(slowdamagegrowing)èN/Nf@10%tendstostabilize
Fatigue Cracking Starting Point Averaged Damage Shifting
-Mul\plica\veshiifactorè
-Referenceaverageddamageforshiiingè0.5(allcurvesareshiiedinsuchawaythattheir10%ofcrackedareahappensforN/Nfsimulated=0.5)-Thefactors(S)forshiiingtheaverageddamageat10%ofcrackedareatothereferencecondi\onweredetermined:
NN f
red = N N f× S
BTAS +×= 35.0

Defining the Damage-to-Cracked Area Transfer Function
Based on T0.35
Crackedareavs.AveragedreduceddamageCrackedareavs.Averageddamage
BeforeshiOing AOershiOing
-CrackedareaandAveragedreduceddamagepresentedauniqueandstrongrela\onship(consideringfieldvariability)
R2≅0.75
2
1
C
fredN
NCCA ⎟⎠
⎞⎜⎝
⎛×=
(44 National Sections) (curvesareshiiedsothat10%ofcrackedareahappensforN/Nfsimulated=0.5)
Predicted vs. Observed cracked areas
Predic\oncapability:
TS Crackedareaonlastsurvey,% Predictedcrackedarea,%
UFSM1 32.9 23.2UFSM3 0.0 0.0UFRGS2 0.0 0.0USP4 0.0 0.0USP5 0.0 0.0ND1 9.0 10.0ND2 3.0 0.4ND3 4.8 2.9ND4 12.5 0.5ND5 19.0 7.1ND6 5.9 7.1ND7 10.0 44.3ND8 0.0 0.4ND9 0.0 0.0ND10 0.0 0.2UFSC2 20.0 14.8UFSC3 0.0 0.5
Samemixture
Bindercontent=4.7%
Bindercontent=5.2%Rubberasphaltatthebo]omlayer
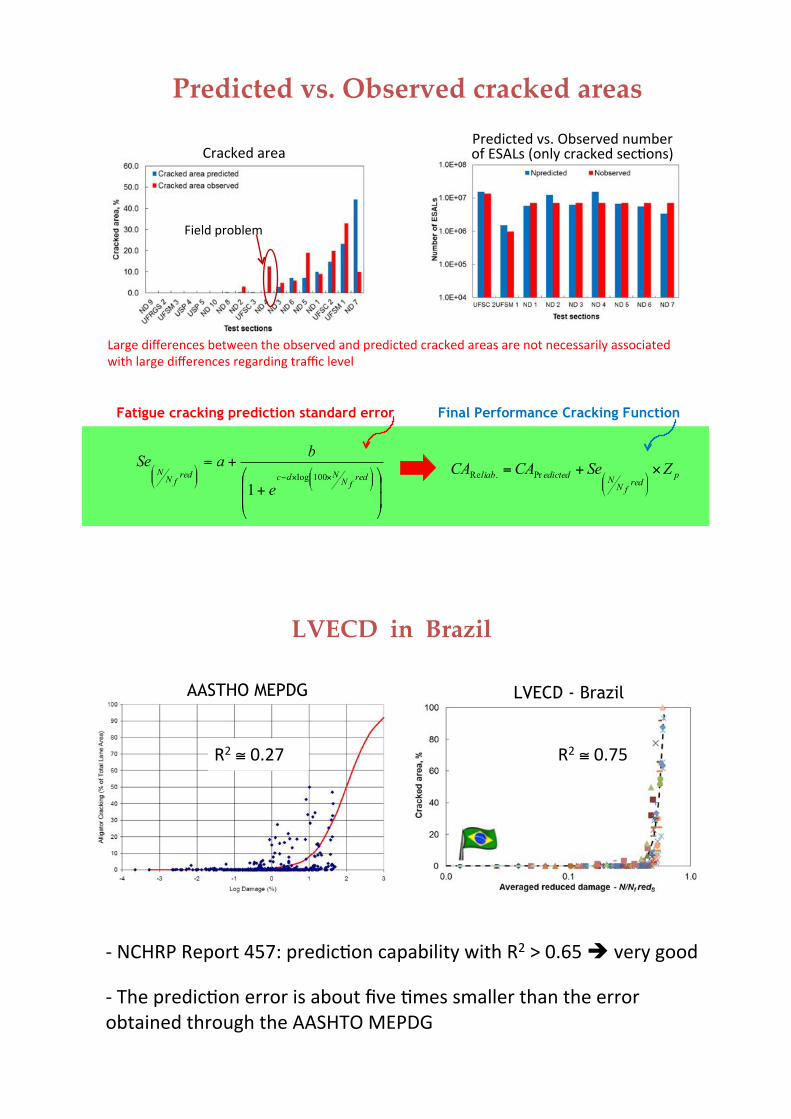
Fieldproblem
CrackedareaPredictedvs.ObservednumberofESALs(onlycrackedsec\ons)
Predicted vs. Observed cracked areas
Largedifferencesbetweentheobservedandpredictedcrackedareasarenotnecessarilyassociatedwithlargedifferencesregardingtrafficlevel
⎟⎟
⎠
⎞
⎜⎜
⎝
⎛+
+=⎟⎟⎠
⎞⎜⎜⎝
⎛××−⎟⎟
⎠
⎞⎜⎜⎝
⎛redfN
NdcredfN
N
e
baSe100log
1p
redfN
Nedictedliab ZSeCACA ×+=⎟⎟⎠
⎞⎜⎜⎝
⎛Pr.Re
Fatigue cracking prediction standard error Final Performance Cracking Function
LVECD in Brazil
-NCHRPReport457:predic\oncapabilitywithR2>0.65èverygood
-Thepredic\onerrorisaboutfive\messmallerthantheerrorobtainedthroughtheAASHTOMEPDG
AASTHO MEPDG
R2≅0.75R2≅0.27
LVECD - Brazil

Next Steps
-Morena*onalpavementsec*onswillbeincludedinthecalibra\on
-Introducingasphaltmixtureself-healingproper\esintheanalysis
-Permanentdeforma*onpredic\onmodelsvalida\onforasphaltmixtureandstructurallayers
-AnalysisofPortlandcementtreatedmaterials.
ACKNOWLEDGEMENTS
UFAM
UFPA UEMA
UFC
UFPB, UFCG
UFS
UFRJ, IME, IPR
USP, EESC
UFSC
UFPR, UEM
UFG
UFMT
UFBA
UFJF, UFOP, CEFET-MG, UFV
UFSM
UFRGS

JoinusinFortalezafortheISAPConferencein2018...
ISAP Workshop in 2009 (≈ 50 people) ISAP Workshop in 2012 (≈ 50 people) ISAP Symposium in 2012 (≈ 150 people) RMPD Workshop sponsored by ISAP in 2016 (≈ 50 people) ISAP Conference in 2018 …