joris wismans master thesis, mt08 - materials · pdf filejoris wismans master thesis ......
TRANSCRIPT

Computed Tomography-based Modeling ofStructured Polymers
Joris Wismans
Master thesis, MT08.04
Supervisors:prof. dr. ir. H.E.H. Meijerdr. ir. L.E. Govaertdr. ir. J.A.W. van Dommelen
Eindhoven University of TechnologyDepartement of Mechanical EngineeringMaterial Technology Institute
Eindhoven, January 2008

Summary
This thesis presents a hybrid numerical-experimental approach to characterize the macroscopicmechanical behavior of structured polymers. It is based on capturing the detailed microstruc-ture of the material with 3D X-ray Computed Tomography (CT). By employing segmentationand voxel-conversion, the reconstructed volume is converted into a finite element model that issubsequently used for mechanical analyses. In the first part, this approach is demonstrated ona 2D polycarbonate honeycomb. An ideal representative volume element (RVE), with a volumeequivalent to the volume of the X-ray CT-based model, is employed to determine the dependenceon intrinsic material behavior, strain-rate and cell wall thickness of this structure. A non-linearelasto-viscoplastic constitutive model was used to describe the intrinsic behavior of the polycarbon-ate base material. A comparison of the elasto-viscoplastic model with a model with hyper-elasticmaterial behavior, revealed that local plastic deformation influences the macroscopic behaviorsignificantly. The dependence on the initial stiffness of the cell wall thickness was found to scalewith t3, whereas the stain rate had a minor influence on the macroscopic behavior. The ideal RVEand the X-ray CT-based model showed a different response, due to local variations of the cell wallthickness of the X-ray CT-based model, causing the latter to deform unstably. In addition to thegeometric imperfections, jagged edges, as a consequence of voxel conversion, contributed to thislocal cell wall thickness variation.In the second part the approach is demonstrated on a 3D polymeric foam. The microstructure ofan urethane foam is characterized with X-ray CT and subsequently converted into an FE model,by employing segmentation and voxel conversion. By using a linear-elastic material model for thebase material behavior, a non-linear elastic stress-strain response is found due to the geometricalnon-linearities.
iii


Contents
Introduction 1
1 CT-based Modeling of Structured Polymers 3
1.1 Introduction . . . . . . . . . . . . . . . . . . . . . . . . . . . . . . . . . . . . . . . . 4
1.2 Characterization of the Honeycomb Structure . . . . . . . . . . . . . . . . . . . . . 6
1.2.1 CT-based RVE . . . . . . . . . . . . . . . . . . . . . . . . . . . . . . . . . . 6
1.2.2 Ideal Volume Equivalent RVE . . . . . . . . . . . . . . . . . . . . . . . . . . 9
1.2.3 Constitutive Model of Polycarbonate . . . . . . . . . . . . . . . . . . . . . . 11
1.3 Results . . . . . . . . . . . . . . . . . . . . . . . . . . . . . . . . . . . . . . . . . . . 13
1.3.1 Loading the Ideal Volume Equivalent RVE . . . . . . . . . . . . . . . . . . 13
1.3.2 Loading the Real CT-Based RVE . . . . . . . . . . . . . . . . . . . . . . . . 16
1.4 Conclusion . . . . . . . . . . . . . . . . . . . . . . . . . . . . . . . . . . . . . . . . 18
A Homogenization . . . . . . . . . . . . . . . . . . . . . . . . . . . . . . . . . . . . . . 18
B EGP model . . . . . . . . . . . . . . . . . . . . . . . . . . . . . . . . . . . . . . . . 19
References . . . . . . . . . . . . . . . . . . . . . . . . . . . . . . . . . . . . . . . . . . . . 20
2 Application to 3D foams 25
2.1 Geometry characterization of a polymeric foam . . . . . . . . . . . . . . . . . . . . 25
2.2 Loading of a CT-based model of a 3D foam . . . . . . . . . . . . . . . . . . . . . . 27
2.3 Conclusion . . . . . . . . . . . . . . . . . . . . . . . . . . . . . . . . . . . . . . . . 27
References 29

vi
Introduction
Because of their favorable specific strength and energy absorption properties, polymeric foamsfind their application in a wide range of engineering areas. In order to optimize products made ofpolymeric foams, their macroscopic mechanical behavior should be predictable for multiple andmixed loading conditions. Current constitutive models describe the macroscopic behavior of poly-meric foams in a limited number of loading conditions [1–6]. The number of loading geometriesthat can be applied for mechanical characterization, which are needed for validation of the consti-tutive models for multiple loading conditions, is limited. This limitation is a direct consequenceof the difficulty of clamping foam materials, which is required for many experiments. To compen-sate for these experimental limitations and to obtain an understanding of the local deformationmechanisms in experimentally non-feasible situations, a hybrid numerical-experimental approachis presented for the characterization of the constitutive behavior of structured polymers.
This approach is based on X-ray Computed Tomography (CT) characterization of the geometry, incombination with a non-liner elasto-viscoplastic material model for the polymer base material, inorder to accurately describe the deformation mechanics of structured polymers. X-ray CT-basedmodeling provides an accurate description of the geometry of the microstructure [7–12], where thenon-linear material model incorporates the un-stable deformation of the polymer base material [13].
In the first part, this approach is demonstrated on a polycarbonate honeycomb. The influence ofthe X-ray CT-based FE model in combination with the Eindhoven Glassy Polymer (EGP) mate-rial model for the intrinsic behavior of polycarbonate [13], is investigated. Subsequent, a volumeequivalent RVE is employed to determine the dependence on intrinsic material behavior, strainrate and cell wall thickness of the macroscopic mechanical behavior. The second part demonstratesthe approach on a 3D urethane foam. An X-ray CT-based model is loaded in compression, byusing a linear-elastic material model for the foam’s base material , to determine the stress-strainresponse.
1


Computed Tomography-based
Modeling of Structured Polymers
J.G.F. Wismansa∗, J.A.W. van Dommelena, L.E. Govaerta, B. van Rietbergenb,H.E.H. Meijera
aDepartment of Mechanical Engineering, Materials Technology Institute, Eindhoven Universityof Technology, P.O. Box 513, 5600 MB, Eindhoven, The Netherlands
bDepartment of Biomedical Engineering, Materials Technology Institute, Eindhoven Universityof Technology, P.O. Box 513, 5600 MB, Eindhoven, The Netherlands
ABSTRACT: A hybrid numerical-experimental approach is proposed to characterize themacroscopic mechanical behavior of structured polymers. The method is based on cap-turing the details of the material’s microstructure using 3D X-ray Computed Tomography(CT). By employing segmentation and voxel-conversion, the reconstructed volume is au-tomatically converted into a finite element model that is subsequently used for mechanicalanalyses. The approach is demonstrated on a 2D polycarbonate honeycomb. An idealrepresentative volume element (RVE), with a volume equivalent to the volume of the realX-ray CT-based RVE, is used to determine the dependence of the macroscopic responseof the structure on intrinsic material behavior, strain rate and cell wall thickness. A non-linear elasto-viscoplastic constitutive model is used to describe the intrinsic behavior of thepolycarbonate base material and a comparison with a hyper-elastic material model revealsthat local plastic deformation significantly influences the macroscopic behavior. A cubicrelation between the stiffness of the structure and cell wall thickness is found, whereas thestrain rate has a minor influence. The ideal RVE shows a different response comparedto the real X-ray CT-based RVE due to local variations of the cell wall thickness in thelatter, causing non-homogeneous deformations. In addition to the geometric imperfections,jagged edges, as a consequence of voxel conversion, contribute to this local variation in cellwall thickness.
KEY WORDS: Polymer foams, X-ray Computed Tomography, Finite element model,Micromechanics, Polycarbonate.
∗Author to whom correspondence should be addressed. E-mail: [email protected]: +31402472857, Fax: +31402447355
3

1 INTRODUCTION
Because of their favorable specific strength and energy absorption properties, polymericfoams find their application in a wide range of engineering areas. In order to optimize foamsand products, their macroscopic mechanical behavior should be predictable for multipleand mixed loading conditions. To capture the mechanical response with a macroscopicconstitutive model, an understanding of the underlying deformation and failure mechanicsis required. In compression, polymeric foams show an elastic response at small strains,caused by bending of the cell struts for open cell foams and/or bending of walls for closedcell foams, followed by buckling, plastic deformation or brittle fracture of the cell walls,resulting in a plateau region which is mainly responsible for the energy absorption charac-teristics of foams [1]. At larger strains, full collapse of the microstructure is observed, alsoknown as densification [1].The mechanical response of polymeric foams is thus determined by a large number of ge-ometrical parameters, such as relative density, mean cell diameter, cell wall thickness andsymmetry of the structure, on one hand, and the intrinsic constitutive behavior of thepolymeric base material, on the other hand. The non-linear intrinsic behavior is charac-terized by a viscoelastic response up to yielding, after which the material starts to flow,inducing strain softening that results in strain localization [2] and, at large strains, strainhardening [3]. The resulting averaged macroscopic stress-strain response is captured inconstitutive models that are only valid for a limited number of loading conditions [4–9].Yang and Shim [4] presented a visco-hyperelastic constitutive model for elastomeric foams,which describes the mechanical behavior in compression with a strain energy function com-bined with a non-linear Maxwell model. A viscoelastic model by Ehlers and Markert [5]incorporates transport of gas, based on the theory of porous media, through the cellularpores during uniaxial compression. Isotropic constitutive models for aluminum foams areproposed by Deshpande and Fleck [6] and include a quadratic yield surface in the stressspace of mean stress versus effective stress. For this model an associated flow rule is cho-sen according to experimental observations. For polymeric foams, a maximum compressivestress criterion is adopted, as an extension to the yield surface [7]. Zhang et al. [8, 9] alsoproposed a quadratic yield surface, only they use a non-associated flow rule to describe themacroscopic behavior in compression and mixed loading conditions.Most of these models, however, are validated only for a limited number of loading con-ditions, whereas for product optimization an accurate description of multiple and mixedloading conditions is necessary. Furthermore, unloading of deformed foams is not describedaccurately [8]. The number of loading geometries that can be applied for mechanical char-acterization, needed for validation of the constitutive models for multiple loading condi-tions, is limited. This limitation is a direct consequence of the difficulty of clamping foammaterials, which is required for many experiments. To compensate for these experimen-tal limitations, and to obtain an understanding of the local deformation mechanisms inexperimentally non-feasible situations, analytical and computational models that work atmicroscopic and macroscopic levels can be employed. Analytical models that describe theeffective mechanical properties of cellular materials, are proposed as a function of their
4

relative density by Gibson and Ashby [1]. Representative unit cells are used as an idealrepresentation of the microstructure, and can be used for Finite Element Method (FEM)analyses to determine the averaged mechanical behavior. Gong et al. [10, 11] and Mills[12] used a periodic Kelvin cell to represent the structure and subsequent FEM analysesprovided them with the effective behavior of open cell foams in compression. Geometricalimperfections were incorporated and the cross sections of the struts were modeled to havePlateau-borders, which are a realistic representation of the cell wall cross sections. Gonget al. [11] reported a geometric imperfection sensitivity of the behavior of foams, whichindicates the necessity of models that accurately represent the microstructure. To modelan irregular foam structure, a unit cell based on Voronoi tessellation can be used [13–16].This technique corresponds to the physical process of nucleation and growth of cells. Thesemodels can then be used for FEM analyses, which show that the cell wall shape signifi-cantly influences the averaged mechanical behavior.An accurate and powerful non-destructive method to characterize the complex microstruc-ture of cellular materials, is X-ray Computed Tomography (CT). Due to absorption by thematerial, the X-ray beam is attenuated when passing through a specimen. The change ofintensity of the X-ray beam is recorded, resulting in grey level images. By rotating theobject step by step over 360◦, a total set of images is created and by using reconstructionalgorithms, a detailed description of the 3D structure based on these images is obtained.This technique has been employed for a wide range of cellular materials, to characterizetheir microstructure, such as metal and polymeric foams [17, 18], trabecular bone [19, 20],bone scaffolds [21] and bread crumbs [22]. To obtain the geometry of the microstructure,segmentation is applied to the reconstructed volume data, by choosing appropriate greyvalues which correspond to the base material. By converting these segmented data intofinite element models, and assigning material properties to the elements, FE analyses canprovide the averaged behavior of these cellular materials.The accuracy of the CT-based FE model depends on the element size and type used.Tetrahedral elements are found to describe the boundaries of the geometry most smoothly[17, 19, 20, 22]. By converting 3D image data (voxels) into hexahedral elements, the re-sulting FE models show jagged edges, which leads to mesh sensitivity at the boundaryof the model [23]. Smoothing algorithms can be applied to overcome the jagged edges,by using a combination of hexahedral and tetrahedral elements [20] or by smoothing theexisting hexahedron mesh by incorporating connectivity information, leading to smootherhexahedral based models [24].Beside the element types, the element size (or voxel size) also determines the accuracyof the description of the geometry and smaller voxel sizes lead to more accurate calcula-tions of the macroscopic mechanical properties [17, 20]. However, an unnecessarily highresolution leads to a large number of elements slowing down computations, whereas lesselements would suffice. Sub-resolution, or binning, can be used to minimize the number ofelements. This method is based on merging n3 voxels, thereby leaving one voxel with theaveraged grey value of the n3 voxels and reducing the voxel size by n, where n is definedas the number of elements that are merged in every direction [17, 20, 22]. For the FEmodels based on hexahedral elements, 3 to 4 elements through the thickness are found
5

to be sufficient for predicting effective properties from CT-based models [23]. In order todetermine the macroscopic mechanical behavior of cellular materials by using X-ray CT-based modeling, a large section of the geometry should be taken, such that its mechanicalbehavior is equivalent to the mechanical behavior found on the macroscopic scale. In somecases, where the structure is not periodic, this approach can lead to models with a verylarge number of elements. It has been shown, however, that the use of special iterativesolvers, and parallel processing, now enables the solving of models with in the order of 100million elements, which is sufficient to accurately represent the proximal part of the humanfemur in detail [19].In this study, a hybrid numerical-experimental approach is presented for the characteri-zation of the constitutive behavior of structured polymers. X-ray Computed Tomographyis used to scan, store and process the microstructure with a high resolution (∼ 7[µm]).Conversion and segmentation of the digital volume data into a 3D hexahedron FE model,results in an accurate and direct representation of the microstructure. This approach ispreviously used in combination with an elastic model to describe the intrinsic behavior ofdifferent cellular structures [17–22]. Here we extend the constitutive model of the basematerial with viscoplasticity, that characterizes the behavior of glassy polymers, like poly-carbonate. A well-validated 3D non-linear elasto-viscoplastic constitutive model [25] isused. Consequences for a real CT-based representative volume element (RVE) and for anideal RVE are investigated. For the CT-based RVE, the combined effects of a non-smoothmicrostructural geometry and an intrinsically unstable response of the polymer base ma-terial (strain softening after yielding) is examined.First the size and complexity of the X-ray CT-based RVE are reduced by choosing apolycarbonate honeycomb (see Fig. 1). Extra motivation for this choice, is found inthe numerical and experimental studies of Papka and Kyriakides [26–28] that show thatthe stress-strain response of a polycarbonate honeycomb in compression is similar to thebehavior of polymeric foams in compression.
2 CHARACTERIZATION OF THE HONEYCOMB
STRUCTURE
2.1 CT-Based RVE
The geometry of the polycarbonate honeycomb (Tubus Bauer GmbH) is analyzed by usinga Nanotom X-ray CT system (Phoenix—X-ray, Wunstorf, Germany), with the resolutionset to 7.7 [µm]. After reconstruction of the volume from the images, segmentation andsubsequently voxel conversion are employed, resulting in a 3D FE model. A subsectionis then taken and converted into a 2D plane strain FE model containing 73,052 linearquadrilateral elements. In order to accurately describe bending, an important deformationmechanism in this structure [28], an assumed strain formulation is used within MSC Marc,that is based on different interpolation functions for the shear strain fields that significantlyimprove the bending behavior of the elements used [29, 30]. An voxel-based FE model
6

10 mm
Figure 1: A polycarbonate honeycomb.
results with dimensions of 7.59x8.67 [mm2], see Fig. 2, showing both smooth and non-smooth boundaries. Vertical and horizontal edges are smooth, whereas curved edges arejagged due to the conversion of voxels into quadrilateral elements. These jagged edgescontribute to a variation of the cell wall thickness ts, shown in Fig. 2. These mesh-inducedvariations are in addition to geometric imperfections of the real honeycomb.
Table 1: Geometric properties, mean and standard deviation (SD), of the real X-ray CT-based RVE of the polycarbonate honeycomb.
Ds [mm] ts [µm] wts [µm] wws [µm]4.44 82.2 150 562
SD 1.6% 6.6% 3.8% 6.4%
The mean geometric properties of the CT-based RVE are given in Table 1, where Ds standsfor the mean outer diameter of a cell, ts is the mean cell wall thickness, wts represents themean welding thickness and wws is given as the mean welding width. The welding areais defined as the region where two cells coincide/overlap, and the CT-based RVE revealedthat 2.33% of the elements are located in these welding areas. The welding width and cellwall thickness show the largest variation, given by SD. The influence on the macroscopicbehavior will be discussed later on.Due to the geometric imperfections and non-periodicity, the CT-based RVE of the polycar-
7

bonate honeycomb (Fig. 2) can not be subjected to periodic boundary conditions, whichare frequently and beneficially used for representative microstructures [12, 14, 15, 31]. Inorder to load this model up to large strains, a compression load is applied via a rigid plate,prescribing its displacement such that a constant linear strain rate ε during deformation isobtained. A second rigid plate is fixed to the lower boundary ΓB of the RVE. The contactbetween elements and plates and between elements themselves is incorporated by assumingno friction in all contact bodies. Nodes that initially are in contact with the plates, re-main in contact with these plates during deformation. Furthermore, boundary conditionsapplied to nodes on boundaries ΓL and ΓB are chosen such that macroscopic shearing issuppressed. To determine the stress-strain response of this model, the engineering stressσeng and engineering strain ε are defined as
σeng = f/A0, (1)
ε = h/h0 − 1, (2)
where A0 is given as the initial contact area between plate and honeycomb, h depicts themomentary height and h0 the initial height. The force f is taken as the reaction force ofthe upper plate in the momentary state and strain is prescribed as ε(τ) = ετ , with τ themomentary time.
x
y
Figure 2: The CT-based RVE of the polycarbonate honeycomb. The inserts depict smoothand jagged boundaries.
8

2.2 Ideal Volume Equivalent RVE
An ideal RVE is modeled using a total volume that is equivalent to the volume of the X-rayCT-based RVE of the honeycomb. The dimension of the ideal volume equivalent RVE isgiven by
√3Drx2Dr, where Dr is the outer diameter of a cell shown in Fig. 3(a), assuming
that at the point where two cells touch, their outer boundaries coincide. Furthermore, thein plane thickness is taken equal to the in plane thickness of the CT-based RVE. By usingvolume equivalency, with the CT-based RVE as a reference, the geometric properties ofthe volume equivalent RVE, as given in Table 2, are obtained.
Table 2: Geometric properties of the ideal volume equivalent RVE, corresponding to Fig.3(a).
Dr [mm] tr [µm] wtr [µm] wwr [µm]4.36 80.2 173 564
The volume equivalent thickness tr and welding properties wwr and wtr, are calculated byconsidering that 2.33% of the elements volume is located in the welding areas. Fig. 3(a)shows the geometry of the volume equivalent RVE, where the insert shows the smoothboundary of the RVE.
x
y
x
y
(a)
1 2
34
(b)
Figure 3: (a) An ideal RVE model of a honeycomb structure, where the insert depict thesmooth boundary. (b) An RVE with the boundaries ΓT and ΓB corresponding with thematerial boundaries.
9
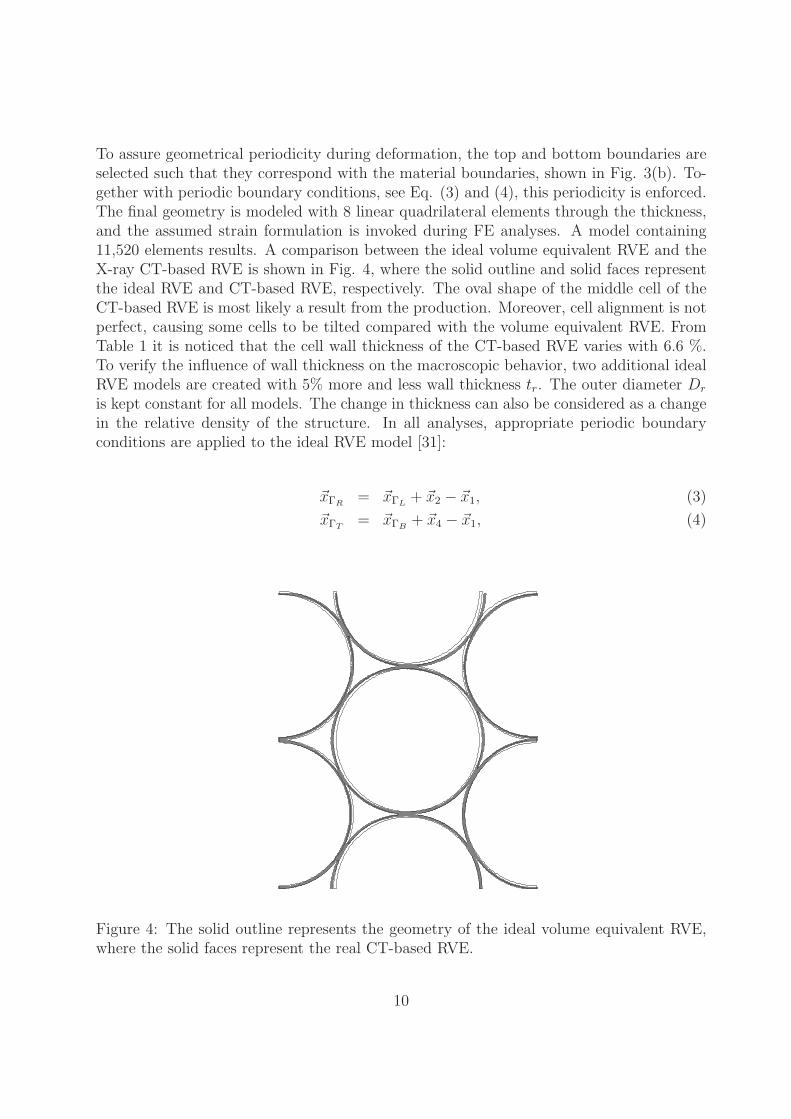
To assure geometrical periodicity during deformation, the top and bottom boundaries areselected such that they correspond with the material boundaries, shown in Fig. 3(b). To-gether with periodic boundary conditions, see Eq. (3) and (4), this periodicity is enforced.The final geometry is modeled with 8 linear quadrilateral elements through the thickness,and the assumed strain formulation is invoked during FE analyses. A model containing11,520 elements results. A comparison between the ideal volume equivalent RVE and theX-ray CT-based RVE is shown in Fig. 4, where the solid outline and solid faces representthe ideal RVE and CT-based RVE, respectively. The oval shape of the middle cell of theCT-based RVE is most likely a result from the production. Moreover, cell alignment is notperfect, causing some cells to be tilted compared with the volume equivalent RVE. FromTable 1 it is noticed that the cell wall thickness of the CT-based RVE varies with 6.6 %.To verify the influence of wall thickness on the macroscopic behavior, two additional idealRVE models are created with 5% more and less wall thickness tr. The outer diameter Dr
is kept constant for all models. The change in thickness can also be considered as a changein the relative density of the structure. In all analyses, appropriate periodic boundaryconditions are applied to the ideal RVE model [31]:
~xΓR= ~xΓL
+ ~x2 − ~x1, (3)
~xΓT= ~xΓB
+ ~x4 − ~x1, (4)
Figure 4: The solid outline represents the geometry of the ideal volume equivalent RVE,where the solid faces represent the real CT-based RVE.
10

where ~xi corresponds to the position vectors of the corner nodes i = 1, 2, 4 in the currentstate and Γj, with j = T,B, L,R, denotes the boundaries as given in Fig. 3(b). Thevolume equivalent RVE model, is loaded in compression with the following conditions:
y4 − y1 = (1 + ετ)(y04 − y01), (5)
x1 = x4, (6)
y2 = y1. (7)
In Eqs. (5)-(7) the subscripts i and 0i denote the current and initial state of node i = 1, 2, 4respectively, where τ is the current time. The corresponding x-y coordinate system is shownin Fig. 3(a). Furthermore, for all analyses contact between the elements is taken intoaccount. Finally the macroscopic response is determined by the homogenization schemeas given in Appendix A.
2.3 Constitutive Model of Polycarbonate
The polycarbonate (PC) base material of the honeycomb is modeled by using the Eind-hoven Glassy Polymer (EGP) model, developed during the last decade, see e.g. [25, 32–34].The model accurately captures the intrinsic behavior of all glassy polymers for differentstrain rates, thermal histories and loading conditions (see Appendix B). The model de-scribes viscoelastic material behavior at small strains, and, at larger strains, yielding, strainsoftening and strain hardening, as shown for compression experiments in Fig. 5.The strain rate applied affects the yield stress as shown in Fig. 5(a), while strain softeningand strain hardening are strain rate independent. The thermal history is captured witha single state parameter Sa and affects, for a constant strain rate, both yield stress andstrain softening, as is observed in Fig. 5(b). Furthermore, it has been shown that theintrinsic behavior is independent of the polymers molecular weight (distribution) [25]. Thematerial properties of polycarbonate, used in the FEM analyses, are taken from [25] andsummarized in Table 3. It should be noted that these properties do not correspond to theactual properties of the base material of the sample that was scanned, but are taken asrepresentative for this class of materials; glassy polymers.
Table 3: Material properties used for polycarbonate in the EGP model [25].
K G η0,r τ0 µ Sa
[MPa] [MPa] [MPa s] [MPa] [-] [-]3750 308 2.1·1011 0.7 0.08 31.7
r0 r1 r2 Gr ∆Ua νa
[-] [-] [−] [MPa] [kJ/mol/K] [m3/mol]0.965 50 -5 26 205 1.33·10−3
11

In Table 3, K denotes the bulk modulus, G the shear modulus, η0,r the initial viscosity, τ0
the characteristic stress, µ the pressure dependence, ri (for i = 0, 1, 2) fitting parametersof the softening kinetics, Gr the rubber modulus, ∆Ua the activation energy and νa theactivation volume [25].To determine the difference of using an elasto-viscoplastic model rather than a purely elasticmodel, the Neo-Hookean hyper-elastic constitutive model is used for an elastic analysis.The values for this model are chosen to correspond with the initial stiffness of the EGPmodel.
0 0.1 0.2 0.3 0.4 0.5 0.60
20
40
60
80
true strain [-]
true
stre
ss [M
pa]
10 -2 s -1
10-3
s-1
10 -4 s -1
(a) Strain rate dependence.
0 0.1 0.2 0.3 0.4 0.5 0.60
10
20
30
40
50
60
70
true strain [-]
true
stre
ss [M
Pa]
(0)=29.1
(0)=26.5
(b) Thermal history dependence.
Figure 5: Stress-strain response of solid PC in compression; lines represent EGP-modelingresults and symbols experimental results [25].
12
3 RESULTS
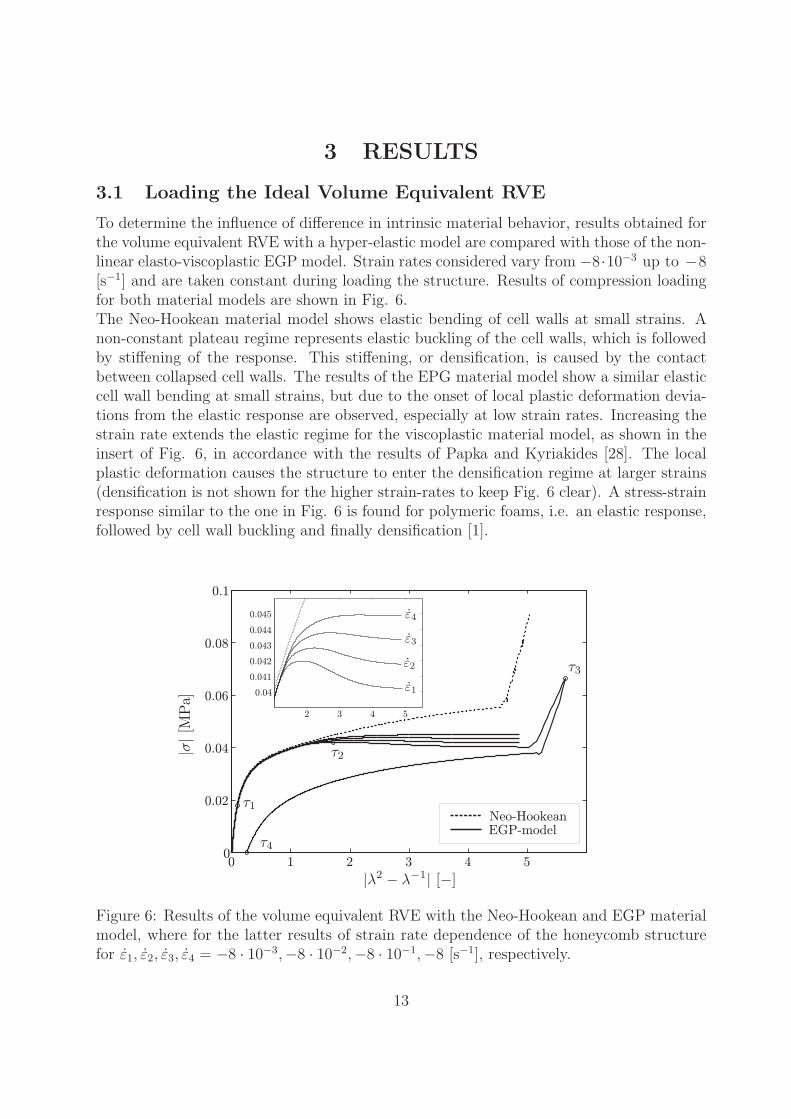
3.1 Loading the Ideal Volume Equivalent RVE
To determine the influence of difference in intrinsic material behavior, results obtained forthe volume equivalent RVE with a hyper-elastic model are compared with those of the non-linear elasto-viscoplastic EGP model. Strain rates considered vary from −8·10−3 up to −8[s−1] and are taken constant during loading the structure. Results of compression loadingfor both material models are shown in Fig. 6.The Neo-Hookean material model shows elastic bending of cell walls at small strains. Anon-constant plateau regime represents elastic buckling of the cell walls, which is followedby stiffening of the response. This stiffening, or densification, is caused by the contactbetween collapsed cell walls. The results of the EPG material model show a similar elasticcell wall bending at small strains, but due to the onset of local plastic deformation devia-tions from the elastic response are observed, especially at low strain rates. Increasing thestrain rate extends the elastic regime for the viscoplastic material model, as shown in theinsert of Fig. 6, in accordance with the results of Papka and Kyriakides [28]. The localplastic deformation causes the structure to enter the densification regime at larger strains(densification is not shown for the higher strain-rates to keep Fig. 6 clear). A stress-strainresponse similar to the one in Fig. 6 is found for polymeric foams, i.e. an elastic response,followed by cell wall buckling and finally densification [1].
0 1 2 3 4 50
0.02
0.04
0.06
0.08
0.1
2 3 4 5
0.04
0.041
0.042
0.043
0.044
0.045
Neo-HookeanEGP-model
Figure 6: Results of the volume equivalent RVE with the Neo-Hookean and EGP materialmodel, where for the latter results of strain rate dependence of the honeycomb structurefor ε1, ε2, ε3, ε4 = −8 · 10−3,−8 · 10−2,−8 · 10−1,−8 [s−1], respectively.
13

0.0e+00
9.4e+00
1.9e+01
2.8e+01
3.7e+01
4.7e+01
5.6e+01
6.5e+01
7.5e+01
8.4e+01
9.4e+01
0.0e+00
9.4e+00
1.9e+01
2.8e+01
3.7e+01
4.7e+01
5.6e+01
6.5e+01
7.5e+01
8.4e+01
9.4e+01
0.0e+00
9.4e+00
1.9e+01
2.8e+01
3.7e+01
4.7e+01
5.6e+01
6.5e+01
7.5e+01
8.4e+01
9.4e+01
0.0e+00
9.4e+00
1.9e+01
2.8e+01
3.7e+01
4.7e+01
5.6e+01
6.5e+01
7.5e+01
8.4e+01
9.4e+01
Figure 7: Equivalent Von Mises stress in the intermediate deformed states for the idealvolume equivalent RVE. Elastic bending (τ = τ1) of the cell walls is followed by local plasticdeformation (τ = τ2). Densification for high strains, causes stiffening of the macroscopicmaterial behavior (τ = τ3). Finally, after unloading, plastic deformation (represented byplastic hinges) remains (τ = τ4). The values of τi correspond to the times τi shown in Fig.6.
14

From the insert of Fig. 6, it is observed that initially the strain rate dependence is negli-gible, which also holds for solid PC in its elastic regime, shown in Fig. 5(a). For higherstrains, the strain rate causes the macroscopic behavior of the ideal RVE to vary with 5%per decade of strain rate variation. For solid polymers, an increase of the strain rate resultsin an increase in yield stress, whereafter strain softening follows, see Fig. 5(a). The sameis observed in the insert of Fig. 6, although the influence of strain rate on yield stress issmaller (3% per decade of strain rate variation) compared with the influence of the strainrate on the yield stress of solid PC, Fig. 5(a) (8% per decade of strain rate variation).To verify that local plastic deformation in present, the ideal RVE is loaded with a constantstrain rate of −8 · 10−3[ s−1] up to densification, followed by unloading, see also Fig. 6.After unloading, a small amount of plastic deformation remains. Fig. 7 shows the interme-diate deformed states during loading and unloading (times τi correspond to those in Fig.6). Up to τ = τ1, cell wall bending is observed, and the structure behaves linearly elastic.Subsequent straining induces simultaneous cell wall buckling, due to local plastic defor-mation (τ = τ2). This introduces plastic hinges and local softening of the base material.Full collapse of the structure, at τ = τ3, results in macroscopic densification due to contactbetween cell walls. Finally, after unloading (τ = τ4) local plastic deformation, representedby the plastic hinges, remaines.
0 1 2 3 4 50
0.02
0.04
0.06
Figure 8: Thickness dependence on the stress-strain response of the RVE.
The results of increasing and decreasing the cell wall thickness in the ideal RVE are shownin Fig. 8. The global response is similar, showing an elastic regime due to cell wall bendingat small strains, followed by simultaneous buckling of cells, due to plastic deformation atlarge strains. The cell wall thickness significantly influences the macroscopic mechanicalbehavior causing the resulting stress to vary 15% and the initial modulus with 18 %. These
15

results agree with those of simple beam theory [35], that predicts a cubic relationshipbetween stiffness and cell wall thickness tr.
3.2 Loading the Real CT-Based RVE
To determine the mechanical behavior of the X-ray CT-based RVE in combination withthe EGP material model, the structure is loaded in compression with a constant strainrate of −0.8 [s−1]. The stress-strain response is shown in Fig. 9, and it is similar to the
0 1 2 3 4 50
0.02
0.04
0.06
0.08
Figure 9: Stress-strain response for the ideal volume equivalent RVE and real CT-basedRVE using the EPG model for the base material behavior.
response found for the ideal RVE model. The non-homogeneous response shown in Fig. 9,is caused by strain localization in two cell walls, triggered by the jagged edges in additionto the non-homogenous cell wall thickness. In contrast, the ideal RVE model shows ahomogeneous response due to simultaneously buckling of all cell walls, shown in Fig. 7.Snapshots of the deformation at various stages during loading are given in Fig. 10 (timesτi correspond to those in Fig. 9). Elastic bending of the cell walls is observed up to τ = τ1.For τ = τ2 localization in the upper cells occurs. Full collapse of both cells is observed atτ = τ3, where contact between the cell walls is present. From this point the other cell wallsstart to buckle and finally touch at τ = τ4. The inserts in Fig. 10 show stress localizationaround the jagged edge of the upper left cell. From the geometry of the model, given in Fig.2, it is verified that at points of strain localization, the cell wall thickness is smaller thanthe mean cell wall thickness ts (as given in Table 1). Moreover, from Fig. 9 it is observedthat the X-ray CT-based RVE initially shows a lower elastic response with a difference of18 %, induced by the local variation in cell wall thickness.
16

It has thus been shown that by incorporating elasto-viscoplastic material behavior anda non-homogeneous geometry, localization of plastic deformation occurs and, as a conse-quence, a non-homogeneous macroscopic response results, as also observed in the experi-ments of Papka and Kyriakides [28].
0.0e+00
1.5e+01
3.0e+01
4.6e+01
6.1e+01
7.6e+01
9.1e+01
1.1e+02
1.2e+02
1.4e+02
1.5e+02
0.0e+00
1.5e+01
3.0e+01
4.6e+01
6.1e+01
7.6e+01
9.1e+01
1.1e+02
1.2e+02
1.4e+02
1.5e+02
Figure 10: Equivalent Von Mises stress in intermediate deformed states for the real X-rayCT-based RVE. Elastic bending (τ = τ1) of the cell walls is followed by stress localizationin two upper cells at (τ = τ2) shown by the magnification. Full collapse of these cells isshown at (τ = τ3), where the remaining cell walls start to buckle. Finally, all cells arecollapsed at (τ = τ4). The values of τi correspond to the τi shown in Fig. 9.
17
4 CONCLUSION
A hybrid numerical-experimental approach for the characterization of the macroscopicresponse of structured polymers has been explored. This approach consist of X-ray CT-based characterization of the microstructural geometry in combination with an accurateelasto-viscoplastic constitutive model for the polymer base material. This method has beenapplied to characterize the response of a PC honeycomb. A real X-ray CT-based represen-tative (RVE) is presented for this PC honeycomb, by converting the reconstructed volumedata into a 2D plane strain model. Jagged edges of the model, due to the voxel conversion,in addition to the non-homogeneous geometry of the honeycomb, contribute to a local vari-ation of the cell wall thickness. Also an ideal volume equivalent RVE has been modeled, todetermine the influence of the intrinsic material behavior, strain rate and cell wall thick-ness on the macroscopic stress-strain response. Viscoplasticity has a significant influenceon the macroscopic behavior, compared to standard hyper-elastic material behavior. Dueto plastic localization in the cell walls, the local and macroscopic deformation behaviordeviates from that found for the hyper-elastic model. After unloading, a relatively smallplastic strain remains. Furthermore, it is shown that the cell wall thickness influences themacroscopic behavior significantly, and the initial stiffness scales with t3r. The strain ratehas a minor influence on the stress-strain response (5% per decade of strain rate variation).The stress-strain response of the real X-ray CT-based RVE, again using the EGP modelas constitutive model for the base material, shows, when loaded in compression, a non-homogeneous response, due to localization in two cells (where for the ideal RVE, stresslocalizations occur simultaneously in all cells). This is due to a local variation in cellwall thickness, caused by the jagged mesh, in addition to non-homogenous geometry ofthe honeycomb. The ideal RVE and real X-ray CT-based RVE show a different response,mainly due to difference in localization. Of course for an accurate determination of themacroscopic behavior of these honeycombs, an RVE consisting of more cells is necessaryand appropriate boundary conditions should be applied to reduce size and computationalcosts of the final model, e.g. following [31].
ACKNOWLEDGEMENT
The authors wish to acknowledge Mr. D. Beczkowiak from Tubus Bauer GmbH for provid-ing the PC honeycomb material and the financial support of the Netherlands Organizationfor Scientific Research (NWO, Division of Technical Sciences under grant number 07345).
A HOMOGENIZATION
A homogenization scheme is used to determine the macroscopic behavior of the RVE. Thescheme is based on averaging the microscopic first Piola Kirchhoff stress tensor Pm [31]:
18

PM =1
V0
∫
V0
PmdV0, (8)
where subscripts M and m represent macroscopic and microscopic quantities, respectively,and V0 is the volume of the RVE in the reference state. By incorporating the periodicboundary conditions given in Eqs. (3) and (4), relation (8) is simplified to
PM =1
V0
∑
i=1,2,4
~fi~x0i, (9)
where ~fi are the reaction forces of the corner nodes in the current state and ~x0i the positionvectors of these nodes in the reference state. Finally, the macroscopic first Piola-Kirchhoffstress tensor PM is related to the macroscopic Cauchy stress tensor σM by
σM =1
det(FM)PM · F
cM . (10)
The macroscopic deformation gradient tensor FM is determined by volume averaging ofthe microscopic deformation gradient tensor Fm, according to
FM =1
V0
∫
V0
FmdV0 =1
V0
∫
Γ0
~x~n0dΓ0, (11)
with ~n0 the outward normal of the boundary Γ0 in the initial state.
B EGP MODEL
A distinction between the contribution of secondary interactions between polymer chainsand the entangled polymer network is made in the EGP model [25]. Therefore the Cauchystress tensor σ is divided into a driving stress σs and a hardening stress σr:
σ = σr + σs. (12)
The hardening stress σr is modeled with a Neo-Hookean relation:
σr = GrBd, (13)
where Bd is the deviatoric part of the isochoric left Cauchy-Green deformation tensor.
The deformation tensor F is multiplicatively decomposed into an elastic (subscript e) andplastic (subscript p) part, according to:
F = Fe · Fp. (14)
The driving stress is given by the following relation:
19
σs = K(J − 1)I︸ ︷︷ ︸
σhs
+ GBde
︸ ︷︷ ︸
σds
, (15)
where J is the volume change factor, I the unity tensor and Bde the deviatoric part of the
isochoric elastic left Cauchy-Green strain tensor.The plastic part of the deformation is determined with a non-Newtonian flow rule, with astress dependent Eyring viscosity, to relate the plastic deformation rate tensor Dp to thedeviatoric driving stress σ
ds , and is given by:
Dp =σ
ds
2η(T, p, τ , S). (16)
The viscosity function η(T, p, τ , S) of the EGP-model is given by:
η(T, p, τ , Sa) = η0,r(T ) exp
(µp
τ0
)τ /τ0
sinh(τ /τ0)exp(SaRγ(γp)), (17)
where T is the absolute temperature, p the characteristic pressure, τ the equivalent stress,Sa a state parameter that captures the thermal history, τ0 the characteristic stress andRγ(γp) the softening kinetics which is determined by the equivalent plastic strain [25].
REFERENCES
[1] L.J. Gibson and M.F. Ashby. Cellular Solids, Structure and properties. second ed.,University Press, Cambridge University Press, 1999.
[2] H.G.H. van Melick, L.E. Govaert, and H.E.H. Meijer. Localisation phenomena inglassy polymers: influence of thermal and mechanical history. Polymer, 44:3579–3591,2003.
[3] H.E.H. Meijer and L.E. Govaert. Multi-scale analysis of mechanical properties ofamorphous polymer systems. Macromolecular Chemistry and Physics, 204:274–288,2003.
[4] L.M. Yang and V.P.W. Shim. A visco-hyperelastic constitutive description of elas-tomeric foam. International Journal of Impact Engineering, 30:1099–1110, 2004.
[5] W. Ehlers and B. Markert. A macroscopic finite strain model for cellular polymers.International Journal of Plasticity, 19:961–976, 2003.
[6] V.S. Deshpande and N.A. Fleck. Isotropic constitutive models for metallic foams.Journal of the Mechanics and Physics of Solids, 48:1253–1283, 2000.
[7] V.S. Deshpande and N.A. Fleck. Multi-axial yield behaviour of polymer foams. Acta
Materialia, 49:1859–1866, 2001.
20

[8] J. Zhang, Z. Lin, A. Wong, N. Kikuchi, V.C. Li, A.F. Yee, and G.S. Nusholtz. Con-stitutive modeling and material characterization of polymeric foams. Journal of En-
gineering Materials and Technology, 119:284–291, 1997.
[9] J. Zhang, N. Kikuchi, V. Li, A. Yee, and G. Nusholtz. Constitutive modeling ofpolymeric foam material subjected to dynamic crash loading. International Journal
of Impact Engineering, 21:369–386, 1998.
[10] L. Gong and S. Kyriakides. Compressive response of open-cell foams. part ii: Initiationand evolution of crushing. International Journal of Solids and Structures, 42:1381–1399, 2005.
[11] L. Gong, S. Kyriakides, and W.Y. Jang. Compressive response of open-cell foams. parti: Morphology and elastic properties. International Journal of Solids and Structures,42:1355–1379, 2005.
[12] N.J. Mills. The high strain mechanical response of the wet kelvin model for open-cellfoams. International Journal of Solids and Structures, 44:51–65, 2007.
[13] A.P. Roberts and E.J. Garboczi. Elastic properties of model random three-dimensionalopen-cell solids. Journal of the Mechanics and Physics of Solids, 50:33–55, 2002.
[14] K. Li, X.-L Gao, and G. Subhash. Effects of cell shape and cell wall thickness variationson the elastic properties of two-dimensional cellular solids. International Journal of
Solids and Structures, 42:1777–1795, 2005.
[15] H. Harders, K. Hupfer, and J. Rosler. Influence of cell wall shape and density on thebehaviour of 2d foam structures. Acta Materialia, 53:1335–1345, 2005.
[16] M.W.D. van der Burg, V. Shulmeister, E. van der Geissen, and R. Marissen. Onthe linear elastic properties of regular and random open-cell foam models. Journal of
Cellular Plastics, 33:31–54, 1997.
[17] E. Maire, A. Fazekas, L. Salvo, R. Dendievel, S. Youssef, P. Cloetens, and J.M. Letang.X-ray tomography applied to the characterization of cellular materials. related finiteelement modeling problems. Composites Science and Technology, 63:2431–2443, 2003.
[18] M. Saadatfar, C.H. Arns, M.A. Knackstedt, and T. Senden. Mechanical and transportproperties of polymeric foams derived from 3d images. Colloids and Surfaces A, 263:284–289, 2004.
[19] B. Van Rietbergen, R. Huiskes, F. Eckstein, and P. Ruegsegger. Trabecular bonetissue strains in the healthy and osteoporotic human femur. Journal of Bone and
Mineral Research, 18:1781–1788, 2003.
21

[20] D. Ulrich, B. Van Rietbergen, H. Weinans, and P. Ruegsegger. Finite element anal-ysis of trabecular bone structure: a comparison of image-based meshing techniques.Journal of Biomechanics, 31:1187–1192, 1998.
[21] T. Van Cleynenbreugel, J. Schrooten, H. Van Oosterwyck, and J. Vander Sloten.Micro-ct-based screening of biomechanical and structural properties of bone tissueengineering scaffolds. Medical and Biological Engineering and Computing, 44:517525,2006.
[22] P. Babin, G. Della Valle, R. Dendievel, N. Lassoued, and L. Salvo. Mechanical prop-erties of bread crumbs from tomography based finite element simulations. Journal of
Materials Science, 40:5867–5873, 2005.
[23] R.E. Guldberg, S.J. Hollister, and G.T. Charras. The accuracy of digital image-basedfinite element models. Journal of Biomechanical Engineering, 120:289–295, 1998.
[24] S.K. Boyd and R. Muller. Smooth surface meshing for automated finite element modelgeneration from 3d image data. Journal of Biomechanics, 39:1287–1295, 2006.
[25] E.T.J. Klompen, T.A.P. Engels, L.E. Govaert, and H.E.H. Meijer. Modeling of thepostyield response of glassy polymers: Influence of thermomechanical history. Macro-
molecules, 38:6997–7008, 2005.
[26] S.D. Papka and S. Kyriakides. In-plane biaxial crushing of honeycombs-part ii: Anal-ysis. International Journal of Solids and Structures, 36:4397–4423, 1999.
[27] S.D. Papka and S. Kyriakides. Biaxial crushing of honeycombs-part i: Experiments.International Journal of Solids and Structures, 36:4367–4396, 1999.
[28] S.D. Papka and S. Kyriakides. In-plane crushing of a polycarbonate honeycomb.International Journal of Solids and Structures, 35:239–267, 1998.
[29] MSC Marc Volume A: Theory and Userinformation, 2006.
[30] T. Belytschko, W.K. Lui, and B. Moran. Nonlinear Finite Elements For Continua
and Structures. John Willy & Sons Ltd., England, 2000.
[31] V.G. Kouznetsova, M.G.D. Geers, and W.A.M. Brekelmans. Multi-scale second-ordercomputational homogenization of multi-phase materials: a nested finite element solu-tion strategy. Computer Methods in Applied Mechanics and Engineering, 193:5525–5550, 2004.
[32] T.A. Tervoort, E.T.J. Klompen, and L.E. Govaert. A multi-mode approach to fi-nite, three-dimensional, nonlinear viscoelastic behavior of polymer glasses. Journal of
Rheology, 40:779–797, 1996.
22

[33] L.E. Govaert, P.H.M. Timmermans, and W.A.M. Brekelmans. The influence of intrin-sic strain softening on strain localization in polycarbonate: modeling and experimentalvalidation. J. Engng. Mat. Technol., 122:177–185, 2000.
[34] T.A. Tervoort, R.J.M. Smit, W.A.M. Brekelmans, and L.E. Govaert. A constitu-tive equation for the elasto-viscoplastic deformation of glassy polymer. Mech. Time-
depend. Mater., 1:269–291, 1998.
[35] R.T. Fenner. Mechanics of solids. CRC Press, Florida, 1999.
23


Chapter 2
Application to 3D foams
In the paper, X-ray CT-based modeling in combination with FEM analyses, resulted in the me-chanical response of a polycarbonate honeycomb in compression. In this chapter, the first resultsare presented of characterizing a 3D polymeric foam with X-ray CT. To show the approach of char-acterizing 3D random polymeric structures with X-ray CT, a coarse urethane foam was chosenbecause of the foam’s open cell structure and relatively large cell walls (smallest cell wall thicknesswas 32 [µm]).
2.1 Geometry characterization of a polymeric foam
X-ray CT-based modeling was used to characterize the geometry of a 3D urethane foam (ConforFoam CF-45100 1 in. from EARSC) and the resolution for this characterization was set to 8.13[µm] in order to accurately describe the microstructure of the foam. Thereafter, the reconstructedvolume data are segmented, by choosing appropriate grey values. This segmented volume is shownin Fig. 2.1(a), where the length of each side h is 790 times the resolution. Finally a sub-sectionof the segmented volume was converted into a hexahedral FE model, with a volume of h3
2, whereh2 = h
3.8 , which is shown in Fig. 2.1(b). Sub-resolution was applied, merging 8 voxels, therebyleaving one voxel with the averaged grey value of the 8 voxels and doubling the voxel size, toreduce the total number of elements. The model presented contains 89,703 linear hexahedronelements. As discussed in part ??, also in this case the assumed strain formulation was used toimprove the bending behavior of these elements. To determine the stress-strain response of thismodel, the engineering stress σeng and engineering strain ε are defined as
σeng = f/A0, (2.1)ε = h/h0 − 1, (2.2)
where A0 is given as the initial contact area between the plate and model, h depicts the currentheight, h0 is the initial height of the model. The force f was taken as the reaction force of theupper plate in the current state and the strain is prescribed as ε(τ) = ετ , with τ the current time.Since the foam does not have a periodic structure, also in this case, a plate was modeled toload the foam in compression and a second plate was placed on the bottom of the model. Contactbetween elements and the plates and between the elements themselves are incorporated during theanalysis. Finally, boundary conditions similar to the boundary conditions used for the honeycomb
25

are applied, such that the foam could expand without friction between the plates in 3D.
(a)
(b)
Figure 2.1: (a) A reconstruction of a polymeric foam with a voxel size of 8.13 [µm] after segmen-tation. (b) An FE model of a subsection of the reconstructed volume with an element size of16.3[µm] and where h2 = h
3.8 .
26
The material behavior of the foam is assumed to be linear elastic with the following properties:E = 2300 [MPa] and ν = 0.3 [−]. Also in this case the material properties, do not correspond tothe actual base material properties, but are only given as a representation of this class of materials.
2.2 Loading of a CT-based model of a 3D foam
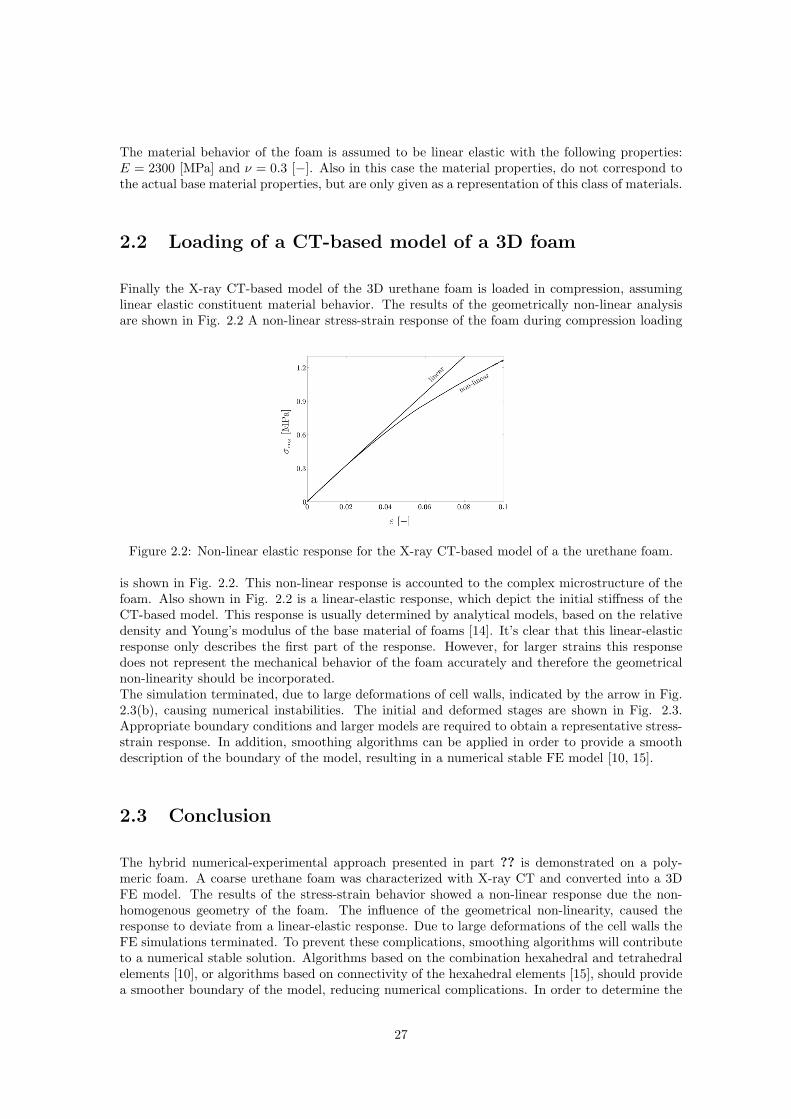
Finally the X-ray CT-based model of the 3D urethane foam is loaded in compression, assuminglinear elastic constituent material behavior. The results of the geometrically non-linear analysisare shown in Fig. 2.2 A non-linear stress-strain response of the foam during compression loading
Figure 2.2: Non-linear elastic response for the X-ray CT-based model of a the urethane foam.
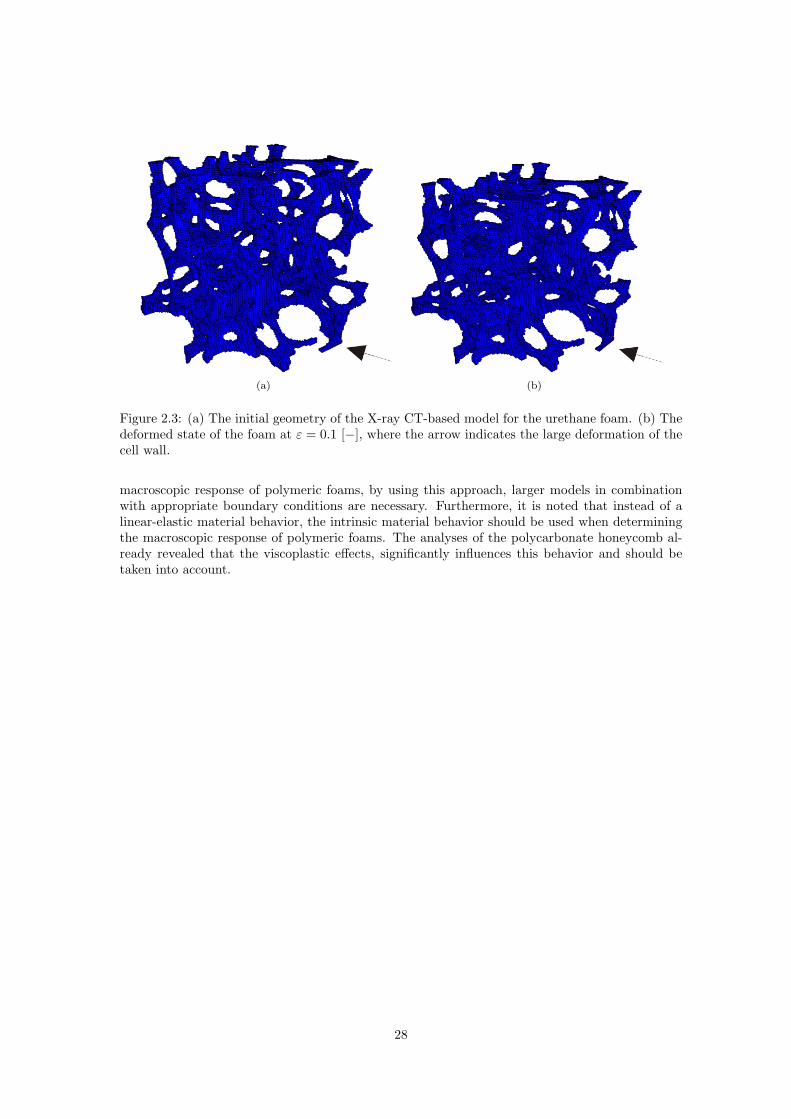
is shown in Fig. 2.2. This non-linear response is accounted to the complex microstructure of thefoam. Also shown in Fig. 2.2 is a linear-elastic response, which depict the initial stiffness of theCT-based model. This response is usually determined by analytical models, based on the relativedensity and Young’s modulus of the base material of foams [14]. It’s clear that this linear-elasticresponse only describes the first part of the response. However, for larger strains this responsedoes not represent the mechanical behavior of the foam accurately and therefore the geometricalnon-linearity should be incorporated.The simulation terminated, due to large deformations of cell walls, indicated by the arrow in Fig.2.3(b), causing numerical instabilities. The initial and deformed stages are shown in Fig. 2.3.Appropriate boundary conditions and larger models are required to obtain a representative stress-strain response. In addition, smoothing algorithms can be applied in order to provide a smoothdescription of the boundary of the model, resulting in a numerical stable FE model [10, 15].
2.3 Conclusion
The hybrid numerical-experimental approach presented in part ?? is demonstrated on a poly-meric foam. A coarse urethane foam was characterized with X-ray CT and converted into a 3DFE model. The results of the stress-strain behavior showed a non-linear response due the non-homogenous geometry of the foam. The influence of the geometrical non-linearity, caused theresponse to deviate from a linear-elastic response. Due to large deformations of the cell walls theFE simulations terminated. To prevent these complications, smoothing algorithms will contributeto a numerical stable solution. Algorithms based on the combination hexahedral and tetrahedralelements [10], or algorithms based on connectivity of the hexahedral elements [15], should providea smoother boundary of the model, reducing numerical complications. In order to determine the
27
(a) (b)
Figure 2.3: (a) The initial geometry of the X-ray CT-based model for the urethane foam. (b) Thedeformed state of the foam at ε = 0.1 [−], where the arrow indicates the large deformation of thecell wall.
macroscopic response of polymeric foams, by using this approach, larger models in combinationwith appropriate boundary conditions are necessary. Furthermore, it is noted that instead of alinear-elastic material behavior, the intrinsic material behavior should be used when determiningthe macroscopic response of polymeric foams. The analyses of the polycarbonate honeycomb al-ready revealed that the viscoplastic effects, significantly influences this behavior and should betaken into account.
28

References
[1] L.M. Yang and V.P.W. Shim. A visco-hyperelastic constitutive description of elastomericfoam. International Journal of Impact Engineering, 30:1099–1110, 2004.
[2] W. Ehlers and B. Markert. A macroscopic finite strain model for cellular polymers. Interna-tional Journal of Plasticity, 19:961–976, 2003.
[3] V.S. Deshpande and N.A. Fleck. Isotropic constitutive models for metallic foams. Journal ofthe Mechanics and Physics of Solids, 48:1253–1283, 2000.
[4] V.S. Deshpande and N.A. Fleck. Multi-axial yield behaviour of polymer foams. Acta Mate-rialia, 49:1859–1866, 2001.
[5] J. Zhang, Z. Lin, A. Wong, N. Kikuchi, V.C. Li, A.F. Yee, and G.S. Nusholtz. Constitutivemodeling and material characterization of polymeric foams. Journal of Engineering Materialsand Technology, 119:284–291, 1997.
[6] J. Zhang, N. Kikuchi, V. Li, A. Yee, and G. Nusholtz. Constitutive modeling of polymericfoam material subjected to dynamic crash loading. International Journal of Impact Engi-neering, 21:369–386, 1998.
[7] M. Saadatfar, C.H. Arns, M.A. Knackstedt, and T. Senden. Mechanical and transport prop-erties of polymeric foams derived from 3d images. Colloids and Surfaces A, 263:284–289,2004.
[8] E. Maire, A. Fazekas, L. Salvo, R. Dendievel, S. Youssef, P. Cloetens, and J.M. Letang. X-ray tomography applied to the characterization of cellular materials. related finite elementmodeling problems. Composites Science and Technology, 63:2431–2443, 2003.
[9] B. Van Rietbergen, R. Huiskes, F. Eckstein, and P. Ruegsegger. Trabecular bone tissue strainsin the healthy and osteoporotic human femur. Journal of Bone and Mineral Research, 18:1781–1788, 2003.
[10] D. Ulrich, B. Van Rietbergen, H. Weinans, and P. Ruegsegger. Finite element analysis oftrabecular bone structure: a comparison of image-based meshing techniques. Journal ofBiomechanics, 31:1187–1192, 1998.
[11] T. Van Cleynenbreugel, J. Schrooten, H. Van Oosterwyck, and J. Vander Sloten. Micro-ct-based screening of biomechanical and structural properties of bone tissue engineering scaffolds.Medical and Biological Engineering and Computing, 44:517525, 2006.
[12] P. Babin, G. Della Valle, R. Dendievel, N. Lassoued, and L. Salvo. Mechanical propertiesof bread crumbs from tomography based finite element simulations. Journal of MaterialsScience, 40:5867–5873, 2005.
[13] E.T.J. Klompen, T.A.P. Engels, L.E. Govaert, and H.E.H. Meijer. Modeling of the postyieldresponse of glassy polymers: Influence of thermomechanical history. Macromolecules, 38:6997–7008, 2005.
29

[14] L.J. Gibson and M.F. Ashby. Cellular Solids, Structure and properties. second ed., UniversityPress, Cambridge University Press, 1999.
[15] S.K. Boyd and R. Muller. Smooth surface meshing for automated finite element modelgeneration from 3d image data. Journal of Biomechanics, 39:1287–1295, 2006.
30