joseba irigoyen otamendi - addi.ehu.es
TRANSCRIPT

-
-
-
-
-
-
-
-
-
--
-
-
-
-
-
-
-
-
-
-
--
-
-
-
- -
-
-
-
-
-
-
-
-
-
-
-
-
-
- -
-
-
-
-
-
-
-
-
-
-
-
-
-
-
-
-
--
-
-
-
-
-
-
-
-
-
--
-
-
--
- -
-
--
- --
--
- -
-
-
-
-
-
-
-
-
-
-
-
--
- - --
-
--
-
-
-
-
-
-
-
-
Na+
Na+
Na+
Na+
Na+
Na+
Na+
Na+
Na+
Na+
Na+
Na+
Na+
Na+
Na+
Na+
Na+
Na+
Na+
Na+
Na+
Na+
Na+
Na+ Na+
Na+
Na+
Na+
Na+
Na+
Na+
Na+
Cl-
Cl-
Cl-
Cl-
Cl-
Cl-
Cl-
Cl-
Na+
Cl-
Cl-
Cl-
Cl-
Cl-
Cl-
Cl-
Cl-
Na+
Cl-
Cl-
Cl-
Cl-
Cl-
Cl-
Cl-
Cl-
Cl-Cl-
Cl-
Cl-
Cl-
Cl-
Cl-
Na+
Na+
Fabrication and Characterization of
Multilayered Assemblies based on
Polyelectrolytes and Hybrid Systems with
Carbon Nanomaterials for Applications in
Nanofiltration and as Smart Surfaces
Joseba Irigoyen Otamendi


Fabrication and Characterization of Multilayered
Assemblies based on Polyelectrolytes and Hybrid
Systems with Carbon Nanomaterials for Applications
in Nanofiltration and as Smart Surfaces
Dissertation presented to the
Department of Ciencia y Tecnología de Polímeros
of the Basque Country (UPV/EHU), Donostia-San Sebastián
for the degree of
Doctor in Applied Chemistry and Polymeric Materials
Presented by
Joseba Irigoyen Otamendi
Thesis Supervisor: Dr. Sergio E. Moya
University Tutor: Dr. Antxon Santamaria
Donostia-San Sebastián 2016
(c)2016 JOSEBA IRIGOYEN OTAMENDI


Agradecimientos|Acknowledgments
En primer lugar me gustaría agradecer a mi director de tesis Dr. Sergio E. Moya
por su apoyo, por abrirme las puertas al mundo de la investigación y por las
oportunidades ofrecidas durante el desarrollo de este trabajo. Esta tesis no solo
me ha dado la oportunidad de crecer profesionalmente sino personalmente;
muchas experiencias vividas, los viajes, los diferentes entornos de trabajo, gente
que he podido conocer y que me han hecho conocerme mejor a mi mismo y
crecer como persona.
Realizar una tesis a caballo entre San Sebastián y múltiples lugares por todo el
mundo no ha sido tarea fácil, aunque obviamente tiene muchos aspectos
positivos también hay experiencias duras y momentos no tan placenteros, el
apoyo de mi familia siempre ha sido un pilar en mi vida y saber que tengo su
respaldo incondicional siempre ha sido un paracaídas para aventurarme a vivir
nuevas experiencias. ¡Os quiero familia!
Tengo que agradecer como no a todos los compañeros del laboratorio, Soft
Matter Nanotechnology Group. En especial a Gabriela Romero, la bigotes, aún
me acuerdo cuando llegaste el primer día todo peripuesta recién llegada de
México y te volviste hecha toda una vasquita a comerte el mundo, gracias por
los momentos pasados juntos y el apoyo que has sido siempre. María
Echeverria muchas gracias por compartir tu neurona conmigo, ese sentido del
humor tan parecido que tenemos y las conversaciones escatológicas que nadie

Agradecimientos
entiende, he descubierto una amiga que espero sea para muchos años.
Eleftheria Diamanti, quien iba a pensar que una griega nula en geografia iba a
tener tantas cosas en común conmigo, aún recuerdo en Argentina cuando
salimos a comprar la mochila mas barata del mundo, o en Berlin cuando me
rescataste de mi vida de fantasma. Nikolaos Politakos, el futuro marido, y tu
siempre sereis mis griegos favoritos, aunque él parezca mexicano. Richard
Murray, ¿quién necesita a google translator si tienes un amigo irlandes con el
que encima te puedes ir de cañas?, gracias por todo el apoyo en el trabajo pero
especialmente por ser un buen amigo. Ane Escobar aunque por poco tiempo
eres la mejor poligonera de Irun multifacetas que he conocido, te deseo muchos
éxitos y que encuentres el mejor goxoki del mundo. Podría hacer una
dedicatoria personalizada para todos ellos, pero entonces necesitaría otra tesis
solo para eso, así que gracias también a Elena, Ángel, Yuan, Danijela,
Guocheng, Patrizia, Dessire, Marija, Teodoro a quien se me olvide y como no a
todas las visitas que hemos tenido tanto de Argentina, Brasil, Alemania y
China. Os deseo muchos éxitos a todos.
También me gustaría agradecer especialmente a Mihaela, Jagoba e Ixi, Aitziber
e Irantzu, amigos de otra epoca vivida en biomaGUNE pero que aún siguen
estando ahí y con quien siempre puedo contar. Y a mis compañeros de
Pamplona: Paula N., Luis, Sagrario, Iñaki, Paula C. y Uxua.
Por último me gustaría agradecer aquellas personas que me hicieron sentir
como en casa durante los viajes realizados, Eduar Gutierrez en Argentina,
Wang Bing en China y los Marcelos en Brasil, ¡gracias por todo!

Index
Abstract 1
Resumen 5
Abbreviations 11
Objectives and Aim 15
Introduction 21
Layer by Layer 22
Film growth and Thickness 29
Roughness 30
Hydration and Swellability 30
Stability 31
Mechanical Properties 32
Permeability 33
Polyelectrolytes in Membrane Separation Systems 35
Nanomaterials 36
Classification According to Composition 36
Classification According to Dimensionality 37
Carbon nanomaterials 40
Graphene 41
Carbon Nanotubes 43
Hybrid Polyelectrolyte / Carbon Nanomaterials 45
References 50
Chapter 1 | Materials and Methods 61
Experimental Methods 61
1.1 Quartz Crystal Microbalance with Dissipation 61
1.2 Ellipsometry 64

Index
1.3 Atomic Force Microscopy 65
1.4 Ion Cromatography 68
1.5 Conductometry 69
1.6 Scanning Electron Microscopy 69
1.7 Transmission Electron Microscopy 73
1.8 X-ray Difraction 75
1.9 Raman Spectroscopy and Confocal Raman Microscopy 75
1.10 Zeta Potential 77
1.11 Electrochemical Impedance Spectroscopy 80
1.12 Cyclic Voltammetry 82
1.13 Contact Angle 83
1.14 X-ray Photoelectron Spectroscopy 85
Materials 87
References
89
POLYELECTROLYTE MULTILAYERS
Chapter 2 | A Comparison of the Transport Properties of Supralinearly and Linearly Growing Polyelectrolyte Multilayers: a Cyclovoltametry and Impedance Study. 95
2.1 Introduction 95
2.2 Materials and Methods 99
2.2.1 Quartz Crystal Microbalance with Dissipation 100
2.2.2 Atomic Force Microscopy 100
2.2.3 Cyclic Voltammetry and Impedance Spectroscopy 101
2.2.4 Contact Angle 102
2.2.5 X-ray Photon Spectroscopy 102
2.3 Results and Discussion 103

Index
2.3.1 Complex Formation between PDADMAC and Ferro/Ferri 115
2.4 Conclusions 120
2.5 References 121
Chapter 3 | Regenerable Polyelectrolyte Multilayers for Applications in Foulant Removal. 125
3.1 Introduction 125
3.2 Materials and Methods 128
3.2.1 Quartz Crystal Microbalance 128
3.2.2 Atomic Force Microscopy 128
3.3 Results and Discussion 129
3.3.1 Ph Changes 129
3.3.2 Surfactants 132
3.4 Conclusions 138
3.5 References 139
Chapter 4 | Responsive Polyelectrolyte Multilayers Assembled at High Ionic Strength. 141
4.1 Introduction 141
4.2 Materials and Methods 143
4.2.1 Quartz Crystal Microbalance with Dissipation 143
4.2.2 In situ Combination of QCM-D and Ellipsometry 143
4.2.3 Atomic Force Microscopy 144
4.3 Results and Discussion 145
4.4 Conclusions 154
4.5 References
155
HYBRID SYSTEMS CARBON NANOMATERIALS/POLYELECTROLYTES
159

Index
Chapter 5| Hybrid Nanofiltration Membranes Based on Multiwalled Carbon Nanotubes and Polyelectrolytes.
5.1 Introduction 159
5.2 Materials and Methods 161
5.2.1 MWCNTs Functionalization 162
5.2.2 Assembly of the MWCNTs Intermediate Layer 162
5.2.3 Polyelectrolyte Multilayer Coatings 164
5.2.4 Filtration Experiments 165
5.2.5 Ion Chromatography and Conductivity Measurements 165
5.2.6 Scanning Electron Microscopy 166
5.3 Results and Discussion 166
5.3.1 Evaluation of Membrane Performance, Water Permeability and Rejection to MgSO4
168
5.3.2 Ion Rejection Dependence on Flux 169
5.3.3 Comparison with Other Types of Formulations 177
5.4 Conclusions 183
5.5 References 184
Chapter 6 | Hybrid Graphene Oxide/Polyelectrolyte Capsules on Erythrocite Cell Templates 189
6.1 Introduction 189
6.2 Materials and Methods 191
6.2.1 Erythrocytes 191
6.2.2 Graphene oxide 192
6.2.3 Layer by Layer Assembly 192
6.2.4 Capsule Fabrication 193
6.2.5 Transmission Electron Microscopy 193
6.2.6 X-ray Diffraction 194
6.2.7 Raman Spectroscopy and Confocal Raman Microscopy 194

Index
6.2.8 Atomic Force Microscopy 194
6.3 Results and Discussion 194
6.4 Conclusions 204
6.5 References 205
Chapter 7 | Conclusions 209
List of Publications 215

Index

[Type text]
List of figures
Introduction
1 a) intrinsic charge compensation between two oppositely charged polymer strands. b) extrinsic compensation occurs with the addition of salt. c) Competing for polymer charge in the presence of additional polyelectrolyte during the assembly of a new layer. 24
2 a) Scheme of the film deposition process using flat substrates and beakers, step 1 and 3 represent the adsorption of a polyanion and a polycation respectively, while 2 and 4 are rinsing steps. b) Simplified picture of the first two adsorption steps, counterions are omitted for clarity. 25
3 Schematic illustration of polyelectrolyte multilayer films on colloids and capsule creation by core removal afterwards. 26
4 Scheme of nanomaterials classified by dimensionality. 38
5 Graphite can be exfoliated in single sheets of graphene that after oxidation became graphene oxide and a posteriori reduction derivatizes in reduced graphene oxide. 42
6 Representation of SWCNT and MWCNT and the three types of conformations for carbon nanotubes. 43
7 Representation of Layer by Layer assembly of polyelectrolytes and carbon nanomaterials; first sketch: carbon nanotubes/polyelectrolytes and second scketch: graphene sheets/ polyelectrolytes. 46
Chapter 1 | Materials and methods
1.1 Frequency and dissipation changes in a quartz crystal resonator with a rigid layer or a viscolelastic layer. 63
1.2 a) Components of a standard AFM. b) Scanning modes in AFM. 66
1.3 Components of a Scanning Electron Microscope. 71
1.4 Resulting components of the interaction between the electron 72

Figures
[Type text]
beam and the sample.
1.5 Components of a Transmission Electron Microscope. 74
1.6 Energy translations for elastic and inelastic scattering. 78
1.7 Scheme of a simplified model of the electric double-layer at a charged interface in aqueous solution. 79
1.8 Nyquist plot of a modified electrode in which a) impedance is governed by the diffusion of the redox probe and b) impedance is dominated by electron transfer process. 82
1.9 Scheme of electrochemical cell set-up. 83
1.10 Typical cyclic voltammogram showing the measurement of the peak currents and peak potentials. 84
1.11 Illustration of the contact angle measurement with the sessile drop method. 85
1.12 Illustration of an XPS measurement. 86
Chapter 2 | A comparison of the transport properties of supralinear and linear growing polyelectrolyte multilayers: a cyclovoltametry and impedance study.
2.1 Chemical formula of the polyelectrolytes involved in the different assemblies.
103
2.2 a) Deposition of 17 layers of PVBTMAC and PSS at 0.5 M NaCl by QCM-D. b) Deposition of 17 layers of PDADMAC and PSS at 0.5 M NaCl by QCM-D. c) Representation of mass vs layer for 17 layers of PDADMAC/PSS and PVBTMAC/PSS assembled by QCM-D. d) Sketch for supralinar and linear assemblies. 104
2.3 AFM images of a) 17 layers of PDADMAC and PSS assembled at 0.5 M NaCl, analyzed in 10 mM NaCl in tapping mode with a DNP cantilever of 0.06 Nm-1. b) 17 layers of PVBTMAC and PSS assembled at 0.5 M NaCl, analyzed in 10mM NaCl in contact mode with a DNP cantilever of 0.35 Nm-1. c) 17 layers of PDADMAC and PSS assembled at 0.5 M NaCl, analyzed in 10 mM NaCl in contact mode with a DNP cantilever of 0.35 Nm-1. 107
2.4 Cyclic voltammograms for a) PDADMAC/PSS and c) 110

Figures
PVBTMAC/PSS PEMs onto MPS functionalized gold substrates. C) Maximum current in oxidation and reduction steps for each PEM.
2.5 Nyquist diagrams for PDADMAC/PSS assembly, b) Nyquist diagrams for PBVTMAC/PSS assembly and c) Nyquist for 11 and 17 layers of PDADMAC/PSS and PVBTMAC/PSS PEMs.
113
2.6 Cyclic voltammograms for PDADMAC/PSS assemblies after the first and the 11th layer have been deposited.
116
2.7 Cyclic voltammograms at different concentrations of PDADMAC in the electrochemical cell. 118
2.8 XPS analysis of Au+MPS+(PDADMAC/PSS)6.5 incubated in ferro/ferri 1 mM 0.1 M KCl. 119
Chapter 3 | Regenerable polyelectrolyte multilayers for applications in foulant removal.
3.1 Schematic of the removal and regeneration of a di-block polyelectrolyte membrane. 129
3.2 a) 4 bilayers of PDADMAC/PAA at 0.3 M naCl and pH 3 treated with water at pH 13, b) 2.5 bilayers of PAH/PSS at 0.5 M NaCl and 3.5 bilayers of PDADMAC/PAA at 0.3 M NaCl and PH 3 treated with water at pH 13, c) 2.5 bilayers of PAH/PSS at 0.5 M NaCl, 3.5 bilayers of PDADMAC/PAA at pH 3 and BSA on top treated with water at PH 13, d), e), f) zooms in of the PEMs removal from figures a, b and c respectively. 131
3.3 a) 2 bilayers of PAH/PSS and 2.5 bilayers of PDADMAC/PSS treated with 50 mM TTAB, b) 2 bilayers of PAH/PSS at 0.5 M NaCl, 3 bilayers of PDADMAC/PSS at 0.5 M NaCl and BSA on top, treated with TTAB and reconstructed with 2 bilayers of PDADMAC/PSS at 0.5 M NaCl afterwards, c), d) zoom ins of the PEMs removal from figures a, and b respectively. 133
3.4 a) AFM micrograph of a PEM di-block of 2 bilayers of PAH/PSS at 0.5 M NaCl and 3 bilayers of PDADMAC/PSS at 0.5 M NaCl on top, b) PEM with BSA deposited on top, c) PEM with BSA after 50 mM TTAB treatment. 134
3.5 Fluorescence Intensity of a) 1 bilayers of PAH/PSS at 0.5 M NaCl and 1.5 bilayers of PDADMAC/PSS at 0.5 M NaCl, b) 135

Figures
[Type text]
with Rhodamine labelled BSA on top, c) after 50 mM TTAB treatment.
3.6 a) 2 bilayers of PEI/PSS in acetate buffer and 2.5 bilayers of PEI/PAA at 0.3 M NaCl and pH 3 on top treated with SDS 2%, b) 2 bilayers of PEI/PSS in acetate buffer and 2 bilayers of PEI/PAA at 0.3 M NaCl and pH 3 with BSA on top and treated with SDS 2%, c), d) zooms in of the PEMs removal from figures a and b respectively. 137
3.7 Schematic scketch of all the different combinations tested. 138
Chapter 4 | Responsive polyelectrolyte multilayers assembled at high ionic strength.
4.1 Frequency response and dissipation curves measured with QCM-D showing the variation of the 3rd overtone during the assembly of 11th layers PDADMAC/PSS system in 3 M NaCl. 145
4.2 Wet mass and dry mass per layer during the assembly of (PDADMAC/PSS)1.50.5 M NaCl+(PDADMAC/PSS)43 M NaCl. 147
4.3 a) Comparison between dry and wet mass per layer for the PDADMAC layers in the PEM, b) Comparison between dry and wet mass per layer for the PSS layers in the PEM. 149
4.4 Frequency response and dissipation curves measured with QCM-D (3rd overtone) for the alternating rinsing of 11 layers of PDADMAC/PSS with water and 3 M NaCl. 149
4.5 AFM images of an 11 layer PDADMAC/PSS PEMs in a) water and in b) 3 M NaCl, and cross sectional analysis c). 151
Chapter 5| Hybrid Nanofiltration Membranes Based on Multiwalled Carbon Nanotubes and Polyelectrolytes.
5.1 Sketch of the closed and open circuit system built for the assembly of the MWCNT reinforcing layer. 163
5.2 a) SEM image of the surface of a flat SiC membrane. b) SEM image of SiC support after being covered with 10 layers of MWNCTs. c) SEM image of a SiC support after being covered with MWCNTs and 10 layers of PDADMAC/PSS 1mgml-1 0.8 M NaCl. 166

Figures
5.3 a) SEM micrographs from a cross section of the inner part of a SiC monotube modified with (PDADMAC/PSS)5. b) Cross section of the inner part of a SiC monotube coated with (MWCNTs-COOH-PAH/MWCNTs-COOH)4 reinforcing layer + (PDADMAC/PSS)5 PEM. 167
5.4 a) Mg2+ rejection dependence on flux for a 5 mM MgSO4 solution. b) Na+ and Mg2+ rejection dependence on flux for a mixed salt solution with 5 mM of NaCl and 5 mM of MgCl2. All filtration experiments were conducted at a cross-flow velocity of 0.83 ms-1 (Reynolds ≈ 5000) and at 20 °C. The membranes analyzed are: (PDADMAC/PSS)5 and MWCNT+(PDADMAC/PSS)3. 170
5.5 a) Sketch of the internal surface of a SiC monotube, covered with a PEM assembled Layer by Layer on top. b) Sketch of the internal part of a SiC monotube, covered with a multilayer of MWCNT with a PEM on top. The arrows represent the flux of permeating water. 172
5.6 SEM micrographs for a) [(MWCNT-PSS-PAH)/(MWCNT-PSS-PAH-PMAA)]4+(PDADMAC/PSS)3, b) [(MWCNT-COOH-PAH)/(MWCNT-COOH)]4 + (PDADMAC/PSS)3, c) (MWCNT-COOH-PAH)+[(MWCNT-COOH/ Laponite-PAH)]4 + (PDADMAC/PSS)3 and d) [(MWCNT-PSS-PAH)/(MWCNT-PSS-PAH-PMAA)]3 (PDADMAC/PSS)3 onto the inner part of SiC monotubes. 179
5.7 Mg2+ rejection dependence on flux for a 5 mM MgSO4 solution. All filtration experiments were conducted at a cross-flow velocity of 0.83 ms-1 (Reynolds ≈ 5000) and at 20 °C. 181
5.8 Na+ and Mg2+ rejection dependence on flux for a mixed salt solution with 5 mM of NaCl and 5 mM of MgCl2. All filtration experiments were conducted at a cross-flow velocity of 0.83 ms-1 (Reynolds ≈ 5000) and at 20 °C. 182
Chapter 6 | Hybrid Graphene Oxide/Polyelectrolyte Capsules on Erythrocite Cell Templates
6.1 GO data; a) and b) TEM images of graphene oxide on lacey carbon, inset: SAED showing diffraction spots of hexagonal patterns; c) Raman spectrum with 532 nm excitation d) XRD pattern showing (002) with d= 0.737 nm. 195
6.2 Schematic illustrations of a) the glutaraldehyde fixed red blood 197

Figures
[Type text]
cells, b) the fixed erythrocytes coated with 4 layers of PSS/PAH, c) the fixed cells in (b) coated with additional GO/polyelectrolyte layers and d) the hybrid GO/polyelectrolyte capsule after NaOCl oxidation of the cell.
6.3 TEM micrographs of a) sample 1: (PSS/PAH)4.50.5M, b) sample 2: (PSS/PAH)20.5M + [GO/(PAH/PSS/PAH)0.5M /GO] + (PSS/PAH)0.5M, c) sample 3 (PSS/PAH)20.5M + [GO/PAH]2.5 + (PSS/PAH)0.5M using a concentration of 0.1 mgml-1 of GO during the assembly. 199
6.4 TEM micrographs of a) sample 2: (PSS/PAH)20.5M + [GO/(PAH/PSS/PAH)0.5M/GO] + (PSS/PAH)0.5M, b) sample 3: (PSS/PAH)20.5M + [GO/PAH]2.5 + (PSS/PAH)0.5M, c-d) magnification of samples 1, 2 respectively. GO concentration was 0.2 mgml-1. 200
6.5 Raman of the GO-capsules. a) Raman spectra of GO sheets, G band located at 1598 cm-1 and D band at 1353 cm-1. b) Image of the sample 2: (PSS/PAH)20.5M + [GO/(PAH/PSS/PAH)0.5M /GO] + (PSS/PAH)0.5M capsules onto Si wafer with the selected area to be analysed. c) Mapping by intensity of the G band at 1598 cm-1 of the area selected in b. d) Image of sample 3 (PSS/PAH)20.5M + [GO/PAH]2.5 + (PSS/PAH)0.5M capsules onto Si wafer with the selected area to be analysed. e) Mapping by intensity of the G band at 1598 cm-1 of the area selected in d. 202
6.6 Atomic force microscope images of dried hybrid PE/GO capsules. a) Height image of a 50 x 50 µm image, with a profile corresponding to the line drawn in the image. b) Deflection image of the same area analysed in a). 204

List of tables
Chapter 2 | A Comparison of the Transport Properties of Supralinearly and linearly Growing Polyelectrolyte Multilayers: A Cyclovoltametry and Impedance Study.
2.1 Contact angle measurements at a different number of layers for PDADMAC/PSS and PVBTMAC assemblies.
108
Chapter 3 | Regenerable polyelectrolyte multilayers for applications in foulant removal.
3.1 Frequency and mass for the 1st and 2nd stacks before and after removal of the second block. Mass removal is also given in percentages. 132
Chapter 5| Hybrid Nanofiltration Membranes Based on Multiwalled Carbon Nanotubes and Polyelectrolytes.
5.1 Pure water permeability and ion rejection for 5mM MgSO4. MgSO4 filtrations were operated at a cross-flow velocity of 0.83 m s-1 (Reynolds ≈ 5000) and a permeate flux of 15 ± 2 l m-2 h-1. All experiments were conducted at 20 °C. 169
5.2 Pure water permeability and ion rejection for 5mM MgSO4. MgSO4 filtrations were operated at a cross-flow velocity of 0.83 m s-1 (Reynolds ≈ 5000) and a permeate flux of 15 ± 2 l m-2 h-1. All experiments were conducted at 20 °C. 180

Figures
2

1
Abstract
This PhD thesis is mainly focused on the development of hybrid materials
based on polyelectrolytes (PEs) and carbon nanomaterials assembled Layer by
Layer, for the fabrication of membranes with applications for water treatment,
for the templating of capsules and the development of smart surfaces. In
parallel we have performed extensive physico-chemical characterization of the
fabricated systems with emphasis on their permeability, ionic conductance and
stability in different media.
This thesis is divided in two; the first section is purely focused on multilayered
structures based in polyelectrolytes, while the second section pertains to hybrid
systems of carbon nanomaterials and polyelectrolytes.
POLYELECTROLYTE MULTILAYERS
In chapter 2, a comparison between two polyelectrolyte multilayers (PEMs)
with the same polyanion but different polycations with quaternary amines
showing different growth regimes has been presented; poly (diallyl dimethyl
ammonium chloride) (PDADMAC)/ poly (sodium 4-styrenesulfonate) (PSS)
shows a supralinear growing regime while multilayers of poly
(vinylbenzyltrimethylammonium chloride) (PVBTMAC)/PSS display a linear
growing regime. Both multilayer systems are assembled in the same
conditions. Contact angle measurements were made for both PEM systems as a
function of the number of layers. Cyclic voltammetry and impedance
spectroscopy studies reveal that although both multilayer systems show similar

Abstract
2
insulating responses, the way the electrons are transferred along the film to the
surface of the electrode for the redox reaction between K4Fe(CN)6 and
K3Fe(CN)6 is different. A particular phenomenon of complexation between
PDADMAC/PSS and the ferro species occurs once 11 layers are assembled; the
multilayer behaves as an electron regulating interface modifying the way the
charge transfer is produced.
In chapter 3, regenerable polyelectrolyte membranes have been prepared on the
basis of di-block polyelectrolyte multilayers (PEM) with a sacrificial top block of
polyelectrolytes on top of a non-removable PEM. The di-block PEM fabrication
is envisaged as a strategy for foulant removal and surface cleaning and
regeneration. Different protocols for PEM removal have been followed
according to the specific polyelectrolyte combination employed for the
fabrication of the top block.
Non removable supporting PEM blocks were fabricated with polyelectrolyte
combinations not affected by the stimuli used to remove the top block.
Bovine Serum Albumine (BSA) was used as a model foulant. For all di-block
PEMs coated with BSA on top, the BSA was removed with the top block or with
part of the top block, which could later be regenerated.
In chapter 4, responsive PEMs of PDADMAC and PSS with thicknesses
between 350 nm and 400 nm for 11 deposited polyelectrolyte layers were
fabricated by assembling polyelectrolytes at 3 M NaCl. When the bulk solution

Abstract
3
(3 M NaCl) is exchanged for water, the PEMs release water, approximately 46 %
of the total mass, and experience a reduction in thickness of more than 200 nm.
These changes in thickness and water content are fully reversible. The film
recovers its original thickness and water content when it is exposed again to a 3
M NaCl solution. A responsive polymer film is achieved with the capability of
swelling at high ionic strength and collapsing in water with variations in
thickness of hundreds of nanometers. Such a film could have applications as a
nanoactuator or for the fabrication of responsive barriers.
HYBRID SYSTEMS CARBON NANOMATERIALS/POLYELECTROLYTES
In chapter 5, a PEM of PDADMAC and PSS has been deposited on top of a thick
layer micrometer range of multiwalled carbon nanotubes (MWCNTs)
assembled on a porous SiC tubular membrane support. MWCNTs are
assembled “Layer by Layer” (LbL) by alternately depositing oxidized carbon
nanotubes (CNTs) and poly (allylamine hydrochloride) (PAH) modified CNTs.
The MWCNT layer is crosslinked by annealing after assembly. The MWCNT
layer acts as a spacer between the PDADMAC/PSS PEM and the SiC support.
The MWCNT support increases water permeability by 42% compared to the
PEMs deposited without MWCNTs. Hybrid MWCNT-PEM membranes show
high rejection for divalent ions, which increases directly with flux. A rejection
rate of up to 92 % was measured for MgSO4 and up to 60 % rejection rate
difference between MgCl2 and NaCl, making the hybrid MWCNT PEMs highly
appealing for nanofiltration and mono and divalent ion separations.

Abstract
4
In chapter 6, a novel and facile method was developed to produce hybrid
graphene oxide (GO)-polyelectrolyte capsules using erythrocyte cells as
templates. The capsules are easily produced through the Layer by Layer
technique using the alternating deposition of polyelectrolyte layers of PAH as
the polycation and PSS as the polyanion and GO sheets. The amount of GO,
and therefore its coverage, in the resulting capsules can be tuned by adjusting
the concentration of the GO dispersion during the assembly. The capsules
retain the approximate shape and size of the erythrocyte template after the
latter is fully removed by oxidation with NaOCl in water. The PE/GO capsules
maintain their integrity and can be placed or located on other surfaces such as
in a device. When the capsules are dried in air, they collapse to form a film that
is approximately twice the thickness of the capsule membrane. AFM images in
the present study suggest a film thickness of ~ 30 nm for the capsules in the
collapsed state implying a thickness of ~ 15 nm for the layers in the collapsed
capsule membrane.

5
Resumen
El contenido de esta tesis está principalmente enfocado al desarrollo de
materiales híbridos basados en polielectrolitos y nanomateriales de carbono
ensamblados mediante la técnica “capa a capa” con el objetivo de fabricar
membranas con aplicaciones en tratamiento de agua, el desarrollo de
superficies inteligentes y la producción de cápsulas. En paralelo se ha realizado
una extensa caracterización fisico-química de los sistemas fabricados con un
especial énfasis en su permeabilidad, conductividad iónica y estabilidad en
diferentes medios.
Esta tesis la hemos agrupado en dos partes; una primera parte enfocada en
estructuras multicapa únicamente basadas en polielectrolitos y una segunda
parte en la que se discuten los sistemas híbridos compuestos por materiales
basados en carbono en combinación con polielectrolitos.
MULTICAPAS DE POLIELECTROLITOS
La caracterización fisico-química de multicapas de polielectrolitos es
fundamental para poder ensamblarlos en condiciones óptimas que permita
controlar posteriormente su desempeño en las aplicaciones requeridas.
En el capítulo dos se ha realizado un estudio comparativo de dos tipos de
multicapas fabricadas “capa a capa”que presentan regímenes de crecimiento
diferente. Se han comparado dos pares de polielectrolitos con un mismo
polianión, PSS, pero que difieren en el policatión, por un lado poly (diallyl

Resumen
6
dimethyl ammonium chloride) (PDADMAC) que en combinación con poly
(sodium 4-styrenesulfonate) (PSS) presenta un régimen de crecimiento
supralineal y por otro lado poly (vinylbenzyltrimethylammonium chloride)
(PVBTMAC) cuyo crecimiento es lineal. Se estudió la variación del ángulo de
contacto con el número de capas ensambladas. Mediante estudios
electroquímicos de voltametría cíclica y espectroscopía por impedancia se ha
observado que ambas multicapas presentan una capacidad aislante bastante
similar, sin embargo la manera en que la transferencia de electrones se produce
para dar lugar a la reacción de oxidación-reducción entre las especies
K4Fe(CN)6 y K3Fe(CN)6 utilizadas como sonda es diferente. A partir de la
onceava capa en el sistema PDADMAC/PSS se produce la formación de un
complejo entre las especies electroquímicas usadas como sonda y el policatión,
PDADMAC, la multicapa empieza a actuar como una interfaz reguladora de
electrones, modificando así la manera en que se produce la transferencia de
carga.
En el capítulo tres se han efectuado estudios de estabilidad de la multicapa
frente a agentes externos con el efecto de producir membranas de
polielectrolitos regenerables y con propiedades “antiincrustantes”; adherencia
de material orgánico que inhabilita o perjudica el desempeño del proceso de
filtrado.
La metodología de trabajo seguida se basó en la preparación de di-bloques de
multicapas de polielectrolitos; un primer bloque sobre el que el estímulo
externo no es eficaz y un segundo bloque depositado sobre este primero que sea

Resumen
7
total o parcialmente removido ante el estímulo. Este segundo bloque puede ser
reconstruido a posteriori. Se han seguido diferentes protocolos de
deconstrucción y regeneración de este segundo bloque en función de la
combinación de polielectrolitos elegida para cada sistema. Como test
antiincrustante se ha depositado albumina de suero bovino, como modelo de
incrustación, sobre la multicapas y se ha comprobado que es posible remover la
proteína con el bloque superior o parte de él aplicando el estímulo apropiado.
La fuerza iónica es una de los parámetros que influyen de manera más
relevante tanto durante el ensamblado de las multicapas como al ser aplicado a
posteriori sobre las mismas.
En el capítulo cuarto se han fabricado multicapas de polielectrolitos responsivas
constituidas por PDADMAC y PSS que alcanzan espesores entre 350 nm y 400
nm para 11 capas depositadas al ser ensambladas bajo condiciones de fuerza
iónica altas como 3M NaCl. Tras el ensamblado al someterlas a agua pura sin
ningún contenido en sal, se produce un efecto de colapso de la multicapa por
efecto de la liberación del agua que contenía internamente, aproximadamente
un 46% del agua total retenida es liberada produciendo una disminución de
alrededor de 200 nm en el espesor de la multicapa. Estos cambios en el
contenido de agua y por consiguiente en su espesor son totalmente reversibles,
volviendo a su estado original una vez se somete a una solución de 3M NaCl
nuevamente. Este tipo de films puede ser utilizado como nano interruptor o en
la fabricación de barreras responsivas.

Resumen
8
SYSTEMAS HÍBRIDOS EN BASE A NANOMATERIALES DE CARBONO Y
POLIELECTROLITOS
En el capítulo quinto se han utilizado nanotubos de carbon multicapa para el
desarrollo de membranas de nanofiltración. Partiendo como soporte de una
membrana tubular porosa de SiC se ha depositado sobre esta una multicapa de
nanotubos de carbono mediante la técnica “capa a capa” alternando nanotubos
multicapas oxidados y nanotubos modificados con un policatión, PAH. Sobre
esta multicapa de nanotubos se ha depositado una multicapa de polielectrolitos
PDADMAC/PSS.
La multicapa de nanotubos de carbono actúa como espaciador entre el soporte
y la multicapa de polielectrolitos en contacto con la solución a filtrar, este
espaciador provoca un efecto de embudo durante el proceso de filtración
favoreciendo en un 42% la permeabilidad al agua y aumentando por tanto la
cantidad de solución que se puede filtrar. Estas membranas híbridas presentan
una alto rechazo frente a iones divalentes, el cual aumenta directamente con el
aumento de flujo de la solución. Un rechazo de hasta un 92% se ha medido
frente a MgSO4 y se ha observado una diferencia de hasta un 60% entre el
rechazo a MgCl2 y NaCl por lo que este tipo de membranas resultan atractivas
para su uso en aplicaciones de separación de iones mono y divalentes de
soluciones en las que coexisten.
En el capítulo sexto se ha desarrollado un método sencillo y novedoso para la
producción de cápsulas híbridas de oxido de grafeno y polielectrolitos
utilizando como plantilla eritrocitos (glóbulos rojos).

Resumen
9
Para la producción de estas cápsulas se ha utilizado el método “capa a capa”
alternando polielectrolitos PAH a modo de policatión y PSS como polianión
intercalando láminas de oxido de grafeno. La cantidad de óxido de grafeno y
por lo tanto el recubrimiento de las cápsulas por el mismo es ajustable en
función de la concentración de oxido de grafeno utilizada durante el
ensamblado. Las cápsulas mantienen el tamaño y forma del eritrocito que se ha
usado como plantilla, una vez la multicapa se ha ensamblado completamente el
eritrocito es eliminado mediante oxidación con hipoclorito sódico, dejándolas
huecas.
Estas cápsulas huecas mantienen su integridad y debido al tamaño del eritrocito
son fácilmente manipulables para poder situarlas en otro tipo de superficie a
modo de dispositivo. Cuando las cápsulas se secan y pierden su contenido
acuoso, colapsan formando un film de ~ 30 nm, el doble del espesor de la pared
de una cápsula individual.

Resumen
10

11
Abbreviations
Å Amstrong
AC Alternating current
AFM Atomic force microscopy
BSA Bovine serum albumine
cm Centimetre
CMM Capillary membrane model
CNT Carbon nanotubes
D Energy dissipation
d Space between planes diffraction planes (in x-ray diffraction)
dn/dc Refractive index increment
E1/2 Formal redox potential (in electrochemistry)
Ebinding Electron binding energy
EDS Energy dispersive x-ray spectroscopy
EIS Electrochemical impedance spectroscopy
Ekinetic Electron kinetic energies
Elost Energy lost during one oscillation
Ephoton Energy of the photon of x-ray source
Eq. Equation
ESCA Electron spectroscopy for chemical analysis
Estored Energy stored in the oscillator
eV Electron volts
f(Ka) Henry´s factor
Fig. Figure
f0 Resonant frequency of the quartz crystal (QCM-D)
FT-IR Fourier transform infrarred
FWHM Full with at half maximum
G Graphene
g Grams
GO Graphene Oxide
h Hour
HMM Homogeneous membrane model
Hz Hertz
i Harmonic number
ITO Indium tin oxide
K Spring force constant
kV Kilovolts

Abbreviations
12
L-B Langmuir-Blodgett
LbL Layer by Layer
m Meter
M Molar
MEMS Micro electrical mechanical systems
mg Milligram
MHz Mega hertz
ml Millilitre
mM Millimolar
MPS 3-mercapto-1-propanesulfonic acid
mV Millivolts
MWCNT Multiwalled carbon nanotubes.
MΩ Megaohms
n Integer (in x-ray diffraction)
N Newton
NEMS Nano electrical mechanical systems
ng Nanogram
NHE Normal hydrogen electrode
nm Nanometer
Pa Pascal
PAA Poly (acrylic acid)
PAH Poly (allylamine hydrochloride)
PBS Phosphate buffered saline
PDADMAC Poly (diallyl dimethyl ammonium chloride)
PEG Polyethylene glycol
PEI Poly(ethyleneimine)
PE Polyelectrolyte
PEM Polyelectrolyte membrane/multilayer
PMAA Poly (methacrylic acid) (PMAA)
PSS Poly (sodium 4-styrenesulfonate)
PVBTMAC Poly (vinylbenzyltrimethylammonium chloride)
PWP Pure water permeability
QCM-D Quartz crystal microbalance with dissipation
Ra Average roughness
Ret Electro transfer resistance
rGO Reduced graphene oxide
rpm Revolutions per minute
Rs Solution resistance
s Second
SCE Saturated calomel electrode
SDS Sodium dodecyl sulfate
SEM Scanning electron microscope
SWCNT Single walled carbon nanotubes

Abbreviations
13
TanΨ Change in the amplitude ratio (in ellipsometry)
TCF Transparent conducting films
TEM Transmission electron microscopy
tq Thickness of the quartz crystal (QCM-D)
TTAB (1-tetradecyl) trimethylammonium bromide
UHV Ultra high vacuum
UV Ultraviolet
V Volts
W Watts
wt. Weight
XPS X-ray photoelectron spectroscopy
Δ Phase difference (ellipsometry)
Δf Frequency change
Δm Adsorbed mass (QCM-D)
ε Dielectric constant
ζ Zeta potential
η Viscosity
θ Incident angle (in x-ray diffraction)
θγ Contact angle
λ Wavelength
μe Electrophoretic mobility
μl Microlitre
ρq Density of the quartz crystal (in QCM-D)
Φ Phase (EIS)
γlv Liquid-vapor interface tension
γsl Solid-liquid interface tension
γsv Solid-vapor interface tension

Abbreviations
14

15
Objectives and aim
This thesis has three main objectives:
1) To advance the knowledge on the assembly and physico-chemical
properties of layer by layer films, in particular those related to the use of
polyelectrolyte multilayers as nanofiltration membranes: i.e. the ionic
permeability.
2) To present a novel approach to remove foulants and regenerate layer by
layer films by using sacrificial top layers in PEM, which can be applied
for PEMs used for nanofiltration in situ under real operation conditions.
3) To assemble hybrid films based on polyelectrolytes and carbon
nanomaterials, carbon nanotubes and graphene oxide for the
development of nanofiltration membranes and capsules.
The first objective, the physico-chemical characterization of the PEMs
performed in the thesis, was fundamental for the two other objectives of the
work. Studies of PEM stability in different media were necessary to determine
the right conditions to develop films with sacrificial top layers with stable
bottom layers. The study of the assembly of the multilayers at high ionic
strength adds to the knowledge of how the quality of the layers can be tuned
with ionic strength as well as on the limits for the ionic strength at which PEMs
can be assembled. The electrochemical characterization of the layers is
important with regards to the use of the PEMs as nanofiltration membranes.
The comparison of the properties of PEMs with the same polyanion and similar

Objectives and aim
16
polycation with a quaternary amine but a different backbone structure for the
polymers let us advance the understanding of how the properties of the film are
influenced by its architecture.
The second objective has a strong practical goal. We want to address a different
approach for removing foulants from PEMs. Foulant accumulation is a
common problem in applications such as nanofiltration as all kinds of charged
organic molecules can attach to the PEMs. Very often these molecules are very
difficult to remove and in the case of nanofiltration devices they may eventually
block the pores of the membranes thereby limiting their application for
filtration and their lifetime. In this thesis, we propose to develop PEMs
fabricated with two blocks. A top block with a PEM that can be removed under
certain stimuli, such as pH or the presence of a surfactant, and a bottom block
that is stable under the conditions at which the top block is removed. In this
way, when the multilayer is covered by foulants we will be able to remove the
top layers with the foulants without affecting the whole PEM, and then
reassemble the top layers to reconstitute the original foulant free PEM. This
approach could be easily applied under operating conditions in reactors and
could significantly extend the lifetime of nanofiltration membranes.
The third objective of the thesis is to explore the use of carbon materials with
polyelectrolytes in hybrid layer by layer assemblies. We have selected two
possible applications: the generation of nanofiltration membranes using films of
carbon nanotubes as supports, and the development of capsules with graphene
oxide as layer constituent.

Objectives and aim
17
A problem with the use of PEMs as nanofiltration membranes is that they have
to be deposited on a support for practical applications. If the support is a
porous structure and these pores have dimensions larger than the
polyelectrolyte being assembled, the polyelectrolyte will pass through the pores
and deposit on the pore walls reducing the pore size, affecting the flux and
producing a membrane with defects. To avoid this situation we have
assembled a film of carbon nanotubes in a layer by layer fashion using
positively and negatively charged nanotubes and used it as a spacer between
the membrane support and the PEM. The nanotubes will not penetrate the
porous support thereby creating a porous structure but with smaller pores, on
top of which we will assembly the PEMs. We will show that PEMs supported
on nanotube films have improved ion separation properties while retaining
high flux.
Finally, we want to show a different approach to use graphene oxide in
assemblies leading to capsules, with potential applications in delivery or
controlled deposition of layered hybrid graphene/polyelectrolyte composites in
the dry state. For this purpose we have coated red blood cells with
multilayered films based on polyelectrolytes and graphene oxide which, are
later oxidized in order to remove the core biological material. This results in
empty capsules with high graphene oxide content.
This thesis aims to explore practical applications of PEMs: antifouling films,
nanofiltration membranes, and delivery systems based on hybrid assembly
concepts: blocks of polyelectrolytes, films of carbon nanotubes supporting

Objectives and aim
18
polyelectrolyte multilayers and graphene oxide assembled with
polyelectrolytes. In parallel, we have performed a careful physicochemical
characterization in order to understand fundamental issues related to the
assembly and properties of PEMs that are highly relevant for practical
applications.
This dissertation has been divided into two sections; the first section focuses on
multilayered structures based on polyelectrolytes and a second section
focussing on hybrid systems of carbon nanomaterials and polyelectrolytes. The
work is divided into six chapters.
POLYELECTROLYTE MULTILAYERS
In the first chapter the different techniques used during the course of this work
are briefly explained, together with a list of the materials employed.
In the second chapter, differences in the structural conformation of two
multilayered membranes assembled in a layer by layer fashion using the same
polyanion but a different polycation are studied by electrochemical techniques.
The comparison is measured in terms of permeability to cyanoferrate
electrochemically active molecules.
In the third chapter, di-block multilayered membranes with antifouling
properties are analysed. The di-block system consists of a permanent block
with a sacrificial block on top which is removable under an external stimulus.
The performance, with a protein simulating organic fouling on top, and their
regeneration afterwards is analysed.

Objectives and aim
19
In the fourth chapter smart surfaces that change their content in water and
therefore their thicknesses following changes in the ionic strength of the
surrounding media are produced by assembling the polyelectrolytes at 3 M
NaCl.
HYBRID SYSTEMS BASED ON CARBON NANOMATERIALS AND
POLYELECTROLYTES
In the fifth chapter, hybrid carbon nanotubes/polyelectrolyte structures are
assembled in between porous substrates and PEMs with nanofiltration
purposes. Acting as a spacer, they enhance the ion retention and flux
parameters of nanofiltration membranes.
In the sixth and final chapter, hybrid capsules of graphene oxide and
polyelectrolytes using erythrocytes as templates are produced.

Objectives and aim
20

21
Introduction
“Nanotechnology is the technology based on the manipulation of matter with at
least one dimension in the nanometer scale, from 1 to 100 nm”, definition
established by the National Nanotechnology Initiative a United States federal
government program.
In 1959 the physicist Richard Feynman gave a talk entitled “There is Plenty of
Room at the Bottom”, in which he predicted the ideas and concepts that years
later would become defined as Nanotechnology. The term was coined by
Professor Norio Taniguchi in 1974 in his work in ultraprecision machining.
With the appearance of the electron microscope in 1937 and afterwards with the
scanning tunnelling microscope in 1981, it became possible to visualise
individual atoms, material and structures at the nanoscale. A new
revolutionary period in science had started.
In the intervening years, material science has developed into an
interdisciplinary field that encompasses all kinds of organic and inorganic
materials such as polymers, metals, biological components, inorganic and
organic molecules to be used in multiple applications in medicine,
biotechnology, engineering, physics, biology and/or chemistry.
Due to the unique properties of material at the nanoscale massive interest has
been generated regarding the use of these materials to create nanostructured
functional materials and assembly techniques for the preparation of molecular
assemblies with tuneable compositions, structures and enhanced properties.1

Introduction
22
Pioneering work on synthetic nanoscale heterostructures based on organic
molecules was carried out by Kuhn in the 1960s using the Langmuir-Blodgett
(L-B) technique.2 These experiments are often considered as the first true
nanomanipulation experiments performed involving the mechanical handling
of individual molecular layers with angstrom precision.
In the early 1980s Sagiv et al., were able to produce layered films via covalent
adsorption of organic molecules with specific functional groups onto a solid
substrate as an alternative to the L-B method.3
In 1992, Decher and collaborators developed a technique capable of producing
nanostructured films mostly independent of the nature, size and topology of
the substrate provided that it is charged or can interact with the absorbing
molecules by any other interaction i.e. hydrogen bonding, hydrophobic
interactions, coordination chemistry, etc. This technique was called “Layer by
Layer” (LbL) and it is mainly based on the electrostatic attraction of oppositely
charged molecules.4,5
Layer by Layer.
In the layer by layer technique positively and negatively charged
polyelectrolytes are alternately assembled on top of charged surfaces, planar or
colloidal. Polyelectrolytes are polymers with charged or chargeable groups
within the monomer repeating units. We can distinguish between:
- Strong polyelectrolytes: display permanent charges in solution for most
reasonable pH values.

Introduction
23
- Weak polyelectrolytes: charge is pH dependent.
The electrostatic interaction between the oppositely charged polyelectrolytes is
the main driving force leading to the assembly of LbL films. Besides
electrostatics, the increase in entropy resulting from the liberation of counter
ions plays an important role in the assembly. As mentioned above other
interactions can lead to the formation of LbL film such as hydrogen bonding,
coordination chemistry, charge transfer and host interactions.6–12
Schlenoff et al. describe the polyelectrolyte assembly through a charge
overcompensation mechanism.13,14 Polyelectrolyte multilayer (PEM) formation
involves an overall electroneutrality during the building up of the layers. This
mechanism for LbL is based on intrinsic and extrinsic charge
overcompensations and competitive ion pairing, see Fig. 1.
- Intrinsic charge compensation: pairing of the charges between oppositely
charged polyelectrolytes or segments of them. There are no counterions
within the bulk of the polymer layers and all non-compensated charges
are located at the surface.
- Extrinsic charge compensation: pairing of the polyelectrolyte charges
with oppositely charged counterions if dissolved salt is present in the
surrounding medium
- Competitive ion pairing: competitive ion exchange due to the addition of
a new oppositely charged polyelectrolyte at the moment of creating a
new layer during assembly.14

Introduction
24
Figure 1. a) intrinsic charge compensation between two oppositely charged
polymer strands. b) extrinsic compensation occurs with the addition of salt. c)
Competing for polymer charge in the presence of additional polyelectrolyte
during the assembly of a new layer.14
Upon assembly, when an oppositely charged polyelectrolyte approaches the
extrinsic charge on the surface becomes intrinsically compensated by the
interaction with the depositing polyelectrolyte chains. Due to the interaction
with the new polyelectrolyte layer counter-ions are released from the bulk
creating an entropic driving force for the LBL assembly.15
LbL is an easy and robust technique, representing a powerful, effective and
simple strategy for modifying surfaces and endowing them with specific
properties. From a practical point of view, LbL assembly only requires the
dipping of a charged substrate into a solution of polyelectrolyte with a charge
opposite to that of the substrate. The procedure is repeated a number of times

Introduction
25
alternating between polycations and polyanions, including water or salt
rinsings between layer deposition, until a film of the desired thickness is
obtained.5,16,17
The dipping method of deposition is simple to implement and can even be
automated. It is, however, time consuming since adsorption time and rinsing
steps for each layer are required, see Fig. 2. Alternative methods have been
developed to speed up the process, such as spray deposition and spin
coating.18–20
Figure 2. a) Scheme of the film deposition process using flat substrates and
beakers, step 1 and 3 represent the adsorption of a polyanion and a polycation
respectively, while 2 and 4 are rinsing steps. b) Simplified picture of the first
two adsorption steps, counterions are omitted for clarity.16
Alternatively, if working with colloids, these are alternately suspended in
polycation and polyanion solutions with several rinsing steps by centrifugation

Introduction
26
in between until a film of the desired thickness is obtained. In the case of
colloids, the core can be removed after PEM assembly in order to create
capsules, see Fig. 3.
Figure 3. Schematic illustration of polyelectrolyte multilayer films on colloids
and capsule creation by core removal afterwards.21
The practical procedures applied by the different groups working in LbL
assembly varies, regarding the number of rinsing steps between the deposition
of layers, the use of salt or water for the washings, assembly time, pH, and the
ionic strength of the polyelectrolyte solution amongst others.22–25 For some of
these parameters, variations in the conditions of assembly can have a strong
impact on the quality of the assembled PEMs.

Introduction
27
For example, the thickness of the PEMs can be tuned by adjusting the charge
density of the polyelectrolytes involved. In the case of strong polyelectrolytes
the charge is not affected by changes in pH however, it is possible to modify the
intramolecular interactions by screening the electrostatic interactions by
adjusting the salt concentration of the polyelectrolyte solution.26 A charged
polyelectrolyte in solution without salt adopts a more extended conformation
due to intramolecular repulsive interactions between the charges of its own
chain.
When the ionic strength is increased, the charges in the polyelectrolyte are
screened causing the chain to adopt a more coiled conformation. The
polyelectrolyte assembled in coiled conformations will result in thicker layers
compared to assembly in an extended conformation. If the polyelectrolyte is
weak, the pH will affect the charge of the polyelectrolyte and consequently its
conformation in solution and the thickness of assembled layers.
LbL films can be deposited onto a huge variety of substrates and, as already
mentioned, different combinations of molecules or objects are possible, not only
polyelectrolytes. Small molecules, proteins, vesicles, and nanomaterials can be
assembled in LbL films. The characteristics of the LbL assembly and the large
variability in the composition of the films make PEMs suitable for many
applications. Among them we can cite the fabrication of polyelectrolyte
capsules for biomedical applications,23,27,28 sensors,29 optical lenses,30
membranes for nanofiltration31–33, reverse osmosis,34 anticorrosion coatings,35
and antireflection coatings36 to mention some examples.

Introduction
28
- Principal parameters that influence LbL assembly.
There are some parameters that must be taken into account in order to
create a desired multilayer film.15
Choice of polyelectrolyte pair: the multilayer formation depends on the
properties of the constituent polymers and the strength of the polymer-
polymer interaction. The characteristics of the polymers and their
interaction will determine the growth mechanism, the resultant
thickness, roughness, porosity, hydrophilicity, swellability and
mechanical properties. For example: pairs that assembly preferably by
intrinsic compensation will produce thinner, less permeable films that
are less prone to swelling.37,38
The ionic strength of the polyelectrolyte solution: the ionic strength of the
polyelectrolytes during the assembly has a direct impact on the quality of
the assembled layers. High salt concentration causes the screening of
polyelectrolyte (PE) chains, and results in more coiled polyelectrolytes
and therefore thicker layers.
pH: the charge density of weak polyelectrolytes can be tuned by
changing the pH which, in turn affects the polymer conformation and the
resulting layer thickness. pH changes after LbL assembly can lead to the
reorganization of the multilayer.22,39,40
Temperature: It can have both a negative and positive impact on the
assembly. On one side high temperatures play against electrostatic

Introduction
29
attraction giving more mobility to the polymer chains; on the other hand
temperature enhances the entropic gain by releasing counterions
improving the polyelectrolyte assembly.41
All these parameters will influence the structure of the resultant film and
therefore the physico-chemical properties. A general overview of the main
properties to be studied in LbL films will be outlined next.
Film Growth and Thickness.
An important factor to take into account in multilayer formation is the growth
rate of the multilayer. If the growth rate is linear, the film grows as a linear
function of the pairs deposited which means that the amount of polyelectrolyte
deposited per pair is approximately constant. The degree of interpenetration
between layers is low, meaning that each new adsorbed layer neutralises almost
all of the charges of the previous layer; the charge overcompensation is mainly
intrinsic.13 A small amount of excess charge through polymer loops, or tails,
becomes the driving force for growth.42 These films usually behave from a
mechanical point of view, more like elastic solids.43,44
On the other hand, if the growth is supralinear the mass of each polymer layer
increases as the number of layers increases. In this type of growth the
interaction between the PEs is not so strong and both intrinsic and extrinsic
charge compensation coexist, there is a high degree of chain mobility between
assembled layers. Typically, if one of the polyelectrolytes has a low charge
density and is highly swollen in water it can diffuse into the film and results in

Introduction
30
supralinear growth.45 This results in thick films following a relatively small
number of deposition steps.46,47 Films are highly hydrated and from a
mechanical point of view they can be thought of as having more viscolelastic
behaviour.48
Roughness.
It is generally accepted that roughness is related to the thickness. The thicker
the film the rougher it will be. The characteristics of the substrate on which the
PEM is deposited will strongly influence the final roughness but all factors
affecting film thickness will also impact on film roughness, such as the
polyelectrolyte pair chosen, film growth, salt content, pH.49
As explained, high ionic strengths induce a more coiled conformation of the
polyelectrolytes resulting in thicker films displaying greater surface
roughnesses.
Polyelectrolyte combinations, or conditions that produce thin and glassy films,
usually with linear growth, are less rough, while supralinear, or exponentially,
grown films will yield rougher films.50
Hydration and Swellability
Film hydration refers to the content of water which is trapped in the films. A
general rule is that films composed of polysaccharides and polypeptides retain
more water than synthetic polyelectrolytes, at comparable salt concentrations.

Introduction
31
This is due to the hydrophobic character of the backbone in synthetic
polyelectrolytes.51
Film hydration and the film swelling capability are strongly associated to the
pair of polyelectrolytes selected and also to the conditions of assembly such as
ionic strength, pH, and the swelling solvent. It has already been reported that
responsive PEMs with the capability of modifying thickness via the release or
uptake of water under changes in ionic strength or pH of the medium.52–54
Stability
An important aspect regarding the use of PEMs is their stability in the
environment/conditions in which the PEMs will be applied.
For example, if the PEM is to be applied in cell cultures it must be stable in
physiological conditions and in cell media. If the PEM is to be built in specific
acidic conditions, e.g.: collagen/hyaluronic acid, which are assembled at low
pH, they cannot be exposed to solutions of pH 7 because as Johansson et al.
found these films dissolve under these conditions.55
One possible application of PEMs is their use as nanofiltration membranes in
combination with commercial membranes for water treatment. Typically these
types of membranes are cleaned in industrial applications with a bleach
treatment. Then, for this application the use of polyelectrolytes with primary
amines must be avoided as these oxidize and degrade in the presence of bleach
as shown by Gregurec et al.56

Introduction
32
Consequently, this instability may be advantageous for other applications. As
we will see in chapter 4, instability of multilayers in certain conditions can be
used to selectively remove polyelectrolyte layers, which can be used for
antifouling treatments. The stability of polyelectrolyte multilayers has been
studied in different conditions such as high ionic strength, pH, and the presence
of surfactants amongst others.57–59
Mechanical Properties
Mechanical properties of polyelectrolyte multilayers vary significantly
depending on the PE pair used and on the deposition conditions. Depending
on these conditions PEMs can behave as rubber like or glassy materials.60
It has been shown that the elastic modulus will be different if PEMs are
stabilised mainly by electrostatic interactions, or by hydrogen bonding. In the
case of PEMs stabilised by electrostatic interactions such as PAH/PSS or
PDADMAC/PSS it has been found that the elastic modulus decreases with
increasing salt concentration after PEM assembly. A high ionic strength causes
instability in the ion pairings. It provokes the swelling of the PEM leading to
absorption of both water and ions thus producing a reduction in the elastic
modulus. Saline solutions act as plasticizers, turning glassy like multilayers
into more rubber like films.44 On the other hand for films stabilised by
hydrogen bonding interactions the elastic modulus increases with increasing
salt concentration. Regardless, there is a limit at which the structure begins to

Introduction
33
relax and the modulus decreases. In the case of PAH/DNA microcapsules this
effect happens at concentrations above 1 M NaCl.61
Mueller et al. in 2005 reported some kind of glass transition for
PDADMAC/PSS at temperatures above 35 ºC, there was a reversible decrease
in the elastic modulus of 2 orders of magnitude. The material appears to be
melting above 35 ºC going from a glassy to a viscoelastic fluid state and
returning to the original state at room temperature. However, there was no
evidence of glass transition by calorimetric methods.62
Film stiffness is extremely important in biological applications regarding cell
adhesion. There are several studies regarding this issue which highlight that
film stiffness can be adjusted by simply tuning the crosslinking between the PEs
in the PEM. This can be done by simple adjustment of the crosslinker
concentration if the crosslinking is done by carbodiimide chemistry between
carboxylic and amine groups, the polyanion and polycation respectively, or by
temperature changes if the crosslinking is thermal, pH control during assembly
and ultraviolet treatments.63,64
Permeability
Film permeability is one of the most interesting properties to control in PEMs.
Permeability is very important for several applications such as drug
delivery,65,66 water purification,67 solvent separation,68 gas barrier, etc .69
When discussing permeability we have to take into account different aspects of
permeability. Firstly, let us consider the case of PEM permeability to liquids,

Introduction
34
like pure water. In this case, the porosity of the film can be controlled by
choosing the appropriate assembly conditions. In general, more compact
structures show lower water permeability than less compact ones. Linearly
growing PEMs result in thinner and more compact structures than
supralinearly growing PEMs. Also, the degree of swelling of the films will
affect its porosity and compactness.
On the other hand, we have to consider the permeability to molecules, ions, or
particles. Different mechanisms can apply for the molecular permeability. One
of them is sieving, due to size exclusion, applicable also for neutral molecules.
Molecules or compounds bigger than the pore size will not pass through it.
Another possible mechanism is related to the electrostatic interaction of the
permeating species with the charges of the polyelectrolyte in the PEMs. The
positive or negative character and extent of the charge of the permeating
molecule or ions together with the character and charge density of the outer
layer of the film will influence the permeability. A negatively charged outer
layer PEM would be more effective at preventing negatively charged ions or
molecules to go through than a positively charged one. This effect has been
thoroughly studied by electrochemical techniques. Usually, for these
experiments a gold electrode is modified with a polyelectrolyte multilayer, and
exposed to an electroactive probe. The cyclic voltammetry or impedance
response is measured, obtaining information on the diffusion of the
electroactive probe.

Introduction
35
One of the latest studies published in this field from Elżbieciak-Wodka et al. in
2015, studied the permeability of potassium hexacyanoferrate II and III in
multilayers with different growing regimes, i.e.: PAH/PSS and
PDADMAC/PSS.70 Consequently, work performed during the completion of
this thesis will also follow in a similar vein. However, in this case the study will
analyse the permeability in films with polycations with similar chemical
structures, quaternary amines, but different growing regimes, i.e.: PVBTMAC
and PDADMAC in combination with PSS.
Polyelectrolytes in Membrane Separation Systems.
A membrane is a selective barrier between two phases that allows some
elements to transit through and stops others. Membranes based on PEs have
been considered suitable for building separation membranes with high
selectivity and permeability. PEMs are exquisitely suitable for nanofiltration
membranes. These membranes are usually consisting on a thin layer on top of a
porous support. PEMs are good candidates for this thin layer; the deposition
procedure is rather simple, it affords control of the membrane thickness at the
nanoscale by the addition of more or less layers, it also allows the use of a wide
range of different PEs which should permit the tailoring of the flux, selectivity
and even fouling rates.71
PEM based nanofiltration membranes are especially attractive for separation of
ions, their multipolar structure favours separation by Donnan exclusion of
mono and divalent ions.72 The charges on the surface of dense PEMs restrict

Introduction
36
permeation through the membrane of ions that have the same charge as the last
layer deposited on top and it is more efficient with multivalent ions.
For example, coated porous alumina with 5 bilayers of PAH/PSS on top
exhibits a rejection rate of 95 % for Mg2+ and Ca2+ and a high selectivity for
Na+/Mg2+ and even higher for Na+/Ca2+ with a better performance than NF 270
commercial membranes.33 The properties of PEMs in regards to nanofiltration
applications can be optimised by choosing the appropriate PE and deposition
conditions. It has to be taken into consideration that imperfections in the film
can reduce the selectivity of the membranes and produce convective transport
of ions thus reducing the overall efficiency of the membrane.
Nanomaterials.
Nanomaterials can be defined as objects displaying a size lower than 100 nm in
at least one of their three dimensions.73 However, when dealing with
nanomaterials it is important to take into consideration the state of aggregation.
There are different classifications for nanomaterials with respect to their origin,
dimensionality, morphology, composition, uniformity and agglomeration, etc.
- Classification According to Composition:
Nanomaterials can be classified on the basis of their chemical composition
into: 74
Metal and metal oxide based: metallic nanoparticles, e.g. Au, Ag..,
metal oxides such as titanium oxides, zinc oxide, iron oxide, etc

Introduction
37
Carbon based: Nanomaterials that display carbon atoms in sp2
configurations: fullerenes, carbon nanotubes, buckyballs, graphene.
Organic based: fabricated upon organic molecules: dendrimers formed
by branched polymer units, micelles, vesicles, etc…
Nanocomposites: materials made from two or more constituents at the
nanoscale that, when combined, produce a material with
characteristics different than those of the original components.
- Classification According to Dimensionality:73,75
This classification is based on the number of dimensions that are non-
nanoscale. As said before the nanoscale is considered below 100 nm.
0D: all the dimensions are nanoscale. E.g.: quantum dots, fullerenes,
nanoparticles, dendrimers and so on.
1D: only one of the dimensions is non-nanoscale, needle like shaped
materials, e.g.: nanotubes, nanowires and nanorods.
2D: two of the dimensions are non-nanoscale, plate like shape
nanomaterials, e.g.: nanofilms, nanolayers and nanocoatings.
3D: all of the dimensions are non-nanoscale. It refers to bulk materials
that possess nanocrystalline structure or the presence of features at the
nanoscale, i.e.: nanoballs with dendritic structures, nanoflowers,
nanopillars, etc.

Introduction
38
Figure 4. Schematic of nanomaterials classified by dimensionality. (Image taken
from http://eng.thesaurus.rusnano.com).
Nanomaterials have different properties compared to their bulk materials
which make them appealing for multiple applications. There are two principle
factors responsible of the nanoscale properties:
- Surface effects: The fraction of atoms at the surface of the nanomaterial is
very high compared to microparticles or bulk materials. They present a
large surface area to volume ratio and therefore a high particle number
per mass. Due to this large surface area they present an enhanced
reactivity compared with bulk materials.
- Quantum effects: when the size of a particle is comparable or smaller
than the Bohr radius of that material, electric dipoles are formed due to
spatially confined holes and electrons producing discrete electronic
energy levels, not continuous as in bulk material. Separation between
adjacent energy levels increases with decreasing size producing
transformations in the density of the energy levels.

Introduction
39
These factors result in variations in the properties of the materials with respect
to the bulk material. Some of the most common and general changes are listed
below:76–78
- Structural properties: crystal structure, lattice parameters, bonds and
bond strength at the nanoscale can differ from the bulk. For example,
gold nanoparticles are icosahedral while in bulk gold is face-centered
cubic.
- Thermal properties: melting point of nanomaterials decreases with size
reduction and is lower than for bulk material, also the melting point of
bulk material occurs at a specific temperature while at the nanoscale it
occurs over a broad temperature range.
- Chemical reactivity: chemical reactivity of nanomaterials can be altered
with respect to bulk material due to the different crystallographic
structure and also due to the high surface to volume ratio. Ionization
energy is generally higher for nanomaterials than for the bulk material.
- Mechanical properties: in the case of nanomaterials the ratio of grain
boundaries is really high increasing the amount of atoms close to or
related to incoherent interfaces or lattice defects such as dislocations,
vacancies and so on. Dislocations have a direct effect on the strength of
nanomaterials. Also, nanomaterials with different atomic structural
arrangements to bulk will show different mechanical properties.
- Magnetic properties: a large proportion of atoms on the surface lead to
different magnetic coupling between neighbouring atoms.

Introduction
40
Ferromagnetic materials show multiple magnetic domains, however
below a critical size, specific for each material, the spin of the electrons of
the atoms orient in the same direction to form a single domain,
displaying a super-paramagnetic behaviour. For example Fe, Co, Ni y
Gd are ferromagnetic in bulk but paramagnetic in the nanoscale.
Also non-magnetic material in bulk can display magnetic behaviour in
the nanoscale.
- Optical properties: these properties are connected to the electronic
structure. In bulk materials electrons are free to move but in
nanomaterials they are restricted, reacting differently with light. For
example, gold in bulk is yellow coloured but nanoscale gold particles can
be orange, purple, red or green depending in their size.
- Electronic properties: due to quantum effects, energy bandwidth and
conductivity of materials change at the nanoscale with respect to bulk
material. For example, silicon is an insulator in bulk but it is a conductor
in nanoscale. In metals, by reducing the size, energy bands become
narrower and ionisation potential energy increases causing a decrease in
conductivity.
Carbon Nanomaterials
Carbon is the basic element of life, from the chemical point of view it is special
not only from the multiple ways it can bond to other atoms but because it can
bond to itself in many different ways too. This tendency allows the formation
of different carbon network structures.

Introduction
41
Before the 1980’s only three carbon allotropes were known; graphite, diamond
and amorphous carbon. While the structure of fullerenes was postulated in
1965 it was not until 1985 when Kroto et al. discovered a cage formed by 60
carbons displaying unique stability and symmetry proving their existence.79
Thus, a new path for carbon nanotechnology was opened.80
In 1991, Sumio Ijima discovered carbon nanotubes, single or multi concentric
graphene cylindrical hollow tubes with high aspect ratios.81 Graphene (G), a 2D
single layer of graphite, even if it was already theoretically predicted since 1947,
was first produced and isolated in 2003.82
- Graphene.
Graphene is undoubtedly one of the most exciting materials generated in
the last decade. It has unique mechanical, optical, thermal and electrical
properties that may lead to the next generation of optoelectronic devices,
while its properties can be used in parallel applications.83,84
The unique properties of graphene, which form super strong sheets of
carbon a single atom thick, result from its planar nature and the sp2
hybridization of its carbon atoms.85
Single, bi and multi-layer graphene, is itself difficult to work with in soft
matter or wet chemistry applications because of dispersibility issues and
its tendency to form multi-layered agglomerates, which begin to acquire
the properties of graphite.86–88 Because of these difficulties, most studies
of graphene, whether for layered assembly or other investigations, have

Introduction
42
been performed on graphite oxide or its exfoliated form, GO, which bears
a mix of sp2 and sp3 hybridized carbons in an overall planar structure.
These derivatives of graphene have the potential to be reduced to what is
called a reduced form of graphene oxide, rGO, by chemical or physical
means, which can lead to materials with properties more like G than GO,
see Fig. 5.89–92 The derivation of G to form GO leads to easily dispersible
and stable systems containing GO with an overall surface charge while
exfoliated, for example, in water.93 The use of GO sheets in the formation
of hierarchical structures and assemblies is a subject of current interest
and, if done by procedures involving wet chemistry techniques, offers
much potential for the development of advanced and composite layered
materials.
Figure 5. Graphite can be exfoliated in single sheets of graphene that after
oxidation became graphene oxide and a posteriori reduction derivatizes in
reduced graphene oxide.

Introduction
43
- Carbon Nanotubes
Carbon nanotubes, as previously mentioned, are tubular structures that
can be considered to be rolled sheets of graphite, of nanometer diameter
and large length/diameter ratio. Nanotubes can be formed by a single
sheet of carbon atoms called single walled carbon nanotube (SWCNT) or
they can be formed by several sheets one inside the other called multi
walled carbon nanotubes (MWCNT).
The properties of the carbon nanotubes are determined by the chirality of
the graphite sheet, it depends on how the graphite sheet is rolled; the
orientation of the hexagonal network with respect to the long axis of the
nanotube. Depending on this, there are three different types, armchair,
zig-zag or chiral nanotube, see Fig.6).94
Figure 6. Representation of SWCNT and MWCNT and the three types of
conformations for carbon nanotubes. (Image taken from http://www.nano-
reviews.net).

Introduction
44
MWCNTs have similar properties to SWCNTs but in the case of MWCNTs
the outer walls can protect the inner walls from chemical interactions with
outside molecules. Also, in terms of reactivity the MWCNTs show more
reactivity due to multiple graphene edges at the surface. Depending on
the chirality they can behave as metallic or as semiconducting materials.
In terms of mechanical properties they present very high strength, elastic
modulus and resiliency, as well as good compression and extension
properties. Due to all of the above mentioned factors they have become a
very interesting material for nanofabrication, but there are also some
difficulties regarding the manipulation of this kind of nanomaterial.
One big issue is their poor solubility in most of the common solvents due
to their high hamacker constant, they tend to aggregate and form bundles
that afterwards precipitate. Another interesting point is post synthesis
purification. The most common method to solve these two issues in one
step is purification with strong oxidizing agents.95,96 In this case, it is
possible to not only eliminate impurities, but to oxidise the carbon
nanotubes providing oxygen groups on their surface, it improves the
solubility in polar solvents, facilitating the exfoliation of the bundles and
also provide groups for further surface modifications.
Surface modification of CNTs can be performed covalently or non-
covalently, e.g.: with polymers in a LbL fashion.97,98 These modifications
allow changes in the surface charge of the carbon nanotubes that can be
integrated into PEMs; alternated with polymers, or assembled in a layer

Introduction
45
by layer fashion themselves. Therefore, in this way well defined films and
tunable surfaces of different materials can be produced using carbon
nanotubes. 37,39–41
Hybrid Polyelectrolyte / Carbon Nanomaterials
Carbon nanomaterials have been thoroughly used in the past combined with
polymeric materials. Already during the 1990´s CNTs were presented as
promising fillers in the field of polymer nanocomposites because of their
remarkable electrical and mechanical properties. The first to present CNTs as
fillers in polymer composites were Ajayan et al. in 1994.102 Following this work,
and during the next decades, extensive effort was expended in the development
of this kind of application by improving the stiffness and strength of the
original polymer.103–105
One of the main problems with the use of carbon nanomaterials as CNTs in
composites is to have them in an isolated mode, minimising the formation of
bundles or aggregates due to Van der Waals interactions between adjacent
carbon sheets. Different strategies can be employed which depend on the
solvent to be used for the suspension.
One of the most successful strategies is surface modification which can be done
in different ways:
- Covalently attaching a molecule or grafting a polyelectrolyte to the side
walls or to the edges.

Introduction
46
- Non-covalent modification by wrapping a polymer around the walls of
the nanotube or stabilisation with surfactants. It has the advantage of not
disrupting the structure and electronic properties of the nanotubes.106
The first use of CNTs in LBL assembly with polyelectrolytes was done in order
to avoid dispersion issues in polymer composite development. It was
performed by Mamedov et al. in 2002, they assembled SWNTs with
poly(ethyleneimine) (PEI) in a LBL fashion and reported the advantages of non-
segregation between phases over the conventional mixing of the filler with the
polymer matrix for the composite production.107
Figure 7. Representation of Layer by Layer assembly of polyelectrolytes and
carbon nanomaterials; first sketch: carbon nanotubes/polyelectrolytes and
second scketch: graphene sheets/ polyelectrolytes. Image taken from
(http://chem.ubbcluj.ro/~studiachemia/docs/Chemia32015.pdf).
This was the start of several works that showed the huge potential of this
technique for the development of a wide range of functional materials, such
as:108

Introduction
47
- Sensor applications: Sensors can be developed analyzing changes in the
electrical properties of CNTs induced by chemical species, or in the
electrochemical response of a polymeric co-partner in the case of
nanocomposites, by structural deformation induced electrical resistance
changes of the composite or specially designed micro/nano electrical
mechanical systems (MEMS/NEMS).108 For example Xue et al. in 2007
patterned LBL CNT nanocomposites as flexible cantilevers arrays.109
- Fuel Cell: These types of structures have been used in the construction of
conductive and durable electrodes in fuel cell proton exchange
membranes. For example Nafion and Pt wrapped in CNTs assembled to
form a fuel cell proton exchange membrane showed unusual
performances.110
- Optoelectronic applications: The layered nanostructure produced by the
LBL technique together with the unique electrical properties of the CNTs
offers an exceptional scenario from which to exploit these hybrid
composite possibilities. These type of films were suggested for use as
high performance transparent conducting films (TCF) like polymeric thin
film transistors.111,112
- Biomedical applications: Hybrid composites with CNTs have been used
to coat objects, for example, for protective purposes, Angelini et al. in
2007 reported the protection of liposomes with a composite of shortened
CNTs.113 Hollow capsules have also been produced by removing the
core after the cover deposition.114

Introduction
48
Another possibility is to wrap the carbon nanotube with a LBL assembly
and produce systems for intracellular delivery, such as anti-cancer
enzymes assembled in MWCNTs and afterwards injected into tumor
cells.115
Graphene also has some drawbacks in order to use it as part of hybrid LBL
structured composites. The main issue is to isolate the graphene platelets from
the graphite. As previously explained, the most common method, especially if
it is to be used in a aqueous environment, is to oxidise the graphene to produce
graphene oxide.
The first reported case of the integration of GO in LBL multilayered films was
by Fendler et al. in 1996, where they developed multilayered films of GO and
polyelectrolyte that, post assembly, were reduced to graphene by chemical
methods.116,117 Similarly, with CNTs a lot of research has been done in this area
in an effort to exploit its capabilities related to high opto-electrical and
mechanical properties. Some applications are listed below:118–120
- Electrical conductor applications: graphene sheets present low intrinsic
electrical resistivity making them suitable in transparent conducting
films (TCF). Studies have been performed using graphene/polymer
composites assembled by LBL, but it was found that they show worse
performances compared to Indium Tin Oxide (ITO) unlike what it was
observed with CNTs.112,121

Introduction
49
TCFs based on graphene have been used as window electrodes in
organic solar cells.122
- Batteries: graphene composites have been used in Lithium ion batteries
as a replacement for commercial graphite. The capacity of the battery
can be boosted due to the presence of more places available for lithiation
by increasing the carbon based area where lithium ions penetrate.
Casagneu et al. produced high reversible specific capacity lithium-ion
batteries based on polyelectrolytes and GO nanosheets with a capacity of
1232 mAhg-1 versus the 372 mAhg-1 which is the theoretical limit of
specific capacity for commercial graphite batteries.117
- Supercapacitors: materials with large specific surface area are suitable
for use as supercapacitors where significant accumulation of electrical
energy can be obtained at the electrode/electrolyte interface.123
Supercapacitors with high capacitances as high as 263 Fg-1 have been
produced using layered GO/polymer composites.124,125
- Sensors: they have attracted a lot of interest in electrochemical,
electronic and optical sensors. Detection of gases is based on changes of
conductance induced by charge transfer between adsorbates and
graphene.123 Single molecule detection sensors of NO2 have been
produced or other aggressive gases like HCN for example.126,127 Also
extensive research in biosensing has been reported as for example a
cancer sensor with ultrahigh sensitivity based on LBL with graphene and
PDADMAC multilayers reported from Zhang et al. in 2011.128

Introduction
50
- Biomedical applications: the hybrid composites have been used to coat
objects and create capsules for drug encapsulation. A dual drug
encapsulation one inside the core and another one in the shell was
reported by Kurapati et al. in 2012.129
References
(1) Borges, J.; Mano, J. F. Chem. Rev. 2014, 114, 8883–8942.
(2) Kuhn, H.; Möbius, D. Angew. Chemie Int. Ed. English 1971, 10 (9), 620–637.
(3) Netzer, L.; Sagiv, J. J. Am. Chem. Soc. 1983, 105 (3), 674–676.
(4) Decher, G. Science (80-. ). 1997, 277 (5330), 1232–1237.
(5) Decher, G.; Hong, J. D. Berichte der Bunsengesellschaft für Phys. Chemie
1991, 95 (11), 1430–1434.
(6) Decher, G.; Hong, J. D.; Schmitt, J. Thin Solid Films 1992, 210–211 (0), 831–
835.
(7) Rydzek, G.; Schaaf, P.; Voegel, J.-C.; Jierry, L.; Boulmedais, F. Soft Matter
2012, 8 (38), 9738.
(8) Quinn, J. F.; Caruso, F. Langmuir 2004, 20 (1), 20–22.
(9) Kharlampieva, E.; Kozlovskaya, V.; Sukhishvili, S. A. Adv. Mater. 2009, 21
(30), 3053–3065.
(10) Xiong, H.; Cheng, M.; Zhou, Z.; Zhang, X.; Shen, J. Adv. Mater. 1998, 10
(7), 529–532.
(11) Zhang, Y.; Cao, W. Langmuir 2001, 17 (16), 5021–5024.

Introduction
51
(12) Dubacheva, G. V; Dumy, P.; Auzely, R.; Schaaf, P.; Boulmedais, F.; Jierry,
L.; Coche-Guerente, L.; Labbe, P. Soft Matter 2010, 6 (16), 3747–3750.
(13) Hatzor, A.; Moav, T.; Cohen, H.; Matlis, S.; Libman, J.; Vaskevich, A.;
Shanzer, A.; Rubinstein, I. J. Am. Chem. Soc. 1998, 120 (51), 13469–13477.
(14) Schlenoff, J. B.; Ly, H.; Li, M. J. Am. Chem. Soc. 1998, 120 (30), 7626–7634.
(15) Schlenoff, J. B.; Dubas, S. T. Macromolecules 2001, 34 (3), 592–598.
(16) Joseph, N.; Ahmadiannamini, P.; Hoogenboom, R.; Vankelecom, I. F. J.
Polym. Chem. 2014, 5 (6), 1817–1831.
(17) Dubas, S. T.; Schlenoff, J. B. Macromolecules 1999, 32 (24), 8153–8160.
(18) Schlenoff, J. B.; Dubas, S. T.; Farhat, T. Langmuir 2000, 16 (26), 9968–9969.
(19) Izquierdo, A.; Ono, S. S.; Voegel, J.-C.; Schaaf, P.; Decher, G. Langmuir
2005, 21 (16), 7558–7567.
(20) Chiarelli, P. A.; Johal, M. S.; Holmes, D. J.; Casson, J. L.; Robinson, J. M.;
Wang, H.-L. Langmuir 2002, 18 (1), 168–173.
(21) Hong, J.; Han, J. Y.; Yoon, H.; Joo, P.; Lee, T.; Seo, E.; Char, K.; Kim, B.-S.
Nanoscale 2011, 3 (11), 4515–4531.
(22) Shiratori, S. S.; Rubner, M. F. Macromolecules 2000, 33 (11), 4213–4219.
(23) Donath, E.; Sukhorukov, G. Angew. Chemie Int. Ed. 1998, 37 (16), 2201–
2205.
(24) Sukhorukov, G. B.; Donath, E.; Lichtenfeld, H.; Knippel, E.; Knippel, M.;
Budde, A.; Möhwald, H. Colloids Surfaces A Physicochem. Eng. Asp. 1998,
137 (1–3), 253–266.
Introduction
52
(25) McAloney, R. A.; Sinyor, M.; Dudnik, V.; Goh, M. C. Langmuir 2001, 17
(21), 6655–6663.
(26) Michel, M.; Toniazzo, V.; Ruch, D.; Ball, V. ISRN Mater. Sci. 2012, 2012, 1–
13.
(27) Boudou, T.; Crouzier, T.; Ren, K.; Blin, G.; Picart, C. Adv. Mater. 2010, 22
(4), 441–467.
(28) Delcea, M.; Möhwald, H.; Skirtach, A. G. Adv. Drug Deliv. Rev. 2011, 63
(9), 730–747.
(29) Shao, Y.; Xu, S.; Zheng, X.; Wang, Y.; Xu, W. Sensors 2010, 10 (4), 3585–
3596.
(30) Manju, S.; Kunnatheeri, S. Pharm. Dev. Technol. 2010, 15 (4), 379–385.
(31) Liu, G.; Dotzauer, D.; Bruening, M. J. Memb. Sci. 2010, 354 (1-2), 198–205.
(32) Stanton, B. W.; Harris, J. J.; Miller, M. D.; Bruening, M. L. Langmuir 2003,
19 (17), 7038–7042.
(33) Ouyang, L.; Malaisamy, R.; Bruening, M. L. J. Memb. Sci. 2008, 310 (1-2),
76–84.
(34) Jin, W.; Toutianoush, A.; Tieke, B. Langmuir 2003, 24 (16), 2550–2553.
(35) Eckle, M.; Decher, G. Nano Lett. 2001, 1 (1), 45–49.
(36) Shimomura, H.; Gemici, Z.; Cohen, R. E.; Rubner, M. F. ACS Appl. Mater.
Interfaces 2010, 2 (3), 813–820.
(37) Miller, M. D.; Bruening, M. L. Chem. Mater. 2005, 17 (21), 5375–5381.
(38) Harris, J. J.; Bruening, M. L. Langmuir 2000, 16 (4), 2006–2013.
(39) v. Klitzing, R. Phys. Chem. Chem. Phys. 2006, 8 (43), 5012–5033.

Introduction
53
(40) Elzbieciak, M.; Zapotoczny, S.; Nowak, P.; Krastev, R.; Nowakowska, M.;
Warszyński, P. Langmuir 2009, 25 (5), 3255–3259.
(41) Salomäki, M.; Vinokurov, I. A.; Kankare, J. Langmuir 2005, 21 (24), 11232–
11240.
(42) Schmitt, J.; Gruenewald, T.; Decher, G.; Pershan, P. S.; Kjaer, K.; Loesche,
M. Macromolecules 1993, 26 (25), 7058–7063.
(43) Jaber, J. A.; Schlenoff, J. B. J. Am. Chem. Soc. 2006, 128 (9), 2940–2947.
(44) Heuvingh, J.; Zappa, M.; Fery, A. Langmuir 2005, 21 (7), 3165–3171.
(45) Hoda, N.; Larson, R. G. J. Phys. Chem. B 2009, 113 (13), 4232–4241.
(46) Picart, C.; Mutterer, J.; Richert, L.; Luo, Y.; Prestwich, G. D.; Schaaf, P.;
Voegel, J.-C.; Lavalle, P. Proc. Natl. Acad. Sci. U. S. A. 2002, 99 (20), 12531–
12535.
(47) Picart, C.; Lavalle, P.; Hubert, P.; Cuisinier, F. J. G.; Decher, G.; Schaaf, P.;
Voegel, J.-C. Langmuir 2001, 17 (23), 7414–7424.
(48) Collin, D.; Lavalle, P.; Garza, J. M.; Voegel, J.-C.; Schaaf, P.; Martinoty, P.
Macromolecules 2004, 37 (26), 10195–10198.
(49) Ghostine, R. A.; Jisr, R. M.; Lehaf, A.; Schlenoff, J. B. Langmuir 2013, 29
(37), 11742–11750.
(50) Lavalle, P.; Gergely, C.; Cuisinier, F. J. G.; Decher, G.; Schaaf, P.; Voegel,
J. C.; Picart, C. Macromolecules 2002, 35 (11), 4458–4465.
(51) Picart, C. Curr. Med. Chem. 2008, 15 (7), 685–697.
(52) Moya, S. Macromol. Rapid Commun. 2012, 33 (12), 1022–1035.

Introduction
54
(53) Irigoyen, J.; Han, L.; Llarena, I.; Mao, Z.; Gao, C.; Moya, S. E. Macromol.
Rapid Commun. 2012, 33 (22), 1964–1969.
(54) Sukhishvili, S. A. Curr. Opin. Colloid Interface Sci. 2005, 10 (1-2), 37–44.
(55) Johansson, J. Å.; Halthur, T.; Herranen, M.; Söderberg, L.; Elofsson, U.;
Hilborn, J. Biomacromolecules 2005, 6 (3), 1353–1359.
(56) Gregurec, D.; Olszyna, M.; Politakos, N.; Yate, L.; Dahne, L.; Moya, S. E.
Colloid Polym. Sci. 2015, 293 (2), 381–388.
(57) Irigoyen, J.; Politakos, N.; Murray, R.; Moya, S. E. Macromol. Chem. Phys.
2014, 215 (16), 1543–1550.
(58) Han, L.; Mao, Z.; Wuliyasu, H.; Wu, J.; Gong, X.; Yang, Y.; Gao, C.
Langmuir 2012, 28 (1), 193–199.
(59) Iturri Ramos, J. J.; Llarena, I.; Moya, S. E. J. Mater. Sci. 2010, 45 (18), 4970–
4976.
(60) Jaber, J. a.; Schlenoff, J. B. Curr. Opin. Colloid Interface Sci. 2006, 11 (6),
324–329.
(61) Heuvingh, J.; Zappa, M.; Fery, A. Langmuir 2005, 21 (7), 3165–3171.
(62) Mueller, R.; Köhler, K.; Weinkamer, R.; Sukhorukov, G.; Fery, A.
Macromolecules 2005, 38 (23), 9766–9771.
(63) Schneider, A.; Francius, G.; Obeid, R.; Schwinté, P.; Hemmerlé, J.; Frisch,
B.; Schaaf, P.; Voegel, J. C.; Senger, B.; Picart, C. Langmuir 2006, 22 (3),
1193–1200.
(64) Detzel, C. J.; Larkin, A. L.; Rajagopalan, P. Tissue Eng. Part B. Rev. 2011,
17 (2), 101–113.

Introduction
55
(65) Wang, Y.; Wang, S.; Xiao, M.; Han, D.; Hickner, M. A.; Meng, Y. RSC
Adv. 2013, 3 (35), 15467–15474.
(66) Lu, H.; Hu, N. J. Phys. Chem. B 2007, 111 (8), 1984–1993.
(67) Chan, E. P. Soft Matter 2014, 10 (17), 2949–2954.
(68) Liu, D. S.; Ashcraft, J. N.; Mannarino, M. M.; Silberstein, M. N.; Argun, A.
A.; Rutledge, G. C.; Boyce, M. C.; Hammond, P. T. Adv. Funct. Mater.
2013, 23 (24), 3087–3095.
(69) Yang, Y.-H.; Bolling, L.; Priolo, M. A.; Grunlan, J. C. Adv. Mater. 2013, 25
(4), 503–508.
(70) Elżbieciak-Wodka, M.; Kolasińska-Sojka, M.; Nowak, P.; Warszyński, P.
J. Electroanal. Chem. 2015, 738, 195–202.
(71) Miller, M. D.; Bruening, M. L. Langmuir 2004, 20 (26), 11545–11551.
(72) Krasemann, L.; Tieke, B. Langmuir 2000, 16, 287–290.
(73) Tiwari, J. N.; Tiwari, R. N.; Kim, K. S. Prog. Mater. Sci. 2012, 57 (4), 724–
803.
(74) Khanna, V. K. In Nanosensors: Physical, Chemical, and Biological; CRC
Press: Boca Raton, 2011; pp 85–142.
(75) Pokropivny, V. V.; Skorokhod, V. V. Mater. Sci. Eng. C 2007, 27 (5-8), 990–
993.
(76) Balaguru, R. J. B. Quantum size effect , electrical conductivity and
Quantum transport School of Electrical & Electronics Engineering
http://www.nptel.ac.in/courses/115106076/Module 6/Module 6.pdf.

Introduction
56
(77) Balaguru, R. J. B. Introduction to Materials and Classification of Low
Dimensional Materials School of Electrical & Electronics Engineering.
(78) Mani Naidu S. Applied Physics; Pearson, Ed.; Dorling Kindersley:
Chennai, Delhi, Chandigarh, 2010.
(79) Kroto, H. W.; Heath, J. R.; O’Brien, S. C.; Curl, R. F.; Smalley, R. E. Nature
1985, 318 (6042), 162–163.
(80) Oliveira, S. F.; Bisker, G.; Bakh, N. a.; Gibbs, S. L.; Landry, M. P.; Strano,
M. S. Carbon N. Y. 2015, 95, 767–779.
(81) Iijima, S. Nature 1991, 354 (6348), 56–58.
(82) Novoselov, K. S.; Geim, A. K.; Morozov, S. V; Jiang, D. Science (80-. ).
2004, 306, 666–669.
(83) Liu, J.; Tang, J.; Gooding, J. J. J. Mater. Chem. 2012, 22 (25), 12435.
(84) Schwierz, F. Nat. Nanotechnol. 2010, 5 (7), 487–496.
(85) Blees, M. K.; Barnard, A. W.; Rose, P. A.; Roberts, S. P.; McGill, K. L.;
Huang, P. Y.; Ruyack, A. R.; Kevek, J. W.; Kobrin, B.; Muller, D. A.;
McEuen, P. L. Nature 2015, 524 (7564), 204–207.
(86) Tasis, D.; Papagelis, K.; Spiliopoulos, P.; Galiotis, C. Mater. Lett. 2013, 94,
47–50.
(87) Nicolosi, V.; Chhowalla, M.; Kanatzidis, M. G.; Strano, M. S.; Coleman, J.
N. Science (80-. ). 2013, 340 (6139), 1226419.
(88) Hernandez, Y.; Lotya, M.; Rickard, D.; Bergin, S. D.; Coleman, J. N.
Langmuir 2010, 26 (5), 3208–3213.

Introduction
57
(89) Dreyer, D. R.; Park, S.; Bielawski, C. W.; Ruoff, R. S. Chem. Soc. Rev. 2010,
39 (1), 228–240.
(90) Si, Y.; Samulski, E. T. Nano Lett. 2008, 8 (6), 1679–1682.
(91) Hassouna, F.; Kashyap, S.; Laachachi, a; Ball, V.; Chapron, D.; Toniazzo,
V.; Ruch, D. J. Colloid Interface Sci. 2012, 377 (1), 489–496.
(92) Gao, X.; Jang, J.; Nagase, S. J. Phys. Chem. C 2010, 114 (2), 832–842.
(93) Du, W.; Jiang, X.; Zhu, L. J. Mater. Chem. A 2013, 1 (36), 10592.
(94) Popov, V. Mater. Sci. Eng. R Reports 2004, 43 (3), 61–102.
(95) Balasubramanian, K.; Burghard, M. Small 2005, 1 (2), 180–192.
(96) Banerjee, S.; Wong, S. S. J. Phys. Chem. B 2002, 106 (47), 12144–12151.
(97) Lee, S. W.; Kim, B.-S.; Chen, S.; Shao-Horn, Y.; Hammond, P. T. J. Am.
Chem. Soc. 2009, 131 (2), 671–679.
(98) Iamsamai, C.; Soottitantawat, A.; Ruktanonchai, U.; Hannongbua, S.;
Dubas, S. T. Carbon N. Y. 2011, 49 (6), 2039–2045.
(99) Michel, M.; Taylor, A.; Sekol, R.; Podsiadlo, P.; Ho, P.; Kotov, N.;
Thompson, L. Adv. Mater. 2007, 19 (22), 3859–3864.
(100) Zhang, M.; Yan, Y.; Gong, K.; Mao, L.; Guo, Z.; Chen, Y. Langmuir 2004,
20 (20), 8781–8785.
(101) Zhang, M.; Su, L.; Mao, L. Carbon N. Y. 2006, 44 (2), 276–283.
(102) Ajayan, P. M.; Stephan, O.; Colliex, C.; Trauth, D. Sci. 1994, 265 (5176),
1212–1214.
(103) Coleman, J. N.; Khan, U.; Blau, W. J.; Gun’ko, Y. K. Carbon N. Y. 2006, 44
(9), 1624–1652.
Introduction
58
(104) Moniruzzaman, M.; Winey, K. I. Macromolecules 2006, 39 (16), 5194–5205.
(105) Wong, K. K.; Shi, S. Q.; Lau, A. K. T. Key Eng. Mater. 2007, 334-335, 705–
708.
(106) Hao, J. Self-assembled structures properties and applications in solution and on
surfaces; CRC Press: Boca Raton, 2011.
(107) Mamedov, A. A.; Kotov, N. A.; Prato, M.; Guldi, D. M.; Wicksted, J. P.;
Hirsch, A. Nat. Mater. 2002, 1 (3), 190–194.
(108) Shim, B. S. Multifunctional carbon nanotube thin film composites by layer-by-
layer assembly technique, University of Michigan, 2009.
(109) Xue, W.; Cui, T. Sensors Actuators A Phys. 2007, 136 (2), 510–517.
(110) Michel, M.; Taylor, A.; Sekol, R.; Podsiadlo, P.; Ho, P.; Kotov, N.;
Thompson, L. Adv. Mater. 2007, 19 (22), 3859–3864.
(111) Xue, W.; Liu, Y.; Cui, T. Appl. Phys. Lett. 2006, 89 (16).
(112) Zhu, J.; Shim, B. S.; Di Prima, M.; Kotov, N. A. J. Am. Chem. Soc. 2011, 133
(19), 7450–7460.
(113) Angelini, G.; Boncompagni, S.; De Maria, P.; De Nardi, M.; Fontana, A.;
Gasbarri, C.; Menna, E. Carbon N. Y. 2007, 45 (13), 2479–2485.
(114) Correa-Duarte, M. A.; Kosiorek, A.; Kandulski, W.; Giersig, M.; Liz-
Marzán, L. M. Chem. Mater. 2005, 17 (12), 3268–3272.
(115) Jia, N.; Lian, Q.; Shen, H.; Wang, C.; Li, X.; Yang, Z. Nano Lett. 2007, 7
(10), 2976–2980.
(116) Kotov, N. A.; Dekany, I.; Fendler, J. H. Adv. Mater. 1996, 8 (8), 637–641.
(117) Cassagneau, T.; Fendler, J. H. Adv. Mater. 1998, 10 (11), 877–881.

Introduction
59
(118) Chen, H.; Müller, M. B.; Gilmore, K. J.; Wallace, G. G.; Li, D. Adv. Mater.
2008, 20 (18), 3557–3561.
(119) Park, S.; Dikin, D. A.; Nguyen, S. T.; Ruoff, R. S. J. Phys. Chem. C 2009, 113
(36), 15801–15804.
(120) Rafiee, M. A.; Rafiee, J.; Wang, Z.; Song, H.; Yu, Z.-Z.; Koratkar, N. ACS
Nano 2009, 3 (12), 3884–3890.
(121) De, S.; Coleman, J. N. ACS Nano 2010, 4 (5), 2713–2720.
(122) Park, H.; Brown, P. R.; Bulović, V.; Kong, J. Nano Lett. 2012, 12 (1), 133–
140.
(123) Yang, M.; Hou, Y.; Kotov, N. A. Nano Today 2012, 7 (5), 430–447.
(124) Li, Z.; Wang, J.; Liu, X.; Liu, S.; Ou, J.; Yang, S. J. Mater. Chem. 2011, 21
(10), 3397–3403.
(125) Yoo, J. J.; Balakrishnan, K.; Huang, J.; Meunier, V.; Sumpter, B. G.;
Srivastava, A.; Conway, M.; Mohana Reddy, A. L.; Yu, J.; Vajtai, R.;
Ajayan, P. M. Nano Lett. 2011, 11 (4), 1423–1427.
(126) Schedin, F.; Geim, A. K.; Morozov, S. V; Hill, E. W.; Blake, P.; Katsnelson,
M. I.; Novoselov, K. S. Nat Mater 2007, 6 (9), 652–655.
(127) Robinson, J. T.; Perkins, F. K.; Snow, E. S.; Wei, Z.; Sheehan, P. E. Nano
Lett. 2008, 8 (10), 3137–3140.
(128) Zhang, B.; Cui, T. Appl. Phys. Lett. 2011, 98 (7).

Introduction
60

61
Chapter 1 Materials and Experimental Methods.
Experimental Methods
The main techniques used in this thesis are explained below.
1.1 Quartz Crystal Microbalance with Dissipation.
The QCM-D is a technique that utilizes acoustic waves generated by oscillating
a piezoelectric crystal quartz plate in order to estimate adsorbed mass, with ng
cm-2 sensitivity. These quartz plates nowadays are usually a circular piece of
quartz sandwiched between two metal electrodes. When an alternating electric
field is applied across the device, an oscillation that propagates through the
crystal is induced. The frequency of such oscillation is determined by the
thickness of the crystal and the speed of shear waves in quartz.1
In 1959, Sauerbrey demonstrated that there is a linear relationship between the
frequency change (Δf) of the oscillating crystal and the mass adsorbed on the
surface (Δm).2 This relationship is given by:
∆𝑚 = −𝐶∆𝑓𝑖
𝑖 (Eq. 1.1)
Where i is the harmonic number and C is defined as:
𝐶 =𝑡𝑞𝜌𝑞
𝑓0 (Eq. 1.2)

Materials and methods
62
where tq is the thickness of the quartz, ρq the density of the quartz, and f0 is the
resonant frequency of the particular crystal. Therefore, for a 4.95 ±0.02 MHz
crystal the value of C=18.06 ± 0.15 ng (Hz cm2). This theory is valid only if three
assumptions are fulfilled:
- The adsorbed mass is small relative to the mass of the quartz crystal.
- The mass is adsorbed rigidly to the surface.
- The mass is distributed over the whole active area of the crystal.
Initially this theory was applied only in vacuum or gas phases. However, in
1980 it was proven to be applicable in liquid environments.3 The drawback of
these applications in liquid is that the liquid phase often incorporates viscous
and elastic contributions to the frequency change therefore violating the
assumption of the Sauerbrey condition of rigidity of the adsorbed film.
A film that is soft (viscoelastic) will not fully couple to the oscillation of the
crystal; hence the Sauerbrey relation will underestimate the adsorbed mass. A
soft film dampens the sensor oscillation. This damping or energy dissipation
(D) reveals the viscoelasticity of the film.
𝐷 =𝐸𝑙𝑜𝑠𝑡
2𝜋𝐸𝑠𝑡𝑜𝑟𝑒𝑑 (Eq 1.3)
Where Elost is the energy lost during one oscillation cycle and Estored is the total
energy stored in the oscillator.
The resolution of frequency and dissipation in liquids is on the order of ± 0.1 Hz
and 10–7, respectively, both are approximately one order of magnitude better in

Chapter 1
63
air or vacuum. The QCM-D approach allows simultaneously recording the f
and D values at multiple harmonics (n = 3, 5, 7,..) of a resonant frequency on a
millisecond time scale. The recorded data allows the estimation of multiple
parameters such as mass, thickness, density, viscosity, or storage modulus.
Combined with complementary techniques, such as ellipsometry or surface
plasmon resonance, the water content or associated solvent can also be
estimated.1
Figure 1.1. Frequency and dissipation changes in a quartz crystal resonator with
a rigid layer or a viscolelastic layer. (Image taken from http://www.egr.msu.edu).
The QCM-D used in this thesis is an E4 quartz crystal microbalance with
dissipation from Q-Sense, Goteborg, Sweden. The fundamental frequencies of
the system are always found in water to establish a reference zero value. QCM-
D data is acquired for the 3rd overtone (15 MHz) with subsecond time
resolution. The silica crystals employed are always QSX 303 SiO2 (50 nm)-

Materials and methods
64
coated quartz crystals (5 MHz) from Q-Sense that are always treated using a
UV-Ozone treatment of 20 minutes in a procleaner chamber from Bioforce
nanoscience immediately before their use.
1.2 Ellipsometry.
Ellipsometry is a non-invasive, non-destructive optical characterisation
technique which measures the change in polarisation that occurs after the
reflection, or transmission, of a beam against a sample. The first ellipsometer
was built buy P. Drude in 1945 but it was not until the 70s-80s that this
technique started to be exploited.4 Taking into account Maxwell´s theory light
is a wave composed by two perpendicular vectors, E related to the electric field
strength and B the magnetic field, both vectors are also perpendicular to the
direction of propagation. Polarization is the change in orientation with time of
E along the propagation direction. If light pass through a polarizer linearly
polarized light is transmitted, when linearly polarised light at an acute angle of
incidence is reflected on a film there is a change in the polarisation to elliptically
polarised light. The two components of E which were in phase for linearly
polarized light emerge out of phase for elliptically polarized light.4
The collected data in an ellipsometric measurement allows obtaining this phase
difference, Δ, and the change in the ratio of their amplitudes given by TanΨ.
These parameters are function of the complex refractive index of the material.
If the refractive index of a certain film and the substrate on which is deposited
are known then the thickness of this film can be calculated by ellipsometry. For

Chapter 1
65
this kind of calculations usually a model must be applied and by iterative
methods the parameters that fit the model better are obtained.5
The spectroscopic rotating ellipsometer used in this thesis is a M2000, Woollam,
NE, USA.
1.3 Atomic Force Microscopy.
In 1982 Binning and Roher invented the scanning tunnelling microscope, where
a conducting tip is brought close to the surface to be examined, the voltage
difference applied between the two can allow electrons to tunnel through the
vacuum between them.6 Information is acquired by monitoring the current as
the tip scans across the surface, and is usually displayed in image form.
Following this, a new family of microscopes, scanning probe microscopes,
emerged based on the distance dependence interaction between a tip (sharp
probe) and a sample. One of these was the atomic force microscope.7
AFM uses the force existing between a probe and the sample to create an image.
In Fig. 1.2 a) a scheme of the components of one of the most common models is
shown.

Materials and methods
66
Figure 1.2. a) Components of a standard AFM. b) Scanning modes in AFM.
(Image taken from http://web.physics.ucsb.edu).
A nanometer sharp tip is grown at the free end of a flexible cantilever, the
reflection of a beam focused at the back of the cantilever is collected in a
photodiode, amplifying and measuring the movement of this cantilever while it
scans the sample. The sample is placed onto a piezoelectric scanner that can
move with subnanometer precision. In this configuration the sample moves
over the tip while in others is the tip which moves over the sample.8
There are different operating modes of AFM available, with the most commonly
used being:
- Contact mode: also called static mode. The tip scans the sample in close
contact with the surface. The deflection of the cantilever is sensed and
compared in a direct-coupled feedback amplifier to some desired
deflection value.
Chapter 1
67
- Tapping mode: also called intermittent contact mode, or a type of
dynamic mode. The cantilever oscillates near its resonant frequency
gently touching the surface in an intermittent fashion. The oscillation is
reduced and this reduction in the oscillation amplitude is used to
identify and measure surface features. This oscillation amplitude is
maintained at a constant value by a feedback loop.
- Non-contact mode: also a dynamic mode. The tip hovers 50-150 Å above
the sample surface where attractive Van der Waals forces acting between
the tip and the sample are detected. The tip is given a small oscillation
so that detection methods can be used to detect small forces by
measuring changes in the amplitude, phase or frequency of the
oscillating cantilever in response to force gradients from the sample.
There are other non-topographic modes such as Magnetic Force microscopy,
force spectroscopy, nanoindentation, thermal modes and Kelvin probe
microscopy.9
The great advantage of this technique over other microscopy techniques is the
possibility to analyse samples in any kind of environment, i.e.: air, gas, vacuum,
or liquid.
All the atomic force microscopy analysis performed during this thesis has been
done with a Veeco Multimode atomic force microscope attached to a
Nanoscope V controller.

Materials and methods
68
1.4 Ion Cromathography.
Ion chromatography is an analytical technique for the separation and
determination of ionic compounds. The first reported use of this technique was
made by Thompson in 1850 in a study about the adsorption of ammonium ions
to soils. In its modern form it was introduced by Small, Stevens and Bauman in
1975, it has been used for many years and still continues to be used for the
separation of various ionic compounds.10
Essentially, it consists of a mobile phase or eluent with the mixture to be
resolved. It is injected and pumped into a separation column, stationary phase,
where the ions interact with fixed ions of opposite charge. The stationary phase
typically consists of an inert organic matrix chemically derivative with ionizable
functional groups (fixed ions) which carry displaceable oppositely charged
ion.11 Analytes are slowed down to an extent characteristic of each ion and
arrived separate to the detector, where they are analyzed.
There are three important factors to take into consideration:
- Efficiency: mainly controlled by the column choice and flow system, in
order to have high and narrow chromatographic peaks.
- Capacity: related to the ability of the column to attract ions and the
eluent strength.
- Selectivity: capability of separation between analytes.
Ion chromatography measurements were taken with a Thermo Scientific
Dionex ICS-1100 ion chromatography system equipped with a Dionex IonPac
Chapter 1
69
CS12A cation-exchange column and a CSRS Ultra II cation self-regenerating
suppressor.
1.5 Conductometry.
A conductometer measures the electrical conductivity of ionic solutions by
applying an alternating electrical current to two electrodes immersed in a
solution and measuring the resulting voltage. Under the effect of the potential
difference cations migrate to the cathode and anions to the anode while the
solution acts as an electrical insulator. Most conductive solutions are aqueous
solutions and have the ability to stabilise the ions formed by solvation.
Conductivity measurements can only be performed after determination of the
cell constant by calibration in a solution with a known specific conductivity.
Conductometry is used for direct measurements and in titration. The theory is
identical for both methods. Whereas in direct measurements it is the absolute
value that is of interest, in titrations it is the change in the measured value.12
Conductometry measurements were performed with a Knick Konduktometer
703.
1.6 Scanning Electron Microscopy.
The Scanning Electron Microscope (SEM) was developed in 1937 by Manfred
von Ardenne due principally to two limitations of the optical microscope:13

Materials and methods
70
- The rather long wavelength of visible light, 400-700 nm, resulting in a
theoretical limit of resolution of 200-500 nm, which could be enhanced
until a maximum of 100 nm using shorter wavelength light as blue or
ultraviolet or immersing the lenses in a high refractive index medium as
oil for example. In electron microscopy, electrons have a much shorter
wavelength allowing higher resolution.14
- A poor depth of field, which means the area of the specimen which can
be on focus at the same time. High power objective lens has a short focal
length, increasing the aperture angle and decreasing the depth of field.
In electron microscopy the working distance is long and has a small
aperture making a shallow aperture angle and hence a good depth of
field.15
Nonetheless, SEM has its limitations. Electrons cannot travel freely through air,
they may be absorbed easily if they strike any molecules present, as such they
need to be in high vacuum. Another limitation is that sample needs to be
conductive enough to dissipate charge.
The electron beam is generated in the electron gun at the top of the column; see
Fig. 1.3, and travels along the electron column which is composed by a series of
lenses and apertures until hitting the sample at the bottom of it, all the column
needs to be at high vacuum.

Chapter 1
71
Figure 1.3. Components of a Scanning Electron Microscope. (Image taken from
http://www.britannica.com).
Electrons are generated by a filament or catode and accelerated toward an
anode with an adjustable voltage. Afterwards the condenser lenses merge the
beam and focus it down to be 1000 times smaller than its original size. Finally
the electron beam passes through different apertures which reduce extraneous
electrons and determine the spot size of the beam when it reaches the specimen.

Materials and methods
72
Figure 1.4. Resulting components of the interaction between the electron beam
and the sample. (Image taken from http://www.gla.ac.uk)
Electrons interact with the atoms of the sample to produce shattered electrons,
X-rays and visible light. In electron microscopy two types of signals are used
for the visual inspection of the sample, secondary and backscattered electrons.
Secondary electrons are the result of inelastic collisions and scattering of the
incident electrons by the specimen electrons. They are used to reveal the
surface structure with a resolution of 10 nm or better.
Backscattered electrons are the result of elastic collisions and scattering between
the incident electrons and specimen nuclei or electrons. They are used to
resolve topographical contrast and atomic number contrast.
The X-ray signal generated allows for the determination of the elemental
composition through energy dispersive x-ray spectroscopy (EDS).

Chapter 1
73
SEM has up to 2 million times magnification and a resolution of 0.4
nanometers.16
Scanning electron micrographs were obtained using a Jeol JSM-5800 electron
microscope.
1.7 Transmission Electron Microscopy.
The first Transmission Electron Microscopy (TEM) was created in 1938 by
Prebus and Hillier at the University of Toronto using the concepts exposed by
Knoll and Ruska some years before.17 A TEM operates on the same principle as
SEM, nevertheless, in this method the image of the sample is based on
transmitted electrons, the electron beam is pointed toward the sample and the
electrons that pass through sample illuminate a fluorescent screen where the
image is recorded. In order to achieve it the configuration of the instrument is
different to that of SEM.
In this case the sample or specimen is placed after the condenser lens which is
responsible for concentrating the electron beam produced in the electron gun,
see Fig. 1.5.

Materials and methods
74
Figure 1.5. Components of a Transmission Electron Microscope. (Image taken
from http://www.britannica.com).
Afterwards the transmitted electrons encounter the objective lens that produces
a real intermediate image that is further magnified by the projector lens and
imaged onto the fluorescent screen. TEM has up to 50 million times
magnification and a resolution of 0.5Å.18
TEM imaging of the GO in this particular case was done using an FEI Titan
80e300 kV field emission gun microscope, which has a symmetrical condenser-
objective lens type S-TWIN (with an spherical aberration Cs ¼ 1.25 mm).
In the case of the capsules a JEOL JEM-1400PLUS (40–120 kV) equipped with a
GATAN US1000 CCD camera was used.

Chapter 1
75
1.8 X-ray Difraction.
Solid matter can be described as; amorphous where atoms are arranged in a
random way or crystalline where atoms are arranged in a regular pattern,
called crystals. Approximately 95% of all solid materials can be described as
crystalline and when x-rays interact with a crystalline substance they produce a
diffraction pattern. This diffraction pattern is like a fingerprint of the substance.
The same substance always gives the same pattern and even in a mixture each
of the components gives its pattern independently of the others.
When an x-ray beam hits an atom the electrons around the atom begin to
oscillate at the same frequency as the incoming beam. In almost all directions
there will be destructive interference, while in some specific directions there is
constructive interference. These directions are regulated by Bragg´s law:
2𝑑𝑠𝑖𝑛𝜃 = 𝑛𝜆 (Eq. 1.4)
Where d is the space between diffraction planes, θ is the incident angle, n is an
integer, and λ is the wavelength of the beam. These specific directions appear
as spots on the diffraction pattern.19,20
XRD data for was obtained using a Siemens D-5000 x-ray diffraction system.
1.9 Raman Spectroscopy and Confocal Raman Microscopy.
The Raman effect was first published in 1928 by C.V. Raman.21 It was first
observed by L. Mandelstman and G. Landsberg but their results were published

Materials and methods
76
months later.22 Nevertheless, the effect was theoretically described in 1923 by
A. Smekal.23
The Raman effect can be described as changes in the wavelength of light that
occur when a light beam is deflected by molecules. When photons interact with
a media they can be absorbed or scattered and these scatterings can be either
elastic or inelastic. See Fig. 1.6.
- Elastic scattering: there is no energy transfer between the photons and
the media. There are two types depending in the size of the scattering
particle. Mie scattering occurs when the wavelength of the light is
smaller than the size of the particle size, while Rayleigh scattering occurs
when the wavelength of the light is larger than the particle.
- Inelastic scattering: there is an energy transfer between photons and the
media. If the energy of the photon is high enough it excites a molecule to
higher electronic states. Relaxation to the lower level occurs via radiant
emission.
If the energy is not high enough it is excited to a virtual state, which is a
quantum mechanically forbidden state, with immediate relaxation to the
lowest level via emission a photon.
If the initial and final states are at the same energy level Rayleigh
scattering has occurred. If it relaxes to a higher energy level state than
the initial one it has gained energy and the emitted photon has been
Stokes shifted. If it relaxes to a lower energy state than the initial one it
has lost energy and has been anti-Stokes shifted.

Chapter 1
77
Figure 1.6. Energy translations for elastic and inelastic scattering. (Image taken
from http://bwtek.com)
Raman spectroscopy is a convenient probe of the energy levels within a
molecule providing a molecular fingerprint of it. Therefore collecting the
Raman frequencies we can determine the composition of a material. Analysing
the polarisation of a Raman peak we can determine the crystal symmetry and
orientation. The width of a peak gives an indication of the quality of a crystal;
the intensity reflects the amount of a particular molecule while changes in the
frequency of the Raman peak reveal the stress/strain state.
Raman analysis was performed using a Renishaw inVia Raman microscope.
1.10 Zeta Potential.
The Z-potential is a property related to the surface charge of a material when
suspended in a fluid. A particle dispersed in water is solvated, the boundary
between this solvated layer and the bulk solution is called the shear plane, see
Fig. 1.7.

Materials and methods
78
Figure 1.7. Scheme of a simplified model of the electric double-layer at a
charged interface in aqueous solution. (Image taken from
http://www.particlesciences.com)
The distribution of charges at the interface is different to that in the bulk phase.
A structure called a double-layer is developed in which ions of opposite charge
to that of the surface create an adjacent layer counterbalancing the surface
charge, these ions are called counterions. The ions with the same charge as the
surface are called coions.
The double layer, as its name suggests, is composed of two regions:
- Stern layer: region closest to the surface with immobile adsorbed ions.
- Diffuse layer: outer region with mobile ions distributed according to
influence of electrical forces and thermal motion.

Chapter 1
79
Z-potential is an electrokinetic potential defined as the potential at the shear
plane, in order to measure it electrophoresis is used. It is determined by
applying an electric field to the suspension and recording the particle transit
time. The particles move faster if their charge is greater. The electric field pulls
the particle in one direction and the counterions in the opposite direction. Ions
in the immobile phase move together with the particle, therefore the shear
plane marks the separation limit in which the ions move with the particle or
not.24
The velocity (m s-1) for unit field strength (1 Volt per meter) is called the
electrophoretic mobility and is related to the Z-potential by Henry´s equation:25
𝜇𝑒 =𝜀𝜁
6𝜋𝜂𝑓(𝑘𝑎) (Eq. 1.5)
Where ε is the dielectric constant of the media, η is the viscosity, f(Ka) is Henry´s
factor and ζ is the Z-potential. Henry´s factor depends on the ratio between the
particle radius and the thickness of the double layer. If the radius is much
smaller that the double layer f(Ka)=1, if it is larger f(Ka)= 1.5.
If the Z-potential is large enough there is repulsion between particles when they
approach one another keeping them in a state of dispersion. In general, it is
accepted that Z-potentials greater than 30 mV, positive or negative, will result
in relatively stable dispersions.
The z-potential was measured with a NanoSizer MALVERN Nano-ZS, U.K. All
the z-potential measurements were performed at 25°C.

Materials and methods
80
1.11 Electrochemical Impedance Spectroscopy.
Electrochemical impedance spectroscopy (EIS) is a perturbative characterisation
of the dynamics of an electrochemical process. It is commonly used in the
characterisation of electrode processes and complex interfaces. EIS involves the
study of the variation of the impedance of an electrochemical system with the
frequency of a small amplitude alternating current perturbation.
Impedance is a measure of the ability of a circuit to resist the flow of electrical
current. It is similar to the resistance concept but for more complex systems.
As the applied potential is alternating current (AC) the applied excitation is
sinusoidal. The response to a sinusoidal potential will be a sinusoid at the same
frequency but shifted in phase and it is expressed as a complex number:
𝑍(𝜔) =𝐸
𝐼= 𝑍0 exp(𝑗𝛷) = 𝑍0(𝑐𝑜𝑠∅ + 𝑗𝑠𝑖𝑛𝛷) Eq. 1.5
where Z0 is a magnitude and Φ is the phase.
Impedance data are usually expressed in the form of a Nyquist plot in which
the real part of the equation is plotted on the X-axis and the imaginary part on
the Y-axis, see Fig. 1.8. Each point corresponds to the value of impedance at a
specific frequency; low frequency data are on the right side of the plot and
higher frequency data are to the left.

Chapter 1
81
Figure 1.8. Nyquist plot of a modified electrode in which a) impedance is
governed by the diffusion of the redox probe and b) impedance is dominated
by electron transfer process.26
A typical response shows a semicircle at high frequencies corresponding to
electron transfer processes, followed by a straight line at low frequencies
representing linear diffusion or the so called Warburg diffusion. The diameter
of the semicircle reveals the electro transfer resistance (Ret) and the intercept
with the x-axis corresponds to the solution resistance (Rs).26
The electrochemical measurements in this thesis were performed in a typical
glass electrochemical cell with a Pt counter-electrode, a saturated calomel
electrode (SCE) 0,242V vs normal hydrogen electrode (NHE) was used as a
reference electrode, with solutions of 1mM tripotassium hexacyanoferrate (III)
(K3Fe(CN)6) and 1mM Potassium hexacyanoferrate (II) trihydrate (K4Fe(CN)6)
as a probe in a 0.1M potassium chloride as a support electrolyte, see Fig 1.9. All
the glass material was precleaned in a warm sulfonitric solution sulfuric
acid:nitric acid 2:1 and rinsed with water.

Materials and methods
82
The solution must be degassed with nitrogen for approximately thirty minutes
prior to making a measurement.
Figure 1.9. Scheme of electrochemical cell set-up.
1.12 Cyclic voltammetry.
Cyclic Voltammetry is a potentiometric method, meaning that the potential that
develops between two electrodes is measured. A typical procedure is to control
the potential of a working electrode with respect to a reference electrode and
measure the resulting current. The magnitude of the resulting current, and its
dependence on the applied potential, provides the analytical information. In
cyclic voltammetry the potential is swept and reversed at a fixed potential at a
N2
Counter-electrode Reference-electrodeWorking-electrode
(1mM (K3Fe(CN)6) |1mM (K4Fe(CN)6))in 0.1MKCl

Chapter 1
83
specific rate (in volts s-1) and the current versus time is measured.27 Time is
then converted to potential and recorded as current versus potential, see Fig.
1.10.
Figure 1.10. Typical cyclic voltammogram showing the measurement of the
peak currents and peak potentials.27
It is a technique to acquire qualitative information about electrochemical
reactions, offering a rapid determination of redox potentials. The cyclic
voltammetry measurements can be performed in the same cell as that shown
above for EIS.
1.13 Contact Angle
Contac angle or wettability studies is a technique that involves the
measurement of the angle formed by the intersection of the solid-liquid
interface and the liquid-vapor interface when a drop is resting on a flat,

Materials and methods
84
horizontal solid surface. This angle is acquired by applying a tangent line from
the contact point along the liquid-vapor interface in the droplet profile. This
interface where solid, liquid and vapor coexist is called the three phase contact
line.28
The contact angle is defined by the mechanical equilibrium of the drop under
three interfacial tensions and it is determine by Young’s equation:29
𝛾𝑠𝑣 − 𝛾𝑠𝑙 − 𝛾𝑙𝑣𝑐𝑜𝑠𝜃𝛾 = 0 (Eq. 1.6)
where γlv, γsv and γsl are the liquid-vapor, solid-vapor and solid-liquid interfacial
tensions, and θγ is the contact angle.
Figure 1.11. Illustration of the contact angle measurement with the sessile drop
method. (Image taken from http://petroleum.mst.edu/).
This angle is a proof of the wetting properties of the surface, angles of less than
90º indicates that the wetting is favourable and therefore the surface is
considered more hydrophilic. Contact angles of more than 90º mean
unfavourable wetting, the droplet minimizes its contact with the surface and it
is considered a more hydrophobic surface. If contact angles are greater than

Chapter 1
85
150º the surface is considered superhydrophobic, such as the lotus flower
effect.30
Contact angle measurements were performed with a DSA 100 contact angle
measurement device from Kruss Company using the technique of direct image
analysis of shape of sessile drops.
1.14 X-ray photoelectron spectroscopy
X-ray photoelectron spectroscopy also known as electron spectroscopy for
chemical analysis (ESCA) is a technique used for obtaining information about
the composition and chemical state of materials. It is based on the photoelectric
effect discovered by Albert Einstein in 1905.31 The test specimen is irradiated by
X-rays of a fixed wavelength (hν) and photoelectrons are excited from the
specimen and collected in a detector where the electron kinetic energies (Ekinetic)
of these photoelectrons are measured. See Fig. 1.12.

Materials and methods
86
Figure 1.12. Illustration of an XPS measurement. (Image taken from
https://en.wikipedia.org/).
As the x-ray energy is known (Ephoton), using the following conservation of
energy equation the electron binding energy (Ebinding) of each of the emitted
photoelectrons can be determined:
𝐸𝑏𝑖𝑛𝑑𝑖𝑛𝑔 = 𝐸𝑝ℎ𝑜𝑡𝑜𝑛 − (𝐸𝑘𝑖𝑛𝑒𝑡𝑖𝑐 + ∅) (Eq. 1.7)
where ∅ is the work function of the detector.
The electron binding energy is an energy associated to the excited electron in a
particular orbital and it is unique and depends on the bonding environment,
therefore it can act as a fingerprint for identifying elements, measuring the
elemental composition, empirical formula, chemical state and electronic state of
the elements within a material.32 These measurements must be conducted in a
high vacuum due to the fact that photoelectrons have low kinetic energies.
Surface analysis by XPS during this thesis was performed in a SPECS SAGE HR
100 system spectrometer in an ultra high vacuum (UHV) chamber.

Chapter 1
87
Materials
Chapter 2
Materials Acronym Distributor
3-mercapto-1-propanesulfonic acid MPS Sigma Aldrich
Ethanol Scharlau
Nitric acid Sigma Adrich
Poly (allylamine hydrochloride) PAH Sigma Adrich
Poly (diallylmethylammonium chloride) PDADMAC Sigma Adrich
Poly (vinylbenzyltrimethylammonium chloride)
PVBTMAC Scientific Polymer
Poly(sodium 4-styrene sulfonate) PSS Sigma Adrich
Potassium chloride Sigma Adrich
Potassium hexacyanoferrate (II) trihydrate
Sigma Adrich
Sodium chloride Sigma Adrich
Sulfuric acid Sigma Adrich
Tripotassium hexacyanoferrate (III) Sigma Adrich
Chapter 3
Materials Acronym Distributor
Poly(diallyldimethyl ammonium chloride) PDADMAC Sigma Adrich
Poly(sodium 4-styrene sulfonate) PSS Sigma Adrich
Sodium chloride Sigma Adrich
Chapter 4
Materials Acronym Distributor
(1-tetradecyl) trimethylammonium bromide
TTAB Alfa Aesar
Acetic acid Sigma Adrich
Bovine serum albumine BSA Sigma Adrich
Hydrochloric acid Sigma Adrich
Poly (acrylic acid) PAA Acros
Poly (allylamine hydrochloride) PAH Sigma Adrich

Materials and methods
88
Poly (diallylmethylammonium chloride) PDADMAC Sigma Adrich
Poly(sodium 4-styrene sulfonate) PSS Sigma Adrich
Polyethyleneimine PEI Sigma Adrich
Sodium acetate trihydrate Sigma Adrich
Sodium chloride Sigma Adrich
Sodium dodecyl sulfate SDS Sigma Adrich
Sodium hydroxide Scharlau
Chapter 5
Materials Acronym Distributor
Multi walled carbon nanotubes MWCNT Nano-lab
Magnesium Chloride hexahydrate VWR International
Magnesium sulfate heptahydrate Fluka
Nitric acid fuming Fluka
Poly (allylamine hydrochloride) PAH Sigma Adrich
Poly (diallylmethylammonium chloride) PDADMAC Sigma Adrich
Poly(sodium 4-styrene sulfonate) PSS Sigma Adrich
Sodium chloride Merck KGaA
Sodium hydroxide Fluka
Sulfuric acid Fluka
Chapter 6
Materials Acronym Distributor
Full blood chicken collected in Alsever's anticoagulant solution
Harlan Laboratories Models S.L
Glutaraldehyde solution grade II Sigma Adrich
Graphite powder Sigma Adrich
Hank´s balanced salt solution 10x Sigma Adrich
Lymphocytes isolation solution (Ficoll) Rafer
Phosphate buffered saline 10x PBS Sigma Adrich
Poly(sodium 4-styrene sulfonate) PSS Sigma Adrich
Polyallylamine hydrochloride PAH Sigma Adrich
Sodium chloride Sigma Adrich
Sodium hypochlorite with active chlorine Sigma Adrich

Chapter 1
89
References
(1) Dixon, M. C. J. Biomol. Tech. 2008, 19, 151–158.
(2) Sauerbrey, G. Zeitschrift für Phys. 1959, 155, 206–222.
(3) Cernosek, R. W.; Martin, S. J.; Hillman, A. R.; Bandey, H. L. Ultrason.
Ferroelectr. Freq. Control. IEEE Trans. 1998, 45, 1399–1407.
(4) Gonçalves, D.; Irene, E. A. Quim. Nova 2002, 25, 794–800.
(5) Xifré Pérez, E. Design, fabrication and characterization of porous silicon
multilayer optical devices, Universitat Rovira i Virgili, 2008.
(6) Binnig, G.; Rohrer, H.; Gerber, C.; Weibel, E. Phys. Rev. Lett. 1982, 49, 57–
61.
(7) Moreno-Herrero, F.; Gomez-Herrero, J. In Atomic Force Microscopy in
Liquid: Biological Applications.; M. Baró, A., G. Reiifenberg, R., Eds.; Wiley-
VCH Verlag GmbH & Co. KGaA, 2012; pp 1–34.
(8) Binnig, G.; Quate, F.; Gerber, C. Phys. Rev. Lett. 1986, 56, 930–933.
(9) Eaton, P.; West, P. Atomic Force Microscopy; Oxford University Press, 2010.
(10) Acikara, Ö. B. In Column Chromathography; Martin, D. F., Martin, B. B.,
Eds.; InTech, 2013; p 31.
(11) Cummins, P.; Dowling, O.; O’Connor, B. In Protein Chromatography SE -
12; Walls, D., Loughran, S. T., Eds.; Methods in Molecular Biology;
Humana Press, 2011; Vol. 681, pp 215–228.
(12) Khopkar, S. . Basic Concepts of Analytical Chemistry, 3rd Editio.; New Age
Science Ltd, 2008.

Materials and methods
90
(13) Von Ardenne, M. Zeitschrift für Phys. 1938, 109, 553–572.
(14) Stadtländer, C. … Res. Educ. Top. Microsc. 2007, 1, 122–131.
(15) Flegler, S. L.; Heckman, J. W.; Klomparens, K. L. Scanning and
Transmission Electron Microscopy: An Introduction; Oxford University Press,
1993.
(16) Dunlap, M.; Adaskaveg, J. E. Introduction to the Scanning Electron
Microscope: Theory, Practice, & Procedures; 1997.
(17) Ma, H.; Shieh, K.-J.; Qiao, T. X. Nat. Sci. 2006, 4, 14–22.
(18) Williams, D. B.; Barry Carter, C. Transmission Electron Microscopy, 2nd ed.;
Springer US, 2009.
(19) Birkholz, M. In Thin Film Analysis by X-Ray Scattering; Wiley-VCH Verlag
GmbH & Co. KGaA, 2005; pp 1–40.
(20) Fultz, B.; Howe, J. In Transmission Electron Microscopy and Diffractometry of
Materials; Springer Berlin Heidelberg: Berlin, Heidelberg, 2013; pp 1–57.
(21) Raman, C. V. Indian J. Phys. 1928, 2, 387–398.
(22) Landsberg, G.; Mandelstam, L. Naturwissenschaften 1928, 16, 557–558.
(23) Smekal, A. Naturwissenschaften 1923, 11, 873–875.
(24) Particle sciences. Technical briefs; An Overview of the Zeta Potential; 2012;
Vol. 2.
(25) Smoluchowski M. Bull. Int. Acad. Sci. Cracovie. 1904, 182–199.
(26) Azzaroni, O.; Gervasi, C. In Functional Polymer Films; Wiley-VCH Verlag
GmbH & Co. KGaA, 2011; pp 809–830.

Chapter 1
91
(27) Harvey, D. In Modern Analytic Chemistry; Kane, K. T., Ed.; James M. Smith,
2000; pp 461–542.
(28) Yuehua, Y.; Randall Lee, T. In Springer Series in Surface Sciences; Bracco,
G., Holst, B., Eds.; Springer-Verlag Berlin Heidelberg, 2013; Vol. 51, pp 3–
34.
(29) Young, T. Philos. Trans. R. Soc. London 1805, 95, 65–87.
(30) Lafuma, A.; Quere, D. Nat. Mater. 2003, 2, 457–460.
(31) Einstein, A. Ann. Phys. 1905, 322, 132–148.
(32) Hüfner, S. Photoelectron Spectroscopy- Principles and Applications, 3rd ed.;
Springer-Verlag, Berlin Heidelberg), 2003.

Materials and methods
92

POLYELECTROLYTE MULTILAYERS


95
Chapter 2- A Comparison of the Transport Properties of Supralinearly and Linearly Growing Polyelectrolyte Multilayers: A Cyclovoltametry and Impedance Study
2.1 Introduction
In recent years there has been continuously growing interest in the use of
polyelectrolyte multilayers (PEMs) for nanofiltration and reverse osmosis
applications.1–8 Since PEMs thicknesses vary normally from 10 to 50 nm and
possess a high density of charged functional groups PEMs are very attractive
for nanofiltration. Several articles have explored the possibilities of PEMs as
filtration membranes using different combinations of polyelectrolytes with very
high retention for specific ions.9–11
A key aspect related to the use of PEMs for nanofiltration/reverse osmosis is
their permeability, and in particular their ionic permeability. PEM permeability
is also of fundamental importance for applications in drug delivery12 and as
anticorrosive coatings.13
There are several studies dealing with the ionic permeability of PEMs. Some
articles have focused on understanding the permeability of polyelectrolyte
capsules with respect to drug delivery applications as already mentioned. For

Supralinearly vs linearly Growing Polyelectrolyte Multilayers
96
capsules, ionic permeability was studied with confocal microscopy and also by
means of electrorotation.14 It was found that the process of capsule templation
generated pores responsible for permeability and transport of molecules in the
capsules
On planar PEMs ionic transport was studied by means of electrochemical
techniques: cyclic voltammetry and electrochemical impedance.
Electrochemical techniques have been thoroughly used in the past to study the
interaction between films and an analyte and/or the kinetics of charge and
mass transport through polyelectrolyte multilayers.15 One of the first studies on
multilayers was performed by Liu et al., where they analysed the pH-
switchable behaviour of a polyelectrolyte membrane by cyclic voltammetry.16
Multiple combinations of polyelectrolytes have been studied. One of the most
common pairs in PEMs is PAH/PSS, which display a linear growth regime.
Ionic permeability for these films has been studied as a function of layer
number, temperature, nature of salt solutions, amongst others.15,17
A theoretical model for understanding the permeability of these films, taking
into account their layered structure and the progressive coating of the
electroactive surface with increasing number of polyelectrolyte layers, has been
reported by Silva et al.15 This model, named Capillary Membrane Model
(CMM), describes the polyelectrolyte membrane as a porous film with circular
uncovered spots. By increasing the number of deposited polyelectrolyte layers,
the holes on the surface decrease in number and size.18 Indeed, PEMs of
PAH/PSS display high permeability with small electron charge resistance for

Chapter 2
97
the first assembled layers. As the number of layers increases the charge
resistance increases and transport in the films decreases, which can be
understood as the films becoming denser and holes on the conductive substrate
become covered. In linear growth regimes the amount of polyelectrolyte
deposited per pair is mostly constant with a low degree of interpenetration,
meaning that the newly adsorbed layer neutralizes the majority of the charges
of the previous layer. However, not all multilayers grow in a linear regime.
Some polyelectrolyte combinations display exponential or supralinear growth
regimes. In an exponential or supralinear regime the amount of polymer
assembled increases as the number of layers deposited increases, the interaction
between polyelectrolyte layers is not so strong and there is diffusion of
polyelectrolyte molecules between layers, it leads to thicker highly hydrated
films.
The chemistry of the polyelectrolytes, spatial arrangement, and the nature of
the interactions between the polyelectrolyte pairs has an influence on
determining one or the other regime. In a recent study run by the group of
Piotr Warszynsky they analysed, using electrochemical methods, the difference
in permeability between pairs of polyelectrolyte showing linear and
exponential growth.19 They compared PAH/PSS versus PDADMAC/PSS and
concluded that linearly grown polyelectrolyte multilayers form denser films
and perform better as a diffusion barrier for electroactive species compared to
the pair that grows exponentially, which forms a highly hydrated spongy like
structure with high viscosity and high permeability. The different growth

Supralinearly vs linearly Growing Polyelectrolyte Multilayers
98
regimes for both films results in two well defined structures but it is not clear
why one or other regimes occurs. The reason for the different growth regimes
in these two polyelectrolyte pairs lies probably in the different interactions
between primary amines of PAH and the sulfonate of PSS , and between the
quaternary amines of PDADMAC and the sulfonate groups of PSS.20 The
different interaction between the two types of amines with the sulfonate may
also influence the transport of a redox probe as the strength of the interaction
between polyanion and polycation may affect the interaction of the probe with
the charged groups of the PEM. It is also the case that primary or quaternary
amines interact differently with the redox probe. The probes are normally
complexes formed by a cation or an anion surrounded by small charged organic
molecules. The complexes have several charges and can interact with the
charged polyelectrolytes of the multilayer. In order to compare the transport
properties of supralinearly and linearly growing PEMs formed by a pair of
polyelectrolytes with similar chemistry but different growing regime we have
decided to work with PEMs with polystyrene sulfonate (PSS) as the polyanion
and two polycations bearing quaternary amines:;
poly(diallydimethylammonium chloride) (PDADMAC) in one case and
poly(vinylbenzyltrimethylammonium chloride) (PVBTMAC) in the other. Both
polycations have quaternary amines but when assembled with PSS the first
results in a film with a supralinear growth while the second is linear. Despite
both polycations have a similar chemistry, both entail quaternary amines, they
differ significantly in their stereochemistry and the chemistry of the backbone

Chapter 2
99
chain. The similitude in the chemistry between PDADMAC/PSS and
PVBTMAC/PSS films make them suitable to compare the transport properties
between the two films in relation to the growth regime, without a difference in
the chemistry of the charged groups in polymer and differences in the
interaction between charged functional groups play a role. In addition we will
study the properties ofthe two films to try to understand why they display
different tendencies of growth.
2.2 Materials and methods
Poly (allylamine hydrochloride) (PAH) [Mw= 15 kgmol-1], poly
(diallylmethylammonium chloride) (PDADMAC) [Mw = 200-350 kgmol-1] 20 %
wt. in water, polyestyrene sulfonate (PSS) [Mw= 70 Kgmol-1], Poly
(vinylbenzyltrimethylammonium chloride) [Mw =100 Kgmol-1] 26.81 % wt in
water, sodium chloride, Tripotassium hexacyanoferrate (III) (K3Fe(CN)6),
Potassium hexacyanoferrate (II) trihydrate (K4Fe(CN)6), 3-mercapto-1-
propanesulfonic acid (MPS), Ethanol, Sulfuric acid, and Nitric acid.
Gold films with a thickness of around 100 nm were deposited on glass
substrates with non-reactive magnetron sputtering using an AJA-ATC 1800
system with a base pressure of 10-7 Pa. Prior to deposition, the substrates were
sputter cleaned with a negative bias of 180 V (25 W) in a 4 Pa Ar atmosphere for
10 min. In order to improve the adhesion of the films to the substrates, a pure
Ti layer of around 50 nm was deposited on the substrates at a Ti target d.c.
power of 270 W. The deposition of the films was done with a 2 inch target, with

Supralinearly vs linearly Growing Polyelectrolyte Multilayers
100
a purity of 99.999% at a pressure of 0.25 Pa of pure Ar and a direct current (d.c.)
target power of 150 W. The distance between target and substrates was about
15 cm.
2.2.1 Quartz Crystal Microbalance with Dissipation (QCM-D)
Polyelectrolyte membrane assembly was monitored in a quartz crystal
microbalance with dissipation. The substrates, gold (100 nm)-coated quartz
crystals were previously cleaned in a UV-Ozone procleaner. Prior to
polyelectrolyte assembly the sensors were incubated overnight in a MPS 10-2 M
in ethanol solution.
All polyelectrolyte solutions were prepared to a concentration of 1 mgml-1 in 0.5
M NaCl. The deposition of each layer is followed by a decrease in the
resonance frequency of the 3rd overtone (15 MHz) with subsecond time
resolution.
The mass of the PEM was calculated using the Sauerbrey equation, Δm=-C(Δf)
where C = 18.06±0.15 ngcm-2Hz-1.
2.2.2 Atomic Force Microscopy (AFM)
The PEMs were previously assembled and monitored in the QCM-D. All the
measurements were analysed in a fluid cell with 10 mM NaCl. For the
PVBTMAC/PSS PEM a DNP cantilever with K=0.35 Nm-1 in contact mode was
used. In the case of PDADMAC/PSS two different cantilevers were used a
DNP of K=0.35 Nm-1 for contact mode and a K=0.06 Nm-1 for tapping mode.

Chapter 2
101
2.2.3 Cyclic Voltammetry and Impedance Spectroscopy
Electrochemical measurements were performed in a glass electrochemical cell
with a Pt counter-electrode, saturated calomel electrode (SCE) 0,242 V VS ENH
as reference electrode, and as probe a solution of 1 mM (K3Fe(CN)6) and 1 mM
(K4Fe(CN)6) in a 0.1 M KCl solution support electrolyte. The solution must be
degassed with N2 for approximately half an hour before measurement. All
glass material was precleaned in a warm sulfonitric solution H2SO4:HNO3 2:1
and rinsed with water.
Gold substrates were precleaned prior to the assembly by a 2 minute immersion
in a cleaning solution of ½ H2O+½ H2O2 + 1/15 H2SO4, rinsed with water,
rinsed with Acetone and finally rinsed with Ethanol.
Samples were incubated overnight in a solution 10-2 M MPS in Ethanol in order
to give a negative charge to the surface, we rinsed with ethanol, and finally
rinsed with water.21
The assembly of the polyelectrolytes was performed by consecutive immersion
of the substrate for 15 minutes in a 1 mgml-1 of the polyelectrolyte in 0.5 M
NaCl solution followed by rinsing in water three times before the next
polyelectrolyte with opposite charge was assembled. This procedure was
repeated until the desired number of layers was assembled. Every set of
membranes were assembled simultaneously.

Supralinearly vs linearly Growing Polyelectrolyte Multilayers
102
2.2.4 Contact Angle
A 5 µl drop of nanopure water was placed onto a glass substrate previously
functionalised with a thiol and the corresponding PEM on top. The same
procedure as for the electrochemistry experiments explained before.
2.2.5 XPS
The X-ray source employed for this analysis was a non-monochromatic Mg Kα
(1253.6 eV) operated at 250 W, calibrated using the 3d5/2 line of Ag with a full
width at half maximum (FWHM) of 1.1 eV. The take- off angle was fixed at 90º
and the analysis was conducted at a pressure of ~10-6 Pa.
A multilayer of (PDADMAC/PSS)6.5 at 0.5 M NaCl was assembled on top of a
gold substrate coated with MPS and incubated for 2.5 hours in a ferro/ferri 1
mM at 0.1 M KCl solution. The substrate was rinsed several times and left in
nanopure water for one hour prior to XPS measurements.
Surfaces were brought into the XPS chamber within 5 min after
cleaning/preparation. The selected resolution for the spectra was 30 eV of Pass
Energy and 0.5 eV/step for the general survey spectra and 15 eV of Pass Energy
and 0.15 eV/step for the detailed spectra of N1s, Fe3p, Fe 2p, O 1s and C 1s.
The resulting atomic percentages of Fe(CN) oxidation states are calculated from
the fitting of the Fe 2p region. Spectra were analysed with the Casa XPS
2.3.15dev87 software. The analysis consisted of satellite removal, Shirley
background subtraction, calibration of the binding energies related to the C 1s
C-C peak at 285 eV, and symmetric peak fitting with Gaussian-Lorentzian line

Chapter 2
103
shapes where the FWHM of all the peaks were constrained while the peak
positions and areas were set free.
2.3 Results and discussion
In this work we intend to compare the assembly and transport properties of
two different PEMs with the same polyanion, PSS, and polycations bearing
quaternary amines but with different stereochemistry and backbone chemistry,
PDADMAC and PVBTMAC. In PDADMAC the quaternary amine is located
inside a cyclopentyl group in the chain, while in PVBTMAC the quaternary
amine is pendant of a benzyl group, as it can be seen in Fig. 2.1.
Figure 2.1. Chemical structure of the polyelectrolytes involved in the different
assemblies.
The assembly of both PEMs was monitored by QCM-D as can be seen in Fig.
2.1a and 2.1b. Frequency decreases stepwise after each polyelectrolyte
deposition with a constant value for PVBTMAC, Fig. 2.1a, while in the case of
PDADMAC/PSS films the value for the frequency steps resulting from
polyelectrolyte deposition increase with the increasing of the number of layers.
In both cases after each deposition step the excess of polyelectrolyte is rinsed
PAH PDADMAC PVBTMAC PSS

Supralinearly vs linearly Growing Polyelectrolyte Multilayers
104
with 0.5 M NaCl, the same salt concentration as the polyelectrolyte solution. In
the last step both PEMs are rinsed with water, it can then be observed that in
the case of PVBTMAC there is not a large change in frequency when we replace
the salt for pure water. However, in the case of PDADMAC there is a large
uptake of water resulting in a doubling of its hydrated mass. Also the
dissipation increases dramatically showing a more loose and swollen structure,
while the PVBTMAC is more rigid and compact as illustrated in Fig. 2.2d. The
hydrated mass for both PEMs have been calculated for each layer and it is
plotted in Fig. 2.2c.
Figure 2.2. a) Deposition of 17 layers of PVBTMAC and PSS at 0.5 M NaCl by
QCM-D. b) Deposition of 17 layers of PDADMAC and PSS at 0.5 M NaCl by
QCM-D. c) Representation of mass vs layer for 17 layers of PDADMAC/PSS
0 100 200 300 400 500 600
-400
-300
-200
-100
0
f(Hz)
D
Time
f (H
z)
-5
0
5
10
15
20
25
30
35
D(1
E-0
6)
0 100 200 300 400 500 600
-1800
-1600
-1400
-1200
-1000
-800
-600
-400
-200
0
200
f(Hz)
D
Time (sec)
f (H
z)
-20
0
20
40
60
80
100
120
140
D(1
E-0
6)
0 2 4 6 8 10 12 14 16 18
0
1000
2000
3000
4000
5000
6000
7000
8000
9000
10000
11000
12000
13000
14000
15000
PV
BT
MA
C/P
SS
(n
g/c
m2)
layer
PVBTMAC/PSS
PDADMAC/PSS
(PVBTMAC/PSS)8.50.5M (PDADMAC/PSS)8.5
0.5Ma b
c d
Supralinear regime
glassglass
Linear regime

Chapter 2
105
and PVBTMAC/PSS assembled by QCM-D. d) Sketch of supralinear and linear
assemblies.
The plotts reveal a linear growth tendency for PVBTMAC/PSS and supralinear
growth in the case of PDADMAC/PSS. It can also be observed that in the case
of PDADMAC/PSS the increase in hydrated mass of PDADMAC is larger than
the amount of PSS. After 17 layers of PVBTMAC/PSS the hydrated mass
deposited is approximately the same as 12 layers in the case of PDADMAC/PSS.
The capacity of PDADMAC/PSS to hydrate upon changing from a NaCl
solution, 100-500 mM, to water has already been reported.22 This sponge like
behaviour is pronounced when the film has over 10 or 11 layers of
polyelectrolyte. Making an analogy with PE brushes the PDADMAC/PSS
PEMs must have uncompensated charges and a certain capacity for chain
reorganization. In a supralinear regime there are more uncompensated charges,
than in a linear regime, as PVBTMAC/PSS does not have similar hydration
behaviour. The nature of the pending group does not seem to play a role here.
In both cases the amines are quaternary and when we look at the molecular
structure of PDADMAC the amines in this polymer are likely to be imbibed in a
more hydrophobic environment. This is because for PDADMAC the amine
groups are located in the back bone chain while the quaternary amines in
PVBTMAC are pending groups. The responsiveness of the film is, however,
lost when PSS is the top layer.22 This could be due to the PSS providing less
uncompensated charges or that being a glassy polymer, it has a limited capacity
to reorganize once in the layer and for that reason the PEM does not hydrate as

Supralinearly vs linearly Growing Polyelectrolyte Multilayers
106
in the case with PDADMAC as the top layer. This also hints that most of the
uncompensated charges are in the top layer of PDADMAC. An explanation for
the different growth behaviour for the two pairs and the absence of a response
with changes in ionic strength for PVBTMAC/PSS PEMs could indeed lie in the
nature of PVBTMAC which is also a polymer with aromatic rings in the
structure. PVBTMAC once deposited probably cannot rearrange or reorganize
like PDADMAC. It may also not easily interdifuse in the layers or interdigitate
with previous layers, which seems to be fundamental for supralinear or
exponential growth.
The sponge like nature of the PDADMAC/PSS film should result in a very soft
material. This can be observed by AFM. First, the topology of both samples has
been analysed by AFM as can be seen in the height images shown in Fig. 2.3. In
both cases the analysis was performed in a liquid cell filled with 10 mM NaCl,
and using a cantilever of k = 0.35 Nm-1 in contact mode, Fig. 2.3b and c. In the
case of PDADMAC/PSS, Fig. 2.3c, the PEM is by the cantilever and the surface
is distorted, with polymer being dragged during the scanning, this is evidence
of the difference in the stiffness of both PEMs. Therefore, for the analysis of the
PDADMAC/PSS PEM we used a softer cantilever of k = 0.06 Nm-1 in tapping
mode. Even in these conditions there is some unavoidable drift due to the
spongy swelled structure of the PDADMAC/PSS.

Chapter 2
107
Figure 2.3. AFM images of a) 17 layers of PDADMAC and PSS assembled at 0.5
M NaCl, analysed in 10 mM NaCl in tapping mode with a DNP cantilever of
0.06 Nm-1. b) 17 layers of PVBTMAC and PSS assembled at 0.5 M NaCl,
analysed in 10 mM NaCl in contact mode with a DNP cantilever of 0.35 Nm-1. c)
17 layers of PDADMAC and PSS assembled at 0.5 M NaCl, analysed in 10 mM
NaCl in contact mode with a DNP cantilever of 0.35 Nm-1.
Comparing Fig. 2.3a for PDADMAC/PSS and Fig. 2.3b for PVBTMAC and their
profiles, we can clearly see the difference not only in topology but also in
stiffness. In the case of PVBTMAC the PEM is stiff and flat with some grains of
a considerable height of around 50 nm and sometimes bigger, popping out from
the surface probably due to aggregates or defects in the compression of the
layers. For PDADMAC/PSS, the structure is clearly less compact, very soft,
resulting in a less flat profile as a consequence of the water swelled membrane.
a b
c

Supralinearly vs linearly Growing Polyelectrolyte Multilayers
108
Analysing the evolution of the contact angle as the PEMs grow provides
additional information on the assembly mechanism between the two
polyelectrolyte pairs. In Table 2.1 the difference in the contact angle for both
systems at a different number of assembled layers can be observed.
Interestingly the contact angle for PBVTMAC/PSS measured always with
PVBTMAC as top layer at the 5th, 11th and 17th layers is almost constant with
values between 24 and 29 degrees indicating a hydrophilic film. A very
different situation is encountered for PDADMAC/PSS films. At an initial stage
the PDADMAC/PSS film is quite hydrophobic with a value at the 5th layer of 73
degree. At the 11th and 17th layers the contact angle becomes smaller but still
much more hydrophobic than the PVBTMAC/PSS PEM, remaining between 42
and 49 degrees.
Table 2.1 Contact angle measurements at different number of layers for
PDADMAC/PSS and PVBTMAC assemblies.
5 layers 11 layers 17 layers
PDADMAC/PSS 73 42 49
PBVTMAC/PSS 27 29 24
The consistency of the contact angle of PVBTMAC/PSS with increasing layer
number reflects the linearity of the growth. The density of the functional
groups in the PBVTMAC/PSS PEM is always the same. The film is quite
hydrophilic meaning that the charge density is high. For PDADMAC/PSS the
situation is different. The initial value of the contact angle is high, indicative of
more hydrophobic behaviour. This can be because the quaternary amines are
not pendant but part of the backbone chain. Despite this the PDADMAC/PSS

Chapter 2
109
films are always more hydrated and there is much more mass of PDADMAC in
the top layer compared to PBVTMAC, which also would mean a larger number
of charged amines for PDADMAC. The high contact angle would however be a
consequence of a lower surface density of amines. This could be because the
layers of PDADMAC are thicker meaning that the charges are distributed over
a larger volume than for PBVTMAC. The decrease in the contact angle with
increasing layer number for PDADMAC/PSS can be explained by the increase
in charged amines per layer as a consequence of the supralinear growth of the
film.
Transport studies were carried out by analysing the electrochemical behaviour
of two probes (K3Fe(CN)6) and (K4Fe(CN)6) when the solution is in contact with
a gold electrode covered with a monolayer of MPS thiols covered with either a
PDADMAC/PSS or PBVTMAC/PSS PEM. At the surface of the gold the
probes can undergo oxidation or reduction, depending on their oxidation state,
by exchanging electrons with the substrate. Initial experiments were performed
with cyclic voltametry. Both cathodic and anodic currents were measured with
increasing numbers of layers for both PDADMAC/PSS and PBVTMAC/PSS as
shown in Fig. 2.4a and b. For clarity the maximum of the cathodic and anodic
peaks have been plotted as a function of the layer number in Fig. 2.4c.

Supralinearly vs linearly Growing Polyelectrolyte Multilayers
110
Figure 2.4. Cyclic voltammograms for a) PDADMAC/PSS and c)
PVBTMAC/PSS PEMs onto MPS functionalised gold substrates. C) Maximum
current in oxidation and reduction steps for each PEM.
We have plotted only the voltammograms for the odd layers, which correspond
to the polycation as the top layer in the PEM for two reasons. Firstly, because in
both assemblies in our study the samples differ in the choice of polycation, and
their different behaviour is what we want to analyse; and secondly because as
we are using negative redox probes, if a polyanion is the top layer there will be
electrostatic repulsion, affecting diffusion.
It has been reported in literature that although PEMs are very permeable to
monovalent and divalent ions used as supporting electrolytes, permeability
decreases rapidly with increasing the number of layers in the PEM for heavily
charged electroactive probes.18 This effect has been explained in different ways.
-0,4 -0,2 0,0 0,2 0,4 0,6
-400
-300
-200
-100
0
100
200
300
400i/A
cm
-2
E/V vs. SCE
Au+MPS
Au+MPS+1l
Au+MPS+3l
Au+MPS+5l
Au+MPS+7l
Au+MPS+11l
Au+MPS+17l
CV PDADMAC/PSS
-0,4 -0,2 0,0 0,2 0,4 0,6
-400
-300
-200
-100
0
100
200
300
i/A
cm
-2
E/V vs. SCE
Au+MPS
Au+MPS+1l
Au+MPS+3l
Au+MPS+5l
Au+MPS+7l
Au+MPS+11l
Au+MPS+17l
CV PVBTMAC/PSSa b
c
0 2 4 6 8 10 12 14 16 18 20
-350
-300
-250
-200
-150
-100
-50
0
50
100
150
200
250
300
350
i / A
cm
-2
layer
Oxidation PVBTMAC
Reduction PVBTMAC
Oxidation PDADMAC
Reduction PDADMAC

Chapter 2
111
It has been postulated that it is caused by a reduction of the active area of the
electrode as the number of deposited layers increases, the so called Capillary
Membrane Model (CMM).23 Another explanation is that the diffusion of the
probe in the film is due to the hopping between exchange sites created within
the film by the supporting electrolyte. The decrease in permeability with the
number of layers is attributed to a decrease in the concentration gradient of the
probe inside the film as the thickness increases,24,25 this model is called the
Homogeneous Membrane Model (HMM).18
As can be seen in Fig. 2.4c, in both cases there is a strong decay in the current
for the initial layers as well as some irregularities in the current until the 5th
layer. It is well known in LbL technique the assembly of the first layers are
quite irregular and the amount of polymer and charge distribution per layer is
not homogeneous. For the first layers it is likely that the coverage of the surface
is partial, with areas remaining free of polymer. The reduction of the current
intensity can be interpreted as a reduction in the active area as the number of
layers increase and the polymer free areas are covered with polymer.
After the fifth layer for both PEMs the current decreases only slightly until
reaching a state after the 17th layer of nearly blocked current. This is observed
for both PEMs at approximately the same number of layers despite having
different thicknesses. Also the shape of the voltammogram plateaus with the
decrease of the peak current as has previously been reported as a consequence
of the reduction of the diffusion coefficient in the film and the nonlinear
diffusion of the probe.18 In both cases the anodic current is less favoured than

Supralinearly vs linearly Growing Polyelectrolyte Multilayers
112
the cathodic current. In the case of PDADMAC this difference is more evident.
Therefore, reduction is less affected compared to oxidation by the number of
assembled layers. It can also be observed that in the case of PDADMAC, Fig.
2.4a, there is a shift of the apparent redox potential to values close to zero,
meaning that there is complex formation between the probe and the
polyelectrolyte, and that this complex is formed after the assembly of the 11th
layer.
Impedance studies were also performed on the PEMs. In Fig. 2.5 we can see the
Nyquist diagrams of both assemblies. In both cases PDADMAC/PSS, Fig. 2.5a,
and PVBTMAC/PSS, Fig. 2.5b, after the assembly of the first and third layers
the impedance does not appear to differ from the bare gold electrode. Only a
straight line of approximate unit slope at low frequencies can be seen, resulting
from the mass transport by linear diffusion. In these cases the coverage is so
poor that the electrode is behaving as if it is not coated.

Chapter 2
113
Figure 2.5. Nyquist diagrams for PDADMAC/PSS assembly, b) Nyquist
diagrams for PBVTMAC/PSS assembly and c) Nyquist for 11 and 17 layers of
PDADMAC/PSS and PVBTMAC/PSS PEMs.
After assembly of the fifth and seventh layers we see a change in the shape of
the Nyquist diagrams in both cases, the typical semicircle at high frequencies
associated with the impedance due to charge transfer appears, related to
capacitance and resistance elements. With increasing numbers of layers we can
see that this semicircle of the impedance response increases, the polymer free
areas of the electrode start getting covered with layers of PE on top. However,
at low frequencies we can still observe the straight line of the linear diffusion of
the probes through these layers until they reach the surface of the electrode.
After the assembly of the 11th layer a difference in behaviour between both
assemblies can be observed. In the case of PVBTMAC/PSS, Fig. 2.5b, the
0 10000 20000 30000 40000 50000 60000
0
2000
4000
6000
8000
10000
12000
14000
16000
18000
-Z"/
oh
ms c
m2
Z'/ohms cm2
Au+MPS
Au+MPS+1l
Au+MPS+3l
Au+MPS+5l
Au+MPS+7l
Au+MPS+11l
Au+MPS+17l
0 1000 2000 3000 40000
500
1000
1500
2000
0 1000 2000 3000 4000 5000 6000 7000 8000
0
200
400
600
800
1000
1200
1400
1600
1800
-Z"/
oh
ms c
m2
Z'/ohms cm2
Au+MPS
Au+MPS+1l
Au+MPS+3l
Au+MPS+5l
Au+MPS+7l
Au+MPS+11l
Au+MPS+17l
a b
c
0 10000 20000 30000 40000 50000 60000
0
2000
4000
6000
8000
10000
12000
14000
16000
18000
-Z"/
oh
ms c
m2
Z´/ohms cm2
11 layers PDADMAC/PSS
17 layers PDADMAC/PSS
11 layers PVBTMAC/PSS
17 layers PVBTMAC/PSS

Supralinearly vs linearly Growing Polyelectrolyte Multilayers
114
changes in impedance show a linear behaviour following the law of the growth
of a linear film. Increasing the number of layers leads to an increase in the
impedance to the charge transfer and a linear diffusion of the species through
the membrane. On the other hand, PDADMAC/PSS PEMs show a dramatic
change in behaviour. We can observe that for the 11th layer the impedance to
the charge transfer increases dramatically and there is a deviation from the
straight line at lower frequencies indicating an alteration in the way mass
transport is carried out. For the 17th layer we can observe that there are two
semicircles superimposed and the second semicircle is even bigger than the first
one at higher frequencies. This effect can be related to the formation of a
complex between the electroactive species and PDADMAC, because it appears
after the 11th layer at which the shift of the apparent redox potential in the CV
of this assembly was observed. Also, this complex formation seems to happen
after the 11th layer, where we have seen in the QCM data for PDADMAC/PSS
the exponential growing regime becomes more evident and a more hydrated
mass of PDADMAC assembles. The increase in the amount of assembled
polyelectrolyte in the 11th layer can be fundamental for the complex formation.
As can be seen in Fig. 2.5c, a complete change in behaviour is observed between
the two assemblies after the 11th layer. The linear diffusion of the redox species
through the PEMs is still visible in the case of PVBTMAC/PSS, but not in the
case of PDADMAC/PSS where the mechanism of mass transport seems to have
changed. Also the impedance values are dramatically larger in the case of
PDADMAC/PSS compared to PVBTMAC/PSS. We have observed that,

Chapter 2
115
according to cyclic voltammograms, PVBTMAC/PSS acts as a better insulator
than PDADMAC/PSS reducing the current in a more effective way. This
peculiar behaviour in PDADMAC seems to affect how mass transport through
the PEM occurs but somehow it does not affect so much the electron transfer
necessary to carry out the redox reaction between both species because there is
not such a big difference in the current reduction observed by cyclic
voltammetry.
Complex Formation Between PDADMAC and ferro/ferri
As we have already mentioned during this chapter the apparent redox potential
shifts when the assembly of PDADMAC/PSS reaches the 11th. In Fig. 2.6 the
cyclic voltammograms after the first layer and the 11th layer have been
deposited onto the gold substrate are shown. It can be clearly seen how the
redox potential has shifted to lower values, from E1/2 (1 layer) = 0.164 V to E1/2
(11 layer) = 0 V.

Supralinearly vs linearly Growing Polyelectrolyte Multilayers
116
Figure 2.6. Cyclic voltammograms for PDADMAC/PSS assemblies after the
first and the 11th layer have been deposited.
In this case we will consider the formal redox potential (E1/2) in order to
simplify the explanation. The formal redox potential for a reversible couple is
centred between the anodic potential and the catodic potential.
As we have seen it seems that the shift in the formal redox potential occurs once
assembly takes place after the 10th layer, as the PDADMAC/PSS system grows
supralinearly and the amount of mass deposited increases with each layer. In
order to create a complex with cyanoferrate molecules a certain amount of free
quaternary amines from PDADMAC are needed. This amount seems to be
reached at the 11th layer when the assembly is performed at these conditions of
ionic strength.
-0.4 -0.2 0.0 0.2 0.4 0.6
-300
-200
-100
0
100
200
300
1 layer
11 layersi/A
cm
-2
E/V vs. SCE
E0
ap
E1/2=0.164VE1/2=0V
Epa =0.245V
Epc =0.083V
Epa =0.024V
Epc =-0.024V

Chapter 2
117
In order to analyse the complex formation a bare gold substrate was placed as a
contact inside the electrochemical cell filled with a solution of ferro/ferri-
cyanate couple at 1 mM in 0.1 M KCl. A 10 mgml-1 solution of PDADMAC in
0.1 M KCl was added drop by drop (100 μl each) into the electrochemical cell
and cyclic voltammograms were recorded time to time. The concentration of
PDADMAC in the cell was recalculated each time.
In Fig. 2.7 we can see that when the concentration of PDADMAC is below 0.03
mgml-1 the shape of the voltammogram is that related to the diffusion of the
ferro/ferri species from the solution to the substrate where the redox reaction
occurs. Once the concentration is greater than 0.03 mgml-1 an elbow related to
the complex formation appears at potentials close to zero. When more
PDADMAC is added this elbow related to the complex starts growing meaning
that more cyanoferrate molecules are complexing with the PDADMAC until all
of them are in complex form This phenomena of the shifting of the potential is
related to the entrapment of ferrocyanide ions inside the PEMs with
PDADMAC and has already been reported.26

Supralinearly vs linearly Growing Polyelectrolyte Multilayers
118
Figure 2.7. Cyclic voltammograms at different concentrations of PDADMAC in
the electrochemical cell.
It is not until the total concentration of the cell reaches ~0.25 mgml-1 that there
are no free cyanoferrate molecules in the cell as seen by the absence of the
typical peak related to the free ferro/ferri reaction.
In order to know if there is any preference for any of them to create the complex
we prepared solutions in which the amount of ferro- and ferri- cyanate are
present in the same proportions.. A multilayer of (PDADMAC/PSS)6.5 at 0.5 M
NaCl was previously incubated with ferro/ferri solution, rinsed and analysed
by XPS afterwards, see Fig. 2.8.
-0.4 -0.2 0.0 0.2 0.4 0.6
-1500
-1000
-500
0
500
1000
1500i/A
E/V vs. SCE
CPDADMAC
=0
CPDADMAC
=0.03mg/ml
CPDADMAC
=0.08mg/ml
CPDADMAC
=0.14mg/ml
CPDADMAC
=0.20mg/ml
CPDADMAC
=0.25mg/ml

Chapter 2
119
Figure 2.8. XPS analysis of Au+MPS+(PDADMAC/PSS)6.5 incubated in
ferro/ferri 1 mM 0.1 M KCl.
It can be observed in Fig. 2.8 that most of the signal after rinsing is related to
potassium hexacyanoferrate (II) trihydrate (K4Fe(CN)6) indicating that there
seems to be a preference to form a complex with the ferro rather than with the
ferri molecule. In a paper published by Bekturov et al. in 1985, they confirmed
the complex formation between ferro-/ferri- species with PDADMAC, and
explained that the ratio in the complex formation between them is 5:1 for
PDADMAC: Fe2+ and 3:1 for PDADMAC: Fe3+.27 They also reported that about
25 % of the Fe2+ ions are oxidised to Fe3+ once the complex is formed; a deficit of
Fe 2p [R5,1]
Fe 2p 3/2 Fe(CN)6 2+
Fe 2p 1/2 Fe(CN)6 2+
Fe 2p 3/2 Fe(CN)6 3+
Fe 2p 1/2 Fe(CN)6 3+Shake up 2+
Shake up 2+
Name
Fe 2p 3/2 Fe(CN)6 2+
Fe 2p 1/2 Fe(CN)6 2+
Fe 2p 3/2 Fe(CN)6 3+
Fe 2p 1/2 Fe(CN)6 3+
Shake up 2+
Shake up 2+
Pos.
708.18
720.98
711.75
723.20
709.64
725.00
FWHM
2.054
2.054
2.054
2.054
2.054
2.054
L.Sh.
GL(30)
GL(30)
GL(30)
GL(30)
GL(30)
GL(30)
%Area
42.65
21.07
6.43
8.82
17.85
3.18
.
.
x 102
300
305
310
315
320
325
330
335
340
345
CP
S
728 724 720 716 712 708Binding Energy (eV)

Supralinearly vs linearly Growing Polyelectrolyte Multilayers
120
electrons created by the attraction of the electrons of the CN groups from the
nitrogen on the PDADMAC attracts the electrons of Fe2+ causing the oxidation
of Fe3+. These could explain the amount of ferro-/ferri- species observed by
XPS, it seems that in the PEM we need to reach to a point in which the
supralinear growth of the multilayer creates a sponge like structure with
enough free amines of different PDADMAC monomers to create the complex,
in a proportion of 5:1 with K4Fe(CN)6. The smaller amount of K3Fe(CN)6 found
could be due to less favoured complex formation or the self-oxidation of part of
the Fe2+ when the complex is created.
Taking into account the shape of the voltammograms and the accumulation of -
Fe(CN)62+ it can be postulated that after the 11th layer all the redox reaction is
carried out through electron transfer among the cyanoferrate molecules
attached to the complex and there is no diffusion of the free cyanoferrate
molecules through the multilayer as the voltammogram is fully centred at 0 V,
there are not elbows centred at 0.164 V related to the free cyano ferrate species.
Therefore, the molecules entrapped in the film forming the complex with the
PDADMAC are responsible for regulating the electron transfer between the
gold electrode and the free cyanoferrate molecules in solution.
2.4 Conclusions
We have discussed the differences in assembly between PSS and two different
polycations with quaternary amines, PDADMAC showing a supralinear growth
and PVBTMAC which displays a linear growth pattern. The assembly of

Chapter 2
121
PVBTMAC/PSS creates denser and less hydrated PEMs than PDADMAC/PSS
assembly. PBVTMAC/PSS PEMs are also more hydrophilic and they act as
better insulators. Their permeability seems not to vary with the number of
layers after a certain number of layers have been assembled and their insulating
behaviour increases in a regular manner with the number of layers assembled.
The PDADMAC/PSS PEMs on the other hand grow in a supralinear fashion,
creating sponge-like membranes especially when more than 11 layers have been
assembled. The nature of the membranes is more hydrophobic than the
PVBTMAC/PSS. It also acts as an insulator and becomes a more efficient
insulator with increasing numbers of layers. A particular phenomenon has
been observed during the electrochemical experiments performed, once the
membrane has more than 11 layers, there is complex formation between the
quaternary amines of the PDADMAC and the ferro specie used as the
electrochemical probe, affecting how mass transport along the membrane is
produced and its capacity as insulator. Even if the PDADMAC/PSS membrane
is thicker than the PVBTMAC/PSS membrane, the current reduction is more
effective in the latter.
2.5 References
(1) Geise, G. M.; Lee, H.-S.; Miller, D. J.; Freeman, B. D.; McGrath, J. E.; Paul,
D. R. J. Polym. Sci. Part B Polym. Phys. 2010, 48 (15), 1685–1718.
(2) Ali, M.; Yameen, B.; Cervera, J.; Ramírez, P.; Neumann, R.; Ensinger, W.;
Knoll, W.; Azzaroni, O. J. Am. Chem. Soc. 2010, 132 (24), 8338–8348.

Supralinearly vs linearly Growing Polyelectrolyte Multilayers
122
(3) Stanton, B. W.; Harris, J. J.; Miller, M. D.; Bruening, M. L. Langmuir 2003,
19 (17), 7038–7042.
(4) Jin, W.; Toutianoush, A.; Tieke, B. Langmuir 2003, 19 (7), 2550–2553.
(5) Shan, W.; Bacchin, P.; Aimar, P.; Bruening, M. L.; Tarabara, V. V. J. Memb.
Sci. 2010, 349 (1-2), 268–278.
(6) Miller, M. D.; Bruening, M. L. Langmuir 2004, 20 (26), 11545–11551.
(7) Ouyang, L.; Malaisamy, R.; Bruening, M. L. J. Memb. Sci. 2008, 310 (1-2),
76–84.
(8) Tripathi, B. P.; Dubey, N. C.; Stamm, M. J. Hazard. Mater. 2013, 252-253,
401–412.
(9) Cheng, C.; Yaroshchuk, A.; Bruening, M. L. Langmuir 2013, 29 (6), 1885–
1892.
(10) Armstrong, J. A.; Bernal, E. E. L.; Yaroshchuk, A.; Bruening, M. L.
Langmuir 2013, 29 (32), 10287–10296.
(11) Bruening, M. In Multilayer Thin Films; Wiley-VCH Verlag GmbH & Co.
KGaA, 2002; pp 487–510.
(12) Mansouri, S.; Winnik, F. M.; Tabrizian, M. Expert Opin. Drug Deliv. 2009, 6
(6), 585–597.
(13) Jiang, C.; Luo, C.; Liu, X.; Shao, L.; Dong, Y.; Zhang, Y.; Shi, F. ACS Appl.
Mater. Interfaces 2015, 7 (20), 10920–10927.
(14) Georgieva, R.; Moya, S.; Donath, E.; Bäumler, H. Langmuir 2004, 20 (5),
1895–1900.
(15) Silva, T. H.; Garcia-Morales, V.; Moura, C.; Manzanares, J. A.; Silva, F.

Chapter 2
123
Langmuir 2005, 21 (16), 7461–7467.
(16) Liu, Y.; Zhao, M.; Bergbreiter, D. E.; Crooks, R. M. J. Am. Chem. Soc. 1997,
119 (37), 8720–8721.
(17) Han, S.; Lindholm-Sethson, B. Electrochim. Acta 1999, 45 (6), 845–853.
(18) Barreira, S. V. P.; García-Morales, V.; Pereira, C. M.; Manzanares, J. a.;
Silva, F. J. Phys. Chem. B 2004, 108 (46), 17973–17982.
(19) Elżbieciak-Wodka, M.; Kolasińska-Sojka, M.; Nowak, P.; Warszyński, P. J.
Electroanal. Chem. 2015, 738, 195–202.
(20) Estrela-Lopis, I.; Iturri Ramos, J. J.; Donath, E.; Moya, S. E. J. Phys. Chem. B
2010, 114 (1), 84–91.
(21) Goss, C. A.; Charych, D. H.; Majda, M. Anal. Chem. 1991, 63 (1), 85–88.
(22) Moya, S. Macromol. Rapid Commun. 2012, 33 (12), 1022–1035.
(23) Harris, J. J.; Bruening, M. L. Langmuir 2000, 16 (4), 2006–2013.
(24) Farhat, T. R.; Schlenoff, J. B. Langmuir 2001, 17 (4), 1184–1192.
(25) Rmaile, H. H.; Farhat, T. R.; Schlenoff, J. B. J. Phys. Chem. B 2003, 107 (51),
14401–14406.
(26) Wang, B.; Anzai, J. Langmuir 2007, 23 (13), 7378–7384.
(27) Bekturov, E. A.; Kudaibergenov, S. E.; Ushanov, V. Z.; Saltybaeva, S. S.
Die Makromol. Chemie 1985, 186 (1), 71–75.

Supralinearly vs linearly Growing Polyelectrolyte Multilayers
124

125
Chapter 3 Regenerable Polyelectrolyte Multilayers for Applications in Foulant Removal.
3.1 Introduction.
Conceptually LbL is simple and easy to apply. It only requires the alternating
exposition of a charged surface to solutions of oppositely charged
polyelectrolytes and washings in between deposition steps to remove excess
polymer.1,2 PEMs are very stable and in most cases are not easy to disassemble
once fabricated. There are practical situations, however, where it would be
desirable to remove PEMs fully or partially after the assembly as a means of
surface exposure or to liberate an encapsulated material. Another reason for
the removal of a PEM could be that PEMs are no longer capable of fulfilling
their functions, i.e.: as filtration membranes. This is often the case when PEMs
are covered with foulants. Devices and coatings fabricated with PEMs retain
charges from the last assembled polyelectrolyte layer. These charges can be
used to build up additional polyelectrolyte layers but can also attract other
charged molecules that could be present in the environment in contact with the
PEM.3,4 For example, in the case of polyelectrolyte capsules for drug delivery
the charge of the PEM can lead to the coating of the capsules with proteins
present in biological fluids. The formation of protein coronas on top of the
capsules will impact on their interaction with cells.5,6 For PEMs used for

Regenerable polyelectrolyte multilayers
126
membrane fabrication with applications in water reuse or desalination, the
charges in the PEMs can lead to the deposition of foulants present in aqueous
media like small charged organic molecules, proteins, and other biomolecules.
The deposition of foulants on top of the PEM can significantly hinder their use
as membranes as pores will be covered by the foulant and their filtering
capacity will be diminished.
One way to avoid the deposition of proteins or foulants on top of the PEMs is
their chemical modification with molecules like polyethylene glycol (PEG)
known for its low protein binding.7–9 In some cases the multilayer can also be
crosslinked reducing the charge density on the surface.10 The chemical
modification or the crosslinking can be effective in preventing foulant
deposition but at the same time they can also interfere with the functionality of
the PEMs.
The removal of foulants deposited on top of the PEM is not simple since the
electrostatic interactions of the foulant with the PEM can be strong and the
surfactant treatment may also lead to the degradation of the layer.
In this chapter we want to explore the possibility of foulant removal from the
surface of PEMs by using sacrificial polyelectrolyte layers on top of non-
removable PEMs. Since the foulants will be located mostly on the surface of the
multilayers we will show that it is possible to develop multilayers where only
the top polyelectrolyte layers can be removed. The idea beyond this is that with
the removal of the top sacrificial layers, foulants present on the surface of the

Chapter 3
127
PEM will also be removed with the sacrificial layers leaving the non-removable
layers unaltered. This strategy would be most suitable in situations where it is
necessary to rebuild the PEM after foulant removal. By having a PEM with
only a removable top block it is not necessary to rebuild the whole multilayer
but only the top layers.
An example for the potential application of regenerable membranes is the
cleaning of PEM membranes used for water filtration.11 Then, it will be possible
to regenerate the PEMs as “foulant free”. If the process can be repeated many
times the operating life of the membrane will be enhanced.
We will show here that depending on the particular combination of polycations
and polyanions employed for multilayer fabrication, different strategies for the
removal of the polyelectrolyte have to be applied11,12 e.g.: variation of pH,13 or
the use of cationic or anionic surfactants.14
As a proof of concept it will be demonstrated that the top layers of a
polyelectrolyte multilayer coated with proteins can be removed together with
the protein layer and then a few polyelectrolyte layers can be assembled and
that the whole procedure can be repeated.
The quartz crystal microbalance and atomic force microscopy will be applied to
study PEM removal and regeneration.

Regenerable polyelectrolyte multilayers
128
3.2 Materials and Methods
Poly acrylic acid (PAH) [Mw = 15 kgmol-1], PDADMAC Mw = 20 % wt. in
water [Mw = 200-350 kgmol-1], PSS [Mw = 70 kgmol-1], poly ethylene imine
(PEI) 50 % wt. in water [Mw = 2 kgmol-1], poly (acrylic acid) (PAA) 50 % wt. in
water [Mw = 5 kgmol-1], sodium dodecyl sulfate (SDS) 99.9 %, BSA, tetramethyl
rhodamine labelled bovine serum albumine (BSA), acetic acid 99.80 %,
hydrochloric acid 1N, sodium acetate trihydrate, sodium chloride, (1-tetradecyl)
trimethylammonium bromide (TTAB) 98 % and sodium hydroxide.
3.2.1 Quartz Crystal Microbalance
PEM formation, deconstruction and regeneration were monitored by QCM-D
using silica crystals as substrates. All the polyelectrolyte solutions were at 1
mgml-1 in the corresponding salt concentration and pH for each of the
following; blocks of PAH/PSS and PDADMAC/PSS at 0.5 M NaCl, blocks of
PDADMAC/ PAA and PEI/PAA, at 0.3 M NaCl at pH 3. Blocks of PEI/ PSS in
50 mM acetate buffer pH 5.6, 0.2 M NaCl. The deposition of each layer is
followed by a decrease in the resonance frequency of the 3rd overtone (15 MHz)
with subsecond time resolution.
3.2.2 Atomic Force Microscopy
The PEMs were deposited on top of a glass substrate, and analysed in tapping
mode in a fluid cell with a solution of 10 mM NaCl and a DNP cantilever with a
k = 0.24 Nm-1.

Chapter 3
129
3.3 Results and Discussion
The strategy followed in this work is illustrated in Fig. 3.1, where a PEM
consisting of two blocks, one removable block on top of a second non-
removable block is shown. The top block is removed by means of pH or
surfactant treatment and then rebuilt.
Figure 3.1. Schematic of the removal and regeneration of a di-block
polyelectrolyte membrane.
3.3.1 Ph Changes
Weak polyelectrolytes are sensitive to changes in the pH by varying the number
of charged functional groups as the pH increases or decreases. PAA is a typical
anionic weak polyelectrolyte. As the pH increases the dissociation of the
carboxylic acid of the PAA monomers increase and PAA becomes more
Firs
tsta
ckSe
cond
stac
k
Protein
1) PEM 2) Removal 3) Regeneration

Regenerable polyelectrolyte multilayers
130
charged. In a recent study we have reported that the assembly of
PAA/PDADMAC is very sensitive to pH at which the assembly is performed.
As PDADMAC is a strong polymer the pH is only affecting PAA. In 2013,
Alonso et al. showed that there is a supralinear growth for PAA/PDADMAC at
low pH, approximately pH 3, and as the pH increases the amount of polymer
deposited in the assembly decreases.15 At high pH, 12-13, almost no polymer is
assembled compared to the assembly at pH 3. Intuitively, one would think that
the opposite situation should be taking place. At higher pH since PAA is more
charged the assembly should proceed more effectively due to electrostatic
interactions than at lower pH, like 3, where the degree of charging of the PAA is
lower. The reason for this behaviour is that at high pH PAA is significantly
hydrated and the interaction with the more hydrophobic PDADMAC would
decrease this hydration and the PAA assembly becomes less favourable
thermodynamically.
Taking advantage of this pH dependence for PAA/PDADMAC we fabricated
the films at pH 3 and then exposed them to pH 13. Film growth and the
treatment with NaOH at pH 13 were followed with the QCM-D. As can be
observed in Fig. 3.2 a) and d) the PAA/PDADMAC display a supralinear
growth at pH 3, and increasing to pH 13 results in a frequency decrease of 186
Hz from an initial value of 320 Hz, approximately 58 % of the PEM has been
removed.

Chapter 3
131
Figure 3.2. a) 4 bilayers of PDADMAC/PAA at 0.3 M naCl and pH 3 treated
with water at pH 13, b) 2.5 bilayers of PAH/PSS at 0.5 M NaCl and 3.5 bilayers
of PDADMAC/PAA at 0.3 M NaCl and PH 3 treated with water at pH 13, c) 2.5
bilayers of PAH/PSS at 0.5 M NaCl, 3.5 bilayers of PDADMAC/PAA at pH3
and BSA on top treated with water at PH 13, d), e), f) zoom ins of the PEM
removal from figures a, b and c respectively.
Frequency and mass values for the first and second blocks and including BSA,
before and after pH or surfactant treatment as well as the percentages of mass
removal are shown in Table 3.1.
Table 3.1. Frequency and mass for the 1st and 2nd stacks before and after
removal of the second block. Mass removal is also given in percentages.
a) b)
0 100 200 300 400
-400
-300
-200
-100
0
f
D
Time (min)
f (H
z)
-5
0
5
10
15
20
25
30
35
40
-
-
-
-+
+
++
pH 13H
2O
D (
1E
-06
)
H2O
0 100 200 300 400
-400
-350
-300
-250
-200
-150
-100
-50
0
50
f
D
Time (min)
f (H
z)
0
10
20
30
40
50
60
70
80
D (
1E
-06
)
-
-
-
-
+
+
++
pH 13
H2O
H2O
-
+
-+
H2O
PDADMAC/PAAPAH/PSS
0 100 200 300 400 500
-500
-400
-300
-200
-100
0
PDADMAC/PAAPAH/PSS
BSA
f
D
Time (min)
f (H
z)
-
-
-
-
+
+
++
pH 13
H2O
H2O
-
-
+
+
H2O
H2O
+
0
20
40
60
80
100
120
D (
1E
-06
)
0 100 200 300 400
-400
-300
-200
-100
0
f
D
Time (min)
f (H
z)
-5
0
5
10
15
20
25
30
35
40
-
-
-
-+
+
++
pH 13H
2O
D (
1E
-06
)
H2O
0 100 200 300 400
-400
-350
-300
-250
-200
-150
-100
-50
0
50
f
D
Time (min)
f (Hz
)
0
10
20
30
40
50
60
70
80
D (1
E-06
)
-
-
-
-
+
+
++
pH 13
H2O
H2O
-
+
-+
H2O
PDADMAC/PAAPAH/PSS
0 100 200 300 400 500
-500
-400
-300
-200
-100
0
PDADMAC/PAAPAH/PSS
BSA
f
D
Time (min)
f (H
z)
-
-
-
-
+
+
++
pH 13
H2O
H2O
-
-
+
+
H2O
H2O
+
0
20
40
60
80
100
120
D (
1E-0
6)
c)d) e) f)
- 320 Hz
- 134 Hz
- 279 Hz
- 219 Hz
- 242 Hz
- 109 Hz

Regenerable polyelectrolyte multilayers
132
Then, we fabricated a di-block PEM with an initial block of PAH/PSS on top of
which we assembled the PAA/PDADMAC film. The film growth was followed
by QCM-D and is shown in Fig. 3.2 b). Then we exposed the PEM to pH 13 and
as it can be seen in the same Fig. 3.2 b) and e) that there is a decrease in the
frequency of 38 % of the second block. Since the idea behind this work is to
create a surface that can be removed and regenerated to eliminate foulants
attached to the surfaces we decided to expose the di-block PEM to BSA. The
protein deposits on top of the PEMs, see Fig. 3.2 c) and f). When the PEM with
BSA on top is exposed to pH 13 solution we can see from the change in
frequency that the protein, together with the top layers of the PEMs, are being
removed, 99 % of the mass of the second block including the protein on top is
removed The PAA/PDADMAC film could be rebuilt.
3.3.2 Surfactants
It has been shown in previous work by Iturri et al. 2010, that PDADMAC/PSS
PEMs can be easily removed in the presence of the TTAB surfactant while
PAH/PSS PEMs remain stable and even bind surfactant to the PEMs.14 The
TTAB surfactant is positively charged and binds therefore to PSS in both cases.
The stability of the PAH/PSS can be attributed to stronger binding of the
Polyelectrolytes Polyelectrolytes
1st Stack 2nd Stackfrom
total
from
2nd
3a 8 (PDADMAC/PAA)4 320 5779 H2O pH 13 58
3b 12 (PAH/PSS)2.5 119 2149 (PDADMAC/PAA)3.5 279 2890 H2O pH 13 22 38
3c 12 (PAH/PSS)2.5 108 1950 (PDADMAC/PAA)3.5 + BSA 242 2420 H2O pH 13 55 99
4a 9 (PAH/PSS)2 53 950 (PDADMAC/PSS)2.5 236 3307 TTAB 50mM 29 37
4b 10 (PAH/PSS)2 79 1423 (PDADMAC/PSS)3 + BSA 324 4427 TTAB 50mM 56 74
6a 9 (PEI/PSS)2 28 511 (PEI/PAA)2.5 140 2018 SDS 2% 44 55
6b 8 (PEI/PSS)2 38 678 (PEI/PAA)2 + BSA 176 2501 SDS 2% 98 125
Treatment
% removed
Figure Nº Layers|f1|
(Hz)
Mass of
1st stack
(ng/cm2)
|f2|
(Hz)
Mass of
2nd stack
(ng/cm2)

Chapter 3
133
primary amines of PAH to the sulfonate groups of PSS than that of the
quaternary amines of PDADMAC to the sulfonate groups of PSS.
We combined PDADMAC/PSS with PAH/PSS in a di-block structure and
followed the assembly in the QCM-D Fig. 3.3 a) and c). The top layers of the
PDADMAC/PSS block could be removed in the presence of TTAB as measured
by QCM-D.
Figure 3.3. a) 2 bilayers of PAH/PSS and 2.5 bilayers of PDADMAC/PSS
treated with 50 mM TTAB, b) 2 bilayers of PAH/PSS at 0.5 M NaCl, 3 bilayers
of PDADMAC/PSS at 0.5 M NaCl and BSA on top, treated with TTAB and
reconstructed with 2 bilayers of PDADMAC/PSS at 0.5 M NaCl afterwards, c),
d) zoom ins of the PEMs removal from figures a, and b respectively.
0 50 100 150 200 250 300
-350
-300
-250
-200
-150
-100
-50
0
50
PDADMAC/PSS f
D
Time (min)
f (H
z)
-
-
-
-
+
++
+
-
+
H2O
H2O
TTAB
PAH/PSS
H2O
-10
0
10
20
30
40
50
60
70
80
90
100
110
120
D (
1E
-06
)
0 100 200 300 400 500
-600
-500
-400
-300
-200
-100
0
PDADMAC/PSSPDADMAC/PSS
H2O
f
D
Time (min)
f (H
z)
-
-+
+
H2O
-
-+
+
-
+
H2O
TTABBSA
H2O
-
-+
+
H2O
PAH/PSS
-10
0
10
20
30
40
50
60
70
80
90
100
D (
1E
-06
)
a)
b)
c) d)
- 236 Hz
- 167 Hz
- 324 Hz
- 143 Hz

Regenerable polyelectrolyte multilayers
134
The change in frequency after treatment with TTAB proved the removal of 37 %
of the second block as shown in Table 3.1. After removal the PDADMAC/PSS
bilayers could be easily reassembled up to the frequency values before TTAB
treatment. The di-block PEM was also coated with BSA, Fig. 3.3 b) and d). The
coating increased the mass of the PEM by 35 %. The treatment with TTAB after
BSA deposition removed the protein together with the bilayers of
PDADMAC/PSS, which could be easily regenerated. In principle, the strategy
of removal could be applied several times. The removal of BSA and the top
layers in a di-block PEMs of PAH/PSS and PDADMAC/PSS was also studied
by AFM. In Fig. 3.4 a) we can observe the AFM micrograph of the di-block
PEM of 2 bilayers of PAH/PSS and 3 bilayers of PDADMAC/PSS on top, the
roughness and the structure are characteristics of the PDADMAC/PSS film.16
Figure. 3.4. a) AFM micrograph of a PEM di-block of 2 bilayers of PAH/PSS at
0.5 M NaCl and 3 bilayers of PDADMAC/PSS at 0.5 M NaCl on top, b) PEM
with BSA deposited on top, c) PEM with BSA after 50 mM TTAB treatment.
In Fig. 3.4 b) the film has been exposed to BSA. The change in the topology of
the film is complete after deposition of the protein. BSA covers the whole
a b c

Chapter 3
135
surface and has a clear rounded structure. The treatment with TTAB shown in
Fig. 3.4 c) results in a surface with a topography that is clearly not that of the
BSA but it is also not that of the PDADMAC/PSS film. Most likely this is due
to remnants of the PDADMAC/PSS PEM on top of the PAH/PSS. Finally,
PDADMAC/PSS bilayers are assembled again on top and the original topology
and roughness of the PDADMAC/PSS film is restored.
In order to confirm that there is no remaining foulant on the film we labelled
BSA fluorescently and measured the fluorescence of the film after BSA
deposition and after PEM removal. QCM-D is not capable of differentiating
between the mass of the PEM and the mass of BSA. In Fig. 3.5 a) a PEM
composed of a di-block assembly of (PAH/PSS)+(PDADMAC/PSS)1.5 does not
show any fluorescence. When BSA labelled with tetramethyl rhodamine was
assembled on top of the PEM, the typical emission fluorescence signal from
rhodamine at 572 nm can be observed in Fig. 3.5 b).
Figure 3.5. Fluorescence Intensity of a) 1 bilayer of PAH/PSS at 0.5 M NaCl and
1.5 bilayers of PDADMAC/PSS at 0.5 M NaCl, b) with rhodamine labelled BSA
on top, c) after 50 mM TTAB treatment.
a b c

Regenerable polyelectrolyte multilayers
136
After treatment with 50 mM TTAB no fluorescence can be detected from the
surface (Fig. 3.5 c), meaning that all labelled BSA has been removed.
Alternatively to the use of the cationic TTAB, and taking into account industrial
applications of the removal and regeneration strategy, we looked at PEM
combinations that could be removed with the negatively charged Sodium
Dodecyl Sulfate (SDS), which is a standard surfactant used for cleaning in
multiple industrial applications. SDS, as a negatively charged molecule, must
bind to a positively charged polyelectrolyte. We tried several polyelectrolyte
combinations as in the previous cases but all proved to be resistant to the SDS
treatment with the exception of PDADMAC/PAA and PEI/PAA. The first
PEM showed 60 % removal in the presence of SDS and the second almost 100
%. We decided to work with PEI/PAA on top of PEI/PSS. PEI/PSS was not
affected by SDS.
When BSA was deposited on top of a di-block membrane of PEI/PSS and
PEI/PAA, and afterwards treated with 2 % SDS in water, we observed (Fig. 3.6
b) and d)) that the top block with BSA was removed but also part of the first
stack.

Chapter 3
137
Figure 3.6. a) 2 bilayers of PEI/PSS in acetate buffer and 2.5 bilayers of
PEI/PAA at 0.3 M NaCl and pH 3 on top treated with 2 % SDS in water, b) 2
bilayers of PEI/PSS in acetate buffer and 2 bilayers of PEI/PAA at 0.3 M NaCl
and pH 3 with BSA on top and treated with 2 % SDS in water, c), d) zoom ins of
the PEMs removal from figures a and b respectively.
The only explanation for this that we can give at the moment, is that the BSA
layer interdigitates with the top PEM and this also affects the 1st stack that can
be removed then. We have seen that the removal of the 2nd stack for the
PDADMAC/PAA with basic pH is more significant when BSA is on top of the
film than when it is not and the same for PDADMAC/PSS in the presence of
0 100 200 300 400
-280
-260
-240
-220
-200
-180
-160
-140
-120
-100
-80
-60
-40
-20
0
20
f
D
Time (min)
f (H
z)
-
-++ H
2O
-
-
+
+
+
H2O
SDS H2O
+
H2O
PEI/PAAPEI/PSS
-10
0
10
20
30
40
D (
1E
-06
)
0 100 200 300 400 500
-340
-320
-300
-280
-260
-240
-220
-200
-180
-160
-140
-120
-100
-80
-60
-40
-20
0
20
f
D
Time (min)
f (H
z)
--
+
+H
2O
PEI/PAAPEI/PSS
-
+
+- H
2O
SDS
H2O
H2O
BSA
0
20
40
60
80
D (
1E
-06
)
- 140 Hz
- 78 Hz
- 176 Hz
- 3 Hz
a)
b)
c) d)

Regenerable polyelectrolyte multilayers
138
TTAB. It is reasonable to think that the protein alters the PEM structure to a
certain extent.
3.4 Conclusions
Di-block PEMs with a top removable block have been fabricated. We have
prepared different polyelectrolyte combinations and we have shown that
depending on the particular combination of polyelectrolyte chosen different
procedures can be applied to remove the top layers: pH variations, and
treatment with SDS and TTAB surfactants, see Fig. 3.7.
Figure 3.7. Schematic sketch of all the different combinations tested.
The removal of the top layers does not affect, in most cases, the 1st block of the
PEM, which is fabricated upon polyelectrolytes that are resistant to the stimuli
that leads to the removal of the top block. There is a certain interdigitation
between the stacks, making the removal of the top blocks less than the removal
if this top block were standing alone without the supporting stack. Foulant
before after
before after
before after before after
before after
WithBSA
before after
38%
99%
37%
74%
55%
125%
(PAH/PSS)+(PDADMAC/PAA) (PAH/PSS)+(PDADMAC/PSS) (PEI/PSS)+(PEI/PAA)

Chapter 3
139
present on top of the PEM, as shown for BSA in this chapter, can be removed
together with the top layers applying the corresponding stimuli. Surprisingly
the removal of the top block is enhanced in the presence of BSA and for the case
of the di-block PEI/PSS with PEI/PAA on top the presence of BSA leads to
complete removal of the PEMs after SDS treatment.
Once the layers have been removed they can be rebuilt free from foulants. The
whole procedure from the regeneration to the removal can be repeated several
times.
If applied to a filtration membrane the removal and reassembly could extend
the operating life of the membrane.
The work presented in this chapter resulted in the following publication:
Irigoyen, J.; Politakos, N.; Murray, R. A.; Moya, S. E. Macromol. Chem. Phys.
2014, 215 (16), 1543–1550.
3.5 References
(1) Decher, G.; Hong, J. D.; Schmitt, J. Thin Solid Films 1992, 210–211 (0), 831–
835.
(2) Decher, G.; Hong, J. D. Berichte der Bunsengesellschaft für Phys. Chemie 1991,
95 (11), 1430–1434.
(3) Caruso, F.; Donath, E.; Möhwald, H. J. Phys. Chem. B 1998, 102 (11), 2011–
2016.
(4) Ladam, G.; Gergely, C.; Senger, B.; Decher, G.; Voegel, J.-C.; Schaaf, P.;

Regenerable polyelectrolyte multilayers
140
Cuisinier, F. J. G. Biomacromolecules 2000, 1 (4), 674–687.
(5) Saptarshi, S. R.; Duschl, A.; Lopata, A. L. J. Nanobiotechnology 2013, 11 (1),
26.
(6) Mahmoudi, M.; Monopoli, M. P.; Rezaei, M.; Lynch, I.; Bertoli, F.;
McManus, J. J.; Dawson, K. A. ChemBioChem 2013, 14 (5), 568–572.
(7) Leung, M. K. M.; Such, G. K.; Johnston, A. P. R.; Biswas, D. P.; Zhu, Z.;
Yan, Y.; Lutz, J.-F.; Caruso, F. Small 2011, 7 (8), 1075–1085.
(8) Banerjee, I.; Pangule, R. C.; Kane, R. S. Adv. Mater. 2011, 23 (6), 690–718.
(9) Yang, W. J.; Pranantyo, D.; Neoh, K.-G.; Kang, E.-T.; Teo, S. L.-M.;
Rittschof, D. Biomacromolecules 2012, 13 (9), 2769–2780.
(10) Zhu, X.; Jańczewski, D.; Lee, S. S. C.; Teo, S. L.-M.; Vancso, G. J. Appl.
Mater. Interfaces 2013, 5 (13), 5961–5968.
(11) Shan, W.; Bacchin, P.; Aimar, P.; Bruening, M. L.; Tarabara, V. V. J. Memb.
Sci. 2010, 349 (1-2), 268–278.
(12) Han, L.; Mao, Z.; Wuliyasu, H.; Wu, J.; Gong, X.; Yang, Y.; Gao, C.
Langmuir 2012, 28 (1), 193–199.
(13) Dubas, S. T.; Schlenoff, J. B. Macromolecules 2001, 34 (11), 3736–3740.
(14) Iturri Ramos, J. J.; Llarena, I.; Moya, S. E. J. Mater. Sci. 2010, 45 (18), 4970–
4976.
(15) Alonso, T.; Irigoyen, J.; Iturri, J. J.; Larena, I. L.; Moya, S. E. Soft Matter
2013, 9 (6), 1920–1928.
(16) Gao, C.; Leporatti, S.; Moya, S.; Donath, E.; Möhwald, H. Langmuir 2001,
17 (11), 3491–3495.

141
Chapter 4 Responsive Polyelectrolyte Multilayers Assembled at High Ionic Strength.
4.1 Introduction
PEM assembly is principally driven by electrostatic interactions between
oppositely charged polyelectrolytes. From a practical point of view, Layer by
Layer assembly only requires the dipping of a charged substrate in a solution of
a polyelectrolyte with a charge opposite to that of the substrate. The procedure
is repeated a number of times alternating between polycations and polyanions,
including water or salt washings in between layers, until a film of the desired
thickness is obtained.1-3 The practical procedure applied by the different
groups working in LbL assembly varies, regarding the number of washings
between the deposition of layers, the use of NaCl or water for the washings,
assembly time, pH and the ionic strength of the polyelectrolyte solution.4-7 For
some of these parameters, variations in the conditions of assembly can have a
strong impact on the quality of the assembled PEMs.
For instance, since polyelectrolyte conformation is determined by the ionic
strength in bulk solution, the thickness of a LbL film will be notably influenced
by the ionic strength at which the assembly has been performed. If
polyelectrolyte assembly takes place at low ionic strength the polymer chains
are normally extended and the resulting film will be thin. Increasing the ionic

Responsive Polyelectrolyte Multilayers
142
strength results in the coiling of the chains, which become less extended but
increase in volume.7 This in turn results in an increase in layer thickness.
Standard values of ionic strength for PEM fabrication range between 0.5 and 1
M NaCl due to considerations of layer thickness and packing of polyelectrolyte
chains.3, 8, 9
Polyelectrolyte assembly can, nevertheless, be performed at higher ionic
strengths even though the electrostatic interaction between subsequent layers is
reduced due to charge screening. There are examples in literature of PEM
assembly and studies of PEM stability at salt concentrations higher than 1 M
NaCl. It has been reported that PDADMAC/PSS remains stable at 3 M NaCl
but post-treatment of these multilayers with 4 and 5 M NaCl leads to the
destruction of the layered structure.10
In this study we explore the LbL assembly of PDADMAC and PSS at 3 M NaCl.
Working at this salt concentration, polyelectrolyte assembly takes place and
results in highly hydrated thick PEMs. These films release water and
experience a reduction in thickness of more than 200 nm when they are exposed
to pure water as we have proven employing both the QCM-D and AFM.
Changes in thickness and water content are fully reversible and comparable
with those observed in polyelectrolyte brushes following changes in the ionic
strength. However, contrary to polyelectrolyte brushes, PDADMAC/PSS
PEMs assembled at 3 M remain in a collapsed state at low ionic strength but are
fully extended at 3 M NaCl.11 The observed phenomena can be interpreted as a
consequence of high water uptake during assembly at 3 M NaCl and a

Chapter 4
143
reversible conformational change in the polyelectrolytes in the PEM. At low
ionic strength the chains expand, occupying more lateral space and displacing
solvent, while at high ionic strength the PEM coils, absorbing water into the
film.
PDADMAC/PSS PEMs combining ease of preparation with the capability of
reversible changes in thickness of more than 200 nm can have interesting
applications in the fabrication of smart surfaces and nanoactuators.
4.2 Materials and Methods
PSS [Mw ~ 70 kgmol-1], PDADMAC 20 % in water [Mw = 200-350 kgmol-1] and
sodium chloride.
4.2.1 Quartz Crystal Microbalance with Dissipation
The LbL technique was performed in situ in the QCM-D chamber onto silica
crystals by passing, with a peristaltic pump, a 1 mg ml-1 polyelectrolyte solution
in 3 M NaCl through the water-filled QCM-D chamber. Polyelectrolyte
deposition was followed by the decrease of the resonance frequency of the
quartz crystal. When the frequency levels stabilised, the polyelectrolyte
solution was replaced by a 3 M NaCl solution until a plateau in the frequency
response was reached. This procedure was repeated until the deposition of the
desired number of layers was achieved.
4.2.2 In Situ Combination of QCM-D and Ellipsometry
Wet mass and dry mass of the PEM were measured simultaneously using an in
situ combination of QCM-D and ellipsometry assembly. Spectroscopic

Responsive Polyelectrolyte Multilayers
144
ellipsometry gives information about solvent-free mass of polymer adsorbed as
a thin film onto a planar surface due to calculations of differences in the optical
density between the adsorbate and free solution. QCM-D gives information
about hydrated mass deposited onto a planar surface due to changes in the
resonance frequency of a quartz crystal. Both systems combined allow
calculating film hydration, which is calculated from the difference between the
dry and wet mass. A Q-Sense E-1 setup with a specific cell with two windows
was mounted on a spectroscopic rotating ellipsometer.
Ellipsometric data was obtained at 65º incident angle for a wavelength range
from 380 to 1000 nm with a time resolution of 5 seconds.
The QCM data was acquired as explained previously in parallel to the
ellipsometric data. The working temperature was maintained constant at 23 ºC.
The quartz crystal used was a QSX 335 specific sensor from Q-sense for the
ellipsometric mode. It is made of a 100 nm titanium layer on top of 50 nm of
silicon dioxide.
The quantitative evaluation of the ellipsometric data was performed using a
three layer model. The first layer is the titanium layer deposited on top of the
quartz crystal, the second layer the polyelectrolyte membrane and the third
layer is the bulk solution.
4.2.3 Atomic Force Microscopy
PEMs films previously deposited by QCM-D were manually, softly cut with a
razor blade, making stripes, and imaged in tapping mode in a closed fluid cell

Chapter 4
145
allowing the “in situ” exchange of salt to water. The particular silicon nitride
cantilever used was a DNP available from Bruker with a K = 0.32 Nm-1.
4.3 Results and Discussion
PDADMAC/ PSS PEMs were grown at 3 M NaCl in the QCM-D chamber.
Changes in frequency response and dissipation were measured for each layer
deposited (Fig. 4.1).
Figure 4.1. Frequency response and dissipation curves measured with QCM-D
showing the variation of the 3rd overtone during the assembly of 11th layers
PDADMAC/PSS system in 3 M NaCl.
The initial three polyelectrolyte layers were assembled in 0.5 M NaCl to
facilitate the polyelectrolyte deposition on top of the silica surface. After the 3rd
layer, polyelectrolytes were assembled at a salt concentration of 3 M NaCl. A

Responsive Polyelectrolyte Multilayers
146
total change in the frequency response of 2600 Hz was measured after the 11th
polyelectrolyte layer was deposited. This frequency variation is significantly
higher than for the same polyelectrolyte combination assembled at 0.5 M NaCl,
around 300 Hz after 11 layers and 800 Hz after 17 layer deposition.12 A total
mass of 47.28 μgcm-2 can be calculated according to the Sauerbrey equation (Eq.
4.1), where C = 18.06 ± 0.15 ngcm-2Hz-1.
𝑚𝑄𝐶𝑀 = −𝐶. (∆𝑓𝑖
𝑖) (4.1)
The mass measured with QCM-D corresponds to the mass of the assembled
polyelectrolytes and that of the entrapped water in the film. The higher values
of mass obtained, in relation to the deposition at 0.5 M NaCl may therefore be
due to more polymer being assembled per layer or more water being entrapped
in the film, or a combination of both situations. In Fig. 4.2 the difference
between dry mass and wet mass per layer during the assembly can be seen.

Chapter 4
147
Figure 4.2. Wet mass and dry mass per layer during the assembly of
(PDADMAC/PSS)1.50.5M NaCl+(PDADMAC/PSS)43M NaCl.
Wet mass calculations were performed as explained before. In the case of dry
mass or optical mass calculations as we have already explained a three layer
model was used. The first layer of titanium was calibrated prior to the
assembly. The PEM was considered as a single, transparent and homogeneous
layer, Cauchy medium, same as the last layer the bulk solution layer. In this
case for the calculation of mass the Feitjer´s equation (Eq. 4.2) was used:13
𝑚𝑜𝑝𝑡 =𝑑𝑜𝑝𝑡(𝑛𝑃𝐸𝑀−𝑛𝑠𝑜𝑙)
𝑑𝑛
𝑑𝑐
(4.2)
where (dn/dc) was considered to be 0.150 cm3g-1.14
nPEM, nH2O, n0.5M and n3M were calculated using Eq. 3:
0 2 4 6 8 10 12
0
5
10
15
20
25
Ma
ss (g
/cm
3)
Nº layers
wet mass
dry mass
PDADMAC
PDADMAC
PDADMAC
PDADMAC
PDADMAC
PDADMAC
PSS
PSS
PSS
PSS
PSS
H2O

Responsive Polyelectrolyte Multilayers
148
𝑛𝑥(𝜆) = 𝐴𝑥 + 𝐵𝑥(𝜆𝜇𝑚−1)−2 (4.3)
For the calculations λ=632.5 nm, the values of A and B for H2O were taken from
the literature A = 1.323 and B = 0.0032.15 In the case of 0.5 M NaCl A = 1.328
and B = 0.0032 and in the case of 3 M NaCl A = 1.351 and B = 0.0032.16
Values of dopt and APEM were obtained by fitting of this model using the
software CompleteEase (Woolam) for each particular layer, and afterwards
hydration was calculated following Eq. 4.4:
𝐻𝑦𝑑𝑟𝑎𝑡𝑖𝑜𝑛(%) =𝑚𝑄𝐶𝑀−𝑚𝑜𝑝𝑡
𝑚𝑄𝐶𝑀∗ 100 (4.4)
As can be seen most of the mass assembled per layer in these conditions is
solvated water. After the 11th layer the solvent is changed from 3 M NaCl to
pure water, there is a 60% loss of mass, but only water is lost because dry mass
remains the same. Taking each polyelectrolyte individually it can also be
observed, Fig. 4.3 a) and b), that comparing the wet and dry mass per
polyelectrolyte, PDADMAC is the mainly responsible for the large amount of
water incorporated in the resulting PEM. The difference between dry and wet
mass is always bigger in the case of PDADMAC compared to PSS.

Chapter 4
149
Figure 4.3. a) Comparison between dry and wet mass per layer for the
PDADMAC layers in the PEM, b) Comparison between dry and wet mass per
layer for the PSS layers in the PEM.
When the 3 M NaCl solution is replaced by water in the QCM-D chamber, the
frequency response increases and dissipation decreases. The response of the
QCM-D to the changes in ionic strength is shown in Fig. 4.4.
1 3 5 7 9 11
0
5
10
PD
AD
MA
QC
ma
ss in
cre
me
nt (
g/c
m2)
PDADMAC layers
PDADMAC wet mass
PDADMAC dry mass
2 4 6 8 10
0
2
4
6
8
10
PS
S m
ass in
cre
me
nt (
g/c
m2)
PSS layers
PSS wet mass
PSS dry massa) b)

Responsive Polyelectrolyte Multilayers
150
Figure 4.4. Frequency response and dissipation curves measured with QCM-D
(3rd overtone) for the alternating rinsing of 11 layers of PDADMAC/PSS with
water and 3 M NaCl.
In Fig. 4.4, the PEM is subsequently exposed to water and 3 M NaCl up to 6
times. As can be observed the changes are fully reversible. The exchange of the
3 M NaCl bulk solution with water results in a change of frequency of
approximately 1500 Hz and a reduction in dissipation of 3E-08. The frequency
change corresponds to a mass variation of 27.30 μgcm-2, or approximately 42 %
of the total mass. This change in frequency would mean, in terms of acoustic
thickness, a variation of approximately 273 nm of the total thickness of the film.
A reversible decrease in the frequency response of the PEM can only be
explained by the system losing water when exposed to water and regaining the
lost water when exposed to 3 M NaCl. The change in dissipation is also
indicative of a system becoming more rigid when the ionic strength is reduced.
Such behaviour resembles that of a polyelectrolyte brush but with an opposite
trend. Brushes are extended in water and reduce thickness, losing water and
become more rigid as the ionic strength increases. Recently, we have shown
that PDADMAC/PSS multilayers assembled at 0.5 M NaCl display similar
behaviour to a polyelectrolyte brush and also show pronounced thickness
variations with reversible loss of water when exposed to water and solutions of
higher ionic strengths.14 Assembling PEMs at 3 M NaCl, results in thicker
PEMs at 11 layers with a mass significantly larger than that obtained after
assembling 17 layers at 0.5 M NaCl. The opposite behaviour in response to the
ionic strength variation highlights a different arrangement of the polymer

Chapter 4
151
chains in the PEM and hints that the chains have different conformational
freedom.
We employed AFM to verify the changes observed by QCM-D measurements.
AFM allows us to visualise thickness variations in the film. A stripe of PEM
was removed from the film as explained in the experimental method. By doing
this a profile of the film was created that allows changes in film thickness to be
measured from the naked substrate to the top of film.
-2 0 2 4 6 8 10 12 14 16 18
-50
0
50
100
150
200
250
300
350
400
Th
ickn
ess (
nm
)
µm
3M NaCl
Waterc) Cross section

Responsive Polyelectrolyte Multilayers
152
Figure 4.5. AFM images of an 11 layer PDADMAC/PSS PEMs in a) water and
in b) 3 M NaCl, and cross sectional analysis c).
AFM images in Fig. 4.5 a) and b) have been taken in water and at 3 M NaCl
respectively. The thickness profile of the PEM, from the removed area to the
top of the PEM, is shown in Fig. 4.5 c) for both water and 3 M NaCl. The
profiles clearly illustrate that there is a decrease in thickness of the film of
approximately 185 nm, approximately 46 % of the total thickness, when going
from 3 M NaCl to water. The AFM measurements confirmed that the change
was reversible and the multilayer regained its original thickness when going
back to 3 M NaCl.
However, the roughness of the films increased as the ionic strength decreased.
An average roughness (Ra) of 1.03 was calculated in 3 M NaCl, while in water
the values of Ra increased to 18.03. This can be understood as the chains grow
laterally; the packing of the grains is altered creating defects between grains.
Both QCM-D and AFM measurements prove the reversible collapse of the PEM
when decreasing the ionic strength by means of water loss and thickness
reduction. The changes in thickness correspond to approximately 200 nm, and
the water loss represents approximately 42-46 % of the total mass. Such
variations in thickness and water content are more significant than those
usually observed with polyelectrolyte brushes.11 Taking brushes as a reference
for responsive polyelectrolyte films with varying ionic strength,
PDADMAC/PSS PEM prepared at 3 M NaCl shows an opposing behaviour to

Chapter 4
153
the expected ionic strength response. Due to a decrease in the ionic strength,
the thickness of the film decreases. This can be explained by the change in
conformation of the polyelectrolyte molecules that results in a thickness
reduction and a lateral growth of the chains that, in turn causes the water
entrapped in the layers to be expelled. The collapse of brushes can be explained
by the screening of the charges of the chains which diminish the internal
repulsion of the charged monomers, allowing the chains to acquire a more
coiled conformation. For the PDADMAC/PSS PEMs prepared at 3 M NaCl,
decreasing the ionic strength also varies the polymer chain conformation. The
chains can now extend themselves but they do so by occupying lateral space in
the film that was filled with water instead of pumping out as brushes do. This
results in uncompensated charges in the film that allow reorganisation in the
PEM.17 The lateral displacement results in the reduction of the water content of
the film. It is not fully clear why the chains tend to preferentially extend
laterally but it is likely due to the presence of oppositely charged layers below
or above. When the ionic strength is reduced the attractive electrostatic
interaction among subsequent layers must increase. This interaction may
indeed trigger a lateral displacement of the chains in a layer trying to maximise
the contact with the layers below and above. Nevertheless, the reversibility of
the collapse indicates that the reorganisation of the chains in the PEM does not
lead to a strong interaction between layers that would indeed prevent the
chains from going back to their original conformations.

Responsive Polyelectrolyte Multilayers
154
4.4 Conclusions
PEMs with the ability to collapse, displaying a variation in thickness of 200 nm,
approximately a 46 % reduction in its thickness, has been fabricated by
assembling PDADPMAC/PSS at 3 M NaCl. PEM assembly at 3 M NaCl with
the chains highly coiled results in a high content of water entrapped between
polyelectrolyte chains. PDADMAC assembles at these conditions with a higher
content in water with respect to PSS as has been measured by combined
ellipsometry-qcm. When reducing the ionic strength to that of pure water the
chains expand and flatten, thus occupying lateral space and removing the water
between chains. As a consequence, the thickness of the PEM is reduced. An
increase in the ionic strength to 3 M NaCl reverses the process and the film
stands up and regains the lost water. Such a PEM film could have interesting
applications, such as nanoactuators or controllable barrier applications where
polyelectrolyte brushes are frequently applied, with the advantage that the
response of the PEMs to varying ionic strength would be opposite to that
observed by a brush. Additionally, the thickness of the film can be easily
controlled over a few hundred nanometres by controlling the number of
polyelectrolyte layers assembled.
The work presented in this chapter resulted in the following publication:
Irigoyen, J.; Han, L.; Llarena, I.; Mao, Z.; Gao, C.; Moya, S. E. Macromol. Rapid
Commun. 2012, 33 (22), 1964–1969.

Chapter 4
155
4.5 References
(1) G. Decher, J. D. Hong, J. Schmitt, Thin Solid Films 1992, 210-211, Part 2, 831.
(2) G. Decher, Science 1997, 277, 1232.
(3) S. T. Dubas, J. B. Schlenoff, Macromolecules 1999, 32, 8153.
(4) S. S. Shiratori, M. F. Rubner, Macromolecules 2000, 33, 4213.
(5) E. Donath, G. B. Sukhorukov, F. Caruso, S. A. Davis, H. Möhwald,
Angewandte Chemie - International Edition 1998, 37, 2202.
(6) G. B. Sukhorukov, E. Donath, H. Lichtenfeld, E. Knippel, M. Knippel, A.
Budde, H. Möhwald, Colloids and Surfaces A: Physicochemical and
Engineering Aspects 1998, 137, 253.
(7) J. B. Schlenoff, S. T. Dubas, Macromolecules 2001, 34, 592.
(8) R. v. Klitzing, J. E. Wong, W. Jaeger, R. Steitz, Current Opinion in Colloid
& Interface Science 2004, 9, 158.
(9) L. Han, Z. Mao, H. Wuliyasu, J. Wu, X. Gong, Y. Yang, C. Gao, Langmuir
2012, 28, 193.
(10) R. Zhang, K. Köhler, O. Kreft, A. Skirtach, H. Möhwald, G. Sukhorukov,
Soft Matter 2010, 6, 4742.
(11) J. J. I. Ramos, S. E. Moya, Macromolecular Rapid Communications 2011, 32,
1972.
(12) J. J. I. Ramos, I. Llarena, S. E. Moya, Journal of Polymer Science Part A:
Polymer Chemistry 2011, 49, 2346.
(13) J. A. De Feijter, J. Benjamins, F. A. Veer, Biopolymers 1978, 17, 1759–1772.

Responsive Polyelectrolyte Multilayers
156
(14) J. J. Iturri Ramos, S. Stahl, R. P. Richter, S. E. Moya, Macromolecules 2011,
43, 9063.
(15) M. Daimon, A. Masumura, Appl. Opt. 2007, 46, 3811.
(16) Lide, D. R. Handbook of chemistry and physics, 85th ed.; CRC Press: Boca
Ratón, 2004.
(17) H. Mjahed, G. Cado, F. Boulmedais, B. Senger, P. Schaaf, V. Ball, J.-C.
Voegel, Journal of Materials Chemistry 2011, 21, 8416.

HYBRID SYSTEMS CARBON
NANOMATERIALS/POLYELECTROLYTES


159
Chapter 5
Hybrid Nanofiltration Membranes
Based on Multiwalled Carbon
Nanotubes and Polyelectrolytes.
5.1 Introduction
In recent years there has been growing interest in the use of PEMs for
nanofiltration and reverse osmosis applications.1–8 In LbL, thickness and
composition in the vertical direction can be defined with nanometer precision.9–
13 PEM thicknesses vary normally from a few to hundreds of nanometers with
a high density of charged functional groups, positively and negatively charged,
provided by the polyelectrolyte components.14,15 These characteristics:
nanoscale thickness and high functional group density, combined with their
ease of fabrication, make PEMs very attractive for the fabrication of
nanofiltration membranes. Several articles3,4,6,7,16,17 have explored the
possibilities of PEMs for nanofiltration and reverse osmosis using different
combinations of polyelectrolytes with very high retention for specific ions.18–21
For practical applications as nanofiltration and reverse osmosis membranes
PEMs must be assembled on top of membrane supports, which are either
polymeric or ceramic. The support entails pores necessary for the passage of
the solutions to be filtrated. If the pores are smaller or have a comparable size
with the polyelectrolyte molecules, which are normally assembled at ionic
strengths between 100 and 800 mM NaCl in a coiled state the LbL assembly

Hybrid nanofiltration membranes
160
takes place without difficulty. In these assembly conditions a dense and
compact multilayer structure is normally obtained. Adamczyk et al.22 found for
example that PDADMAC (Mw = 160 kgmol-1) at 0.5 M NaCl has a
hydrodynamic diameter of 26.2 nm. If pores are larger than the size of
polyelectrolyte molecules these will penetrate the pore and assemble on the
pore walls, which are charged. After a few deposition cycles of
polyelectrolytes, the pores will be filled with the polyelectrolyte as PEMs will
assembly on the walls of the pores.23,24 The size of the pores will decrease since
the diameter will be reduced by the PEMs being assembled or the pore can even
be fully blocked. If the polymer flows through the pores more polyelectrolyte
layers will be necessary to bridge over the pores. With the size of the pore
being reduced flow will also be reduced or stopped, hindering the use of the
membrane. This will be the case for ceramic SiC membranes which display a
broad distribution of pores ranging from a few nanometers in some cases to
more than 50 nm. Ideally for an optimal nanofiltration membrane a dense PEM
structure should be achieved on top of the pores without depositing on the pore
walls, which would cause the reduction of pore size and flow through the pore.
To overcome this problem of the size and the filling of the pores, as well as to
avoid the deposition of a large number of layers to cover the pore we have
fabricated an intermediate layer between the substrate and the PEMs based on
MWCNTs. This intermediate layer will cover the pores of the SiC support and
on top of these layers we have assembled the polyelectrolyte multilayer
membrane. The MWCNTs have also been assembled in a “Layer by Layer”

Chapter 5
161
fashion, using positively and negatively charged CNTs, which were later
crosslinked by annealing. CNTs were oxdised and later modified with
polycations to have negatively and positively charged CNTs respectively that
could be alternately assembled by electrostatic interactions. Since CNTs are on
average significantly longer than the pore diameter they will deposit on top
without penetrating the pore. The CNTs layers will then form a mesh that does
not allow the polyelectrolytes to go through the pore during the PEM assembly.
In this way the PEM acting as the nanofiltration membrane will be separated
from the pores by a MWCNTs multilayer. In these conditions the pores will not
be filled with polymer during the PEM assembly. Moreover, this spacer will
increase the path of water flow and thus allow lateral movement of water
between the PEM and SiC pores, creating a funnel effect with a consequent
increase in flow. We will show that by fabricating a hybrid membrane based on
PEMs deposited on a MWCNT multilayer on top of ceramic silicon carbide
(SiC) modules the performance of the PEMs, flow and retention, will be
significantly increased compared with the situation without MWCNTs, leading
to new operational possibilities in nanofiltration for PEMs.
5.2 Materials and Methods
PAH [Mw= 1.5 kgmol-1], PSS [Mw=1000 kgmol-1], PDADMAC [Mw=100-200
kgmol-1], sodium chloride (Reag. Ph Eur), magnesium chloride hexahydrate (Ph
Eur), sulfuric acid (95-97%), nitric acid fuming 100%, magnesium sulfate
heptahydrate (Ph Eur), sodium hydroxide and multi walled carbon nanotubes
95% purity, 30 nm of diameter and 1-5 microns of length (Data from the

Hybrid nanofiltration membranes
162
distributor). Ceramic SiC monotubular modules with a length of 250 mm, an
inner diameter 6 mm, and an outer diameter of 10 mm and flat sheets were
provided by Liqtech International, Denmark. According to company technical
specifications the pore size is around 40 nm in diameter. The water used is
ultra pure with a resistivity at 25ºC of 18.2 MΩ cm-1.
5.2.1 MWNTs Functionalization
For the LBL assembly of the MWCNTs these were first oxidised in a mixture of
H2SO4:HNO3 (3/1 v/v) at reflux at 80-85 ºC for 90 minutes and then cleaned
with water in an Amicon cell (pore size 200 nm) until neutral pH was
achieved.25 The carboxylated nanotubes (MWCNT-COOH) were stable in
water and display a zeta potential of -23 mV at neutral pH. Once oxidised the
MWCNTs were coated with PAH by electrostatic interactions. The CNTs
become positively charged with a zeta potential of +39 mV also at neutral pH.
For the PAH coating, previously oxidised MWCNTs were dispersed in a
solution of 1 mgml-1 PAH in 0.5 M NaCl for 30 minutes and then centrifuged at
35.000 rpm for 1 hour to remove excess of PAH and then washed with pure
water 3 times.
5.2.2 Assembly of the MWCNTs Intermediate Layer
For the coating of planar SiC membranes a drop of the MWCNTs solution was
placed on top and left it incubating for 15 minutes, as the surface is porous the
water was filtered through it and the CNTs remained on top. Afterwards the
SiC surface was washed with water 3 times before placing it in a beaker with
fresh water and shaking it in order to remove the excess MWCNTs. Then, the

Chapter 5
163
procedure was repeated a few times, alternating positively and negatively
charged CNTs. The sample was left to dry overnight at room temperature and
afterwards, annealed in an oven at 150ºC for half an hour in order to crosslink
the MWCNT layer. This crosslinking reaction creates amide bonds between the
amines of the PAH and the carboxylic groups present in the oxidised MWNTS
and will contribute to making it more stable.25 On the SiC flat surfaces
PDADMAC and PSS (1 mgml-1 0.5 M NaCl both solutions) were assembled by
alternately dipping the sample in the polyelectrolyte solutions. After every
assembly step the sample was rinsed 3 times with water.
For the assembly of the MWCNTs intermediate layer on top of the internal face
of a ceramic SiC tubular module, the module was first enclosed inside a
chamber specifically designed for this application and fixed with two o-rings at
its borders, see Fig. 5.1. This chamber has three exits: 1- an inlet, 2- an outlet,
and 3- a permeate exit from were only the liquid already filtered exits. The
solution is pumped along the circuit by a pump.
O-rings
Feeding solution
permeate
1 2
3
inlet outlet
Open circuit
collector
O-rings
Feeding solution
permeate
1 2
3
inlet outlet
Closed circuit

Hybrid nanofiltration membranes
164
Figure 5.1. Sketch of the closed and open circuit system built for the assembly of
the MWCNT reinforcing layer.
The assembly of each layer was done in two steps: a) first the corresponding
positive or negative MWCNT solution (100 ml at 250 µgml-1) was pumped
during 1 min in a closed circuit mode, afterwards the pump was stopped and
the coating solution was left for 15 min inside the tube. b) The feeding solution
was replaced with 400 ml of water and pumped during 15 minutes in a closed
circuit (recirculating), the circuit was opened and the 400 ml of the water was
collected from the exit, and finally another 400 ml was pumped in an open
circuit mode. This procedure was alternately repeated as many times as
number of layers were intended to be built. The monotube was removed from
the chamber, left drying overnight at room temperature and then annealed in
an oven at 150ºC for half an hour in order to crosslink the MWCNT layer as for
the planar surfaces. The permeability of the support at different pressures was
measured after each deposition to confirm the assembly of the charged
MWCNTs.
5.2.3 Polyelectrolyte Multilayer Coatings
SiC monotube membranes were coated with PDADMAC/PSS multilayer films
in a custom cross-flow filtration setup. Aqueous polyelectrolyte solutions of
PDADMAC and PSS were prepared with a polymer and NaCl concentrations of
1 mg ml-1 and 0.8 M respectively. The membranes were alternately coated with
PDADMAC and PSS by filling the inner SiC monotube volume with the

Chapter 5
165
polyelectrolyte solution, operating the filtration setup at a constant
transmembrane pressure of 2.0 bar for 10 min (first PDADMAC layer for 5 min)
without cross-flow, and subsequently rinsing with water for 3 min at a
transmembrane pressure of 0.1 bar and a cross-flow of 50 lh-1. The sequence
was continued until a desired number of layers were deposited on the
membrane.
5.2.4 Filtration Experiments
Pure water permeability (PWP) measurements and salt solution filtrations were
conducted in a custom cross-flow filtration setup. PWPs were calculated from
at least three pure water fluxes measured within a transmembrane pressure
range of 0.3 – 2.0 bar, at a 0.5 ms-1 cross-flow velocity and 20 °C. A 5 mM
MgSO4 salt solution and a mixed salt solution containing 5 mM of NaCl and 5
mM of MgCl2 were used to characterize membrane performance. Salt solution
filtrations were conducted at various permeate fluxes within a transmembrane
pressure range of 1.5 – 9.5 bar, and always at 0.83 ms-1 cross-flow velocity
(Reynolds ≈ 5000) and 20 °C. Feed, permeate and retentate samples were
collected for ion chromatography and conductivity measurements.
5.2.5 Ion Chromatography and Conductivity Measurements
Sodium and magnesium concentrations were analyzed from feed permeate and
retentate samples with an ion chromatography system. An 11 mM sulfuric acid
solution was used as the eluent. Conductivities were measured from feed,
permeate and retentate samples at 25 °C.

Hybrid nanofiltration membranes
166
5.2.6 Scanning Electron Microscopy
Scanning electron micrographs were obtained operating at 8kV acceleration
voltage. Before imaging, dry membrane samples were cut open and sputtered
with a thin layer of gold in an Edwards Scancoat Six sputter coater.
5.3 Results and Discussion.
The MWCNT assembly was first performed in SiC planar surfaces as explained
in materials and methods. In Fig. 5.2 a) we can observe the topology of the SiC
support. The surface has a grainy structure; grains are irregular in size and
between them pores can be recognized.
Figure 5.2. a) SEM image of the surface of a flat SiC membrane. b) SEM image of
SiC support after being covered with 10 layers of MWNCTs. c) SEM image of a
SiC support after being covered with MWCNTs and 10 layers of
PDADMAC/PSS 1 mgml-1 0.8 M NaCl.
The SEM image in Fig. 5.2 b) shows the SiC surface coated with 5 bilayers of
MWCNTs. The MWCNTs layer has been fabricated alternating layers of
a
b
c

Chapter 5
167
oxidised and PAH coated CNTs as explained in the experimental part. The
coating is continuous and dense; areas free of CNTs cannot be observed. The
characteristic fibrillar shape of the CNTs can be easily recognized on the surface
as well as pores smaller than those in the bare SiC surface. On top of the
MWCNT layer we deposited a multilayer of PDADMAC and PSS resulting in a
complete coating of the surface, Fig. 5.2 c). CNTs can be still recognized in
some areas but not on the whole surface. Most of the surfaces present the
grainy structure characteristic of PDADMAC/PSS films. We have chosen
PDADMAC/PSS films as these are more suitable for practical applications of
PEMs.26
The coating was then performed on the SiC tubular membranes as described in
the experimental section. Once the assembly was completed the tubes were cut
in the middle and the cross section was visualized by SEM, Fig. 5.3.
Figure 5.3. a) SEM micrographs from a cross section of the inner part of a SiC
monotube modified with (PDADMAC/PSS)5. b) Cross section of the inner part
of a SiC monotube coated with (MWCNTs-COOH-PAH/MWCNTs-COOH)4
reinforcing layer + (PDADMAC/PSS)5 PEM.
5.9 µm
SiC membrane
(MWCNTs-COOH-PAH/MWCNTs-COOH)4 + (PDADMAC/PSS)3
a
bMonotube

Hybrid nanofiltration membranes
168
The SiC support has a grainy structure with smaller grains in the inner surface
than in the outer surface. In Fig. 3a the cross section of a SiC membrane coated
with 5 bilayers of PDADMAC/PSS is observed. The presence of the PEM on
top of the membrane cannot be confirmed from the lateral images. The
MWCNTs assembly on top of the SiC support forms a thick layer of
approximately 6 micrometer as it can be visualized in Fig. 3b. The layer is
continuous on the SiC surface and as expected the CNTs are not penetrating in
the pores.
5.3.1 Evaluation of Membrane Performance, Water Permeability and
Rejection to MgSO4
The pure water permeability (PWP) and ion rejection were measured for the
SiC modules with the MWCNT coating and PEMs. In a first instance the PWP
and the rejection to MgSO4 were measured for the bare SiC without any
modification as control and the SiC membrane with a variable number of
(PDADMAC/PSS) bilayers.
As it can be seen in Table 5.1 the permeability of the SiC membrane decreases
significantly from 10.300 to 5.3 l m-2h-1bar-1 when a 5 bilayers PDADMAC/PSS
PEM are assembled on top. PWP remains almost constant with the number of
layers assembled; only a small decrease is observed with the addition of each
bilayer due to the increase in density and thickness of the PEM. Once the
MWCNT spacer is placed between the support and the PEM, the permeability
increases a 42 % with respect to the same PEM without MWCNTs. Such an

Chapter 5
169
increase in the flux represents a large improvement in the membrane
performance.
For the PDADMAC/PSS PEMs assembled on the SiC support without CNTs
the rejection to MgSO4 increases from 48.2 % to a 59.1 % with an increasing
number of bilayers forming the PEM, from 3 to 5. Most interesting the rejection
increases to 84.4 % for 3 bilayers of PDADMAC/PSS when these are assembled
on top of the MWCNT multilayer, a 75 % more efficient than the same number
of layers without CNTs and a 42 % more efficient than having 5 bilayers of
polyelectrolytes instead of 3.
Table 5.1. Pure water permeability and ion rejection for 5mM MgSO4. MgSO4
filtrations were operated at a cross-flow velocity of 0.83 ms-1 (Reynolds ≈ 5000)
and a permeate flux of 15 ± 2 lm-2h-1. All experiments were conducted at 20 °C.
CNT support PEM coating PWP, lm-2h-1bar-1 R (MgSO4), %
(MWCNT-COOH-PAH)
/(MWCNT-COOH)4 (PDADMAC/PSS)3 8.7 ± 0.2 84.4 ± 0.6
No (PDADMAC/PSS)3 6,1 ± 0.2 48.2 ± 0.5
No (PDADMAC/PSS)4 5.7 ± 0.2 56.1 ± 0.4
No (PDADMAC/PSS)5 5.3 ± 0.2 59.1 ± 0.4
No No 10300 ± 400 <1
5.3.2 Ion Rejection Dependence on Flux
Two different experiments were performed to study ion rejection. In a first
instance the effect of permeate flux on rejection of Mg2+ at a 5 mM MgSO4
solution was analyzed. The rejection to Mg2+ increases slightly while the
solution flux is increased through variations in the operation pressure, see Fig.

Hybrid nanofiltration membranes
170
5.4 a). In the case of the membrane without MWCNTs, even if the number of
bilayers of the PEM is bigger, the rejection to Mg2+ is lower than with
MWCNTs, and also we can see that at a flux of around 45 lm-2h-1 rejection
decreases.
Figure 5.4. a) Mg2+ rejection dependence on flux for a 5 mM MgSO4 solution. b)
Na+ and Mg2+ rejection dependence on flux for a mixed salt solution with 5 mM
of NaCl and 5 mM of MgCl2. All filtration experiments were conducted at a
cross-flow velocity of 0.83 ms-1 (Reynolds ≈ 5000) and at 20 °C. The membranes
analyzed are: (PDADMAC/PSS)5 and MWCNT+(PDADMAC/PSS)3.
5 10 15 20 25 30 35 40 45 50
0
10
20
30
40
50
60
70
80
90
100
MWCNT+(PDADMAC/PSS)3
(PDADMAC/PSS)5
Rej
ectio
n (%
)
Solution flux (L m-2 h
-1)
10 15 20 25 30 35 40
0
10
20
30
40
50
60
70
80
90
100
MWCNT+(PDADMAC/PSS)3 Mg
2+ rejection
MWCNT+(PDADMAC/PSS)3 Na
+ rejection
(PDADMAC/PSS)5 Mg
2+ rejection
(PDADMAC/PSS)5 Na
+ rejection
Rej
ectio
n (%
)
Solution flux (L m-2 h
-1)
a
b

Chapter 5
171
As can be seen in Fig. 5.4 b) there is a bigger rejection for divalent ions of Mg2+,
than for monovalent ions of Na+. There is only a slight change in the Mg2+
rejection for the PEMs on top of MWCNTs when the counter ion for Mg2+
changes from sulfate and chloride. Nevertheless when we look at the PEM
without MWCNTs the Mg2+ with Cl- as counter ions is significantly more
rejected than for the solution with sulfate. When we compare the rejection of
Mg2+ with sulfate as co-ion for membranes supported on MWCNTs and free of
them we observe that the rejection for the ones on MWCNTs is much larger.
Divalent sulfate (by electroneutrality magnesium in Fig. 5.4 a) is better retained
than monovalent chloride (sodium in Fig. 5.4 b). As the Fig. 5.4 a) and 4b show
the difference in monovalent (NaCl salt) and divalent ions (MgSO4 salt)
retention was significantly higher with MWCNTs supported PEM membrane.
The curves in Fig. 5.4 also reveal that after a certain flux the rejection for both
divalent and monovalent ions tend to decrease. However when the PEM is on
top of the MWCNT layer the rejection remains constant or increases with
increasing flux for the fluxes that we have applied in this work, up to 45 l m-2 h-
1. As we can observe in the curves for MgSO4 the rejection for the PEMs on
MWCNTs increases from 89 to 92 % approximately when going from a flux of
15 to 45 l m-2h-1. For the PEMs without the MWCNT and for fluxes between 10
and 25 lm-2h-1 rejection remains constant around a 65 % but at 45 lm-2h-1
decreases to less than 50 %. The effect is also clear for NaCl and MgCl2.

Hybrid nanofiltration membranes
172
From the Fig. 5.4 b) we can also observe that the rejection for Mg2+ is much
larger than for Na+. Though this is the case for PDADMAC/PSS with and
without the MWCNT support. The effect is more pronounced on the MWCNT
supported PEMs with a 56 % more rejection for the Mg+2 than the Na+ at 40 l m-
2 h-1, with a maximum difference at a low flux of around 14 l m-2 h-1 of 78%.
This difference in rejection is larger than the observed for the PEMs without the
MWCNT. At 40 l m-2 h-1 they show a difference in rejection of 26 % for Mg2+
and Na+.
Figure 5.5. a) Sketch of the internal surface of a SiC monotube, covered with a
PEM assembled Layer by Layer on top. b) Sketch of the internal part of a SiC
monotube, covered with a multilayer of MWCNT with a PEM on top. The
arrows represent the flux of permeating water.
In Fig. 5.5 we show two sketches with both assemblies of PEMs on top of the
supporting membrane with and without the MCNTs intermediate layer. In Fig.
5.5 a) we can observe the sketch of the PEM assembled on top of the SiC
support without the CNTs. In the sketch the PEM is covering the internal walls
of the pores reducing the pore size. The flux passing through the pore will be
also restricted to the solution going through the area of the PEMs that it is
SiC
MWCNT
PEM
SiC
a
PEM
b

Chapter 5
173
deposited on top of the pore. In Fig. 5.5 b) the sketch shows the MWCNTs
assembled on the porous support. On top of the MWCNTs multilayer a PEM
has been deposited. It can be appreciated that the PEM is separated from the
support by the MWCNTS multilayer, which act as a spacer. The flux going
through the pores comes from the volume between the PEMs and the MWCNTs
spacer acting as a funnel. In this situation the solution going through the pores
is collected from larger membrane areas with the subsequent increase in the
volume passing through the pore as compared with the situation of the PEM
assembled onto the pores without the CNTs layers.
Pure water permeability decreases after placing polyelectrolytes on top,
remaining almost constant independently of the number of layers assembled,
only a small decrease is observed with the addition of each bilayer due to the
increase in density and thickness of the PEM. After the MWCNT spacer is
placed between the support and the PEM, the permeability increases such an
increase in the flux represents a large improvement in the membrane
performance, confirming our assumption. A comparison with the PWP of
commercial nanofiltration membranes as NF270= 15.3 lm-2hr-1bar-1 and NF90=
7.2 lm-2hr-1bar-1 from Dow Chemicals (Midland, MI),27 measured in similar
conditions, shows that our MWCNTs+PEM SiC modified membranes give
values of flux slightly lower than the commercial ones but still much higher
than those of the PEMs without CNTs.
Rejection to MgSO4 increases while we increase the number of polyelectrolytes
assembled on top of the bare SiC support, until a maximum of around a 60 %

Hybrid nanofiltration membranes
174
for the maximum number of layers tested. Once we place the MWCNTs spacer
in between, rejection increases dramatically, reaching levels above 80 %.
We can conclude that there is a considerable improvement in terms of rejection
when the reinforcing layer is placed in between the SiC and the PEM.
Analysing the effect of permeate flux on rejection of Mg2+ at a 5 mM MgSO4
solution we observed as we previously said that rejection to Mg2+ increases
slightly while the solution flux is increased through variations in the operation
pressure. In this case there is a decoupling between ion flux and water flux,
water flux increases while ion flux can be electrically and/or sterically
hindered, resulting in a dilution effect and therefore in a lower ion
concentration in the permeate and then ion rejection might be higher. At the
same time due to this increase in the operation pressure there is a more
significant transport of ions to the surface of the membrane enhancing the
concentration polarization and reducing rejection. In our case the effect of
dilution is slightly higher than the effect on the concentration polarization
therefore the rejection increases.28 In the case of the membrane without
MWCNTs, even if the number of bilayers of the PEM is larger, the rejection to
Mg2+ is lower than with MWCNTs, and also it can be observed that at a flux of
around 45 l m-2 h-1 rejection decreases and the effect of the concentration
polarization is bigger than the effect of dilution that was the predominant at
lower fluxes.

Chapter 5
175
Nanofiltration membranes have mainly two mechanisms for separation: sieving
in the case of uncharged particles bigger than the membrane pore size and
electric repulsion due to Donnan and dielectric effects in the case of charged
particles or ions 29. The interaction of charged molecules and ions with the
functional groups present in the membrane is very important in determining
their transport through the membrane or their rejection. We observed that
there is a larger rejection for divalent ions of Mg2+, than for monovalent ions of
Na+. Divalent cations have more charge and therefore they show less passage
through the charged PEM than the monovalent one. This is understandable as
the divalent ions are more charged than monovalent resulting in a stronger
repulsion. There is only a slight change in the Mg2+ rejection for the PEMs on
top of MWCNTs when the counter ion for Mg2+ changes from sulfate and
chloride. Nevertheless when we look at the PEM without MWCNTs the Mg2+
with Cl- as counter ions is significantly more rejected than for the solution with
sulfate. This can probably be explained by a higher affinity of the Cl- ions for
the quaternary ammonium groups in PDADMAC.30 When we compare the
rejection of Mg2+ with sulfate as co-ion for membranes supported on MWCNTs
and free of them we observe that the rejection for the ones on MWCNTs is
much larger, most likely because of a more dense structure formed on the
MWCNTs with less defects than for the case of the PEM without the MWCNTs
support.
Since the PDADMAC/PSS membrane is negatively charged due to sulfonate
groups of the uppermost PSS layer. Therefore, it can be assumed that the

Hybrid nanofiltration membranes
176
charge of anions determines mostly the retention. Divalent sulfate is better
retained than monovalent chloride, retention was significantly higher with
MWCNTs supported PEM membrane. We can assume that the charge density
on the PEM layer is higher when MWCNT support was used than without
MWCNTs. As a result the retention decrease caused by higher diffusion, when
concentration polarization was higher at higher flux, was compensated for
higher electrostatic repulsion of MWCNT+PEM membranes. The higher
retention of MWCNT supported PEM membranes might also be caused by
denser membrane structure with fewer defects. Most likely the PEMs
supported on the MWCNTs display both a higher charge density and a denser
structure as layer coverage and density of functional groups are closely related
issues for PEMs.
It can be observed too that for the membrane without spacer after a certain flux
the rejection for both divalent and monovalent ions tend to decrease, while
when the PEM is on top of the MWCNT layer the rejection remains constant or
increases with increasing flux for the fluxes that we have applied in this work.
The reason for the different response to the increase in flux must be due to the
improved characteristics of the PEM supported on the MWCNT layers, with
fewer defects than the PEMs without the MWCNTs.
Rejection for Mg2+ is much larger than for Na+, in both cases with and without
the MWCNT support. The effect is more pronounced on the MWCNT
supported PEMs, the large difference in rejection for the PEMs on MWCNTs for
mono and divalent ions make them very appealing for ion separation.

Chapter 5
177
5.3.3 Comparison with other type of formulations
In order to create the MWCNT spacer not only the formulation explained before
was used. Different types of functionalitations were tested until a stable spacer
was created.
Amongst all the trials performed only four types of formulation reached the
prototyping step in which the assembly was done and tested in the SiC
monotubes. Between all of them only the formulation presented before was
stable enough and withstands all the tested performed and the results were
consistent with the repetitions. The rest three at some point of the tests flasks of
MWCNTs were released from the spacer and its performance dropped
dramatically. However some of them during their operative lifetime performed
even better than the selected one and therefore it is interesting to present these
experiments too.
Four formulations were assembled:
1- [(MWCNT-PSS-PAH)/(MWCNT-PSS-PAH-PMAA)]4
2- [(MWCNT-COOH-PAH)/(MWCNT-COOH)]4
3- (MWCNT-COOH-PAH)+[(MWCNT-COOH/Laponite-PAH)]4
4- [(MWCNT-PSS-PAH)/(MWCNT-PSS-PAH-PMAA)]3
In the case of 1 and 4 both are the same formulation but they differ in the
number of bilayers. In this case the MWCNTs were not previously oxidated as
we have explained previously; they were functionalized in a Layer by Layer
fashion by wrapping the polyelectrolytes around them. As last layer PAH was

Hybrid nanofiltration membranes
178
used as positive agent and poly(methacrylic acid) (PMAA) as negative one in
order to have amines and carboxylic groups available for the posterior
amidation by annealing.
Formulation 2 is the one explained during this chapter previously.
In formulation three a precursor layer of PAH adsorbed onto oxidated
MWCNTs was used. The same used in formulation 2. But afterwards this
component was changed for Laponite functionalized with PAH. Laponite was
dissolved 1mg ml-1 in water at neutral pH, afterwards NaCl was added until a
concentration of 0.5M was reached and finally PAH (Mw=15 Kg mol-1) for
having 1mg ml-1 of polyelectrolyte. After 1 hour the solution was rinsed 3 times
with water by centrifugation in cycles of 9000 rpm during 15 minutes.
The assembly onto the inner part of the SiC monotube was performed as it has
been explained before for formulation 2. In Fig. 5.6 SEM micrographs can be
observed with the difference thickness of spacer obtained for each formulation.
All of the formulations were annealed after the deposition. After the spacer a
deposition of 3 bilayers of (PDADMAC/PSS) was assembled on top.
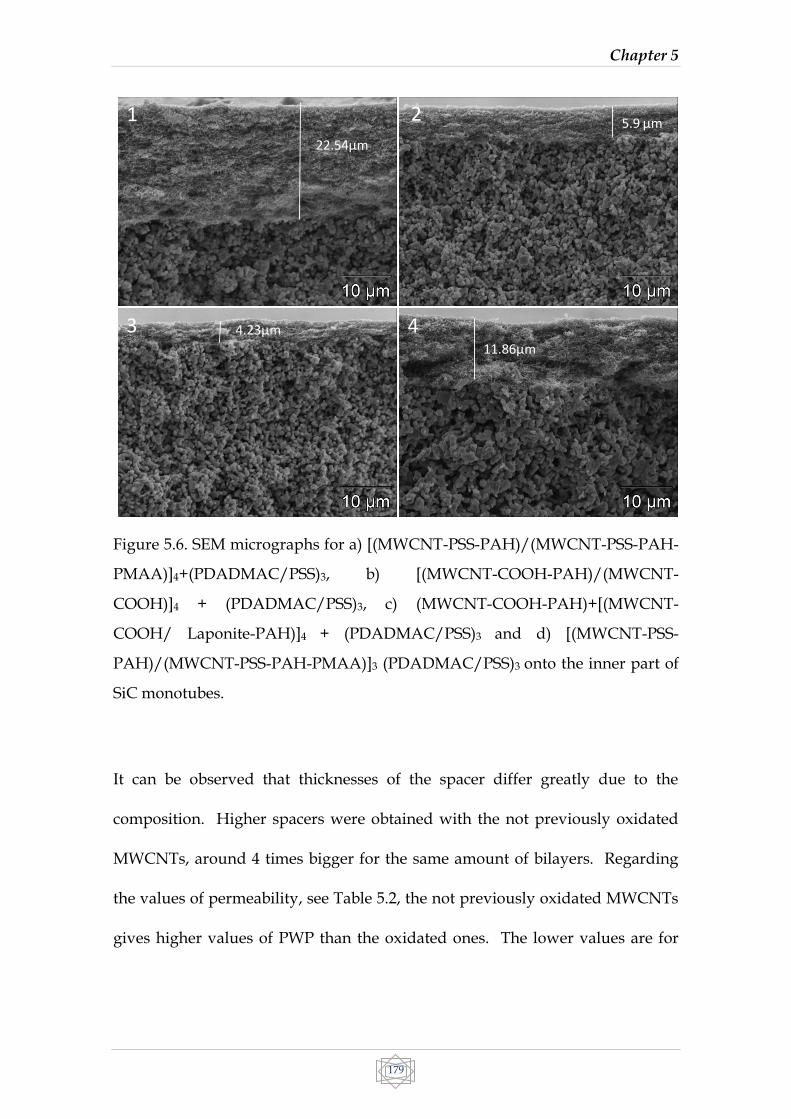
Chapter 5
179
Figure 5.6. SEM micrographs for a) [(MWCNT-PSS-PAH)/(MWCNT-PSS-PAH-
PMAA)]4+(PDADMAC/PSS)3, b) [(MWCNT-COOH-PAH)/(MWCNT-
COOH)]4 + (PDADMAC/PSS)3, c) (MWCNT-COOH-PAH)+[(MWCNT-
COOH/ Laponite-PAH)]4 + (PDADMAC/PSS)3 and d) [(MWCNT-PSS-
PAH)/(MWCNT-PSS-PAH-PMAA)]3 (PDADMAC/PSS)3 onto the inner part of
SiC monotubes.
It can be observed that thicknesses of the spacer differ greatly due to the
composition. Higher spacers were obtained with the not previously oxidated
MWCNTs, around 4 times bigger for the same amount of bilayers. Regarding
the values of permeability, see Table 5.2, the not previously oxidated MWCNTs
gives higher values of PWP than the oxidated ones. The lower values are for
43
1
22.54μm
4.23μm
11.86μm
5.9 µm2

Hybrid nanofiltration membranes
180
the ones with Laponite, due to the laminar shape of the Laponite sheets can
disturb the path of the water through the spacer reducing the permeability.
Table 5.2. Pure water permeability and ion rejection for 5 mM MgSO4. MgSO4
filtrations were operated at a cross-flow velocity of 0.83 ms-1 (Reynolds ≈ 5000)
and a permeate flux of 15 ± 2 lm-2h-1. All experiments were conducted at 20 °C.
CNT support PEM coating
PWP, l m-
2 h-1 bar-1
Rejection
MgSO4, %
1 [(MWCNT-PSS-PAH)/(MWCNT-PSS-PAH-PMAA)]4 (PDADMAC/PSS)3 10.1 ± 0.2 88.5 ± 0,4
2 [(MWCNT-COOH-PAH)/(MWCNT-COOH)]4 (PDADMAC/PSS)3 8.7 ± 0.2 84.4 ± 0.6
3 (MWCNT-COOH-PAH)+
[(MWCNT-COOH/ Laponite-PAH)]4 (PDADMAC/PSS)3 4.4 ± 0.2 86.6 ± 0. 4
4 [(MWCNT-PSS-PAH)/(MWCNT-PSS-PAH-PMAA)]3 (PDADMAC/PSS)3 14.2 ± 1,0 89.6 ± 0.5
N
o No (PDADMAC/PSS)3 6.1 ± 0.2 48.2 ± 0.5
N
o No (PDADMAC/PSS)4 5.7 ± 0.2 56.1 ± 0.4
N
o No (PDADMAC/PSS)5 5.3 ± 0.3 59.1 ± 0.4
N
o No No
10.300 ±
400 <1
Rejection values to MgSO4 are more or less in the same range for all four
formulations, higher rejections were obtained for the non oxidated ones. The
best performance regarding these values is for formulation 4 which is half
thicker than formulation 1 and it gives the higher PWP and rejection values of
all of them. In fact this values of PWP of 14.2 lm-2hr-1bar-1are as high as
commercial nanofiltration membranes as NF270= 15.3 lm-2hr-1bar-1 and higher
than NF90= 7.2 lm-2hr-1bar-1 from Dow Chemicals (Midland, MI), measured in
similar conditions.

Chapter 5
181
Figure 5.7. Mg2+ rejection dependence on flux for a 5 mM MgSO4 solution. All
filtration experiments were conducted at a cross-flow velocity of 0.83 ms-1
(Reynolds ≈ 5000) and at 20 °C.
Analyzing rejection dependence on flux to MgSO4 for all formulations it can be
seen that all four formulations gives performances much better than without
spacer. The higher rejection values are for formulation 4 giving a rejection of
94% at a flux of 46.8 lm-2h-1, see Fig. 5.7.
Regarding the difference in the rejection between divalent and monovalent
ions, as it was seen before for formulation 2 during the chapter, there is a higher
rejection for divalent ions than for monovalent ones in the four cases. In all
cases the bigger differences are for low fluxes; while we increase the flux even if
the rejection to divalent ions remains more or less constant in the case of
10 20 30 40 50 60 70
40
50
60
70
80
90R
eje
ctio
n (
%)
Solution flux (L m-2 h
-1)
no CNT
1
2
3
4

Hybrid nanofiltration membranes
182
monovalent ions it gets higher, and then the difference between rejections for
both type of ions decreases.
It can be seen also that for low fluxes we obtain negative values of rejection in
the case of NaCl, it can be due to some remnant NaCl in the PEM that it was
used for the assembly of the PEM. At these low values there can be some
release of this NaCl to the solution disturbing the data obtained, see Fig. 3.8.
Figure 5.8. Na+ and Mg2+ rejection dependence on flux for a mixed salt solution
with 5 mM of NaCl and 5 mM of MgCl2. All filtration experiments were
conducted at a cross-flow velocity of 0.83 ms-1 (Reynolds ≈ 5000) and at 20 °C.
Comparing the general outcome of the four formulations it seems that the best
performance is for the fourth formulation, anyway as we have already mention
this membrane started to show issues of instability after more than one use,
10 20 30 40 50 60 70
-20
0
20
40
60
80
100
Re
jectio
n (
%)
Solution flux (L m-2 h
-1)
No - Mg2+
No - Na+
1 - Mg2+
1 - Na+
2 - Mg2+
2 - Na+
3 - Mg2+
3 - Na+
4 - Mg2+
4 - Na+

Chapter 5
183
flakes of carbon nanotubes were released and values started dropping down.
Only the second formulation remained constant with the use and time.
5.4 Conclusions
A hybrid nanofiltration membrane has been fabricated based on the assembly
of a PDADMAC/PSS polyelectrolyte multilayer on top of a multilayer of
MWCNTs. The MWCNTs layers act as a spacer between the membrane
support and the polyelectrolyte multilayer. The spacer results on a dense
polyelectrolyte multilayer assembly that cover the pores present in the
MWCNT layer. The assembly of the PEMs on top the support without the
MWCNT layer fails to cover the pores present on the membrane substrate for
the same or larger number of layers assembled in the PEM as on top of the
MWCNTs. The spacing of the PEM from substrate has the additional
advantage of increasing the flux through the pores of the support as the volume
going through a pore is collected from a larger area of the PEM with the
MWCNTs acting as a funnel. The performance of the PEM supported on the
MWCNT is significantly better than the PEM without CNTs. A PEM of 3
bilayer PDADMAC/PSS on a MWCNT spacer showed a rejection for MgSO4
around 84 % while in the best of the case without MWCNT for a PEM of 5
bilayers a rejection of 59 % was observed. The PEMs on MWCNT show a large
rejection difference for mono and divalent ions making them very appealing for
separating ion mixtures.

Hybrid nanofiltration membranes
184
The assembly of the PEMs on top of the MWCNTs as intermediate layer results
in the formation of denser PEM membrane with a high charge density as
needed for the divalent salt rejection and for a high stability with increasing
flux, indeed with only 3 polyelectrolyte bilayers a significantly higher
performance is achieved than with 5 bilayers on a SiC membrane without a
MWCNT support.
A comparison with other type of formulations was done, the only formulation
that remained stable and unaltered during the whole process was [(MWCNT-
COOH-PAH)/(MWCNT-COOH)]4 + (PDADMAC/PSS)3, the rest of
formulations were not suitable for their use due to instability issues.
The work presented in this chapter resulted in the following publication:
Irigoyen, J.; Laakso, T.; Politakos, N.; Dahne, L.; Pihlajamäki, A.; Mänttäri, M.;
Moya, S. E. Macromol. Chem. Phys. 2016, 217(6), 804-811.
I would like to acknowledge Timo Laakso and Arto Pihlajamäki for the
evaluation of the membrane performance regarding permeability and ion
rejection measurements.
5.5 References
(1) Geise, G. M.; Lee, H.-S.; Miller, D. J.; Freeman, B. D.; McGrath, J. E.; Paul,
D. R. J. Polym. Sci. Part B Polym. Phys. 2010, 48 (15), 1685–1718.
(2) Ali, M.; Yameen, B.; Cervera, J.; Ramírez, P.; Neumann, R.; Ensinger, W.;
Knoll, W.; Azzaroni, O. J. Am. Chem. Soc. 2010, 132 (24), 8338–8348.

Chapter 5
185
(3) Stanton, B. W.; Harris, J. J.; Miller, M. D.; Bruening, M. L. Langmuir 2003,
19 (17), 7038–7042.
(4) Jin, W.; Toutianoush, A.; Tieke, B. Langmuir 2003, 19 (7), 2550–2553.
(5) Shan, W.; Bacchin, P.; Aimar, P.; Bruening, M. L.; Tarabara, V. V. J. Memb.
Sci. 2010, 349 (1-2), 268–278.
(6) Miller, M. D.; Bruening, M. L. Langmuir 2004, 20 (26), 11545–11551.
(7) Ouyang, L.; Malaisamy, R.; Bruening, M. L. J. Memb. Sci. 2008, 310 (1-2),
76–84.
(8) Tripathi, B. P.; Dubey, N. C.; Stamm, M. J. Hazard. Mater. 2013, 252-253,
401–412.
(9) Decher, G. Science (80-. ). 1997, 277 (5330), 1232–1237.
(10) Lavalle, P.; Gergely, C.; Cuisinier, F. J. G.; Decher, G.; Schaaf, P.; Voegel,
J. C.; Picart, C. Macromolecules 2002, 35 (11), 4458–4465.
(11) Irigoyen, J.; Han, L.; Llarena, I.; Mao, Z.; Gao, C.; Moya, S. E. Macromol.
Rapid Commun. 2012, 33 (22), 1964–1969.
(12) Decher, G.; Hong, J. D.; Schmitt, J. Thin Solid Films 1992, 210–211 (0), 831–
835.
(13) Dubas, S. T.; Schlenoff, J. B. Macromolecules 1999, 32 (24), 8153–8160.
(14) Arys, X.; Laschewsky, A.; Jonas, A. M. Macromolecules 2001, 34 (10), 3318–
3330.
(15) Alonso, T.; Irigoyen, J.; Iturri, J. J.; Larena, I. L.; Moya, S. E. Soft Matter
2013, 9 (6), 1920–1928.

Hybrid nanofiltration membranes
186
(16) Ramos, J.; Stahl, S.; Richter, R.; Moya, S. Macromolecules 2010, 43 (21),
9063–9070.
(17) Deng, H. Y.; Xu, Y. Y.; Zhu, B. K.; Wei, X. Z.; Liu, F.; Cui, Z. Y. J. Memb.
Sci. 2008, 323 (1), 125–133.
(18) Cheng, C.; Yaroshchuk, A.; Bruening, M. L. Langmuir 2013, 29 (6), 1885–
1892.
(19) Armstrong, J. A.; Bernal, E. E. L.; Yaroshchuk, A.; Bruening, M. L.
Langmuir 2013, 29 (32), 10287–10296.
(20) Bruening, M. In Multilayer Thin Films; Wiley-VCH Verlag GmbH & Co.
KGaA, 2002; pp 487–510.
(21) Joseph, N.; Ahmadiannamini, P.; Hoogenboom, R.; Vankelecom, I. Polym.
Chem. 2014, 5 (6), 1817–1831.
(22) Batys, P.; Michna, A.; Adamczyk, Z.; Jamro, K. J. Colloid Interface Sci.
2014, 435, 182–190.
(23) Raoufi, M.; Tranchida, D.; Schönherr, H. Langmuir 2012, 28 (26), 10091–
10096.
(24) Roy, C. J.; Dupont-Gillain, C.; Demoustier-Champagne, S.; Jonas, a. M.;
Landoulsi, J. Langmuir 2010, 26 (5), 3350–3355.
(25) Lee, S. W.; Kim, B.-S.; Chen, S.; Shao-Horn, Y.; Hammond, P. T. J. Am.
Chem. Soc. 2009, 131 (2), 671–679.
(26) Gregurec, D.; Olszyna, M.; Politakos, N.; Yate, L.; Dahne, L.; Moya, S. E.
Colloid Polym. Sci. 2014, 293 (2), 381–388.

Chapter 5
187
(27) Sanyal, O.; Sommerfeld, A. N.; Lee, I. Sep. Purif. Technol. 2015, 145, 113–
119.
(28) Fang, J.; Deng, B. J. Memb. Sci. 2014, 453, 42–51.
(29) Pérez-González, A.; Ibáñez, R.; Gómez, P.; Urtiaga, a. M.; Ortiz, I.;
Irabien, J. a. J. Memb. Sci. 2015, 473, 16–27.
(30) Azzaroni, O.; Moya, S.; Farhan, T.; Brown, A. A.; Huck, W. T. S.
Macromolecules 2005, 38 (24), 10192–10199.

Hybrid nanofiltration membranes
188

189
Chapter 6
Hybrid Graphene
Oxide/Polyelectrolyte Capsules on
Erythrocite Cell Templates.
6.1 Introduction
Graphene is undoubtedly one of the most exiting materials generated in the last
decade however there is a significant drawback for the practical application of
graphene. Most studies of graphene have been performed on graphite oxide or
its exfoliated form, GO, because it is difficult to work with layered graphene in
wet chemical applications due to dispersability issues and its tendency to form
multi-layered agglomerates.1–3 Because of these difficulties, these derivatives of
graphene have the potential to be reduced to what is called a reduced form of
graphene oxide, rGO, which can lead to materials with properties more like G
than GO.4–7
The use of GO sheets in the formation of hierarchical structures and assemblies
is a subject of current interest, and if done by procedures involving wet
chemical techniques, offers much potential for the development of advanced
and composite layered materials.
The assembly of GO in thin films on the basis of its surface charge can be
accomplished using the LbL technique. Although the technique was originally
developed for the alternating assembly of PEs of opposite charge, LbL can be
and has been extended to include particles, 2D layered materials,

Hybrid GO/PE capsules
190
nanostructures, lipid vesicles, etc., which provide charged surfaces, or, which
can have complementary interactions with another material that can lead to a
subsequent or alternating assembly.8 There are examples in literature of the
assembly of GO with polycations using the LbL technique as a promising tool
for the incorporation of GO into nanoscale organized thin films and the
subsequent electrochemical reduction of the GO to rGO.9,10
Using the LbL technique, we explored the assembly of exfoliated GO into 3D
structures and developed micron-sized capsules on the basis of GO and
polyelectrolytes using chicken erythrocyte cells as templates. Template cells
have been used in the past as capsule templates on the basis of a simple
protocol, which includes the oxidation of the cell components to leave a thin
polymer film capsule that mimics the dimensions and topological features of
the cell template.11–13 We show that by incorporating GO within the LbL
assembly on top of the erythrocytes, 3D closed films containing walls of PE/GO
and empty volume can be produced.
Capsules based on GO have potential applications in drug delivery, especially
for topical applications, as the LbL capsules provide low degradability and high
stability through the GO. The use of GO in the fabrication of capsules for drug
delivery was reported by Hong et al. and by Kurapati et al., the last one with a
focus on drug delivery.14,15 The authors, however, use a different protocol and
templates for their fabrication. In the present work, we produce continuous GO
capsules with the shape of cells and show the presence and location of the GO
by raman confocal microscopy and TEM. Another potential application of these

Chapter 6
191
capsules is for the production of dense PE/GO films with a high concentration
of GO, which was achievable in the present study by employing a high
concentration of exfoliated GO during the layer by layer assembly. This is due
to the coating protocol employed in which the cells are suspended in a GO
solution and then centrifuged. Under these conditions, a high concentration of
GO is achieved on the cell surface leading to a continuous coating.
Once dried, the capsules collapse by losing internal volume and form planar
films with nanoscale thicknesses. Such films could be used to build additional
hierarchical structures or for integration into devices; moreover, by the
judicious choice of reagents, the GO may be further reduced to form rGO to
alter particularly the electronic, mechanical and optical properties of the films.
6.2 Materials and Methods
PAH [Mw=15 kgmol-1], PSS [Mw=70 kgmol-1], sodium hypochlorite with active
chlorine 13%, phosphate buffered saline 10x (PBS), glutaraldehyde solution
grade II 25 % in water, Hank´s balanced salt solution 10x, sodium chloride,
graphite powder (< 45 μm, ≥ 99.99% trace metals basis), Lymphocytes isolation
solution (Ficoll) and full blood chicken collected in Alsever's anticoagulant
solution.
6.2.1 Erythrocytes
Erythrocytes were separated from the chicken blood and the rest of the plasma
components by centrifugation. Chicken blood conserved in Alsever´s solution
was diluted with (Ca, Mg) Hank´s solution and carefully poured onto a Ficoll

Hybrid GO/PE capsules
192
solution to avoid mixing. Afterwards the resulting solution was centrifuged at
800 G speed during 30 minutes at 4 ºC depositing the Erythrocytes at the
bottom and the rest of the plasma in different phases above them. Only the
Erythrocytes were obtained and cleaned twice with Hank´s solution by
centrifugation under the same conditions as before. Cells were then fixed
during 1 hour at 4 ºC with glutaraldehyde at a concentration of 2.5 % in filtered
PBS buffer. After fixation, they were centrifuged and washed in 0.9 % NaCl
several times at 10 ºC and kept refrigerated.
6.2.2 Graphene Oxide
GO was prepared by strong acid oxidation of graphite using the Hummer’s
method as modified in where the dispersion was water washed to neutral
pH.16,17 Following this, we washed with dilute HCl followed again by water
washes to neutral pH. The graphene oxide was exfoliated via ultra-sonication
and microwave irradiation. FT-IR spectra were taken with a Nexus 470
Spectrometer over 4000-400 cm-1 using multiple scans and 4 cm-1 resolution in
transmission mode.
6.2.3 Layer by Layer Assembly
The LbL assembly of GO and polyelectrolytes was performed on the fixed
erythrocytes. Previous to the GO assembly, two bilayers of PSS/PAH were
assembled. The polyelectrolytes were assembled at a concentration of 1 mgml-1
in 0.5 M NaCl. Two washings were performed with water between each layer
assembly by centrifugation (67.08 G during 2 min). The first assembled layer on
top of the cells was always PSS since it was already shown that it assemblies

Chapter 6
193
better using a polyanion rather than a polycation on the erythrocytes, despite
the negative charge of the cells.18 After the fourth layer was assembled, GO is
deposited in a concentration of 0.1 or 0.2 mgml-1 in water (pH 10). The
assembly of GO is performed without NaCl as the salt would screen the charges
of the GO and lead to aggregation. The incubation time for polyelectrolytes and
GO was always two minutes. After GO deposition, the cells were also washed
in water by centrifugation. GO was assembled alternating with PAH or with
three polyelectrolyte layers; PAH/PSS/PAH, until a total number of 11 layers
was achieved in both cases. Also, another sample with just 9 layers of PEs,
without GO, was assembled as a control, following the same procedure
described above.
6.2.4 Capsule Fabrication
Once the GO/polyelectrolyte multilayer was assembled on top of the cells, they
were exposed to aqueous 1 % NaOCl. The oxidizing solution degrades the cells
by breaking their protein constituents through oxidation. After NaOCl
treatment, samples were washed first in NaCl and then in water for several
cycles to remove the products of oxidation.
6.2.5 Transmission Electron Microscopy
An aliquot of 5µl of each sample was deposited on grids of carbon film 400
Mesh Cu, (50/bx) and left to evaporate. The grid was previously stained with
uranyl acetate. The images were acquired with a CCD camera of samples
prepared from water dispersions cast on lacey carbon grids.

Hybrid GO/PE capsules
194
6.2.6 X-Ray Difraction
XRD data for GO was obtained operating at 35 KV and 25 mA and Cu Kα
radiation.
6.2.7 Raman Spectroscopy and Confocal Raman Microscopy
Raman analysis was performed with a 100x objective, a 532 nm laser excitation
and 1800 mm-1 grating. The system was calibrated to the spectral line of
crystalline silicon at 520.7 cm-1. A drop of a diluted solution containing the
capsules was placed onto a silicon wafer and left evaporating overnight.
6.2.8 Atomic Force Microscopy
The samples were imaged in contact mode in air, using a TESP-V2 silicon probe
with a k= 42 Nm-1. A drop of a diluted solution with the capsules was placed
on a glass substrate with a thin layer of Au deposited on top. The sample was
left evaporating and afterwards imaged.
6.3 Results and Discussion
GO was prepared by the strong acid oxidation of powdered graphite by a
modified Hummer’s method; characterization data are shown in Fig. 6.1.16,17
Multiple TEM images formed from exfoliated GO in water and dried on lacey
carbon grids show micron size, few-layer GO sheets with some gentle folds and
ripples (Fig. 6.1a and b). The SAED inset in b shows diffraction spots indicative
of hexagonal patterns.19 Raman spectroscopy (Fig. 6.1c) shows the expected
prominent peaks for GO at 1349 and 1601 cm-1, with a D/G ratio of 0.8. The D
resonance corresponds to the vibration of sp2 carbon while G corresponds to sp3

Chapter 6
195
carbon and defects associated with vacancies and grain boundaries.20 The
peaks at higher wavenumbers are also characteristic of graphene oxide. XRD
results Fig. 1d indicate the absence of graphite and show the prominent (002)
peak at 12.0 degrees 2θ, indicating an inter-planar GO sheet distance of 0.737
nm.21 Prominent fourier transform infrared (FT-IR) bands for GO were
observed at 3415, 1723, 1623, 1394 and 1050 cm-1 as reported, for example, in.22
Figure 6.1. GO data; a) and b) TEM images of graphene oxide on lacey carbon,
inset: SAED showing diffraction spots of hexagonal patterns; c) Raman
1000 1500 2000 2500 3000
0
2000
4000
6000
8000
1601
1349
Raman Shift (cm-1)
Inte
nsity (
a.u
.)
D G
a b
c d
5 10 15 20 25 30
0
20
40
60
80
100
120
2 (degree)
Inte
nsity (
u.a
.)
12.0

Hybrid GO/PE capsules
196
spectrum with 532 nm excitation d) XRD pattern showing (002) with d= 0.737
nm.
A scheme of the Layer by Layer assembly applied on the erythrocytes for the
deposition of GO and polymers, as well as for the subsequent NaOCl oxidation
and capsule generation, is represented in Fig. 6.2. In the first step, the red blood
cells are crosslinked with glutaraldehyde. The crosslinking is necessary to
insure that the polyelectrolytes will not disrupt the erythrocyte membrane.
Erythrocytes were chosen because of their simple structure that lacks a nucleus,
which makes the degradation of the whole cell content with NaOCl solution
easier. Before the coating with GO, four layers of PSS/PAH were assembled on
top of the cell. Despite the erythrocytes have a slightly negative charged
surface the first assembled layer was PSS, which is also negative. We have
observed earlier that the PSS assembles better as first layer on the cells causing
significantly less aggregation of the cells.10 The coating of the cells with an
initial film of PSS/PAH is done to ensure a homogenously charged surface
prior to the GO deposition. The assembly of the polyelectrolytes in the first
layers and between the GO was done in 0.5 M NaCl as in these salt conditions
the polymers assemble in a denser and compact structure, due to the optimal
coiled conformation of the PEs at this ionic strength.

Chapter 6
197
Figure 6.2. Schematic illustrations of a) the glutaraldehyde fixed red blood
cells, b) the fixed erythrocytes coated with 4 layers of PSS/PAH, c) the fixed
cells in (b) coated with additional GO/polyelectrolyte layers and d) the hybrid
GO/polyelectrolyte capsule after NaOCl oxidation of the cell. (Illustration
courtesy of Eleftheria Diamanti).
The assembly of exfoliated GO was done in water at pH 10 to avoid the
screening of the charges on the GO. If present, screening the GO charges could
lead to a stronger interaction between GO sheets in solution leading to
aggregation. Charge screening would also eventually reduce the electrostatic
interaction between the GO and the polyelectrolyte on the cell, which would be
unfavourable for assembly. Between each GO deposition, we deposited either
one layer of PAH or three layers of PAH/PSS/PAH. Since the assembly of one
layer of PAH between the GO layers may not be sufficient to lead to a complete

Hybrid GO/PE capsules
198
coating of the surface and full recharging, we additionally prepared capsules
assembling three polyelectrolyte layers in between the GO layers. The addition
of three polyelectrolyte layers on top of the GO layer makes the procedure more
time consuming but we observe a major improvement in the stability of the
coated cell, thus reducing aggregation.
The removal of the cell interior by NaOCl is based on the oxidation of the cell
content. The cell interior is mainly formed by proteins, which are oxidized
defragmented in presence of NaOCl and are easily eliminated during
centrifugation and washing cycles with NaCl and water. Oxidation also affects
the PAH within the layers but a thin polymer film remains as was shown
previously.23 The possible oxidation of the GO with NaOCl would increase the
percentage of negative charge on the GO surface.
The morphology and structural characteristics of the capsules were first studied
by TEM which also provided proof of the core removal. Fig. 3a shows an image
of the capsules prepared as a control, which do not contain GO. They clearly
retain the shape of the erythrocytes used as templates. The capsules contain
only water and collapse in the dry state to ellipsoid shaped films. The drying
process is responsible for the appearance of edges on the capsule surface.

Chapter 6
199
Figure 6.3. TEM micrographs of a) sample 1: (PSS/PAH)4.50.5M, b) sample 2:
(PSS/PAH)20.5M + [GO/(PAH/PSS/PAH)0.5M /GO] + (PSS/PAH)0.5M, c) sample
3 (PSS/PAH)20.5M + [GO/PAH]2.5 + (PSS/PAH)0.5M using a concentration of
0.1 mg/ml-1 of GO during the assembly.
In Fig. 6.3b and c we observe two examples of capsules fabricated with GO at a
0.1 mgml-1 concentration with 1 PAH layer and three PAH/PSS/PAH layers in
between the GO. As for the polyelectrolyte capsules, the GO capsules also
retain the shape and size of the cells used as templates. The GO capsules are
also empty as they are in a collapse state after drying. On the capsule wall we
can recognize the presence of a structure of patches, with dimensions between a
few hundred of nanometers and 1 micron. GO is recognized in the structure
but embedded within the polyelectrolyte materials. The patches have the
characteristic µm range size of the GO sheets. GO is present on some random
spots in the capsule, the rest of the capsule structure is very similar to the
control capsules. The patches have the characteristic µm range size of the GO
sheets.
5µm 5µm
b c
5µm
a

Hybrid GO/PE capsules
200
We decided to increase the concentration of GO to 0.2 mgml-1 in order to
increase the GO present on the coating. For this GO concentration TEM
imaging reveals that indeed the GO coating has become visible all over the
surface of the capsules as can be appreciated in Fig. 6.4.
Figure 6.4. TEM micrographs of a) sample 2: (PSS/PAH)20.5M +
[GO/(PAH/PSS/PAH)0.5M/GO] + (PSS/PAH)0.5M, b) sample 3: (PSS/PAH)20.5M
+ [GO/PAH]2.5 + (PSS/PAH)0.5M, c-d) magnification of samples 1, 2
respectively. GO concentration was 0.2 mgml-1.
In Fig. 6.4 a) and b) the capsules are prepared as in Fig. 6.3 a) and b) but with a
GO concentration of 0.2 mgml-1 instead of 1 mgml-1. Fig. 6.4 c) and d) are
magnifications of a selected area from the corresponding capsules represented

Chapter 6
201
in Fig. 6.4 a and b, respectively. The GO sheets can be recognized all over the
surface. Presumably, there is more GO deposited in the areas that show more
contrast. The presence of these darker areas could imply that there may be GO
stacking on top of previously assembled GO but still separated by PEs. The
TEM images also confirm that by increasing the GO concentration, there is a
complete coverage of the capsules with GO, which is not observed at the 1 mg
ml-1 concentration. The TEM images also proves the formation of a complete
and continuous coating of the capsule surface with GO with only three layers of
GO being assembled, which, interestingly, is not obtained for the same number
of layers on a planar surface. The use of a layer of PAH or three polyelectrolyte
layers between the GO assemblies does not seem to affect the integrity of the
capsules. Accordingly, we proceeded with the assembly with just one
intermediate polyelectrolyte layer, which results in a reduced number of steps
during the assembly for ease of fabrication.
Although the GO sheets can be recognized by their characteristic shape, we
performed confocal Raman microscopy imaging to provide additional proof
that the patches on the capsule wall correspond to GO. A representative scan
on one capsule is shown in Fig. 6.5 a.

Hybrid GO/PE capsules
202
Figure 6.5. Raman of the GO-capsules. a) Raman spectra of GO sheets, G band
located at 1598 cm-1 and D band at 1353 cm-1. b) Image of the sample 2:
(PSS/PAH)20.5M + [GO/(PAH/PSS/PAH)0.5M /GO] + (PSS/PAH)0.5M capsules
onto Si wafer with the selected area to be analysed. c) Mapping by intensity of
the G band at 1598 cm-1 of the area selected in b. d) Image of sample 3
(PSS/PAH)20.5M + [GO/PAH]2.5 + (PSS/PAH)0.5M capsules onto Si wafer with
the selected area to be analysed. e) Mapping by intensity of the G band at 1598
cm-1 of the area selected in d.

Chapter 6
203
The surface of the capsule was scanned point by point. At each point, the
Raman spectra revealed the presence of characteristic and strong bands at 1353
and 1598 cm-1, which are typical for the GO and graphene structures and which
cannot be detected in the capsules prepared solely with polyelectrolytes. The
peaks in the Raman spectra of the capsules correspond to the G and D bands
observed in the pristine GO (vide supra), with the typical shift in the G band to
higher frequencies for GO with respect to graphite.20
In order to determine the thickness of the capsule walls we performed AFM
imaging of the capsules in the collapsed state. From the AFM images, see in
Fig. 6 a, an estimated maximal thickness of about 30 nm could be determined
for the capsules, implying a thickness in the order of 10-19 nm for the walls of
the capsule in the dry state. These values are obtained assuming that the
thickness of the collapsed capsule is twice the thickness of the capsule wall
since the capsule loose internal volume when drying. These values are taking
from the maximal and minimal thickness measured for the capsule. AFM
imaging also confirmed the stability of the capsules, which retain their shape
and integrity after collapsing in air, Fig. 6.6 b.

Hybrid GO/PE capsules
204
Figure 6.6. Atomic force microscope images of dried hybrid PE/GO capsules.
a) Height image of a 50 x 50 µm image, with a profile corresponding to the line
drawn in the image. b) Deflection image of the same area analysed in a).
6.4 Conclusions
We have shown that 3D micron sized objects in the form of capsules can be
fabricated on the basis of the LbL assembly of GO and polyelectrolytes on top of
fixed erythrocyte cells as templates. TEM imaging revealed a surface structure
composed of GO sheets when the GO assembly was performed with a high GO
concentration. The presence of GO was confirmed by Raman spectro-
microscopy that revealed the presence of the GO in the capsule structure. AFM
revealed that the capsule walls are thin films with a thickness of ~ 15 nm. Our
result shows an alternative method for the fabrication of capsules entailing GO
in a dense arrangement that could eventually have applications in drug
delivery and optoelectronics by developing hybrid thin polymer films
containing graphene oxide or its reduced form rGO.
35
nm
28
nm
a b

Chapter 6
205
The work presented in this chapter resulted in the following publication:
Irigoyen, J.; Politakos, N.; Diamanti, E.; Rojas, E.; Marradi, M.; Ledezma, R.;
Arizmendi, L.; Rodríguez, J. A.; Ziolo, R. F.; Moya, S. E. Beilstein J. Nanotechnol.
2015, 6, 2310–2318.
6.5 References
(1) Tasis, D.; Papagelis, K.; Spiliopoulos, P.; Galiotis, C. Mater. Lett. 2013, 94,
47–50.
(2) Nicolosi, V.; Chhowalla, M.; Kanatzidis, M. G.; Strano, M. S.; Coleman, J.
N. Science (80-. ). 2013, 340 (6139), 1226419.
(3) Hernandez, Y.; Lotya, M.; Rickard, D.; Bergin, S. D.; Coleman, J. N.
Langmuir 2010, 26 (5), 3208–3213.
(4) Dreyer, D. R.; Park, S.; Bielawski, C. W.; Ruoff, R. S. Chem. Soc. Rev. 2010,
39 (1), 228–240.
(5) Si, Y.; Samulski, E. T. Nano Lett. 2008, 8 (6), 1679–1682.
(6) Hassouna, F.; Kashyap, S.; Laachachi, a.; Ball, V.; Chapron, D.; Toniazzo,
V.; Ruch, D. J. Colloid Interface Sci. 2012, 377 (1), 489–496.
(7) Gao, X.; Jang, J.; Nagase, S. J. Phys. Chem. C 2010, 114 (2), 832–842.
(8) Decher, G. Science (80-. ). 1997, 277 (5330), 1232–1237.
(9) Yang, M.; Hou, Y.; Kotov, N. a. Nano Today 2012, 7 (5), 430–447.
(10) Kotov, N. A.; Dekany, I.; Fendler, J. H. Adv. Mater. 1996, 8 (8), 637–641.

Hybrid GO/PE capsules
206
(11) Donath, E.; Moya, S.; Neu, B.; Sukhorukov, G. B.; Georgieva, R.; Voigt,
A.; Baumler, H.; Kiesewetter, H.; Mohwald, H. Chemistry 2002, 8 (23),
5481–5485.
(12) Moya, S. E.; Georgieva, R.; Bäumler, H.; Richter, W.; Donath, E. Med. Biol.
Eng. Comput. 2003, 41 (4), 504–508.
(13) Georgieva, R.; Moya, S.; Hin, M.; Mitlöhner, R.; Donath, E.; Kiesewetter,
H.; Möhwald, H.; Bäumler, H. Biomacromolecules 2002, 3 (3), 517–524.
(14) Hong, J.; Char, K.; Kim, B.-S. J. Phys. Chem. Lett. 2010, 1 (24), 3442–3445.
(15) Kurapati, R.; Raichur, A. M. Chem. Commun. 2012, 48 (48), 6013.
(16) Hummers, W. S.; Offeman, R. E. J. Am. Chem. Soc. 1958, 80 (6), 1339.
(17) Kovtyukhova, N. I.; Ollivier, P. J.; Martin, B. R.; Mallouk, T. E.; Chizhik,
S. A.; Buzaneva, E. V; Gorchinskiy, A. D. Chem. Mater. 1999, 11 (3), 771–
778.
(18) Gao, C.; Leporatti, S.; Moya, S.; Donath, E.; Möhwald, H. Chem. – A Eur. J.
2003, 9 (4), 915–920.
(19) Kim, T.; Chang Kang, H.; Thanh Tung, T.; Don Lee, J.; Kim, H.; Seok
Yang, W.; Gyu Yoon, H.; Suh, K. S. RSC Adv. 2012, 2 (23), 8808–8812.
(20) Kudin, K. N.; Ozbas, B.; Schniepp, H. C.; Prud’homme, R. K.; Aksay, I.
A.; Car, R. Nano Lett. 2008, 8 (1), 36–41.
(21) Jeong, H.-K.; Lee, Y. P.; Lahaye, R. J. W. E.; Park, M.-H.; An, K. H.; Kim, I.
J.; Yang, C.-W.; Park, C. Y.; Ruoff, R. S.; Lee, Y. H. J. Am. Chem. Soc. 2008,
130 (4), 1362–1366.

Chapter 6
207
(22) Lee, D. W.; De Los Santos V., L.; Seo, J. W.; Felix, L. L.; Bustamante D., A.;
Cole, J. M.; Barnes, C. H. W. J. Phys. Chem. B 2010, 114 (17), 5723–5728.
(23) Moya, S.; Dähne, L.; Voigt, A.; Leporatti, S.; Donath, E.; Möhwald, H.
Colloids Surfaces A Physicochem. Eng. Asp. 2001, 183-185 (0), 27–40.

Hybrid GO/PE capsules
208

209
Conclusions
The main goal of this thesis is the study of multilayered assembled structures of
polyelectrolytes solely or combined with carbon nanomaterials in order to use
them for specific applications such as nanofiltration membranes and smart
surfaces. Physico-chemical studies of PEM stability in different media, the
assembly of the multilayers in extreme ionic strength conditions and study of
different growth regimes by choosing different pairs of polycations and
polyanions have been additionally performed.
Combined polyelectrolyte and carbon nanomaterial hybrid materials have been
also created. Carbon nanotubes have been used to fabricate an intermediate
layer acting as a spacer between commercial porous supports and PEMs for
applications in nanofiltration. A novel approach to combine polyelectrolytes
with graphene oxide producing capsules using erythrocytes as templates with a
tuneable content in carbon has also been performed.
MULTILAYERED POLYELECTROLYTE MEMBRANES
In chapter 2, the differences in the assembly between two different polycations,
PDADMAC showing a supralinear growth and PVBTMAC which displays a
linear growth have been discussed. The assembly of PVBTMAC/PSS creates
denser and less hydrated PEMs than the PDADMAC/PSS assembly.
PBVTMAC/PSS PEMs are also more hydrophilic and they act as better
insulators. Their permeability seems not to vary with the number of layers after

Conclusions
210
a certain number of layers have been assembled and their insulating behaviour
increases in a regular fashion with the number of layers assembled. The
PDADMAC/PSS PEMs on the other hand grow in a supralinear fashion,
creating sponge-like multilayers especially when more than 11 layers are
assembled. The nature of these multilayers is more hydrophobic than those of
PVBTMAC/PSS. PDADMAC/PSS systems also act as insulators and are more
efficient with increasing numbers of layers. A particular phenomenon has been
observed during the electrochemical experiments performed, when more than
11 layers have been assembled, there is complex formation between the
quaternary amines of the PDADMAC and the ferro species used as an
electrochemical probe, the multilayer behaves as an electron regulating
interface affecting how charge transfer along the membrane is produced and its
capacity as an insulator. Even if the multilayer is thicker than the
PVBTMAC/PSS one, the current reduction is more effective in the latter.
In chapter 3, di-block PEMs with a top removable block have been fabricated.
We have prepared different polyelectrolyte combinations: (PAH/PSS)-
(PDADMAC/PAA), (PAH/PSS)-(PDADMAC/PSS) and (PEI/PSS)-(PEI/PAA)
showing that, depending on the particular combination of polyelectrolyte
chosen, different procedures can be applied to remove the top layers: pH
variations, and treatment with the TTAB and SDS surfactants.
The removal of the top layers does not affect, in most cases, the 1st block of the
PEM, which is fabricated upon polyelectrolytes that are resistant to the stimuli
Conclusions
211
that leads to the removal of the top block. There is a certain interdigitation
between the stacks, making the removal of the top blocks less pronounced than
the removal of top block if it were standing alone without the supporting stack.
Foulant present on top of the PEM, as shown for BSA, can be removed together
with the top layers applying the corresponding stimuli. Surprisingly, the
removal of the top block is enhanced in the presence of BSA and in the case of
the di-block PEI/PSS with PEI/PAA on top the presence of BSA leads to
complete removal of the PEMs after SDS treatment.
Once the layers have been removed they can be rebuilt free from foulants. The
whole procedure from the regeneration to the removal can be repeated several
times.
If applied to a filtration membrane the removal and reassembly could extend
the operative life of the membrane.
In chapter 4, PEMs with the ability to collapse, displaying a variation in
thickness of 200 nm, approximately a 46 % reduction in its thickness, have been
fabricated by assembling PDADPMAC/PSS at 3 M NaCl. PEM assembly at 3 M
NaCl with the chains highly coiled results in a high content of water entrapped
between polyelectrolyte chains. PDADMAC assembles at these conditions with
a higher water content with respect to PSS as has been measured by combined
ellipsometry-qcm. When reducing the ionic strength to that of pure water the
chains expand and flatten, thus occupying lateral space and removing the water
between chains. As a consequence, the thickness of the PEM is reduced. An

Conclusions
212
increase in the ionic strength to 3 M NaCl reverses the process and the film
stands up and regains the lost water. Such a PEM film could have interesting
applications, such as nanoactuators or controllable barrier applications where
polyelectrolyte brushes are frequently applied, with the advantage that the
response of the PEMs to varying ionic strength would be opposite to that
observed by a brush. Additionally, the thickness of the film can be easily
controlled over a few hundred nanometres by controlling the number of
polyelectrolyte layers assembled.
HYBRID POLYELECTROLYTE-CARBON NANOMATERIALS
In chapter 5, a hybrid nanofiltration membrane has been fabricated based on
the assembly of a PDADMAC/PSS polyelectrolyte multilayer on top of a
multilayer of MWCNTs. The MWCNTs layer act as a spacer layer between the
membrane support and the polyelectrolyte multilayer. The spacer results in a
dense polyelectrolyte multilayer assembly that covers the pores present in the
MWCNT layer. The assembly of the PEMs on top the support without the
MWCNT layer fails to cover the pores present on the membrane substrate for
the same or greater numbers of layers assembled in the PEM as on top of the
MWCNTs. The spacing of the PEM from substrate has the additional
advantage of increasing the flux through the pores of the support as the volume
going through a pore is collected from a larger area of the PEM with the
MWCNTs acting as a funnel. The performance of the PEM supported on the
MWCNT layer is significantly better than the PEM without CNTs. A PEM of 3

Conclusions
213
bilayers of PDADMAC/PSS on a MWCNT spacer showed a rejection for
MgSO4 of around 84 % while in the best case without MWCNT for a PEM of 5
bilayers a rejection of 59 % was observed. The PEMs on MWCNT show a large
rejection difference for mono and divalent ions making them very appealing for
separating ion mixtures.
The assembly of the PEMs on top of the MWCNTs as an intermediate layer
results in the formation of denser PEM membranes with a high charge density
as needed for the divalent salt rejection and for a high stability with increasing
flux, indeed with only 3 polyelectrolyte bilayers a significantly higher
performance is achieved compared to with 5 bilayers on a SiC membrane
without a MWCNT support.
In the last chapter, we have shown that 3D micron sized objects in the form of
capsules can be fabricated on the basis of the LbL assembly of GO and
polyelectrolytes on top of fixed erythrocyte cells as templates. TEM imaging
revealed a surface structure composed of GO sheets when the GO assembly was
performed with a high GO concentration. The presence of GO was confirmed
by Raman spectro-microscopy that revealed the presence of the GO in the
capsule structure. AFM revealed that the capsule walls are thin films with a
thickness of ~ 15 nm. Our results show an alternative method for the
fabrication of capsules involving GO in a dense arrangement that could
eventually have applications in drug delivery and optoelectronics by

Conclusions
214
developing hybrid thin polymer films containing graphene oxide or its reduced
form rGO.

215
List of Publications
(1) García, T. A.; Gervasi, C. A.; Rodríguez Presa, M. J.; Irigoyen Otamendi,
J.; Moya, S. E.; Azzaroni, O. J. Phys. Chem. C 2012, 116 (26), 13944–13953.
(2) Irigoyen, J.; Han, L.; Llarena, I.; Mao, Z.; Gao, C.; Moya, S. E. Macromol.
Rapid Commun. 2012, 33 (22), 1964–1969.
(3) Alonso, T.; Irigoyen, J.; Iturri, J. J.; Larena, I. L.; Moya, S. E. Soft Matter
2013, 9 (6), 1920–1928.
(4) Irigoyen, J.; Arekalyan, V. B.; Navoyan, Z.; Iturri, J.; Moya, S. E.; Donath,
E. Soft Matter 2013, 9 (48), 11609–11617.
(5) Moya, S. E.; Irigoyen, J. J. Polym. Sci. Part B Polym. Phys. 2013, 51 (14),
1068–1072.
(6) Coustet, M.; Irigoyen, J.; Garcia, T. A.; Murray, R. A.; Romero, G.; Susana
Cortizo, M.; Knoll, W.; Azzaroni, O.; Moya, S. E. J. Colloid Interface Sci.
2014, 421, 132–140.
(7) Irigoyen, J.; Politakos, N.; Murray, R. A.; Moya, S. E. Macromol. Chem.
Phys. 2014, 215 (16), 1543–1550.
(8) Gu, H.; Ciganda, R.; Castel, P.; Vax, A.; Gregurec, D.; Irigoyen, J.; Moya,
S.; Salmon, L.; Zhao, P.; Ruiz, J.; Hernández, R.; Astruc, D. Chem. – A Eur.
J. 2015, 21 (50), 18177–18186.
(9) Irigoyen, J.; Iturri, J.; Camacho, J. L.; Donath, E.; Moya, S. MRS Online
Proc. Libr. Arch. 2015, 1754, 53–58.
(10) Irigoyen, J.; Politakos, N.; Diamanti, E.; Rojas, E.; Marradi, M.; Ledezma,

Publications
216
R.; Arizmendi, L.; Rodríguez, J. A.; Ziolo, R. F.; Moya, S. E. Beilstein J.
Nanotechnol. 2015, 6, 2310–2318.
(11) Marmisollé, W. A.; Irigoyen, J.; Gregurec, D.; Moya, S.; Azzaroni, O. Adv.
Funct. Mater. 2015.
(12) Qiu, Y.; Rojas, E.; Murray, R. A.; Irigoyen, J.; Gregurec, D.; Castro-
Hartmann, P.; Fledderman, J.; Estrela-Lopis, I.; Donath, E.; Moya, S. E.
Nanoscale 2015, 7 (15), 6588–6598.
(13) Rapakousiou, A.; Deraedt, C.; Irigoyen, J.; Wang, Y.; Pinaud, N.; Salmon,
L.; Ruiz, J.; Moya, S.; Astruc, D. Inorg. Chem. 2015, 54 (5), 2284–2299.
(14) Irigoyen, J.; Laakso, T.; Politakos, N.; Dahne, L.; Pihlajamäki, A.;
Mänttäri, M.; Moya, S. E. Macromol. Chem. Phys. 2016, 217(6), 804-811.
(15) Wang, C.; Ciganda, R.; Salmon, L.; Gregurec, D.; Irigoyen, J.; Moya, S.;
Ruiz, J.; Astruc, D. Angew. Chemie Int. Ed. 2016, 55 (9), 3091–3095.
(16) Muzzio, N. E.; Gregurec, D.; Diamanti, E.; Irigoyen, J.; Pasquale, M. a.;
Azzaroni, O.; Moya, S. E. Adv. Mater. Interfaces 2016, accepted in press.
(17) Diamanti, E.; Muzzio, N.; Gregurec, D.; Irigoyen, J.; Pasquale, M.;
Azzaroni, O.; Brinkmann, M.; Moya, S. E. Colloids Surfaces B Biointerfaces
2016, accepted in press.

