journal of 13 biophotonics - uni-muenster.de · journal of biophotonics issn 1864-063x j....
TRANSCRIPT

Journal of
BIOPHOTONICS
ISSN 1864-063X J. Biophotonics, Vol. 6, No. 3 (March), 213–298 (2013)
www.biophotonics-journal.org
Impact
Factor 2011:
4.343
3/13
3D modelling and monitoring of infectionscenarios HOT and DHMB. Kemper, Á. Barroso, M. Woerdemann,L. Dewenter, A. Vollmer, R. Schubert,A. Mellmann, G. von Bally, C. Denz
LETTER
Towards 3D modelling and imaging of infection scenariosat the single cell level using holographic optical tweezersand digital holographic microscopy
Bjorn Kemper*; 1, Alvaro Barroso1; 2, Mike Woerdemann2, Lena Dewenter2, Angelika Vollmer1,Robin Schubert1, Alexander Mellmann3, Gert von Bally1, and Cornelia Denz2
1 Center for Biomedical Optics and Photonics, University of Muenster, Robert-Koch-Str. 45, 48149 Muenster, Germany2 Institute of Applied Physics, University of Muenster, Corrensstraße 2/4 Muenster, 48149 Muenster, Germany3 Institute of Hygiene, University of Muenster, Robert-Koch-Str. 41, 48149 Muenster, Germany
Received 28 March 2012, revised 25 May 2012, accepted 26 May 2012Published online 12 June 2012
Key words: holographic optical tweezers, digital holographic microscopy, infection monitoring, live cell imaging, bacteria
Æ Supporting information for this article is available free of charge under http://dx.doi.org/10.1002/jbio.201200057
1. Introduction
During the infection process, a host organism inter-acts with microorganisms such as viruses or bacteria.Typically, mammalian hosts react to infections withinnate responses in which inflammation is often in-volved [1]. However, diagnosis of an infection can
be difficult as sometimes specific signs and symptomsare absent. Thus, for a treatment with adequatepharmaceuticals, a clear diagnosis with a reliableidentification of the microorganism and knowledgeabout the underlying infection mechanisms are cru-cial. For an efficient identification of infective agents,many different assays have been developed. Typical
# 2013 by WILEY-VCH Verlag GmbH & Co. KGaA, Weinheim
Journal of
BIOPHOTONICS
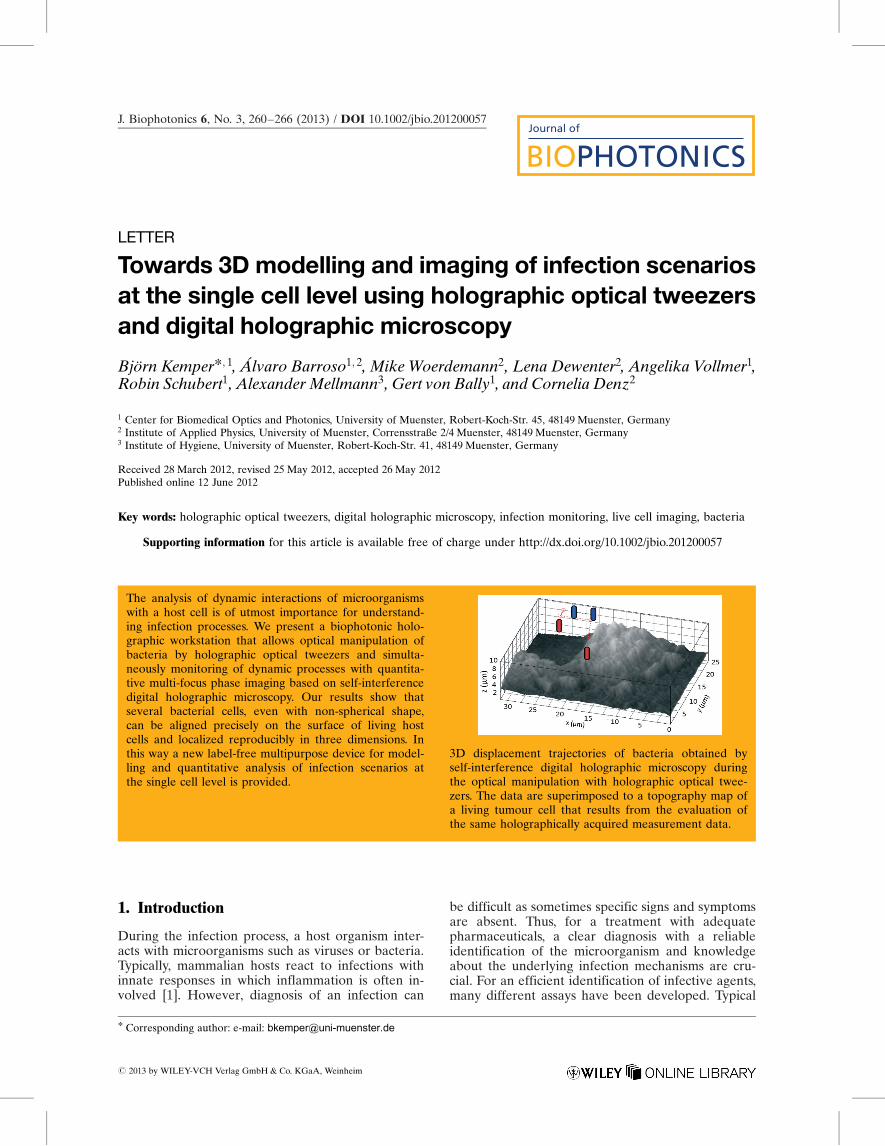
The analysis of dynamic interactions of microorganismswith a host cell is of utmost importance for understand-ing infection processes. We present a biophotonic holo-graphic workstation that allows optical manipulation ofbacteria by holographic optical tweezers and simulta-neously monitoring of dynamic processes with quantita-tive multi-focus phase imaging based on self-interferencedigital holographic microscopy. Our results show thatseveral bacterial cells, even with non-spherical shape,can be aligned precisely on the surface of living hostcells and localized reproducibly in three dimensions. Inthis way a new label-free multipurpose device for model-ling and quantitative analysis of infection scenarios atthe single cell level is provided.
3D displacement trajectories of bacteria obtained byself-interference digital holographic microscopy duringthe optical manipulation with holographic optical twee-zers. The data are superimposed to a topography map ofa living tumour cell that results from the evaluation ofthe same holographically acquired measurement data.
* Corresponding author: e-mail: [email protected]
J. Biophotonics 6, No. 3, 260–266 (2013) / DOI 10.1002/jbio.201200057
in vitro assays for bacteria are based on the cultiva-tion in Petri dishes on solid media with subsequentphenotypic characterization or molecular techniquessuch as polymerase chain reactions (PCR) [2]. How-ever, for a deeper understanding of the dynamicsof infection processes, a quantitative, time-resolvedanalysis at the single cell level is necessary. Further-more, the three-dimensional monitoring of interac-tions between the microorganisms and living hostcells is of interest to elucidate different steps duringthe infection process, e.g. adherence on or invasioninto the host cell. In order to design and analyze de-fined three-dimensional (3D) infection scenarios,methods are required that are capable of reliablymanipulating and imaging single or multiple parasiticspecimen and host cells. Ideally, these techniquesshould be minimally invasive in order to affect theprocesses of interest as little as possible. On the onehand, holographic optical tweezers (HOT) havebeen found suitable for the efficient 3D positioningand alignment of single and multiple bacteria andcells with laser light [3–5]. On the other hand, digitalholographic microscopy (DHM) in off-axis config-uration enables quantitative, minimally invasive mul-ti-focus phase contrast imaging of biological samplesby fast single-shot acquisition of digital holograms(see [6–10] and references therein) as well as theautomated 3D tracking of living cells [11]. Exploitingthe complementary features of both techniques, wecombined both technologies into a single work-station, which we name “biophotonic holographicworkstation”, because both techniques are based on
holography. In order to demonstrate in a proof-of-principle study the versatility of our workstation, wepresent for the first time to our knowledge 3D datafrom holographic manipulation and label-free quan-titative imaging of model bacteria during a well-de-fined infection scenario to pancreatic tumor cells.Our approach provides new label-free equipment formodelling and quantitative dynamic 3D imaging ofinfection scenarios at a single cell level with hithertounrivalled precision.
2. Methods and material
2.1 Holographic workstation
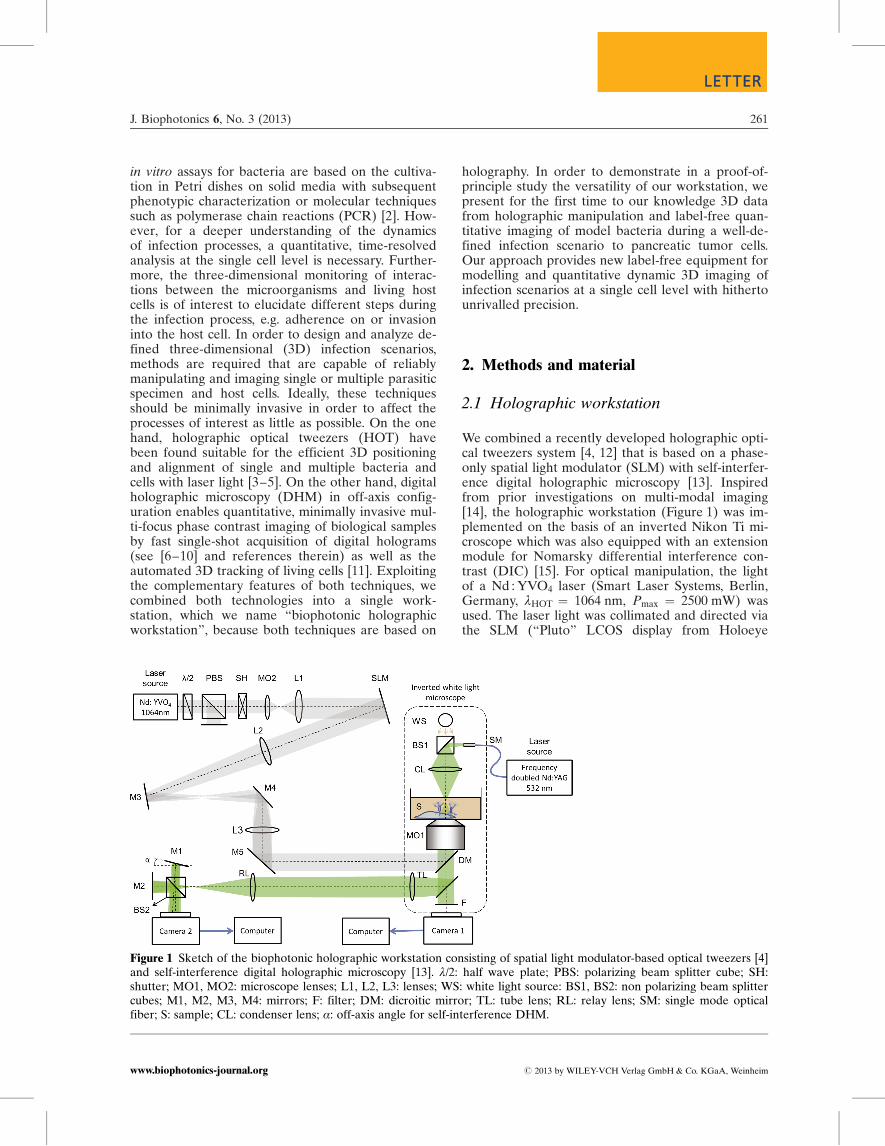
We combined a recently developed holographic opti-cal tweezers system [4, 12] that is based on a phase-only spatial light modulator (SLM) with self-interfer-ence digital holographic microscopy [13]. Inspiredfrom prior investigations on multi-modal imaging[14], the holographic workstation (Figure 1) was im-plemented on the basis of an inverted Nikon Ti mi-croscope which was also equipped with an extensionmodule for Nomarsky differential interference con-trast (DIC) [15]. For optical manipulation, the lightof a Nd : YVO4 laser (Smart Laser Systems, Berlin,Germany, lHOT ¼ 1064 nm, Pmax ¼ 2500 mW) wasused. The laser light was collimated and directed viathe SLM (“Pluto” LCOS display from Holoeye
Figure 1 Sketch of the biophotonic holographic workstation consisting of spatial light modulator-based optical tweezers [4]and self-interference digital holographic microscopy [13]. l/2: half wave plate; PBS: polarizing beam splitter cube; SH:shutter; MO1, MO2: microscope lenses; L1, L2, L3: lenses; WS: white light source: BS1, BS2: non polarizing beam splittercubes; M1, M2, M3, M4: mirrors; F: filter; DM: dicroitic mirror; TL: tube lens; RL: relay lens; SM: single mode opticalfiber; S: sample; CL: condenser lens; a: off-axis angle for self-interference DHM.
J. Biophotonics 6, No. 3 (2013) 261
LETTERLETTER
# 2013 by WILEY-VCH Verlag GmbH & Co. KGaA, Weinheimwww.biophotonics-journal.org
Photonics, Berlin, Germany) and appropriate relayoptics to the back focal plane of an oil immersionmicroscope lens with a high numerical aperture (Ni-kon, 1.49) where a power of PHOT ¼ 400 mW wasutilized to manipulate the specimens with one ormultiple Gaussian shaped optical tweezers. In orderto steer the tweezers, digital kinoforms were gener-ated [16]. The software used was originally devel-oped at the University of Glasgow, Scotland [17],and adapted to the specific requirements of theworkstation. For quantitative phase imaging withDHM, a self-interference setup was adapted to oneof the camera ports of the inverted microscope [13].
A frequency doubled Nd : YAG laser (Coherent,Compass 100, Lubeck, Germany, lDHM ¼ 532 nm)was used as coherent light source. In difference tocommon Mach-Zehnder setups, a Michelson interfe-rometer approach was used. Due to the short opticalpath length differences, this experimental setup is inparticular insensitive to mechanical instabilities andvibrations. Off-axis digital holograms were createdby a slight tilt (a) of one of the mirrors of the Mi-chelson interferometer and were recorded by a CCDsensor (The Imaging Source DMK 41BU02, Bre-men, Germany) which was also used for bright fieldimaging of the sample under white light illumination.The reconstruction of the resulting off-axis digitalholograms was performed in two steps as reportedin detail previously elsewhere [18–20]. First, thecomplex object wave was reconstructed by spatialphase shifting [18]. If the sample was not in focusduring hologram recording, numerical refocusing bya convolution approach of the Huygens Fresnel prin-ciple was performed [19] in combination with a holo-graphic autofocusing procedure [20].
2.2 Cells and bacteria
Based on experiences with the specimens from for-mer experiments [4, 19] human pancreatic ductaladenocarcinoma cells (PaTu8988T [21]) were used tomodel the host in this proof-of-principle study whilea wildtype strain of Bacillus subtilis (BD 630) wasutilized as a model for the parasitic organism.
The PaTu8988T cells were obtained from theGerman Collection of Microorganisms and Cell Cul-tures (DSMZ, Braunschweig), Germany and cul-tured in Dulbecco’s Modified Eagle Medium(DMEM) supplemented with 5% fetal calf serum(FCS), 5% horse serum, and 2 mM L-glutamine at10% CO2. For the experiments the medium was buf-fered with Hepes.
B. subtilis is a rod-shaped bacterium with a dia-meter of about 1 mm and a length of approximately2.5 mm. For the experiments the bacteria were de-frosted, centrifuged at 5000 g for 2–3 minutes, and
resuspended at room temperature into chemotaxisbuffer [22]. Then, the bacteria were suspended im-mediately to the cell culture buffer medium. Both,cells and bacteria, were studied in Petri Dishes (m-Dish35 mm, low, ibidi GmbH, Munich, Germany). Toavoid fast migrations of the tumor cells and possibleoverheating by the trapping laser beam the ex-periments were performed at room temperature(T ¼ 24 �C) [23]. In order to prevent optical trappingof unwanted specimens a concentration of B. subtiliswas chosen for which only few bacteria were visiblewithin the field of view. Rod-shaped bacteria of thissize and aspect ratio typically align their long axiswith the beam axis in the employed configuration ofdiscrete optical tweezers with Gaussian beam profile[24]. Using multiple optical tweezers acting at onebacterium, however, the orientation of the bacteriacan be defined at will [4].
3. Results and discussion
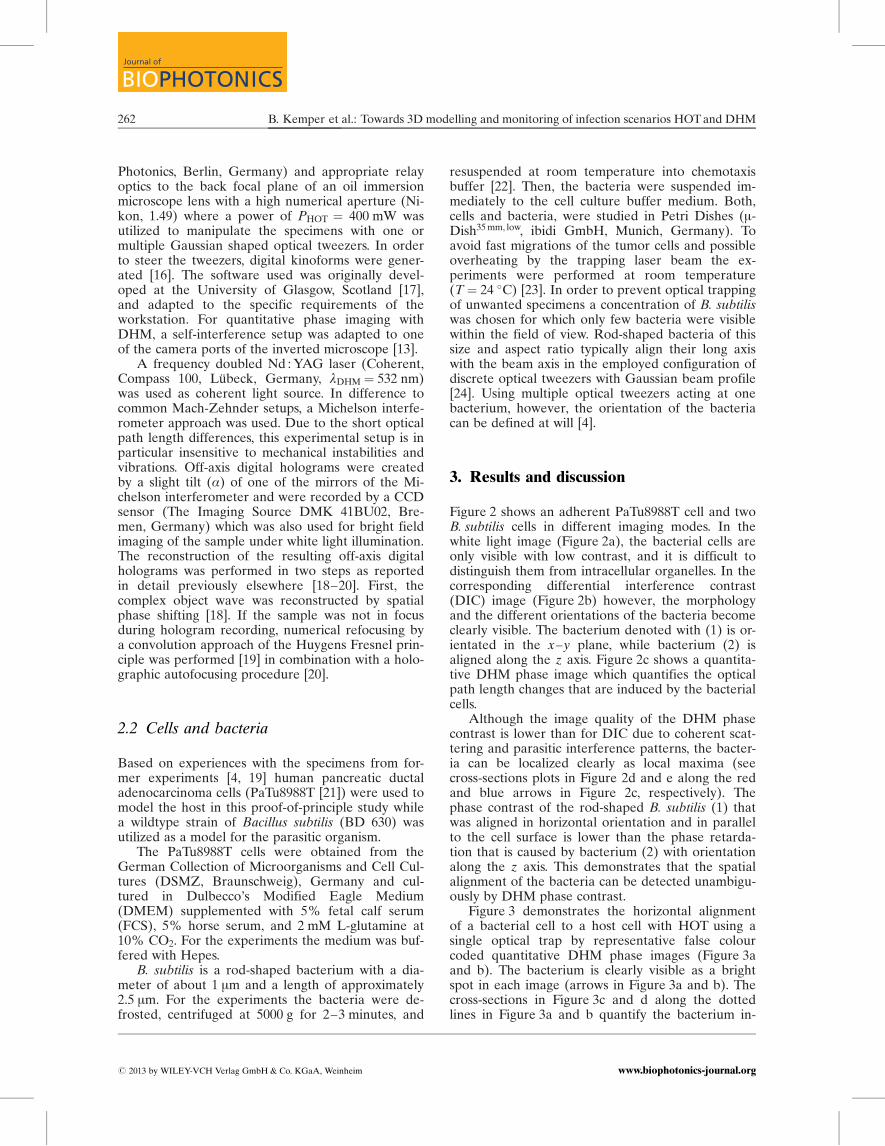
Figure 2 shows an adherent PaTu8988T cell and twoB. subtilis cells in different imaging modes. In thewhite light image (Figure 2a), the bacterial cells areonly visible with low contrast, and it is difficult todistinguish them from intracellular organelles. In thecorresponding differential interference contrast(DIC) image (Figure 2b) however, the morphologyand the different orientations of the bacteria becomeclearly visible. The bacterium denoted with (1) is or-ientated in the x–y plane, while bacterium (2) isaligned along the z axis. Figure 2c shows a quantita-tive DHM phase image which quantifies the opticalpath length changes that are induced by the bacterialcells.
Although the image quality of the DHM phasecontrast is lower than for DIC due to coherent scat-tering and parasitic interference patterns, the bacter-ia can be localized clearly as local maxima (seecross-sections plots in Figure 2d and e along the redand blue arrows in Figure 2c, respectively). Thephase contrast of the rod-shaped B. subtilis (1) thatwas aligned in horizontal orientation and in parallelto the cell surface is lower than the phase retarda-tion that is caused by bacterium (2) with orientationalong the z axis. This demonstrates that the spatialalignment of the bacteria can be detected unambigu-ously by DHM phase contrast.
Figure 3 demonstrates the horizontal alignmentof a bacterial cell to a host cell with HOT using asingle optical trap by representative false colourcoded quantitative DHM phase images (Figure 3aand b). The bacterium is clearly visible as a brightspot in each image (arrows in Figure 3a and b). Thecross-sections in Figure 3c and d along the dottedlines in Figure 3a and b quantify the bacterium in-
B. Kemper et al.: Towards 3D modelling and monitoring of infection scenarios HOT and DHM262
Journal of
BIOPHOTONICS
# 2013 by WILEY-VCH Verlag GmbH & Co. KGaA, Weinheim www.biophotonics-journal.org
duced phase changes and also illustrate its lateralmovement. The comparison of the local phase con-trast maximum with the data from bacterium (2) inFigure 2c reveals that the HOT cause the specimento align with the z axis. Furthermore, the comparisonof the two cross-sections in Figure 3e show that themorphology of the cell does not change during opti-cal manipulation of the bacteria with HOT. Thus, weconclude that no photo damage is induced duringthe observation time of about 10 min. In the furtherevaluation, the lateral coordinates of the maximumphase that is caused by the optically manipulatedbacterium are determined as described in [11] in or-der to track its lateral two-dimensional (2D) mo-tions.
Figure 3f depicts the resulting 2D displacementtrajectory, obtained from a sequence of N ¼ 17 sub-sequent quantitative DHM phase images, which issuperimposed to a representative quantitative DHMphase map of the cell. Video 1 illustrates the dynamictracking of the bacterium by a fast motion movie.
Having demonstrated dynamic 2D tracking, weinvestigated if dynamic 3D repositioning of multiplebacterial cells with HOT can be quantified by DHM.Therefore, within a timeframe of 30 s, N ¼ 110 di-gital holograms of three bacterial cells were re-corded. Initially the specimens were optically trappedin the same z plane, subsequently lifted up, and fi-nally lifted down and brought to the surface of aPaTu8988T cell (for illustration see Figure 4a, b and
Figure 2 Imaging of a pancreatictumor cell (PaTu8988T) and two B.subtilis cells (denoted as (1) and(2)) in different spatial orientations(white arrows) with different im-aging modalities. (a): White lightimage; (b), (c): corresponding DICand false colour coded quantitativeDHM phase images; (d), (e): cross-sections through the DHM phasealong the red and blue arrows in(c) that quantify the specimen in-duced phase retardation Dj.Scale bar: 5 mm
Figure 3 Automated 2D tracking of an optically-manipulated bacterium. (a), (b): false colour coded quantitative DHMphase images at t ¼ 0 and at the time where the bacterium aligned on the cell surface; (c), (d): cross-sections through thecell and the bacterium along the dotted lines in (a) and (b); (e): comparative plot of the data in (c) and (d); (f): 2Ddisplacement trajectory of the bacteria obtained from a sequence of N ¼ 17 digital holograms superimposed to a represen-tative quantitative phase image of the cell. The scale bar amounts to 5 mm (Video 1). The parameter Dj quantifies thespecimen induced phase retardation.
J. Biophotonics 6, No. 3 (2013) 263
LETTERLETTER
# 2013 by WILEY-VCH Verlag GmbH & Co. KGaA, Weinheimwww.biophotonics-journal.org
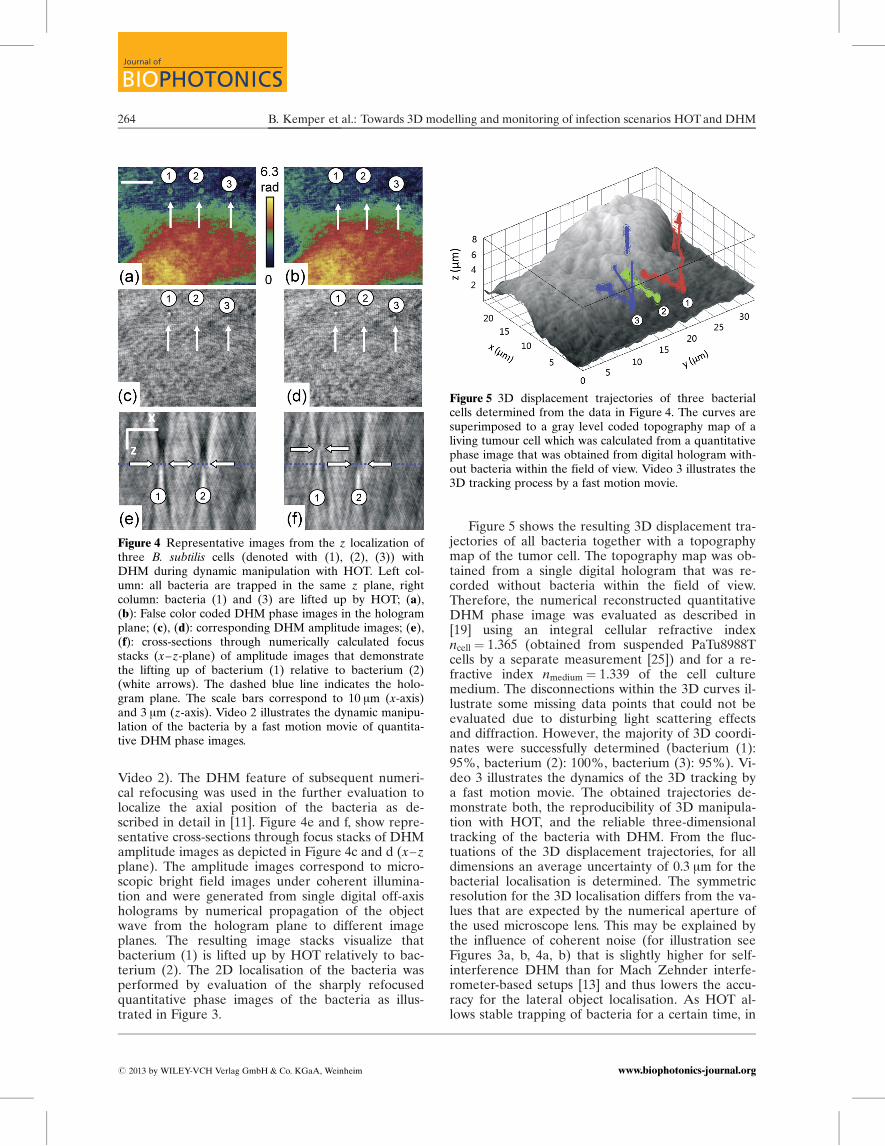
Video 2). The DHM feature of subsequent numeri-cal refocusing was used in the further evaluation tolocalize the axial position of the bacteria as de-scribed in detail in [11]. Figure 4e and f, show repre-sentative cross-sections through focus stacks of DHMamplitude images as depicted in Figure 4c and d (x–zplane). The amplitude images correspond to micro-scopic bright field images under coherent illumina-tion and were generated from single digital off-axisholograms by numerical propagation of the objectwave from the hologram plane to different imageplanes. The resulting image stacks visualize thatbacterium (1) is lifted up by HOT relatively to bac-terium (2). The 2D localisation of the bacteria wasperformed by evaluation of the sharply refocusedquantitative phase images of the bacteria as illus-trated in Figure 3.
Figure 5 shows the resulting 3D displacement tra-jectories of all bacteria together with a topographymap of the tumor cell. The topography map was ob-tained from a single digital hologram that was re-corded without bacteria within the field of view.Therefore, the numerical reconstructed quantitativeDHM phase image was evaluated as described in[19] using an integral cellular refractive indexncell ¼ 1.365 (obtained from suspended PaTu8988Tcells by a separate measurement [25]) and for a re-fractive index nmedium ¼ 1.339 of the cell culturemedium. The disconnections within the 3D curves il-lustrate some missing data points that could not beevaluated due to disturbing light scattering effectsand diffraction. However, the majority of 3D coordi-nates were successfully determined (bacterium (1):95%, bacterium (2): 100%, bacterium (3): 95%). Vi-deo 3 illustrates the dynamics of the 3D tracking bya fast motion movie. The obtained trajectories de-monstrate both, the reproducibility of 3D manipula-tion with HOT, and the reliable three-dimensionaltracking of the bacteria with DHM. From the fluc-tuations of the 3D displacement trajectories, for alldimensions an average uncertainty of 0.3 mm for thebacterial localisation is determined. The symmetricresolution for the 3D localisation differs from the va-lues that are expected by the numerical aperture ofthe used microscope lens. This may be explained bythe influence of coherent noise (for illustration seeFigures 3a, b, 4a, b) that is slightly higher for self-interference DHM than for Mach Zehnder interfe-rometer-based setups [13] and thus lowers the accu-racy for the lateral object localisation. As HOT al-lows stable trapping of bacteria for a certain time, in
Figure 4 Representative images from the z localization ofthree B. subtilis cells (denoted with (1), (2), (3)) withDHM during dynamic manipulation with HOT. Left col-umn: all bacteria are trapped in the same z plane, rightcolumn: bacteria (1) and (3) are lifted up by HOT; (a),(b): False color coded DHM phase images in the hologramplane; (c), (d): corresponding DHM amplitude images; (e),(f): cross-sections through numerically calculated focusstacks (x–z-plane) of amplitude images that demonstratethe lifting up of bacterium (1) relative to bacterium (2)(white arrows). The dashed blue line indicates the holo-gram plane. The scale bars correspond to 10 mm (x-axis)and 3 mm (z-axis). Video 2 illustrates the dynamic manipu-lation of the bacteria by a fast motion movie of quantita-tive DHM phase images.
Figure 5 3D displacement trajectories of three bacterialcells determined from the data in Figure 4. The curves aresuperimposed to a gray level coded topography map of aliving tumour cell which was calculated from a quantitativephase image that was obtained from digital hologram with-out bacteria within the field of view. Video 3 illustrates the3D tracking process by a fast motion movie.
B. Kemper et al.: Towards 3D modelling and monitoring of infection scenarios HOT and DHM264
Journal of
BIOPHOTONICS
# 2013 by WILEY-VCH Verlag GmbH & Co. KGaA, Weinheim www.biophotonics-journal.org

future even higher accuracies for specimen localisa-tion may be expected by enhancement of the DHMsetup with synthetic aperture approaches, e.g., asproposed in [26, 27].
4. Conclusions
We have demonstrated that single and multiple bac-teria can be simultaneously aligned and monitoredin three dimensions by using a biophotonic holo-graphic workstation that combines the complemen-tary features of HOT and self-interference DHM.Bacterial cells with a size close to the diffraction lim-it of the employed optical imaging system are re-solved in quantitative DHM phase contrast. The bac-teria-induced signal in the quantitative phase imagessignificantly exceeds the coherent noise in the uti-lized self-interference DHM setup. Thus, even differ-ent orientations of rod-shaped specimens are identi-fied. Furthermore, it has been shown that bacteriacan be reproducibly aligned on the surface of cellswith sub micrometer accuracy. During the observa-tion time no changes of the bacterial and cell mor-phology were observed in the quantitative DHMphase images. From this it can be concluded that theused optical tweezers system neither induced seriousphoto damage to the cells nor that the viability ofthe bacteria is significantly affected.
In conclusion, the concept of the presented bio-photonic holographic workstation opens up brightfuture prospects for the modelling of infection sce-narios. Bacteria can be minimally-invasively alignedon cells and localized precisely in three-dimensions.Moreover, it is possible to observe the interactionof bacteria and cells, and bacteria-induced cellularmorphology changes quantitatively and label-free.Although further in-depth studies with suitable cel-lular and bacterial models are required, we believethat our approach paves the way towards innovativeand substantial investigations of infection processesat the single cell level.
Acknowledgements This project was partly funded bythe European Union Network of Excellence Photonic-s4Life (P4L). Further financial support by the GermanMinistry of Education and Research (BMBF) within thefocus program “Biophotonics” (FKZ13N10937), the Eur-opean Union funded Erasmus Program and the MedicalFaculty of the University of Muenster (grant BD9817044)are gratefully acknowledged. The authors thank ChristinaAlpmann and Florian Horner (Department of AppliedPhysics, University of Muenster, Germany) for helpful dis-cussions, Christina Rommel and Jurgen Schnekenburgerfrom the Biomedical Technology Center, University ofMuenster, Germany, for support with the pancreatic tu-mor cells, and Berenike Maier and Jan Ribbe (both Bio-
zentrum Koln, Universitat zu Koln, Germany) for the kindsupply of B. subtilis samples.
References
[1] S. Akira, Curr Top Microbiol Immunol. 311, 1–16(2006).
[2] S. Baron, Medical Microbiology. 4th ed., Galveston(TX) 1996.
[3] D. J. Stevenson, F. G. Moore, and K. Dholakia, J.Biomed. Opt. 15, 041503 (2010).
[4] F. Hoerner, M. Woerdemann, S. Mueller, B. Maier,C. Denz, J. Biophoton. 3, 468–475 (2010).
[5] G. Carmon, I. Fishov, and M. Feingold, Opt. Lett. 37,440–442 (2012).
[6] P. Marquet, B. Rappaz, P. J. Magistretti, E. Cuche,Y. Emery, T. Colomb, and C. Depeursinge, Opt. Lett.30, 468–470 (2005).
[7] B. Kemper and G. von Bally, Appl. Opt. 47, A52–A61(2008).
[8] M. K. Kim, SPIE Reviews 1, 018005 (2010).[9] G. Popescu, Quantitative phase imaging of cells and
tissues (McGraw-Hill, New York, 2011).[10] N. T. Shaked, M. T. Rinehart, and A. Wax, Quantita-
tive phase microscopy of biological cell dynamics bywide-field digital interferometry, in: Coherent LightMicroscopy for Imaging and Quantitative Phase Ana-lysis (Springer, 2011), pp. 169–199.
[11] P. Langehanenberg, L. Ivanova, I. Bernhardt, S. Ke-telhut, A. Vollmer, D. Dirksen, G. Georgiev, G. vonBally, and B. Kemper, J. Biomed. Opt. 14, 014018(2009).
[12] M. Woerdemann, S. Glasener, F. Horner, A. Devaux,L. D. Cola, and C. Denz, Adv. Mater. 22, 4176–4179(2010).
[13] B. Kemper, A. Vollmer, C. Rommel, J. Schnekenbur-ger, and G. von Bally, J. Biomed. Opt. 16, 026014(2011).
[14] M. Esseling, B. Kemper, M. Antkowiak, D. Steven-son, L.Chaudet, M. A. A. Neil, P. W. French, G. vonBally, K. Dholakia, and C. Denz, J. Biophoton. 5, 9–13 (2012).
[15] G. Nomarski, J. Phys. Radium 16, 9–11 (1955).[16] J. Liesener, M. Reicherter, T. Haist, and H. J. Tiziani,
Opt. Commun. 185, 77–82 (2000).[17] R. W. Bowman, D. Preece, G. Gibson, and M. J. Pad-
gett, J. Opt. A 13, 044003 (2011).[18] D. Carl, B. Kemper, G. Wernicke, and G. von Bally,
Appl. Opt. 43, 6536–6544 (2004).[19] B. Kemper, D. Carl, J. Schnekenburger, I. Brede-
busch, M. Schafer, W. Domschke, and G. von Bally,J. Biomed. Opt. 11, 034005 (2006).
[20] P. Langehanenberg, B. Kemper, D. Dirksen, andG. von Bally, Appl. Opt. 47, A52–A61 (2008).
[21] H. P. Elsasser, U. Lehr, B. Agricola, and H. F. Kern,Virchows Arch. B 61, 295–306 (1992).
[22] G. Ordal and D. Goldman, Science 189, 802–805(1975).
J. Biophotonics 6, No. 3 (2013) 265
LETTERLETTER
# 2013 by WILEY-VCH Verlag GmbH & Co. KGaA, Weinheimwww.biophotonics-journal.org
[23] A. Barroso, B. Kemper, M. Woerdemann, A. Vollmer,S. Ketelhut, and G. von Bally, C. Denz, Proc. SPIE8427, 84270A (2012).
[24] L. Dewenter, C. Alpmann, M. Woerdemann, andC. Denz, Proc. SPIE 8427, 84270N (2012).
[25] B. Kemper, S. Kosmeier, P. Langehanenberg, G. vonBally, I. Bredebusch, W. Domschke, and J. Schneken-burger, J. Biomed. Opt. 12, 054009 (2007).
[26] M. Debailleul, V. Georges, B. Simon, R. Morin, andO. Haeberle, Opt. Lett. 34, 79–81 (2009).
[27] M. Kim, Y. Choi, C. Fang-Yen, Y. Sung, R. R. Dasari,M. S. Feld, and W. Choi, Opt. Lett. 36, 148–150(2011).
B. Kemper et al.: Towards 3D modelling and monitoring of infection scenarios HOT and DHM266
Journal of
BIOPHOTONICS
# 2013 by WILEY-VCH Verlag GmbH & Co. KGaA, Weinheim www.biophotonics-journal.org