journal of anatomy - jiriarte.people.uic.edu et al 2011 - jofanatomy.pdf · in vivo bone strain and...
TRANSCRIPT
In vivo bone strain and finite-element modeling of thecraniofacial haft in catarrhine primatesCallum F. Ross,1 Michael A. Berthaume,2 Paul C. Dechow,3 Jose Iriarte-Diaz,1 Laura B. Porro,1
Brian G. Richmond,4 Mark Spencer5 and David Strait6
1Organismal Biology & Anatomy, University of Chicago, Chicago, IL, USA2Department of Mechanical & Industrial Engineering, University of Massachusetts, Amherst, MA, USA3Department of Biomedical Sciences, Baylor College of Dentistry, Texas A&M Health Science Center, Dallas, TX, USA4Department of Anthropology, Center for the Advanced Study of Hominid Paleobiology, The George Washington University,
Washington, DC, USA5Department of Anthropology, Institute of Human Origins, Arizona State University, Tempe, AZ, USA6Department of Anthropology, University at Albany, Albany, NY, USA
Abstract
Hypotheses regarding patterns of stress, strain and deformation in the craniofacial skeleton are central to
adaptive explanations for the evolution of primate craniofacial form. The complexity of craniofacial skeletal
morphology makes it difficult to evaluate these hypotheses with in vivo bone strain data. In this paper, new in
vivo bone strain data from the intraorbital surfaces of the supraorbital torus, postorbital bar and postorbital
septum, the anterior surface of the postorbital bar, and the anterior root of the zygoma are combined with
published data from the supraorbital region and zygomatic arch to evaluate the validity of a finite-element
model (FEM) of a macaque cranium during mastication. The behavior of this model is then used to test hypoth-
eses regarding the overall deformation regime in the craniofacial haft of macaques. This FEM constitutes a
hypothesis regarding deformation of the facial skeleton during mastication. A simplified verbal description of
the deformation regime in the macaque FEM is as follows. Inferior bending and twisting of the zygomatic
arches about a rostrocaudal axis exerts inferolaterally directed tensile forces on the lateral orbital wall, bending
the wall and the supraorbital torus in frontal planes and bending and shearing the infraorbital region and
anterior zygoma root in frontal planes. Similar deformation regimes also characterize the crania of Homo and
Gorilla under in vitro loading conditions and may be shared among extant catarrhines. Relatively high strain
magnitudes in the anterior root of the zygoma suggest that the morphology of this region may be important
for resisting forces generated during feeding.
Key words biomechanics; facial buttresses; feeding; hominins; mastication.
Introduction
Primates exhibit a diverse range of morphology in the cranio-
facial haft – the structures joining the rostrum to the brain-
case. The functional significance of this morphological
diversity is important for our understanding of primate cra-
niofacial evolution because many of the features defining pri-
mate higher taxa are part of the craniofacial haft. The
postorbital bar isa synapomorphy of Primates, the postorbital
septum a synapomorphy of Haplorhini (tarsiers and anthro-
poids), extreme orbital convergence and frontation are syna-
pomorphies of anthropoids, and the close approximation of
the orbits below the olfactory tract in haplorhines distin-
guishes them from most strepsirrhines (Cartmill, 1970, 1975,
1980; Ravosa, 1988, 1991; Ross & Ravosa, 1993; Ross, 1995;
Ross & Hylander, 1996b). Evidence for the functional signifi-
cance of these features in the craniofacial haft, where many
functional systems overlap, requires innovative experimental
and modeling approaches. For example, the highly frontated
(vertically orientated) orbits of anthropoids and some strep-
sirrhines might be effects of increased frontal lobe size or
retraction of the palate, or adaptations for visual inspection
of manually acquired food (Cartmill, 1970). In any case,
increased orbital verticality increases resistance of the face to
dorsoventral shearing and bending forces (Ross, 2001).
Describing the in vivo deformation regimes during feed-
ing is the first step in determining whether the shape of the
circumorbital region reflects selection for its ability to resist
Correspondence
Callum F. Ross, Organismal Biology & Anatomy, University of
Chicago, 1027 East 57th Street, Chicago, IL 60637, USA.
T: + 1 773 8347858; E: [email protected]
Accepted for publication 20 October 2010
Article published online 24 November 2010
ªª 2010 The AuthorsJournal of Anatomy ªª 2010 Anatomical Society of Great Britain and Ireland
J. Anat. (2011) 218, pp112–141 doi: 10.1111/j.1469-7580.2010.01322.x
Journal of Anatomy

those deformation regimes. Estimates of the relative bone
strain magnitudes in the circumorbital region during feed-
ing provide insight into the probable importance of bone
size and shape for resisting feeding forces (Hylander et al.
1991). The research reported here presents new strain data
from the intraorbital surface of the supraorbital torus, post-
orbital bar and postorbital septum, the anterior surface of
the postorbital bar and the anterior root of the zygoma in
macaques during mastication. These data are combined
with published data on deformation regimes in the supra-
orbital region and zygomatic arch (Hylander et al. 1991; Hy-
lander & Johnson, 1997b) to evaluate the validity of a
finite-element model (FEM) of a macaque cranium during
simulated mastication. The behavior of this model is then
used to test hypotheses regarding the overall deformation
regime in the craniofacial haft of macaques. The macaque
FEM is then compared with in vivo bone strain data col-
lected from Chlorocebus and published data on in vitro
deformation regimes of dry crania of Homo and Gorilla.
These comparisons suggest hypotheses about the degree to
which deformation regimes in the circumorbital regions are
shared among extant catarrhines.
In what follows, the term loading regime refers to the
combination of external forces acting on the skull in vivo or
in silico (i.e. in the FEM); the term deformation regime
refers to the pattern of deformation of the skull produced
by that loading regime; and the terms stress or strain
regime refer to the associated patterns of internal forces or
strains acting within the skull or FEM.
Hypotheses
Axial compression of facial pillars
Several workers have modeled the primate face as a rigid
frame composed of straight elements, often referred to as
facial ‘buttresses’ (Gorke, 1904; Richter, 1920; Benninghoff,
1925; Bluntschli, 1926; Sicher & Tandler, 1928; Endo, 1966b;
Roberts & Tattersall, 1974; Couly, 1976; Rak, 1983). The con-
cept of facial ‘buttresses’ persists in the clinical literature on
craniofacial skeleton deficiencies due to fractures and
tumor removal (Manson et al. 1980; Gruss & Mackinnon,
1986; Yamamoto et al. 1998; Nagasao et al. 2005; Andrades
et al. 2008; Rodriguez et al. 2008). The simplest of these
framework models posit that the bones of the craniofacial
haft are axially compressed during mastication and incision
and transmit these stresses from the molar region up to the
frontal bone via the interorbital ‘pillar’ medially, the postor-
bital bar laterally, and the pterygoid processes of the sphe-
noid posteriorly (Gorke, 1904; Benninghoff, 1925; Roberts &
Tattersall, 1974). Roberts and Tattersall’s model is presented
as an example in Fig. 1(A). The ‘axial compression’ hypothe-
ses are general statements regarding dissipation of stresses
in the face, and do not make precise predictions regarding
patterns of deformation. However, simple axial compres-
A
B
1
2
34
5
6
7
8
C
Fig. 1 (A) Facial pillars modeled by Roberts & Tattersall (1974) as
transmitting compressive forces from the toothrow to the braincase.
(B) Endo’s fundamental framework of the human face, consisting of
(1) transversely oriented frontal member, (2) oblique superior
zygomaticofrontal member, (3) vertically oriented inferior
zygomaticofrontal member, (4) oblique maxillozygomatic member, (5)
lower nasal member, (6) midline upper nasal member, (7) maxillary
member, and (8) transversely oriented alveolar member. (C) Endo’s
fundamental framework of the gorilla face. This framework differs
from the human frame in having a single zygomaticofrontal member,
a horizontally oriented maxillozygomatic member, and an alveolar
member that does not extend lateral to the maxillary member. The
methods for deriving these models are not presented by Endo, so the
reasons for these differences are not discussed.
ªª 2010 The AuthorsJournal of Anatomy ªª 2010 Anatomical Society of Great Britain and Ireland
Catarrhine facial strain, C. F. Ross et al. 113

sion models are unlikely to predict deformation regimes in
the primate lateral orbital wall because in most primates
this structure is not a straight member, but a curved, irregu-
larly shaped structure. This shape makes it difficult to pre-
dict how the lateral orbital wall will be deformed by
superiorly directed force components during biting. How-
ever, the medial position of the toothrow relative to the lat-
eral orbital wall does mean that bite forces will bend the
lateral orbital wall, rather than axially compress it. Similarly,
the force vectors of the masticatory musculature are almost
certainly off axis, suggesting that the lateral orbital wall is
probably bent, twisted and ⁄ or sheared by these muscle
forces as well. The relative orientations of muscle force vec-
tors are taken into account by Endo, Rak and Hylander’s
recent models of circumorbital function in primates.
Endo’s in vitro analyses
Endo’s (1966a,b, 1970, 1973) rigid frame models of the
human and gorilla faces (Fig. 1B,C) have influenced many
investigations of primate craniofacial biomechanics (Picq &
Hylander, 1989). These models comprise straight members
of uniform cross-section loaded by external forces simulat-
ing in vitro occlusal and muscle loadings. Endo used frame
analysis to estimate bending moments and stresses in these
facial frames in frontal, lateral and oblique perspectives,
B
Rt. M1
A
Rt. M1
Rt. I1D
C
Rt. I1E
Rt. M1
+
+ +
++
– ––
–
F Rt. M1 Rt. I1H
150 με
Rt. I1
+
+
+
+
–– ––
G
100 με
Fig. 2 Endo’s rigid frame model of the human face in anterior perspective (derived from Fig. 4.1 of Endo, 1966a,b). (A) Diagram of bending
moments calculated from molar loading. Figure is redrawn from Fig. 4.3A, top, in Endo (1966a,b). Bending moments in red are indicated on the
tensile side of the members. (B) Schema of the stresses acting on the members of the rigid frame during right molar loading (derived from Figs
4.3 and 6.1 in Endo, 1966a,b). Converging arrow pairs indicate compression; diverging arrow pairs indicate tension; single arrows indicate
external forces; curved arrows indicate bending moments. (C) Diagram of bending moments calculated from incisor loading. Figure is redrawn
from Fig. 4.3A, bottom, in Endo (1966a,b). Bending moments in red are indicated on the tensile side of the members. (D) Schema of the stresses
acting on the members of the rigid frame during incisor loading (derived from Figs 4.3 and 6.1 in Endo, 1966a,b). Converging arrow pairs indicate
compression; diverging arrow pairs indicate tension; single arrows indicate external forces; curved arrows indicate bending moments. (E) Fiber
strains along selected cross-sections during right first molar loading. Red denotes tensile strain, blue compressive strain. Lateral orbital margins are
primarily tensile units, although bending moments do generate compressive strains in the bar cross-sections on the working side, and slightly on
both sides during incisor loading. The nasal cross-section experiences primarily compressive strain. Redrawn from Endo (1966a,b; Fig. 3.11). (F)
Strain distributions around rims of orbits and pyriform aperture during right first molar loading. Lengths of lines perpendicular to the orbital
margin are proportional to the magnitude of strains along the margin at that point. Blue is compressive strain, red is tensile. Redrawn from Endo
(1966a,b; Fig. 3.8). (G) Strains along selected cross-sections during incisor loading. Red denotes tensile strain, blue compressive strain. Lateral
orbital margin strains are primarily tensile, although bending moments do generate compressive strains in the bar cross-sections on the working
side, and slightly on both sides during incisor loading. The nasal cross-section experiences primarily compressive strain. Redrawn from Endo
(1966a,b; Fig. 3.11). (H) Strain distributions around the rims of the orbits and pyriform aperture during right first incisor loading. Lengths of lines
perpendicular to orbital margin are proportional to the magnitude or strains along the margin at that point. Blue is compressive strain, red is
tensile. Redrawn from Endo (1966a,b; Fig. 3.8).
ªª 2010 The AuthorsJournal of Anatomy ªª 2010 Anatomical Society of Great Britain and Ireland
Catarrhine facial strain, C. F. Ross et al.114
and then qualitatively compared the magnitudes of these
stresses with the distribution of bone around the frames.
The bending moments acting on the facial framework of
the human skull are illustrated in Fig. 2(A,C). Bending
moments are illustrated here because Endo argued that
they were the most important deformation regimes acting
on the facial skeleton. It should be noted that these mem-
bers are subjected to varying degrees of compression, ten-
sion and shear, which Endo also calculated. Schemata of
the stresses acting on the members of the model are dia-
grammed in Fig. 2(B,D). Figure 2(E,G) illustrates strains per-
pendicular to selected cross-sections during right molar and
incisor loading, respectively. Figure 2(F,H) illustrates strains
along the margins of the orbits and piriform aperture dur-
ing these deformation regimes.
The overall deformation regime under incisor loading
(Fig. 2D) is bending in the frontal plane. The lateral ends
of the frontal member are pulled inferiorly by the tem-
poralis muscle forces, as well as by masseter forces trans-
mitted to the frontal member by the zygomaticofrontal
members. The lower lateral corners of the orbits are simi-
larly pulled inferiorly by masseter muscle forces, inducing
bending moments, especially in the lower zygomatico-
frontal member and the zygomaticomaxillary members
(Fig. 2C). These inferiorly directed forces cause the orbit
to deform, such that the upper lateral inside corner
bends to open out, or ‘unbends’, whereas the lower lat-
eral corner bends to close up (Fig. 2H). The inferiorly
directed components of masseter muscle force acting on
the lateral edges of the model and the superiorly direc-
ted bite forces acting on the alveolar member are both
resisted by the zygomaticomaxillary members, which are
sheared (not shown) and bent as a result. Under this
deformation regime, sections through the postorbital bar
are primarily under tension, except for the medial end of
the lower section (Fig. 2G), predicting tensile strains ori-
ented along the long axis of the postorbital bar.
Under unilateral molar loading (Fig. 2A,B) the working
side orbit is deformed in a very similar manner to the orbits
in the incisor loading model (cf. Fig. 2F,H). Compared to the
incisor loading regime, the magnitude of the bending
moments in the medial end of the zygomaticomaxillary
member is higher, due to the transmission of greater
amounts of force through the working side maxillary mem-
ber. Also, the lateral orbital wall experiences greater bend-
ing moments (Fig. 2A), and a greater degree of compressive
strain at the medial end of the lower cross-section through
the postorbital bar (Fig. 2E).
Although there is some variation in the magnitudes of
the internal forces associated with different bite points, the
deformation of the lateral orbital wall inferred by Endo is
similar, regardless of whether the toothrow is loaded on
the incisors, the premolars, or the molars, whether the sim-
ulated forces from the temporalis and masseter act alone or
together, and whether the species involved is Gorilla or
Homo. When the temporalis force and bite force are
applied without the masseter, axial compressive forces
within the lateral orbital wall increase, and when the mas-
seter force and bite force are applied without the temporal-
is, axial tensile forces within the lateral orbital wall increase.
Regardless of where the toothrow is loaded, Endo’s model
posits that the inferiorly directed forces of the masseter and
temporalis acting on the lateral orbital wall subject the wall
to internal bending moments. These bending moments are
one component of an overall deformation regime in the
craniofacial haft that can be simply described as bending in
a frontal or coronal plane. In general, the medially located
members in the model experience high axial forces (pre-
dominantly compressive) and the lateral members experi-
ence high bending moments and shearing forces
(Fig. 2E,G).
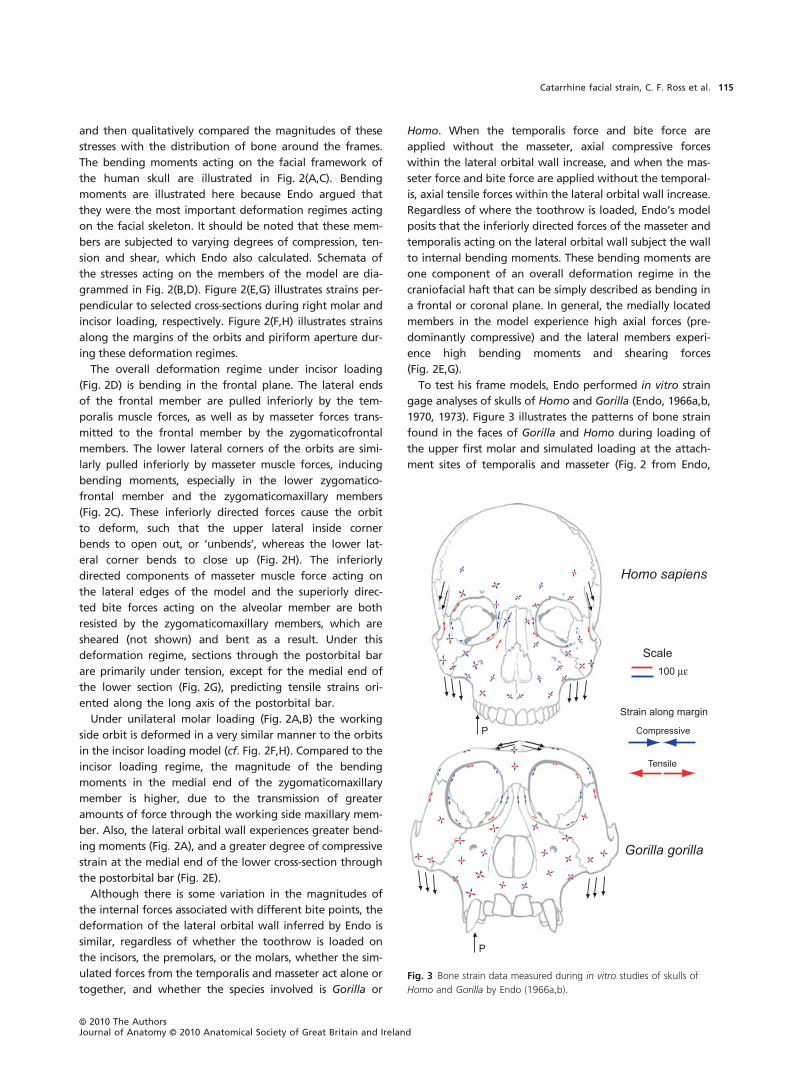
To test his frame models, Endo performed in vitro strain
gage analyses of skulls of Homo and Gorilla (Endo, 1966a,b,
1970, 1973). Figure 3 illustrates the patterns of bone strain
found in the faces of Gorilla and Homo during loading of
the upper first molar and simulated loading at the attach-
ment sites of temporalis and masseter (Fig. 2 from Endo,
P
P
100 με
Strain along margin
Scale
Tensile
Compressive
Homo sapiens
Gorilla gorilla
Fig. 3 Bone strain data measured during in vitro studies of skulls of
Homo and Gorilla by Endo (1966a,b).
ªª 2010 The AuthorsJournal of Anatomy ªª 2010 Anatomical Society of Great Britain and Ireland
Catarrhine facial strain, C. F. Ross et al. 115

1973 and Fig. 3.9 from Endo, 1966a,b). The patterns of stress
predicted by the mathematical model are similar to patterns
of bone strain recorded under in vitro loading (but see Picq
& Hylander, 1989).
Rak (1983) invoked Endo’s hypotheses regarding frame-
works and their deformation regimes in Homo and Gorilla
to reconstruct frameworks and posit their deformation
regimes in the faces of ‘australopithecine’ hominins. Rak
argued that the frames of the upper faces of australopithe-
cines resemble the frameworks of Homo and Gorilla, but
that their lower frames differed in having a zygomaticoal-
veolar member, corresponding in position to the zygomati-
coalveolar crest (Fig. 4) (Figs 37A and 4B of Rak, 1983:
p. 94). This additional member ‘serves as a supporting col-
umn between the heavily loaded occlusal surfaces of the
upper teeth, on the one hand, and the site of origin of the
powerful masseter, on the other’ (Rak, 1983: p. 94). Rak
hypothesized that the lateral orbital walls of the australopi-
thecines, like those of Homo and Gorilla, are principally ten-
sile elements subjected to external forces from temporalis
and masseter. In Paranthropous boisei, rostral displacement
of the masseter origin relative to the lateral orbital wall
removes the tensile support of the lateral orbital wall from
the anterior zygoma root, necessitating evolution of the
visor-like appearance of the boisei infraorbital region to
compensate.
Hylander et al. (1991) used in vivo bone strain data to
evaluate hypotheses regarding deformation regimes of
the supraorbital torus in macaques and baboons during
feeding. The results supported Endo’s (1966a,b) hypothesis
that during incision and mastication the supraorbital
regions of macaques and baboons are bent in a frontal
plane by inferiorly directed components of masseter and
temporalis muscle forces. However, they noted that ‘it is
clear that because of its morphological complexity, the
browridge cannot be accurately modeled, even for a first-
approximation analysis, as a slightly curved or straight
beam’ (Endo, 1966a,b: p. 33, emphasis in original). One
reason for their caution is the observation that strain ori-
entations in the dorsal orbital gage site, above the center
of each orbit, did not match the predictions of the frontal
bending hypothesis. In this study we present data from
the inferior, or intraorbital, surface of the supraorbital
torus, which we refer to as the orbital roof. These data, in
conjunction with data from the lateral orbital wall, allow
hypotheses regarding deformation regimes in the circum-
orbital region to be evaluated.
Ross & Hylander (1996a,b) reported strain data from the
medial (intraorbital) and lateral surfaces of the postorbital
septum in the owl monkey, Aotus. They reported primarily
superoinferiorly oriented tensile strains on the lateral sur-
face of the working side septum and superoinferiorly ori-
ented compressive strains on the medial surface. They
hypothesized that both working and balancing septa are
primarily bent in frontal planes and that the balancing side
septum is under some torsion due to posteroinferiorly ori-
ented force from masseter contraction (Ross & Hylander,
1996a).
A
B
C
Fig. 4 Fundamental rigid frameworks of faces of (A) Australopithecus
africanus, (B) Paranthropous robustus, and (C) Paranthropus boisei
hypothesized by Rak (1983). Skull drawings are from Rak (1983: with
permission). Rigid frames are constructed from interpretation of the
text and from Figs 37 and 44 in Rak (1983). Rak states that the upper
facial parts of the frames of A. africanus and P. robustus resemble the
generalized condition, and that these taxa resemble P. boisei in having
a zygomaticoalveolar member extending from the lower end of the
inferior zygomaticofrontal member to the alveolar member. In (C)
converging arrows represent compression of the zygomaticoalveolar
member and diverging arrows represent tension of the single
zygomaticofrontal member.
ªª 2010 The AuthorsJournal of Anatomy ªª 2010 Anatomical Society of Great Britain and Ireland
Catarrhine facial strain, C. F. Ross et al.116

Finite-element modeling of the macaque facial
skeleton
These hypotheses regarding deformation regimes in the pri-
mate craniofacial haft have used simple structures, such as
beams, plates and cylinders, to interpret patterns of strain
and infer deformation regimes. However, these models are
limited in their accuracy and precision by the geometric and
material complexity of primate facial form, and by the com-
plexity of the external forces acting on the facial skeleton
during feeding (Hylander et al. 1991; Ross & Hylander,
1996a; Ravosa et al. 2000a; Ross, 2001; Ross & Metzger,
2004; Metzger et al. 2005). To address these problems, our
hypothesis regarding deformation regimes in the macaque
face is a finite-element model (FEM) of the macaque face
subjected to external forces modeled on muscle and bite
forces, as described in this paper and elsewhere (Strait et al.
2002, 2005, 2008, 2009; Ross et al. 2005; Wang et al. 2008;
Chalk et al. 2010). Predictions of this hypothesis, in the form
of strain orientation and relative magnitude data, are eval-
uated in this paper using in vivo bone strain data from the
facial bones of macaques. These predictions are presented
in Figs 6–14, where they are compared with the in vivo
strain data.
Strain gradients in the facial skeleton
Hylander et al. (1991) noted that the in vivo bone strain
data reveal significant strain gradients in macaque and
baboon faces. They found very low strains in the supraor-
bital region, including dorsal interorbital, dorsal orbital
and rostral interorbital gage sites, data that replicated
the results reported by Endo from his in vitro strain
recordings from skulls of Homo and Gorilla (Picq &
Hylander, 1989). Hylander et al. concluded that the func-
tion of the supraorbital torus in catarrhines is unlikely to
be dissipation of masticatory stresses. Instead they posited
that the anterior displacement of the orbits relative to
the neurocranium necessitates the presence of bone
above the orbits to resist high strain magnitude traumatic
loads associated with infrequent blows to the head
(Hylander et al. 1991; Hylander & Johnson, 1992, 1997a,b;
Hylander & Ravosa, 1992). Subsequent work has shown
that strain gradients are widespread in the craniofacial
skeleton of primates and other vertebrates, leading Ross
and Metzger to argue that there are various reasons why
bone strain magnitudes might vary from one region to
another (Ross, 2001; Ross & Metzger, 2004). Low strained
bony sheets around the orbit have been hypothesized to
function to support the brain (orbital roof), provide
attachment for chewing muscles (postorbital septum),
provide attachment for the nasal epithelium and support
the eyeball (orbital floor) (Ross, 2001). These hypotheses
are evaluated here with in vivo bone strain data collected
from the intraorbital surfaces in macaques.
dio
rio
arz
pldent
bar
temp
morbmorbmorb
dorb
septum
dio
rio
arz
pldent
dorbseptum
bar
parchmarch
cond
aarch
lingualsymph
roofroofroofmorbmorbmorb
Fig. 5 Diagram of skull of Macaca illustrating gauge locations.
Abbreviations and region groups: Orbital region: dio, dorsal
interorbital; rio, rostral interorbital; dorb, dorsal orbital; roof, orbital
roof; bar, postorbital bar (anterior surface). Septum: postorbital
septum (intraorbital surface of zygomatic bone); morb, medial orbital
wall. Zygomatic: Arch, aarch, anterior 1 ⁄ 3 of zygomatic arch; March,
middle 1 ⁄ 3 zygomatic arch, on zygomatic ⁄ jugal bone, immediately
anterior to zygomatico-temporal suture; parch, posterior arch on
zygomatic process of squamous part of temporal bone; arz, anterior
root of zygoma; cond, condylar neck; Mandible, symph, symphysis;
lingual, lingual aspect of mandibular corpus.
ªª 2010 The AuthorsJournal of Anatomy ªª 2010 Anatomical Society of Great Britain and Ireland
Catarrhine facial strain, C. F. Ross et al. 117

Materials and methods
Subjects
Three adult females and one adult male rhesus macaques
(Macaca mulatta) served as subjects. All of these animals had
previously been unilaterally enucleated (i.e. had the orbital con-
tents removed) on the right side for reasons unrelated to our
research. This enabled placement of strain gages on the intraor-
bital surface of the lateral orbital wall and on the orbital roof.
Enucleation occurred several years before our research on the
adult animals and no skeletal asymmetries were evident.
Strain-gage placement
During 10 different experiments, delta (SA-06-030WY-120;
Micromeasurements, Raleigh, NC, USA) (wired in a three-wire
quarter-bridge circuit) or rectangular (FRA 1-11-1L; Texas Mea-
surements) rosette strain gages were placed in various combina-
tions along: (i) the medial or intraorbital surface of the lateral
orbital wall (septum); (ii) on the anterior surface of the frontal
process of the zygomatic bone at midorbital height (bar); (iii)
on the intraorbital surface of the supraorbital torus (roof); (iv)
on the anterior surface of the anterior root of the zygomatic
arch (arz); (v) on the frontal bone immediately adjacent to the
temporal line and behind the supraorbital torus (temp); (vi) on
the lateral surface of the zygomatic arch (arch); and (vii) on the
lateral surface of the mandibular corpus below the M1 or P4
(corpus) (Fig. 5, Table 1).
The animals were food-deprived for 24 h before each experi-
ment. The animals were then either heavily sedated using an
intramuscular injection of ketamine and acepromazine or anes-
thetized using inhalant isofluorane. To eliminate discomfort to
the animals and to abet hemostasis, a local anesthetic (2% lido-
caine HCl with epinephrine) was infiltrated subcutaneously over
the area where the strain gage was to be bonded. About 5 min
after infiltration, a small incision was made in the skin overlying
the gage site and the periosteum elevated to expose the bone.
A small area of the cortical bone was degreased with clinical
grade chloroform and neutralized [M-Prep Neutralizer 5A
(Ammonia water); Measurement Group Inc., Raleigh, NC, USA],
then the rosette was bonded to it with a cyanoacrylate adhe-
sive. To prevent movements of the lead wires from causing
strain in the gage, the lead wires were bonded to the bone for
3–4 mm using the same adhesive. Following bonding of the
strain gage and wires, the incision was sutured closed with the
lead wires of the strain gage passing out through the incision.
The lead wires were secured to the skin in areas where skin
movement is minimal. Dorsoventral, lateral and anteroposterior
radiographs were taken to document strain gage position and
orientation.
The macaques were placed in a commercially available
restraint (XPL-517-CM; Plas Labs, Lansing, MI, USA) that
restrained an animal’s arms while enabling the head and neck
to move freely. The animals were allowed to recover for at least
1 h after isofluorane anesthesia and up to 2 h after ketamine
sedation before data collection.
Each of the three elements of the rosettes was connected to
form one arm of a Wheatstone Bridge. Bridge excitation was
2 V. Voltage changes were conditioned and amplified on a
Vishay 2100 system, and then recorded on a PC at between 2.7
and 10 kHz (Table 1). Data acquisition to the PCs was controlled
using LAB-VIEW software (National Instruments, Austin, TX, USA)
running in Windows 3.1 NT.
The animals were presented hard apricots, hard prunes with
pits, gelatin candies (‘gummi bears’, ‘jelly beans’), nuts (almonds
or Brazil nuts), apples, taffy (chewy candy), and tootsie rolls
(chewy candy). Strains were recorded while the animals incised
and chewed these foods. Chewing side was recorded.
After each recording session (or Experiment) the animal was
again anesthetized and radiographs were taken to document
strain gage position and orientation. The gages were then
removed, the wound cleaned and closed with sutures, analgesics
and antibiotics were administered, and the animal was returned
to its cage.
Strain analysis
The data were analyzed in IGOR PRO 4.0 (WaveMetrics, Inc., Lake
Oswego, OR, USA) using custom written software. The strain
data were sampled at a rate of 1000 Hz then converted to mi-
crostrain (le) using calibration files made during the recording
sessions. The strain tracings were examined along with simulta-
neous electromyograms (EMGs) and the video tapes of the
experiments were examined to identify movement artifacts and
chewing side. Sequences were selected for analysis on the basis
Table 1 List of experiments from which data are derived.
Experiments Individual Gage number and type Gage locations reported here
8 Macaca mulatta 2 (F) Rectangular rosettes Medial orbital wall and anterior root of zygoma (R)
9 Macaca mulatta 1 (M) Rectangular rosettes Medial orbital wall and anterior root of zygoma (R)
10 Macaca mulatta 1 (F) Rectangular rosette Intraorbital, postorbital septum (R)
13 Macaca mulatta 1 (F) Rectangular rosette Orbital roof (R)
32 Macaca mulatta 2 (F) 4 delta stacked rosettes Intraorbital, postorbital septum, frontal bone (R)
38 Macaca mulatta 2 (F) 4 delta stacked rosettes Postorbital bar; zygomatic arch; mandibular corpus (L)
42 Macaca mulatta 5 (F) 2 delta stacked rosettes Postorbital bar; postorbital septum (R)
46 Macaca mulatta 5 (F) 4 delta stacked rosettes Postorbital bar (R)
47 Macaca mulatta 4 (F) 4 delta stacked rosettes Dorsal orbital; orbital roof; postorbital bar; postorbital
septum (R)
48 Macaca mulatta 4 (F) 4 delta stacked rosettes Postorbital bar (L)
57 Chlorocebus aethiops 3 delta stacked rosettes Bar (R), corpus (R), dorsal orbital (R)
ªª 2010 The AuthorsJournal of Anatomy ªª 2010 Anatomical Society of Great Britain and Ireland
Catarrhine facial strain, C. F. Ross et al.118
of length, the clarity of chewing side, and the lack of food
manipulation other than incision and mastication. Early power
strokes in a sequence were excluded if the animal was manipu-
lating food, and late power strokes were excluded if the magni-
tudes of the strains decreased so as to be unreliably
distinguishable from noise (which ranged from 5 to 10 mV in
each channel).
Strain (e), a dimensionless unit equaling the change in length
of an object divided by its original length, is measured in micro-
strain (le) units which are equal to 1 · 10)6 inches per inch, or
mm mm)1. Tensile strain is registered as a positive value and
compressive strain as a negative value. The maximum principal
strain (e1) is usually the largest tensile strain value, whereas the
minimum principal strain is usually the largest compressive
strain value (e2). e1 minus e2 is equal to the maximum shear
strain, or c-max. For selected sequences, the direction of the
maximum principal strain relative to the A-element of the gage,
the magnitude of the shear strains, and the ratio of maximum
to minimum strains (e1 ⁄ | e2|) were calculated with standard
equations (Dally & Riley, 1965). The magnitude and timing of
the peak shear strain were calculated for each power stroke,
and then the direction of the maximum principal strain and the
ratio of maximum to minimum strains at the same point in time
were calculated.
In vivo data analyses
Previous reports have illustrated the mean of the peak e1 orien-
tation during left and right chews and incisions (e.g. Hylander
et al. 1991; Ross & Hylander, 1996a,b; Ross, 2001). In this study,
figures illustrate the peak e1 and e2 orientation and magnitude
recorded during every power stroke analyzed, with the results
presented as plots of strain vectors overlaid on diagrams of
macaque skulls. These illustrations allow intuitive estimation of
relative magnitudes of peak tensile and compressive strains, an
appreciation of the range of strain orientations recorded, as
well as relationships between strain orientations and strain
magnitudes. The strain vector plots were created in IGOR PRO
using custom software that converts strain orientations (in
degrees) and magnitudes (in microstrain) to polar coordinates.
Skull images were output from the FEM of the macaque skull
and oriented so that the surface of the gage site was approxi-
mately parallel with the plane of the illustration. The orienta-
tions of the vectors relative to the skull images were
determined from notes and radiographs taken during the sur-
geries, as explained in the figure captions. Maximum principal
(tensile) strains, or e1, are in red; minimum principal (compres-
sive) strains, or e2, are in blue.
Quantitative analyses of the data were performed using ORIANA
2.02e (Kovach Computing Services, http://www.kovcomp.com).
Circular statistics were calculated for the orientations of e1 at
each gage site, with chew cycles grouped according to whether
the animal chewed ipsilateral or contralateral to the gage site,
yielding ‘working-side’ and ‘balancing-side’ chews, respectively.
Strain orientations recorded from the same area during differ-
ent experiments were converted to a common reference frame
to enable comparisons between experiments and between the
in vivo and FEM data. The strain orientations from the postor-
bital septum, orbital roof and dorsal orbital region were calcu-
lated relative to the plane of the orbital opening; the data from
the postorbital bar were oriented relative to a horizontal line
Exp. 46
AA
AA
Exp. 48200 με
A
Exp. 47200 με
AA
Exp. 38
200 με
200 με
Exp. 42
AA
200 με
Balancing Working
0o o0
WorkingBalancing
εεε
11
2
Postorbital barIn vivo strains
FEM bar rangeupper bar site
(lower bar site, exp. 48)
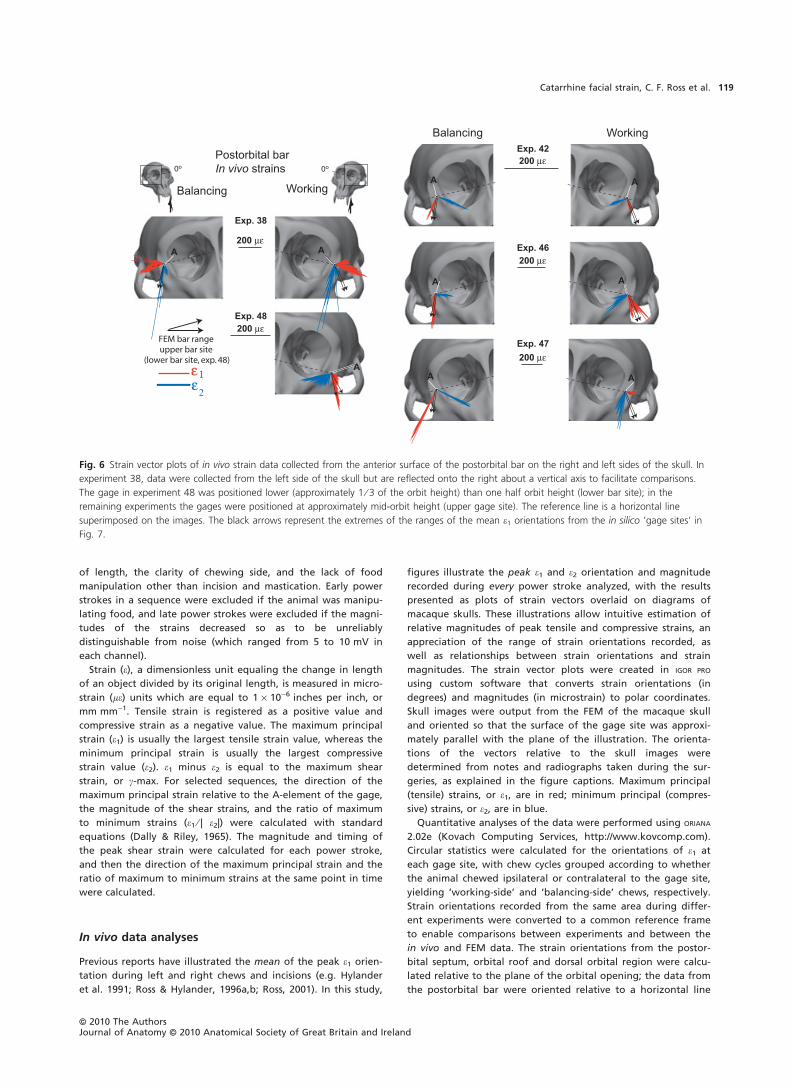
Fig. 6 Strain vector plots of in vivo strain data collected from the anterior surface of the postorbital bar on the right and left sides of the skull. In
experiment 38, data were collected from the left side of the skull but are reflected onto the right about a vertical axis to facilitate comparisons.
The gage in experiment 48 was positioned lower (approximately 1 ⁄ 3 of the orbit height) than one half orbit height (lower bar site); in the
remaining experiments the gages were positioned at approximately mid-orbit height (upper gage site). The reference line is a horizontal line
superimposed on the images. The black arrows represent the extremes of the ranges of the mean e1 orientations from the in silico ‘gage sites’ in
Fig. 7.
ªª 2010 The AuthorsJournal of Anatomy ªª 2010 Anatomical Society of Great Britain and Ireland
Catarrhine facial strain, C. F. Ross et al. 119
through the orbits. The statistics presented are: the angle (l) of
the mean vector relative to the A-element of the strain gage;
the length of the mean vector (r), ranging from 0 to 1, with a
larger r value indicating the observations are clustered more
closely around the mean than a lower r; the concentration (j),
the maximum likelihood estimate of the population concentra-
tion (Fisher, 1993; Mardia & Jupp, 2000), a parameter specific to
the von Mises distribution that measures the departure of the
distribution from a uniform distribution; the circular variance V,
calculated as V = 1 ) r; the circular standard deviation S = [)2
ln(r)]½ (in radians); the standard error of the mean (formula
4.42 in Fisher, 1993); and the 95% and 99% confidence intervals
derived from the standard error. (Note that the length of the
mean vector is not an estimate of the mean magnitude of e1,
but instead an estimate of the degree to which the strain orien-
tations cluster.) In addition, results of Rayleigh’s test of unifor-
mity are presented, along with Watson’s U2 test to determine
whether the data are derived from a von Mises distribution. To
determine whether working and balancing side deformation
regimes differ, mean e1 orientations recorded during chewing
on left and right sides were compared using a nonparametric
Mardia–Watson–Wheeler test when the data did not match a
von Mises distribution, and a Watson–Williams F-test when they
did. To determine whether strain orientation changed as the
magnitude of loading increased, circular-linear correlation coef-
ficients were calculated between e1 orientation and magnitude
following Zar (1999) with tests of significance using the approxi-
mation of the F distribution presented by Mardia & Jupp (2000).
There is no sign to these correlations; however, after examina-
tion of bivariate plots of orientation vs. magnitude, signs were
added to the results table to indicate whether the angle
became oriented more clockwise (a negative sign) or more
counterclockwise (positive sign) with increasing strain magni-
tude.
Three-way ANOVA (general linear model in SPSS for Windows
8.0) was used to investigate the effects of experiment, food and
chewing side (i.e. working or balancing) on shear strain magni-
tudes at all sites. Post hoc tests of differences in means were
performed using a Games–Howell pairwise comparison test
(which does not assume homogeneity of variances).
Strain gradients were documented using pairwise t-tests of
mean differences in shear strain recorded simultaneously at
each site. Pairwise comparisons between working and balancing
sides were not possible because in each experiment, strain gages
were only placed on one side of the face. t-Tests of indepen-
dent samples were used to compare strain magnitudes recorded
at the same site when it was on working and balancing sides.
Finite-element modeling
Finite-element analysis (FEA) or modeling (FEM) is an engineer-
ing technique used to examine how structures of complex
design respond to external loads (Huiskes & Chao, 1983; Cook
et al. 2002). The structure of interest (e.g. a skull) is modeled as
a mesh of simple bricks and tetrahedra (finite elements) joined
at nodes. The elements are assigned material properties and cer-
tain nodes are constrained against motion, forces are applied,
and displacements, stresses and strains at each node and within
each element are calculated. Recent advances in computer soft-
ware and imaging technology have made it possible to capture
and digitally reconstruct skeletal geometry with great precision,
thereby facilitating the generation of detailed FEMs of bony
structures, including non-human vertebrate crania (Rayfield
et al. 2001; Strait et al. 2002, 2005, 2007, 2008, 2009; Rayfield,
2004, 2005a,b, 2007; Dumont et al. 2005; Richmond et al. 2005;
Kupczik et al. 2007; McHenry et al. 2007; Moazen et al. 2007,
2008a,b, 2009; Moreno et al. 2007, 2008; Bourke et al. 2008;
Pierce et al. 2008; Rayfield & Milner, 2008). However, the incor-
poration of realistic muscle forces, bone material properties,
modeling constraints, and experimental bone strain data are
equally important components of FEA that are necessary to
ensure biologically meaningful results (Richmond et al. 2005;
Ross et al. 2005; Strait et al. 2005; Rayfield, 2007).
The finite-element model of the skull of Macaca used to
derive our predictions regarding deformation regimes in the
macaque facial skeleton has been described previously (Ross
et al. 2005; Strait et al. 2005). Briefly, it was built by digitizing
61 CT scans 2-mm-thick of a Macaca fascicularis skull (housed at
the National Museum of Natural History, Smithsonian Institu-
tion) in CAD Software (Dassault Systems Solidworks Corp.,
Concord, MA, USA). A mesh of 311 047 brick and tetrahedral
elements was created in ALGOR FEM PRO (Autodesk Inc., Pittsburgh,
PA, USA) (Fig. 3A). The model was assigned material properties
based on data derived from macaque skulls (Wang & Dechow,
2006). The FEM was converted to nastran format and imported
into STRAND 7.4. The data presented here were extracted from
the model as solved by STRAND 7.4.
The model was loaded in a manner designed to approximate
in vivo loading during mastication at unknown bite points
along the left postcanine toothrow. External forces generated
by four muscles on each side of the head were modeled (super-
ficial and deep masseter, medial pterygoid and anterior tempo-
ralis) for a total of eight muscle loads. Relative muscle force
magnitudes were calculated using electromyographic data (Ross
et al. 2005) and data on physiological cross-sectional area col-
lected according to Anton (1993). One node on the working
side articular eminence was fixed against translation along Y
and Z directions, one node on the balancing side eminence was
fixed against translation in X, Y and Z directions, and the
model was ‘solved’ six different times, all with the same exter-
nal muscle forces and temporomandibular joint (TMJ)
constraints, but each with a different bite point constraint con-
dition. In each of these bite point conditions, the medial cusps
on left upper postcanine tooth ⁄ teeth were constrained against
translation in X, Y and Z. The constraint conditions were: left
M3 constrained; left M2 constrained; left M1 constrained; left P4
constrained; left P3 constrained; and all of the left side postca-
nine teeth constrained together. In this way we sought to esti-
mate, at all in silico gage sites, variance in strain regimes
associated with variation in bite point. Bite point is unknown
in vivo, so this method provides a reasonable and conservative
estimate of model variance to compare with the in vivo situa-
tion.
In silico data extraction and analyses
To compare the surface strains recorded in vivo with the
strains on the surface of the macaque model the strain orien-
tations on the surfaces of the FEM need to be calculated at in
silico ‘gage sites’. The centroid locations and the strain tensors
for the external surface bricks of the model were exported
from STRAND and imported into MATLAB�. Custom-written code
(Iriarte-Diaz & Ross, 2010; see Supporting Information Data S1)
was used to calculate the orientation and magnitude of
ªª 2010 The AuthorsJournal of Anatomy ªª 2010 Anatomical Society of Great Britain and Ireland
Catarrhine facial strain, C. F. Ross et al.120

Tab
le2
Des
crip
tive
circ
ula
rst
atis
tics
for
invi
vobone
stra
inorien
tations
reco
rded
from
ante
rior
surf
ace
of
post
orb
ital
bar
.
Exp
eri
men
t38
38
42
42
46
46
47
47
48
Sid
eB
ala
nci
ng
Wo
rkin
gB
ala
nci
ng
Wo
rkin
gB
ala
nci
ng
Wo
rkin
gB
ala
nci
ng
Wo
rkin
gW
ork
ing
n421
458
183
117
194
128
21
50
179
Mean
vect
or
(l)
)4.3
73
1.3
16
53.3
86
54.5
24
66.9
68
50.1
19
50.5
96
2.3
07
)75.1
33
Len
gth
of
mean
vect
or
(r)
0.9
04
0.9
70.9
98
0.9
97
0.9
74
0.9
45
0.9
99
0.9
74
0.8
35
Med
ian
0.3
38
2.9
68
53.1
95
54.3
03
68.7
17
47.4
02
50.5
63.6
56
)71.5
8
Co
nce
ntr
ati
on
5.5
13
16.8
266.4
84
148.0
75
19.8
44
9.3
35
568.9
08
19.4
22
3.3
62
Cir
cula
rva
rian
ce0.0
48
0.0
15
9.3
9E-0
40.0
02
0.0
13
0.0
28
4.4
0E-0
40.0
13
0.0
83
Cir
cula
rSD
12.8
57.0
99
1.7
57
2.3
58
6.5
15
9.6
51
1.2
02
6.5
88
17.2
19
95%
con
fid
en
cein
terv
al
(±)
for
l)
3.1
47
1.9
67
53.1
32
54.0
97
66.0
51
48.4
47
50.0
82
0.4
81
)72.6
28
)5.5
99
0.6
66
53.6
41
54.9
52
67.8
85
51.7
951.1
14.1
33
)77.6
39
99%
con
fid
en
cein
terv
al
(±)
for
l)
2.7
62
2.1
71
53.0
52
53.9
63
65.7
63
47.9
22
49.9
21
)0.0
93
)71.8
41
)5.9
84
0.4
62
53.7
21
55.0
86
68.1
73
52.3
15
51.2
72
4.7
07
)78.4
26
Rayl
eig
hte
st(Z
)344.2
71
430.7
25
182.3
13
116.2
1184.2
2114.2
67
20.9
63
47.4
25
124.7
25
Rayl
eig
hte
st(P
)<
1E-1
2<
1E-1
2<
1E-1
2<
1E-1
2<
1E-1
2<
1E-1
23.8
5E-0
9<
1E-1
2<
1E-1
2
Wats
on
’sU
2te
st(v
on
Mis
es,
U2)
3.9
48
1.7
18
0.0
61
0.1
91
2.5
25
1.0
14
0.0
35
0.0
52
0.7
52
Wats
on
’sU
2te
st(P
)<
0.0
05
<0.0
05
0.5
>P
>0.2
5<
0.0
05
<0.0
05
<0.0
05
>0.5
0.5
>P
>0.2
5<
0.0
05
Test
for
wo
rkin
g⁄b
ala
nci
ng
dif
fere
nce
s
W29.0
19
7.2
26
135.4
36
44.3
63
P<
0.0
001
0.0
27
<0.0
001
<0.0
001
ªª 2010 The AuthorsJournal of Anatomy ªª 2010 Anatomical Society of Great Britain and Ireland
Catarrhine facial strain, C. F. Ross et al. 121
maximum and minimum principal strain on bricks in the maca-
que FEM that corresponded to the bone surfaces from which
in vivo strain data were collected. The software first allows the
user to interactively define a ‘gage site’ on the FEM surface,
including defining the local coordinate system of the gage;
then it transforms the strain tensors of the bricks in the gage
site into the coordinate system of the gages according to the
equations presented in Appendix 1. One of us (C.F.R.) selected
the areas on the model surface that most closely approximated
the position of the gages in the in vivo experiments. The vec-
tors representing the orientation and magnitude of the princi-
pal strains on the gage sites were exported from MATLAB� and
were used to create vector plots that were exported to ADOBE
ILLUSTRATOR� where they were oriented into the coordinate sys-
tem of the in vivo strain data. These data are presented for
comparison in the figures. In each figure the mean vector
recorded at an in silico gage site under one bite point con-
straint condition is represented by a colored line.
Results
Postorbital bar
In vivo strain orientations
Vectors representing the maximum principal strains
recorded from the anterior surface of the postorbital bar
in vivo are presented in Fig. 6. Strain data are reported
from the left postorbital bar in two experiments (38 and
48) and from the right postorbital bar in three experi-
ments (42, 46, 47). The images in Fig. 6 present all the
working side data on the left postorbital bar and all bal-
ancing side data on the right postorbital bar, regardless
of the side from which the data were actually collected.
No usable strain data were recorded from the balancing
side during experiment 48.
In three of the five experiments for which working side
data are available (42, 46, 48), e1 orientations are primarily
inferolateral, oriented between 45 and 67� counterclock-
wise of the horizontal. In experiments 38 and 47, e1 orienta-
tions are horizontal on the working side, deviating from
the horizontal by only 1–2�. In three of the four experi-
ments for which balancing side data are available, mean e1
orientations are primarily inferolateral, ranging from ca.
50–67� counterclockwise of the horizontal. The exceptions
are the data from the balancing side in experiment 38,
which are oriented almost directly laterally (ranging from
2.7 to 6� clockwise of the horizontal). In all experiments,
strain orientations recorded during chews ipsilateral to the
gage are significantly different from those recorded contra-
lateral to the gage (Table 2). In all cases, the working side e1
orientations are directed more laterally, while those on the
balancing side are oriented slightly more inferiorly. In all
experiments except for experiment 47, strain orientation on
the anterior surface of the postorbital bar is correlated with
strain magnitude, i.e. the deformation regime in the bar
changes with increasing strain magnitude (Table 2). In all
but one case, e1 orientations become more inferiorly direc-
ted as e1 increases. During balancing side chews in experi-
ment 42, e1 orientations rotate clockwise as e1 increases, but
only slightly (Fig. 6).
FEM strain field Working
FEM bite point means
BalancingPostorbital bar
20 με
10 με
Upper bar
Lower bar
Premolar 2
Premolar 3
Molar 1
Molar 2
Molar 3
All teeth
ε1 ε2
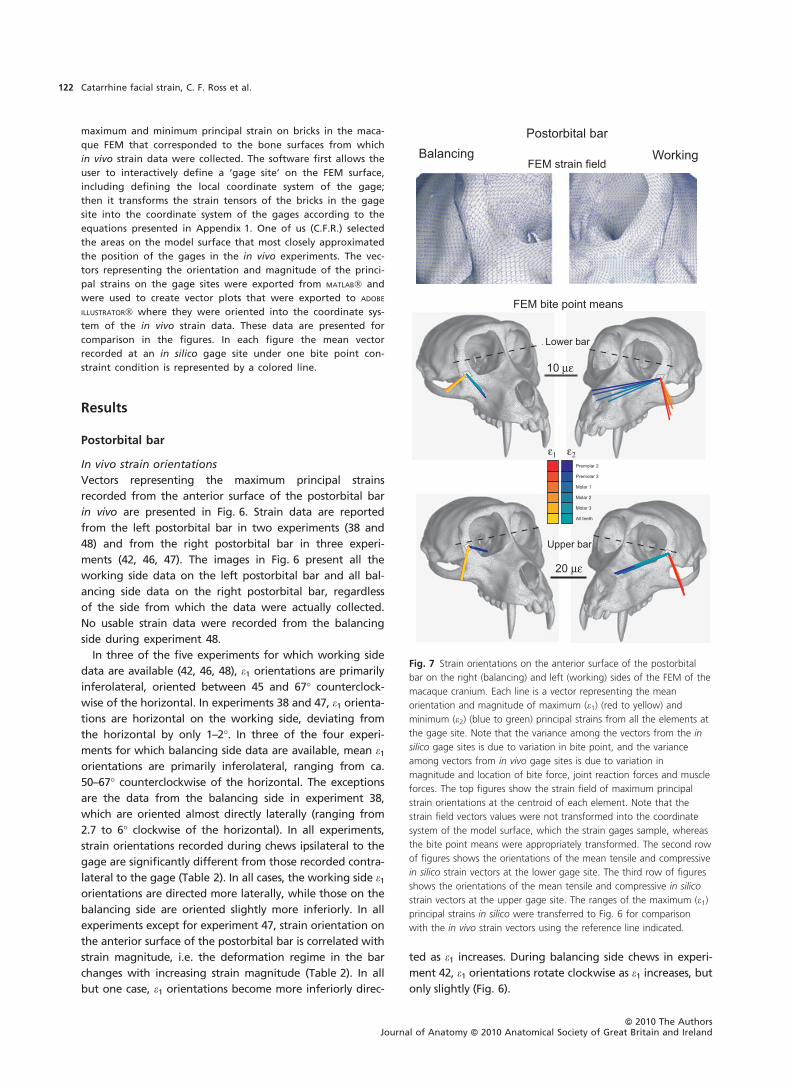
Fig. 7 Strain orientations on the anterior surface of the postorbital
bar on the right (balancing) and left (working) sides of the FEM of the
macaque cranium. Each line is a vector representing the mean
orientation and magnitude of maximum (e1) (red to yellow) and
minimum (e2) (blue to green) principal strains from all the elements at
the gage site. Note that the variance among the vectors from the in
silico gage sites is due to variation in bite point, and the variance
among vectors from in vivo gage sites is due to variation in
magnitude and location of bite force, joint reaction forces and muscle
forces. The top figures show the strain field of maximum principal
strain orientations at the centroid of each element. Note that the
strain field vectors values were not transformed into the coordinate
system of the model surface, which the strain gages sample, whereas
the bite point means were appropriately transformed. The second row
of figures shows the orientations of the mean tensile and compressive
in silico strain vectors at the lower gage site. The third row of figures
shows the orientations of the mean tensile and compressive in silico
strain vectors at the upper gage site. The ranges of the maximum (e1)
principal strains in silico were transferred to Fig. 6 for comparison
with the in vivo strain vectors using the reference line indicated.
ªª 2010 The AuthorsJournal of Anatomy ªª 2010 Anatomical Society of Great Britain and Ireland
Catarrhine facial strain, C. F. Ross et al.122
FEM orientations
Strain orientations on the anterior surface of the postorbital
bar vary with location, as shown by the FEM strain fields
shown in Fig. 7 (top). The in vivo strain gage recordings
were taken from the anterior surface of the bar at mid-orbit
height (upper bar, experiments 38, 42, 46, 47) (Fig. 7, mid-
dle) or at approximately one-third of orbit height (lower
bar, experiment 48) (Fig. 7, bottom). One upper and one
lower postorbital bar gage site were sampled on both work-
ing and balancing sides in silico. Each of the colored vectors
in Fig. 7 represents the mean strain orientations for all bricks
underlying the in silico ‘gages’ under a different in silico
‘bite point’ constraint condition. The ranges of these mean
e1 vectors are represented by black arrows that were then
added to the vector plots of the in vivo strains in Fig. 6.
On both working and balancing sides and at both upper
and lower bar sites, e1 orientations are oriented supero-infe-
riorly along the lateral edge of the bar’s anterior surface
(Fig. 7). At the upper bar site, e1 is oriented obliquely infero-
laterally on both working and balancing sides, with the
working side strains being slightly more horizontal than the
balancing (Fig. 7). At the lower bar site, working e1 orien-
tations are similar to those at the upper bar site. At the
balancing side lower bar site, e1 orientations are predo-
minantly laterally directed.
The in vivo experiments exhibited sufficient variation
between individuals that it would have been impossible for
the in silico data to match the data from all of them (i.e. when
two experiments exhibit non-overlapping ranges in strain
orientation, the single, average in silico vector obviously can-
not fall within the ranges of both). At the lower bar gage site,
the in vivo e1 orientations from experiment 48 include the
entire range of orientations sampled in silico. At the upper
bar site, the range of orientations sampled in silico broadly
overlapped those recorded on the working and balancing
sides in experiment 46 and on the working side in experiment
42, and are only ca. 10 degrees different from the balancing
side data collected during experiment 42. In contrast, the in
silico data are not overlapped by the very horizontally direc-
ted e1 orientations recorded during experiments 38 and 47. In
sum, the range of in silico mean vectors recorded from the
bar gage sites were well matched by in vivo data from two
experiments (38 and 46), and were matched or closely
approximated by the data from one other (experiment 42).
Postorbital septum
In vivo strain orientations
Strain vectors recorded from the intraorbital surface of the
postorbital septum are illustrated in Figs 8 and 9. Strain ori-
entations are presented in Table 3 as angles relative to the
plane of the orbital aperture, represented in Figs 8 and 9 by
a line following the anterior surface of the postorbital bar.
Strain was recorded from the zygomatic portion of the sep-
tum, at mid-orbit height, in three experiments (10, 42, 47)
(Fig. 8) and from the frontal portion at the top of the sep-
tum in experiment 32 (Fig. 9). In two of the three experi-
ments on the zygomatic portion of the septum, e1
orientations on the working side are anteroinferiorly direc-
ted at 121 and 134� relative to the orbital plane. In experi-
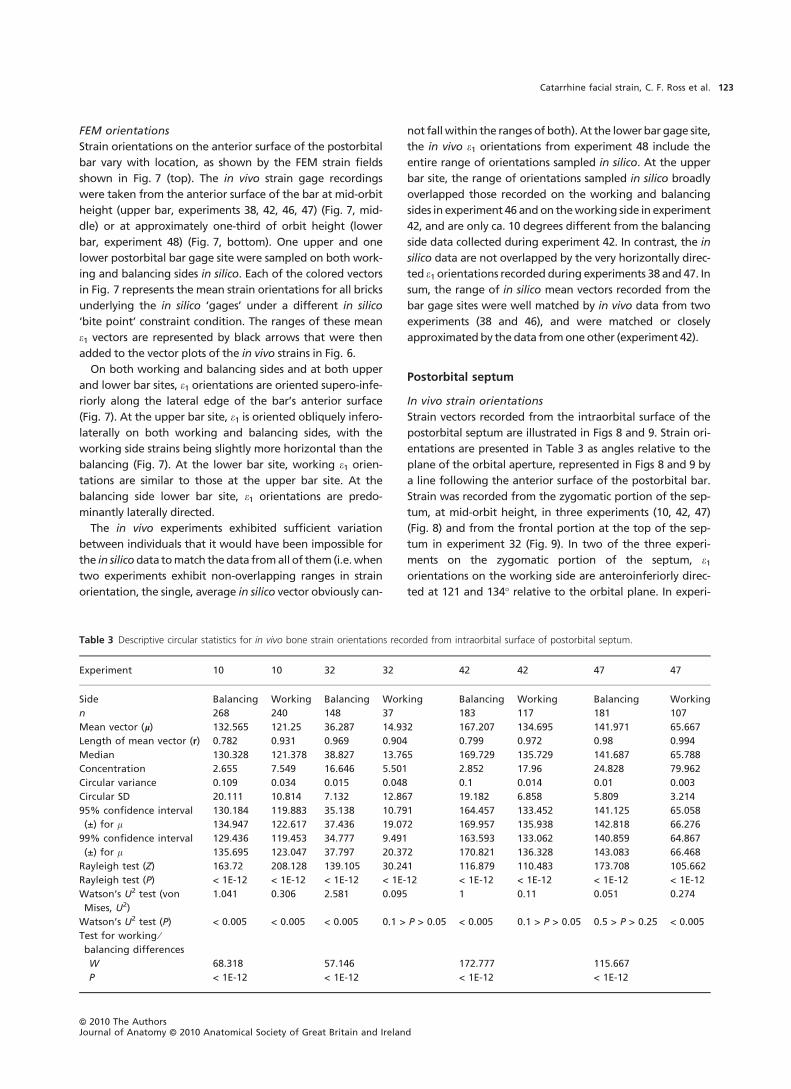
Table 3 Descriptive circular statistics for in vivo bone strain orientations recorded from intraorbital surface of postorbital septum.
Experiment 10 10 32 32 42 42 47 47
Side Balancing Working Balancing Working Balancing Working Balancing Working
n 268 240 148 37 183 117 181 107
Mean vector (l) 132.565 121.25 36.287 14.932 167.207 134.695 141.971 65.667
Length of mean vector (r) 0.782 0.931 0.969 0.904 0.799 0.972 0.98 0.994
Median 130.328 121.378 38.827 13.765 169.729 135.729 141.687 65.788
Concentration 2.655 7.549 16.646 5.501 2.852 17.96 24.828 79.962
Circular variance 0.109 0.034 0.015 0.048 0.1 0.014 0.01 0.003
Circular SD 20.111 10.814 7.132 12.867 19.182 6.858 5.809 3.214
95% confidence interval
(±) for l
130.184 119.883 35.138 10.791 164.457 133.452 141.125 65.058
134.947 122.617 37.436 19.072 169.957 135.938 142.818 66.276
99% confidence interval
(±) for l
129.436 119.453 34.777 9.491 163.593 133.062 140.859 64.867
135.695 123.047 37.797 20.372 170.821 136.328 143.083 66.468
Rayleigh test (Z) 163.72 208.128 139.105 30.241 116.879 110.483 173.708 105.662
Rayleigh test (P) < 1E-12 < 1E-12 < 1E-12 < 1E-12 < 1E-12 < 1E-12 < 1E-12 < 1E-12
Watson’s U2 test (von
Mises, U2)
1.041 0.306 2.581 0.095 1 0.11 0.051 0.274
Watson’s U2 test (P) < 0.005 < 0.005 < 0.005 0.1 > P > 0.05 < 0.005 0.1 > P > 0.05 0.5 > P > 0.25 < 0.005
Test for working ⁄balancing differences
W 68.318 57.146 172.777 115.667
P < 1E-12 < 1E-12 < 1E-12 < 1E-12
ªª 2010 The AuthorsJournal of Anatomy ªª 2010 Anatomical Society of Great Britain and Ireland
Catarrhine facial strain, C. F. Ross et al. 123
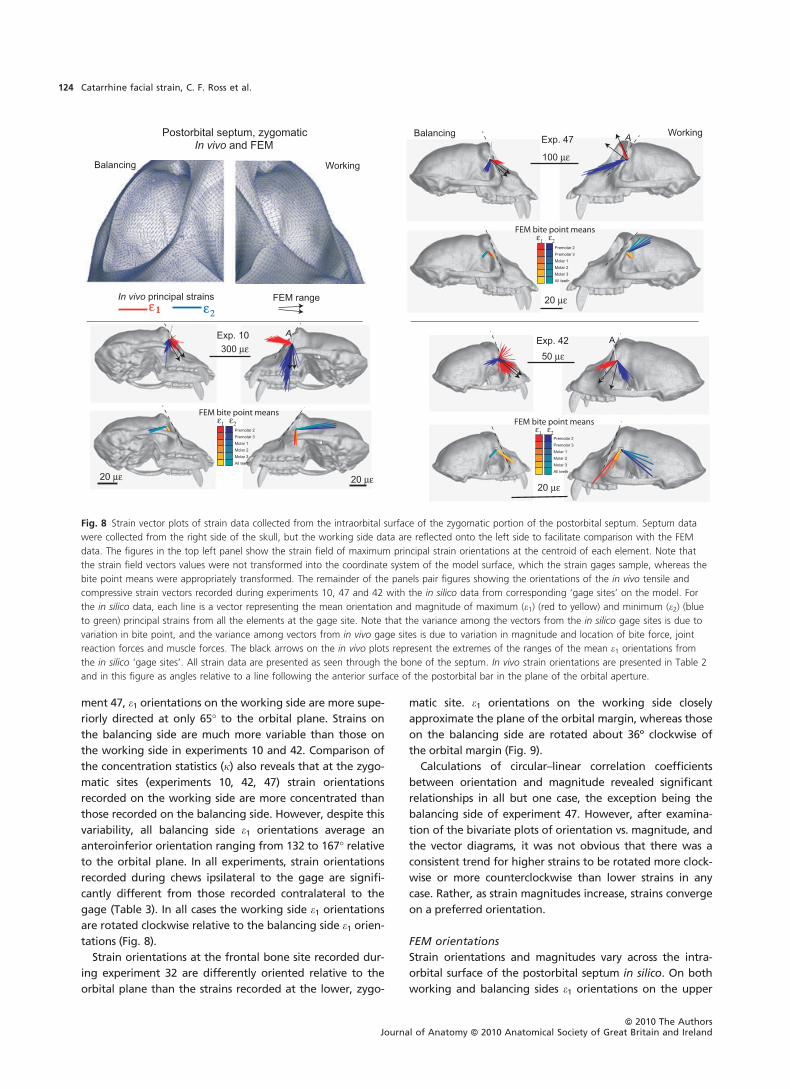
ment 47, e1 orientations on the working side are more supe-
riorly directed at only 65� to the orbital plane. Strains on
the balancing side are much more variable than those on
the working side in experiments 10 and 42. Comparison of
the concentration statistics (j) also reveals that at the zygo-
matic sites (experiments 10, 42, 47) strain orientations
recorded on the working side are more concentrated than
those recorded on the balancing side. However, despite this
variability, all balancing side e1 orientations average an
anteroinferior orientation ranging from 132 to 167� relative
to the orbital plane. In all experiments, strain orientations
recorded during chews ipsilateral to the gage are signifi-
cantly different from those recorded contralateral to the
gage (Table 3). In all cases the working side e1 orientations
are rotated clockwise relative to the balancing side e1 orien-
tations (Fig. 8).
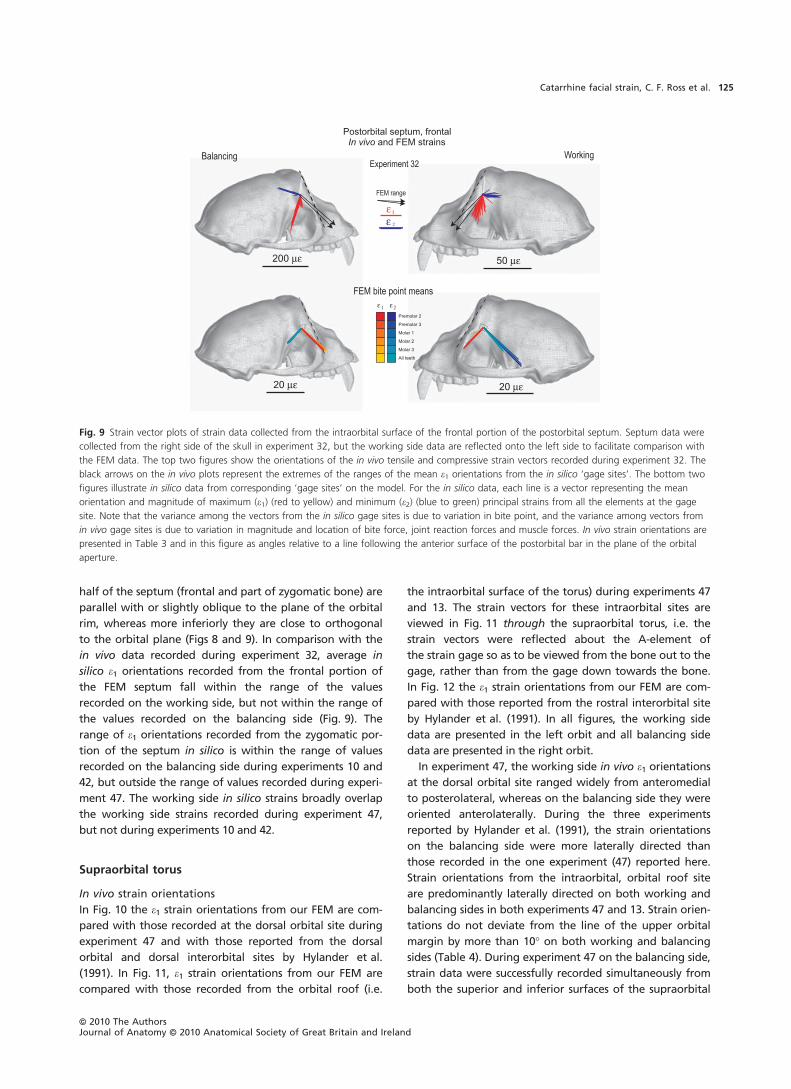
Strain orientations at the frontal bone site recorded dur-
ing experiment 32 are differently oriented relative to the
orbital plane than the strains recorded at the lower, zygo-
matic site. e1 orientations on the working side closely
approximate the plane of the orbital margin, whereas those
on the balancing side are rotated about 36º clockwise of
the orbital margin (Fig. 9).
Calculations of circular–linear correlation coefficients
between orientation and magnitude revealed significant
relationships in all but one case, the exception being the
balancing side of experiment 47. However, after examina-
tion of the bivariate plots of orientation vs. magnitude, and
the vector diagrams, it was not obvious that there was a
consistent trend for higher strains to be rotated more clock-
wise or more counterclockwise than lower strains in any
case. Rather, as strain magnitudes increase, strains converge
on a preferred orientation.
FEM orientations
Strain orientations and magnitudes vary across the intra-
orbital surface of the postorbital septum in silico. On both
working and balancing sides e1 orientations on the upper
A
20 με
A
ε11 ε2
WorkingBalancing
FEM range
Postorbital septum, zygomaticIn vivo and FEM
Exp. 4250 με
A
100 με
Exp. 47
20 με
WorkingBalancing
300 μεExp. 10
20 με
20 μεIn vivo principal strains
FEM bite point means
Premolar 2Premolar 3Molar 1Molar 2Molar 3All teeth
FEM bite point means
Premolar 2Premolar 3Molar 1Molar 2Molar 3All teeth
FEM bite point means
Premolar 2Premolar 3Molar 1Molar 2Molar 3All teeth
ε1 ε2
ε1 ε2
ε1 ε2
Fig. 8 Strain vector plots of strain data collected from the intraorbital surface of the zygomatic portion of the postorbital septum. Septum data
were collected from the right side of the skull, but the working side data are reflected onto the left side to facilitate comparison with the FEM
data. The figures in the top left panel show the strain field of maximum principal strain orientations at the centroid of each element. Note that
the strain field vectors values were not transformed into the coordinate system of the model surface, which the strain gages sample, whereas the
bite point means were appropriately transformed. The remainder of the panels pair figures showing the orientations of the in vivo tensile and
compressive strain vectors recorded during experiments 10, 47 and 42 with the in silico data from corresponding ‘gage sites’ on the model. For
the in silico data, each line is a vector representing the mean orientation and magnitude of maximum (e1) (red to yellow) and minimum (e2) (blue
to green) principal strains from all the elements at the gage site. Note that the variance among the vectors from the in silico gage sites is due to
variation in bite point, and the variance among vectors from in vivo gage sites is due to variation in magnitude and location of bite force, joint
reaction forces and muscle forces. The black arrows on the in vivo plots represent the extremes of the ranges of the mean e1 orientations from
the in silico ‘gage sites’. All strain data are presented as seen through the bone of the septum. In vivo strain orientations are presented in Table 2
and in this figure as angles relative to a line following the anterior surface of the postorbital bar in the plane of the orbital aperture.
ªª 2010 The AuthorsJournal of Anatomy ªª 2010 Anatomical Society of Great Britain and Ireland
Catarrhine facial strain, C. F. Ross et al.124
half of the septum (frontal and part of zygomatic bone) are
parallel with or slightly oblique to the plane of the orbital
rim, whereas more inferiorly they are close to orthogonal
to the orbital plane (Figs 8 and 9). In comparison with the
in vivo data recorded during experiment 32, average in
silico e1 orientations recorded from the frontal portion of
the FEM septum fall within the range of the values
recorded on the working side, but not within the range of
the values recorded on the balancing side (Fig. 9). The
range of e1 orientations recorded from the zygomatic por-
tion of the septum in silico is within the range of values
recorded on the balancing side during experiments 10 and
42, but outside the range of values recorded during experi-
ment 47. The working side in silico strains broadly overlap
the working side strains recorded during experiment 47,
but not during experiments 10 and 42.
Supraorbital torus
In vivo strain orientations
In Fig. 10 the e1 strain orientations from our FEM are com-
pared with those recorded at the dorsal orbital site during
experiment 47 and with those reported from the dorsal
orbital and dorsal interorbital sites by Hylander et al.
(1991). In Fig. 11, e1 strain orientations from our FEM are
compared with those recorded from the orbital roof (i.e.
the intraorbital surface of the torus) during experiments 47
and 13. The strain vectors for these intraorbital sites are
viewed in Fig. 11 through the supraorbital torus, i.e. the
strain vectors were reflected about the A-element of
the strain gage so as to be viewed from the bone out to the
gage, rather than from the gage down towards the bone.
In Fig. 12 the e1 strain orientations from our FEM are com-
pared with those reported from the rostral interorbital site
by Hylander et al. (1991). In all figures, the working side
data are presented in the left orbit and all balancing side
data are presented in the right orbit.
In experiment 47, the working side in vivo e1 orientations
at the dorsal orbital site ranged widely from anteromedial
to posterolateral, whereas on the balancing side they were
oriented anterolaterally. During the three experiments
reported by Hylander et al. (1991), the strain orientations
on the balancing side were more laterally directed than
those recorded in the one experiment (47) reported here.
Strain orientations from the intraorbital, orbital roof site
are predominantly laterally directed on both working and
balancing sides in both experiments 47 and 13. Strain orien-
tations do not deviate from the line of the upper orbital
margin by more than 10� on both working and balancing
sides (Table 4). During experiment 47 on the balancing side,
strain data were successfully recorded simultaneously from
both the superior and inferior surfaces of the supraorbital
11
FEM range
2
WorkingBalancing
εε
Postorbital septum, frontalIn vivo and FEM strains
50 με
20 με
200 με
20 με
Experiment 32
FEM bite point means
Premolar 2
Premolar 3
Molar 1
Molar 2
Molar 3
All teeth
ε1 ε2
Fig. 9 Strain vector plots of strain data collected from the intraorbital surface of the frontal portion of the postorbital septum. Septum data were
collected from the right side of the skull in experiment 32, but the working side data are reflected onto the left side to facilitate comparison with
the FEM data. The top two figures show the orientations of the in vivo tensile and compressive strain vectors recorded during experiment 32. The
black arrows on the in vivo plots represent the extremes of the ranges of the mean e1 orientations from the in silico ‘gage sites’. The bottom two
figures illustrate in silico data from corresponding ‘gage sites’ on the model. For the in silico data, each line is a vector representing the mean
orientation and magnitude of maximum (e1) (red to yellow) and minimum (e2) (blue to green) principal strains from all the elements at the gage
site. Note that the variance among the vectors from the in silico gage sites is due to variation in bite point, and the variance among vectors from
in vivo gage sites is due to variation in magnitude and location of bite force, joint reaction forces and muscle forces. In vivo strain orientations are
presented in Table 3 and in this figure as angles relative to a line following the anterior surface of the postorbital bar in the plane of the orbital
aperture.
ªª 2010 The AuthorsJournal of Anatomy ªª 2010 Anatomical Society of Great Britain and Ireland
Catarrhine facial strain, C. F. Ross et al. 125

torus: these strains are orthogonal to each other. On the
working side, good quality simultaneous strain data are less
common, but the laterally directed strains recorded from
the inferior surface in experiments 13 and 47 are roughly
orthogonal to those recorded from the superior surface by
Hylander et al. (1991). Mardia–Watson–Wheeler and
Wheeler–Williams tests reveal that strain orientations from
working and balancing orbital roofs are significantly differ-
ent. Linear–circular correlations reveal significant relation-
ships between e1 orientations and magnitudes in both
experiments on the orbital roof. As illustrated in Figs 10
and 11, e1 orientations rotate counterclockwise on the
working side and clockwise on the balancing side as strain
magnitudes increase, making the e1 orientations more
transversely oriented.
FEM orientations
The e1 strain field across the superior surface of the supraor-
bital torus during a left M1 bite is shown at the top of
Fig. 10. e1 orientations vary across the supraorbital region,
with anterolaterally directed orientations on both sides. A
line of reversal in strain orientation runs obliquely across
the mid-line from the medial corner of the balancing side
(right) orbit. Average strain orientations at the dorsal orbi-
tal and dorsal interorbital gage sites are reproduced, along
with e2 orientations, in the second row of Fig. 10. The dorsal
interorbital strains recorded in silico agree well with those
reported by Hylander et al. (1991), falling within the range
of values reported by them. Similarly, the in silico e1 orienta-
tions recorded from the balancing side dorsal orbital site
match those reported from multiple experiments by
Hylander et al. (1991), but they do not match those
recorded in our experiment 47 (Fig. 10). The in silico e1 ori-
entations recorded from the working side dorsal orbital site
fall within the range of values reported by Hylander et al.
(1991: Table 7) and our data from experiment 47.
FEM range ε11 ε2
Exp. 2C, 5A, 6 (Hylander et al. 1991)
WorkingBalancing
Exp. 47
0o0o
20 με
100 με
100 με
2C6 5A5A
6
2C2C
A
FEM bite point means
Premolar 2
Premolar 3
Molar 1
Molar 2
Molar 3
All teeth
In vivo principal strains
FEM strain field
Dorsal orbital and dorsal interorbital
Balancing Working
ε1 ε2
Fig. 10 Strain vector plots of strain data collected from dorsal orbital
surfaces of the supra-orbital torus. The top figure shows the strain
field of maximum principal strain orientations at the centroid of each
element. Note that the strain field vectors values were not
transformed into the coordinate system of the model surface, which
the strain gages sample, whereas the bite point means were
appropriately transformed. The second figure illustrates in silico data
from corresponding ‘gage sites’ on the model. For the in silico data,
each line is a vector representing the mean orientation and magnitude
of maximum (e1) (red to yellow) and minimum (e2) (blue to green)
principal strains from all the elements at the gage site. Note that the
variance among the vectors from the in silico gage sites is due to
variation in bite point, and the variance among vectors from in vivo
gage sites is due to variation in magnitude and location of bite force,
joint reaction forces and muscle forces. The in vivo strain vectors for
experiment 47 are shown in the third figure. In vivo strain orientations
are presented in Table 4 as angles relative to the plane of the orbital
aperture. Also shown is the range of e1 vectors recorded from the
dorsal orbital site during three experiments reported by Hylander et al.
(1991). Strain data for the balancing side shown in the skull’s left
orbit were actually recorded from within the right orbit: they are
illustrated on the left side after reflecting them about the mid-sagittal
plane. The black arrows on the in vivo plots represent the extremes of
the ranges of the mean e1 orientations from the in silico ‘gage sites’.
ªª 2010 The AuthorsJournal of Anatomy ªª 2010 Anatomical Society of Great Britain and Ireland
Catarrhine facial strain, C. F. Ross et al.126
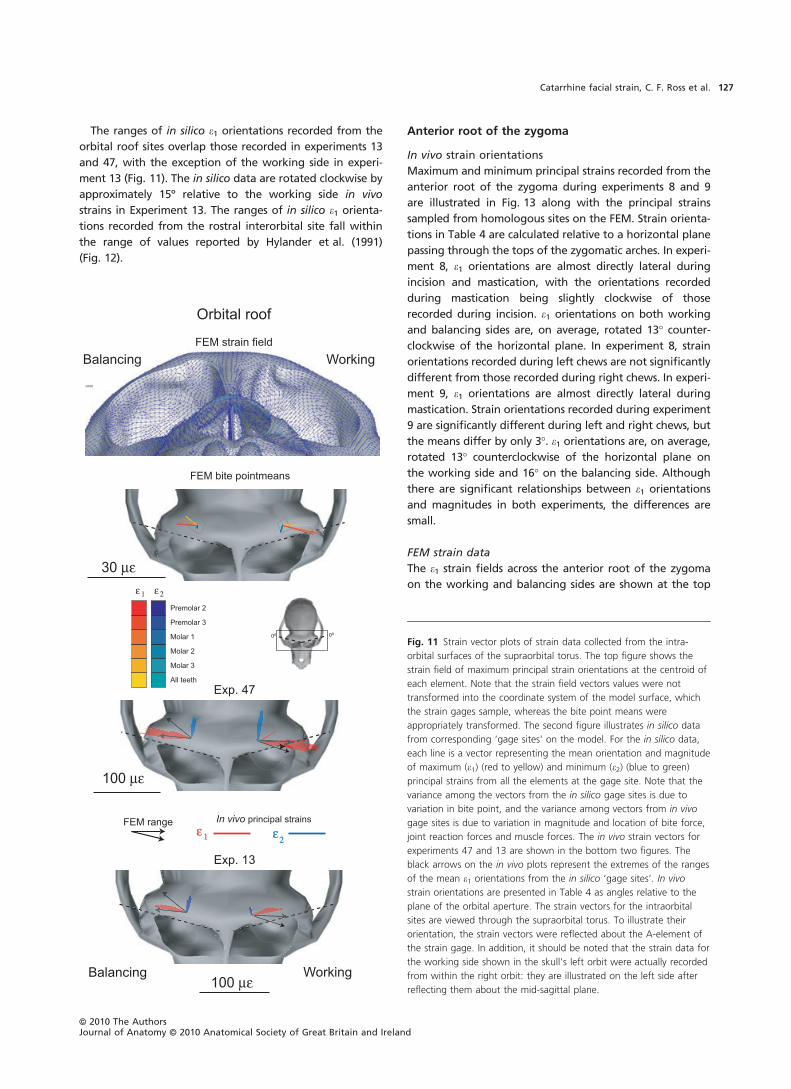
The ranges of in silico e1 orientations recorded from the
orbital roof sites overlap those recorded in experiments 13
and 47, with the exception of the working side in experi-
ment 13 (Fig. 11). The in silico data are rotated clockwise by
approximately 15º relative to the working side in vivo
strains in Experiment 13. The ranges of in silico e1 orienta-
tions recorded from the rostral interorbital site fall within
the range of values reported by Hylander et al. (1991)
(Fig. 12).
Anterior root of the zygoma
In vivo strain orientations
Maximum and minimum principal strains recorded from the
anterior root of the zygoma during experiments 8 and 9
are illustrated in Fig. 13 along with the principal strains
sampled from homologous sites on the FEM. Strain orienta-
tions in Table 4 are calculated relative to a horizontal plane
passing through the tops of the zygomatic arches. In experi-
ment 8, e1 orientations are almost directly lateral during
incision and mastication, with the orientations recorded
during mastication being slightly clockwise of those
recorded during incision. e1 orientations on both working
and balancing sides are, on average, rotated 13� counter-
clockwise of the horizontal plane. In experiment 8, strain
orientations recorded during left chews are not significantly
different from those recorded during right chews. In experi-
ment 9, e1 orientations are almost directly lateral during
mastication. Strain orientations recorded during experiment
9 are significantly different during left and right chews, but
the means differ by only 3�. e1 orientations are, on average,
rotated 13� counterclockwise of the horizontal plane on
the working side and 16� on the balancing side. Although
there are significant relationships between e1 orientations
and magnitudes in both experiments, the differences are
small.
FEM strain data
The e1 strain fields across the anterior root of the zygoma
on the working and balancing sides are shown at the top
100 με
0o0o
ε1 ε2
Exp. 47
In vivo principal strains
Exp. 13
WorkingBalancing100 με
Orbital roof
30 με
FEM strain field
FEM range
Balancing Working
Premolar 2
Premolar 3
Molar 1
Molar 2
Molar 3
All teeth
FEM bite pointmeans
ε1 ε2
Fig. 11 Strain vector plots of strain data collected from the intra-
orbital surfaces of the supraorbital torus. The top figure shows the
strain field of maximum principal strain orientations at the centroid of
each element. Note that the strain field vectors values were not
transformed into the coordinate system of the model surface, which
the strain gages sample, whereas the bite point means were
appropriately transformed. The second figure illustrates in silico data
from corresponding ‘gage sites’ on the model. For the in silico data,
each line is a vector representing the mean orientation and magnitude
of maximum (e1) (red to yellow) and minimum (e2) (blue to green)
principal strains from all the elements at the gage site. Note that the
variance among the vectors from the in silico gage sites is due to
variation in bite point, and the variance among vectors from in vivo
gage sites is due to variation in magnitude and location of bite force,
joint reaction forces and muscle forces. The in vivo strain vectors for
experiments 47 and 13 are shown in the bottom two figures. The
black arrows on the in vivo plots represent the extremes of the ranges
of the mean e1 orientations from the in silico ‘gage sites’. In vivo
strain orientations are presented in Table 4 as angles relative to the
plane of the orbital aperture. The strain vectors for the intraorbital
sites are viewed through the supraorbital torus. To illustrate their
orientation, the strain vectors were reflected about the A-element of
the strain gage. In addition, it should be noted that the strain data for
the working side shown in the skull’s left orbit were actually recorded
from within the right orbit: they are illustrated on the left side after
reflecting them about the mid-sagittal plane.
ªª 2010 The AuthorsJournal of Anatomy ªª 2010 Anatomical Society of Great Britain and Ireland
Catarrhine facial strain, C. F. Ross et al. 127
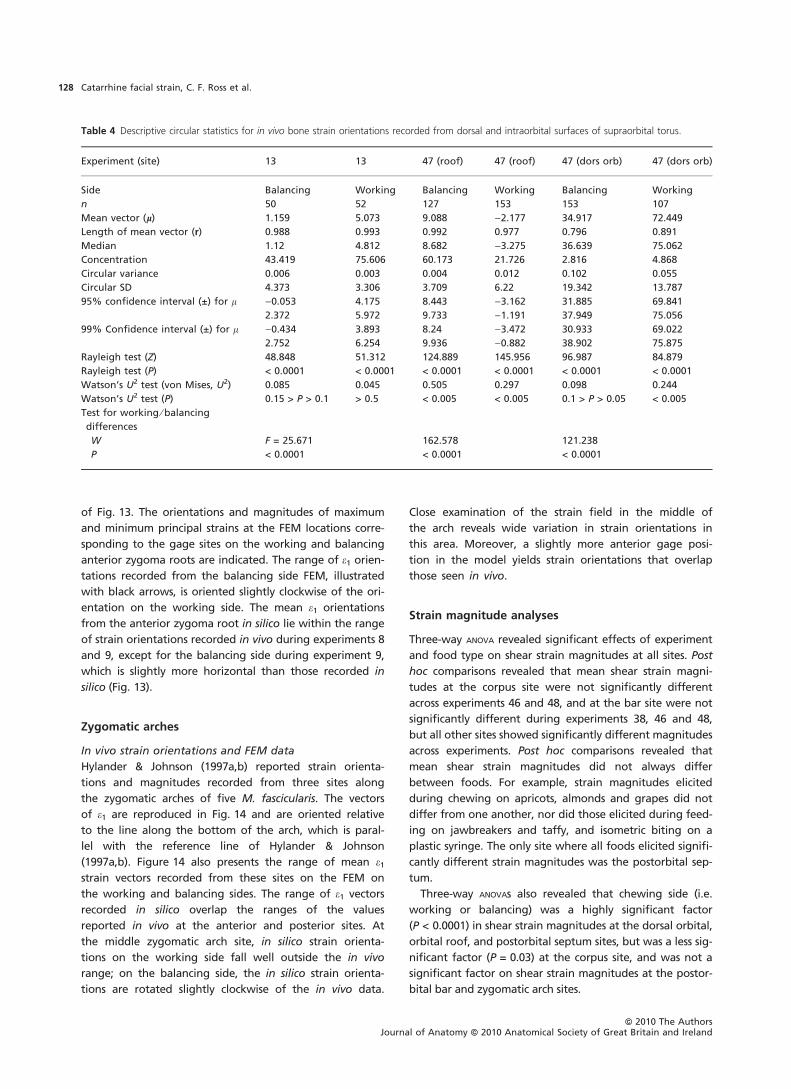
of Fig. 13. The orientations and magnitudes of maximum
and minimum principal strains at the FEM locations corre-
sponding to the gage sites on the working and balancing
anterior zygoma roots are indicated. The range of e1 orien-
tations recorded from the balancing side FEM, illustrated
with black arrows, is oriented slightly clockwise of the ori-
entation on the working side. The mean e1 orientations
from the anterior zygoma root in silico lie within the range
of strain orientations recorded in vivo during experiments 8
and 9, except for the balancing side during experiment 9,
which is slightly more horizontal than those recorded in
silico (Fig. 13).
Zygomatic arches
In vivo strain orientations and FEM data
Hylander & Johnson (1997a,b) reported strain orienta-
tions and magnitudes recorded from three sites along
the zygomatic arches of five M. fascicularis. The vectors
of e1 are reproduced in Fig. 14 and are oriented relative
to the line along the bottom of the arch, which is paral-
lel with the reference line of Hylander & Johnson
(1997a,b). Figure 14 also presents the range of mean e1
strain vectors recorded from these sites on the FEM on
the working and balancing sides. The range of e1 vectors
recorded in silico overlap the ranges of the values
reported in vivo at the anterior and posterior sites. At
the middle zygomatic arch site, in silico strain orienta-
tions on the working side fall well outside the in vivo
range; on the balancing side, the in silico strain orienta-
tions are rotated slightly clockwise of the in vivo data.
Close examination of the strain field in the middle of
the arch reveals wide variation in strain orientations in
this area. Moreover, a slightly more anterior gage posi-
tion in the model yields strain orientations that overlap
those seen in vivo.
Strain magnitude analyses
Three-way ANOVA revealed significant effects of experiment
and food type on shear strain magnitudes at all sites. Post
hoc comparisons revealed that mean shear strain magni-
tudes at the corpus site were not significantly different
across experiments 46 and 48, and at the bar site were not
significantly different during experiments 38, 46 and 48,
but all other sites showed significantly different magnitudes
across experiments. Post hoc comparisons revealed that
mean shear strain magnitudes did not always differ
between foods. For example, strain magnitudes elicited
during chewing on apricots, almonds and grapes did not
differ from one another, nor did those elicited during feed-
ing on jawbreakers and taffy, and isometric biting on a
plastic syringe. The only site where all foods elicited signifi-
cantly different strain magnitudes was the postorbital sep-
tum.
Three-way ANOVAs also revealed that chewing side (i.e.
working or balancing) was a highly significant factor
(P < 0.0001) in shear strain magnitudes at the dorsal orbital,
orbital roof, and postorbital septum sites, but was a less sig-
nificant factor (P = 0.03) at the corpus site, and was not a
significant factor on shear strain magnitudes at the postor-
bital bar and zygomatic arch sites.
Table 4 Descriptive circular statistics for in vivo bone strain orientations recorded from dorsal and intraorbital surfaces of supraorbital torus.
Experiment (site) 13 13 47 (roof) 47 (roof) 47 (dors orb) 47 (dors orb)
Side Balancing Working Balancing Working Balancing Working
n 50 52 127 153 153 107
Mean vector (l) 1.159 5.073 9.088 )2.177 34.917 72.449
Length of mean vector (r) 0.988 0.993 0.992 0.977 0.796 0.891
Median 1.12 4.812 8.682 )3.275 36.639 75.062
Concentration 43.419 75.606 60.173 21.726 2.816 4.868
Circular variance 0.006 0.003 0.004 0.012 0.102 0.055
Circular SD 4.373 3.306 3.709 6.22 19.342 13.787
95% confidence interval (±) for l )0.053 4.175 8.443 )3.162 31.885 69.841
2.372 5.972 9.733 )1.191 37.949 75.056
99% Confidence interval (±) for l )0.434 3.893 8.24 )3.472 30.933 69.022
2.752 6.254 9.936 )0.882 38.902 75.875
Rayleigh test (Z) 48.848 51.312 124.889 145.956 96.987 84.879
Rayleigh test (P) < 0.0001 < 0.0001 < 0.0001 < 0.0001 < 0.0001 < 0.0001
Watson’s U2 test (von Mises, U2) 0.085 0.045 0.505 0.297 0.098 0.244
Watson’s U2 test (P) 0.15 > P > 0.1 > 0.5 < 0.005 < 0.005 0.1 > P > 0.05 < 0.005
Test for working ⁄ balancing
differences
W F = 25.671 162.578 121.238
P < 0.0001 < 0.0001 < 0.0001
ªª 2010 The AuthorsJournal of Anatomy ªª 2010 Anatomical Society of Great Britain and Ireland
Catarrhine facial strain, C. F. Ross et al.128

Strain gradients
Pairwise t-tests of mean differences in shear strain recorded
simultaneously across the working or balancing sides of the
face were possible in 15 cases. On the working side, the rank
order of mean shear strains from highest to lowest was sepa-
rated by significant mean differences in le: arch (389), cor-
pus (318), bar (69), temporal line (20), septum (17), and
dorsal orbital + orbital roof. On the balancing side, the rank
order of mean shear strains was separated from highest to
lowest by significant mean differences in le: arch (390), cor-
pus (400), bar (343), dorsal orbital (103) and orbital roof (26).
Independent sample t-tests of strain magnitudes found
shear strains to be significantly different and higher at the
bar, arch, corpus and dorsal orbital sites when they were on
the balancing side. The postorbital septum showed higher
strains on the working than the balancing sides, and the
orbital roof evinced no significant difference.
Figure 15 compares the shear strain (cmax) magnitudes
recorded in vivo with those recorded from the FEM at 20
sites. At six sites the raw FEM data fall below the range of
the in vivo data. This may be because the skull modeled is
larger and ⁄ or stiffer than that of the animals from which
data were gathered. To account for this possibility, the data
were standardized by dividing all the strain magnitudes by
the strains at the site with the highest strain magnitude
(anterior arch). When this was done, most of the FEM val-
ues fall within the in vivo range, with the exception of the
left septum sites, and the right postorbital bar and dorsal
orbital sites. Notable rank order differences between the
datasets are the low values on the balancing side (right)
zygomatic arch, balancing side (right) postorbital bar and
In vivo right chews In vivo left chews
5 με
50 με
FEM, simulated left chews
Premolar 2
Premolar 3
Molar 1
Molar 2
Molar 3
All teeth
In vivo ε Range & mean
1
In vivo data(Hylander et al. 1991)
Rostral interorbitalIn vivo and FEM
ε1 ε2
Fig. 12 Strain vector plots of strain data collected from the rostral interorbital gage site in vivo and from the FEM. The top figure illustrates in
silico data from the rostral interorbital ‘gage site’ on the model. Each line is a vector representing the mean orientation and magnitude of
maximum (e1) (red to yellow) and minimum (e2) (blue to green) principal strains from all the elements at the gage site. Note that the variance
among the vectors from the in silico gage sites is due to variation in bite point, and the variance among vectors from in vivo gage sites is due to
variation in magnitude and location of bite force, joint reaction forces and muscle forces. The in vivo strain vectors for the data presented by
Hylander et al. (1991) are shown in the bottom two figures. The red lines indicate the means and ranges of the data. The black arrows on the in
vivo plots represent the extremes of the ranges of the mean e1 orientations from the in silico ‘gage’ sites.
ªª 2010 The AuthorsJournal of Anatomy ªª 2010 Anatomical Society of Great Britain and Ireland
Catarrhine facial strain, C. F. Ross et al. 129
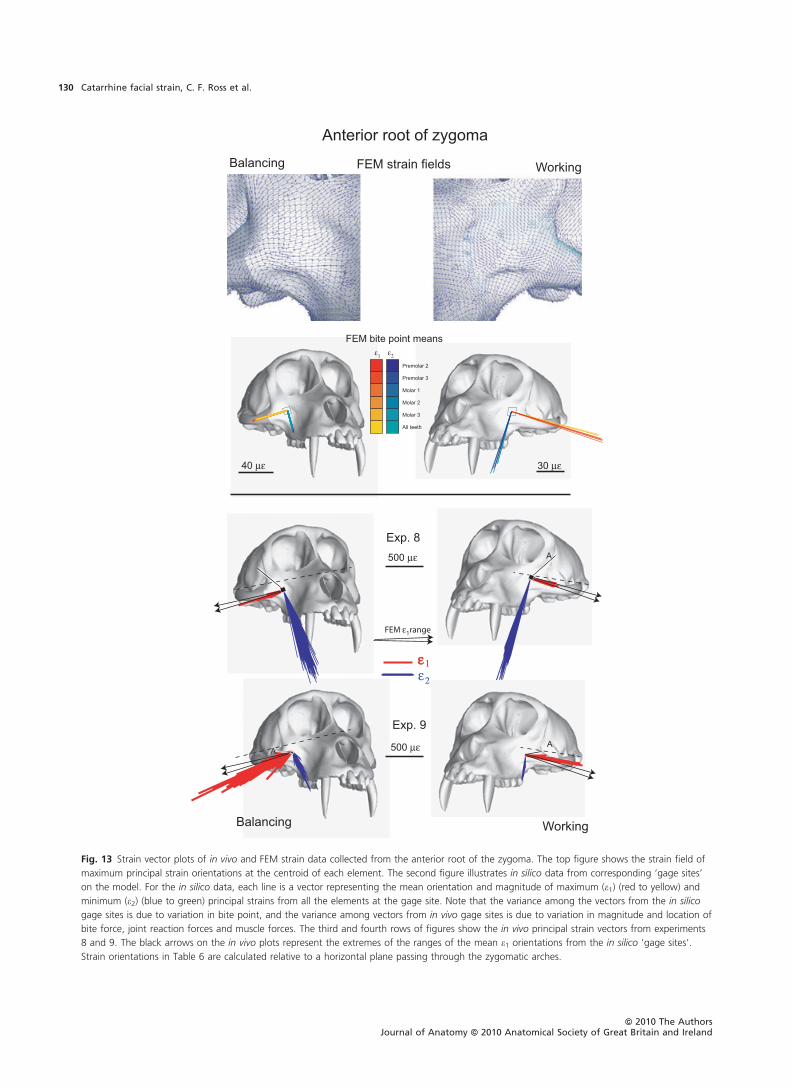
A 500 με
εεε
11
2
500 με
40 με
Balancing Working
Anterior root of zygoma
30 με
Exp. 8
FEM ε1range
A
FEM strain fields
Premolar 2
Premolar 3
Molar 1
Molar 2
Molar 3
All teeth
FEM bite point means
Exp. 9
Balancing
ε1 ε2
A
Working
Fig. 13 Strain vector plots of in vivo and FEM strain data collected from the anterior root of the zygoma. The top figure shows the strain field of
maximum principal strain orientations at the centroid of each element. The second figure illustrates in silico data from corresponding ‘gage sites’
on the model. For the in silico data, each line is a vector representing the mean orientation and magnitude of maximum (e1) (red to yellow) and
minimum (e2) (blue to green) principal strains from all the elements at the gage site. Note that the variance among the vectors from the in silico
gage sites is due to variation in bite point, and the variance among vectors from in vivo gage sites is due to variation in magnitude and location of
bite force, joint reaction forces and muscle forces. The third and fourth rows of figures show the in vivo principal strain vectors from experiments
8 and 9. The black arrows on the in vivo plots represent the extremes of the ranges of the mean e1 orientations from the in silico ‘gage sites’.
Strain orientations in Table 6 are calculated relative to a horizontal plane passing through the zygomatic arches.
ªª 2010 The AuthorsJournal of Anatomy ªª 2010 Anatomical Society of Great Britain and Ireland
Catarrhine facial strain, C. F. Ross et al.130
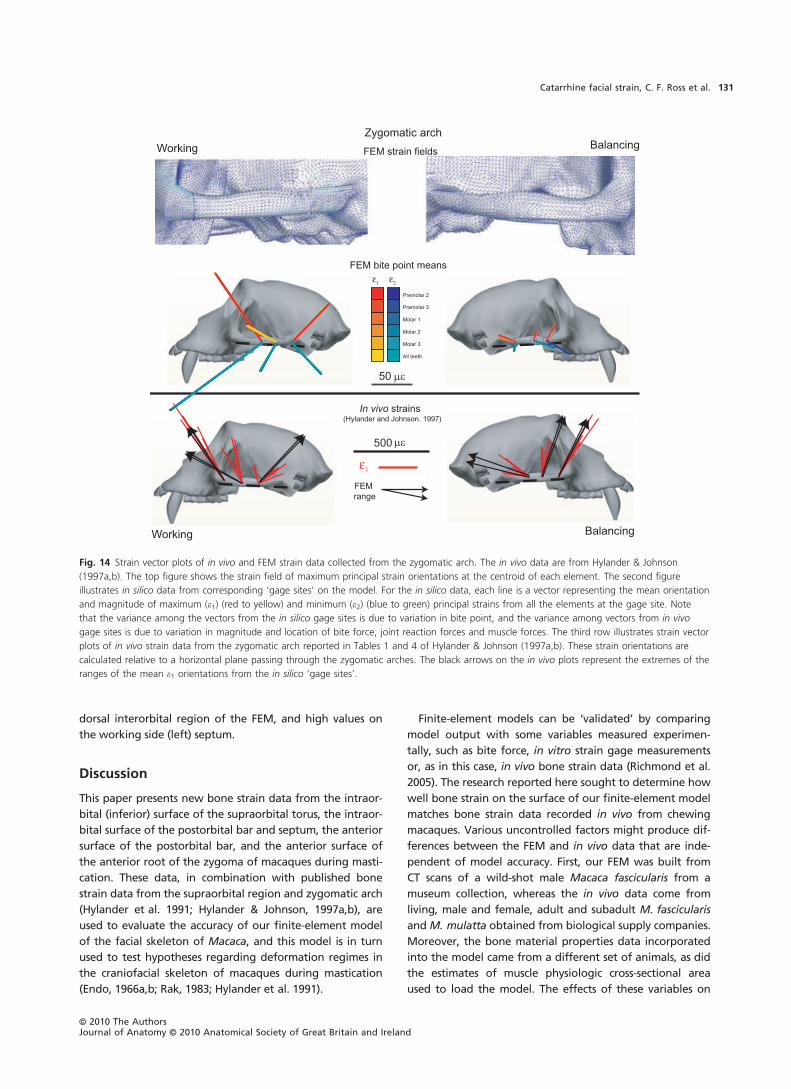
dorsal interorbital region of the FEM, and high values on
the working side (left) septum.
Discussion
This paper presents new bone strain data from the intraor-
bital (inferior) surface of the supraorbital torus, the intraor-
bital surface of the postorbital bar and septum, the anterior
surface of the postorbital bar, and the anterior surface of
the anterior root of the zygoma of macaques during masti-
cation. These data, in combination with published bone
strain data from the supraorbital region and zygomatic arch
(Hylander et al. 1991; Hylander & Johnson, 1997a,b), are
used to evaluate the accuracy of our finite-element model
of the facial skeleton of Macaca, and this model is in turn
used to test hypotheses regarding deformation regimes in
the craniofacial skeleton of macaques during mastication
(Endo, 1966a,b; Rak, 1983; Hylander et al. 1991).
Finite-element models can be ‘validated’ by comparing
model output with some variables measured experimen-
tally, such as bite force, in vitro strain gage measurements
or, as in this case, in vivo bone strain data (Richmond et al.
2005). The research reported here sought to determine how
well bone strain on the surface of our finite-element model
matches bone strain data recorded in vivo from chewing
macaques. Various uncontrolled factors might produce dif-
ferences between the FEM and in vivo data that are inde-
pendent of model accuracy. First, our FEM was built from
CT scans of a wild-shot male Macaca fascicularis from a
museum collection, whereas the in vivo data come from
living, male and female, adult and subadult M. fascicularis
and M. mulatta obtained from biological supply companies.
Moreover, the bone material properties data incorporated
into the model came from a different set of animals, as did
the estimates of muscle physiologic cross-sectional area
used to load the model. The effects of these variables on
Working Balancing
In vivo strains(Hylander and Johnson. 1997)
FEM strain fields
ε1
Zygomatic arch
FEM range
Premolar 2
Premolar 3
Molar 1
Molar 2
Molar 3
All teeth
FEM bite point means
Working Balancing
ε1 ε2
Fig. 14 Strain vector plots of in vivo and FEM strain data collected from the zygomatic arch. The in vivo data are from Hylander & Johnson
(1997a,b). The top figure shows the strain field of maximum principal strain orientations at the centroid of each element. The second figure
illustrates in silico data from corresponding ‘gage sites’ on the model. For the in silico data, each line is a vector representing the mean orientation
and magnitude of maximum (e1) (red to yellow) and minimum (e2) (blue to green) principal strains from all the elements at the gage site. Note
that the variance among the vectors from the in silico gage sites is due to variation in bite point, and the variance among vectors from in vivo
gage sites is due to variation in magnitude and location of bite force, joint reaction forces and muscle forces. The third row illustrates strain vector
plots of in vivo strain data from the zygomatic arch reported in Tables 1 and 4 of Hylander & Johnson (1997a,b). These strain orientations are
calculated relative to a horizontal plane passing through the zygomatic arches. The black arrows on the in vivo plots represent the extremes of the
ranges of the mean e1 orientations from the in silico ‘gage sites’.
ªª 2010 The AuthorsJournal of Anatomy ªª 2010 Anatomical Society of Great Britain and Ireland
Catarrhine facial strain, C. F. Ross et al. 131

comparisons between strain patterns on the surface of the
model and those collected in vivo cannot be predicted at
present. Secondly, although all care was taken to carefully
document the position and orientation of the strain gages
in vivo, these cannot be determined as precisely as can in
silico ‘gage sites’. Therefore, homology of in vivo and in
silico gage sites cannot be guaranteed. Thirdly, the in vivo
strain data were collected while the animals chewed on
food of varying material properties and at various undocu-
mented positions along the toothrow.
Despite these factors, there is a fairly good match
between in vivo and in silico surface strains. Strait et al.
(2005) summarized the strain magnitude data: this paper
focuses on the strain orientation results, summarized in
Table 5. The range of e1 orientations at the two in silico
‘gage sites’ on the anterior surface of the working side post-
orbital bar fell within the range of three of five in vivo
experiments. All of the in vivo e1 orientations on the ante-
rior surface of the working side postorbital bar could be
found somewhere on the anterior surface of the FEM post-
orbital bar, albeit in small patches. The e1 orientations
recorded in silico from the balancing side postorbital bar
replicated one of the in vivo experiments and were very
close to two others. The average in silico e1 orientations
recorded from the working side zygomatic septum fell
within the range of in vivo values recorded during one
experiment and the average in silico e1 orientations
recorded from the balancing side zygomatic septum are
within the range of values recorded during two in vivo
experiments and very close to the third. The average in sil-
ico e1 orientations from the dorsal interorbital and working
and balancing side dorsal orbital sites fall within the ranges
reported by Hylander et al. (1991). The in silico e1 orienta-
tions on the orbital roof overlap with the in vivo ranges.
The in silico e1 orientations on the anterior root of the
zygoma and from the anterior and posterior gage sites on
both the working and balancing side zygomatic arches all
fall within the ranges of our in vivo results and those pub-
lished previously (Hylander et al. 1991). The in silico data do
not overlap with those gathered in vivo from the frontal
septum site. It should be noted that at all of the sites where
there was poor or variable correspondence between the
1.5
1.0
0.5
0.0
Sta
ndar
dize
d γ
max
L an
terio
r zy
gom
a ro
ot
L P
osto
rbita
l bar
L do
rsal
orb
ital
L an
terio
r ar
ch
L m
iddl
e ar
ch
L po
ster
ior
arch
L or
bita
l roo
f
L fr
onta
l sep
tum
L zy
gom
atic
sep
tum
R a
nter
ior
zygo
ma
root
R P
osto
rbita
l bar
R d
orsa
l orb
ital
R a
nter
ior
arch
R m
iddl
e ar
ch
R p
oste
rior
arch
R o
rbita
l roo
f
R fr
onta
l sep
tum
R z
ygom
atic
sep
tum
Dor
sal i
nter
orbi
tal
Ros
tral
inte
rorb
ital
1400
1200
1000
800
600
400
200
0
γ max
(με)
In vivo range
In silico mean In silico bite points
In vivo mean
Fig. 15 Plots comparing in vivo and FEM cmax values at 20 sites. L = left side = biting side, R = right = balancing side. Top figure presents absolute
values of cmax; bottom figure shows cmax standardized by dividing the in vivo data by the average value recorded at the anterior zygomatic arch
site and the in silico data by the largest value recorded at the same site. The in vivo mean is the average across all data recorded at that site; the
in vivo range was estimated as the largest and smallest values across all experiments of the mean ± 2 SD. In vivo data are from apple chewing
data collected in this study and published in the literature (Hylander et al., 1991; Hylander & Johnson, 1997a,b; Strait et al., 2005).
ªª 2010 The AuthorsJournal of Anatomy ªª 2010 Anatomical Society of Great Britain and Ireland
Catarrhine facial strain, C. F. Ross et al.132
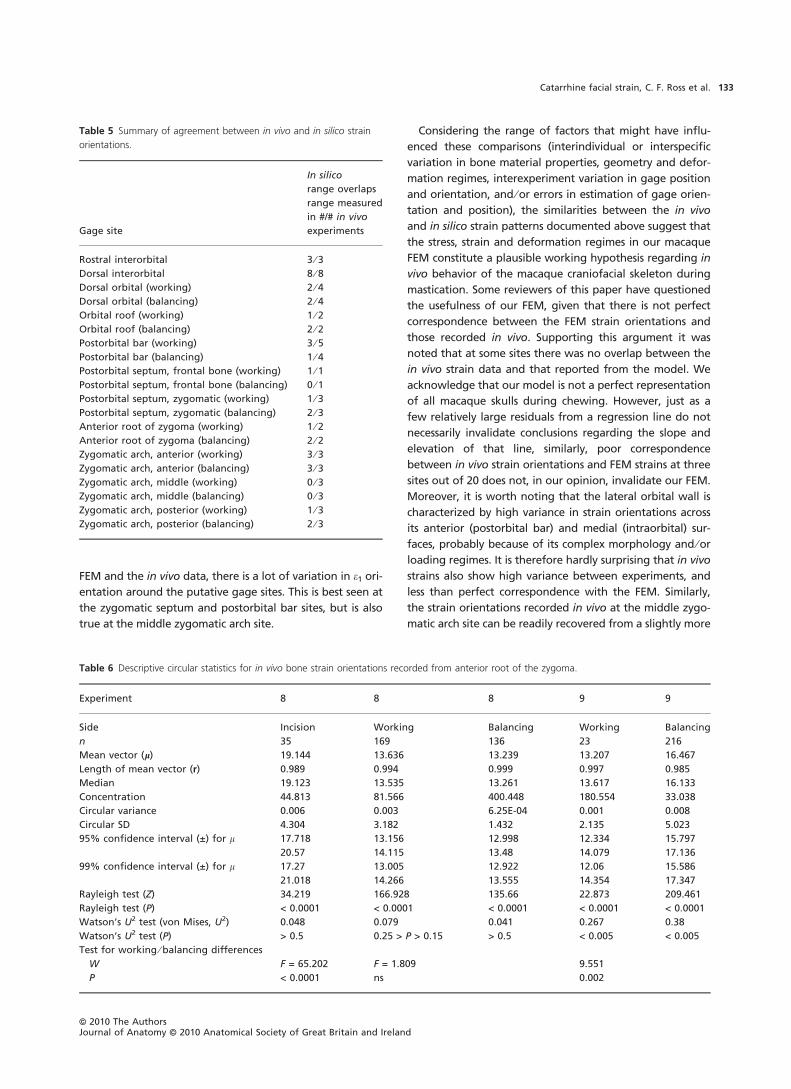
FEM and the in vivo data, there is a lot of variation in e1 ori-
entation around the putative gage sites. This is best seen at
the zygomatic septum and postorbital bar sites, but is also
true at the middle zygomatic arch site.
Considering the range of factors that might have influ-
enced these comparisons (interindividual or interspecific
variation in bone material properties, geometry and defor-
mation regimes, interexperiment variation in gage position
and orientation, and ⁄ or errors in estimation of gage orien-
tation and position), the similarities between the in vivo
and in silico strain patterns documented above suggest that
the stress, strain and deformation regimes in our macaque
FEM constitute a plausible working hypothesis regarding in
vivo behavior of the macaque craniofacial skeleton during
mastication. Some reviewers of this paper have questioned
the usefulness of our FEM, given that there is not perfect
correspondence between the FEM strain orientations and
those recorded in vivo. Supporting this argument it was
noted that at some sites there was no overlap between the
in vivo strain data and that reported from the model. We
acknowledge that our model is not a perfect representation
of all macaque skulls during chewing. However, just as a
few relatively large residuals from a regression line do not
necessarily invalidate conclusions regarding the slope and
elevation of that line, similarly, poor correspondence
between in vivo strain orientations and FEM strains at three
sites out of 20 does not, in our opinion, invalidate our FEM.
Moreover, it is worth noting that the lateral orbital wall is
characterized by high variance in strain orientations across
its anterior (postorbital bar) and medial (intraorbital) sur-
faces, probably because of its complex morphology and ⁄ or
loading regimes. It is therefore hardly surprising that in vivo
strains also show high variance between experiments, and
less than perfect correspondence with the FEM. Similarly,
the strain orientations recorded in vivo at the middle zygo-
matic arch site can be readily recovered from a slightly more
Table 6 Descriptive circular statistics for in vivo bone strain orientations recorded from anterior root of the zygoma.
Experiment 8 8 8 9 9
Side Incision Working Balancing Working Balancing
n 35 169 136 23 216
Mean vector (l) 19.144 13.636 13.239 13.207 16.467
Length of mean vector (r) 0.989 0.994 0.999 0.997 0.985
Median 19.123 13.535 13.261 13.617 16.133
Concentration 44.813 81.566 400.448 180.554 33.038
Circular variance 0.006 0.003 6.25E-04 0.001 0.008
Circular SD 4.304 3.182 1.432 2.135 5.023
95% confidence interval (±) for l 17.718 13.156 12.998 12.334 15.797
20.57 14.115 13.48 14.079 17.136
99% confidence interval (±) for l 17.27 13.005 12.922 12.06 15.586
21.018 14.266 13.555 14.354 17.347
Rayleigh test (Z) 34.219 166.928 135.66 22.873 209.461
Rayleigh test (P) < 0.0001 < 0.0001 < 0.0001 < 0.0001 < 0.0001
Watson’s U2 test (von Mises, U2) 0.048 0.079 0.041 0.267 0.38
Watson’s U2 test (P) > 0.5 0.25 > P > 0.15 > 0.5 < 0.005 < 0.005
Test for working ⁄ balancing differences
W F = 65.202 F = 1.809 9.551
P < 0.0001 ns 0.002
Table 5 Summary of agreement between in vivo and in silico strain
orientations.
Gage site
In silico
range overlaps
range measured
in #/# in vivo
experiments
Rostral interorbital 3 ⁄ 3Dorsal interorbital 8 ⁄ 8Dorsal orbital (working) 2 ⁄ 4Dorsal orbital (balancing) 2 ⁄ 4Orbital roof (working) 1 ⁄ 2Orbital roof (balancing) 2 ⁄ 2Postorbital bar (working) 3 ⁄ 5Postorbital bar (balancing) 1 ⁄ 4Postorbital septum, frontal bone (working) 1 ⁄ 1Postorbital septum, frontal bone (balancing) 0 ⁄ 1Postorbital septum, zygomatic (working) 1 ⁄ 3Postorbital septum, zygomatic (balancing) 2 ⁄ 3Anterior root of zygoma (working) 1 ⁄ 2Anterior root of zygoma (balancing) 2 ⁄ 2Zygomatic arch, anterior (working) 3 ⁄ 3Zygomatic arch, anterior (balancing) 3 ⁄ 3Zygomatic arch, middle (working) 0 ⁄ 3Zygomatic arch, middle (balancing) 0 ⁄ 3Zygomatic arch, posterior (working) 1 ⁄ 3Zygomatic arch, posterior (balancing) 2 ⁄ 3
ªª 2010 The AuthorsJournal of Anatomy ªª 2010 Anatomical Society of Great Britain and Ireland
Catarrhine facial strain, C. F. Ross et al. 133
anterior position on the FEM arch than we originally
hypothesized corresponded to the gage site. In conclusion,
we believe that this model constitutes a better hypothesis
(more accurate, more precise and more testable) than other
hypotheses regarding cranial deformation that refer to sim-
ple geometries and loading regimes (e.g. the skull functions
like a cylinder that is twisted) (Gorke, 1904; Richter, 1920;
Benninghoff, 1925; Bluntschli, 1926; Sicher & Tandler, 1928;
Endo, 1966a,b, 1970, 1973; Roberts & Tattersall, 1974; Couly,
1976; Rak, 1983; Greaves, 1985). We look forward to future
improvements to the model.
Deformation regimes in the circumorbital region
A dynamic view of the deformation of our FEM, available
online (Supporting Information Video S1), provides the
clearest picture of the deformation regime that we hypoth-
esize occurs during mastication in Macaca. The finite-
element model, including its specific geometry and material
properties, and the resulting loading, stress and defor-
mation regimes, is our hypothesis (Chalk et al. 2010).
Nevertheless, the following descriptors provide rough
approximations as to the deformation of the skull of
Macaca during mastication.
Masseter muscle forces bend the zygomatic arches infe-
riorly and twist them about an anteroposteriorly oriented
axis passing through the anterior and posterior roots, as
suggested by Hylander & Johnson (1997a,b). Downward
bending of the zygomatic arches subjects the infraorbital
region and anterior root of the zygoma to shear in coro-
nal planes. Twisting of the zygomatic arch about its long
axis is associated with inferolaterally directed tension act-
ing on the lateral orbital wall, the infraorbital plate, and
the anterior root of the zygoma. On the working side this
deformation twists the working side mid-facial skeleton
about the bite point, pulling the lateral orbital margin in-
ferolaterally. These inferolaterally directed forces do gen-
erate tensile stresses in the lateral orbital wall but,
because the wall is curved, the principal effect of these
forces is bending, or rather ‘unbending’ (cf. Ross &
Hylander, 1996a,b), in the sense that the postorbital bar
bends in such a way as to become less curved. This
‘unbending’ of the lateral orbital wall on the working side
contributes to deformation of the orbital aperture, charac-
terized by increase in diameter along a superomedially–
inferolaterally directed axis accompanied by decrease in
diameter along an inferomedially–superolaterally directed
axis. Figure 16 illustrates the patterns of variation in ten-
sile and compressive strain magnitudes (top figures)
associated with this deformation, as well as a static
illustration of the deformation of the model (bottom).
The lengthening of the orbit along an inferolaterally
oriented axis is associated with concentrations of tensile
strain along the edges parallel with this vector, i.e. the
inferomedial and superolateral corners of the orbit. Sim-
ilarly, compression of the orbit along a superolaterally
directed axis is associated with compressive strain
concentrations in the inferolateral and superomedial
corners.
Inferiorly directed components of deformation of the lat-
eral orbital walls acting on the lateral ends of the supraor-
bital torus bend the supraorbital region in the frontal
plane, resulting in large lateral components to the tensile
strain orientations in the dorsal interorbital region (Fig. 10)
(Hylander et al. 1991). However, as noted by Hylander
et al., the deformation regime in the supraorbital torus is
not a simple one. If the supraorbital torus were a simple
beam bent in frontal planes, the inferior surface would
experience anteriorly directed tensile strains and the supe-
rior surface laterally directed tensile strains. The latter is
only true in the dorsal interorbital region and the former is
not true in the orbital roof. As Fig. 10 illustrates, maximum
principal strain orientations in the dorsal orbital region vary
with location, but with significant anteriorly directed com-
ponents, whereas tensile strains on the inferior surface of
the supraorbital torus (i.e. the roof of the orbit) are laterally
directed.
The dynamic view of the macaque FEM provides insight
into the deformation regime producing these strains. The
inferolaterally directed deformation of the lateral orbital
wall associated with the deformation of the orbital aper-
ture described above produces a region of tensile strain in
the superolateral corner of the orbit. As reported elsewhere
(Ross, 2001), the medial wall of the orbit experiences very
low strain magnitudes during chewing with variable strain
orientations; however, principal tensile strains are oriented
predominantly anteriorly. This orientation of the tensile
strains suggests that the medial orbital wall is subjected to
compressive strains in the plane of the orbital aperture, as
predicted by Fig. 16.
The high strain magnitudes evident in the zygomatic arch
and its anterior root, in conjunction with the high level of
interspecific variation in the morphology of this region,
suggest that the biomechanics and morphology of this
region deserve attention (Fig. 16). An obliquely oriented
field of tensile strain is evident in the upper lateral region
of the anterior root of the zygoma, at the junction of the
root with the lateral orbital wall, and elevated compression
characterizes the inferiorly directed edge of the anterior
zygoma root as it converges on the alveolar process of the
maxilla. At the junction of the inferomedial border of the
anterior root of the zygoma with the snout is a concentra-
tion of both high tensile and high compressive strains, indi-
cating the presence of high shear strains. We hypothesize
that this shear strain concentration is due to the presence
of superiorly directed components of bite force acting med-
ial to this site and inferiorly directed components of masse-
ter muscle force acting lateral to it. The high strain
magnitudes apparent in this region suggest that the mor-
phology of this region of the cranium may reflect selection
for feeding performance.
ªª 2010 The AuthorsJournal of Anatomy ªª 2010 Anatomical Society of Great Britain and Ireland
Catarrhine facial strain, C. F. Ross et al.134
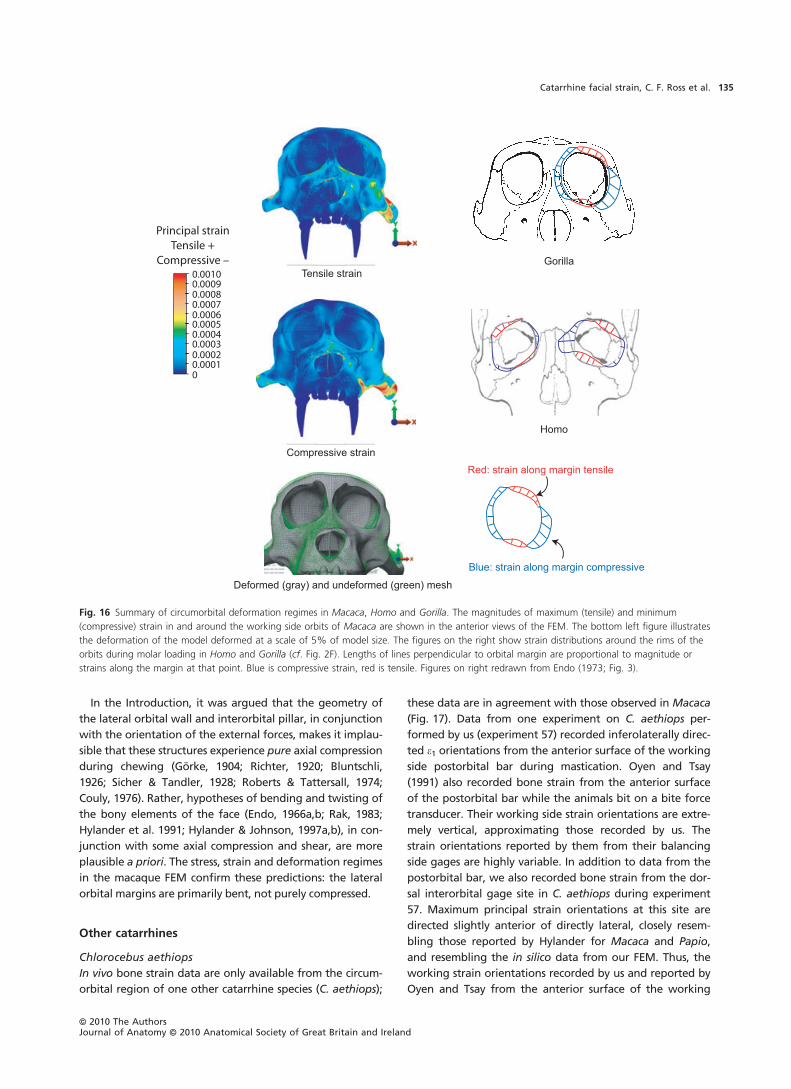
In the Introduction, it was argued that the geometry of
the lateral orbital wall and interorbital pillar, in conjunction
with the orientation of the external forces, makes it implau-
sible that these structures experience pure axial compression
during chewing (Gorke, 1904; Richter, 1920; Bluntschli,
1926; Sicher & Tandler, 1928; Roberts & Tattersall, 1974;
Couly, 1976). Rather, hypotheses of bending and twisting of
the bony elements of the face (Endo, 1966a,b; Rak, 1983;
Hylander et al. 1991; Hylander & Johnson, 1997a,b), in con-
junction with some axial compression and shear, are more
plausible a priori. The stress, strain and deformation regimes
in the macaque FEM confirm these predictions: the lateral
orbital margins are primarily bent, not purely compressed.
Other catarrhines
Chlorocebus aethiops
In vivo bone strain data are only available from the circum-
orbital region of one other catarrhine species (C. aethiops);
these data are in agreement with those observed in Macaca
(Fig. 17). Data from one experiment on C. aethiops per-
formed by us (experiment 57) recorded inferolaterally direc-
ted e1 orientations from the anterior surface of the working
side postorbital bar during mastication. Oyen and Tsay
(1991) also recorded bone strain from the anterior surface
of the postorbital bar while the animals bit on a bite force
transducer. Their working side strain orientations are extre-
mely vertical, approximating those recorded by us. The
strain orientations reported by them from their balancing
side gages are highly variable. In addition to data from the
postorbital bar, we also recorded bone strain from the dor-
sal interorbital gage site in C. aethiops during experiment
57. Maximum principal strain orientations at this site are
directed slightly anterior of directly lateral, closely resem-
bling those reported by Hylander for Macaca and Papio,
and resembling the in silico data from our FEM. Thus, the
working strain orientations recorded by us and reported by
Oyen and Tsay from the anterior surface of the working
Tensile strain
Deformed (gray) and undeformed (green) mesh
0.00100.00090.00080.00070.00060.00050.00040.00030.00020.00010
Principal strainTensile +
Compressive –
Compressive strain
Gorilla
Homo
Red: strain along margin tensile
Blue: strain along margin compressive
Fig. 16 Summary of circumorbital deformation regimes in Macaca, Homo and Gorilla. The magnitudes of maximum (tensile) and minimum
(compressive) strain in and around the working side orbits of Macaca are shown in the anterior views of the FEM. The bottom left figure illustrates
the deformation of the model deformed at a scale of 5% of model size. The figures on the right show strain distributions around the rims of the
orbits during molar loading in Homo and Gorilla (cf. Fig. 2F). Lengths of lines perpendicular to orbital margin are proportional to magnitude or
strains along the margin at that point. Blue is compressive strain, red is tensile. Figures on right redrawn from Endo (1973; Fig. 3).
ªª 2010 The AuthorsJournal of Anatomy ªª 2010 Anatomical Society of Great Britain and Ireland
Catarrhine facial strain, C. F. Ross et al. 135
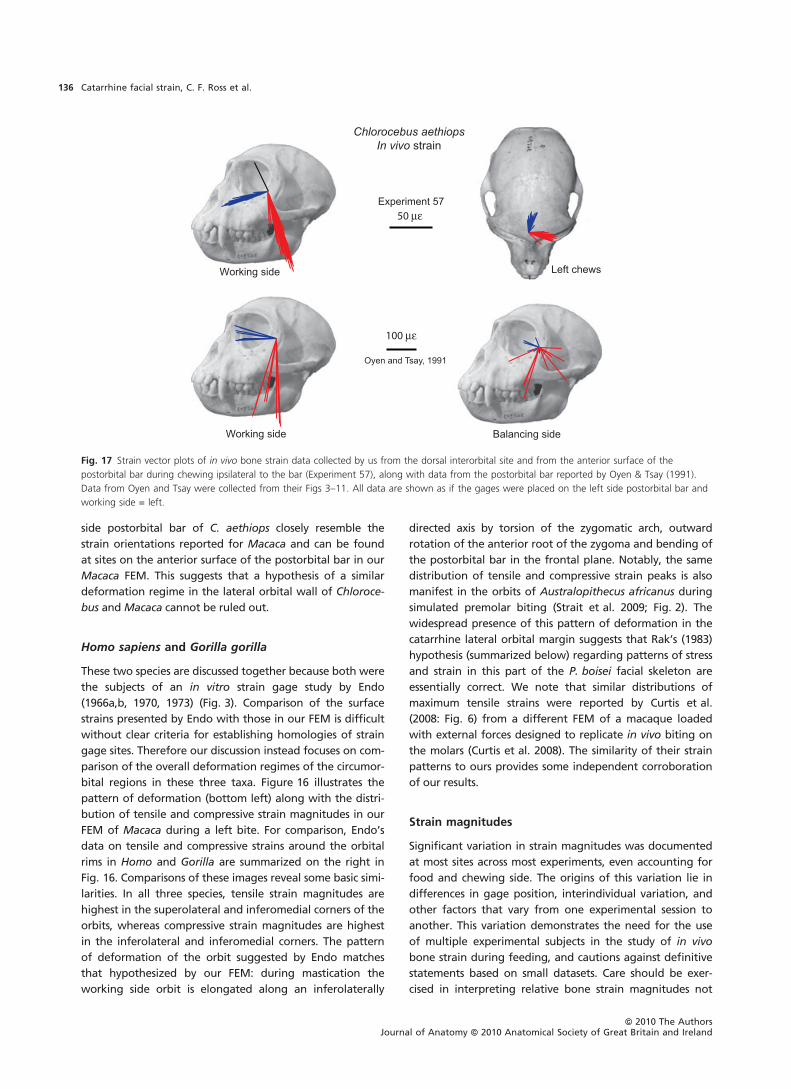
side postorbital bar of C. aethiops closely resemble the
strain orientations reported for Macaca and can be found
at sites on the anterior surface of the postorbital bar in our
Macaca FEM. This suggests that a hypothesis of a similar
deformation regime in the lateral orbital wall of Chloroce-
bus and Macaca cannot be ruled out.
Homo sapiens and Gorilla gorilla
These two species are discussed together because both were
the subjects of an in vitro strain gage study by Endo
(1966a,b, 1970, 1973) (Fig. 3). Comparison of the surface
strains presented by Endo with those in our FEM is difficult
without clear criteria for establishing homologies of strain
gage sites. Therefore our discussion instead focuses on com-
parison of the overall deformation regimes of the circumor-
bital regions in these three taxa. Figure 16 illustrates the
pattern of deformation (bottom left) along with the distri-
bution of tensile and compressive strain magnitudes in our
FEM of Macaca during a left bite. For comparison, Endo’s
data on tensile and compressive strains around the orbital
rims in Homo and Gorilla are summarized on the right in
Fig. 16. Comparisons of these images reveal some basic simi-
larities. In all three species, tensile strain magnitudes are
highest in the superolateral and inferomedial corners of the
orbits, whereas compressive strain magnitudes are highest
in the inferolateral and inferomedial corners. The pattern
of deformation of the orbit suggested by Endo matches
that hypothesized by our FEM: during mastication the
working side orbit is elongated along an inferolaterally
directed axis by torsion of the zygomatic arch, outward
rotation of the anterior root of the zygoma and bending of
the postorbital bar in the frontal plane. Notably, the same
distribution of tensile and compressive strain peaks is also
manifest in the orbits of Australopithecus africanus during
simulated premolar biting (Strait et al. 2009; Fig. 2). The
widespread presence of this pattern of deformation in the
catarrhine lateral orbital margin suggests that Rak’s (1983)
hypothesis (summarized below) regarding patterns of stress
and strain in this part of the P. boisei facial skeleton are
essentially correct. We note that similar distributions of
maximum tensile strains were reported by Curtis et al.
(2008: Fig. 6) from a different FEM of a macaque loaded
with external forces designed to replicate in vivo biting on
the molars (Curtis et al. 2008). The similarity of their strain
patterns to ours provides some independent corroboration
of our results.
Strain magnitudes
Significant variation in strain magnitudes was documented
at most sites across most experiments, even accounting for
food and chewing side. The origins of this variation lie in
differences in gage position, interindividual variation, and
other factors that vary from one experimental session to
another. This variation demonstrates the need for the use
of multiple experimental subjects in the study of in vivo
bone strain during feeding, and cautions against definitive
statements based on small datasets. Care should be exer-
cised in interpreting relative bone strain magnitudes not
Fig. 17 Strain vector plots of in vivo bone strain data collected by us from the dorsal interorbital site and from the anterior surface of the
postorbital bar during chewing ipsilateral to the bar (Experiment 57), along with data from the postorbital bar reported by Oyen & Tsay (1991).
Data from Oyen and Tsay were collected from their Figs 3–11. All data are shown as if the gages were placed on the left side postorbital bar and
working side = left.
ªª 2010 The AuthorsJournal of Anatomy ªª 2010 Anatomical Society of Great Britain and Ireland
Catarrhine facial strain, C. F. Ross et al.136
recorded simultaneously from different sites (Hylander
et al. 1991). Note also that our strain magnitudes recorded
from the corpus are higher on the balancing than on the
working side. This difference runs counter to observations
across a large number of animals by Hylander et al. (1991),
suggesting that the animals in the present study might have
chewed harder when the food was contralateral as com-
pared to ipsilateral to the gages. With these caveats, several
observations can be made.
First, there were no significant differences between in
vivo working and balancing strain magnitudes at the post-
orbital bar and zygomatic arch sites. This suggests that bite
forces may not directly affect strain magnitudes in the post-
orbital bar and anterior root of the zygoma, and that the
external force(s) acting on these structures during mastica-
tion are primarily produced by muscles of mastication. It is
notable that strain orientations at the anterior root of the
zygoma changed only very slightly with changes in chewing
side (Fig. 13), as did strain orientations in the postorbital
bar during most experiments (Fig. 6). Moreover, strain ori-
entations on orbital roof sites (experiments 13 and 47) show
little variance with chewing side.
Secondly, on both working and balancing sides, strains in
the zygomatic arch and mandibular corpus are higher than
those in the circumorbital region, and the postorbital bar
exhibits the highest strains among the circumorbital sites.
On the working side the postorbital septum exhibits higher
strains compared with the supraorbital region. The reverse
is true on the balancing side, but both of these areas experi-
ence low strains compared with the mandibular corpus,
zygomatic arch and anterior root of the zygoma (Fig. 15).
These results, mirrored by FEA of Pan troglodytes (Wroe
et al. 2007), confirm the conclusion that, if optimality is
defined as maximum strength with minimum material, the
postorbital septum and supraorbital regions of the catar-
rhine facial skeleton are not optimized for resisting and
transmitting external forces experienced during mastication
(Hylander et al. 1991). While highly strained areas of the
facial skeleton might be more closely optimized for feeding,
other hypotheses must be invoked to explain the presence
of browridges and plates of circumorbital bone in maca-
ques (Ravosa, 1991; Ravosa et al. 2000b; Ross, 2001; Ross &
Metzger, 2004).
The lateral orbital wall of robust australopithecines
Rak (1983) argued that differences between the P. boisei
facial frame (Fig. 4) and that of other hominins [elevated
glabella, inferolaterally sloping frontal member (represent-
ing the supraorbital tori) contacting a single zygomaticoal-
veolar member at the wide flaring ‘visor-like’ anterior
zygoma root] (Fig. 44 from Rak, 1983) functioned to
decrease bending moments acting on the circumorbital
region, thereby improving the ability of the facial skeleton
to resist powerful external forces. Rak argued that the facial
framework of P. boisei needed these modifications because
it was subjected to unusually large masseter muscle forces
that acted relatively far rostral and lateral relative to the lat-
eral orbital wall. Rak hypothesized that, as a result, P. bois-
ei’s lateral orbital wall was subjected to powerful
inferolaterally directed forces that would generate bending
stresses at the junctions between the frontozygomatic
members, between the superior frontozygomatic member
and supraorbital torus, and between the supraorbital torus
and glabella (Rak, 1983: Fig. 41). He argued that, by
straightening out the junction between the frontozygomat-
ic member (lateral orbital wall) and the supraorbital torus,
creating the characteristic inferolaterally sloping supraor-
bital torus and ‘sad eyes’ appearance of the P. boisei skull,
and by creating the ‘visor-like’ anterior zygoma root, these
bending stresses are minimized and tensile stresses predom-
inate in the lateral orbital wall.
The data presented here suggest that in catarrhines the
circumorbital region, including the lateral orbital wall, is
indeed subjected to bending in the frontal plane. More-
over, similarities across hominids, including P. boisei, in the
position and orientation of masseter muscle forces relative
to the lateral orbital wall suggest that the circumorbital
regions of all hominids, including P. boisei, are and were
subjected to high bending moments in the frontal plane.
However, the low in vivo and in silico strain magnitudes in
the lateral orbital wall of Macaca and the low in silico strain
magnitudes predicted for this region of extant hominids
(Wroe et al. 2007) suggest that the size and shape of the
lateral orbital wall is not optimized for resisting these bend-
ing moments. Whether the morphology of the P. boisei lat-
eral orbital wall reflects selection for decreased bending
moments in the lateral orbital wall must await detailed
FEM of the P. boisei cranium: the data presented here sug-
gest this hypothesis is probably not correct.
In contrast with the lateral orbital wall, the high in vivo
and in silico strain magnitudes in the lateral infraorbital
region ⁄ anterior zygoma root of Macaca reported here and
elsewhere (Hylander & Johnson, 1992, 1997a) and the high
in silico strains hypothesized for the anterior zygoma root
of extant (Wroe et al. 2007) and fossil (Strait et al. 2009)
hominids suggest that the biomechanics of this region,
including the zygomatico-alveolar crest, the zygomatic
prominence of A. africanus, the flaring, visor-like zygoma
of P. boisei, the transverse buttress of the intra-orbital
region and the zygomatic arch (Rak, 1983; Kimbel et al.
2004), should be addressed.
Conclusions
In conjunction with the in vivo bone strain data presented
and summarized here, our FEM constitutes the best hypoth-
esis to date regarding stress, strain and deformation
regimes in the cranial skeleton of Macaca during mastica-
tion. Although the model only represents behavior during
ªª 2010 The AuthorsJournal of Anatomy ªª 2010 Anatomical Society of Great Britain and Ireland
Catarrhine facial strain, C. F. Ross et al. 137
unilateral biting ⁄ mastication, it serves as the foundation for
future work on variation in deformation regimes associated
with bite point, food material properties and muscle
recruitment patterns. Although we would prefer to avoid
simplified descriptors of this deformation regime, referring
instead to the model in its entirety as our hypothesis of
deformation, it is reasonable to describe the global defor-
mation of the macaque facial skeleton during mastication
as ‘bending in a frontal plane’ caused in larger part by tor-
sion of the zygomatic arch about its long axis and bending
of the arch in sagittal planes. The similarity of this deforma-
tion regime to those observed in our FEM A. africanus
(Strait et al. 2009) and to those in Endo’s in vitro analyses of
the crania of Homo and Gorilla suggests this may be a com-
mon pattern of deformation in all catarrhine crania. The
extent to which changes in skeletal geometry reflect
changes in the nature or magnitude of this deformation
regime remains to be evaluated.
Acknowledgements
The staff at DLAR, Stony Brook, housed and cared for the ani-
mals. Technical assistance was provided by Brigitte Demes, Susan
Larson, Jack Stern, Hylton Gordon and Mark Bookbinder. Dr.
Clint Rubin generously loaned the bridges used in several of the
experiments. The following students trained animals and
assisted with data collection and analysis: R. Asher, C. Heesy, M.
Irwin and K. Metzger. L. Betti-Nash and R. Markley assisted with
the illustrations. We thank Ian Grosse and Betsy Dumont for
advice and assistance and Sam Cobb and the reviewers for their
comments. This research was funded by Stony Brook University
and NSF Physical Anthropology (BCS 9706676; BCS 0240865; BCS
0725126).
Author contributions
All authors conceived of and designed the research; C.F.R. col-
lected and analyzed the in vivo data; C.F.R., M.B., M.S., L.P.,
B.R., P.D. and D.S. built, loaded and interpreted the FEM; J.I.D.
and C.F.R. wrote the MATLAB code for processing data from the
FEM; J.I.D. extracted surface strain data from the model; C.F.R.
drafted the manuscript. All authors read and commented on
the manuscript.
References
Andrades P, Rosenthal EL, Carroll WR, et al. (2008)
Zygomaticomaxillary buttress reconstruction of midface
defects with the osteocutaneous radial forearm free flap.
Head Neck J Sci Spec Head Neck 30, 1295–1302.
Anton SC (1993) Internal masticatory muscle architecture in the
Japanese macaque and its influence on bony morphology. Am
J Phys Anthropol Suppl 16, 50.
Benninghoff A (1925) Spaltlinien am Knochen, eine Methode
zur Ermittelung der Architektur platter Knochen. Verh Anat
Ges 34, 189–206.
Bluntschli H (1926) Ruckwirkuneg des Kieferapparatus auf den
Gesamyschadel. Z Zahnartzte Orthop 18, 71–85.
Bourke J, Wroe S, Moreno K, et al. (2008) Effects of gape and
tooth position on bite force and skull stress in the dingo
(Canis lupus dingo) using a 3-dimensional finite element
approach. PLoS ONE 3(5): e2200. doi:10.1371/journal.pone.
0002200.
Cartmill M (1970) The Orbits of Arboreal Mammals: A
Reassessment of the Arboreal Theory of Primate Evolution,
pp. 671. Chicago: University of Chicago.
Cartmill M (1975) Primate Origins. Minneapolis: Burgess.
Cartmill M (1980) Morphology, function and evolution of the
anthropoid postorbital septum. In: Evolutionary Biology of
the New World Monkeys and Continental Drift (eds Ciochon
RL, Chiarelli AB), pp. 243–274. New York: Plenum.
Chalk J, Richmond BG, Ross CF, et al. (2010) A finite element
analysis of masticatory stress hypotheses. Am J Phys
Anthropol, doi: 10.1002/ajpa.21416.
Cook RD, Malkus DS, Plesha ME (2002) Concepts and
Applications of Finite Element Analysis. New York: Wiley.
Couly G (1976) La statique osseuse de la face. Rev Belge
Stomatol 77, 420–426.
Curtis N, Kupczik K, O’Higgins P, et al. (2008) Predicting skull
loading: applying multibody dynamics analysis to a macaque
skull. Anat Rec Adv Integr Anat Evol Biol 291, 491–501.
Dally JW, Riley WF (1965) Experimental Stress Analysis. New
York: McGraw Hill.
Dumont ER, Piccirillo J, Grosse IR (2005) Finite-element analysis
of biting behavior and bone stress in the facial skeletons of
bats. Anat Rec A Discov Mol Cell Evol Biol 283A, 319–330.
Endo B (1966a) A biomechanical study of the human facial
skeleton by means of strain-sensitive lacquer. Okajimas Folia
Anat Jpn 42, 205–217.
Endo B (1966b) Experimental studies on the mechanical
significance of the form of the human facial skeleton. J Fac
Sci, Univ Tokyo, Section V III, 1–106.
Endo B (1970) Analysis of stresses around the orbit due to
masseter and temporalis muscles respectively. J Anthropol Soc
Nippon 78, 251–266.
Endo B (1973) Stress analysis on the facial skeleton of gorilla by
means of the wire strain gauge method. Primates 14, 37–45.
Fisher NI (1993) Statistical Analysis of Circular Data. New York:
Cambridge University Press.
Gorke O (1904) Beitrag zur fuktionellen Gestaltung des Schadels
bei den Anthropomorphen und Menschen durch
Untersuchung mit Rontgenstrahlen. Arch Anthropol 1, 91–108.
Greaves WS (1985) The mammalian postorbital bar as a torsion-
resisting helical strut. J Zool (Lond) 207, 125–136.
Gruss JS, Mackinnon SE (1986) Complex maxillary fractures: role
of buttress reconstruction and immediate bone grafts. Plast
Reconstr Surg 78, 9.
Huiskes R, Chao EYS (1983) A survey of finite element analysis
in orthopaedic biomechanics: the first decade. J Biomech 16,
385–409.
Hylander WL, Johnson KR (1992) Strain gradients in the
craniofacial region of primates. In: The Biological Mechanisms
of Tooth Movement and Craniofacial Adaptation (ed.
Davidovich Z), pp. 559–569. Columbus, OH: The Ohio State
University.
Hylander WL, Johnson KR (1997a) In vivo bone strain patterns
in the craniofacial region of primates. In: Science and Practice
of Occlusion (ed. McNeill C), pp. 165–178. Chicago:
Quintessence Publishing Co.
ªª 2010 The AuthorsJournal of Anatomy ªª 2010 Anatomical Society of Great Britain and Ireland
Catarrhine facial strain, C. F. Ross et al.138

Hylander WL, Johnson KR (1997b) In vivo bone strain patterns
in the zygomatic arch of macaques and the significance of
these patterns for functional interpretations of craniofacial
form. Am J Phys Anthropol 102, 203–232.
Hylander WL, Ravosa MJ (1992) An analysis of the supraorbital
region of primates: a morphometric and experimental
approach. In: Structure, Function and Evolution of Teeth (eds
Smith P, Tchernov E), pp. 223–255. London: Freund Publishing
House Ltd.
Hylander WL, Picq PG, Johnson KR (1991) Masticatory-stress
hypotheses and the supraorbital region of primates. Am J
Phys Anthropol 86, 1–36.
Iriarte-Diaz J, Ross CF (2010) Surface Strain Transformation and
Visualization Software 2.0. Chicago.
Kimbel WH, Johanson D, Rak Y (2004) The Skull of
Australopithecus afarensis. Oxford: Oxford University Press.
Kupczik K, Dobson CA, Fagan MJ, et al. (2007) Assessing
mechanical function of the zygomatic region in macaques:
validation and sensitivity testing of finite element models.
J Anat 210, 41–53.
Manson PN, Hoopes JE, Su CT (1980) Structural pillars of the
facial skeleton: an approach to the management of LeFort
fractures. Plast Reconstr Surg 66, 54.
Mardia KV, Jupp PE (2000) Directional Statistics. Chichester:
Wiley.
McHenry CR, Wroe S, Clausen PD, et al. (2007) Supermodeled
sabercat, predatory behavior in Smilodon fatalis revealed by
high-resolution 3D computer simulation. Proc Natl Acad Sci U
S A 104, 16010–16015.
Metzger KA, Daniel WJ, Ross CF (2005) Comparison of beam
theory and finite-element analysis with in vivo bone strain
data from the alligator cranium. Anat Rec A Discov Mol Cell
Evol Biol 283A, 331–348.
Moazen M, Curtis N, O’Higgins P, et al. (2007) Musculoskeletal
modelling and finite element analysis of lizard skulls.
J Morphol 268, 1108.
Moazen M, Curtis N, Evans SE, et al. (2008a) Combined finite
element and multibody dynamics analysis of biting in a
Uromastyx hardwickii lizard skull. J Anat 213, 499–508.
Moazen M, Curtis N, Evans SE, et al. (2008b) Rigid-body
analysis of a lizard skull: modelling the skull of Uromastyx
hardwickii. J Biomech 41, 1274–1280.
Moazen M, Curtis N, O’Higgins P, et al. (2009) Assessment of
the role of sutures in a lizard skull: a computer modelling
study. Proc R Soc Lond B Biol Sci 276, 39–46.
Moreno K, Wroe S, McHenry C, et al. (2007) Komodo dragon
cranial mechanics and kinesis as revealed by high-resolution
finite element analysis. J Vertebr Paleontol 27, 120A.
Moreno K, Wroe S, Clausen P, et al. (2008) Cranial performance
in the Komodo dragon (Varanus komodoensis) as revealed by
high-resolution 3-D finite element analysis. J Anat 212, 736–
746.
Nagasao T, Nakajima T, Kimura A, et al. (2005) The dynamic
role of buttress reconstruction after maxillectomy. Plast
Reconstr Surg 115, 1328–1340.
Oyen OJ, Tsay TP (1991) A biomechanical analysis of craniofacial
form and bite force. Am J Dentofacial Orthop 99, 298–309.
Picq PG, Hylander WL (1989) Endo’s stress analysis of the
primate skull and the functional significance of the
supraorbital region. Am J Phys Anthropol 79, 393–398.
Pierce SE, Angielczyk KD, Rayfield EJ (2008) Patterns of
morphospace occupation and mechanical performance in
extant crocodilian skulls: a combined geometric morphometric
and finite element modelling approach. J Morphol 269, 840–
864.
Rak Y (1983) The Australopithecine Face. New York: Academic
Press.
Ravosa MJ (1988) Browridge development in Cercopith-
ecidae: a test of two models. Am J Phys Anthropol 76, 535–
555.
Ravosa MJ (1991) Interspecific perspective on mechanical and
nonmechanical models of primate circumorbital morphology.
Am J Phys Anthropol 86, 369–396.
Ravosa MJ, Johnson KR, Hylander WL (2000a) Strain in the
galago facial skull. J Morphol 245, 51–66.
Ravosa MJ, Vinyard CJ, Hylander WL (2000b) Stressed out:
masticatory forces and primate circumorbital form. Anat Rec
261, 173–175.
Rayfield EJ (2004) Cranial mechanics and feeding in
Tyrannosaurus rex. Proc R Soc Lond B Biol Sci 271, 1451–1459.
Rayfield EJ (2005a) Aspects of comparative cranial mechanics in
the theropod dinosaurs Coelophysis, Allosaurus and
Tyrannosaurus. Zool J Linn Soc 144, 309–316.
Rayfield EJ (2005b) Using finite-element analysis to investigate
suture morphology: a case study using large carnivorous
dinosaurs. Anat Rec A Discov Mol Cell Evol Biol 283A, 349–
365.
Rayfield EJ (2007) Finite element analysis and understanding
the biomechanics and evolution of living and fossil
organisms. Annu Rev Earth Planet Sci 35, 541–576.
Rayfield EJ, Milner AC (2008) Establishing a framework for
archosaur cranial mechanics. Paleobiology 34, 494–515.
Rayfield EJ, Norman DB, Horner CC, et al. (2001) Cranial design
and function in a large theropod dinosaur. Nature 409, 1033–
1037.
Richmond BG, Wright B, Grosse I, et al. (2005) Finite element
analysis in functional morphology. Anat Rec A 283A, 259–
274.
Richter W (1920) Der Obergesichtschadel des Menschen als
Gebissturm, ein statische Kunstwerk. Dtsch Monatsschr
Zahnheilkd 38, 49–68.
Roberts D, Tattersall I (1974) Skull form and the mechanics of
mandibular elevation in mammals. Am Mus Novit 2536, 1–9.
Rodriguez ED, Bluebond-Langner R, Park JE, et al. (2008)
Preservation of contour in periorbital and midfacial
craniofacial microsurgery: reconstruction of the soft-tissue
elements and skeletal buttresses. Plast Reconstr Surg 121,
1738–1747.
Ross CF (1995) Muscular and osseous anatomy of the primate
anterior temporal fossa and the functions of the postorbital
septum. Am J Phys Anthropol 98, 275–306.
Ross CF (2001) In vivo function of the craniofacial haft: the
interorbital ‘pillar’. Am J Phys Anthropol 116, 108–139.
Ross C, Hylander WL (1996a) In vivo and in vitro bone strain in
owl monkey circumorbital region and the function of the
postorbital septum. Am J Phys Anthropol 101, 183–215.
Ross CF, Hylander WL (1996b) In vivo and in vitro bone strain
in the owl monkey circumorbital region and the function of
the postorbital septum. Am J Phys Anthropol 101, 183–215.
Ross CF, Metzger KA (2004) Bone strain gradients and
optimization in tetrapod skulls. Ann Anat 186, 387–396.
Ross CF, Ravosa MJ (1993) Basicranial flexion, relative brain
size and facial kyphosis in nonhuman primates. Am J Phys
Anthropol 91, 305–324.
139Catarrhine facial strain, C. F. Ross et al.
ªª 2010 The AuthorsJournal of Anatomy ªª 2010 Anatomical Society of Great Britain and Ireland

Ross CF, Patel BA, Slice DE, et al. (2005) Modeling masticatory
muscle force in finite-element analysis: sensitivity analysis
using principal coordinates analysis. Anat Rec A 283, 288–299.
Sicher H, Tandler J (1928) Anatomie fur Zahnartzte. Berlin:
Springer.
Strait D, Richmond B, Ross C, et al. (2002) Finite element
analysis of a macaque skull: applications for functional
morphology. Am J Phys Anthropol Supplement 34, 149.
Strait D, Wang Q, Dechow PC, et al. (2005) Modeling elastic
properties in finite element analysis: how much precision is
needed to produce an accurate model? Anat Rec 283A, 275–
287.
Strait D, Richmond BG, Spencer M, et al. (2007) Something to
chew on: masticatory biomechanics and its relevance to early
hominid phylogeny. J Hum Evol 52, 585–599.
Strait DS, Wright B, Richmond BG, et al. (2008) Craniofacial
strain patterns during premolar loading: implications for
human evolution. In: Primate Craniofacial Function and
Biology. (eds Vinyard CJ, Ravosa MJ, Wall CE), pp. 149–172,
New York: Springer.
Strait DS, Weber GW, Neubauer S, et al. (2009) The feeding
biomechanics and dietary ecology of Australopithecus
africanus. Proc Natl Acad Sci U S A 106, 2124–2129.
Wang Q, Dechow PC (2006) Elastic properties of external
cortical bone in the craniofacial skeleton of the rhesus
monkey. Am J Phys Anthropol 131, 402–415.
Wang Q, Dechow PC, Wright BW, et al. (2008) Surface strain
on bone and sutures in a monkey facial skeleton: an in vitro
method and its relevance to finite element analysis. In:
Primate Craniofacial Function and Biology (eds Vinyard CJ,
Ravosa MJ, Wall CE), pp. 173–198, New York: Springer.
Wroe S, Moreno K, Clausen P, et al. (2007) High-resolution three-
dimensional computer simulation of hominid cranial
mechanics. Anat Rec Adv Integr Anat Evol Biol 290, 1248–1255.
Yamamoto Y, Minakawa H, Kawashima K, et al. (1998) Role of
buttress reconstruction in zygomaticomaxillary skeletal
defects. Plast Reconstr Surg 101, 943–950.
Zar JH (1999) Biostatistical Analysis. Prentice Hall, Upper Saddle
River, NJ.
Supporting Information
Additional Supporting Information may be found in the online
version of this article:
Data S1. Surface strain transformation and visualization soft-
ware v2.0.
Video S1. Model deformations amplified 500·.
As a service to our authors and readers, this journal provides
supporting information supplied by the authors. Such materials
are peer-reviewed and may be re-organized for online delivery,
but are not copy-edited or typeset. Technical support issues
arising from supporting information (other than missing files)
should be addressed to the authors.
Appendix 1
Strain coordinate transformation
To compare in vivo strain orientations and magnitudes
recorded from bone surfaces with strain values from compara-
ble areas in the FEM, it was necessary to transform the 3-D
finite-element strains from the global coordinate system of the
model into the local coordinate system of the surfaces of the
model where strain gage data were sampled in vivo. Strain is a
tensor, not a vector, so it is not possible to simply project the
orientation of a 3-D strain vector such as maximum principal
strain. Rather, the values of the strain tensor must be recalcu-
lated in the new coordinate system of the bone surface plane
(P¢). This was achieved in the following way:
1. The 3-D coordinates of three nodes (a,b,c) representing P’
were selected.
2. Two vectors representing P’ were calculated as A = a ) b and
B = a ) c.
3. The normalized cross-product A · B = Z¢, representing the
normal to P’, was used to represent the orientation of P’.
4. The cross-product of Z¢ and the normal to the horizontal
plane of the global coordinate system yields X¢, the unit vector
in the horizontal plane that is orthogonal to Z¢.5. The cross-product Z¢ · X¢ gives Y¢, the vector orthogonal to Z¢and X¢.6. The components of these three unit vectors, X¢, Y¢, Z¢, in the
global model coordinate system serve as direction cosines for
the rotation matrix [T] defined below.
7. {e¢}, the strain tensor in the coordinate system X¢, Y¢, Z¢ is cal-
culated by premultiplying {e}, the strain tensor in the global
coordinate system of the model, by the rotation matrix [Ts]
given below; i.e.
{e¢} = [Ts] {e}
where the 3-D strain tensor
feg ¼ex
cxy
2cxz
2cyx
2 eycyz
2czx2
czy
2 ez
264
375is reduced to a 6,1 matrix feg ¼
ex
ey
ezcxy
2cyz
2cxz2
26666664
37777775
and premultiplied by
½Ts� ¼
l21 m21 n2
1 l1m1 m1n1 l1n1
l22 m22 n2
2 l2m2 m2n2 l2n2
l23 m23 n2
3 l3m3 m3n3 l3n3
2l1l2 2m1m2 2n1n2 l1m2 þ l2m1 m1n2 þm2n1 n1l2 þ n2l12l2l3 2m2m3 2n2n3 l2m3 þ l3m2 m2n3 þm3n2 n2l3 þ n3l22l1l3 2m1m3 2n1n3 l3m1 þ l1m3 m3n1 þm1n3 n3l1 þ n1l3
26666664
37777775
140 Catarrhine facial strain, C. F. Ross et al.
ªª 2010 The AuthorsJournal of Anatomy ªª 2010 Anatomical Society of Great Britain and Ireland

where l1, l2, l3 are the cosines of the angles between X and the
X¢, Y¢ and Z¢ axis, respectively, m1, m2, m are the cosines of the
angles between the Y and the X¢, Y¢ and Z¢ axis, respectively,
and n1, n2, n3 are the cosines of the angles between Z and the
X¢, Y¢ and Z¢ axis, respectively.
8. {e} was output from the FEM software; [Ts] and {e¢} were calcu-
lated in MATLAB� using steps 2–6 described above.
141Catarrhine facial strain, C. F. Ross et al.
ªª 2010 The AuthorsJournal of Anatomy ªª 2010 Anatomical Society of Great Britain and Ireland