journal of atmospheric and solar-terrestrial physicscc.oulu.fi/~usoskin/personal/nit_2014.pdf ·...
TRANSCRIPT

Journal of Atmospheric and Solar-Terrestrial Physics 121 (2014) 50–58
Contents lists available at ScienceDirect
Journal of Atmospheric and Solar-Terrestrial Physics
http://d1364-68
n CorrE-m
journal homepage: www.elsevier.com/locate/jastp
Cosmogenic production and climate contributions to nitrate record inthe TALDICE Antarctic ice core
S. Poluianov a,n, R. Traversi c, I. Usoskin a,b
a Department of Physics, FI-90014, University of Oulu, Finlandc Department of Chemistry “Ugo Schiff”, University of Florence, via della Lastruccia, I-50019 Sesto Fiorentino, Italyb Sodankylä Geophysical Observatory (Oulu unit), University of Oulu, FI-90014, Finland
a r t i c l e i n f o
Article history:Received 18 May 2014Received in revised form15 September 2014Accepted 24 September 2014Available online 28 September 2014
Keywords:Solar activityNitrateHoloceneTALDICE
x.doi.org/10.1016/j.jastp.2014.09.01126/& Elsevier Ltd. All rights reserved.
esponding author.ail address: [email protected] (S. Polui
a b s t r a c t
This paper presents the results of a comparative wavelet coherence analysis of a multimillennial nitraterecord with a number of climatic and solar activity proxies. Distinguishing between these factors isimportant in the view of a possibility of nitrate deposited in a polar region to represent galactic cosmicray flux and, consequently, solar activity. We used the data from the TALDICE drilling project (TalosDome, Antarctica), which covers the age range 12,000–700 BP (years before present, i.e. before 1950) andincludes records of nitrate as well as climatic proxies, such as Naþ , Ca2þ , MSA (methanesulphonic acid),δ18O, ℬSO4
2 . The solar activity series is represented by reconstructions of the heliospheric modulationparameter from the 14C and 10Be data. We found (1) a confirmation of multimillennial relation betweennitrate and galactic cosmic ray flux; (2) no clear signature of long-term variations of nitrate transportfrom lower latitudes. We suggest that variations in the nitrate record in the time scale of hundreds–thousands years are most likely caused by local production, deposition and post-deposition processes.
& Elsevier Ltd. All rights reserved.
1. Introduction
It is important for many reasons to reconstruct the variability ofsolar activity on the long-term scale extending over centennia andmillennia. The only established quantitative way to reconstructsolar activity in the past, before direct solar observations, is relatedto the use of a proxy which corresponds to the flux of galacticcosmic rays impinging the Earth. Galactic cosmic ray flux ismodulated by solar activity in the heliosphere and is roughlyinversely proportional to it. The intensity of cosmic rays isrecorded in concentration of the so-called cosmogenic isotopes,primarily 14C and 10Be, measured in natural independently datedarchives, such as tree trunks or ice cores (e.g., Beer et al., 2012;Usoskin, 2013). In addition to these well-established cosmogenicnuclear proxies of solar activity, a chemical tracer was recentlyproposed (Traversi et al., 2012; Soon et al., 2014) — nitrate ( ℬNO3)measured in an Antarctic ice core. In particular, it was shown thatthe nitrate record from the TALDICE ice core depicts significantcoherence with the cosmogenic radiocarbon 14C on the time scaleof ten millennia, which was interpreted as an evidence for adominant solar signal in the nitrate production. Accordingly, thepolar nitrate was proposed as a potential proxy for solar activity on
anov).
different timescales (from decadal to multi-millennial). We notethat the relation between nitrate and solar activity proposed byTraversi et al. (2012) is caused by the variability of galactic cosmicrays which is different from the disputable response of polarnitrate to major solar energetic particle events (McCracken et al.,2001; Palmer et al., 2001; Kepko et al., 2009; Wolff et al., 2008,2012). This is a new feature as typically nitrate is used as a tracer ofnatural and anthropogenic nitrogen species emissions (e.g.,Mayewski et al., 1986, 1990; Legrand and Mayewski, 1997).
If proven to be a reliable proxy, the new chemical tracer wouldbe a useful addition to the traditional cosmogenic radionuclideproxies. Nitrate, in contrast to cosmogenic radionuclides, is notpurely cosmogenic — it is appreciably controlled by a number ofterrestrial sources and processes not related to solar activity. Herewe try to disentangle production and transport effects in thenitrate using an empirical analysis of the mutual relations between
ℬNO3 and other chemical tracers, measured in the same TALDICEcore.
2. Data and method
Nitrate ions ( ℬNO3) in Antarctic snow/ice represent mainlydeposited gaseous acid HNO3, the ultimate product of reactionswith nitrogen oxides (NOx) in the atmosphere (e.g., Legrand andKirchner, 1990; Delmas, 1992). The sources of nitrate and/or its

S. Poluianov et al. / Journal of Atmospheric and Solar-Terrestrial Physics 121 (2014) 50–58 51
precursors include (1) the photochemical dissociation of N2Ooccurring in the stratosphere, that is mainly responsible forproduction of reactive NOx in the stratosphere and their furtherdownwelling to the troposphere (e.g., Legrand and Kirchner, 1990);(2) production of several nitrogen species (NOx, peroxyacetylnitrates) in the low and middle latitude areas by lightnings (e.g.,Wolff, 1995), (3) biomass burning and recent (4) anthropogenicactivity (and references therein Grannas et al., 2007), and, finally,(5) the re-emission from the snowpack of volatile HNO3 (e.g.,Weller and Wagenbach, 2007) or through photolysis-emission ofNOx and subsequent oxidation in the atmosphere (Grannas et al.,2007). As concerning the NOx production in the stratosphere, avery important source is related to interactions of high-energyparticles, namely galactic cosmic rays and solar energetic particleswith the ambient air (e.g., Vitt and Jackman, 1996). In contrast tothe lightning-related source this one is stronger in polar regionswith weaker or no geomagnetic shielding. Here we focus on thesouth polar region where the local production of ℬNO3 by lightningsis negligible but its influence can be still important due totransport of ℬNO3 from lower latitudes.
In order to study the climate influence on ℬNO3 we compare itwith a number of available data series which are stronglysubjected to various climatic factors (temperature, air transport,etc.). We use the data that were obtained in the framework of theTalos Dome Ice Core drilling project (TALDICE), where an ice corecovering a hundred of thousands of years was obtained. Thedrilling site is located in Central Antarctica ( † ν72 49 S, † ν159 11 E,2315 m above sea level). The data represent age-concentrationseries that cover the age range from 12,000 to 700 BP (years beforepresent, i.e. before 1950) with dating uncertainties keeping below150 years in the late Holocene, back to 4500 BP (Bazin et al., 2013).Since the dominant type of ℬNO3 deposition at Talos Dome is dry(Traversi et al., 2012), the deposition flux (i.e. concentration timessnow accumulation rate) is generally more suitable than theconcentration to derive the quantity of each component actuallydeposited onto the ice sheet, as usually accomplished when drydeposition is dominant with respect to wet deposition (e.g., EPICACommunity Members, 2004). Nonetheless, introducing a para-meter (deposition flux) which is not directly measured butcalculated from the measured concentration by applying a suitableflow model and absolute temporal horizons (Bazin et al., 2013)carries an additional uncertainty which has to be taken intoaccount when discussing the variability of the chemical dataseries. The choice between a data series obtained by directmeasurements (concentrations) but not directly related to atmo-spheric depositions and a data series directly related to deposi-tions (flux) but obtained by introducing another calculated para-meter, not measured parameter (accumulation rate), is notstraightforward. In such a case, considering that this work focuseson the relative variability, rather than on the absolute atmosphericconcentrations, and keeping in mind that the accumulation ratewas nearly constant during the Holocene, we chose to consider theconcentration series as more robust. Moreover, the possible tuningeffect of different accumulation rates on concentrations might besignificant when these series are compared with an “external”series with independent dating, but not for different tracersobtained from the same ice core.
We consider the following substances whose strong relationswith some climatic parameters make them useful markers ofaerosol production and/or transport processes:
�
sodium Naþ is a tracer of sea salt supply to the deposition site; � calcium Ca2þ generally reflects dust aerosol transported fromareas with open soil;
� methanesulphonic acid CH3ℬSO3 (MSA henceforth) representsphytoplankton activity in the ocean;
�
relative concentration of 18O isotope (δ18O henceforth) is anindex of the air temperature at the deposition site;�
non-sea-salt sulphate ℬnssSO42 is mainly driven by the phyto-plankton activity in the ocean as well as by volcanic activityand anthropogenic SO2 emissions with a small contributionfrom mineral dust (e.g., gypsum).
In order to exclude the influence of sea spray on the measuredℬSO4
2 we calculate the non-sea-salt value using the followingequation (Traversi et al., 2004):
= ℬℬ ℬ +[nssSO ] [SO ] 0.253[Na ], (1)42
42
where all the values represent mass concentrations in the unit ofʨg/L .
Since many of those substances are produced outside of theAntarctic ice sheet, their concentrations in the TALDICE ice coreare strongly influenced by the air transport factor.
As an index of cosmic ray variability we use heliosphericmodulation parameter ϕ (see Usoskin et al., 2005 for definition).Because of the inverse relation between ϕ and the cosmogenicproduction rate in the atmosphere, for convenience we use inversevalues of modulation parameter, denoted henceforth as ɒℬ . Thus,an increase of the inverse modulation parameter ɒℬ correspondsto an increase of the cosmic ray flux and, consequently, an increaseof the cosmogenic production rate. The series of ϕ is based on theglobally averaged ʁ 14C data (INTCAL09 project, see Reimer et al.,2009) and is converted into the cosmic ray modulation using amodel by Kovaltsov et al. (2012). This series covers the same timerange as the TALDICE series. The other one is based on measure-ments of 10Be in a Greenland ice core in the framework of GRIPproject (Yiou et al., 1997) and converted into the cosmic raysmodulation by Steinhilber et al. (2008). This series is somewhatshorter, covering the period from 9300 to 700 BP.
Since the data series are essentially non-stationary and varyingon different time scales, the conventional bivariate correlationanalysis is not appropriate. Accordingly, we study relations be-tween series using the method of wavelet coherence (e.g.,Torrence and Compo, 1998; Lachaux et al., 2002) which allowsone to disentangle the relation between data series in bothtemporal and frequency domains. Namely, we apply the Matlab-based software package originally developed by Grinsted et al.(2004). The original package estimates the significance of coher-ence using an assumption of a red noise model of the signal, whichmay essentially overestimate the significance (Usoskin et al., 2006;Poluianov and Usoskin, 2014). In order to be on a safe side, weapply a more conservative Monte-Carlo non-parametric random-phase method (Ebisuzaki, 1997) for the estimate of significance. Itsapplication to the wavelet coherence procedure is described, e.g.,by Traversi et al. (2012). The original code by Grinsted et al. (2004)was modified accordingly. Before the analysis, all data series werestandardized, viz. normalized to the mean, and divided by thestandard deviation, and additionally low-pass filtered by therectangular window in frequency domain with the cutoff fre-quency 0.01 year�1. We used the following parameters of thewavelet coherence computation: the Morlet wavelet basis withǺ = 30 ; statistical significance of the results was calculated for1000 Monte-Carlo runs using the non-parametric random-phasemethod. In addition to the conventional 2D coherence (in time andfrequency domains) we also computed the time-averaged coher-ence, considering also the relative phase of the signals (see detailsin Traversi et al., 2012).
All the plots are arranged in the same manner as described inthe caption of Fig. 1.
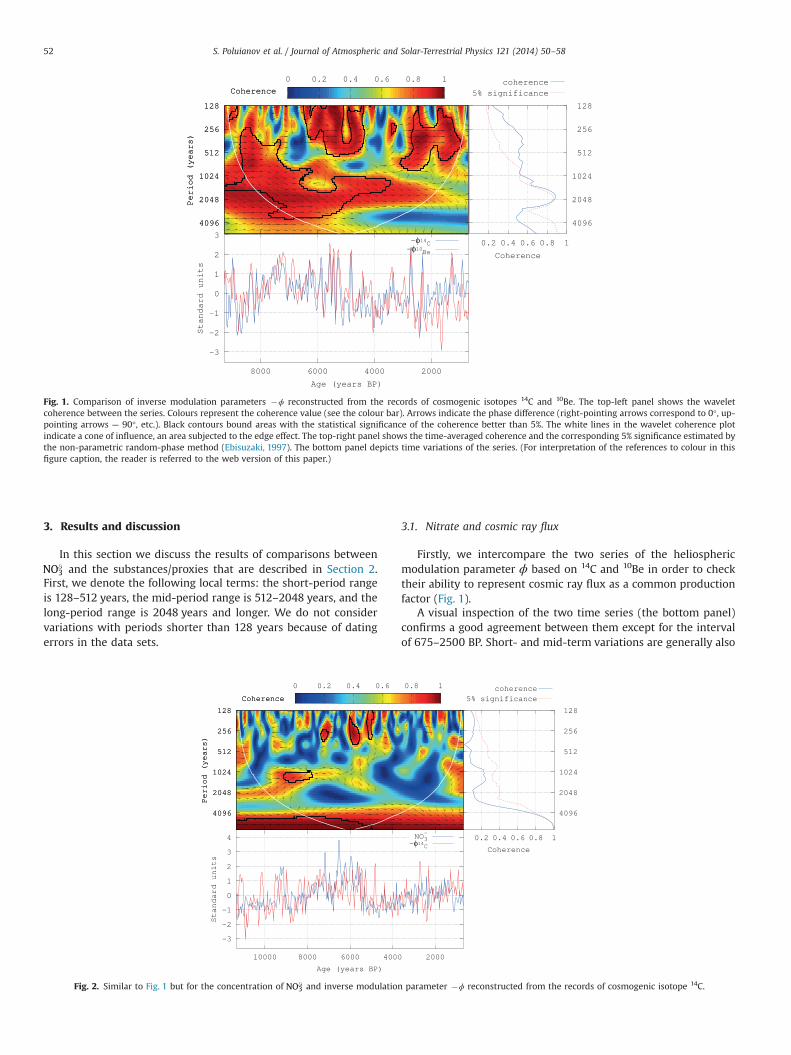
Fig. 1. Comparison of inverse modulation parameters �ϕ reconstructed from the records of cosmogenic isotopes 14C and 10Be. The top-left panel shows the waveletcoherence between the series. Colours represent the coherence value (see the colour bar). Arrows indicate the phase difference (right-pointing arrows correspond to 0°, up-pointing arrows — 90°, etc.). Black contours bound areas with the statistical significance of the coherence better than 5%. The white lines in the wavelet coherence plotindicate a cone of influence, an area subjected to the edge effect. The top-right panel shows the time-averaged coherence and the corresponding 5% significance estimated bythe non-parametric random-phase method (Ebisuzaki, 1997). The bottom panel depicts time variations of the series. (For interpretation of the references to colour in thisfigure caption, the reader is referred to the web version of this paper.)
S. Poluianov et al. / Journal of Atmospheric and Solar-Terrestrial Physics 121 (2014) 50–5852
3. Results and discussion
In this section we discuss the results of comparisons betweenℬNO3 and the substances/proxies that are described in Section 2.
First, we denote the following local terms: the short-period rangeis 128–512 years, the mid-period range is 512–2048 years, and thelong-period range is 2048 years and longer. We do not considervariations with periods shorter than 128 years because of datingerrors in the data sets.
Fig. 2. Similar to Fig. 1 but for the concentration of ℬNO3 and inverse modulation
3.1. Nitrate and cosmic ray flux
Firstly, we intercompare the two series of the heliosphericmodulation parameter ϕ based on 14C and 10Be in order to checktheir ability to represent cosmic ray flux as a common productionfactor (Fig. 1).
A visual inspection of the two time series (the bottom panel)confirms a good agreement between them except for the intervalof 675–2500 BP. Short- and mid-term variations are generally also
parameter �ϕ reconstructed from the records of cosmogenic isotope 14C.

S. Poluianov et al. / Journal of Atmospheric and Solar-Terrestrial Physics 121 (2014) 50–58 53
coincident. Both series have a number of strong dips, e.g., at 8320,5570, 4840, 2750 BP, corresponding to Grand Minima (cf. Usoskinet al., 2007). The top panels present patterns of coherencebetween the series. Overall, the good agreement between the datais confirmed by a relatively high coherence, but its distribution inthe time-period space is nonuniform. The high and statisticallysignificant coherence is observed at short- and mid-period rangesbut not at long-period range (cf. Usoskin et al., 2009). One can seethat while the mid- and long-period coherence is low at theinterval 5000–675 BP there are two “spots” of very high short-period coherence. The disagreement between the ɒℬ C14 and ɒℬ Be10
series in long-time scale was found earlier (e.g., Vonmoos et al.,2006; Usoskin et al., 2009).
We ascribe the high coherence found in short- and mid-periodranges by cosmic ray flux that drives production of both isotopes.The disagreement at long-time scale can be caused by variation ofsome parameters in the production–transport–deposition chain of14C and/or 10Be.
Because of the weak relation in long-time scale either ɒℬ C14
and/or ɒℬ Be10 series can be distorted in the sense of the long-termcosmic rays variability, and the extraction of the true cosmic raybehaviour from those data series is not trivial (Steinhilber et al.,2012). Therefore, we compare nitrate with each of cosmogenicisotopes separately assuming that each of them is mainly drivenby cosmic ray flux but may also contain a climate-related signal.
The next pair to compare is ℬNO3 and ɒℬ C14 (Fig. 2). The mainfeature here is a statistically significant very high (up to 0.99, seethe right panel of Fig. 2) and in-phase coherence at long-periodrange. In contrast, at the short- and mid-periods, there are only afew significant “spots” of high coherence: at 9000–8000 BP forperiods about 1024 years, at 7100–6600 BP, and at 6000–5800 BPfor periods about 256 years. They are short-term and look likecoincidences of variations even with a good significance.
Overall, the coherence at short- and mid-periods is low and itcan probably be explained by climatic influence, while highlycoherent long-period variations of ℬNO3 and ɒℬ C14 are most likelycaused by cosmic ray flux, directly affecting their production.
This result is in quantitative agreement with the same compar-ison done earlier by Traversi et al. (2012). A minor difference canbe explained by the discrepancy in details of the computationprocedure.
Fig. 3. Similar to Fig. 1 but for the concentration of ℬNO3 and inverse modulation
Comparison of ℬNO3 and ɒℬ Be10 is presented in Fig. 3. Unlike theprevious case with ɒℬ C14 , ℬNO3 and ɒℬ Be10 are weakly coherent at allranges of periods. Nevertheless, one can see an interval ofcommon long-period behaviour of the two series ca. 9400–7000BP. During the rest of the time the long-period coherence is verylow. At short- and mid-period ranges there are a few small “spots”of relatively high coherence. Their phases have values near þ90°or �90° and are strongly variable. Detailed examination of thetime series suggests that these “spots” cannot indicate any realrelation between the data sets, but are accidental.
Thus, the result of the wavelet coherence analysis in Fig. 3 leadsto the conclusion that there is no significant relation between ℬNO3and ɒℬ Be10 . This distinction can be probably caused by localfeatures of transport and/or deposition of 10Be in Greenland. Thelack of short- and mid-period relation in the ℬNO3 vs. ɒℬ Be10 pair aswell as in the ℬNO3 vs. ɒℬ C14 pair on the one hand, and the goodshort- and mid-period coherence between ɒℬ C14 and ɒℬ Be10 on theother hand suggests that the ℬNO3 series may be affected bynoncosmogenic factors, most likely of climatic nature.
In an attempt to understand the influence of that kind ofprocess on ℬNO3 deposition we compare it with a number ofclimatic markers described in Section 2.
3.2. ℬNO3 vs. ℬnssSO42 and MSA
The comparison of ℬNO3 and ℬnssSO42 is shown in Fig. 4. The
wavelet analysis shows significant coherence for long- and mid-period variations of the series. However, the phase shift of about�45° at long-period range and visual inspection of the two seriespoint to the lack of real long-term relation between ℬNO3 and
ℬnssSO42 . On the contrary, the mid-period range has three “spots” of
high and in-phase coherence (ca. 10,500–8500, 8000–7000 and3000–2000 BP). This indicates sporadic relation between theseries. A number of coincident peaks (in the bottom panel),reflected as small “spots” of high coherence (in the top-left panel),are likely due to a random occurring co-variability and not to acommon driver in production and/or transport, as suggested bytheir short duration and random relative phase.
The discrepancy between ℬNO3 and ℬnssSO42 at periods longer
than 4000 years can be explained in the view that ℬNO3 productionis dominated by galactic cosmic rays at long period range (seeSection 3.1), while ℬnssSO4
2 is totally independent on it. The
parameter �ϕ reconstructed from the records of cosmogenic isotope 10Be.

Fig. 4. Similar to Fig. 1 but for the concentrations of ℬNO3 and no-sea-salt ℬSO42 .
S. Poluianov et al. / Journal of Atmospheric and Solar-Terrestrial Physics 121 (2014) 50–5854
significant coherence at other period ranges can be caused bycommon formation processes from already present precursors ingas-phase (NOx and SO2 or dimethyl sulphoxide (DMSO) for ℬNO3
and ℬnssSO42 , respectively), or by common transport processes from
the middle and low latitudes. Concerning the first option, it isreasonable to assume that the efficiency of atmospheric oxidationof ℬNO3 and ℬnssSO4
2 precursors is somewhat higher in conditions ofhigher solar irradiation, and this may provide a link between thetwo parameters. For instance, a common behaviour at seasonalscale has been found in several Antarctic sites by the analysis ofsnow pits and firn cores, even allowing us to perform a relativedating on the basis of a clear seasonal pattern (e.g., Severi et al.,2009). The seasonality of ℬnssSO4
2 has always been ascribed to theannual variations of biogenic productivity (blooming in summer)whereas the seasonality of ℬNO3 has been so far overlooked and notclearly explained despite being used in several works for ice dating
Fig. 5. Similar to Fig. 1 but for the c
via annual layer counting of single parameters or via a multi-parametric approach (Wolff, 1995; Traufetter et al., 2004; Severiet al., 2009). The dependence of ℬNO3 and ℬnssSO4
2 on the solarirradiation can be analysed by intercomparison with MSA, a proxyof biogenic productivity (e.g., Saltzman et al., 2006) and, indirectly,of solar irradiation. Here we should note that other climatic factorssuch as sea-ice extent and atmospheric circulation modes (e.g.,South Oscillation Index (SOI) and Southern Annual Mode (SAM))might affect MSA budget and temporal trends in Antarctic sitesrelatively close to the coast, like Talos Dome (Becagli et al., 2009;Curran et al., 2003).
The wavelet coherence and the time variations of ℬNO3 and MSAare presented in Fig. 5. There are several relatively large areas ofstatistically significant high coherence in long-, mid- and short-period ranges. However the relative phases of the “spots” varysignificantly. The area of high coherence at the long-period range
oncentrations of ℬNO3 and MSA.
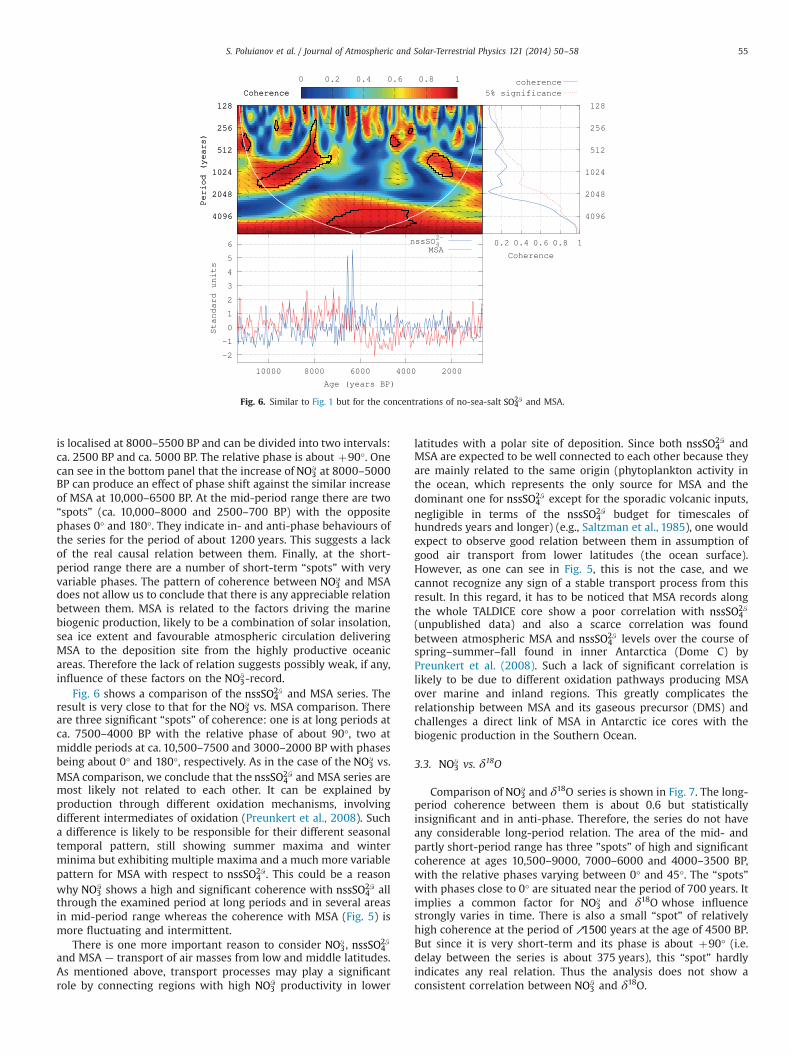
Fig. 6. Similar to Fig. 1 but for the concentrations of no-sea-salt ℬSO42 and MSA.
S. Poluianov et al. / Journal of Atmospheric and Solar-Terrestrial Physics 121 (2014) 50–58 55
is localised at 8000–5500 BP and can be divided into two intervals:ca. 2500 BP and ca. 5000 BP. The relative phase is about þ90°. Onecan see in the bottom panel that the increase of ℬNO3 at 8000–5000BP can produce an effect of phase shift against the similar increaseof MSA at 10,000–6500 BP. At the mid-period range there are two“spots” (ca. 10,000–8000 and 2500–700 BP) with the oppositephases 0° and 180°. They indicate in- and anti-phase behaviours ofthe series for the period of about 1200 years. This suggests a lackof the real causal relation between them. Finally, at the short-period range there are a number of short-term “spots” with veryvariable phases. The pattern of coherence between ℬNO3 and MSAdoes not allow us to conclude that there is any appreciable relationbetween them. MSA is related to the factors driving the marinebiogenic production, likely to be a combination of solar insolation,sea ice extent and favourable atmospheric circulation deliveringMSA to the deposition site from the highly productive oceanicareas. Therefore the lack of relation suggests possibly weak, if any,influence of these factors on the ℬNO3-record.
Fig. 6 shows a comparison of the ℬnssSO42 and MSA series. The
result is very close to that for the ℬNO3 vs. MSA comparison. Thereare three significant “spots” of coherence: one is at long periods atca. 7500–4000 BP with the relative phase of about 90°, two atmiddle periods at ca. 10,500–7500 and 3000–2000 BP with phasesbeing about 0° and 180°, respectively. As in the case of the ℬNO3 vs.MSA comparison, we conclude that the ℬnssSO4
2 and MSA series aremost likely not related to each other. It can be explained byproduction through different oxidation mechanisms, involvingdifferent intermediates of oxidation (Preunkert et al., 2008). Sucha difference is likely to be responsible for their different seasonaltemporal pattern, still showing summer maxima and winterminima but exhibiting multiple maxima and a much more variablepattern for MSA with respect to ℬnssSO4
2 . This could be a reasonwhy ℬNO3 shows a high and significant coherence with ℬnssSO4
2 allthrough the examined period at long periods and in several areasin mid-period range whereas the coherence with MSA (Fig. 5) ismore fluctuating and intermittent.
There is one more important reason to consider ℬNO3 ,ℬnssSO4
2
and MSA — transport of air masses from low and middle latitudes.As mentioned above, transport processes may play a significantrole by connecting regions with high ℬNO3 productivity in lower
latitudes with a polar site of deposition. Since both ℬnssSO42 and
MSA are expected to be well connected to each other because theyare mainly related to the same origin (phytoplankton activity inthe ocean, which represents the only source for MSA and thedominant one for ℬnssSO4
2 except for the sporadic volcanic inputs,negligible in terms of the ℬnssSO4
2 budget for timescales ofhundreds years and longer) (e.g., Saltzman et al., 1985), one wouldexpect to observe good relation between them in assumption ofgood air transport from lower latitudes (the ocean surface).However, as one can see in Fig. 5, this is not the case, and wecannot recognize any sign of a stable transport process from thisresult. In this regard, it has to be noticed that MSA records alongthe whole TALDICE core show a poor correlation with ℬnssSO4
2
(unpublished data) and also a scarce correlation was foundbetween atmospheric MSA and ℬnssSO4
2 levels over the course ofspring–summer–fall found in inner Antarctica (Dome C) byPreunkert et al. (2008). Such a lack of significant correlation islikely to be due to different oxidation pathways producing MSAover marine and inland regions. This greatly complicates therelationship between MSA and its gaseous precursor (DMS) andchallenges a direct link of MSA in Antarctic ice cores with thebiogenic production in the Southern Ocean.
3.3. ℬNO3 vs. δ18O
Comparison of ℬNO3 and δ18O series is shown in Fig. 7. The long-period coherence between them is about 0.6 but statisticallyinsignificant and in anti-phase. Therefore, the series do not haveany considerable long-period relation. The area of the mid- andpartly short-period range has three ”spots” of high and significantcoherence at ages 10,500–9000, 7000–6000 and 4000–3500 BP,with the relative phases varying between 0° and 45°. The “spots”with phases close to 0° are situated near the period of 700 years. Itimplies a common factor for ℬNO3 and δ18O whose influencestrongly varies in time. There is also a small “spot” of relativelyhigh coherence at the period of ↗1500 years at the age of 4500 BP.But since it is very short-term and its phase is about þ90° (i.e.delay between the series is about 375 years), this “spot” hardlyindicates any real relation. Thus the analysis does not show aconsistent correlation between ℬNO3 and δ18O.

Fig. 7. Similar to Fig. 1 but for the concentration of ℬNO3 and δ18O.
S. Poluianov et al. / Journal of Atmospheric and Solar-Terrestrial Physics 121 (2014) 50–5856
Since δ18O represents the temperature at the site of depositionand is generally related to snow accumulation rate (e.g., Parreninet al., 2001), its low coherence with ℬNO3 suggests that nitrateconcentration at Talos Dome during the Holocene is not signifi-cantly affected by snow accumulation rate on relatively long (atleast decadal, which is the temporal resolution of the samples)timescales.
3.4. ℬNO3 vs. Naþ and Ca2þ
The results of comparisons ℬNO3 vs. Naþ and ℬNO3 vs. Ca2þ arepresented in Figs. 8 and 9, respectively. Pairwise coherence is low
Fig. 8. Similar to Fig. 1 but for the c
and insignificant for all period and age ranges except for severalsmall “spots” at the short-period range with floating phase.
The results can be explained by significant differences inprocesses responsible for generation, transport and deposition of
ℬNO3 , Naþ and Ca2þ . Naþ is a component of sea salt aerosol,produced directly above the ocean surface, or via frost flowersformation (Rankin et al., 2000; Schüpbach et al., 2013), ordelivered to the deposition site via saline blowing snow (Yanget al., 2008). Calcium ion generally represents dust aerosoltravelled from areas with open soil. During Holocene the TALDICEice core archived dust particles originated not only from Patagonia,South America, but also from regional ice-free areas, namelyNorthern Victoria Land, East Antarctica (Sala et al., 2008;
oncentrations of ℬNO3 and Naþ .

Fig. 9. Similar to Fig. 1 but for the concentrations of ℬNO3 and Ca2þ .
Table 1Summary of suggested relations between the series. Three signs in each cell arerelated to the short, middle and long-term period ranges (see the definitions inSection 3). “þ” indicates the presence of significant positive relation betweenseries during the whole time range, “7” indicates the sporadic relation betweenseries, and “�” indicates the lack of any positive relation for a given period range.
ɒℬ C14 ɒℬ Be10 ℬnssSO42 MSA δ18O Naþ Ca2þ
ℬNO3 ℬℬ+ ℬℬℬ ℬ‡ ℬ ℬℬℬ ℬ‡ ℬ ℬℬℬ ℬℬℬ
ɒℬ C14 ‡ ‡ ℬℬnssSO4
2 ℬℬℬ
S. Poluianov et al. / Journal of Atmospheric and Solar-Terrestrial Physics 121 (2014) 50–58 57
Delmonte et al., 2010). It might be supposed that common regionaltransport processes or post-deposition effects could provide somerelations among ℬNO3 , Naþ and Ca2þ but there are no signs ofthose in Fig. 8.
4. Conclusions
In this paper we have compared the ℬNO3 data series with anumber of climatic and cosmic ray indices. The suggested relationsbetween the series are simplistically summed in Table 1.
We found a significant long-period relation of ℬNO3 with ɒℬ C14
but not with ɒℬ Be10 . In the view of a similar disagreement betweenɒℬ C14 and ɒℬ Be10 , we conclude that long-period variations of ℬNO3
are mainly driven by variability of cosmic ray flux. At mid- andshort-period ranges the cosmic ray factor is weak as comparedwith other factors, as suggested by low coherence of ℬNO3 withboth ɒℬ C14 and ɒℬ Be10 . Comparisons of ℬNO3 with climatic proxiesyield no significant long-, mid- or short-term relation except forthe pair ℬNO3 vs. ℬnssSO4
2 that needs a more detailed investigationfor interpretation. Assuming a considerable contribution of light-ning driven ℬNO3 into total deposition, we have searched forsignatures of possible air transport from lower latitudes bycomparisons of ℬnssSO4
2 and MSA; ℬNO3 and Naþ , Ca2þ . The resultsdo not show any sign of occurrence of the transport mechanism.Therefore, we suggest that the influence of the lower latitude ℬNO3source at the Talos Dome ice core is weak. Consequently, processes
not related to the long-range transport of ℬNO3 precursors play acrucial role in its formation in the TALDICE ice core.
This hypothesis needs quantitative estimation of possibleeffects, thus the further study of ℬNO3 in polar regions should becontinued by modeling of global and local processes that caninfluence on it.
Acknowledgements
This work is a contribution to the TALDICE project. TALDICE(Talos Dome Ice Core Project) is a joint European programme,funded by national contributions from Italy, France, Germany,Switzerland and the United Kingdom. Primary logistic supportwas provided by PNRA at Talos Dome. This is TALDICE publicationno. 40. This work was partly done in the framework of the ReSoLVECenter of Excellence (Finnish Academy Project no. 272157).
References
Bazin, L., Landais, A., Lemieux-Dudon, B., Toyé Mahamadou Kele, H., Veres, D.,Parrenin, F., Martinerie, P., Ritz, C., Capron, E., Lipenkov, V., Loutre, M.-F.,Raynaud, D., Vinther, B., Svensson, A., Rasmussen, S.O., Severi, M., Blunier, T.,Leuenberger, M., Fischer, H., Masson-Delmotte, V., Chappellaz, J., Wolff, E., 2013.An optimized multi-proxy, multi-site antarctic ice and gas orbital chronology(aicc2012): 120–800 ka. Clim. Past 9 (4), 1715–1731, URL ⟨http://www.clim-past.net/9/1715/2013/⟩.
Becagli, S., Castellano, E., Cerri, O., Curran, M., Frezzotti, M., Marino, F., Morganti, A.,Proposito, A., Severi, M., Traversi, R., Udisti, R., 2009. Methanesulphonic acid(MSA) stratigraphy from a Talos Dome ice core as a tool in depicting sea icechanges and southern atmospheric circulation over the previous 140 years.Atmos. Environ. 43 (5), 1051–1058, URL ⟨http://www.sciencedirect.com/science/article/pii/S1352231008010789⟩.
Beer, J., McCracken, K., von Steiger, R., 2012. Cosmogenic Radionuclides: Theory andApplications in the Terrestrial and Space Environments. Springer, Berlin.
Curran, M.A.J., van Ommen, T.D., Morgan, V.I., Phillips, K.L., Palmer, A.S., 2003. Ice coreevidence for antarctic sea ice decline since the 1950s. Science 302 (5648),1203–1206, URL ⟨http://www.sciencemag.org/content/302/5648/1203.abstract⟩.
Delmas, R.J., 1992. Environmental information from ice cores. Rev. Geophys. 30 (1),1–21. http://dx.doi.org/10.1029/91RG02725.
Delmonte, B., Baroni, C., Andersson, P.S., Schoberg, H., Hansson, M., Aciego, S., Petit,J.-R., Albani, S., Mazzola, C., Maggi, V., Frezzotti, M., 2010. Aeolian dust in theTalos Dome ice core (East Antarctica, Pacific/Ross Sea sector): Victoria landversus remote sources over the last two climate cycles. J. Quat. Sci. 25 (8),1327–1337, URL http://dx.doi.org/10.1002/jqs.1418.

S. Poluianov et al. / Journal of Atmospheric and Solar-Terrestrial Physics 121 (2014) 50–5858
Ebisuzaki, W., 1997. A method to estimate the statistical significance of a correla-tion when the data are serially correlated. J. Clim. 10, 2147–2153.
EPICA Community Members, 2004. Eight glacial cycles from an Antarctic ice core.Nature 429(6992), 623–628. URL ⟨http://nora.nerc.ac.uk/12161/⟩.
Grannas, A.M., Jones, A.E., Dibb, J., Ammann, M., Anastasio, C., Beine, H.J., Bergin, M.,Bottenheim, J., Boxe, C.S., Carver, G., Chen, G., Crawford, J.H., Dominé, F., Frey, M.M., Guzmán, M.I., Heard, D.E., Helmig, D., Hoffmann, M.R., Honrath, R.E., Huey,L.G., Hutterli, M., Jacobi, H.W., Klán, P., Lefer, B., McConnell, J., Plane, J., Sander,R., Savarino, J., Shepson, P.B., Simpson, W.R., Sodeau, J.R., von Glasow, R., Weller,R., Wolff, E.W., Zhu, T., 2007. An overview of snow photochemistry: evidence,mechanisms and impacts. Atmos. Chem. Phys. 7 (16), 4329–4373, URL ⟨http://www.atmos-chem-phys.net/7/4329/2007/⟩.
Grinsted, A., Moore, J.C., Jevrejeva, S., 2004. Application of the cross wavelettransform and wavelet coherence to geophysical time series. Nonlinear Process.Geophys. 11, 561–566.
Kepko, L., Spence, H., Smart, D.F., Shea, M.A., 2009. Interhemispheric observations ofimpulsive nitrate enhancements associated with the four large ground-level solarcosmic ray events (1940–1950). J. Atmos. Sol.-Terr. Phys. 71 (17–18), 1840–1845, URL⟨http://www.sciencedirect.com/science/article/pii/S1364682609001850⟩.
Kovaltsov, G., Mishev, A., Usoskin, I., 2012. A new model of cosmogenic productionof radiocarbon 14C in the atmosphere. Earth Planet. Sci. Lett. 337, 114–120.
Lachaux, J.-P., Lutz, A., Rudrauf, D., Cosmelli, D., Quyen, M.L.V., Martinerie, J., Varela, F.,2002. Estimating the time-course of coherence between single-trial brain signals:an introduction to wavelet coherence. Neurophysiol. Clin. 32 (3), 157–174, URL⟨http://www.sciencedirect.com/science/article/pii/S0987705302003015⟩.
Legrand, M., Mayewski, P., 1997. Glaciochemistry of polar ice cores: a review. Rev.Geophys. 35, 219–244.
Legrand, M.R., Kirchner, S., 1990. Origins and variations of nitrate in south polarprecipitation. J. Geophys. Res. 95 (D4), 3493–3507. http://dx.doi.org/10.1029/JD095iD04p03493.
Mayewski, P.A., Lyons, W.B., Spencer, M.J., Twickler, M., Dansgaard, W., Koci, B.,Davidson, C.I., 1986. Sulfate and nitrate concentrations from a south greenlandice core. Science 232 (4753), 975–977.
Mayewski, P.A., Lyons, W.B., Spencer, M.J., Twickler, M.S., Buck, C.F., Whitlow, S.,1990. An ice-core record of atmospheric response to anthropogenic sulphateand nitrate. Nature 346, 554–556.
McCracken, K., Dreschhoff, G., Zeller, E., Smart, D., Shea, M., 2001. Solar cosmic rayevents for the period 1561–1994: 1. Identification in polar ice, 1561–1950. J.Geophys. Res. 106, 21585–21598.
Palmer, A.S., Van Ommen, T.D., Curran, M.A.J., Morgan, V., 2001. Ice-core evidencefor a small solar-source of atmospheric nitrate. Geophys. Res. Lett. 28 (10),1953–1956. http://dx.doi.org/10.1029/2000GL012207.
Parrenin, F., Jouzel, J., Waelbroeck, C., Ritz, C., Barnola, J.-M., 2001. Dating the Vostokice core by an inverse method. J. Geophys. Res. Atmos. 106 (D23), 31837–31851.http://dx.doi.org/10.1029/2001JD900245.
Poluianov, S., Usoskin, I., 2014. Critical analysis of a hypothesis of the planetary tidalinfluence on solar activity. Sol. Phys. 289 (6), 2333–2342. http://dx.doi.org/10.1007/s11207-014-0475-0.
Preunkert, S., Jourdain, B., Legrand, M., Udisti, R., Becagli, S., Cerri, O., 2008.Seasonality of sulfur species (dimethyl sulfide, sulfate, and methanesulfonate)in Antarctica: inland versus coastal regions. J. Geophys. Res. Atmos. 113 (D15),D15302. http://dx.doi.org/10.1029/2008JD009937.
Rankin, A.M., Auld, V., Wolff, E.W., 2000. Frost flowers as a source of fractionatedsea salt aerosol in the polar regions. Geophys. Res. Lett. 27 (21), 3469–3472.http://dx.doi.org/10.1029/2000GL011771.
Reimer, P.J., Baillie, M.G.L., Bard, E., Bayliss, A., Beck, J.W., Blackwell, P.G., Ramsey, C.B., Buck, C.E., Burr, G.S., Edwards, R.L., Friedrich, M., Grootes, P.M., Guilderson, T.P., Hajdas, I., Heaton, T.J., Hogg, A.G., Hughen, K.A., Kaiser, K.F., Kromer, B.,McCormac, F.G., Manning, S.W., Reimer, R.W., Richards, D.A., Southon, J.R.,Talamo, S., Turney, C.S.M., van der Plicht, J., Weyhenmeye, C.E., 2009. INTCAL09and Marine09 radiocarbon age calibration curves, 0–50000 years cal BP.Radiocarbon 51 (4), 1111–1150.
Sala, M., Delmonte, B., Frezzotti, M., Proposito, M., Scarchilli, C., Maggi, V., Artioli, G.,Dapiaggi, M., Marino, F., Ricci, P., Giudici, G.D., 2008. Evidence of calcium carbonatesin coastal (Talos Dome and Ross Sea area) East Antarctica snow and firn:environmental and climatic implications. Earth Planet. Sci. Lett. 271 (1-4), 43–52,URL ⟨http://www.sciencedirect.com/science/article/pii/S0012821X08002045⟩.
Saltzman, E.S., Dioumaeva, I., Finley, B.D., 2006. Glacial/interglacial variations inmethanesulfonate (MSA) in the Siple dome ice core, west antarctica. Geophys.Res. Lett. 33 (11), L11811. http://dx.doi.org/10.1029/2005GL025629.
Saltzman, E.S., Savoie, D.L., Prospero, J.M., Zika, R.G., 1985. Atmospheric methane-sulfonic acid and non-sea-salt sulfate at fanning and american samoa. Geophys.Res. Lett. 12 (7), 437–440. http://dx.doi.org/10.1029/GL012i007p00437.
Schüpbach, S., Federer, U., Kaufmann, P.R., Albani, S., Barbante, C., Stocker, T.F.,Fischer, H., 2013. High-resolution mineral dust and sea ice proxy records from
the Talos Dome ice core. Clim. Past 9 (6), 2789–2807, URL ⟨http://www.clim-past.net/9/2789/2013/⟩.
Severi, M., Becagli, S., Castellano, E., Morganti, A., Traversi, R., Udisti, R., 2009. Thirty yearsof snow deposition at Talos Dome (Northern Victoria Land, East Antarctica):chemical profiles and climatic implications. Microchem. J. 92 (1), 15–20, URL⟨http://www.sciencedirect.com/science/article/pii/S0026265X08001008⟩.
Soon, W., Velasco Herrera, V.M., Selvaraj, K., Traversi, R., Usoskin, I., Chen, C.-T.A.,Lou, J.-Y., Kao, S.-J., Carter, R.M., Pipin, V., Severi, M., Becagli, S., 2014. A review ofholocene solar-linked climatic variation on centennial to millennial timescales:physical processes, interpretative frameworks and a new multiple cross-wavelet transform algorithm. Earth Sci. Rev. 134 (0), 1–15, URL ⟨http://www.sciencedirect.com/science/article/pii/S0012825214000518⟩.
Steinhilber, F., Abreu, J.A., Beer, J., 2008. Solar modulation during the Holocene.Astrophys. Space Sci. Trans. 4, 1–6.
Steinhilber, F., Abreu, J.A., Beer, J., Brunner, I., Christl, M., Fisher, H., Heikkilä, U.,Kubik, P.W., Mann, M., McCracken, K.G., Miller, H., Miyahara, H., Oerter, H.,Wilhelms, F., 2012. 9,400 years of cosmic radiation and solar activity from icecores and tree rings. Proc. Natl. Acad. Sci. USA 109 (16), 5967–5971.
Torrence, C., Compo, G., 1998. A practical guide to wavelet analysis. Bull. Am.Meteorol. Soc. 79, 61–78.
Traufetter, F., Oerter, H., Fischer, H., Weller, R., Miller, H., 2004. Spatio-temporalvariability in volcanic sulphate deposition over the past 2 kyr in snow pits andfirn cores from Amundsenisen, Antarctica. J. Glaciol. 50 (168), 137–146, URL⟨http://www.ingentaconnect.com/content/igsoc/jog/2004/00000050/00000168/art00014⟩.
Traversi, R., Becagli, S., Castellano, E., Largiuni, O., Migliori, A., Severi, M., Frezzotti,M., Udisti, R., 2004. Spatial and temporal distribution of environmental markersfrom coastal to plateau areas in Antarctica by firn core chemical analysis. Int. J.Environ. Anal. Chem. 84 (6-7), 457–470.
Traversi, R., Usoskin, I.G., Solanki, S.K., Becagli, S., Frezzotti, M., Severi, M., Stenni, B.,Udisti, R., 2012. Nitrate in polar ice: a new tracer of solar variability. Sol. Phys.280, 237–254.
Usoskin, I.G., 2013. A history of solar activity over millennia. Living Rev. Sol. Phys. 10(1), URL ⟨http://www.livingreviews.org/lrsp-2013-1⟩.
Usoskin, I.G., Alanko-Huotari, K., Kovaltsov, G.A., Mursula, K., 2005. Heliosphericmodulation of cosmic rays: monthly reconstruction for 1951–2004. J. Geophys.Res. 110, A12108.
Usoskin, I.G., Horiuchi, K., Solanki, S., Kovaltsov, G.A., Bard, E., 2009. On thecommon solar signal in different cosmogenic isotope data sets. J. Geophys.Res. Space 114 (A3), A03112. http://dx.doi.org/10.1029/2008JA013888, URL⟨http://www.livingreviews.org/lrsp-2013-1⟩.
Usoskin, I.G., Solanki, S.K., Kovaltsov, G.A., 2007. Grand minima and maxima ofsolar activity: new observational constraints. Astron. Astrophys. 471, 301–309.
Usoskin, I.G., Voiculescu, M., Kovaltsov, G.A., Mursula, K., 2006. Correlation betweenclouds at different altitudes and solar activity: fact or artifact?. J. Atmos. Sol.-Terr. Phys. 68, 2164–2172.
Vitt, F.M., Jackman, C.H., 1996. A comparison of sources of odd nitrogen productionfrom 1974 through 1993 in the earth's middle atmosphere as calculated using atwo-dimensional model. J. Geophys. Res. Atmos. 101 (D3), 6729–6739. http://dx.doi.org/10.1029/95JD03386.
Vonmoos, M., Beer, J., Muscheler, R., 2006. Large variations in holocene solaractivity: constraints from 10Be in the greenland ice core project ice core. J.Geophys. Res. 111 (A10), A10105.
Weller, R., Wagenbach, D., 2007. Year-round chemical aerosol records in continen-tal antarctica obtained by automatic samplings. Tellus B 59 (4), 755–765. http://dx.doi.org/10.1111/j.1600-0889.2007.00293.x.
Wolff, E.W., 1995. Nitrate in polar ice. In: Delmas, R.J. (Ed.), Ice Core Studies ofGlobal Biogeochemical Cycles. NATO ASI Series, vol. 30. Springer, Berlin,Heidelberg, pp. 195–224. http://dx.doi.org/10.1007/978-3-642-51172-1_10.
Wolff, E.W., Bigler, M., Curran, M.A.J., Dibb, J.E., Frey, M.M., Legrand, M., McConnell,J.R., 2012. The Carrington event not observed in most ice core nitrate records.Geophys. Res. Lett. 39, L08503.
Wolff, E.W., Jones, A.E., Bauguitte, S.J.-B., Salmon, R.A., 2008. The interpretation ofspikes and trends in concentration of nitrate in polar ice cores, based onevidence from snow and atmospheric measurements. Atmos. Chem. Phys. 8(18), 5627–5634, URL ⟨http://www.atmos-chem-phys.net/8/5627/2008/⟩.
Yang, X., Pyle, J.A., Cox, R.A., 2008. Sea salt aerosol production and bromine release:Role of snow on sea ice. Geophys. Res. Lett. 35 (16), L16815. http://dx.doi.org/10.1029/2008GL034536.
Yiou, F., Raisbeck, G., Baumgartner, S., Beer, J., Hammer, C., Johnsen, S., Jouzel, J.,Kubik, P., Lestringuez, J., Stiévenard, M., Suter, M., Yiou, P., 1997. Beryllium 10 inthe greenland ice core project ice core at summit, Greenland. J. Geophys. Res.102, 26783–26794.