journal of building performance simulation the impact of
TRANSCRIPT

PLEASE SCROLL DOWN FOR ARTICLE
This article was downloaded by: [Chvatal, Karin Maria Soares]On: 4 February 2011Access details: Access Details: [subscription number 917086477]Publisher Taylor & FrancisInforma Ltd Registered in England and Wales Registered Number: 1072954 Registered office: Mortimer House, 37-41 Mortimer Street, London W1T 3JH, UK
Journal of Building Performance SimulationPublication details, including instructions for authors and subscription information:http://www.informaworld.com/smpp/title~content=t787187009
The impact of increasing the building envelope insulation upon the risk ofoverheating in summer and an increased energy consumptionKarin Maria Soares Chvatala; Helena Corvachob
a Department of Architecture and Urbanism, São Carlos Engineering School, University of São Paulo,São Carlos, Brazil b Department of Civil Engineering - Building Division, Faculty of Engineering ofPorto University, Porto, Porto, Portugal
First published on: 13 August 2009
To cite this Article Chvatal, Karin Maria Soares and Corvacho, Helena(2009) 'The impact of increasing the buildingenvelope insulation upon the risk of overheating in summer and an increased energy consumption', Journal of BuildingPerformance Simulation, 2: 4, 267 — 282, First published on: 13 August 2009 (iFirst)To link to this Article: DOI: 10.1080/19401490903095865URL: http://dx.doi.org/10.1080/19401490903095865
Full terms and conditions of use: http://www.informaworld.com/terms-and-conditions-of-access.pdf
This article may be used for research, teaching and private study purposes. Any substantial orsystematic reproduction, re-distribution, re-selling, loan or sub-licensing, systematic supply ordistribution in any form to anyone is expressly forbidden.
The publisher does not give any warranty express or implied or make any representation that the contentswill be complete or accurate or up to date. The accuracy of any instructions, formulae and drug dosesshould be independently verified with primary sources. The publisher shall not be liable for any loss,actions, claims, proceedings, demand or costs or damages whatsoever or howsoever caused arising directlyor indirectly in connection with or arising out of the use of this material.

The impact of increasing the building envelope insulation upon the risk of overheating in summer
and an increased energy consumption
Karin Maria Soares Chvatala* and Helena Corvachob
aDepartment of Architecture and Urbanism, Sao Carlos Engineering School, University of Sao Paulo, Av. TrabalhadorSaoCarlense, 400, 13566-590, Sao Carlos, Brazil; bFaculty of Engineering of Porto University, Department of Civil Engineering –
Building Division, R: Dr Roberto Frias, Porto, 4200-465, Porto, Portugal
(Received 7 April 2009; final version received 5 June 2009)
This work describes a study aiming to establish the impact of the increase of the building envelope insulation uponthe thermal performance of buildings. A particular emphasis is placed upon the consequences in terms of highertemperatures in summer, potentially leading to increased needs for installation of air-conditioning. This study alsodescribes the coupled influence of other parameters that can reduce overheating, like solar shading and ventilation.The methodology is based on parametric studies obtained through simulations. The comfort analysis methodology isbased on the adaptive approach. The results show that, with added insulation, it is necessary to control solar andinternal gains more closely to avoid overheating in summer. Results also include the requirements to avoid air-conditioning, in terms of window shading for each level of insulation and internal gains.
Keywords: building envelope insulation; adaptive comfort; building simulation; air-conditioning avoidance
1. Introduction
Thermal regulations for buildings in the Europeancountries were recently revised to comply with theEuropean Directive on the Energy Performance ofBuildings (EU Official Journal 2003). One of theconsequences was the general adoption of stricterrequirements for insulation of the building envelope inthe European legislations. There was a strong pressurefrom industry (Ecofys 2004) and from the EuropeanCommission itself (EC 2005) to move towards higherinsulation levels in all types of buildings everywherein Europe. As an example, the Portuguese thermalregulations for residential buildings were recentlymodified (2006) and insulation requirements increasedby about 50% and a similar tendency was visible inmost EC countries (Maldonado 2005a,b; DGE 2006).
The benefits of increasing the insulation thicknessare evident in a typical winter situation, when a lowerU-value directly reduces heating needs. In countriesthat have long heating periods and short and mildsummers, e.g. northern European countries, the energyconsumption can be considerably reduced with theadoption of highly insulated envelopes.
However, the consequences during the summerperiod are not so evident. In certain conditions, whensolar and internal gains are not adequately controlled,a highly insulated envelope may cause a rise in theindoor temperature, possibly above acceptable
comfort limits. This problem can be found morefrequently in countries where summers have longperiods with high outdoor temperatures and high solarradiation exposure, which is the case of the southernEuropean countries.
In traditional southern European residential build-ings, air-conditioning is not usually needed. Architec-tural solutions are well adapted to such climates,taking advantage of high thermal inertia, good solarprotection and night ventilation. However, if there arechanges in the way that buildings are designed, and ifthe degree of discomfort becomes too important,overheating in summer can lead building occupantsto adopt air-conditioning, thereby increasing the totalenergy consumption of the building, possibly offsettingany savings obtained from increased insulation duringthe heating season. The sales of air-conditioning inEurope have been growing very fast in the last twodecades (Dupont and Adnot 2005), at a rate averaging10% or more per year, and this rate can become evenhigher by adding more insulation to the buildingenvelopes without taking additional measures to limitsummer overheating.
It thus seems wise to investigate the influence ofincreasing the building envelope insulation upon itsglobal thermal performance, in terms of the conse-quences of promoting overheating in summer. It isnecessary to determine the limit until such time it
*Corresponding author. Email: [email protected]
Journal of Building Performance Simulation
Vol. 2, No. 4, December 2009, 267–282
ISSN 1940-1493 print/ISSN 1940-1507 online
� 2009 International Building Performance Simulation Association (IBPSA)
DOI: 10.1080/19401490903095865
http://www.informaworld.com
Downloaded By: [Chvatal, Karin Maria Soares] At: 16:33 4 February 2011

becomes desirable to increase the insulation of theenvelope without causing summer overheating thatcould offset the significance of any savings in energyheating during winter.
To achieve this objective, it was decided to analysethe thermal behaviour of the envelope throughparametric studies obtained via computational simula-tions. Distinct building models with varying envelopeinsulation levels were studied, together with otherparameters that can reduce overheating, like solarshading and ventilation. High thermal inertia solutionswere preserved. The adaptive comfort approach wasused to evaluate the acceptability of the resultingindoor environments.
2. Parametric studies
2.1. First phase of simulations
In this phase, the simulations were carried out for threetypes of buildings (Figure 1), each one used either as aresidence or as a small office:
. A one-storey building (Building A),
. Two intermediate flats in multi-storey buildings(Buildings B and C).
All three typologies are quite current in southernEuropean construction and they all have a highthermal inertia. Reasonable ranges of window
Figure 1. Selected building models. (a) Building A. (b) Building B. (c) Building C. (d) Buildings characteristics.
268 K.M.S. Chvatal and H. Corvacho
Downloaded By: [Chvatal, Karin Maria Soares] At: 16:33 4 February 2011

shading, pattern of use of the building as a residenceor as an office, ventilation rates, envelope insulationand climate were considered for each of them. Thesimulations were performed both in free-float condi-tions and with heating and cooling systems (thermo-static conditions). Figure 2 shows an overall schemeof the studied combinations and Table 1 lists thedetailed input data for all the parametric studies.Table 2 presents the U-values for the externalenvelope of the simulated buildings and Table 3describes the average climatic data for the selectedlocations (Figure 3).
The simulations of the thermal behaviour of thebuildings were carried out with TRNSYS software(Solar Energy Laboratory 2002). Because of the largeamount of simulations (3780 individual cases), aprogram, named PARAM and written in Cþþ, was
prepared to automatically run TRNSYS for all thecases and to treat the outputs (post data processing)(Chvatal et al. 2003, 2005).
Figure 4 shows a simplified scheme of the wholeprocess. The first step consists of manually creating theTRNSYS input files for the base cases that are to beanalysed. The base case corresponds to a combinationof building and type of use (Figure 2). In thesesimulations, nine base cases were studied. TheseTRNSYS input files for each base case contain allthe information regarding geometrical characteristics,orientation and type of use (internal gains). Theseparameters are fixed and do not change during thesimulation process.
In the second step, the input files for the programPARAM are created. These files contain all neededdata to perform the parametric studies: climates,
Figure 2. Overall schemes of the parametric studies combinations for the first phase of simulations.
Journal of Building Performance Simulation 269
Downloaded By: [Chvatal, Karin Maria Soares] At: 16:33 4 February 2011

Table 1. Input data for the first phase of simulations.
Simulated buildings A, B and C (Figure 1)
External envelopeDouble external walls (Buildings A, B and C) Roof (Building A)(a) Render (2 cm) (a) Gravel (5 cm)(b) External ceramic hollow bricks (15 cm) (b) DPM (1 cm)(c) Intermediate air layer (2 cm) (c) Insulation (a)(d) Insulation (a) (d) Concrete (10 cm)(e) Internal ceramic hollow bricks (11 cm) (e) Concrete flat roof (13 cm)(f) Render (2 cm) (f) Render (2 cm)
Solar absorptance coefficient, exterior surface:0.6, interior surface: 0.3
Solar absorptance coefficient, exterior surface:0.6 / interior surface: 0.3
Floor (Building A)
Internal elementsInternal walls (Buildings A, B and C),ceramic hollow bricks masonry (11 cm)
Slab (Buildings B and C), concrete slab (18 cm)
External envelope insulationFive envelope insulation levels: [0/2], [2/4], [4/6],
[6/10] and [15/22] cm [wall insulation/roofinsulation thicknessesb]
Thermal conductivity of the insulation material: 0.04 W/m. 8C
Percentage of window areaWindow/floor area: 12.9% (building A), 11.6% (building B), 10.2% (building C)
Window shadingSummer WinterSeven possibilities of shadingc (corresponding
solar factors): 0.75 / 0.60 / 0.45 / 0.37 / 0.30 / 0.22 / 0.15No shading, corresponding solar factor ¼ 0.75
Types of useHousing (the original purpose of the buildings or apartments)Services (a small office, for example – this type of adaptation is common in the Portuguese reality. Two patterns of internal
gains were considered.)
Occupation scheduleUse: housing Use: services, patterns 1 and 2Between 18:00 and 09:00 h, on weekdays 24 h on weekends Between 09:00 and 18:00 h, on weekdays only
Occupied zones Occupied zonesBuilding A: zones 1, 3, 4 and 5 Building A: zones 1, 3, 4 and 5Building B: zones 1, 3, 4 and 5 Building B: zones 1, 2, 3, 4 and 5Building C: zones 1, 2 and 3 Building C: zones 1, 2 and 3
Internal gainsUse: housing, pattern 1 Use: services, pattern 23.3 W/m2 – average over 24 h, in the occupied zones 9.2 W/m2 – average over 24 h, in the occupied
zonesUse: services, pattern 314.8 W/m2 – average over 24 h, in the
occupied zones
VentilationTwo possibilities of ventilation: with minimum and night ventilation
Minimum ventilationConstant rate of 0.6 air changes/h
With night ventilationd
Use: housing Use: servicesNight ventilation between 18:00 and 24:00 h (3 air changes/h), every day. Night ventilation between 18:00 and 09:00 h
(5 air changes/h), on weekdays.During the night: no night ventilation due to noise constraints.
(continued)
(a) Wood (0.5 cm)(b) Mortar (2 cm)(c) Concrete (12 cm)(d) Gravel (15 cm)(e) Insulation (5 cm)
270 K.M.S. Chvatal and H. Corvacho
Downloaded By: [Chvatal, Karin Maria Soares] At: 16:33 4 February 2011

ventilation characteristics (number of air changes perhour and period of ventilation), window shading factorand envelope insulation levels, as well the heating andcooling system characteristics (set point temperature,period of use, etc.).
After the input files are completed, the third stepsimply consists of running PARAM. The programautomatically creates the TRNSYS input files for eachindividual case to be simulated, runs TRNSYS andthen performs the post processing of the results, i.e.hourly values of the indoor temperature for each zone,for the whole year, as well as the heating and coolingloads. Post processing treats these data to obtainsummarized results and to show the differencesbetween each case. It includes the comfort analysisdescribed in detail in Section 3.
2.2. Second phase of simulations
To analyse the influence of diurnal ventilation and toverify the validity of the obtained results for othersouthern European climates, another set of simulationswas conducted (Figure 5), which corresponds to 1020individual cases. The process was the same as the onedescribed in the previous section. The input data arepresented in Table 4. Table 3 describes the averageclimatic data.
3. Comfort analysis methodology
Finding an answer to the question that this studyaddresses rests on being able to set an objectivecriterion to define when an occupant feels enoughdiscomfort, in terms of both intensity and length ofexposure, to decide to install and use an air-condi-tioner. It is assumed that there are no economicconstraints that would prevent occupants from instal-ling and running AC equipment.
Comfort analyses of the indoor environments arecovered by ISO 7730 (2005), based on the well-knownFanger theory. However, thermal comfort field studieshave demonstrated some room for improvement inthe predictions of the real mean vote (Nicol andHumphreys 2002). In these field surveys, the subjectsdemonstrated, with good statistical confidence, toaccept a wider range of environmental conditionsthan those set by ISO 7730. One of the reasons forthese differences is the capacity of adaptation of thesubjects, e.g. the possibility that they have to makesome changes in their thermal environment, likeopening/closing windows, adjusting clothing, location,shading and ventilation conditions, etc. This wouldallow them to tolerate indoor conditions outside thenarrow limits prescribed by the ISO standard, whereno adaptation possibility is taken into account. Therecent revision of the ASHRAE Standard 55 (De Dearand Brager 2002; ASHRAE 2004) also includes anadaptive model, which became an alternative to thedeterministic method prescribed in its previous version.This approach can be used for naturally ventilatedbuildings that obey certain restrictions, on the basis ofresearch carried out using an extensive worldwidedatabase of thermal comfort field studies. The recentEN 15251 standard (Criteria for the Indoor Environ-ment including thermal, indoor air quality, light andnoise) (CEN 2007), linked to the implementationof the EPBD, also offers some room for adaptive
Table 1. (Continued).
Simulated buildings A, B and C (Figure 1)
ClimateThree climates: Porto, Lisbon and Evora
Typical of the three Portuguese summer climatic zones, according to building Regulations (DGE 2006) Table 3 and Figure 3.The hourly climate data for these three cities were generated by the Meteonorm program (Meteotest 2000).
Heating and Coolinge
Summer setpoint temperature: 258C Winter setpoint temperature: 208C
aThe external envelope is always the same, but the insulation thickness changes. Table 2 presents the U-values for the external envelope.bBuildings B and C are located in intermediate floors and consequently have no slab insulation.cFixed external shading.dThere is night ventilation only during summer and if the outdoor temperature is lower than the indoor temperature.eThere is heating and cooling only in the occupied zones. When it is necessary, heating or cooling begin automatically. This is considered for thecorrespondent occupation period, during the whole year.
Table 2. U-values (W/m2 8C) for the external envelope ofthe simulated buildings.
Envelope insulationlevel 1 2 3 4 5
Insulation thickness(cm) [wall/slab]
[0/2] [2/4] [4/6] [6/10] [15/22]
Wall U-value 0.91 0.64 0.47 0.37 0.20Roof U-value 0.80 0.50 0.38 0.27 0.14
Journal of Building Performance Simulation 271
Downloaded By: [Chvatal, Karin Maria Soares] At: 16:33 4 February 2011

considerations but they seem short when comparedto the full potential identified by Humphreys andNicol.
In the adaptive comfort theory, comfort tempera-ture is closely related to the prevailing outdoorambient temperature, as described by Equation (1)(McCartney and Nicol 2002):
Tc ¼ a � Tout þ b ð1Þ
where, Tc: comfort temperature, corresponding to theneutral comfort vote in the ASHRAE scale (ASHRAE2004); Tout: outdoor temperature index, for example,the average outdoor temperature; a, b: constantsobtained from regression analysis of measured datain field studies.
The adaptive comfort theory fits exactly into thetraditional lifestyle of southern Europeans in theirdwellings and unconditioned offices. It thus seemsmore realistic to use this approach rather than themore deterministic ISO 7730.
Table 3. Average climate data for the studied climates.
Latitude(8north)
Temperature (8C) Humidity (%)
Globalhorizontal
radiation (kWh/m2) Heating degreedays (8C/day)
Summer Winter Summer Winter Summer Winter Winter
Porto 41.08 19.6 9.8 74.0 80.7 208 48 479Lisbon 38.43 22.3 11.8 63.7 79.0 225 58 309Evora 38.34 22.6 9.8 48.7 75.7 241 61 479Athens 38.04 25.0 11.6 51.0 71.3 213 52 325Nice 43.40 22.1 9.2 71.7 66.3 207 46 524
Temperature and humidity: average of monthly averages from July, August and September (summer) and from December, January and February(winter). The monthly averages are based on hourly data.
Global horizontal radiation: maximum of monthly averages and minimum of monthly averages.
Heating degree days: reference temperature: 158C, during December, January and February. The differences were calculated using the hourlydata.
Figure 3. Climatic zones for summer, in Portugal and theselected cities for the parametric studies.
Figure 4. Simplified scheme of the simulation process.
272 K.M.S. Chvatal and H. Corvacho
Downloaded By: [Chvatal, Karin Maria Soares] At: 16:33 4 February 2011

A recent European study, with the main purpose todevelop an adaptive control algorithm fitting Equation(1), provided data for calculation of a and b constantsfine-tuned to the southern European population. Itincluded field studies in Portugal, France and Greece,as well as in other more northern climates (McCartney
and Nicol 2002) and provided adaptive algorithms foreach country. For Portugal, Greece and France,Equation (1) thus becomes:Portugal:
Tc ¼ 0:381 � TRM þ 18:12 ð�CÞ ð2aÞ
Table 4. Input of data for the second phase of simulations.
Window shading (fixed external shading)
Simulated buildings A, B, C (Figure 1) Summer Winter
Three possibilities of shading(corresponding solar factors):0.75 / 0.37 / 0.15
No shading (corresponding solar factor):0.75
Types of useHousing, pattern 1, and services, pattern 3
(occupation schedule and internal gains according to the description presented in Table 1)Ventilation: with minimum and with day þ night ventilationWith minimum ventilation: constant rate of 0.6 air changes/h
With day þ night ventilationa
Use: housing Use: servicesVentilation between 09:00 and
24:00 h (3 air changes/h), every dayVentilation 24 h (5 air changes/h),
every day.ClimateAthens and Nice þ Evora, Porto and LisbonHourly climate data generated by the Meteonorm program (Meteotest 2000)
aThere is ventilation during summer only if the outdoor temperature is lower than the indoor temperature.
External and internal envelope, insulation levels, percentage of window area and heating and cooling characteristics are the same as thosedescribed in Table 1.
Figure 5. Overall schemes of the parametric studies combinations for the second phase of simulations.
Journal of Building Performance Simulation 273
Downloaded By: [Chvatal, Karin Maria Soares] At: 16:33 4 February 2011
Greece:
Tc ¼ 0:205 �TRM þ 21:69 ð�CÞ for TRM > 10�Cð Þ ð2bÞ
Tc ¼ 22:88 ð�CÞ for TRM � 10�Cð Þ
France:
Tc ¼ 0:206 � TRM þ 21:42 ð�CÞ for TRM > 10�Cð Þ ð2cÞ
Tc ¼ 0:049 �TRM þ 22:58 ð�CÞ for TRM � 10�Cð Þ ð2dÞ
In Equation (2a–d), TRM is the running meanoutdoor temperature. It is the outdoor temperatureindex that produces better accuracy and that canbetter reflect the time-dependency of the comforttemperature. It is similar to the half-life radioactivedecay calculations, and it is calculated on a dailybasis. In this case, it corresponds to a half-life of*3.5 days, according to the following Equation (3):
TnRM ¼ 0:80 � Tn�1
RM þ 0:20 � Tn�1DM ð
�CÞ ð3Þ
where, TnRM: running mean temperature on day ‘n’;
Tn�1RM: running mean temperature on day ‘n71’; Tn�1
DM:daily mean temperature on day ‘n71’.
At day 1, TnRM is assumed to be the same as mean
outdoor ambient temperature.Using the above equations, daily comfort tempera-
tures were obtained for the five cities for a whole typicalyear. The maximum values of the comfort temperaturewere found to be 26.78C for Porto, 27.48C for Lisbon,27.78C for Evora, 27.58C for Athens and 26.68C forNice.
The comfort temperature corresponds to a neutralthermal sensation vote. The comfort zone was estab-lished as+28C around the comfort temperature, accor-ding to Nicol and Humphreys (2005). Actually, there isnot an exact limit between comfort and discomfort, butthis is the recommended range to avoid an increasedsense of discomfort anddissatisfactionwith the ambient.
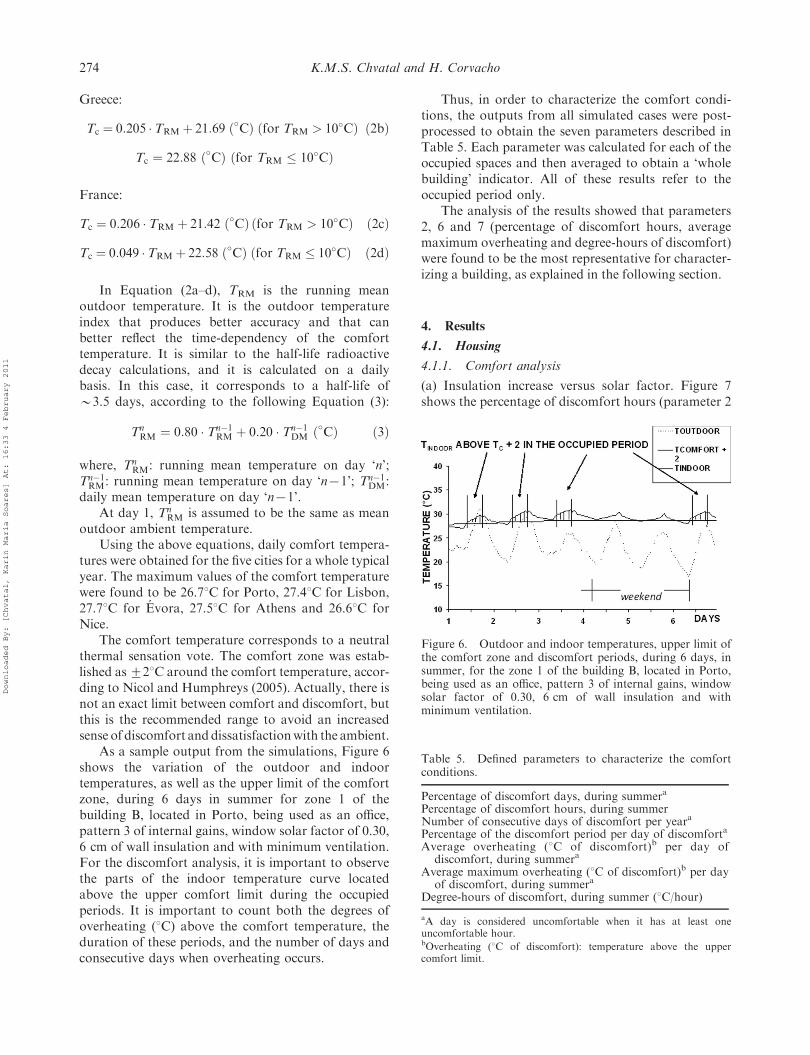
As a sample output from the simulations, Figure 6shows the variation of the outdoor and indoortemperatures, as well as the upper limit of the comfortzone, during 6 days in summer for zone 1 of thebuilding B, located in Porto, being used as an office,pattern 3 of internal gains, window solar factor of 0.30,6 cm of wall insulation and with minimum ventilation.For the discomfort analysis, it is important to observethe parts of the indoor temperature curve locatedabove the upper comfort limit during the occupiedperiods. It is important to count both the degrees ofoverheating (8C) above the comfort temperature, theduration of these periods, and the number of days andconsecutive days when overheating occurs.
Thus, in order to characterize the comfort condi-tions, the outputs from all simulated cases were post-processed to obtain the seven parameters described inTable 5. Each parameter was calculated for each of theoccupied spaces and then averaged to obtain a ‘wholebuilding’ indicator. All of these results refer to theoccupied period only.
The analysis of the results showed that parameters2, 6 and 7 (percentage of discomfort hours, averagemaximum overheating and degree-hours of discomfort)were found to be the most representative for character-izing a building, as explained in the following section.
4. Results
4.1. Housing
4.1.1. Comfort analysis
(a) Insulation increase versus solar factor. Figure 7shows the percentage of discomfort hours (parameter 2
Table 5. Defined parameters to characterize the comfortconditions.
Percentage of discomfort days, during summera
Percentage of discomfort hours, during summerNumber of consecutive days of discomfort per yeara
Percentage of the discomfort period per day of discomforta
Average overheating (8C of discomfort)b per day ofdiscomfort, during summera
Average maximum overheating (8C of discomfort)b per dayof discomfort, during summera
Degree-hours of discomfort, during summer (8C/hour)
aA day is considered uncomfortable when it has at least oneuncomfortable hour.bOverheating (8C of discomfort): temperature above the uppercomfort limit.
Figure 6. Outdoor and indoor temperatures, upper limit ofthe comfort zone and discomfort periods, during 6 days, insummer, for the zone 1 of the building B, located in Porto,being used as an office, pattern 3 of internal gains, windowsolar factor of 0.30, 6 cm of wall insulation and withminimum ventilation.
274 K.M.S. Chvatal and H. Corvacho
Downloaded By: [Chvatal, Karin Maria Soares] At: 16:33 4 February 2011

of Table 5) during summer, for the building B whenused as a dwelling, with minimum ventilation, inEvora, which corresponds to the warmest summerzone of Portugal (Figure 3 and Table 3). The ‘x’ axisrepresents the insulation thickness used in the externalenvelope and each curve corresponds to one particularwindow solar factor (window shading).
Depending on the solar factor, there are differentpatterns of behaviour as the insulation increases:
. When there is little shading (high solar factor,which means high solar gains), there is atendency towards more discomfort as the insula-tion increases.
. However, when shading is more effective (lowersolar factor and lower solar gains), the discom-fort is low and it decreases even when theinsulation increases.
This shows that the increase of the insulation of theenvelope is favourable only when window solar gainsare below certain limits. In this specific example, thecross-over point, i.e. the solar factor above whichincreased insulation results in worse building perfor-mance in summer is 0.32. This value was established bya specially refined running of the building model, tolook for the precise value of the solar factor thatproduced different behaviours just below and above it.
(b) Selected comfort parameters. For the othercomfort parameters of Table 5, the same type of resultwas observed (Figure 8a–f): there are clearly differentpatterns of behaviour depending on the solar factor.Well-insulated envelopes with insufficient shading(high solar factors and high solar gains) have atendency for more discomfort, in all aspects (duration,
maximum overheating, etc.). Because of the similaritiesof the observed patterns (or trends), it is not necessaryto consider all these comfort parameters to character-ize the level of summer discomfort in a building.Therefore, only some of them were selected.
The selection of the most representative parameterstook into account the evaluation of the discomfort periodsin terms of both intensity and length of exposure. Thepercentage of discomfort hours (Figure 7) was chosen torepresent the duration of the discomfort period, and theaverage maximum daily overheating (Figure 8e), thehighest intensity of this discomfort. The degree-hours(Figure 8f) complete the discomfort characterization,integrating the information from both the duration andthe intensity in only one parameter.
(c) Influence of ventilation. Figure 9a–c shows thesame type of results, both for the case above, withminimum ventilation, and for the cases with day and/ornight ventilation. The presented window solar factorsare 0.75 and 0.37. As was expected, when there is moreventilation, there is less discomfort. Ventilation gives animportant contribution to remove the heat accumulatedinside the building. Ventilation during the day and nightshowed to be more effective than during the night only,because exterior summer temperatures are belowcomfort level during many days. When insulation isadded to the envelope, the discomfort does not increaseas it increases for the case with minimum ventilation (insome cases, it does not even increase) and the cross-overpoint corresponds to a higher solar factor. In this case,the building can accept higher solar gains than withminimum ventilation and still be comfortable withhigher insulation of the envelope. The cross-over pointsare presented in Figure 9d.
(d)BuildingsA,BandCandother climates.BuildingsA andC showed the same pattern of behaviour as the onedescribed for building B. In building C (Figure 10), therewas only a slight difference: in some cases, the discomfortincreases as more insulation is added to the envelope,even when solar gains are low.Nevertheless, this increaseis very small, compared to what is observed when thesolar shading is inefficient. Building B presented thehighest values of discomfort in all aspects, followed by Cand A, respectively.
For the other southern European climates, namelyLisbon, Porto, Athens and Nice, the same pattern ofbehaviour presented for Evora was observed, regard-ing insulation increase versus shading.
4.1.2. Energy consumption
Figure 11a–c shows, respectively, the heating, coolingand heating plus cooling energy consumption for thebuilding C, also located in Evora. The heating andcooling energy consumptions have the same
Figure 7. Percentage of discomfort hours, during summer,for the building B, when used for housing, with minimumventilation, various solar factors and envelope insulationlevels, in Evora.
Journal of Building Performance Simulation 275
Downloaded By: [Chvatal, Karin Maria Soares] At: 16:33 4 February 2011

Figure 8. Results for the building B, used for housing, with minimum ventilation and various solar factors, in Evora.(a) Percentage of discomfort days, during summer. (b) Number of consecutive days of discomfort per year. (c) Percentage of thediscomfort period per day, during summer. (d) Average overheating per day, during summer. (e) Average maximum overheatingper day, during summer. (f) Degree-hours of discomfort, during summer.
276 K.M.S. Chvatal and H. Corvacho
Downloaded By: [Chvatal, Karin Maria Soares] At: 16:33 4 February 2011

conversion factors to primary energy, taking theirrespective efficiencies and the used systems intoconsideration (DGE 2006). Therefore, heating pluscooling energy consumption directly indicates theresultant primary energy.
The heating consumption always decreases as theinsulation increases (Figure 11a), in opposition to thecooling consumption, which, in most of the cases,increases as more insulation is added to the envelope(Figure 11b). But the increase in the cooling consump-tion is not sufficient to offset the much larger energysavings produced by the added insulation during thewinter. The consequence is that the heating þ coolingenergy consumption always decreases (Figure 11c),even when air conditioning is adopted and fully usedduring summer under thermostatic control mode. ButFigure 11 clearly shows that an analysis based onheating needs alone can be totally misleading, as the
Figure 9. Results for the building B, used for housing, with distinct patterns of ventilation and window solar factors (0.75 and0.37), during summer, in Evora. (a) Percentage of discomfort hours. (b) Average maximum overheating per day. (c) Degree-hoursof discomfort. (d) Cross-over points.
impact of cooling energy consumption severely reducesthe benefits of added insulation on a yearly basis. Thesame type of results was found for the other buildingtypes and climates.
4.1.3. Recommendations for the housing use
Summing up the results for the use of the building as aresidential unit, the following was observed:
. Solar gains need to be carefully avoided insummer, especially when ventilation is low,coupled to enough thermal inertia indoors. Ifsolar gains are too high, increases in insulationthickness will result in increasing the discomfortin summer. This could lead to higher AC energyconsumption, reducing most of the benefitsobtained during the heating season.
Journal of Building Performance Simulation 277
Downloaded By: [Chvatal, Karin Maria Soares] At: 16:33 4 February 2011

4.2. Office
4.2.1. Comfort analysis
Offices, with higher internal gains, behave in a differentway than when the same unit is used as a housing unit.Even with efficient shading, discomfort is clearly muchhigher, in all aspects. Results are shown in Figure 12,for building B, in Evora, with the lowest solar gains(solar factor equal to 0.15) and two different levels ofinternal gains (patterns 2 and 3). When the ventilationis at its lowest, there is always more discomfort as theinsulation increases, even for the lowest solar gains(low solar factor). Discomfort occurs during nearly100% of the occupied time in many cases, and theaverage maximum overheating reaches 13.28C in theworst situation (building B, in Evora, higher internalgains, with no shading and highly insulated envelope).In this type of use, the use of air-conditioning is muchmore common than in dwellings.
With higher ventilation rates, the effects are similarto those observed for dwellings: the discomfort isalways reduced, and day plus night ventilation showedto be more effective. When internal gains are reduced(from internal gains pattern 3 to 2), the discomfortalso decreases, but not as much as it decreaseswith ventilation (Figure 12). Of course, the bestresults can be achieved when both strategies, i.e.ventilation and the reduction of internal gains areconsidered.
Similar results were obtained for buildings A and Cand for the other climates, with obviously differentvalues. The differences between the buildings andbetween the climates were the same as those observedfor dwellings. Depending on the climate, the buildingtypology, solar factor, the pattern of gains and theamount of ventilation, the discomfort can be low andthe insulation can be increased without causing over-heating or not. For example, for building B, in Evora,
Figure 10. Results for the building C, used for housing, with distinct patterns of ventilation, window solar factors (0.75 and0.37), during summer, in Evora. (a) Percentage of discomfort hours. (b) Average maximum overheating per day. (c) Degree-hoursof discomfort.
278 K.M.S. Chvatal and H. Corvacho
Downloaded By: [Chvatal, Karin Maria Soares] At: 16:33 4 February 2011

Figure 11. Energy consumption for building C, used for housing, in Evora. (a) Heating consumption. (b) Cooling consumption.(c) Heating plus cooling consumption.
Figure 12. Percentage of discomfort hours for building B, with different patterns of ventilation, window solar factor: 0.15, usedfor housing and as an office (two patterns of internal gains: 2 and 3), in Evora.
Journal of Building Performance Simulation 279
Downloaded By: [Chvatal, Karin Maria Soares] At: 16:33 4 February 2011
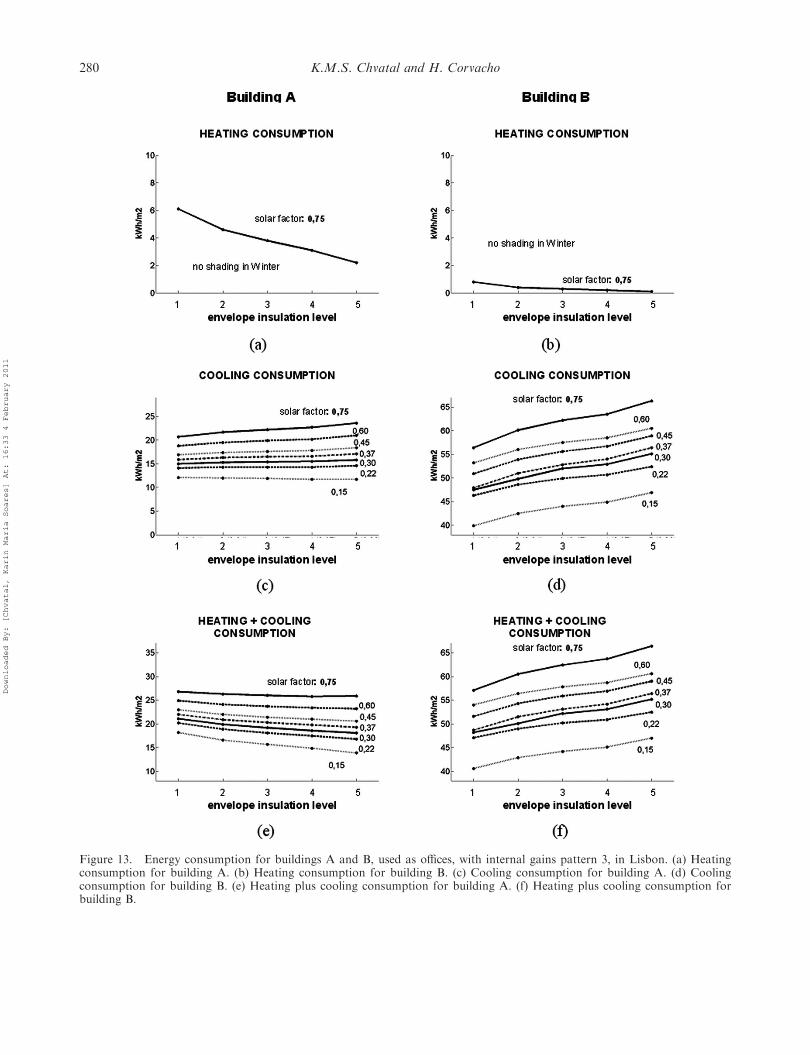
Figure 13. Energy consumption for buildings A and B, used as offices, with internal gains pattern 3, in Lisbon. (a) Heatingconsumption for building A. (b) Heating consumption for building B. (c) Cooling consumption for building A. (d) Coolingconsumption for building B. (e) Heating plus cooling consumption for building A. (f) Heating plus cooling consumption forbuilding B.
280 K.M.S. Chvatal and H. Corvacho
Downloaded By: [Chvatal, Karin Maria Soares] At: 16:33 4 February 2011

with high insulation, the percentage of discomforthours varies from 100% (services use pattern 3,minimum ventilation and solar factor equal to 0.75)to 9.8% (services use pattern 2, day ventilation andsolar factor equal to 0.37).
4.2.2. Energy consumption
Unlike the pattern observed in residential buildings,the AC consumption increase is sufficiently high tooffset the energy savings in winter in many cases, as isshown in Figure 13f, for building B, in Lisbon, withinternal gains pattern 3. Figure 13b and d shows,respectively, the heating and cooling consumption forthe same building.
This type of result was observed both for buildingsB and C, in all cases with the highest values of internalgains (pattern 3). When the internal gains of thesebuildings are lower (pattern 2), the situation changesand the increase in cooling is not sufficient to under-mine the heating energy savings. This last situation wasalso observed for all cases studied for building A, evenfor the higher internal gains, as is shown in Figure 13a,c and e.
The significance of internal gains is clear and it canbe concluded that this type of buildings should not behighly insulated, when internal gains are high andcannot be reduced. For all situations, more shadinghas a positive effect in the heating þ coolingconsumption, showing the importance of solar gainscontrol. Nevertheless, the same question about in-creased energy consumption for lighting, explained inthe housing use, needs to be considered.
4.2.3. Recommendations for the office use
Summing up the results for the office use, the followingwas observed:
. Offices, with higher internal gains, should not behighly insulated. Solar and internal gains need tobe carefully avoided and ventilation should beadopted to reduce the discomfort.
. Beyond the discomfort problem, the AC con-sumption increase can be sufficiently high tooffset the heating savings and to contribute toincrease the total energy consumption of thebuildings as envelope insulation increases.
5. Conclusions
This study aimed at evaluating the influence of theincrease of the envelope insulation upon overallbuilding performance. It clearly has a beneficial effectin winter, but not always in summer. It was necessary
to determine the limit until which it is possible toincrease the insulation of the envelope without causingsummer overheating, which would lead to more airconditioning, thereby eliminating any energy heatingsavings gained during winter.
The methodology is based on parametric studiesobtained through simulations. Distinct building mod-els were studied. They had distinct envelope insulationlevels, but a high level of thermal inertia has beenensured for all cases. The coupled influence of otherparameters that can reduce the overheating, like solarshading and ventilation, has also been considered. Theadaptive comfort approach has been used to evaluatethe acceptability of the resulting indoor environments.
The main conclusions are as follows:
. When the gains (internal or solar) are notadequately controlled, there is a tendency to-wards more summer discomfort as the envelopeinsulation increases.
. If there is ventilation, the building remainscomfortable during a higher proportion of thetime (or, at least, the discomfort is reduced).
. In some cases, ventilation can be enough topractically eliminate the influence of the increaseof insulation of the envelope.
. The level of envelope insulation should remainbelow the threshold that would lead to theprobable installation of air-conditioning, toavoid increased investment and running costs.
. Indiscriminate conversion of buildings designedfor housing to commercial purposes should becarefully evaluated. Adding insulation may bebeneficial for housing units, but it may be undesir-able for the same building used as a small office,resulting in increased overall energy consumption.
This research brings a new view regarding the studyof the influence of the envelope insulation. It indicatesthat highly insulated envelopes, traditionally consid-ered energy savers and the best option to providecomfort, cannot always bring benefits. Future workscould analyse the coupled impact of reflectivity andemissivity of the walls and roofs, as well as performsimulations in a wider range of climates, namely colderplaces (where heating is used most of the time) andwarmer climates (for example, the tropical ones).
References
ASHRAE Standard 55, 2004. Thermal environmental condi-tions for human occupancy. Atlanta: ASHRAE Inc.
Chvatal, K.M.S., Corvacho, M.H.P., and Maldonado,E.A.B., 2003. Analysis of envelope thermal behaviourthrough parametric studies. In: Proceedings of BuildingSimulation, Eindhoven, The Netherlands, 195–202.
Journal of Building Performance Simulation 281
Downloaded By: [Chvatal, Karin Maria Soares] At: 16:33 4 February 2011

Chvatal, K.M.S., Maldonado, E.A.B., and Corvacho,M.H.P., 2005. The impact of envelope insulation andventilation on summer performance. In: Proceedings ofInternational Conference Passive and Low Energy Coolingfor the Built Environment, Santorini, Greece, 823–828.
Direccao Geral de Energia, 2006. DL 80/2006, 4 de Abril.Rules for the thermal characteristics of building envelopes.Lisbon, Portugal.
De Dear, R.J. and Brager, G.S., 2002. Thermal comfort innaturally ventilated buildings: revisions to ASHRAEStandard 55. Energy and Buildings, 34, 549–561.
Dupont, M. and Adnot, J., 2005. Inspection and auditing ofair-conditioning facilities in Europe – a new efficiencytarget. Mandelieu, France: ECEEE (European Councilfor an Energy Efficient Economy) Summer Study.
Ecofys, 2004. Mitigation of CO2 emissions from the buildingstock. Beyond the EU directive on the energy performanceof buildings. Koln, Germany: EURIMA.
EU Official Journal, 2003. Directive on the energy perfor-mance of buildings 2002/91/CE. 4/January.
European Commission, 2005. Green paper on energyefficiency: doing more with less. COM (2005) 265,Brussels.
European Committee for Standardization, CEN, 2007. EN15251. Indoor environmental input parameters for designand assessment of energy performance of buildingsaddressing indoor air quality, thermal environment,lighting and acoustics.
ISO 7730, 2005. Ergonomics of the thermal environment.Analytical determination and interpretation of thermalcomfort using calculation of the PMV and PPD indicesand local thermal comfort criteria. Geneva: InternationalOrganization for Standardization.
Maldonado, E., 2005a. The impacts of the EPBD upon thesummer performance of buildings. In: Proceedings ofinternational conference passive and low energy cooling forthe built environment, Santorini, Greece, 797–802.
Maldonado, E., 2005b. The concerted action for thetransposition of the directive on the energy performanceof buildings (EPBD). In: Proceedings of the AIVCconference, Brussels, Belgium.
McCartney, K.J. and Nicol, J.F., 2002. Developing anadaptive control algorithm for Europe. Energy andBuildings, 34, 623–635.
Nicol, J.F. and Humphreys, M.A., 2002. Adaptive thermalcomfort and sustainable thermal standards for buildings.Energy and Buildings, 34, 563–572.
Nicol, J.F. and Humphreys, M.A., 2005. Maximum tempera-tures in buildings to avoid heat discomfort. In: Proceedingsof international conference passive and low energy cooling forthe built environment, Santorini, Greece.
Solar Energy Laboratory, 2002. TRNSYS version 15.Wisconsin, USA: Solar Energy Laboratory.
282 K.M.S. Chvatal and H. Corvacho
Downloaded By: [Chvatal, Karin Maria Soares] At: 16:33 4 February 2011