journal of business management - banku augstskola · creativity. organizational climate is the...
TRANSCRIPT
ISSN 1691-5348
Journal of Business Management
Issue No.9
2015

Journal of Business Management, 2015, No.9 ISSN 1691-5348
2
THE EDITORIAL BOARD
Dr. K.Balaton, Corvinus University of Budapest, Hungary
Dr. D.Kamerade- Hanta, University of Birmingham, United Kingdom
Dr. O.Gjolberg, University of Life Sciences, Norway
Dr. J.Hassid, University of Piraeus, Greece
Dr. V.Kozlinskis, Head of the Editorial Board, Riga International School of
Economics and Business Administration, Latvia
Dr. V.Kundrotas, Adizes Graduate School, USA
Dr. T.Mets, University of Tartu, Estonia
Dr. D.Pavelkova, Tomas Bata University in Zlin, Czech Republic
Dr A.Sauka, Stockholm School of Economics in Riga, Latvia
Dr. I.Sennikova, Riga International School of Economics and Business
Administration, Latvia
Dr. I.Strelets, Moscow State Institute of International Relations, Russia
Dr. T.Volkova, BA School of Business and Finance, Latvia
Dr. B.Butler, Curtin University, Australia
Dr. A.Vorobjovs, Daugavpils University, Latvia (invited for the business psychology section)
Dr. M.Zakrizevska, Riga International School of Economics and Business
Administration, Latvia (invited for the business psychology section)
Journal of Business Management, 2015, No.9 ISSN 1691-5348
3
FOREWORD
A portfolio of the 9th
issue of The Journal of Business Management consists of papers presented
at an online scientific conference “Business Psychology – Gateway to Sustainable and Successful
Business” as well as papers submitted in the first half of 2015. Accordingly, the new issue is
divided into two sections: business psychology (six papers) and management (five papers).
Business psychology is one of the cornerstones of successful and sustainable business.
Understanding of the science of human behaviour coupled with experience and knowledge of
management and working environment ensures effective and sustainable performance for both
individuals and organisations.
The online scientific conference “Business Psychology – Gateway to Sustainable and
Successful Business” brought together junior and senior researchers to discuss their academic
interests and applied business cases in an innovative way.
Topics covered in the selected papers include: organisational culture and climate, occupational
stress, professional deformation and burnout, leadership, innovations, and idea management,
amongst others.
The papers devoted to management problems cover such issues as acquisition of firms, system
of innovation management, idea management, etc. underpinning their theoretical and practical
significance.
Every paper went through the double-blind peer review process. Eleven papers were shortlisted
as a result.
Head of the Editorial Board,
Professor Dr. Vulfs Kozlinskis
Member of the scientific virtual conference
“Business Psychology - Gateway to Sustainable
and Successful Business” organising committee
Dr.Maija Zakrizevska
Journal of Business Management, 2015, No.9 ISSN 1691-5348
4
TABLE OF CONTENTS
Dubkevics, L. Interrelation Between Organizational Culture and Climate for Creativity in State
Theatres in Latvia 5
Zakrizevska, M., Bulatova, J. Occupational Stress and Professional Deformation Among
University Academic Staff 20
Bulatova, J. The Role of Leadership in Creation of Organisational Trust 28
Musura, A., Petrovecki, K. Mental Accounting and Related Categorizations in the Context of
Self - Regulation 34
Zakrizevska, M. Professional Burnout of Special Education Teachers in Latvia 47
Blumberga, S., Austruma, S. Psychological Climate, Leadership Style and Workplace Stress at
Fuel & Retail Company 56
Cirjevskis, A. Empirical Testing of ARCTIC Model for Assessment of Competence Based
Synergy in Acquisition Process 63
Mihailovs, J., Kreituss, I. Optimal Risk/Return Trade – Off of the 2nd
Pillar Pension Plans in
Latvia 74
Vasiljeva, T., Sinkovskis, I. Exploratory Study of E – Services Introduction in Health Industry 87
Resele, L. Impact of the National Innovation System on Innovation 97
Mikelsone, E., Liela, E. Literature Review of Idea Management: Focuses and Gaps 107
Journal of Business Management, 2015, No.9 ISSN 1691-5348
5
INTERRELATION BETWEEN ORGANIZATIONAL CULTURE AND
CLIMATE FOR CREATIVITY IN STATE THEATRES IN LATVIA
Lotars Dubkevics
BA School of Business and Finance, K.Valdemara str.161, LV - 1013, Riga, Latvia.
e-mail: [email protected]
ABSTRACT
The purpose of the research paper is to study interrelation between organizational culture and climate for creativity in
state theatres in Latvia.
Main methods used for research: The Organizational Culture Assessment Methodology and Instrument, KEYS
methodology and Instrument, interviews, mathematical statistical methods.
Design of the research methodology as well as the model for interrelation between organizational culture and climate
for creativity and also be used in research in other industries.
Paper type: research paper.
Keywords: organizational culture, organizational climate, creativity.
1.INTRODUCTION
In the current (changing) economic situation it is a positive and promising fact, that concepts like
innovation, innovative entrepreneurship, creativity and creative economy, become increasingly important in
the acoustic field of Latvian business management education and practice. This indicates a change in
understanding and the way of thinking in business and society. All of the above is also related to
organizational culture and climate (Dubkevics, 2009).
Creative industries already by definition are associated with the above-mentioned concepts. Definitions of
creative industries in management science are different, but not contradictory. Creative industries can be
described as the convergence of creative arts (individual creativity, talent and skills) and culture industries
(mass activities) to satisfy needs of the interactive consumer (Hartley, 2005).
Topicality of the theme is also determined by the nature of state theatres: on the one hand state theatres are
business organizations (government established limited companies), while at the same time they are cultural
institutions. From management perspective it is a question of how to balance creative, intellectual and
emotional performances with needs of basic customers and market interests (Berzins, Niedrite, 2011).
Organizational culture in management science is defined as a set of basic assumptions, values, beliefs,
behaviours and artefacts (Heskett, 2012). A strong organizational culture is linked to sustainability and long-
term effectiveness of an organization (Heskett, 2012; Waterman, Peters, Philips, 1982, at.all.)
Sustainability of an organization is largely dependent on its openness to change – creativity and
innovation. It is emphasized that creativity and innovation are the impetus to change, while organizational
culture is the fundamental (Sarros, Cooper, Santora, 2008).
The Recent research shows that organizations with culture and strategy related to creativity and
innovation show significant increase in company value and profits (Jaruzelski, Loehr, Holman, 2011).
Organizational culture research is important, necessary and useful. Topicality of the issue is also
determined by the fact, that organizational culture can either support or hinder the change. This is also why
organizational culture studies are important for long-term strategy. Organizational culture studies in Latvia
are very fragmented, and mainly related to the commercial banking sector. The research is an application to
build a research meta-story about performing arts in the form of state theatres in Latvia.
The notion of “culture” itself is associated with creativity. Creativity is the human ability to generate new
ideas with potential value of practical applicability. Social environment has an impact on individual
creativity. Organizational climate is the subjective perception of organizational characteristics and internal
environment factors which have a positive or negative impact on individual creativity. (Amabile, Conti,
Coon, 1996).
Research results show that creativity and innovation exercised in certain products or processes are the
most important factors for achieving organization’s long-term existence and success. This explains the
increasing research interest in the level of creativity in organizational climate and its compliance with
innovation. An increase in interest has particularly been evident in the last twenty years, as the 21st century is
characterized as the era of innovation (Carol Yeh –Yun Lin, Feng - Chuan Liu, 2011).
Both, organizational culture and climate actually characterize the same phenomenon – internal
environment of an organization. The key difference is in research traditions and interpretations of the
Journal of Business Management, 2015, No.9 ISSN 1691-5348
6
phenomena. Therefore, there is a need for integrated approach to both methodological (qualitative and
quantitative methods need to be used in organizational culture research) and thematic meanings (Denison,
1996). It should be noted that interrelation between organizational culture and climate for creativity is not
sufficiently studied in management science (McLean, Laird, 2005).
The author of the paper shares the view of the world’s leading management researchers - while analysing
organizational culture and climate for creativity, in addition to management science, the knowledge of other
social sciences such as sociology, anthropology, psychology and philosophy needs to be taken into
consideration. (Hofstede G, Hofstede G.J, 2005).
Internal environment of an organization – culture and climate, is created in the management process – it is
the result of specific management activities that lead to realization of organizational objectives.
The aim of the research is to study interrelation between organizational culture and climate for creativity in
state theatres in Latvia.
Research hypotheses are:
1. Preferable changes of culture of state theatres are associated with changes of climate for creativity and
factors influencing it.
2. The supportive (clan, family type) and creative (innovative, adhocracy) values of desired culture is
being characterized by a greater effect size on climate for creativity in state theatres in Latvia.
3. The bureaucratic (hierarchical) and market values of the desired culture are being characterized by a
lower effect size on climate for creativity in state theatres in Latvia.
Theoretical Significance and Scientific Novelty of the Study are:
1. Potential theoretical concept for the empiric research of interrelation between organizational culture
and climate for creativity in creative and other industry organizations was developed as a part of the paper.
2. Research includes a study of interrelation management between organizational culture and climate for
creativity in state theatres.
3. KEYS methodology and respective research instrument (KEYS – Tool for Assessing the Climate for
Creativity) is used in climate for creativity research. It is possible to compare the obtained results with the
data of different industries and statistic data of organizations created by Creative Leadership centre and
standard deviation base results in creative economy.
4. Design of the research methodology as well as the model for interrelation management between
organizational culture and climate for creativity was developed as a part of the paper and can also be used in
research in other industries.
2.THEORETICAL DESCRIPTION OF ORGANIZATIONAL CULTURE AND CLIMATE
IN MANAGEMENT SCIENCE
The first chapter of the paper is focused on the analysis of theoretical approaches of organizational
culture and climate in management science in state theatres in Latvia. Concepts of organizational culture and
climate for creativity are defined and convergence of organizational culture and climate is described.
Organizations are affected by their internal and external environments. The author of the paper explores
the internal environment.
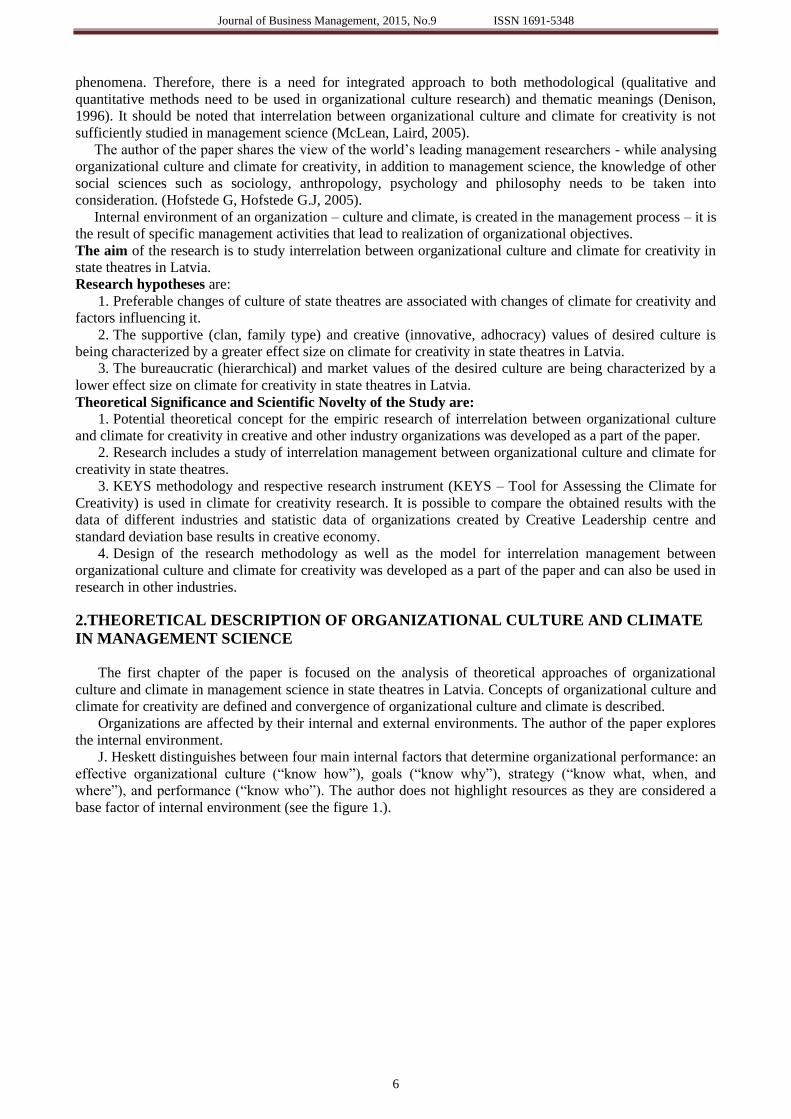
J. Heskett distinguishes between four main internal factors that determine organizational performance: an
effective organizational culture (“know how”), goals (“know why”), strategy (“know what, when, and
where”), and performance (“know who”). The author does not highlight resources as they are considered a
base factor of internal environment (see the figure 1.).
Journal of Business Management, 2015, No.9 ISSN 1691-5348
7
Figure 1. Mutual relationships of an organizational culture and purpose, strategy, and execution
Source: Compiled by the author based on the works of Heskett (2012).
Organizational culture is also the reflection of all the internal environment factors. Culture plays a crucial
role in implementing the strategy.
Organization’s internal environment is a result of management. Culture is a set of main organizational
conditions that drive performance.
Interrelation between organizational culture and climate for creativity is studied in this research
On the one hand, the fact that not all internal factors are in the scope of this study is a research limitation.
On the other hand, global research practice in management science relates the organizational culture
specifically with the level of climate for creativity. Organizational culture and climate for creativity are
related to human resource development – promotion of individual creativity.
After evaluating different perspectives, the author concludes that in general organizational culture is
defined as a set and system of common values and assumptions, as well as the way of thinking that
characterizes the organization and its members. Such opinion is expressed by the leading organizational
culture researchers in management science (Schein, 2010; Cameron, Quinn, 2006; Heskett, 2012;
Wallach,1983;Vanaerde, Jowrnee, 2003).
Theoretical framework of the research is based on organizational culture theories by K. Cameron, R.
Quinn and E. Wallach.
Competing values framework by K. Cameron and R. Quinn is based on organizational effectiveness
research (Cameron, Quinn, 2006). It is designed by integrating a variety of organizational culture research
findings.
The theory distinguishes four dominating types (value systems) of organizational culture:
1. Hierarchy (bureaucratic);
2. Market;
3. Clan (family);
4. Adhocracy (innovative);
The typology is based on two dimensions of organizational culture effectiveness:
1. Flexibility and discretion // stability and control;
2. External focus and differentiation // internal focus and integration
The main values of the hierarchy or bureaucratic culture are formalized and structured environment,
power hierarchy, goal orientation, stability and competitiveness (Orientation to internal focus, stability). The
main values of the clan or supportive culture are positive microclimate, team awareness, high self-
motivation, as well as respect for traditions and personalities (Orientation to internal focus and flexibility).
The main values for the adhocracy or innovative culture are creative environment, freedom for creativity,
orientation towards change and risk, as well as high internal motivation (Orientation to external focus and
flexibility). The value system of the market culture is oriented towards high competition in the external
market and stability.
In this study, the author has used research instrument OCAI, which is based on organizational culture
typology theory by K. Cameron and R. Quinn. According to research in management science on a global
level, adhocracy and clan culture values are the ones that positively correlate with organizational climate for
creativity
E. Wallach’s theory does not differ very much from the typology by K. Cameron and R. Quinn. Similarly
to K. Cameron and R. Quinn and other authors, E. Wallach believes that to understand the culture means to
understand the difference between the current and preferred situations in an organization. OCAI research
instrument examines both levels. (Wallach, 1983).
Journal of Business Management, 2015, No.9 ISSN 1691-5348
8
Wallach’s description of cultures is similar to the theory by K. Cameron and R. Quinn. In her culture
analysis she emphasizes the role of functionality in culture and recommends collecting information about
two or three different functions (subcultures – L.D.) within organization. For this purpose the questionnaire
OCI can be used. This instrument has been used in the paper, to study management and actor subcultures.
Unlike K. Cameron and R. Quinn, E. Wallach does not separate market dimension of the culture. She
connects the market orientation to the innovative culture dimension (Wallach, 1983).
Typology theories are theoretical concepts (categories of thinking process) that are based on the research.
Value of the typology theories is determined by the extent to which they allow navigation when dealing with
the complex organizational reality. At the same time, the problem of typology theories is simplification of
reality. This type of theories limits research perspective focusing only on certain dimensions while ignoring
subcultures.
However, research instruments based on typology theories are widely used in research practice. The research
paper is based on organizational culture definition by K. Cameron and R. Quinn, which essentially does not
differ from other definitions in management science. It is similar to the most well-known definition by E.
Schein and in fact, is not different from E. Wallach’s view. The empirical research of the research paper is
based on organizational culture theories by K. Cameron, R. Quinn and E. Wallach. Value systems in those
theories are related to organizational climate and the theories also describe creative types/dimensions of the
culture.
Research has shown that it is possible to balance the improvement of organization’s business performance
and promotion of creativity. To achieve that, it is necessary to understand factors that promote and distract
creativity.
Research literature often associates creativity and innovation with organizational climate (McLean, Laird,
2005; Amabile, at all 1996). The range of climate definitions is wide enough, however researchers are more
focused on human perception of internal environment, including organizational culture. Individual
perception is a reality that affects the internal environment factors of an organization. The climate is more
sensitive to power – more easily manipulated and influenced (Denison, 1996).
In KEYS methodology, which is used for empiric research of the paper, organizational climate is defined as
human perception of work environment factors. This perception affects their personal activities, including
creative activities. On the other hand, creativity is defined as human ability to generate new ideas that have a
useful value. Research is based on the organizational climate definition provided in KEYS methodology.
Subjectivity of climate largely explains why the research literature relates creativity and innovation to
organizational climate instead of culture (Center for Creative Leadership, 2010;Amabile Center for
Creativity, 2010).
In the management science literature:
1. Individual creativity is not separate from the level of creativity of organizational climate and factors
influencing it.
2. Creativity and innovation are complimentary, interdependent and at the same time different concepts.
The conceptual model of climate for creativity developed by T. Amabile and other authors distinguishes ten
dimensions/scales: freedom, challenging work, managerial encouragement, work group supports,
organizational encouragement, organizational impediments, sufficient resources and workload pressure. The
end result of these factors is the level of creativity and productivity in the organization (Amabile 1985;
Amabile, et.al.,1996).
There are three main conceptual approaches, when it comes to interaction between organizational climate
and culture that largely determine research interests of the authors:
1. Organizational culture and climate are two significantly different concepts;
2. Organizational culture and climate are complimentary concepts;
3. Organizational culture, climate and change (therefore also creativity and innovation process – L.D.)
are closely interrelated, and constitute a kind of trinity. They are supposed to be studied in parallel and
simultaneously (Ashkanasy, Wilderom, Peterson, 2000).
This research is based on the third conceptual approach. The author suggests that all three views actually
recognize cultural impact on the climate and creativity. This assumption is a logical consequence of
theoretical concepts mentioned above.
The concept of culture is much broader and deeper than climate, but they are related and characterized by
convergence and complementarity. Research of creativity in organization is based on dyadic approach:
culture and climate are supposed to be studied in parallel and simultaneously.

Journal of Business Management, 2015, No.9 ISSN 1691-5348
9
3.RESEARCH METHODOLOGY
The research base of the paper is state theatres in Latvia. Actor and management subcultures were
studied. The size of population (N) is 198 respondents, while the sample size (n) is 130.
In order for the standard error not to overreach 0.05, sample size of 132 respondents is required. The
sample size is sufficient to ensure the validity of the study. It is also appropriate to KEYS methodology and
the generally accepted sample size compared to the population size in research.
Five research instruments were used in the study:
1. Organizational Culture Assessment Instrument – OCAI by K. Cameron and R. Quinn is used for
organizational culture research. The questionnaire allows to measure existing and preferred organizational
culture typological models from different (actors, managers) subcultures perspectives. The instrument allows
to diagnose the dominating cultural value orientation, type, strength and congruence.
2. The Organizational Culture Index – OCI is also used in the study. In general, it is similar to theoretical
concept of OCAI. OCI is used to re-test purposes in order to test the reliability of OCAI data.
3. KEYS – Tool for Assessing the Climate for Creativity is used to research climate for creativity. In total
186 organizations from different industries (including the creative industries) have been tested by using this
instrument. Based on studies a database with results and possible standard deviations for all KEYS
dimensions has been created. This allows a comparison of research data.
Research results are directly related to statistical data and standard deviations included in the calculation
formula of the instrument. There does not exist such a database in the Baltics and Europe. The database also
does not include specific information about theatres as a part of performance art industry. Taking into
account all the above-mentioned as well as cultural differences, KEYS results leave space for interpretations
in different climate dimensions.
4. Another instrument used in the study is a questionnaire. The target audience of the questionnaire is a
group of producers – experts. It consists of 9 producers from state theatres in Latvia (middle and top level
management).
5. In order to evaluate results of the empiric research and to clarify the possible preferred changes in
culture and climate in the theatres, directors of four theatres were interviewed. In one of the occasions, the
public relationship manager gave an interview after it was confirmed with the director.
6. Statistical methods (descriptive and inferential statistic methods for exploring relationships among
variables):
a) measures of central tendency;
b) correlation;
c) analysis of variance;
d) standard linear regression.
Data to be collected are processed and analysed using MS Excel and SPSS
4. RESEARCH RESULTS
OCAI and OCI questionnaires were used as a data collection method for organizational culture analysis in
state theatres. The data analysis reflects separate perspectives of management subculture and the actor
subculture as well as their common view. The existing and preferred organizational culture typology from
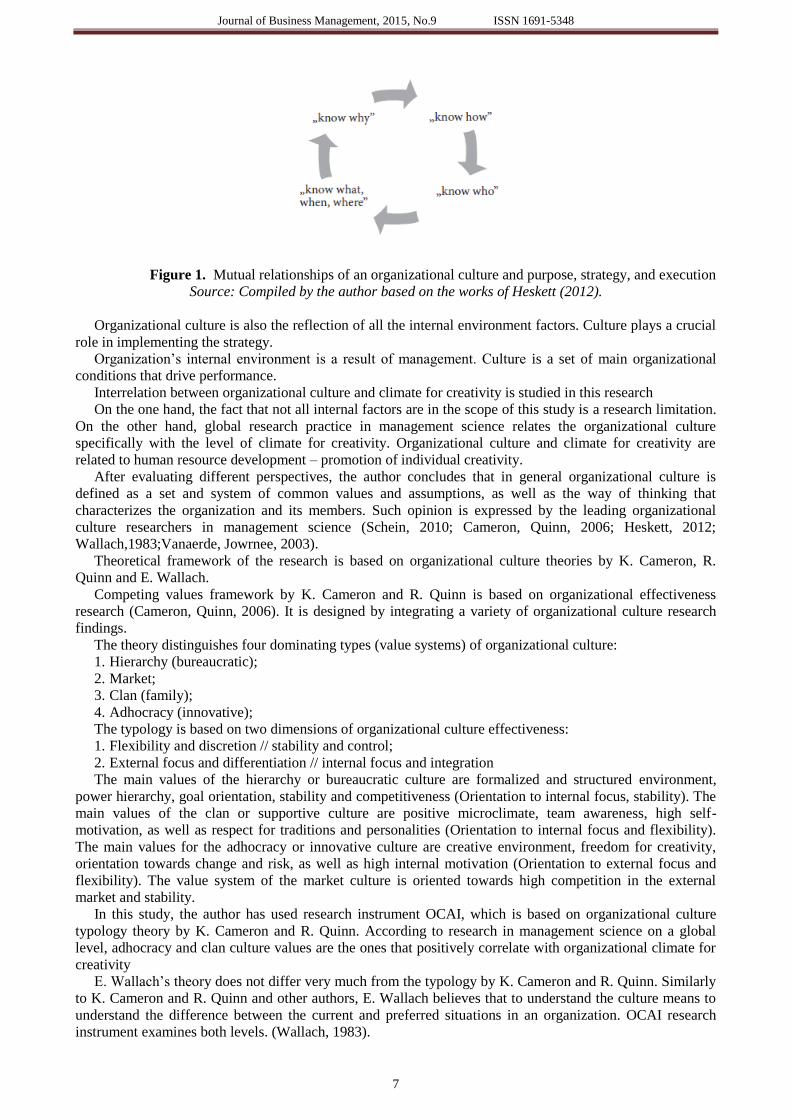
common view of both subcultures is reflected in the figure 2.
Journal of Business Management, 2015, No.9 ISSN 1691-5348
10
Figure 2. Percentage frequencies for existing organizational culture of actors and managers subcultures
and taken both together accordingly by OCAI
Source: Compiled by the author
The analysis was carried out by using frequency distribution expressed in frequency percentage rate
available in MS Office 2010 Excel software. The figure 3 shows that the dominant culture type in the
existing model is hierarchy culture with the percentage rate 29%. The percentage rate for clan culture type is
1% lower – 28%. Accordingly, median values for both cultures are – 27.5 for hierarchy culture and 26.5 for
clan culture. This indicates that the current culture model is characterized by the internal focus and
integration, which is characterized by maintenance of the status quo.
Activities of state theatres are currently focused on keeping the existing clients (spectators) with an
appropriate repertoire, pricing policies etc.
There are statistically significant (expressed by Me) differences between clan culture and other culture
types. However, it must be asserted that results of questionnaires in subcultures prove the typology of
organizational culture on the whole in OCAI version.
Theoretically, hierarchy and clan cultures are interested in fostering climate for creativity. However, the
author believes that the two are not characterized by strong emphasis on innovative orientation focused
towards market expansion.
The typology of the existing organizational culture is also confirmed by the results of OCI questionnaire.
Percentage frequencies of exiting organizational culture dimensions taken both subcultures together
accordingly by OCI methodology are innovative dimension 31%; Supportive dimension – 34%; Bureaucratic
dimension – 35%
OCI questionnaire was used as the re-test instrument.
Results by OCI confirm the results by OCAI. Validity of the study is also supported by dispersion
analysis.
To understand the culture means to understand the difference between the existing and preferred situation
in the organization.
Preferred culture model in state theatres is shown in the figure 3.

Journal of Business Management, 2015, No.9 ISSN 1691-5348
11
Figure 3. Percentage frequencies of preferable organizational culture dimensions for actors and staff
subcultures and taken both together accordingly by the OCAI
Source: Compiled by the author
The figure 3. shows that dominating types in the preferred culture are as follows: clan culture type 35%;
adhocracy culture type 26%; market and hierarchy culture types 20%.
Both subcultures, in general, are dominated by clan and adhocracy culture values, which in management
science are positively associated with climate for creativity. Increase in clan and adhocracy culture values is
based on proportional decrease of hierarchy values in overall culture and actor subculture. From management
perspective the decrease in hierarchy culture is smaller by 1%.
The author argues that formalized, strongly structured and stable internal environment at least on a
subjectively desired level provokes clan or family culture values: development of human resources
(individual creativity), team, and other values. Such environment also provokes adhocracy values – desire to
express individual creativity.
Differences between the existing and preferred organizational culture models are shown in the table 1.
Table 1
Organizational culture Wilcoxon Signed Rank Test in the actors and managers subcultures taken
together
Organizational
culture type
Organizational
culture level
Median
(Me)
existing
Median
(Me)
preferable
Z value
p
(level of
significance)
Statistical
significance
Clan (taken
together)
existing-
preferable 26,25 30,00 -2,032 0,042
Statistically
significant
difference
Adhocracy
(taken together)
existing-
preferable 20,00 25,00 -2,060 0,039
Statistically
significant
difference
Market, (taken
together)
existing-
preferable 20,00 20,00 -0,447 0,655
Statistically
no significant
difference
Hierarchy
(taken together)
existing-
preferable 27,50 20,00 -2,070 0,038
Statistically
significant
difference
Source: Compiled by the author.
The Wilcoxon rank criterion shows significant differences (large effect) in clan, adhocracy and hierarchy
culture types. Statistically, the less significant difference (small effect) is detectable between the existing and
preferred market culture values in both subcultures separately and in general.
The difference between the existing and preferred organizational cultures is generally valued as
Journal of Business Management, 2015, No.9 ISSN 1691-5348
12
statistically significant. Consequently, the existing organizational culture cannot be classified as integrated,
strong and effective. It is characterized by certain features of entropy.
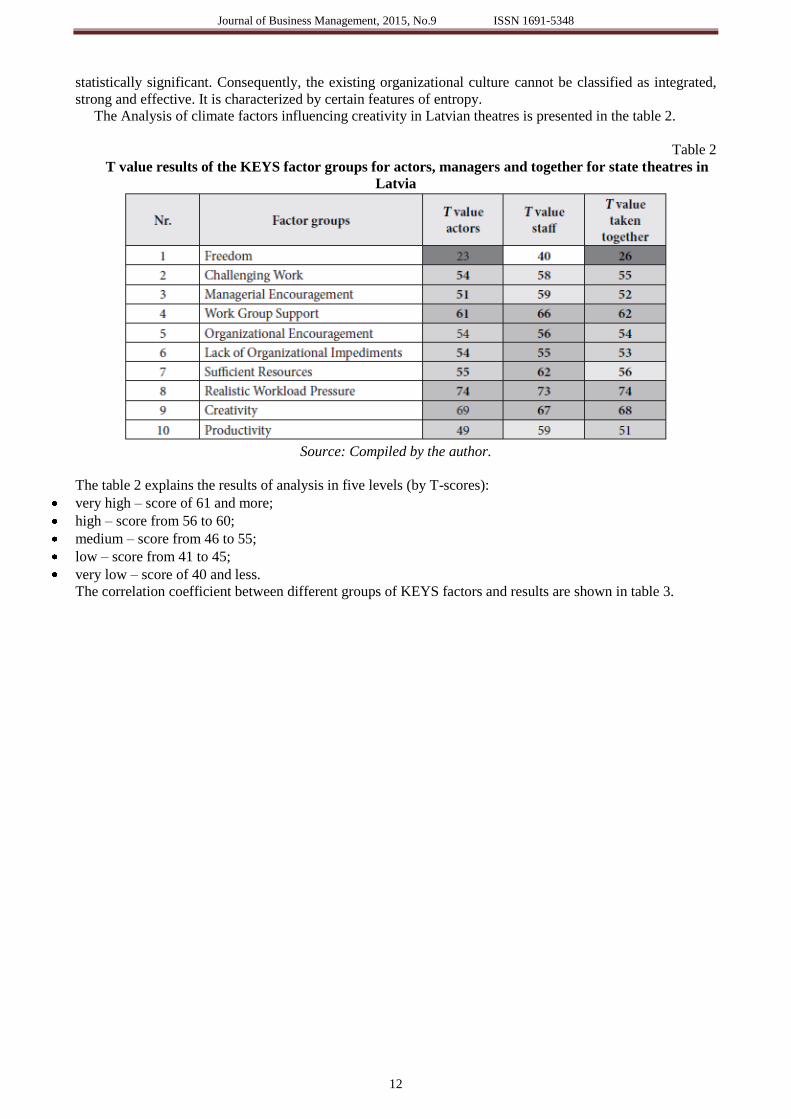
The Analysis of climate factors influencing creativity in Latvian theatres is presented in the table 2.
Table 2
T value results of the KEYS factor groups for actors, managers and together for state theatres in
Latvia
Source: Compiled by the author.
The table 2 explains the results of analysis in five levels (by T-scores):
very high – score of 61 and more;
high – score from 56 to 60;
medium – score from 46 to 55;
low – score from 41 to 45;
very low – score of 40 and less.
The correlation coefficient between different groups of KEYS factors and results are shown in table 3.

Journal of Business Management, 2015, No.9 ISSN 1691-5348
13
Tab
le 3
Pea
rso
n`s
pro
du
ct-m
om
ent
corr
elati
on
coef
fici
ents
bet
wee
n K
EY
S f
act
ors
for
act
ors
an
d m
an
ag
ers
sub
cult
ure
s ta
ken
toget
her
Sourc
e: C
om
pil
ed b
y th
e auth
or.
Journal of Business Management, 2015, No.9 ISSN 1691-5348
14
Table 3. shows the correlation between KEYS factor groups. Presented degree of association is with high
reliability.
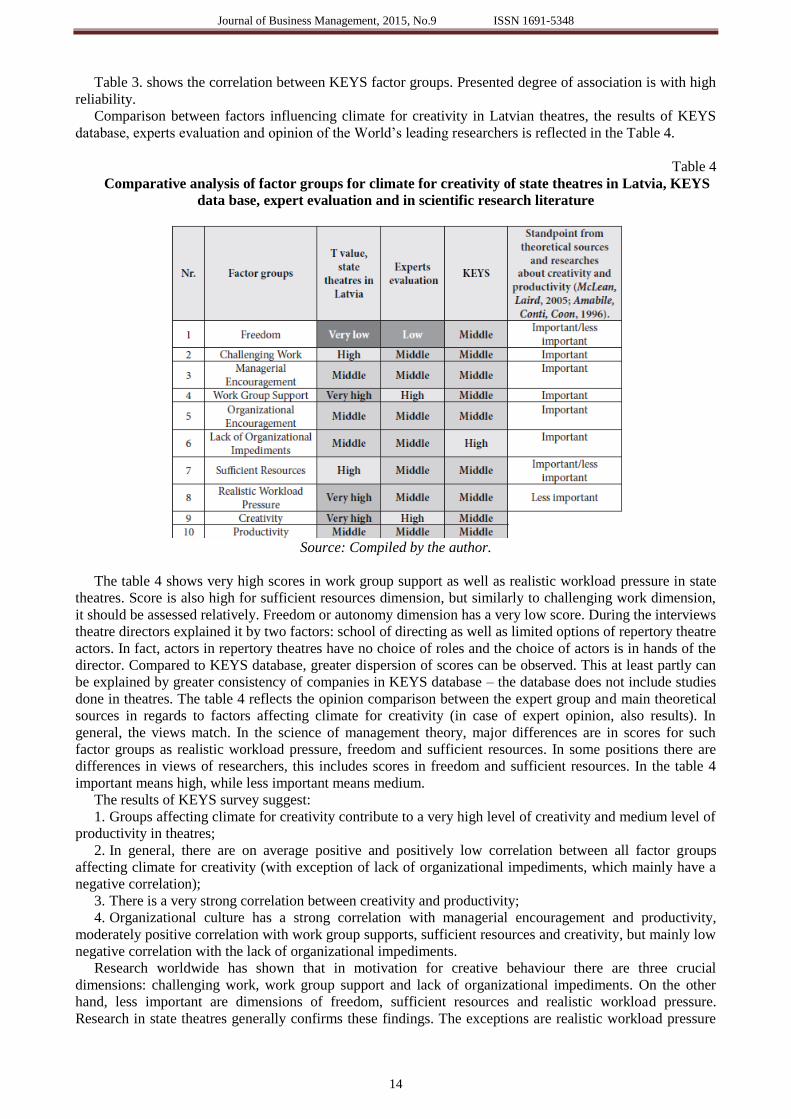
Comparison between factors influencing climate for creativity in Latvian theatres, the results of KEYS
database, experts evaluation and opinion of the World’s leading researchers is reflected in the Table 4.
Table 4
Comparative analysis of factor groups for climate for creativity of state theatres in Latvia, KEYS
data base, expert evaluation and in scientific research literature
Source: Compiled by the author.
The table 4 shows very high scores in work group support as well as realistic workload pressure in state
theatres. Score is also high for sufficient resources dimension, but similarly to challenging work dimension,
it should be assessed relatively. Freedom or autonomy dimension has a very low score. During the interviews
theatre directors explained it by two factors: school of directing as well as limited options of repertory theatre
actors. In fact, actors in repertory theatres have no choice of roles and the choice of actors is in hands of the
director. Compared to KEYS database, greater dispersion of scores can be observed. This at least partly can
be explained by greater consistency of companies in KEYS database – the database does not include studies
done in theatres. The table 4 reflects the opinion comparison between the expert group and main theoretical
sources in regards to factors affecting climate for creativity (in case of expert opinion, also results). In
general, the views match. In the science of management theory, major differences are in scores for such
factor groups as realistic workload pressure, freedom and sufficient resources. In some positions there are
differences in views of researchers, this includes scores in freedom and sufficient resources. In the table 4
important means high, while less important means medium.
The results of KEYS survey suggest:
1. Groups affecting climate for creativity contribute to a very high level of creativity and medium level of
productivity in theatres;
2. In general, there are on average positive and positively low correlation between all factor groups
affecting climate for creativity (with exception of lack of organizational impediments, which mainly have a
negative correlation);
3. There is a very strong correlation between creativity and productivity;
4. Organizational culture has a strong correlation with managerial encouragement and productivity,
moderately positive correlation with work group supports, sufficient resources and creativity, but mainly low
negative correlation with the lack of organizational impediments.
Research worldwide has shown that in motivation for creative behaviour there are three crucial
dimensions: challenging work, work group support and lack of organizational impediments. On the other
hand, less important are dimensions of freedom, sufficient resources and realistic workload pressure.
Research in state theatres generally confirms these findings. The exceptions are realistic workload pressure

Journal of Business Management, 2015, No.9 ISSN 1691-5348
15
and sufficient resources.
The impact of existing competing value types on climate for creativity factor groups and results in state
theatres was analysed by OCAI version. Linear regression method was used in creation of mathematical
model. β standardized coefficient was applied in evaluating state theatre value types and values on dependent
variables. Higher β value has a higher impact on the dependent variable. In this model, other dimensions
have lower, insignificant effect. In some cases it might be said that the effect does not exist. Interaction
between culture and climate for creativity in state theatres from actor and management perspective was
analysed. Such integrated perspective on the problem complies with the goal of the research.
Results of the organizational culture and climate for creativity research show similarities in assessment of
the existing and preferred organizational cultures in state theatres from actors and management perspective.
Differences in opinions in general are not statistically significant.
Linear regressions β values were analysed in the OCAI methodological context. Results are shown in the
table 5
Table 5
β values presenting interaction between existing culture and climate for creativity for actors and
managers taken together accordingly by OCAI
Source: Compiled by the author.
The table 5 shows interrelation between culture and determinants as well as outcomes of climate for
creativity in state theatres in reliable and prevalent β values. From overall management and actors
perspective according to OCAI the prevailing influence on factors forming climate for creativity belongs to
the clan culture values.
The current interaction between culture and climate for creativity in state theatres in linear regression β
values leads to the following conclusions:
1. In state theatres prevailing impact on factors of climate for creativity (organizational encouragement,
lack of organizational impediments, realistic workload pressure, level of creativity and productivity) belongs
to supportive or clan culture values.
2. Impact of culture on determinants and outcomes of climate for creativity in state theatres only partly is
consistent with the dominant culture types and dimensions.
Analysis of variance (ANOVA) in terms of η2
also shows that the current cultural competing values
dominants by OCAI do not correspond to their significance of impact on climate for creativity. The current
cultural values have different impact on climate for creativity factors and results in state theatres. The impact
of market culture values on climate for creativity in state theatres is insignificant. Results of analysis of
variance (ANOVA) in terms of η2 and linear regressions (β values) are similar. Thus it increases the validity
of the study.
In order to make any changes, it is necessary to determine the current situation, find out the systematic
relationships and the necessary changes. This is the purpose of the research. Higher management has a
crucial role in managing change.
In this chapter the desired interactions between culture and climate for creativity in state theatres are
analysed from overall actor and management perspective. This shows an integrated picture of organizational
culture and allows to determine accurately the main directions of the development.
The desired interactions between organizational culture and climate for creativity in state theatres in the
research are analysed by linear regression method in terms of β values as well as analysis of variance
(ANOVA) method in terms of η2. Interactions are analysed by OCAI and KEYS methodologies, taking into
Journal of Business Management, 2015, No.9 ISSN 1691-5348
16
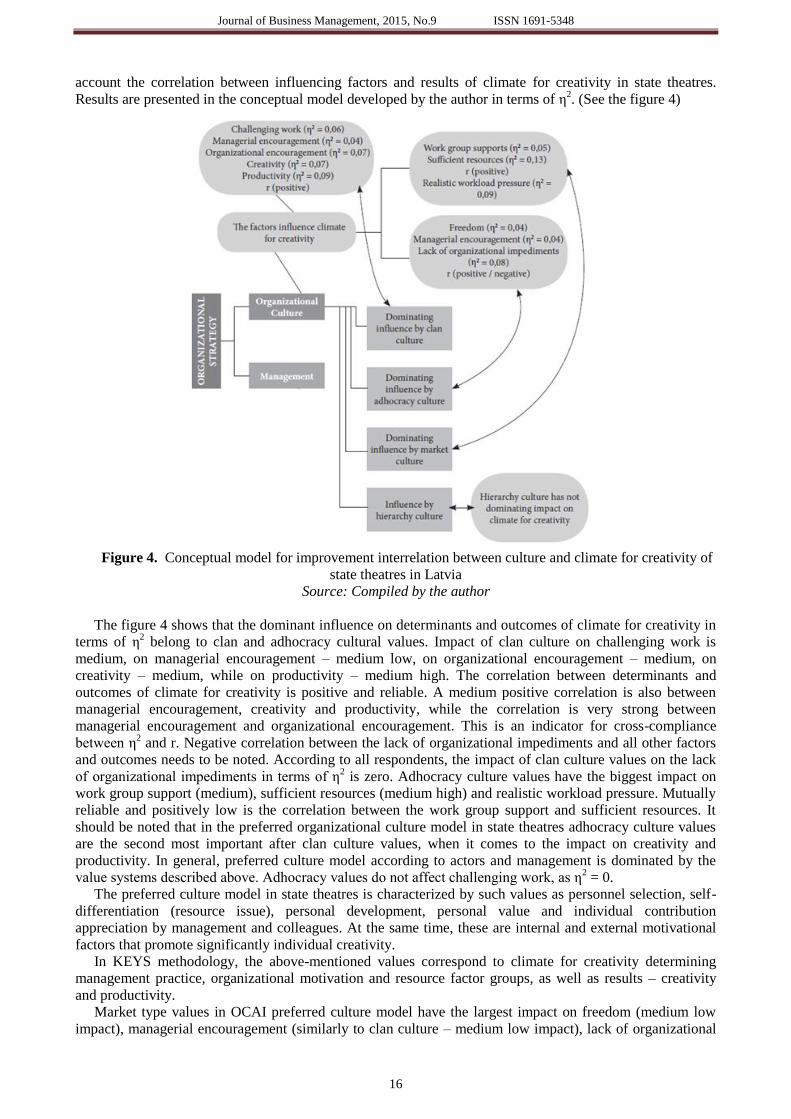
account the correlation between influencing factors and results of climate for creativity in state theatres.
Results are presented in the conceptual model developed by the author in terms of η2. (See the figure 4)
Figure 4. Conceptual model for improvement interrelation between culture and climate for creativity of
state theatres in Latvia
Source: Compiled by the author
The figure 4 shows that the dominant influence on determinants and outcomes of climate for creativity in
terms of η2 belong to clan and adhocracy cultural values. Impact of clan culture on challenging work is
medium, on managerial encouragement – medium low, on organizational encouragement – medium, on
creativity – medium, while on productivity – medium high. The correlation between determinants and
outcomes of climate for creativity is positive and reliable. A medium positive correlation is also between
managerial encouragement, creativity and productivity, while the correlation is very strong between
managerial encouragement and organizational encouragement. This is an indicator for cross-compliance
between η2 and r. Negative correlation between the lack of organizational impediments and all other factors
and outcomes needs to be noted. According to all respondents, the impact of clan culture values on the lack
of organizational impediments in terms of η2 is zero. Adhocracy culture values have the biggest impact on
work group support (medium), sufficient resources (medium high) and realistic workload pressure. Mutually
reliable and positively low is the correlation between the work group support and sufficient resources. It
should be noted that in the preferred organizational culture model in state theatres adhocracy culture values
are the second most important after clan culture values, when it comes to the impact on creativity and
productivity. In general, preferred culture model according to actors and management is dominated by the
value systems described above. Adhocracy values do not affect challenging work, as η2 = 0.
The preferred culture model in state theatres is characterized by such values as personnel selection, self-
differentiation (resource issue), personal development, personal value and individual contribution
appreciation by management and colleagues. At the same time, these are internal and external motivational
factors that promote significantly individual creativity.
In KEYS methodology, the above-mentioned values correspond to climate for creativity determining
management practice, organizational motivation and resource factor groups, as well as results – creativity
and productivity.
Market type values in OCAI preferred culture model have the largest impact on freedom (medium low
impact), managerial encouragement (similarly to clan culture – medium low impact), lack of organizational
Journal of Business Management, 2015, No.9 ISSN 1691-5348
17
impediments (medium impact). The positive correlation of managerial encouragement is with low reliability,
while managerial encouragement has a reliably low negative correlation with it. Market culture values do not
affect creativity as η2 = 0.
Hierarchy and bureaucratic culture values actually have no impact on determinants and outcomes of
climate for creativity in the preferred organizational culture model: η2 effect on freedom, work group
support, sufficient resources, lack of organizational impediments, creativity and productivity is zero. There is
no prevailing influence of hierarchy culture values on other factors for climate for creativity. They have a
medium low impact on challenging work, and low impact on managerial encouragement, organizational
encouragement and realistic workload pressure. On the one hand, it confirms the preferred culture typology
of state theatres. On the other hand, it increases organizational risks, especially given the status of state
theatres, which is a public limited liability company. Hierarchy or bureaucratic culture values provide a
framework for existence of the organization and ensures the status quo.
The figure 4 characterizes the author’s conceptual approach, based on theoretical and empiric research
results.
The main conclusions are:
1. Factor groups, creativity and productivity affecting climate for creativity in state theatres are mainly
determined by clan and adhocracy culture value systems.
2. Typologically different culture values have different prevailing impact on factors and results of climate
for creativity in state theatres in Latvia. It is confirmed by the results of linear regression and analysis of
variance in terms of η2.
3. Analysis of variance (ANOVA) results are broadly consistent with correlation between climate for
creativity factor groups in state theatres.
4. Analysis of variance (ANOVA) results in terms of η2 correspond to the dominant preferred
organizational culture competing values typology from management and actor perspectives according to
OCAI.
This is generally confirmed by the results of linear regression in terms of β. The difference in results can
be explained by the diversity in calculation methodology.
In the figure 4 organizational strategy first means defining and communicating the vision, while core of
the organization is formed by values. Strategy, organizational culture and climate (internal environment)
generally are the result of managing, while culture plays the key role in implementing the strategy. The
recipient of internal environment change management in any organization is the top management.
To summarize the main issues of the research, the change of the existing organizational culture model
will contribute not only to the increasing level of climate for creativity, internal efficiency and innovation,
but also on to higher level of artistic quality in state theatres in Latvia.
Qualitative research method – interview, was used to assess the possibility to increase the level of
creativity by using the preferred model of interaction between culture and climate for creativity in state
theatres in Latvia. The author choses to interview four directors, who also are chairmen of the board.
Theoretical substantiation of the interviews is based on management science knowledge that organizational
culture and climate is defined by the top management.
The public relations manager was interviewed in the fourth theatre. The content of the interview was
previously aligned with the opinion of the director of the theatre.
Results of the interviews can be summarized as follows:
1. This type of research has not been done in Latvian state theatres before.
2. Research results of the paper are reliable.
3. Dual status of state theatres is confirmed: on the one hand, they are public corporations characterized
by hierarchy and market culture values – focus on results, while on the other hand, as cultural institutions,
they are characterized by clan and adhocracy culture values.
4. In regards to interaction management between culture and climate in state theatres in Latvia, top
management have similar views.
5. Clan and adhocracy culture values are more suitable for culture specifics of state theatres. Values of
market culture (mainly competition) are not significant, but do exist. This is confirmed by the preferred
model of interaction between culture and climate in state theatres, where market culture values have
statistically insignificant impact on climate factors and level of creativity.
6. The impact of hierarchy culture values in culture and climate of state theatres is mainly related to over-
bureaucratic politics by the Ministry of Culture.
7. The interviews confirm the possibility to implement the model of culture and climate interaction in
partly close (definition of mission, vision and values) but mainly further future (a period of 3-5 years).

Journal of Business Management, 2015, No.9 ISSN 1691-5348
18
Interviews confirm reliability of research results and that the goal of the research is reached.
Paper does not include practical results of interaction between preferred culture model and climate, as
changes take longer a period of time.
5.THE MAIN CONCLUSIONS / DISCUSSIONS
1. Dominant organizational culture type in actor subculture as well as overall culture is the hierarchy
culture type (by OCAI). Management subculture is largely dominated by clan culture values. The less
significant is market culture orientation. Proportion of adhocracy culture values in both subcultures is
statistically insignificant. Culture in theatres is characterized by internal focus and integration. Results of
OCAI and OCI questionnaires in regards to the existing culture from perspective of both subcultures and in
general is similar. The differences are evaluated as statistically insignificant. Similarities in the existing
culture are confirmed by the analysis of variance of OCAI and OCI.
2. Preferred culture by OCAI according to overall actor and management view is dominated by clan
culture based on a decline in hierarchy culture values. There is also an increase in adhocracy culture
direction and a decline in market orientation. The preferred culture typology highlights values fostering
climate for creativity (in terms of linear regression β and analysis of variance – ANOVA η2).
3. The analysis of Wilcoxon rank criterion shows statistically significant difference between the
hierarchy, clan and adhocracy culture types in the existing and preferred organizational culture models in
general. Analysis of OCAI results does not confirm strength of the cultures in theatres. Research results
prove the features of cultural entropy as the existing values are not consistent with the preferred ones.
Determining the level of cultural entropy requires additional research.
4. Factor groups affecting climate for creativity contribute to a very high level of creativity and medium
productivity in state theatres. Overall organizational climate in state theatres in Latvia is characterized by
very high work group support, realistic workload pressure, and highly sufficient resources. Factors as
challenging work, managerial encouragement, organizational encouragement, and lack of organizational
impediments are at a medium level. Personal freedom and autonomy dimension is very low.
5. Evaluation of factors of climate for creativity in state theatres from actor and management subcultures
perspective is different: it is higher in all dimensions, apart from realistic workload pressure, from
management perspective. The level of climate for creativity is rated slightly higher from actor subculture
perspective.
6. The research shows that creativity is positively correlated with productivity. In state theatres in Latvia,
there is a medium positive and positively low correlation between all factor groups affecting climate for
creativity (except for the lack of organizational impediments, which mainly has low negative correlation).
7. There is a strong positive correlation between managerial encouragement and productivity, average
positive correlation with work group support, sufficient resources and creativity, but mainly low negative
correlation with lack of organizational impediments in state theatres.
8. There is a statistically significant interrelation between organizational culture and climate for creativity
in state theatres. The impact of different organizational culture types on results and factor groups affecting
climate for creativity is different. The main influence in the preferred model by OCAI belongs to clan and
adhocracy culture values. The impact of organizational culture types (dimensions) on results and factor
groups affecting climate for creativity is different.
9. Overall dominant management in state theatres in Latvia is not focused on significant challenges, risks,
and creative experiments. Instinct to preserve internal environment and climate dominates, which does not
exclude the encouragement to maintain the existing level of creativity. This is confirmed by the dominance
of hierarchy leadership by OCAI culture typology and results by KEYS.
10. Results of the research support hypothesis put forward in the paper, that the preferred changes in
culture in state theatres are associated with changes in climate for creativity and the factors affecting it.
11. Research supports the hypothesis, that the focus on supportive (family and clan) as well as creative
(innovative and adhocracy) values in the preferred culture is characterized by a greater impact on climate for
creativity in state theatres in Latvia.
12. Research results prove the hypothesis, that the orientation towards bureaucracy (hierarchy) and
market values in preferred culture is characterized by a lower impact on climate for creativity in state
theatres in Latvia.
13. The developed methodological design and conceptual model for research of interaction between
organizational culture and the level of climate for creativity can be used in change management in Latvian
state theatres.

Journal of Business Management, 2015, No.9 ISSN 1691-5348
19
Acknowledgments: the author would like to thank personally T.M.Amabile and to the Centre for Creative Leadership
(CCL) for permission to use KEYS in this study
REFERENCES
1. Amabile, T. M., Conti, R., Coon, H., Lazenby, J., Herron, M. (1996) Assessing the Work Environment for Creativity.
Academy of Management Journal. Vol.39, No.5. pp.1154 – 1180.
2. Amabile, T.M. (1985) Motivation and Creativity: Effects of Motivational Orientation on Creative Writers. Journal of
Personality and Social Psychology, No.48, pp. 393-399.
3. Ashkanasy, N. M., Wilderom, C., Peterson, M. F. (2000) Handbook of Organizational Culture & Climate. Sage
Publications.
4. Berzins, G., Niedrite, V. (2011). Improvement of the competitiveness in the organizations of the creative industries //
Konkuretspejas paaugstinasanas sistema radoso nozaru organizacijas. LU rakstu krajums „Vadibas zinatne”, 771.
sej. – Riga, LU, pp. 368.-381.
5. Cameron, S.K., Quinn, R.E. (2006) Diagnosing and Changing Organizational Culture Based on Values Framework.
San Francisco: Jossey-Bass Inc.
6. Carol Yeh –Yun Lin, Feng - Chuan Liu. (2011) A cross – level Analysis of Organizational Creativity climate and
Perceived Innovation: The Mediating Effect of Work Motivation. Innovation Management. Vol.3. pp. 1- 30.
7. Denison, D. R. (1996) What's the difference between organizational culture and organizational climate? Academy of
Management Review. No.3. Vol.21. pp. 619-654.
8. Dubkevics, L. (2009) Organizational Culture // Organizacijas kultura, Riga: Jumava.
9. Hartley, J. (2005) Creative Industries. Oxford: Wiley-Blackwell.
10. Heskett, J. L. (2012) The Culture Cycle: How to Shape the Unseen Force that Transform Performance. New Jorsey:
FT Press Upper Saddle River.
11. Hofstede, G., Hofstede, G.J. (2005) Culture and Organizations: Software of the Mind. - New York. McGraw-Hill.
12. McLean, Laird D. (2005) Organizational Culture’s Influence on Creativity and Innovation: A Review of the
Literature and Implications for Human Resource Development. Advances in Developing Human Resources, May,
vol. 7 no. 2, pp 226-246.
13. Sarros, J.C., Cooper, B.K., Santora, J.C. (2008) Building a Climate for Innovation through Transformational
Leadership and Organizational Culture. Journal of Leadership & Organizational Studies. Vol., 5. No.2. pp.145-158.
14. Schein, E.H. (2010) Organizational Culture and Leadership. (The Jossey-Bass Business & Management Series) 4th
edition. - Hoboken, NY. USA: Jossey- Bass.
15. Vanaerde, P., Jowrnee, M. (2003) Cultuurverandering Antwerpen: Uitgeverij De Boeck.
16. Wallach, E.J. (1983) Individuals and Organization: The Cultural Match. Training and Development Journal.
February. pp. 29-36.
17. Waterman, R.G., Peters, T.K., Philips, J.R. (1982) Structure is not organization. Business Horizons, June, pp. 50 –
63.
18. Jaruzelski, B., Loehr, J., Holman, R. (2011) The Global Innovation 1000: Why Culture Is Key. [sk. 23.12. 2011].
Pieejams: http://www.strategy-business.com/article/11404?pg=all, Internet resources
19. Center for Creative Leadership. (2010) KEYS to Creativity and Innovation. Users Guide. Unpublished materials.
20. T.M. Amabile, Center for Creative Leadership. KEYS to Creativity and Innovation. Prepared for 2010 Sample
Organization – Overall, 2009, 1987,2009. Unpublished materials.
Journal of Business Management, 2015, No.9 ISSN 1691-5348
20
OCCUPATIONAL STRESS AND PROFESSIONAL DEFORMATION
AMONG UNIVERSITY ACADEMIC STAFF
Maija Zakrizevska
Riga International School of Economics and Business Administration, Meza 3, Riga, Latvia,
e-mail:[email protected]
Julija Bulatova
Riga International School of Economics and Business Administration, Meza 3, Riga, Latvia, e-mail:
e-mail: [email protected]
ABSTRACT
Occupational stress and professional deformation is an important issue that should be studied not only within the
different industries, but also within each company separately.
The results of numerous studies of educational sector indicate on high levels of stress in pedagogical profession;
research also indicates on professional deformation of those working in educational sphere for a longer time period. The
study (N = 100) involved the academic staff of one of the Latvian state universities, which is famous for its history,
traditions and constant values. The aim of the research was to measure the stress level of the academic staff, and to find
out if there is a correlation between the occupational stress and professional deformation.
The research applied occupational stress questionnaire (Fontana, 1991) and the survey for studying professional
deformation (based upon the questionnaire by Rogov, 1999). For data processing SPSS 22 software was used. The
research results highlighted professional deformation features as well as significant correlations between all
professional deformation scales and occupational stress – the higher the occupational stress, the more significant
behavioural changes.
The paper argues that academic staff should be informed and educated about the signs and expressions of professional
deformation. Different techniques for reducing stress can be recommended, and it is also suggested for the management
of the academic institution to pay a thorough attention to such issues as stress and professional deformation.
Keywords: professional deformation, occupational stress, academic staff
1.INTRODUCTION
Stress impacts the effectiveness of work in both, positive and negative, manner (Selye, 1978; Lazarus,
2006). Occupational stress has always been discussed as a present issue in the educational professions
(Weissbourd, 2003; Motowidlo, et al., 1986). Professional deformation is argued to be present specifically
in a pedagogical profession (Gordijenko, 2008; Fontalova, 2011).
Occupational stress is often defined as a psychological or physical overwork, which is caused by the
discrepancy between the work demands and actual capabilities of the employee (e.g. Roja, et al, 2006). There
is a notion that occupational stress can actually improve work’s quality and productivity (LBAS/LM, 2010).
If an employee however has demonstrated high work performance and has been over – mobilized, he/she is
often expected to keep up the same level, which may result in a high occupational stress level and may
eventually lead to a burnout (Volti, 2008). Stress therefore cannot be considered as a motivational factor in a
long run (LBAS/LM, 2010).
Educational institutions can be considered as a violent system, which disclaims human factor (Hirigoyen,
2006). Working in unsociable and unhealthy organizational climate creates negative emotions that affect all
the parties involved (Lipman-Blumen, 2006). It emerges as frustration, psychological pressure, avoidance,
apathy and alienation from work, leading to professional stress (Ghodsy, 2008). On top of that, nowadays the
work of lecturers is no longer a prestigious and well-paid job, salary hardly covers expenses, and financial
vulnerability becomes another cause for stress (Zhuravlev & Sergijenko, 2011).
In the course of professional action, personality growth occurs as well. Professional role influences
personality; worldview and moral values are getting shaped due to profession and a particular organizational
culture have an impact on the person’s self- image and self-worth. Professional deformation gradually
emerges in the course of professional action, actualizing certain traits and personal characteristics (Vodjaha,
2012).
This article deals with the problem of occupational stress and professional deformation of the academic
staff, paying attention to this important issue. Further, the brief literature analysis will be presented, followed
by methodology and results of the research. Conclusions and discussions introduce with the main
Journal of Business Management, 2015, No.9 ISSN 1691-5348
21
conclusions of the research and provide some comments of the authors and recommendations.
2.LITERATURE REVIEW
Occupational stress can be defined in terms of interaction between the employee and his/her working
environment. Stress is experienced when the demands of the work environment surpasses the abilities of the
worker (LIZDA, 2011).
Among the main reasons of occupational stress often are mentioned the following ones: high workload,
too short and strict deadlines for performing tasks, high work quality requests (Ozolina – Nucho & Vidnere,
2004). According to Zhdanov (2008), there are employees who feel like “stuck in the frame” because of the
unreasonable work regulations: too rigid control of employees evokes irritation, anger and unwillingness to
work.
According to European Agency of Safety and Health at Work, educational employees are one of the
professional groups, where employees are the subjects of highest stress. According to European Agency for
Safety and Health at Work (EU – OSHA, 2011) in the field of education and pedagogical profession there is
the second highest stress level in comparison to other fields and professional groups. The occupational stress
increasingly influences the health and wellbeing of educationists (ESENER, 2009). This is the main reason
why The European Trade Union Committee for Education conducted the research of the impact of stress in
pedagogical profession. ES and EFTA states took a part in this research – altogether 500 schools and 5500
lecturers. The main goal was to determine the cause of occupational stress of academic staff and to
understand how it could affect their professional actions.
The research results showed that among other European countries stress levels in work place are one of
the highest in Latvia, Lithuania and Estonia (ETUCE, 2013). Comparative research conducted in Finland and
the Baltic states has demonstrated that in Latvia there is the highest work intensity and increased tendency of
workplace conflicts (Antila & Ylostalo, 2003). The Latvian Trade Union of Education and Science
Employees (LIZDA) has introduced with shocking data that in Latvia there is the highest level of mobbing in
Europe (34%), the highest level of insults at the working place (verbal violence) (56%), almost the highest
level of reported insecurity of employees (50%), reports indicated on very high pressure for controlling one’s
emotions (64%), and the feeling of being ‘on the edge of burnout’ (49%). Educational sphere employees of
Latvia estimate theirs physical health state lower comparing to educationers in other European countries and
they feel ‘rarely satisfied with their work and life in general’ (59%), while in Lithuania for example, 67
percent of pedagogues are satisfied with their lives (LIZDA, 2011a).
This corresponds to the research conducted earlier in Latvia, according to which 54% of higher education
lecturers in Latvia consider their profession as highly stressful. Among the main sources of stress there were:
inadequate behaviour of students; inadequate demands and unbalanced responsibility required from
institutions; work organization per se; workload and lack of time (Uzole, 2009). Often in literature it is also
argued that the main source of stress in pedagogical profession happens due to emotional linkage between
separate students and professor/lecturer (Zhuravlev & Sergijenko, 2011). Other factors that evoke tension
are: perception of social inequality among educationers and representatives of other professions, decrease of
social status of the profession; and these factors in turn create insecurity towards pedagogues’ own work
evaluation and, therefore, hinder their professional development (Uzole, 2009). As a common cause of stress
experienced by academic staff there also can be mentioned a role conflict and uncertainty in evaluating the
morality of actions (Kuzmina, 2004). Academic staff stands in a spotlight, their professional actions are
judged and they are required to maintain high work performance. This by itself results in emotional tension
and may lead to a burnout and reduced self-reflection (Kurapova, 2009).
Another important and related topic is psychological health of academic staff. Lecturing not only requires
the exchange of information and delivering of knowledge, foremost, it involves responsibility towards
personal and students’ emotional wellbeing (Zhuravlev & Sergijenko, 2011). Therefore, it is assumed that a
lecturer is a psychologically stable person. Taking into consideration the amount of stressors, psychological
stability becomes a critical point of discussion. Consequently, occupational stress is undesired in pedagogical
work.
Professional deformation of personality is a social phenomenon and it can be defined as changes in
personal characteristics, which affect professional actions, which can be expressed in the usage of
professional jargon, certain behaviour and even physical image (Mihailiukova, 2005). As many professional
capacities and personal resources are not being used and several professional characteristics get transformed
in the course of time, modification of personality traits can happen and, paradoxically, it causes disturbing
effects (Gordijenko, 2008). Professional deformation spreads over the professional realm having an impact
Journal of Business Management, 2015, No.9 ISSN 1691-5348
22
on person’s everyday life. It happens particularly often if a person is working in a specific field for a
relatively long period of time loses interests in other topics and lacks contacts with other people outside of
own professional circle (Romane, 2013). Among the academic staff not only changes in professional traits,
but also in personality traits were observed (Veniaminovich, 2011). Professional deformation of personality
in pedagogical work can emerge as a desire to manipulate with others, egoism, inadequate use of authority,
rigidity, un-criticality, which influences professional work of pedagogues in a negative manner
(Veniaminovish, 2011).
As argued, professional deformation mostly occurs in professions, where work is closely related with the
presence of other people: teachers, academic staff, psychologists, managers, medical staff, etc. (Nozhenika,
2009; Bykov, Liapina, 2013).
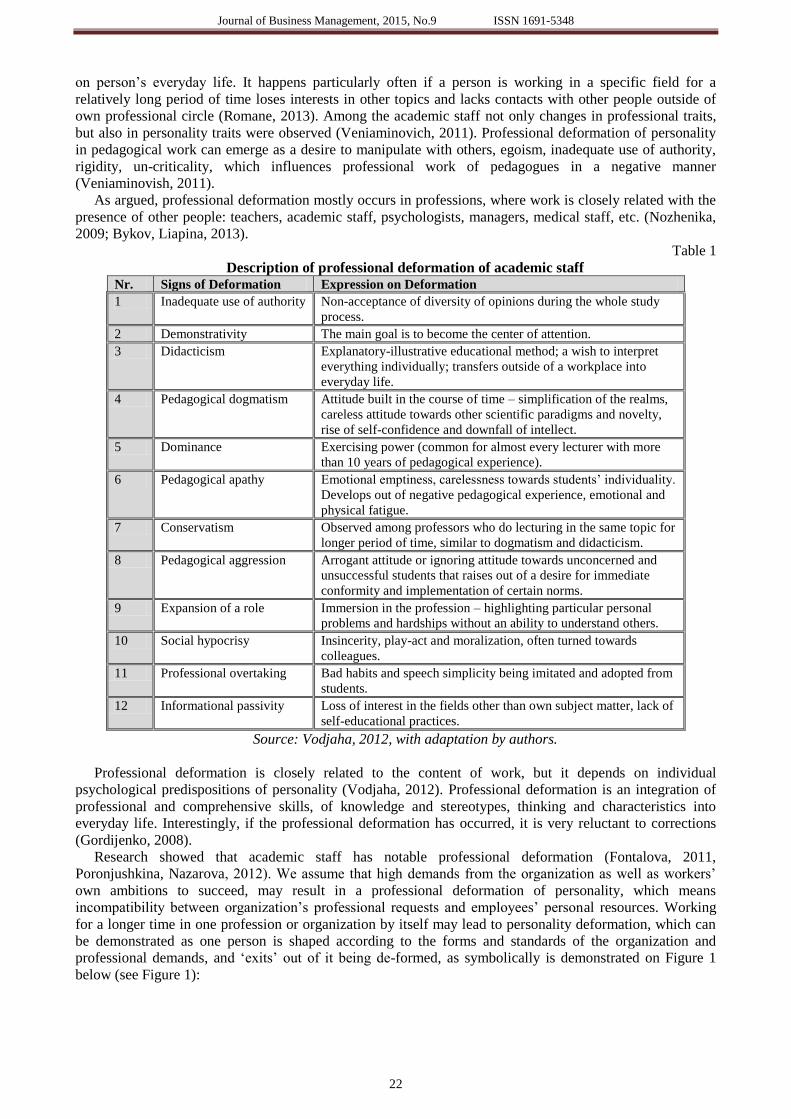
Table 1
Description of professional deformation of academic staff Nr. Signs of Deformation Expression on Deformation
1 Inadequate use of authority Non-acceptance of diversity of opinions during the whole study
process.
2 Demonstrativity The main goal is to become the center of attention.
3 Didacticism Explanatory-illustrative educational method; a wish to interpret
everything individually; transfers outside of a workplace into
everyday life.
4 Pedagogical dogmatism Attitude built in the course of time – simplification of the realms,
careless attitude towards other scientific paradigms and novelty,
rise of self-confidence and downfall of intellect.
5 Dominance Exercising power (common for almost every lecturer with more
than 10 years of pedagogical experience).
6 Pedagogical apathy Emotional emptiness, carelessness towards students’ individuality.
Develops out of negative pedagogical experience, emotional and
physical fatigue.
7 Conservatism Observed among professors who do lecturing in the same topic for
longer period of time, similar to dogmatism and didacticism.
8 Pedagogical aggression Arrogant attitude or ignoring attitude towards unconcerned and
unsuccessful students that raises out of a desire for immediate
conformity and implementation of certain norms.
9 Expansion of a role Immersion in the profession – highlighting particular personal
problems and hardships without an ability to understand others.
10 Social hypocrisy Insincerity, play-act and moralization, often turned towards
colleagues.
11 Professional overtaking Bad habits and speech simplicity being imitated and adopted from
students.
12 Informational passivity Loss of interest in the fields other than own subject matter, lack of
self-educational practices.
Source: Vodjaha, 2012, with adaptation by authors.
Professional deformation is closely related to the content of work, but it depends on individual
psychological predispositions of personality (Vodjaha, 2012). Professional deformation is an integration of
professional and comprehensive skills, of knowledge and stereotypes, thinking and characteristics into
everyday life. Interestingly, if the professional deformation has occurred, it is very reluctant to corrections
(Gordijenko, 2008).
Research showed that academic staff has notable professional deformation (Fontalova, 2011,
Poronjushkina, Nazarova, 2012). We assume that high demands from the organization as well as workers’
own ambitions to succeed, may result in a professional deformation of personality, which means
incompatibility between organization’s professional requests and employees’ personal resources. Working
for a longer time in one profession or organization by itself may lead to personality deformation, which can
be demonstrated as one person is shaped according to the forms and standards of the organization and
professional demands, and ‘exits’ out of it being de-formed, as symbolically is demonstrated on Figure 1
below (see Figure 1):

Journal of Business Management, 2015, No.9 ISSN 1691-5348
23
Figure 1. The organizational impact on professional deformation
Source: created by authors
Professional deformation may occur when the lecturer works in the same position for a significant period
of time. Also, as argued, high stress level fastens or contributes to occurrence of professional deformation.
Studies of stress show that pedagogical work contains significant amount of stressors (Catano, 2007).
Lecturer’s professional action is often evaluated and high productivity is requested. On everyday basis
lecturer must work with students, be psychologically healthy and stand as an authority. Professional
deformation has not been widely studied in Latvia, and this study addresses both issues – occupational stress
and professional deformation among the educators of one of the universities of Latvia. Research background
was dictated by practical question: how can an academic staff work for a long period of time (more than 25
or 30 years) without developing a burnout or professional deformation?
The goal of the current research was to find out whether there is a correlation between the occupational
stress and professional deformation and to provide suggestions to management of a particular university
which can enable preventative actions on diminishing the signs of the occupational stress and professional
deformation. In order to obtain the goal the research questions were raised:
1. Is there a correlation between the professional deformation and occupational stress?
2. 2. What kind of signs of professional deformation the academic staff of university X possesses?
3.METHODOLOGY
The research took place in one of the Latvia’s biggest state universities with its strong traditions and good
reputation. About 500 lecturers are employed by this university. Questioners were electronically sent to full –
time employees, out of which 100 valid questionnaires were returned and therefore selected for further
analysis. Out of 100 respondents, there were 73% women and 27% men. The age of respondents varied
between 23 and 73 years old. Mostly lecturers were in an age of 36 to 50 (39%); in an age group of 51 to 65
there were 27% of respondents, but 23% of respondents represented an age group of 23 to 35. Less
represented were the lecturers/professors in an age group from 66 and up (11%). Mostly respondents had
work experience as an academic staff lasting from 21 to 30 years (26%), 24% of respondents work in the
position from 6 to 10 years, and 23% of respondents answered, that their professional work as an academic
staff is lasting from 11 to 20 years. 16% of respondents work as lecturers 5 years or less and 11% of the
respondents dedicated more than 31 years to the educational profession in academic setting.
To detect the professional deformation a questionnaire of 40 questions was developed (adapted from
Rogov, 1999). Three professional deformation scales were used: behavioural deformation, inadequate use of
authority, and demonstrativity. The scale of behavioural deformation included: behavioural change,
pedagogical aggression and professional overcome. Inadequate use of authority implies: inadequate use of
authority and dominance. Demonstrativity is also sub-divided into two sub-scales: demonstrativity itself and
the expansion of role. This questionnaire does not measure such deformational features as pedagogical
dogmatism, pedagogical apathy, conservativism, social hypocrisy, informational passivity, and professional
didacticism. This can be a subject of further studies.
The coefficients of Cronbach’s alpha were calculated in order to detect the internal consistency in all
scales. After excluding couple of questions in the scale of behaviour, Cronbach’s alpha was 0,962. After
excluding two questions in the scale of inadequate use of authority, Cronbach’s alpha was 0,939. Cronbach’s
alpha of demonstrativity scale was 0,942.
In order to determine the level of occupational stress, the test of Occupational stress by Fontana was used
(Fontana, 1991). The coefficients of Cronbach’s alpha of Occupational stress test was 0,913.
Applying Kolmogorov-Smirnov Z test for calculating the correspondence to the normal distribution, it
Journal of Business Management, 2015, No.9 ISSN 1691-5348
24
was found that results do not correspond to the normal distribution. It can be useful to conduct a further
research in a larger selection with possibility to differentiate respondents according to their age and years of
experience. In our study a nonparametric statistical method such as the Spearman’s rank correlation
coefficient was used.
Additionally, the question of personal character was asked, it concerned the matters of dedication of time
to oneself (health and beauty procedures), and it was formulated: do you feel you can devote time for taking
care of your health and appearance? This question assumed a “yes / no” answer, the space was also left for
comments, if respondents would wish to provide them.
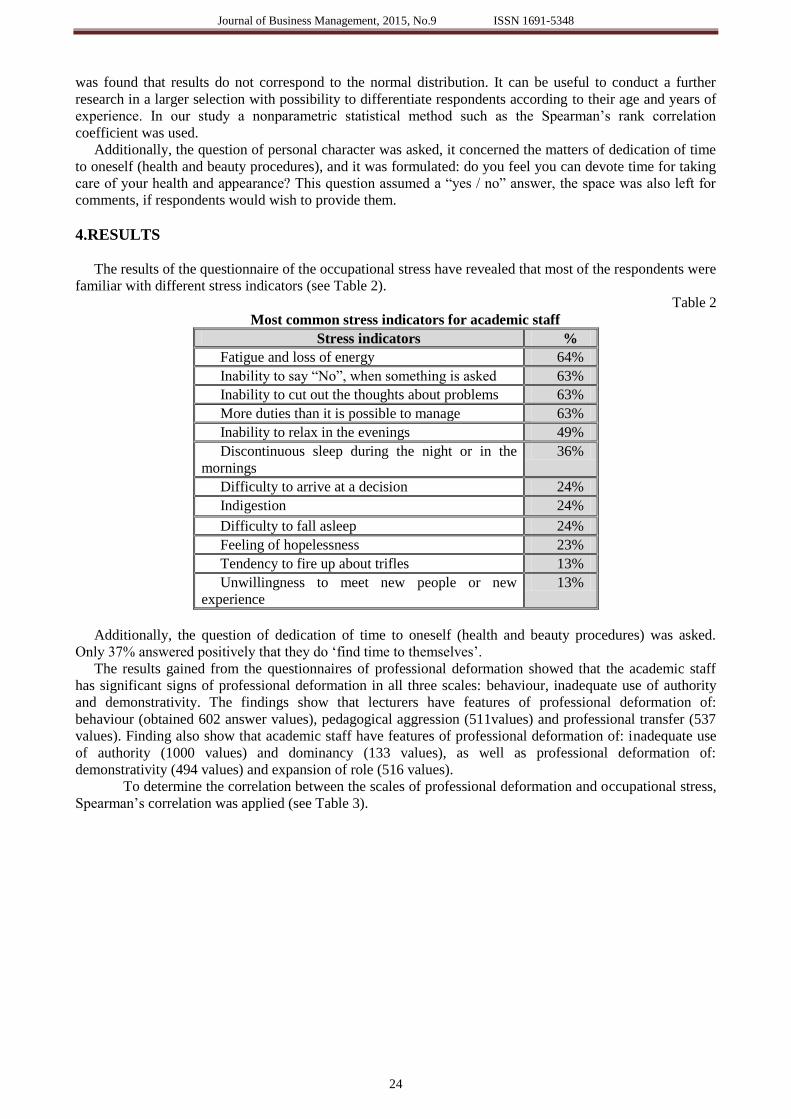
4.RESULTS
The results of the questionnaire of the occupational stress have revealed that most of the respondents were
familiar with different stress indicators (see Table 2).
Table 2
Most common stress indicators for academic staff
Stress indicators %
Fatigue and loss of energy 64%
Inability to say “No”, when something is asked 63%
Inability to cut out the thoughts about problems 63%
More duties than it is possible to manage 63%
Inability to relax in the evenings 49%
Discontinuous sleep during the night or in the
mornings
36%
Difficulty to arrive at a decision 24%
Indigestion 24%
Difficulty to fall asleep 24%
Feeling of hopelessness 23%
Tendency to fire up about trifles 13%
Unwillingness to meet new people or new
experience
13%
Additionally, the question of dedication of time to oneself (health and beauty procedures) was asked.
Only 37% answered positively that they do ‘find time to themselves’.
The results gained from the questionnaires of professional deformation showed that the academic staff
has significant signs of professional deformation in all three scales: behaviour, inadequate use of authority
and demonstrativity. The findings show that lecturers have features of professional deformation of:
behaviour (obtained 602 answer values), pedagogical aggression (511values) and professional transfer (537
values). Finding also show that academic staff have features of professional deformation of: inadequate use
of authority (1000 values) and dominancy (133 values), as well as professional deformation of:
demonstrativity (494 values) and expansion of role (516 values).
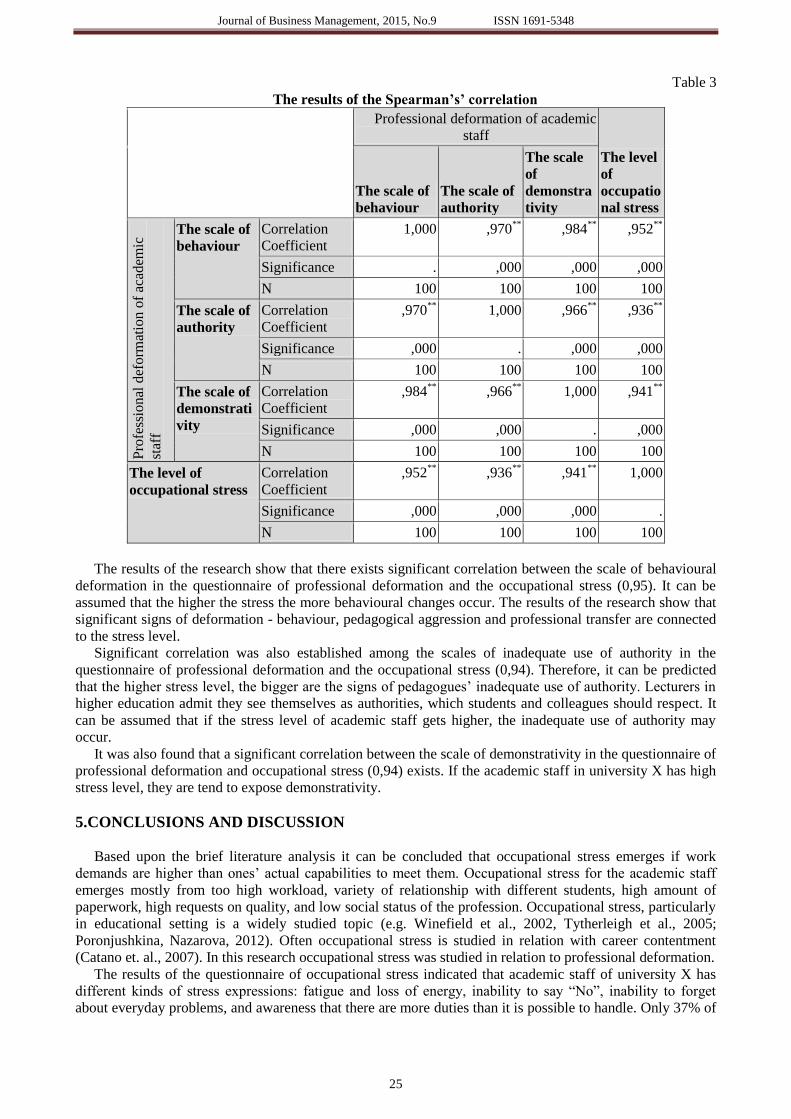
To determine the correlation between the scales of professional deformation and occupational stress,
Spearman’s correlation was applied (see Table 3).
Journal of Business Management, 2015, No.9 ISSN 1691-5348
25
Table 3
The results of the Spearman’s’ correlation
Professional deformation of academic
staff
The level
of
occupatio
nal stress
The scale of
behaviour
The scale of
authority
The scale
of
demonstra
tivity
Pro
fess
ion
al d
efo
rmat
ion
of
acad
emic
staf
f
The scale of
behaviour
Correlation
Coefficient
1,000 ,970**
,984**
,952**
Significance . ,000 ,000 ,000
N 100 100 100 100
The scale of
authority
Correlation
Coefficient
,970**
1,000 ,966**
,936**
Significance ,000 . ,000 ,000
N 100 100 100 100
The scale of
demonstrati
vity
Correlation
Coefficient
,984**
,966**
1,000 ,941**
Significance ,000 ,000 . ,000
N 100 100 100 100
The level of
occupational stress
Correlation
Coefficient
,952**
,936**
,941**
1,000
Significance ,000 ,000 ,000 .
N 100 100 100 100
The results of the research show that there exists significant correlation between the scale of behavioural
deformation in the questionnaire of professional deformation and the occupational stress (0,95). It can be
assumed that the higher the stress the more behavioural changes occur. The results of the research show that
significant signs of deformation - behaviour, pedagogical aggression and professional transfer are connected
to the stress level.
Significant correlation was also established among the scales of inadequate use of authority in the
questionnaire of professional deformation and the occupational stress (0,94). Therefore, it can be predicted
that the higher stress level, the bigger are the signs of pedagogues’ inadequate use of authority. Lecturers in
higher education admit they see themselves as authorities, which students and colleagues should respect. It
can be assumed that if the stress level of academic staff gets higher, the inadequate use of authority may
occur.
It was also found that a significant correlation between the scale of demonstrativity in the questionnaire of
professional deformation and occupational stress (0,94) exists. If the academic staff in university X has high
stress level, they are tend to expose demonstrativity.
5.CONCLUSIONS AND DISCUSSION
Based upon the brief literature analysis it can be concluded that occupational stress emerges if work
demands are higher than ones’ actual capabilities to meet them. Occupational stress for the academic staff
emerges mostly from too high workload, variety of relationship with different students, high amount of
paperwork, high requests on quality, and low social status of the profession. Occupational stress, particularly
in educational setting is a widely studied topic (e.g. Winefield et al., 2002, Tytherleigh et al., 2005;
Poronjushkina, Nazarova, 2012). Often occupational stress is studied in relation with career contentment
(Catano et. al., 2007). In this research occupational stress was studied in relation to professional deformation.
The results of the questionnaire of occupational stress indicated that academic staff of university X has
different kinds of stress expressions: fatigue and loss of energy, inability to say “No”, inability to forget
about everyday problems, and awareness that there are more duties than it is possible to handle. Only 37% of
Journal of Business Management, 2015, No.9 ISSN 1691-5348
26
academic staff has confirmed they devote some time “to themselves”, which means that most of the lecturers
for some reason are not able to find time for their health and beauty/appearance conditions.
At the beginning of this research two questions were raised, which were answered in the course of the
research. Answering to the first question - Is there a correlation between professional deformation and
occupational stress? - The results indicate that statistically significant correlations exist between all scales of
professional deformation and occupational stress. Therefore, it can be assumed that the higher is the
occupational stress, the more significant are the signs of professional deformation.
The second question - What signs of professional deformation academic staff of organization X have? –
Results revealed such signs: professional aggression, temptation to manipulate and criticize, unreasonable
pretension and showoff.
Data of professional deformation questionnaire has also indicated that academic staff had high indexes in
all three scales. In the scale of behaviour there are significant signs of behaviour, pedagogical aggression and
professional transfer. In the scale of authority there is significant signs of inadequate use of authority, but in
the scale of demonstrativity there are significant signs of demonstrativity and expansion of role.
Theoretical analysis of different researches has shown that academic personnel might develop a
professional deformation by working for a longer time. It might lead to lowering of the quality of work.
As a result of this research, following recommendation to the management of university X was
developed: To involve a professional psychologist or a lecturer in psychology of stress management in order
to explain the signs of stress and the signs of professional deformation to the academic staff and the
management of the university. In order to avoid professional deformation of academic staff and foster self-
actualization, to involve a psychologist who could take regular meetings either as an open lectures- seminars
or coach sessions, which would help to realise the features and expressions of stress and professional
deformation;
To carefully analyse student’s evaluation questionnaires about academic staff and to involve psychologist
who could give some consultations and support to those lecturers, who have significant signs of professional
deformation’;
To promote open communication; create the confidential room or an ethical center where the employees
can pose questions and get support, which is aimed on reduction of stress and the risk of emotional burn-out.
For the academic staff it is recommended to learn to recognize the early signs of stress and professional
deformation, and search for a balance between the work and self-maintenance. It is also important to
evaluate own abilities and capacities in relation to the workload. Building good colleague relationships and
working in a team should be acknowledged. Academic staff should also learn to ask for a help and support
when needed; proper time scheduling and implementation of breaks, as well as maintaining of overall
positive attitude towards life should take place.
REFERENCES
1. Antila, J. & Ylostalo, P. (2003). “Darba dzives barometrs Baltijas valstis 2002.gada. Darba politikas petijumi 247.
Galveno rezultatu kopsavilkums”, Helsinki: Darba ministrija. Available at:
https://osha.europa.eu/fop/latvia/lv/research/docs/petijuma_secinajumi.htm , accessed 01.02. 2015.
2. Bykov.S., Ljapina,I., (2013). “Emotional burn-out as a factor of organisational stress of the employees of psycho-
neurological hospital.”// “Emocialnovo vikoranjie kak faktor organizacionnovo stresa rabonikov
psihonevrologicheskovo dispansera”. Vestnik Samorskoi gumanitarnoi akademii. No 1, s.85-93.
3. Catano, V., Francis, L., Haines, T., Kirpalan, H., Shannon, H., Stringer, B. & Lozanski, L. (2007). “Occupational
Stress Among Canadian University Academic Staff”, McMaster University. Available at:
http://www.unbc.ca/sites/default/files/sections/sitransken/occupationalstressamongcanadianuniversity.doc, accessed
16.04.2014.
4. ESENER: European Survey on New and Emerging Risks - Psychosocial Risks, (2009), ESENER-PSR Technical
Report, Munich: European Agency for Safety and Health at Work, available at: https://osha.europa.eu/en/esener-
enterprise-survey/technical-report-euosha.pdf, accessed 20.11.2014.
5. ETUCE: European Trade Union Committee for Education (2013). “Par veseligam un drosam darba vietam
izglitibas darbiniekiem/ Teacher trade unions in solidarity for healthy and safe workplaces in the economic crisis”,
Published by Brussels 2013 ETUCE Project 2013 – 2014, available:
http://teachersosh.homestead.com/Health_and_Safety_in_Crisis/Project_Report_Health_and_Safety_in_Economic_
Crisis_EN.pdf , accessed 28. 04. 2015.
6. Fontana, D. (1991). “Managing Stress”. Bulletin of the Institute of Historical Research Journal. Wiley & Sons.
7. Fontalova, N. (2011). „Stress in professional labour and its psychopsihological consequences.”//„Stress v
profesionalnoi deyatelnosti I evo psihologo –ekonomicheskije posledstvie”. Izvestija Irkutskoy gosudarstvennoi
ekonomicheskoj akademii. No 3. 179-182 s. assessed 26.02.15.
8. Gordijenko, N.V., (2008). “Psychological prophylaxis of the professional deformation of the personality of the
Journal of Business Management, 2015, No.9 ISSN 1691-5348
27
pedagogue.” // Psihologicheskoe coprovozhdenie profilaktiki profesionalnoi lichnosti deformacii lichnosti
pedagoga. Severo – kavkazkij socialnij institut, available at: http://www.dslib.net/psixologia-
vozrasta/psihologicheskoe-soprovozhdenie-profilaktiki-professionalnoj-deformacii-lichnosti.html. (Accessed 17
February 2014).
9. Ghodsy, A. (2008). “The Role of School Organizational Climate in Occupational Stress among Secondary School
Teachers in Tehran”, International Journal of Occupational Medicine and Environmental Health, Vol. 21, Issue 4,
pp. 319 – 329.
10. Hirigoyen, M. F. (2006). Ielavisanas dvesele: emocionala paklausana un identitates deformacija, Riga: Eve.
11. Kurapova, I.A. (2009). “The Moral –Virtues regulation of the Emotional Burn-out in the professional sphere: the
case of teachers of the secondary and higher schools.” // Nravstvenno-cennostnaja reguljacija emocialnovo
vigoraniya v profesionalnoj dejatelnosti: na primere pedagogov crednei I vishei shkoli. Institut psihologii RAN,
aivailable at: http://www.dissercat.com/content/nravstvenno-tsennostnaya-regulyatsiya-emotsionalnogo-vygoraniya-
v-professionalnoi deyatelnos#ixzz2uT89L1YF (accessed 7 February 2014).
12. Kuzmina, G., (2004). “Stress is powerful, but is it the most powerful?”// “Stress - varens, bet vai visvarens? Par
stresu un ta parvaresanu”, Psihologija Gimenei un Skolai, Nr. Nov. / Dec., 28. - 31.
13. Lazarus, R.S., (2006). Stress and Emotion. A new Synthesis. London: Springer Publishing Company.
14. LBAS/LM, (2010). Psihosociala darba vide, Riga: Latvijas Brivo arodbiedribu savieniba un Labklajibas ministrija,
available at: http://www.lbas.lv/upload/stuff/201103/psihosocialadarbavide.pdf, accessed 12 December 2014.
15. Lipman-Blumen,J. (2006). The Allure of Toxic Leaders: Why We Follow Destructive Leaders and Corrupt
Politicians. Oxford: Oxford University Press.
16. LIZDA, (2011a). “Teachers’ Work-Related Stress: Assessing, Comparing and Evaluating. European Trade Union
Committee for Education”, The European Federation of Education Employers, available at:
http://www.lizda.lv/content/files/TeachersStressEn.pdf, accessed 2 February 2014.
17. LIZDA, (2011b). “Recommendations for lowering stress and violence in pedagogic work”// “Rekomendacija par
stresa un vardarbibas mazinasanu pedagoga darba”. The European Federation of Education Employers, available at:
www.lizda.lv/content/files/rekomendacija.docx, accessed 25 February 2014.
18. Motowidlo, S., Packard, J., & Mannin, M. (1986). „Ocupational Stress: Its Causes and Consequences for Job
Performance”. Journal of Applied Psychology, No4. 618 – 629.
19. Mihailiukova, A.V. (2005). “Personal changes of professional deformation cause the lost of professionalism”. //
“Lichnostnie izmenyanie iz-za profesionalnoi deformacii grozjat specialistu poterei etogo samogo profesionalizma”,
Delovoi Peterburg – 2005.
20. Nozhenika, O.S. (2009). “Professional deformation of teacher and pedagogical reflexion.”// “Profesionalnaja
deformacija uchitelja i pedagogicheskaja refleksija”. Voprosi psihologii, Moskva: ООО.
21. Ozolina-Nucho, A., Vidnere, M. (2004). “Stress management: overcoming and prophylaxis”. //Stresa menedzments:
parvaresana un profilakse”, Riga: AGB.
22. Poronjushkina, T., Nazarova, I., (2012). “Practical recommendations for the prophylaxis of professional stressors”//
“Prakticheskije pekomendacii po profilaktike profesionalnih stresov. Sovremennie isledovanie socialnih problem,
No 8 / 2012, 3-14 s.
23. Roja, I., Roja, Z., Kalkis, H. (2006). “”Stress and violence at work.” // “Stress un vardarbiba darba”, Riga.
24. Rogov, J.I. (1999). „Ocenka profesionalnoi napravlenosti lichnosti uchitelja, available at:
http://brunner.kgu.edu.ua/index.php/cv/516-rogov, accessed 10 February 2014.
25. Romane, L. (2013). “Profesionala deformacija: kad privataja dzive ielauzas darbs: par profesionalo iemanu
pielietosanu arpus darba vietas”, Veseliba, Nov. (2013), 86. - 89.lpp.
26. Selye, H. (1978). The Stress of Life. New York: Mc Graw – Hill.
27. Tytherleigh, M.Y., Webb, C. Cooper, C.L. & Ricketts, C. (2005). “Occupational stress in UK higher education
institutions: A comparative study of all staff categories”, Higher Education Research & Development, 24, pp. 41 -
61.
28. Uzole, T. (2009). “Stress and burnout: professional stress and its management.” // “Stress un izdegsanas sindroms:
Profesionalais stress un ta vadisana”, Riga: Latvijas Universitate, available at:
http://profizgl.lu.lv/mod/book/view.php?id=16480&chapterid=3238 (accessed 15 December 2014).
29. Veniaminovich, G.A. (2011). “Professional destruction and deformation of the pedagogue” // Profesionalnaja
destrukcija i deformacija pedagoga, available at: http://www.proza.ru/2011/12/28/1510%20-, accessed 02.12.2014.
30. Vodjaha, S.A. (2012). “Professional deformation of the pedagogue”. // Profesionalnaja deformacija pedagoga,
Available at: http://educationalpsychology.narod.ru/index/0-32 , accessed 03.02. 2014.
31. Volti, R. (2008). “An introduction to the sociology of work and occupations”, Los Angeles: Rudi Volti.
32. Weissbourd, R. (2003). “Moral teachers, Moral Students.” Educational Leadership, 60, 6 – 11.
33. Winefield, A.H., Gillespie, N., Stough, C., Dua, J. & Hapuararchchi, J. (2002). “Occupational stress in Australian
universities: A national survey 2002.” South Melbourne: National Tertiary Education Union.
34. Zhuravlev, A.L., Sergiejnko, J.A (2011). “Stress, burnout, keeping up in contemporary context.” //“Stress,
vigoranie, sovladanie v covremennom kontekste”, Institut psihologii RAN.
35. Zdanovs, O. (2008). [Zhdanov, O.] “On the Utility of Stress: on Stress at work.” // “Par stresa lietderibu: par stresu
darba”, Les Nouvelles Esthetiques Latvia, Nr. 6, 46. - 47.lpp.
Journal of Business Management, 2015, No.9 ISSN 1691-5348
28
THE ROLE OF LEADERSHIP IN CREATION OF ORGANISATIONAL
TRUST
Julija Bulatova
Riga International School of Economics and Business Administration, Meza 3, Riga, Latvia,
e-mail: [email protected]
ABSTRACT
Purpose: This research paper introduces with the empirical results of a study exploring the relationships between the
concepts of leadership and organizational trust. The sample used in the analysis (N = 215) was selected in Latvian
companies, both of Latvian and foreign capital. This paper argues that trust in organizational life is a necessary
foundation of working relationship and it can be enhanced due to the leadership behaviour.
Design/methodology/approach: The empirical part of the study shows the relationship between cognitive and
emotional components of trust and ethical leadership, which was measured by leader – member exchange (LMX) scale.
Statistical analysis (using SPSS 22) based on a survey of employees of 4 different organisations within Latvian business
context was applied.
Findings: The results of the study indicate that relationship – oriented leadership, which implies an ethical connotation,
has a positive correlation with trust, and organisations as to leadership – trust relationship differ statistically.
Research implications: This study contributes both to the literature on organisational trust, as well as to the emerging
theory on leadership and ethical leadership, adding data of Latvian business context.
Practical implications: It is suggested that organisational trust should be addressed as a strategic question for the
companies. Moreover, leaders should take responsibility for the quality of the leader-member relationship in order to
develop organisational trust.
Originality: This article makes a theoretical contribution by examining the linkages between organisational trust and
leadership, and also adds Latvian data to the field of study of interrelationship between the phenomena.
Keywords: Leadership, Trust, LMX, Latvian business context.
1.INTRODUCTION
Organisation foremost is the people. As stated by Drucker (Drucker, 2005 In: Forands, 2007, p. 162)
organisation is based upon “human, its social and moral phenomena”. A major part of the leader’s work, as it
continues to be highlighted in managerial literature, is dealing with people. When leadership relationships
induce organisational trust, the overall organisational context gives spontaneous sociability (Fukuyama,
1995), which means willingness and ability of participants to form co-operation within the terms of reference
partners. Organisational trust is a positive attitude held by one organisational member towards another
assuming that the other party will act honestly and will not take advantage of one’s vulnerability and
dependence in a risky situation (Das & Teng, 1998).
As stated by Nyhan and Marlowe (1997), in order to lead succesfully a leader has to have an access to the
information. Trust forms the effectiveness of co-operation with followers providing such access to
information. It is argued that trust in a leader is a basis for effective functioning of the organization and it is
the level of confidence that employees have in their leader’s competence. When followers trust a leader, they
are ready to sense the visions and objectives, being confident that their rights, interests and energy will not
be neglected (Nyhan and Marlowe, 1997).
Morris (2014) defines a leader as someone who looks ahead and visualises the future. Zaleznik (1992)
states that leaders directly work with values, they define the contexts and meanings to others. In literature we
also find that the leader has an important role as a catalyst of change in the organisation (Trevino, & Brown,
2004). The attitudes and decision-making of top leadership influence an organisational culture and resonate
throughout the entire organisation. The research by Mayer (2011), Ciulla (2005), Trevino et al. (2003)
demonstrate that executive leaders play an important role in communicating ethical standards. Values of
leaders get transformed into organisational values. If the leader works for building trustful dyadic
relationship with the subordinates, it gradually gets transformed throughout the entire organisation
(Fukujama, 1995). Research indicates that ethical leadership positively affects developing of a strong
organisational culture (Trevino et al., 2003), and contributes to strengthening of the organisational trust
(Lamsa & Pucetaite, 2006). Although the exact meaning of ‘ethical leadership’ is still a matter of discussion
in theoretical and practical terms (Ciulla, 2005; Maak & Pless, 2006), this research is concerned with the
impact of leadership’s ‘ethicality’ on such outcome as organisational trust in Latvian business context.
Theoretical background further will introduce with the main arguments, which served as a theoretical basis
of this research. Methodology part will briefly discuss the methods used; results part will demonstrate the
Journal of Business Management, 2015, No.9 ISSN 1691-5348
29
results gained in the research, followed by conclusion and discussion parts.
2.THEORETICAL BACKGROUND
Trust has been defined in many different ways; already Stack (1978) and Wrightsman (1991) in the field
of social psychology have reviewed trust as an individual predisposition, it was also observed as a
psychological state (Lewicki et al, 2006; Rosseau et al, 1998) and as a behavioural response (Mayer et al,
1995). Often the definition of trust by Mayer et al. (1995) is provided in leadership research: trust is „the
willingness of a party to be vulnerable to the outcomes of another party based on the expectation that the
other will perform a particular action important to the trustor, irrespective of the ability to monitor or control
that other party” (Mayer, Davis, & Schoorman, 1995, p. 712). This confidence in the other party’s
benevolent behaviour develops from the experience and belief that the trustee has earlier followed the same
values and principles (Connell, Ferres, & Travaglione, 2003). As to Sako (2000), trust cannot be formed
without a prior basis for it. It usually develops when two parties regularly comply with the same ethical
or/and social norms and regulations (Fukuyama, 1995). Trust therefore, depends on organizational members’
work morale and competence (Lamsa & Pucetaite, 2006), and it includes perception, interpretation and
belief, resulting in a high intention for further collaboration (Kuan and Bock, 2007).
As the vast body of literature suggests, trust is a multifaceted construct comprising cognitive, affective,
behavioural, economical and ethical components. Trust may bring positive or negative results and it can be
manifested at the individual, group, organisational or societal levels (Pucetaite, Novelskaite, 2014). Trust
may be felt towards individuals and organisations alike (Luoma-aho et al., 2012), and, once established, it
builds a certain context, which enhances ‘communities of practice’ (Brown & Duguid, 1998). Such
‘communities of practice’ are characteristics of so called ‘learning organisations’, where openness,
knowledge sharing and emotional support take place (Easterby-Smith, Crossan & Nicolini, 2000).
The study by McEvily and Tortoriello (2011) has revealed that there exist 42 different instruments to
measure trust in the organisational context. Among the trust measurement instruments (e.g. Gillespie, 2003,
Cummings and Bromily, 1996), the instrument by McAllister (1995) was chosen for the purposes of this
study. According to McAllister (1995) trust is divided into cognitive and affective components, where
affective trust is connected to psychological and emotional aspects, which make people to wish to share their
feelings, hopes, and fundamental believes. Cognition-based trust tackles evaluative dimension, based on
critical attitude towards one’s performance, decision-making and consistency. The cognitive component of
organisational trust refers to a certain experience based on the fact that a partner has been acting in a
competent way in the past and can be expected to do so in the future (Gulati & Sytch, 2008). Cognition-
based trust works in short-term affairs, meanwhile in sustaining the long-term relationship, an affect-based
trust is required. Affect-based trust can be found in reliable, mutually-rewarding and effective relationships
(Gulati & Sytch, 2008; Lamsa & Pucetaite, 2006).
The LMX theory (primarily was called as Vertical Dyad linkage theory by Graen & Cashman, 1975) is
focused on the development of relationship between the leader and subordinates, and it has its roots in the
theory of social interrelations - e.g. in social exchange theory (Blau, 1964). According to this approach, there
exists an exchange of information and emotions between the parties involved, and it can be referred to as low
and high LMX (Anand et al., 2011). High – exchange relationship (high LMX) imply high quality of
informational exchange, trust, loyalty, emotional comfort. Such relationships are getting formed by a leader
(Dansereau et al., 1975) with the subordinates who constitute the „in-group” circle. In- group followers are
empowered with greater responsibilities, they receive more attention of the leader, are given more freedom
for performing their roles, and they get more rewards. The influence has a two-way direction, parties are
willing to contribute to the emotional well-being of each other, and relationships exit the boundaries of the
formal contract. In the case of „out-group members”, the exchange of quality of information and emotional
support is low, the influence goes the direction from the leader towards the subordinate, there is lower level
of trust, more control is used from the part of the leader and less initiative from the part of subordinate. Such
relationship can be characterised as formal and emotionally neutral or rather cold and indicate on low LMX
(Graen & Uhl – Bien, 1995).
As discussed, values of leader, gradually are getting spread throughout the working environment and can
start to form an affect-based organizational trust, as participants start to feel that their values are accepted
and partners perceive the congruence between own and organisational values (in-group employees). As
demonstrated in a recent studies (Ellemers et al, 2013), value congruence contributes to the increase of
intrinsic motivation, which in turns serves as a base for co-operation, creativity and sustainability of the
organisation (e.g. Liao et al., 2010) satisfaction and commitment (Gerstner and Day, 1997; Podsakoff et al.,
Journal of Business Management, 2015, No.9 ISSN 1691-5348
30
1996). Interestingly that in the case of low LMX a cognitive trust may be present, and although it rests on
contractual commitments, the reliance on other party’s professionalism may result in high effectiveness as
well, especially if it concerns short-term relationship (Pucetaite, 2014).
The academic discourse on leadership has related the concepts of LMX and that of ethical leadership
(Hansen, 2011, Pucetaite, 2014), arguing that the characteristics of high LMX such as respect, trust,
reciprocity, and empowering of followers indicate on ethical dimension of leadership. Indeed,
transformational leadership idea (Avolio & Gardner, 2005) which gave rise to the discussion of leadership
ethicality (Northouse, 2010; Yukl, 2012) draws a particular attention to such characteristics of leadership as
encouragement of employees, risks-taking, creativity, sharing of visions (Brown, 2006). Transformational
and, further, ethical leadership is often associated with sharing the visions, values, empowering of the
subordinates, sharing of responsibility, leaders’ servant-ship (Greenleaf, 2003). Ethical leadership often
speaks of integrity and character. Indeed, high LMX indicates on such qualities of the leader and
subordinates’ reliance upon leaders’ integrity (Wilson et al, 2010). Although there are arguments against
attributing LMX theory to ethical leadership (Yukl et al, 2009), moreover, the studies demonstrate that LMX
have another conceptual platform than that of ethical and transformational leadership (O'Donnell et al, 2012),
it is not contradictory for the purposes of this study. The aim of this research was to observe what role the
behaviour of a leader plays in the formation of organisational trust. Leaving apart the discussion as to what
degree the LMX can or cannot be attributed to ethical leadership theory, the LMX measurement allows one
to understand how the quality of relationship between the followers and the leaders are perceived by
followers. The moral responsibility of a leader for forming relationship with subordinates and within the
organisation was discussed above.
Therefore, two research questions were established:
Is there a link between the behaviour of leader and organisational trust?
Do organisations differ in their levels of organisational trust? If so, can the differences be attributed
to leaders’ behaviour?
3.METHODOLOGY
The survey for the present study was administered in 2014 by author in four different organisations of
different industries. They were chosen in order to represent service and production organisations, which,
using statistical data are representing Latvian business context most, by the number of people involved in
these industries. Organisations were deliberately chosen of different industries, as studied phenomena rather
than the industry were in the focus of the research, which is argued to be a valid and applicable approach for
social science (Schwab, 2005).
Participants (N =215) were aged 24 – 63, medium age 42. Men – 62%, women – 38%, both, Latvian and
Russian nationals, high management position – 9%, middle management – 15%, and 76% employees –
specialists. Data were collected using printed questionnaire version. Confidentiality was guaranteed to
respondents.
In order to study the relationship between ethical leadership and organisational trust, the seven-item LMX
measure (Graen & Uhl – Bien, 1995), and McAllister’s (1995) organisational trust test (11 questions which
are subdivided in 2 scales: emotional and cognitive trust) were used, applying a translation and back –
translation method, which is stated to be a valid procedure in social science research (Brislin, 1970). Five -
point Likert scale for LMX (1 - strongly disagree and 5 – strongly agree) and a seven – point Likert scale (1
– strongly disagree and 7 – strongly agree) for measuring organisational trust were statistically analysed
applying SPSS 22 version.
4.RESULTS
Descriptive statistics has revealed that Cronbach’s alpha for LMX were 0.82, and 0.68 for the Trust
questionnaire, which are acceptable results for the socio – psychological research (Kaplan, 2004). Spearman
coefficient was chosen to be applied in order to calculate the correlations of the scales, as there was no
normal distribution found. Table1 below demonstrates the correlations between the LMX statements and
those of trust. Table 2 shows the results of total LMX scale in relation to emotional and cognitive trust.
Based upon the data of all four companies a moderate correlation has been established between the leader
– member exchange and organisational trust; It was found though that in organisation A, B and C the
correlation among the scales is high (summary result of three organisations = 0.877).
The organisation D had low indexes of LMX, which did not correlate with the organisational trust; some

Journal of Business Management, 2015, No.9 ISSN 1691-5348
31
of the LMX scales in the answers of the respondents of this organisation even had negative correlation with
the scales of organisational trust, paradoxically, organisational trust scales were of high results. It seems that
relationship among colleagues revealed cognition-based trust although the majority of the people did not
correspond to the ‘in-group’ profile as to their relationship with the leader. This organisation belongs to a
banking industry. After the banking sector organisation data was extracted from the analysis, the remaining
data of three other organisations demonstrated that there exists the link between the leaders’ behaviour and
organisational trust (a positive correlation of 0,87 was established).
In another organisation, which belongs to Fashion and model industry, just 11 employees have
participated in the survey and this organisation has demonstrated highest standard deviation of results, which
can be explained by the small amount of people and the specifics of their sphere, where employees are
encouraged to perform as independent professionals who focus more on building relationships with partners
outside of the organisation rather than within.
Interestingly that organisation of cosmetics production industry, despite of the fact that it is a production
company with a long history of more than hundred years, has demonstrated high LMX and high
organisational trust, particularly of emotion-based trust, indicating on ‘family-like’ leadership approach
within this organisation.
Table 1
The correlations among the scales of LMX and Organisational Trust
LMX 1 LMX 2 LMX 3 LMX 4 LMX 5 LMX 6 LMX 7
Trust 1 0.612 0.628 0.683 0.607 0.552 0.562 0.772
Trust 2 0.565 0.465 0.693 0.547 0.578 0.503 0.756
Trust 3 0.451 0.465 0.629 0.572 0.562 0.485 0.660
Trust 4 0.418 0.573 0.662 0.604 0.535 0.479 0.717
Trust 5 0.539 0.510 0.628 0.560 0.545 0.475 0.726
Trust 6 0.480 0.569 0.539 0.498 0.544 0.435 0.631
Trust 7 0.408 0.564 0.535 0.582 0.527 0.423 0.617
Trust 8 0.417 0.480 0.433 0.539 0.487 0.378 0.612
Trust 9 0.426 0.430 0.494 0.526 0.432 0.432 0.574
Trust 10 0.414 0.492 0.564 0.538 0.432 0.414 0.587
Trust 11 0.324 0.447 0.540 0.509 0.566 0.363 0.663
Table 2
Correlation among total LMX and Emotional and Cognition – based trust
Emotional trust Cognition- based trust
LMX ,629**
,686**
**. Correlation is significant at the 0.01 level (2-tailed).
5.CONCLUSIONS AND DISCUSSION
This study has demonstrated that organisations differ statistically among themselves in their evaluation of
organisational trust, and differences can be attributed to the followers’ perceptions of leadership in their
organisations.
The object of LMX theory is the independent relationship between the leader and each of the
subordinates. The quality of each relationship is different in different dyads. It means with some subordinates
the leader has poor interaction, and LMX results will have lower values, compared to those employees with
whom the leader has trustful and open relationship. The objective of the theory is that a leader should try to
involve more members into in-group relationship and build high-quality relationship with many
subordinates, such that whole working unit works as an in-group ‘community’.
The results have revealed that this actually can take place, and it was the case of the production
Journal of Business Management, 2015, No.9 ISSN 1691-5348
32
organisation of the cosmetics industry. As follows from the literature review, low LMX often is related to the
low job satisfaction. LMX speaks of realisation of leaders’ responsibility in terms of projecting own biases
on the followers, which permits to build long-term relationship (Yukl et al, 2009). Current work
demonstrates that some leaders are not viewed as reliable partners, and the links between the leaders and
employees are emotionally weak. Employees do not feel their leaders as somebody they would refer to in
moral terms. Especially this concerns the banking and casino sector. This also corresponds to Boddy (2011)
observation of the banking sector leadership.
Current research is a work in progress. Further qualitative method would permit to specify which aspects
of leadership are particularly important for Latvian business context, as well as to see closely the reasons of
why different organisations had different relationship as to LMX – trust.
Similar research took place in Lithuania in 2013 – 2014, where employees of the public organisation
(sample size, n=757) and six private organizations (n=316) were tested (Pucetaite & Novelskaite, 2014).
Comparing the results from a cross – cultural perspective, it is interesting to learn that in Lithuania and in
Finland (Pucetaite, 2015) trust was studied as a mediator between the LMX and organisational
innovativeness, and although its mediating role was found to be rather weak (R2=0.3 B=0.538), it was
argued to be a necessary foundation for such important organisational outcome as innovativeness. In their
studies LMX and trust were also found to be related.
Overall, the current research demonstrates that a leader plays a significant role in formation of
organisational trust, and this study has confirmed that in order to establish high organisational trust the
leaders should pay attention to their behavioural standards.
REFERENCES
1. Anand, S., Hu, J., Liden, R. C. & Vidyarthi, P. R. (2011). Leader-member exchange: Recent research findings and
prospects for the future. In A. Bryman et al. (Eds) The Sage Handbook of Leadership (pp. 311-325). London: Sage
Publications.
2. Avolio, B.J. and Gardner, W.L. (2005). “Authentic leadership development: getting to the root of positive forms of
leadership. “Leadership Quarterly, Vol. 16 No. 3, pp. 315-38.
3. Bass, B.M. (1985). Leadership and Performance Beyond Expectations. Free Press, New York, NY.
4. Basu, R. and Green, S.G. (1997). “Leader-member exchange and transformational leadership: an empirical
examination of innovative behaviours in leader-member dyads.” Journal of Applied Social Psychology, Vol. 27 No.
6, pp. 477-99.
5. Blau, P. M. (1964). Exchange and Power in Social Life. New York, NY: John Wiley.
6. Boddy, C. (2011). “The Corporate Psychopaths Theory of the Global Financial Crisis.” Journal of business Ethics.
102, 255 – 259.
7. Brislin, R.W. (1970). “Back – Translation for Cross – Cultural research.” Journal of Cross-Cultural Psychology.
September, vol. 1 no. 3, 185-216.
8. Connell, J., Ferres, N., & Travaglione, T. (2003). Engendering trust in manager-subordinate relationships: Predictors
and outcomes. Personnel Review, 32(5), 569–587.
9. Dansereau, F. Jr., Graen, G. and Haga, W.J. (1975). “A vertical dyad linkage approach to leadership within formal
organization: a longitudinal investigation of the role making process”, Organizational Behaviour & Human
Performance. Vol. 13 No. 1, pp. 46-78.
10. Das, T. K. & Teng, B-S. (1998). Between Trust and Control: Developing Confidence in Partner Cooperation
Alliances. Academy of Management Review, 23, 491-512.
11. Deluga, R.J. (1992), “The relationship of leader-member exchange with laissez-faire, transactional, and
transformational leadership in naval environments”, in Clark, K.E., Clark, M.B. and Campbell, D.P. (Eds), Impact
of Leadership, Center for Creative Leadership, Greensboro, NC, pp. 237-47.
12. Ellonen, R., Blomqvist, K. & Puumalainen K. (2008). “The role of trust in organisational innovativeness”. European
Journal of Innovativeness, 11, 160–181.
13. Esterby-Smith, M., Crossan, M.,Nicolini, D. (2000). “Organizational learning: debates past, present and future”.
Journal of management studies, Vol.37, Iss.6, pp.783 – 796.
14. Forands, I. (2007). Paligs personala specialistam.// Help to Personnel Manager. Riga: LIF
15. Fukuyama, F. (1995). Trust. New York, NY: Simon and Schuster.
16. Gerstner, C. R., & Day, D. V. (1997). Meta-analytic review of leader–member exchange theory: Correlates and
construct ideas. Journal of Applied Psychology, 82, 827–844.
17. Graen, G.B., Cashman, J.F. (1975). „A Role making Model of Leadership in Formal Organisations: A
Developmental Approach.” In: J.G. Hunt, L.L.Larson (Ed.)Leadership Frontier. 143 – 165. Kent: Ohio.
18. Gulati, R. & Sytch, M. (2008). Does familiarity breed trust? Revisiting the antecedents of trust. Managerial
Decision Economics, 29, 165–190. http://dx.doi.org/10.1002/mde.1396
19. Graen, G.B. & Uhl-Bien, M. (1995). Relationship-based approach to leadership: Development of leader-member
exchange (LMX) theory of leadership over 25 years: Applying a multi-level multi-domain perspective. Leadership
Quarterly, 6 (2), 219-247.

Journal of Business Management, 2015, No.9 ISSN 1691-5348
33
20. Greenleaf, R.K. (2003). The Servant-Leader Within: a Transformative Path New York: Paulist Press.
21. Hansen, M. B. (2011). “Antecedents of organizational innovation: The diffusion of new public management into
Danish local government”. Public Administration, 89 (2), 285-306. http://dx.doi.org/10.1111/j.1467-
9299.2010.01855.x
22. Huhtala, M., Kangas, M., Lamsa, A.-M. & Feldt, T. (2013). Ethical managers in ethical organizations? The
leadership-culture connection among Finnish managers. Leadership and Organization Development Journal, 34 (3),
250 – 270. http://dx.doi.org/10.1108/01437731311326684
23. Kaplan, D. (2004). The SAGE Handbook of Quantitative Methodology for the Social Sciences. Londn: SAGE
24. Lamsa, A-M. & Pucetaite, R. (2006). Development of organizational trust among employees from a contextual
perspective. Business Ethics: A European Review, 15, 130–141. http://dx.doi.org/10.1111/j.1467-8608.2006.00437.x
25. Lewicki, R.J., Tomlinson, E., Gillespie, N. (2006). “Models of Interpersonal Trust Development: Theoretical
Approaches, Empirical Evidence, and Future Directions.” Journal of Management, 32: 991.
26. Liao, H., Liu, D. and Loi, R. (2010), “Looking at both sides of the social exchange coin: a social cognitive
perspective on the joint effects of relationship quality and differentiation on creativity”, Academy of Management
Journal, Vol. 53 No. 5, pp. 1090‐109.
27. Luoma-aho, V., Vos, M.,Lappalainen R., Lamsa, A.-M., Uusitalo, O., Maaranen, P., Koski, A. (2012). “Added
Value of Intangibles for Organisational Innovation.” An Interdisciplinary Journal on Humans in ICT
Environments.Vol. 8 (1), 7–23. DOI: http://dx.doi.org/10.17011/ht/urn.201205141650
28. Maak, T., Pless, N.M. (2006). “Responsible Leadership in a Stakeholder Society – A Relational Perspective”.
Journal of Business Ethics, Vol. 66, 99 – 115.
29. McAllister, D.J. (1995). “Affect- and Cognition-based Trust as Foundations for Interpersonal Cooperation in
Organisations.” Academy of Management Journal. Vol. 38., No 1, 24 – 59.
30. McEvily, B. Tortoriello, M. (2011). “Measuring trust in organisational research: Review and recommendations.”
Journal of Trust Research: Routledge. Vol. 1(1), 2011: 23-63
31. Northouse, P. G. (2010). Leadership: theory and practice. 5 th ed. Thousand Oaks, CA: Sage Publications.
32. Nyhan, R.C., & Marlowe, H.A. (1997). “Development and psychometric properties of the organizational trust
inventory”. Evaluation Review, 21(5), 614-635.
33. O'Donnell, M., Yukl, G., Taber, T. (2012),"Leader behavior and LMX: a constructive replication",
Journal of Managerial Psychology, Vol. 27 Iss 2 pp. 143 – 154.
34. Podsakoff, P. M., MacKenzie, S. B., Bommer, W. H., 1996. Transformational leader behaviours and substitutes for
leadership as determinants of employee satisfaction, commitment, trust, and organizational citizenship behaviours.
Journal of Management. 22.
35. Pucetaite, R. (2014). “Stimulating organizational innovativeness through ethical leadership practices: the mediating
role of organizational trust”. 19th International Scientific Conference; Economics and Management 2014, ICEM,
Latvia. Procedia - Social and Behavioral Sciences 156 ( 2014 ) 231 – 235.
36. Pucetaite, R., Novelskaite, R. (2014). “The Mediating Effect of Organisational Trust in the Relationship Between
Leader Member Exchange and Organisational Innovativeness.” Economics and Management. Vol. 19 (2), 194 –
201.
37. Pucetaite, R. (2015). “Sustainable innovation as positive organizational outcome of practising organizational ethics.”
Proceeding of the International Conference Ethical organizations and sustainable innovations. Kaunas, March 25,
2015.
38. Rousseau, D. M., Sitkin, S. B., Burt, R. S., & Camerer, C. (1998). Not so different after all: A cross-discipline view
of trust. Academy of Management Review, 23, 393–404.
39. Schwab, D. (2005). Research Methods for Organizational Studies, 2nd ed., Lawrence Erlbaum, NJ.
40. Trevino, L. K., Brown, M., & Hartman, L. P. (2003). “A qualitative investigation of perceived executive ethical
leadership: Perceptions from inside and outside the executive suite”. Human Relations, 56(1), 5-37.
41. Wilson, K.S., Sin, H. and Conlon, D.E. (2010), “What about the leader in leader‐member exchange? The impact of
resource exchanges and substitutability on the leader”, Academy of Management Review, Vol. 35 No. 3, pp. 358‐72.
42. Yukl, G.A. (2012). Leadership in organizations. Harlow: Pearson Education.
43. Yukl, G., O'Donnell, M. and Taber, T. (2009), “Influence of leader behaviors on the leader‐member exchange
relationship”, Journal of Managerial Psychology, Vol. 24 No. 4, pp. 289‐99.
44. Zaleznik, A. (1992). “Managers and |Leaders: Are they different?” Harvard Business Review Classics. HBR press.
Journal of Business Management, 2015, No.9 ISSN 1691-5348
34
MENTAL ACCOUNTING AND RELATED CATEGORIZATIONS IN THE
CONTEXT OF SELF-REGULATION
Andrijana Musura
Zagreb school of economics and management, Jordanovac 110, 10 000 Zagreb, Croatia
e-mail: [email protected]
Kristina Petrovecki
High school Zabok, Ivana i Cvijete Huis 2, 49200 Zabok, Croatia
e-mail: [email protected]
ABSTRACT
Purpose: The concept of mental accounting is part of a new scientific discipline that integrates insights psychology into
the area of economic decision-making – behavioral economics. The problem of this research evolves around questions
whether mental accounting is kind of universal process as well as around question whether the tendency for mental
accounting serves as a function of different mind-sets – deliberative and implemental. The notion of different mind-sets
comes from self-regulation theory of action phases and that in relation to goal setting and pre and post decision phase.
Design: All research questions are addressed in the experimental design, conducted on 200 participants. The tendency
for mental accounting is measured using five hypothetical situations within context of different mind-sets.
Findings: The research showed that mental accounting is robust phenomenon, which might play a self-regulatory role
in the context of saving decision making but not in the condition of experimentally induced manipulation but in the real
world decision making.
Originality/Value: The usage of experimental design in analysis of mental accounting and related categorizations;
Approach to mental accounting in the context of self-regulation theories
Keywords: mental accounting, framing, self-regulation, deliberative mind set, implemental intentions
1.INTRODUCTION
Mental accounting is as a way of categorization of money within different situational contexts where
situations serve as frames that direct economic decisions. Using mental accounting, individuals help
themselves to facilitate judging about economic decisions. Nevertheless, some situations lead to activation of
different mental accounts and thus different judgments, although these differences are not accounted by
economic theory of rational decision-making. Judgment under influence of framing is not supported by
mainstream economic theory, which posits that rational behavior is guided by narrow economic rules, among
which of them is the context independence of choice.
Openness for various information as well as unbiased and objective valuation of information characterizes
rational reasoning, if under “rational” we assume symmetric information. Individual, who reasons, takes into
account all available information in the process of reaching a rational decision. According to self-regulation
theory of action phases, when a decision is made, individual “closes” himself to available information
selectively processing information compatible with his goal. Selective perception includes susceptibility to
using heuristics in addition with specific mind-set that encompasses this phase of self-regulation. Different
mind-sets – deliberative and implemental, are properties of the pre-decision and after-decision phase.
Research done with different modes of thinking has shown that inducing individuals into certain mind set,
frames their way of thinking, making them pay more attention to information congruent with the elicited
mind set. Induced to deliberative mind set, individual objectively perceives information about goal
feasibility, while in implemental mind set individual is biased towards overestimating this feasibility and
thus protecting himself from the distractions found out of the goal focus.
Considering all this, it gives us right to assume that subjects induced to deliberative mind set will be less
prone to heuristics like mental accounting and related categorizations, compared to the subjects induced to
implemental mind set who might show greater susceptibility to heuristical reasoning. In the latter, subject is
encouraged to make implemental intentions which help him protect his goal and be more focused to
achieving the goal. In the following research, we shall propose that mental accounting existing phenomenon.
In addition, in the case of implemental mind set, we assume subjects will be more susceptible to mental
accounting as a tool supporting the appointed goal - in our case "saving". In the economic sense,
implemental mind set will lead to less rational behavior.
Journal of Business Management, 2015, No.9 ISSN 1691-5348
35
2. THEORETICAL FRAMEWORK 2.1 BEHAVIORAL ECONOMICS
The 1979 paper by Daniel Kahneman and Amos Tversky titled “ Prospect theory: An analysis of decision
making under risk”, published in most popular economic journal at the time - Econometrica, went on to
become the most cited paper in social sciences (Kahneman & Tversky, 1979). One could argue that
Kahneman and Tversky have provided the most important contributions to the growth of behavioral
economics – a scientific discipline that aims at improving economics explanatory and predictive power by
providing it with reliable psychological foundations (Camerer & Loewenstein, 2002), as a separate scientific
discipline. The main contribution of behavioral economics to mainstream classic (neoclassic) economics is
the provision of empirically tested understandings of individual behavior that deviates greatly from the
rational assumptions held by orthodox economics found in majority of economic textbooks. At the onset of
their careers Kahneman & Tversky were studying intuitive beliefs and choices and limited rationality and
their prime goal was to advance the field of decision making in psychology (Kahneman, 2003).
2.1.1 FRAMING AND PROSPECT THEORY
One of the central findings of Kahneman & Tversky is applied to the susceptibility of people to be
influenced by the way a situation or choice is presented. The authors equate the term “frame” with a
“reference point”, and in the function of that reference point, people change their preferences. According to
Kahneman and Tversky (1981), decision-making “frame” involves personal view of the possible options,
their outcomes, and the probability of linking options with their outcomes or consequences. The frame may
have external or internal source whereby it could be provided by formulation of a problem or it could arise
from personal characteristics such as beliefs, attitudes, or habits.
The focal point of Prospect theory is that gains and losses are perceived very differently, meaning, they
have different psychological value to an individual. The same amount of loss or gain does not have the same
absolute consequences in terms of value. Losses actually hurt more than do gains feel good. Thus, in the
prospect of loss, a person becomes loss averse. Further assumptions derived from the Prospect theory include
directions on how to frame certain financial outcomes, assumptions that later led Richar Thaler (1990, 1999)
to develop the theory of mental accounting.
2.1.2 MENTAL ACCOUNTING AND RELATED CATEGORIZATIONS
Kahneman & Tversky in their work also studied psychological accounting as a way of framing decisions.
Subsequently, Thaler (1999) classified it as mental accounting and defined it as a set of cognitive operations
used by individuals or households to organize, evaluate, and track their financial activities. Mental
accounting is based on the assumption that people make “irrational” economic decisions because of the way
they designed their schemes related to money and consumption. Mental accounting is a phenomenon, which
examines the existence and the use of “mental accounts” through a set of cognitive operations that
individuals use in order to organize, evaluate and monitor financial activities, specifically gains and losses
(Brendl et al., 1998). In this context, they use mental categories that serve to group expenses and transactions
associated with a particular event or option. The notion of mental accounting distorts the economic concept
of fungibility that assumes the absolute amount of money is equally perceived regardless of the form (e.g.
cheque, cash, or card) (Brendl et al., 1998; Thaler, 1999; Chatterjee & Rose, 2012; Chatterjee et al., 2000).
Fungibility assumes that individuals are equally inclined to spend money regardless of the form as long as
the absolute value of the form of money is equivalent. Due to different mental accounts, studies have shown
that consumption associated with each account is perceived differently i.e. it is common for the same amount
of money to have a different perceived value through different mental accounts.
Frisch (1993) distinguishes between several framing categories (situations): with different reference
points such as gain/loss, relative/absolute value, nominally different mental accounts (the theatre ticket
situation, later in the text) and the situation of irreversible costs as a separate framing category.
The method of hypothetical choices in the form of “imagine” is often referred to as the “thought
experiment” and it is assumed that the choices in that context are at least a reasonable approximation of
behavior that would happen in the “same” real context. Prospect theory by Kahneman and Tversky as well as
Thaler’s work on mental accounting is based on thought experiments. Angner and Loewenstein (2007)
commented that Thaler’s hypothetical situations are so real that they excuse themselves from criticism. In
most cases in the study of mental accounting, experimental designs comprised of hypothetical situations are
Journal of Business Management, 2015, No.9 ISSN 1691-5348
36
used. The most common form of such an experimental design involves a minimum of two experimental
groups that receive different manipulative instructions or are simply placed in two different framing
situations. Every situation has two variants where mental accounting is proved by a statistically significant
difference in the results between these two situations.
In the context of the elaboration of Prospect theory (Kahneman & Tversky, 1981) conducted a study in
the situation of going to the theatre. They examined the likelihood of purchasing a ticket in the situation
where there has been a loss of a previously purchased ticket as well as in the situation of previously lost sum
of money equivalent to the price of the ticket. In the former scenario, after losing the purchased ticket, only
46% of participants were willing to buy a new ticket. This is significantly less than the 88% of participants
who were willing to buy a ticket after losing $10 from their wallet. Mental or psychological accounting
demonstrates that the “account” in a situation of losing a ticket has significantly negative balance and
therefore influences the decision about not buying a new ticket. Buying new tickets in this scenario falls
within the scope of an existing account where the first ticket was already purchased. Losing money is more
abstract and it does not belong to any particular topical account thereby making it “easier” for people to give
the new $10 for a ticket (Brendl et al., 1998).
The literature on mental accounting also mentions sunk cost fallacy which refers to the tendency of
continuing efforts to an activity after investing money, time or effort (Arkes and Blumer, 1983). In the
context of social psychology it refers to justifying the effort that is closely related to the notion of cognitive
dissonance (Festinger, 1957). Sunk cost leads to further investment in projects and events despite new
adverse conditions that reduce the effectiveness of the project as well as the attractiveness of further pursuing
the same activity. Arkes and Blumer (1985) and Thaler (1980) suggest that another interesting example in
which investing into something leads to the sunk cost effect and commitment to a situation in which they
invest despite the adverse conditions. The authors are discussing the phenomenon of increased willingness of
going to a concert for which the tickets have been bought in times of adverse financial conditions, compared
to participants who received the same ticket. Participants were less likely to close the account in which they
have a negative balance (they paid for the ticket) with the loss and to a greater extent, decided to go for the
concert. Because money not spent on the ticket is still not part of any account, losing it did not result in any
negatively affected mental account. Money per se is quite abstract notion and is hard to be perceived in
absolute terms (Ariely, 2009).
When faced with a choice between purchasing a jacket ($125) and a pocket calculator ($15). In each
frame there is an offer with an additional saving option in the form of a 20 minute walk to a nearby store
where the same product costs $ 5 less ($120 jacket and $10 calculator). The results are indicating that the
participants would rather choose walking in the situation of buying the pocket calculator (Tversky &
Kahneman, 1981). The study showed that participants were again influenced by topical account. Greater
perceived saving in the case of a pocket calculator had a greater impact on the final decision whereby 68% of
the participants stated they would prefer to walk for a $5 saving in the case of a pocket calculator in contrast
to 29% for the identical saving in the case of jacket (Kahneman & Tversky, 1983). The example also shows
that people take into account the context and instead of absolute value, they perceive relative value of the
outcome. As a result, they value money less, which encourages higher expenditure and the value of a small
discount is decreased.
The effect of windfall gain is related to the house money fallacy. This fallacy is defined by different
categorization and a different propensity to spend the money an individual finds not his own but received by
prior gambling (Thaler & Johnoson, 1990, Milkman et al, 2009). In classical study conducted by Thaler &
Johnson (1990), participants were exposed to two situations: 1) possibility to gamble after receiving $30
where by further gambling there is a 50% chance to gain $9 and a 50% chance to lose $ 9, and 2) possibility
of gambling where there is a 50% chance of winning $ 39 and 50% chance of winning $ 21. Participants
were willing to gamble in the first situation (77% vs. 44%), which the authors called the two step
process since in the first step subject "gets money" and in the second step subject is presented with the
gamble "at once". As an explanation of this phenomenon Thaler & Johnson (1990) state that after winning,
gambling preference depends on the amount of potential loss. Small loss and higher income become
integrated, which reduces the impact of risk aversion and risk seeking increases. According to Thaler and
Johnson (1990), the second situation does not give the sense that participants were "ahead" of the potential
losses in that case the assumption which stands arises from Prospect theory - the loss potentiates risk seeking
According to Chatterjee et al. (2009), mental accounting is one of the most relevant theories of decision
making in the last 50 years. It is a rich and descriptive theory about the way humans make economic
decisions and the way schemes about money and spending are set up. If we perceive mental accounting as a
way of categorizing or grouping, it does not lead to suboptimal economic decisions but provides us with

Journal of Business Management, 2015, No.9 ISSN 1691-5348
37
facilitated approach to information relevant to our goal (Henderson and Peterson, 1992). In this context,
mental accounting rather facilitates than undermines reasoning aligned with the goals. Furthermore, mental
accounting can be a very useful strategy to organize knowledge. Given that we organize our knowledge in
the form of goals, mental categories are becoming goals that include relevant information related to
individual goals, their achievement, and reference points for comparison to external factors and contexts
(Brendl et al., 1998). Following the logic of mental accounting as way of self-regulation and taking into
account the goal of the study where we will try to connect two fields, which are dealing with mental
processes and behavioral regulation it is necessary to make an introduction to the theory of self-regulation.
2.2 THE THEORY OF ACTION PHASES
Gollwitzer and Bargh (1996) in their theory of action phases breaks down the process of self-regulation
on: 1) Predecision action phase, 2) Making a decision and preaction phase, 3) Action initiation and the action
phase and 4) Goal achievement and the post action phase. Mind-set is based on cognitive processes that
encourage task solving that is activated precisely with that mind-set. With regard to deliberative and
implemental mind set, mode of thinking refers to cognitive process related to the way a person chooses
between different options or how a person plans an action to reach desired goal. In the end, theory of action
phases has its anchor in numerous empirical studies, experimental as well as applied (e.g. HRM) (Gollwitzer
& Bargh, 1996; Heckhausen & Heckhausen, 2008).
In pre-decision phase, deliberative mind set is activated while in preaction and action phase volitional
implemental mind set is implied. In the last phase, we return to the motivational process, this time evaluative.
Pre-decision and post-action phase imply motivational, while pre-action and action phase imply volitional
process – the mere core of self-regulation process. Since motivational and volitional processes activate
different mind-sets, there is a strong distinction between mental account assigned to pre-decision deliberation
and mental account activated to forming intentions. Different cognitive orientations are adaptive inasmuch as
the context of decision making and available cognitive resources. When motivational process is activated, a
person is cognitively oriented to deliberation. Individual is thinking about his need and wants to choose the
ones which are desired and achievable. The focus is set on reasoning about positive and negative information
concerning the goals one is deliberating about. It is shown that experimental induction to deliberative mind
set leads to greater openness for information, objective evaluation of the options, cognitive priming to
information relevant for goal desirability and lesser susceptibility to self-serving (Gollwitzer et al, 1990,
Gollwitzer and Kinney, 1989, Armor and Taylor, 2003; Brandstaetter et al, 2001, Gollwitzer and Oettingen,
1998).
In a phase where a decision about the goal is reached, the individual is planning the action and is focused
on information supporting his goal. This includes committing to the favourable opportunities for action and
creating implementation intentions. Implemental mind set is characterized by focusing to goal achievement,
to questions such as “when”, “where” and “how” to initiate, attain and finish behaviors directed to achieving
the goal. Focusing himself to the implementations, individual creates positive illusions and heightens his
expectations related to the goal achievability (Taylor i Gollwitzer, 1995). By doing this, a person is assuring
itself with an active goal approach.
The key concept in the context of volitional process is making implementation intentions, which in
comparison to just deliberating about the goal, have greater influence on the volition toward reaching the
goal (Gollwitzer i Bargh, 1996). Implementation intentions are subordinated to goal intention and can be
found in the form of “If situation X happens, then I’ll do Y”. This form is relevant in the case that a problem
of volition in reaching the goal arises. In their classical study, Gollwitzer and Brandstatter (1997) were
looking at the degree in which two groups of students will fulfil their assignment on time. Participants were
induced to two different mind-sets and the task included writing a report about their holiday times. The
deadline was 48 hours. The research showed that two thirds of participants that planned details on how and
when to write the report really submitted the report due to the deadline. On the other hand, only one third of
participants who did not write their implementation intentions submitted the task on time.
Taking all into account, the main research question of this paper is to explore if there is a mental
accounting effect, or in other words, do the differently framed hypothetical situations elicit different
responses and if activating different mind-sets leads to greater susceptibility to mental accounting. We expect
that the framing effect exist to acknowledge the construct of mental accounts. Furthermore, we expect to find
that by inducing subjects to deliberative mind set will lead to less mental accounting. In the situation of
implemental mind set, subjects will be more susceptible to mental accounting since some frames of the
situations will be more compatible with their goal than this will be the case in the deliberative condition. The
Journal of Business Management, 2015, No.9 ISSN 1691-5348
38
goal about which our subjects will deliberate or plan action is saving. Activities that people are not at ease
with usually involve short-term costs and only long-term benefits and therefore require an intensive self-
regulation of behavior and commitment (Gollwitzer and Oettingen, 1998). Saving is just one of those
activities. It requires a high degree of self-control and commitment, and assumes that the behavior towards
people is neither inherent nor easily conducted (Laibson et al., 1998). If we manage to confirm the
assumption about the existence of mental accounting in relation to implemental mind set, it could mean that
mental accounting indeed serves as a way of self-regulating behavior. In this line of thought, these findings
could be helpful in creating policies that help direct people to certain economic goals that benefit their
financial well-being.
The main goal of this research is to verify the existence of mental accounting phenomena and their
relation to different self-regulatory mind-sets. Research objectives are:
1. To test the existence of mental accounting and related categorizations by using hypothetical decision
scenarios with different situation frames
2. To analyse whether susceptibility to mental accounting can be related to different self-regulatory mind-
sets induced by experimental manipulation
3. RESEARCH METHODOLOGY 3.1. RESEARCH DESIGN
Experimental research design consists of two independent measures. Independent variable refers to
different mind-sets and has two levels or conditions (IV):
1) Deliberative mind-set that is induced by using questionnaire instructions to deliberate about reasons
against and for the goal of saving (IV1)
2) Implemental mind set induced by using questionnaire instructions to make implemental intentions about
the goal of saving (IV2)
Dependent variable represents mental accounting scenarios measured by using hypothetical decision-
making situations, all of which are related to some kind of money transaction. To provide evidence for the
existence of mental accounting there need to be two versions of the situation, and consequently two
questionnaire versions. Two different versions of the situations differ in the frame of situation, meaning that
situations are economically equivalent but not in the sense of context they describe. The difference in
participants’ answers indicates that frames elicit different types of mental environment and thus different
judgment and response. Participants respond in the range from 0 to 100% of probability of required action.
Since there are two levels of independent variable and every situation requires two versions of the frame, we
used four versions of questionnaire. Therefore, we had four independent measures or groups.
3.2. SAMPLING
Research was conducted during 2013. Participants were selected using no probabilistic method. Main
criteria for the participant selection were permanent employment or retirement. This criteria is selected
because of the assumption that people who have experience with money also have more developed money
schemes, therefore, being more appropriate as participants in a research that analyses mental accounting.
Two hundred participants (N=200) participated in this research. Each experimental group consisted of
hundred participants (N=100). Age ranged from 21 to 80 years, with a mean of 34 (M=33,80, SD=9,46).
There were 57% of males and 43% of females. Majority of participants had some kind of college degree
(54%), about one third had master or doctoral degree (31%) while 15% had only high school degree.
Average personal income was 7776 kunas (equivalent of 1140 USD) per month. Participants mostly save
(72%)
3.3. PROCEDURE
To participants who agreed to take part in this research, the purpose of the research was explained with
the notion that their response to it was anonymous. Participants filled out the questionnaires individually and
delivered them sealed in provided envelopes. All participants were randomly assigned to the experimental
conditions. They had a chance to select the envelope they wanted. Duration for filling the questionnaire was
estimated to be 10 minutes.
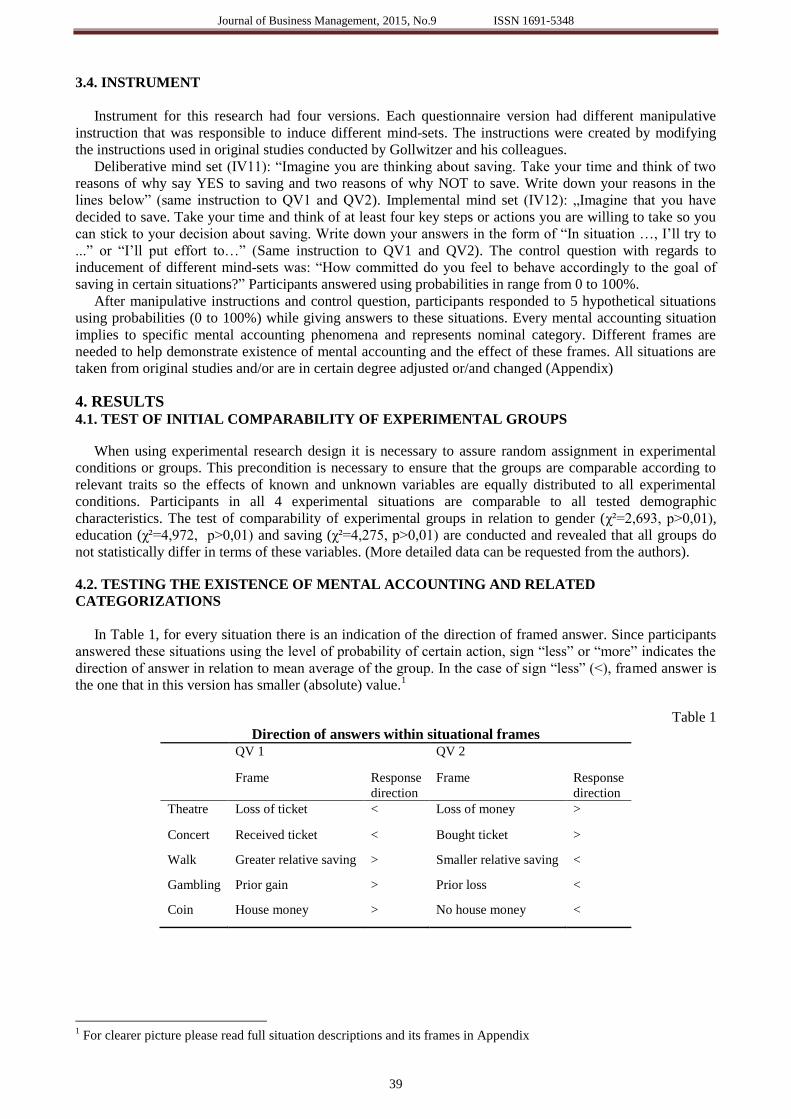
Journal of Business Management, 2015, No.9 ISSN 1691-5348
39
3.4. INSTRUMENT
Instrument for this research had four versions. Each questionnaire version had different manipulative
instruction that was responsible to induce different mind-sets. The instructions were created by modifying
the instructions used in original studies conducted by Gollwitzer and his colleagues.
Deliberative mind set (IV11): “Imagine you are thinking about saving. Take your time and think of two
reasons of why say YES to saving and two reasons of why NOT to save. Write down your reasons in the
lines below” (same instruction to QV1 and QV2). Implemental mind set (IV12): „Imagine that you have
decided to save. Take your time and think of at least four key steps or actions you are willing to take so you
can stick to your decision about saving. Write down your answers in the form of “In situation …, I’ll try to
...” or “I’ll put effort to…” (Same instruction to QV1 and QV2). The control question with regards to
inducement of different mind-sets was: “How committed do you feel to behave accordingly to the goal of
saving in certain situations?” Participants answered using probabilities in range from 0 to 100%.
After manipulative instructions and control question, participants responded to 5 hypothetical situations
using probabilities (0 to 100%) while giving answers to these situations. Every mental accounting situation
implies to specific mental accounting phenomena and represents nominal category. Different frames are
needed to help demonstrate existence of mental accounting and the effect of these frames. All situations are
taken from original studies and/or are in certain degree adjusted or/and changed (Appendix)
4. RESULTS 4.1. TEST OF INITIAL COMPARABILITY OF EXPERIMENTAL GROUPS
When using experimental research design it is necessary to assure random assignment in experimental
conditions or groups. This precondition is necessary to ensure that the groups are comparable according to
relevant traits so the effects of known and unknown variables are equally distributed to all experimental
conditions. Participants in all 4 experimental situations are comparable to all tested demographic
characteristics. The test of comparability of experimental groups in relation to gender (χ²=2,693, p>0,01),
education (χ²=4,972, p>0,01) and saving (χ²=4,275, p>0,01) are conducted and revealed that all groups do
not statistically differ in terms of these variables. (More detailed data can be requested from the authors).
4.2. TESTING THE EXISTENCE OF MENTAL ACCOUNTING AND RELATED
CATEGORIZATIONS
In Table 1, for every situation there is an indication of the direction of framed answer. Since participants
answered these situations using the level of probability of certain action, sign “less” or “more” indicates the
direction of answer in relation to mean average of the group. In the case of sign “less” (<), framed answer is
the one that in this version has smaller (absolute) value.1
Table 1
Direction of answers within situational frames
QV 1 QV 2
Frame Response
direction
Frame Response
direction
Theatre Loss of ticket < Loss of money >
Concert Received ticket < Bought ticket >
Walk Greater relative saving > Smaller relative saving <
Gambling Prior gain > Prior loss <
Coin House money > No house money <
1 For clearer picture please read full situation descriptions and its frames in Appendix
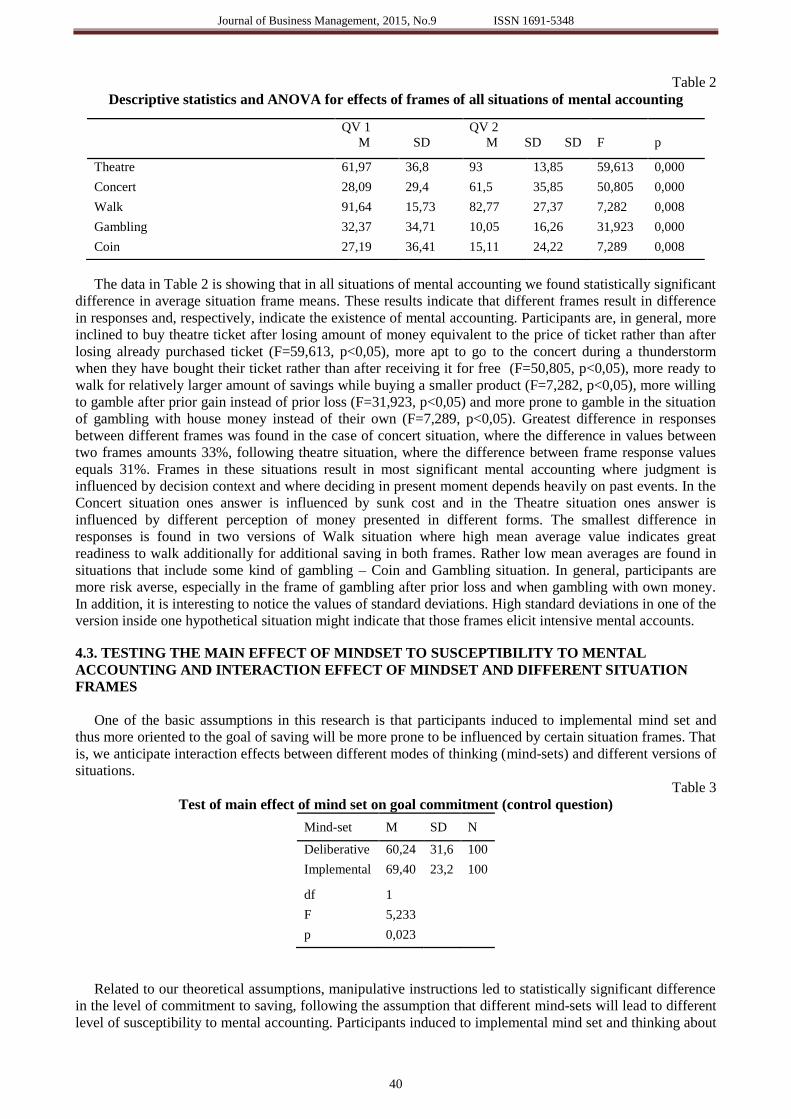
Journal of Business Management, 2015, No.9 ISSN 1691-5348
40
Table 2
Descriptive statistics and ANOVA for effects of frames of all situations of mental accounting
The data in Table 2 is showing that in all situations of mental accounting we found statistically significant
difference in average situation frame means. These results indicate that different frames result in difference
in responses and, respectively, indicate the existence of mental accounting. Participants are, in general, more
inclined to buy theatre ticket after losing amount of money equivalent to the price of ticket rather than after
losing already purchased ticket (F=59,613, p<0,05), more apt to go to the concert during a thunderstorm
when they have bought their ticket rather than after receiving it for free (F=50,805, p<0,05), more ready to
walk for relatively larger amount of savings while buying a smaller product (F=7,282, p<0,05), more willing
to gamble after prior gain instead of prior loss (F=31,923, p<0,05) and more prone to gamble in the situation
of gambling with house money instead of their own (F=7,289, p<0,05). Greatest difference in responses
between different frames was found in the case of concert situation, where the difference in values between
two frames amounts 33%, following theatre situation, where the difference between frame response values
equals 31%. Frames in these situations result in most significant mental accounting where judgment is
influenced by decision context and where deciding in present moment depends heavily on past events. In the
Concert situation ones answer is influenced by sunk cost and in the Theatre situation ones answer is
influenced by different perception of money presented in different forms. The smallest difference in
responses is found in two versions of Walk situation where high mean average value indicates great
readiness to walk additionally for additional saving in both frames. Rather low mean averages are found in
situations that include some kind of gambling – Coin and Gambling situation. In general, participants are
more risk averse, especially in the frame of gambling after prior loss and when gambling with own money.
In addition, it is interesting to notice the values of standard deviations. High standard deviations in one of the
version inside one hypothetical situation might indicate that those frames elicit intensive mental accounts.
4.3. TESTING THE MAIN EFFECT OF MINDSET TO SUSCEPTIBILITY TO MENTAL
ACCOUNTING AND INTERACTION EFFECT OF MINDSET AND DIFFERENT SITUATION
FRAMES
One of the basic assumptions in this research is that participants induced to implemental mind set and
thus more oriented to the goal of saving will be more prone to be influenced by certain situation frames. That
is, we anticipate interaction effects between different modes of thinking (mind-sets) and different versions of
situations.
Table 3
Test of main effect of mind set on goal commitment (control question)
Mind-set M SD N
Deliberative 60,24 31,6 100
Implemental 69,40 23,2 100
df 1
F 5,233
p 0,023
Related to our theoretical assumptions, manipulative instructions led to statistically significant difference
in the level of commitment to saving, following the assumption that different mind-sets will lead to different
level of susceptibility to mental accounting. Participants induced to implemental mind set and thinking about
QV 1
M SD
QV 2
M SD SD
F
p
Theatre 61,97 36,8 93 13,85 59,613 0,000
Concert 28,09 29,4 61,5 35,85 50,805 0,000
Walk 91,64 15,73 82,77 27,37 7,282 0,008
Gambling 32,37 34,71 10,05 16,26 31,923 0,000
Coin 27,19 36,41 15,11 24,22 7,289 0,008
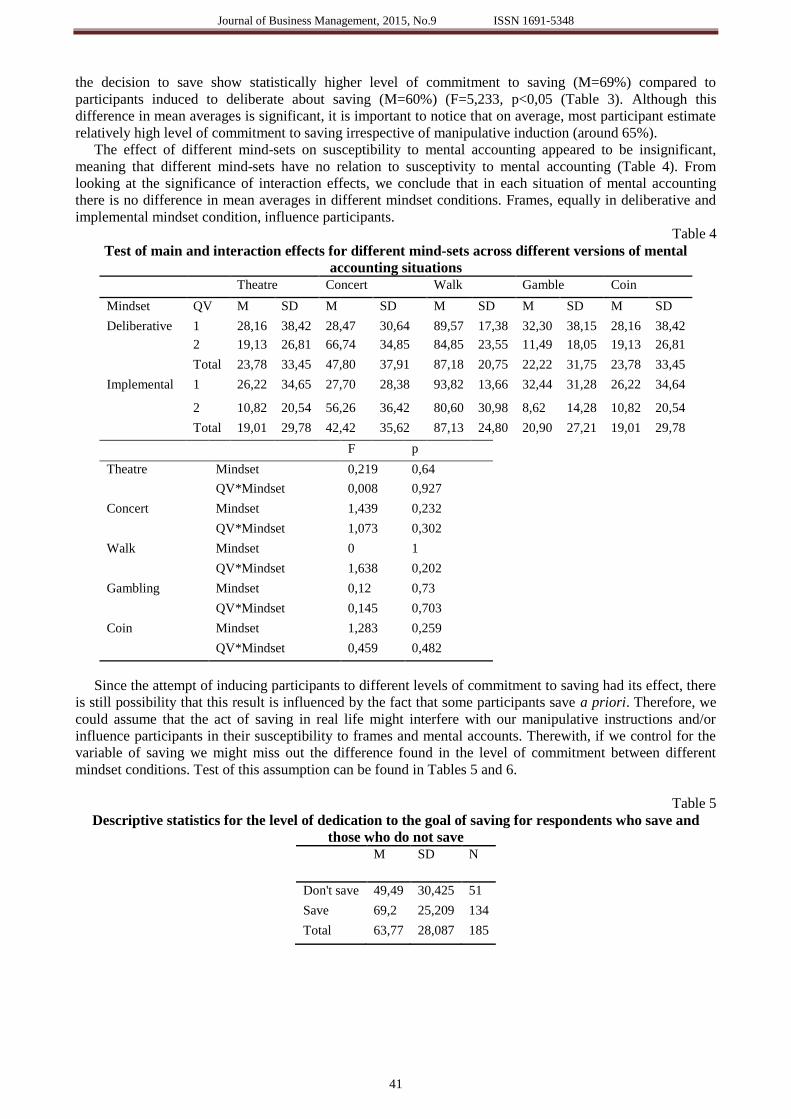
Journal of Business Management, 2015, No.9 ISSN 1691-5348
41
the decision to save show statistically higher level of commitment to saving (M=69%) compared to
participants induced to deliberate about saving (M=60%) (F=5,233, p<0,05 (Table 3). Although this
difference in mean averages is significant, it is important to notice that on average, most participant estimate
relatively high level of commitment to saving irrespective of manipulative induction (around 65%).
The effect of different mind-sets on susceptibility to mental accounting appeared to be insignificant,
meaning that different mind-sets have no relation to susceptivity to mental accounting (Table 4). From
looking at the significance of interaction effects, we conclude that in each situation of mental accounting
there is no difference in mean averages in different mindset conditions. Frames, equally in deliberative and
implemental mindset condition, influence participants.
Table 4
Test of main and interaction effects for different mind-sets across different versions of mental
accounting situations
Theatre Concert Walk Gamble Coin
Mindset QV M SD M SD M SD M SD M SD
Deliberative 1 28,16 38,42 28,47 30,64 89,57 17,38 32,30 38,15 28,16 38,42
2 19,13 26,81 66,74 34,85 84,85 23,55 11,49 18,05 19,13 26,81
Total 23,78 33,45 47,80 37,91 87,18 20,75 22,22 31,75 23,78 33,45
Implemental 1 26,22 34,65 27,70 28,38 93,82 13,66 32,44 31,28 26,22 34,64
2 10,82 20,54 56,26 36,42 80,60 30,98 8,62 14,28 10,82 20,54
Total 19,01 29,78 42,42 35,62 87,13 24,80 20,90 27,21 19,01 29,78
F p
Theatre Mindset 0,219 0,64
QV*Mindset 0,008 0,927
Concert Mindset 1,439 0,232
QV*Mindset 1,073 0,302
Walk Mindset 0 1
QV*Mindset 1,638 0,202
Gambling Mindset 0,12 0,73
QV*Mindset 0,145 0,703
Coin Mindset 1,283 0,259
QV*Mindset 0,459 0,482
Since the attempt of inducing participants to different levels of commitment to saving had its effect, there
is still possibility that this result is influenced by the fact that some participants save a priori. Therefore, we
could assume that the act of saving in real life might interfere with our manipulative instructions and/or
influence participants in their susceptibility to frames and mental accounts. Therewith, if we control for the
variable of saving we might miss out the difference found in the level of commitment between different
mindset conditions. Test of this assumption can be found in Tables 5 and 6.
Table 5
Descriptive statistics for the level of dedication to the goal of saving for respondents who save and
those who do not save
M SD N
Don't save 49,49 30,425 51
Save 69,2 25,209 134
Total 63,77 28,087 185
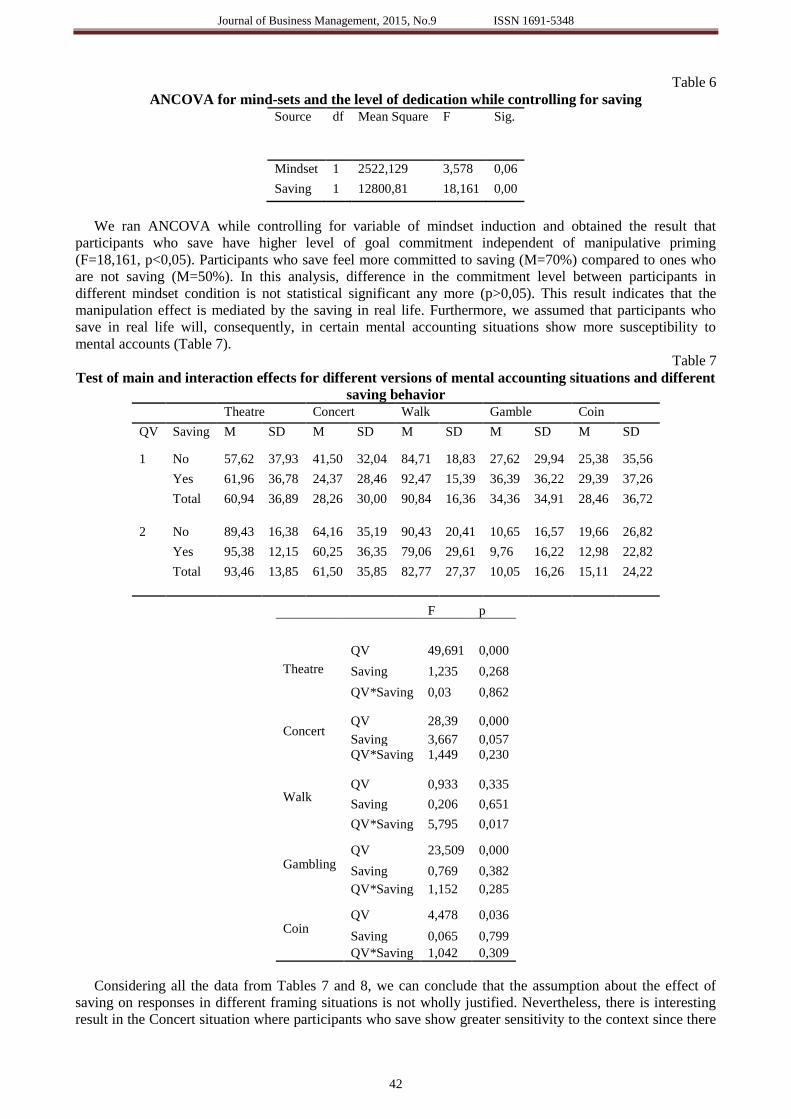
Journal of Business Management, 2015, No.9 ISSN 1691-5348
42
Table 6
ANCOVA for mind-sets and the level of dedication while controlling for saving
Source df Mean Square F Sig.
Mindset 1 2522,129 3,578 0,06
Saving 1 12800,81 18,161 0,00
We ran ANCOVA while controlling for variable of mindset induction and obtained the result that
participants who save have higher level of goal commitment independent of manipulative priming
(F=18,161, p<0,05). Participants who save feel more committed to saving (M=70%) compared to ones who
are not saving (M=50%). In this analysis, difference in the commitment level between participants in
different mindset condition is not statistical significant any more (p>0,05). This result indicates that the
manipulation effect is mediated by the saving in real life. Furthermore, we assumed that participants who
save in real life will, consequently, in certain mental accounting situations show more susceptibility to
mental accounts (Table 7).
Table 7
Test of main and interaction effects for different versions of mental accounting situations and different
saving behavior
Theatre Concert Walk Gamble Coin
QV Saving M SD M SD M SD M SD M SD
1 No 57,62 37,93 41,50 32,04 84,71 18,83 27,62 29,94 25,38 35,56
Yes 61,96 36,78 24,37 28,46 92,47 15,39 36,39 36,22 29,39 37,26
Total 60,94 36,89 28,26 30,00 90,84 16,36 34,36 34,91 28,46 36,72
2 No 89,43 16,38 64,16 35,19 90,43 20,41 10,65 16,57 19,66 26,82
Yes 95,38 12,15 60,25 36,35 79,06 29,61 9,76 16,22 12,98 22,82
Total 93,46 13,85 61,50 35,85 82,77 27,37 10,05 16,26 15,11 24,22
F p
Theatre
QV 49,691 0,000
Saving 1,235 0,268
QV*Saving 0,03 0,862
Concert QV 28,39 0,000
Saving 3,667 0,057
QV*Saving 1,449 0,230
Walk QV 0,933 0,335
Saving 0,206 0,651
QV*Saving 5,795 0,017
Gambling QV 23,509 0,000
Saving 0,769 0,382
QV*Saving 1,152 0,285
Coin QV 4,478 0,036
Saving 0,065 0,799
QV*Saving 1,042 0,309
Considering all the data from Tables 7 and 8, we can conclude that the assumption about the effect of
saving on responses in different framing situations is not wholly justified. Nevertheless, there is interesting
result in the Concert situation where participants who save show greater sensitivity to the context since there
Journal of Business Management, 2015, No.9 ISSN 1691-5348
43
is an average of 24% probability of going to concert after buying the ticket and an average of 60%
probability of going to concert in the frame of receiving the ticket. In the case of participants who don’t save,
we found that, on average, there is 42% probability of going to concert in the former condition and average
of 64% of probability of going to concert in the later condition (F=3,667, p<0,06). In addition, a difference in
susceptiveness to context is significantly greater for participants who save when it comes to version of Walk
situation. We found significant interaction effect between saving and frames of this situation (F=5,795,
p<0,05). Participants who save are more prone to walking for additional discount when it is perceived as
larger relative to original price (M=36%) compared to participants who don’t save (M=28%). This difference
is not found in the other frame of this situation where the amount saved after walking is the same but its
relative share in original price is smaller (M=10% vs. M=11%). In the rest of the situation frames we found
no significant results.
5. DISCUSSION AND CONCLUSIONS
In the first analysis, we have focused on answering to our first research goal - the test of mental
accounting and related categorizations. Hereby, we have tested the effect of frames used in each hypothetical
situation. Since there was a statistically significant framing effect in every pair of situation versions, different
frames elicited the existence of mental accounting, which has proved to be a quite robust and constant
phenomenon. Theatre situation (that is referred to as reference point situation) resulted in strongest framing
effect. The other scenarios, reflecting the phenomena of the house money effect, sunk cost fallacy and loss
aversion, were proven to exist since the framing effect resulted in statistically significant differences in
participants' responses. By providing different answers to the frames, we can hypothesize that frames
activated different mental contexts, influencing, thus, the direction of participants' responses. Within every
mental accounting situation used in this research, we have a frame that elicits strong mental frame or context.
From looking at the mean averages, we can notice that participants show indicative level of loss aversion and
“spending” aversion. More disruptive frames include lost theatre ticket, bought concert ticket, walking for
higher relative saving, gambling after prior loss and tossing a coin while not using house money. Situations
that have economically equivalent values from the economic standpoint are assumed to elicit responses
independent of the frames and context of a certain economic problem. These rational assumptions deviate
greatly from the real life behavior of economic agents.
Concerning our second research goal, the test of the main effects of different mindset effect resulted in
the absence of any significant result, suggesting that either directing participants think openly or more
economically focused does not result in different susceptibility to mental accounting. Nevertheless, dividing
participants to the ones who save and the ones that don’t and looking at their sensitivity to mental
accounting, we found some interesting data that slightly lead to a premise that saving could be related to
certain uses of mental accounting. This result indicates that our manipulative instruction interacted with the
saving that participants encounter in their real life. The statistically significant effectiveness of manipulative
instruction has led to a greater sense of commitment to saving in the condition of implemental mindset
compared to the level of commitment in the deliberative mindset condition. This result went above the range
of acceptable significance level when we controlled for the variable of saving. There is a moderately high
level of commitment to saving among all the participants, which can be discussed in the light of current
economic situation in Croatia where people save more than before economic crisis. Our manipulative
instructions only contributed slightly to already present commitment to saving. Because we found that in
some situations participants more focused to save are more sensitive to mental accounting, we could argue
that mental accounting can be seen as a self-regulatory strategy. Saving, in an economic context, is rational
behavior since its purpose is to assure a better quality of life in the future. Therefore, the right question about
the state of mental accounting is not whether it is rational or not, but whether it is useful or not. From that
perspective, mental accounting is very reasonable to use if one wants to protect its goals.
In this research, we confirmed numerous violations of rational decision theory that assumes consistency
of preferences independent of the way situation is presented. It seems that only one word can influence
mental context and lead to different perception of situation and consequently different response. This result
is in line with all the research that accentuates the contextuality of people's decision-making process.
Accepting the fact that people do not make decisions in vacuum but in the real-life and very subjective
context means that by creating this decision context we can influence the direction of decisions. Applications
of this finding show great potential in the arena of public policy. For example, if we make salient the
information about saving to people or remind them of their own saving, we could direct them to make
choices that are more rational. Choice architecture that takes into account effects of situational framing can
Journal of Business Management, 2015, No.9 ISSN 1691-5348
44
be the tool to "push" people into making decisions that serve in their better interest. Moreover, the finding
that instructing people to make implementation intentions to save actually made them feel more committed
to saving, could also serve as a great tool to motivate people to be more aligned with the behavior that leads
to their goals. The main problem with goal accomplishment is the lack of intentions and actual steps of
actions that help achieve the set goals. There is a need to design real-life experimental research that tests
these assumptions. One major contribution of this research is its greater real-life validity and experimental
design used on people who earn and save their own money. Majority of the research done in the field of
decision-making is conducted mostly on students.
Methodological limitations of this research are several. Firstly, making hypothetical implementation
intentions is not as strong as making them in real life. Although there is stronger correlation between
intention and behavior rather than between attitude and behavior, we still hold on to situations that are only
present in mental context. The reason we did not confirmed the main effect of different mind-sets on mental
accounting could be assigned to this methodological remark. Likewise, the measure of response might also
affect the end results since we used the level of intention expressed in percentages. In most of original
studies, authors used categorical responses like “yes” and “no”. We decided to use the scale so we could
perform parametric statistics. The way a question is asked can also lead to different answers. In the future, it
is advisable to expand the analysis to individual characteristics like personality, cognitive style and similar.
In addition, it is commendable to use situations that are more hypothetical or categorize them and develop
more situations that represent one type of mental accounting. It would be interesting, also, to develop
instrument to measure susceptibility to mental accounting.
REFERENCES
1. Angner, E., & Loewenstein, G. (2007), "Behavioral Economics", In: D. Gabbay, P. Thagard & J. Woods (Ed.),
Handbook of the philosophy of science (641-690). Amsterdam: Elsevier.
2. Ariely, D. (2009), Predictably Irrational: The Hidden Forces That Shape Our Decisions, London: Harper.
3. Arkes, H., & Blumer, C. (1985), "The Psychology of Sunk Cost", Organizational Behavior and Human Decision
Process, 35, 124–140.
4. Arkes, H. R., Joyner, C. A., & Pezzo, M. V. (1994), "The psychology of windfall gains", Organizational behavior
and human decision making processes, 59, 331–347.
5. Armor, D. A., & Taylor, S. E. (2003), "The effects of mindset on behavior: Self-regulation in deliberative and
implemental frames of mind", Personality and social psychology bulletin, 29, 86-95.
6. Baron, J. (2004), "Normative models of judgment and decision making", In: D. J. Koehler & N. Harvey (Ed.),
Blackwell handbook of judgment and decision making (19-36), London: Blackwell.
7. Brandstaetter, V., Lengfelder, A., & Gollwitzer, P. M. (2001), "Implementation intentions and efficient action
initiation", Journal of personality and social psychology, 81, 946-960.
8. Brendl, C. M., Markman, A., & Higgins, T. E. (1998), "Mental accounting as self-regulation: Representativeness to
goal-derived categories", Sonderheft Konsumentenpsychologie, 29, 89-104.
9. Camerer, C. & Loewenstein, G. (2004), "Behavioral economics: Past, present and future" in Camerer, C.,
Loewenstein, G. and Rabin, M. (Ed.). Advances in behavioral economics, Princeton: Princeton University Press.
10. Chatterjee, P., & Rose, R. L. (2012), "Do Payment Mechanisms Change the Way Consumers Perceive Products?
Journal of consumer research", 38, 1129-1139.
11. Chatterjee, S, Heath, T. B., Milberg, S. J., & France, K. R. (2000), "The differential processing of prices in gains
and losses: the effects of frame and need for cognition", Journal of behavioral decision making, 13, 61-75.
12. Chatterjee, S., Heath, T., & Min, J. (2009), "The Susceptibility of Mental Accounting Principles to Evaluation Mode
Effects", Journal of behavioral decision making, 22, 120-137.
13. Festinger, L. (1957), A theory of cognitive dissonance, Evanston: Row & Peterson.
14. Fiske, S. T. (2004), Social beings: A core motives approach to social psychology, New York: Wiley
15. Frisch, D. (1993), "Reasons for framing effects", Organizational behavior and human decision processes, 54, 399-
429.
16. Gigerenzer, G. (2005), "I think , therefore & err", Social Research, 72 (1), 1-24.
17. Gigerenzer, G. (2008), Gut feelings, Zagreb: Algoritam.
18. Gilboa, I. (2009), Rational choice, Cambridge: MIT Press.
19. Gilboa, I. (2010), "Questions in Decision Theory", Annual Review of Economics, 2 (1), 1-19.
20. Gilboa, I., Postlewaite, A., & Schmeidler, D. (2009), "Is It Always Rational to Satisfy Savage’s
Axioms?" Economics and Philosophy, 25, 285-296.
21. Gollwitzer, P. M. (1990), "Action phases and mind-sets", In: E. T. Higgins & R. M. Sorrentino (Ed.), The handbook
of motivation and cognition: Foundations of social behavior, 2 (53-92), New York: Guilford Press.
22. Gollwitzer, P. M., & Bargh, J. A. (1996), The psychology of action: Linking cognition and motivation to behavior,
New York: Guilford Press.
23. Gollwitzer, P. M., & Brandstatter, V. (1997), "Implementation intentions and effective goal pursuit", Journal of
personality and social psychology, 73 (1), 186-199.
Journal of Business Management, 2015, No.9 ISSN 1691-5348
45
24. Gollwitzer, P. M., & Kinney, R. F. (1989), "Effects of deliberative and implemental mind-sets on the illusion of
control", Journal of personality and social psychology, 56, 531-542.
25. Gollwitzer, P. M., & Oettingen, G. (1998), "The emergence and implementation of health goals", Psychology &
Health, 13, 687-715.
26. Gollwitzer, P. M., Heckhausen, H., & Steller, B. (1990), "Deliberative vs. implemental mind-sets: Cognitive tuning
toward congruous thoughts and information", Journal of personality and social psychology, 59, 1119-1127.
27. Harvey, J. T., & Garnett, R. F. Jr. (2008), Future directions for heterodox economists, Michigan: The University of
Michigan Press.
28. Hastie, R., & Dawes, R. M. (2001), Rational Choice in an Uncertain World: The Psychology of Judgment and
Decision Making, Thousand Oaks: Sage Publications.
29. Heath, C., & Soll, J. B. (1996), "Mental budgeting and consumer decisions", Journal of consumer research, 23, 40–
52.
30. Heckhausen, J., & Heckhausen, H. (2008), Motivation and action, Cambridge: Cambridge University Press.
31. Henderson, P. W., & Peterson, R. A. (1992), "Mental Accounting and Categorization", Organizational Behavior
and Human Decision Processes, 51, 92-117.
32. Kahneman, D. (2000), "A psychological point of view: Violations of rational rules as a diagnostic of mental
processes", Behavioral and Brain Sciences, 23 ,681 –683.
33. Kahneman, D. (2003), "Maps of Bounded Rationality: Psychology for Behavioral Economics", American Economic
Review, 93 (5), 1449-1475.
34. Kahneman, D. & Frederick, S. (2005), "A model of heuristic judgment", In: K. J. Holyoak & R. G. Morrison
(Ed.), The Cambridge handbook of thinking and reasoning (267-293). New York: Cambridge University Press.
35. Kahneman, D., & Tversky, A. (1972), "Subjective probability: A judgment of representativeness", Cognitive
Psychology, 3 (3), 430–454.
36. Kahneman, D., & Tversky, A. (1974), "Judgement under uncertainty: Heuristics and biases", Science, 185, 1124-
1131.
37. Kahneman, D. & Tversky, A. (1979), "Prospect theory: An analysis of decisions under risk", Econometrica, 47 (2),
263–291.
38. Kahneman, D., & Tversky, A. (1984), "Choices, values and frames", American Psychologist 39 (4), 341–350.
39. Kahneman, D., & Tversky, A. (2000), Choices, values and frames, New York: Cambridge University.
40. Kahneman, D., Slovic, P., & Tversky, A. (1982), Judgment under Uncertainty: Heuristics and Biases, Cambridge:
Cambridge University Press.
41. Klein, P. A. (2006), Economics confront the economy, Cheltenham: Edward Elgar Publishing Limited.
42. Kunda, Z. (2002), Social cognition: making sense of people, London: The MIT Press.
43. Milkman, K. L. Beshears, J., Rogers, T. & Bazerman, M. H. (2009), "Mental Accounting and Small Windfalls:
Evidence from an Online Grocer" (Working paper). Harvard Business School. Available at:
http://hbswk.hbs.edu/item/5792.html (accesed: 20 February 2015).
44. Miller, G. A. (2003). "The cognitive revolution: A historical perspective", Trends in cognitive sciences, 7, 141-144.
45. Moskowitz, G. B. (2005), Social cognition, New York: Guilford Press.
46. Prelec, D., & Loewenstein, G. (1998), "The Red and the Black: Mental Accounting of Savings and Debt",
Marketing Science, 17, 4–28.
47. Samson, A., & and Voyer, B. G. (2012), "Two minds, three ways: dual system and dual process models in
consumer psychology", AMS review, 2 (2-4), 48-71.
48. Savage, L. J. (1954), The Foundations of Statistics, New York: John Wiley.
49. Stanovich, K. (1999), Who Is Rational: Studies of Individual Differences in Reasoning. Mahwah: Lawrence
Erlbaum Associates, Inc.
50. Stanovich, K. E. (2011), Rationality and the reflective mind, New York: Oxford University Press.
51. Stanovich, K. E., & West, R. F. (2000), "Individual differences in reasoning: Implications for the rationality
debate", Behavioral & Brain Sciences, 23, 645-665.
52. Stanovich, K. E., & West, R. F. (2002), "Individual differences in reasoning: Implications for the rationality
debate?," In: T. Gilovich, D. Griffin, D. Kahneman (Ed.), Heuristics and Biases, the Psychology on Intuitive
Judgment (421-440), Cambridge: Cambridge University Press.
53. Stanovich, K. E., & West, R. F. (2003), "Evolutionary versus instrumental goals: How evolutionary psychology
misconceives human rationality", In: D. E. Over (Ed.), Evolution and the psychology of thinking: The debate (171-
230). Hove (England): Psychology Press.
54. Stanovich, K. E., & West, R. F. (1999), "Discrepancies between normative and descriptive models of decision
making and the understanding/acceptance principle", Cognitive psychology, 38, 349-385.
55. Sternberg, R. (2004), Cognitive psychology, Jastrebarsko: Naklada Slap.
56. Taylor, S. E., & Gollwitzer, P. M. (1995), "Effects of mindset on positive illusions", Journal of Personality and
Social Psychology, 69, 213-226.
57. Thaler, R. H. (1980), "Towards a positive theory of consumer choice", Journal of Economic Behavior and
Organization, 1, 39-60.
58. Thaler, R. H. (1999), "Mental accounting matters", Journal of Behavioral Decision Making, 12, 183-206.

Journal of Business Management, 2015, No.9 ISSN 1691-5348
46
59. Thaler, R. H., & Johnson, E. J. (1990), "Gambling with the House Money and Trying to Break Even: The Effects of
Prior Outcomes on Risky Choice" Management Science, 36 (6), 643-660.
60. Tversky, A., & Kahneman, D. (1974), "Judgment under uncertainty: Heuristics and biases", Science, 185 (4157),
1124–1131.
61. Tversky, A., & Kahneman, D. (1981), "The framing of decisions and the psychology of
choice" Science, 211 (4481), 453–458.
62. Tversky, A., & Kahneman, D. (1973), "Availability: A heuristic for judging frequency and probability", Cognitive
Psychology, 5 (2). 207–232.
63. Tversky, A., & Kahneman, D. (1983), "Extensional versus Intuitive Reasoning: The Conjunction Fallacy in
Probability Judgment", Psychological Review, 90, 293-315.
64. Tversky, A., & Kahneman, D. (1986), "Rational Choice and the Framing of Decisions", The Journal of Business, 59
(4), 251-278.
65. Von Neumann, J., & Morgenstern, O. (1953), Theory of Games and Economic Behaviour, Princeton: Princeton
University Press.
Journal of Business Management, 2015, No.9 ISSN 1691-5348
47
PROFESSIONAL BURNOUT OF SPECIAL EDUCATION TEACHERS IN
LATVIA
Maija Zakrizevska
Riga International School of Economics and Business Administration, Meza 3, Riga, Latvia,
e-mail: [email protected]
ABSTRACT
Professional burnout has been a popular research subject among teachers over the last few years. However, there are not
many research studies involving teachers of special education there. The results of the study conducted by the European
Trade Union Committee for Education show that the teachers surveyed in Latvia are on the verge of burnout (49%)
(Moncada, Llorens, 2013). The aim of the study is to research the levels of professional burnout and the differences in
special education teachers whose length of employment in education is 10 and 25 years.
The Maslach Burnout Inventory (Maslach, Jackson, 1986) was used to study professional burnout. The study sample
consisted of 106 special education teachers. The results of the study do not confirm the hypothesis that there are
statistically significant differences in the levels of professional burnout between special education teachers whose
length of employment in education is 10 years and those whose length of employment in education is 25 years. The
results of the study reveal that teachers have high and medium levels of emotional exhaustion.
Keywords: Professional burnout, special education teachers, Maslach Burnout Inventory.
1.INTRODUCTION
Representatives of the Education and Science Trade Union of Latvia acknowledge that the profession of a
teacher is associated with burnout, and the resulting loss of capacity for work cannot be restored by
introducing new technologies because the specific nature of the job, i.e., the direct contact with children,
cannot be excluded. The effects of various factors cause physiological and psychoemotional changes in the
body and lead to loss of the professional skills in such teachers (Grigorjevs, 2014).
Evidence has been obtained in earlier studies that that working in education involves continuous periods
of tension and may lead to professional burnout (Antoniou et al., 2013). Environmental diversity, a wide
spectrum of communication, emotional and physical loads involved in working with pupils of various ages
and levels of development and their parents, and handling complex situations are just a few of the factors
which are topical for this profession. Even though the profession of teacher is highly regulated and
supervised from the outside, it is not highly appreciated in terms of the salary and respect (Hargreaves et al.,
2007; Muller et al., 2007). The research studies conducted by the Organisation for Economic Co-operation
and Development also show that most of the countries have very limited possibilities for due appreciation
and remuneration of the teachers' job (OECD, 2005).
In their daily job in a classroom, special education teachers meet children who have explicitly different
special features of the nervous system function, have attention deficit disorders, hyperactivity, emotional
disorders, development disorders, etc. The mission of the special education teacher in the school is to
understand the weaknesses of every child, identify their individual strengths, and, accordingly, provide the
necessary support and evaluate the performance of the child. Individual approaches in education create
favourable conditions for all-round development of each child and acquisition of knowledge and skills
(Tomlinson, 2012).
In summary, one can conclude that special education teachers are exposed to various occupational risks,
such as environmental diversity, emotional and physical loads involved in working with pupils of different
ages and levels of development and their parents, dealing with complex situations, finding individual
approaches to each individual, and limited possibilities for due appreciation and remuneration of such
teachers, which are all suggestive of potential professional burnout in this profession.
The aim of the study is to research the levels of professional burnout and the differences in special
education teachers whose length of employment in education is 10 and 25 years.
The following hypothesis was proposed: There are statistically significant differences in the levels of
professional burnout between special education teachers whose length of employment in education is 10
years and those whose length of employment in education is 25 years.
The study was conducted in three special schools in Riga where 187 special education teachers were
employed in the academic year 2012/2013, of which 24 either left their jobs themselves or were dismissed
during the year. This indicator of 13% of the total number of employees served as a determinant factor to
support the significance of the research study.

Journal of Business Management, 2015, No.9 ISSN 1691-5348
48
2.THE JOB OF A SPECIAL EDUCATION TEACHER AS A PROFESSIONAL BURNOUT
FACTOR
After H. Freudenberger first used the term 'burnout' to describe the state of chronic emotional exhaustion,
this phenomenon has become the subject of many subsequent studies (Kraft, 2007). Later on, K. Maslach et
al. conducted a study into on-job professional burnout among employees and described this phenomenon as a
syndrome of emotional exhaustion, depersonalisation, and reduction of personal accomplishment, which may
occur in individuals working with people (Maslach, Jackson, 1997). For a teacher to become a professional
in their field, they must work in the sector of education for 5-7 years in order to acquire the necessary skills.
K. Maslach emphasises that the first symptoms of professional burnout appear specifically in this period
(Maslach, 1998).
Based on the discoveries made by scientists that professional burnout has already been observed in
various jobs associated with providing assistance to other people and communication between people, one
can identify certain risk groups exposed to the risk of burnout. These include doctors, medical nurses, social
workers, pharmacists, psychologists, teachers (Koustelios, 2003; Koustelios, Tsigilis, 2005; Tsigilis et al.
2004) etc., people working in shifts; people whose job involves high degrees of responsibility, but low levels
of moral and material appreciation as well as authority (Ancane, 2004).
Very many research studies have been conducted particularly among teachers. For instance, there has
been a study involving teachers who have just started their careers and ones whose experience exceeds six
years (Goddard et al., 2006), several research studies have been carried out into differences in professional
burnout in lower and upper secondary schools (Yavuz, 2009; Tsigilis et al., 2011; Antoniou et al, 2013).
These studies do not reveal any statistically significant differences between professional burnout in teachers
working in lower or upper secondary schools, but they reveal statistically significant differences between
male and female teachers (Yavuz, 2009). Other studies show no statistically significant correlations between
professional burnout, stress, and job satisfaction (Reddy, 2007). It was discovered during the studies that
workloads and shortage of time are among the most significant factors which affect teachers (Tsiakkiros,
Piasiardis, 2002). Results were obtained to claim that the causes of emotional exhaustion include excessive
workloads of teachers and disruptive behaviours of pupils (Fernet et al., 2012). Burnout is also associated
with demographic properties of pupils, such as age, gender, form level, family status, and cultural context
(Schwab, et al., 1986). Several studies suggest that the working environment plays a significant role in the
burnout of teachers (Friedman, 2000; Goddard, et al., 2006). A. Friedman (2000) writes about the causes of
burnout that teachers have a “reality shock”. It is a phenomenon which involves inability of teachers to
provide the necessary knowledge to their pupils on the one hand and pupil discipline problems and
behavioural disorders in the classroom on the other hand.
Research studies have also been conducted specifically among special education teachers, for example, in
the United States where differences in burnout have been studied between teachers of regular educational
institutions and teachers working at special educational institutions. The results of the study showed higher
burnout rates for teachers working in regular schools. No statistically significant differences were found with
regard to job satisfaction among regular and special education teachers. A weak correlation was found
between job satisfaction and burnout in both study samples (Roach, 2009).
Professional burnout develops in employees gradually and discreetly over several years (Montgomery,
Rupp, 2005). Burnout is a process which involves 3 dimensions: emotional exhaustion, depersonalisation,
and reduction of personal accomplishment (Maslach, 1998).
These three dimensions of professional burnout often overlap and appear to be the cause and consequence
of each other, and this is what was researched within this study conducted among the teachers of the three
special schools in Latvia.
3.RESEARCH METHODOLOGY AND SAMPLE
According to the information published on the website of Riga City Council Department of Education,
Culture, and Sports, there are 12 special schools in Riga (List of special educational schools: http://dati.e-
skola.lv/Katalogs/RigaSkolaSVSpec). The study was conducted in three special schools of Riga with 187
special education teachers in the academic year 2012/2013. 187 questionnaires were distributed in these
schools in total, and 149 questionnaires were received back. The questionnaires were distributed among the
respondents in paper format. 106 questionnaires were fully completed and valid for processing, 62 (58%) of
them were received from teachers whose length of employment is 25 years, and 44 (42%) were received
from teachers whose length of employment is at least 10 years.
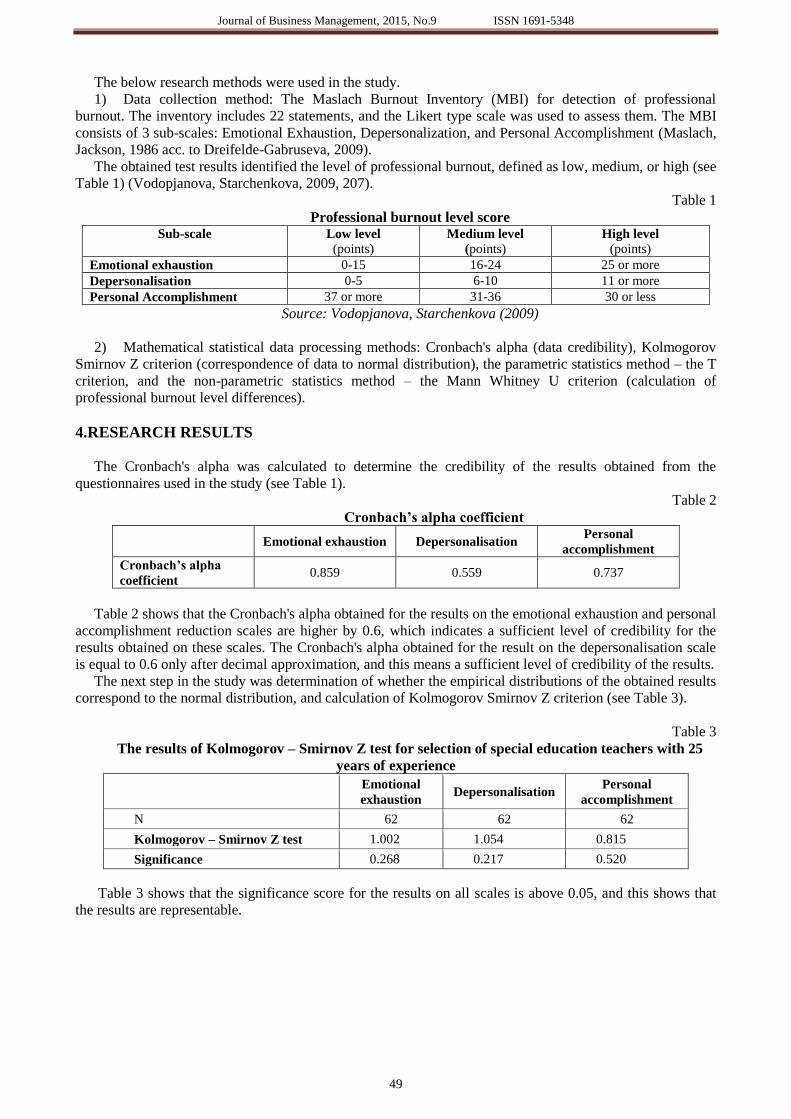
Journal of Business Management, 2015, No.9 ISSN 1691-5348
49
The below research methods were used in the study.
1) Data collection method: The Maslach Burnout Inventory (MBI) for detection of professional
burnout. The inventory includes 22 statements, and the Likert type scale was used to assess them. The MBI
consists of 3 sub-scales: Emotional Exhaustion, Depersonalization, and Personal Accomplishment (Maslach,
Jackson, 1986 acc. to Dreifelde-Gabruseva, 2009).
The obtained test results identified the level of professional burnout, defined as low, medium, or high (see
Table 1) (Vodopjanova, Starchenkova, 2009, 207).
Table 1
Professional burnout level score Sub-scale Low level
(points) Medium level
(points) High level
(points)
Emotional exhaustion 0-15 16-24 25 or more
Depersonalisation 0-5 6-10 11 or more
Personal Accomplishment 37 or more 31-36 30 or less
Source: Vodopjanova, Starchenkova (2009)
2) Mathematical statistical data processing methods: Cronbach's alpha (data credibility), Kolmogorov
Smirnov Z criterion (correspondence of data to normal distribution), the parametric statistics method – the T
criterion, and the non-parametric statistics method – the Mann Whitney U criterion (calculation of
professional burnout level differences).
4.RESEARCH RESULTS
The Cronbach's alpha was calculated to determine the credibility of the results obtained from the
questionnaires used in the study (see Table 1).
Table 2
Cronbach’s alpha coefficient
Emotional exhaustion Depersonalisation Personal
accomplishment
Cronbach’s alpha
coefficient 0.859 0.559 0.737
Table 2 shows that the Cronbach's alpha obtained for the results on the emotional exhaustion and personal
accomplishment reduction scales are higher by 0.6, which indicates a sufficient level of credibility for the
results obtained on these scales. The Cronbach's alpha obtained for the result on the depersonalisation scale
is equal to 0.6 only after decimal approximation, and this means a sufficient level of credibility of the results.
The next step in the study was determination of whether the empirical distributions of the obtained results
correspond to the normal distribution, and calculation of Kolmogorov Smirnov Z criterion (see Table 3).
Table 3
The results of Kolmogorov – Smirnov Z test for selection of special education teachers with 25
years of experience
Emotional
exhaustion Depersonalisation
Personal
accomplishment
N 62 62 62
Kolmogorov – Smirnov Z test 1.002 1.054 0.815
Significance 0.268 0.217 0.520
Table 3 shows that the significance score for the results on all scales is above 0.05, and this shows that
the results are representable.

Journal of Business Management, 2015, No.9 ISSN 1691-5348
50
Table 4
The results of Kolmogorov – Smirnov Z test for selection of special education teachers with 10
years of experience
Emotional
exhaustion Depersonalisation
Personal
accomplishment
N 44 44 44
Kolmogorov – Smirnov Z test 1.212 0.697 1.447
Significance 0.106 0.716 0.030
For the special education teachers with 10 years of job experience, the significance score is by 0.05 higher
for the results on the emotional exhaustion and depersonalisation scales (see Table 4), and this shows that the
results are representable. The Kolmogorov Smirnov Z criterion score for the results on the personal
accomplishment reduction scale are lower by 0.05, which indicates that the results are not representable.
The next step was the descriptive statistics calculations – the mean arithmetic median mode is the central
tendency indicators. If the central tendency indicators are close according to their values, this means that the
sample size is sufficient.
The central tendency indicators for the emotional exhaustion and personal accomplishment reduction
scale scores are close according to their values, and this shows that the sample size is sufficient for these
measurements. The depersonalisation scale central tendency mode value is explicitly lower, and this shows
that the sample size is small (see Table 5).
Table 5
The results of Kolmogorov – Smirnov Z test for selection of special education teachers with 25
years of experience
Emotional
exhaustion Depersonalisation
Personal
accomplishment
N valid 62 62 62
missing 0 0 0
Arithmetic mean 25.0323 6.3548 33.7581
Median 24.0000 6.0000 34.0000
Mode 26.00 3.00 34.00
Standard deviation 9.45909 4.06947 8.32276
Coefficient of skewness 0.439 1.098 -0.252
Standard error of the coefficient of
skewness
0.304 0.304 0.304
Excess -0.999 1.099 0.132
Standard deviation of excess 0.599 0.599 0.599
A review of the skewness coefficient values shows that the coefficient of skewness for the results on the
emotional exhaustion and depersonalisation scales is positive, and this indicates that the results have a
tendency towards lower values. The skewness coefficient is negative for the results on the personal
accomplishment reduction scale, and this indicates that the results have a tendency towards higher values
(see Table 5).

Journal of Business Management, 2015, No.9 ISSN 1691-5348
51
Table 6
The results of Kolmogorov – Smirnov Z test for selection of special education teachers with 10
years of experience
Emotional
exhaustion Depersonalisation Personal accomplishment
N valid 44 44 44
missing 0 0 0
Arithmetic mean 22.8409 5.2500 32.5227
Median 21.0000 5.0000 37.0000
Mode 16.00a 5.00 40.00
Standard deviation 7.92389 3.18518 9.02835
Coefficient of skewness 1.230 0.358 -0.629
Standard error of the coefficient of
skewness
0.357 0.357 0.357
Excess 0.539 0.038 -0.983
Standard deviation of excess 0.702 0.702 0.702
The excess values show that the value is negative for the results obtained on the emotional exhaustion
scale, and this indicates that the results tend to spread along the X axis. The excess value is positive for the
results on the depersonalisation and personal accomplishment reduction scales, and this indicates that the
results have a tendency to cluster around the arithmetic mean (see Table 6).
Considering the fact that the empirical distribution of the results obtained on the emotional exhaustion
and depersonalisation scales corresponds to the normal distribution in both samples, the parametric statistics
method - the T criterion was used to calculate the differences in the levels of professional burnout (see Table
7).
Table 7
T test for special education teachers with 10 and 25 years work experience
T Significance
Emotional exhaustion -1.255 0.212
Depersonalisation -1.503 0.136
The T criterion significance values, which are above 0.05, allow concluding that the special education
teachers with 10 years of job experience and the special education teachers with 25 years of job experience
do not have statistically significant differences in the emotional exhaustion and depersonalisation scores (see
Table 7).
Since the empirical distribution of the results obtained on the personal accomplishment reduction scale
for the teachers with 25 years of job experience in the samples do not correspond to the normal distribution,
and the results for the teachers with 10 years of job experience do not correspond to the normal distribution,
the calculations were based on the use of the non-parametric statistics method - the Mann Whitney U
criterion (see Table 8).
Table 8
Mann Whitney U test for special education teachers with 10 and 25 years work experience
Personal accomplishment
Mann Whitney U test 1333.500
Significance 0.845
The Mann Whitney U criterion significance values, which are above 0.05, allow concluding that there are
no statistically significant differences also in the personal accomplishment reduction scores for the special
education teachers with 10 years of job experience and the special education teachers with 25 years of job
experience (see Table 8).
Further below is a description of the burnout scores obtained for the special education teachers on the
three scales: emotional exhaustion, depersonalisation, and personal accomplishment reduction (see Fig. 1 to
Fig 4).
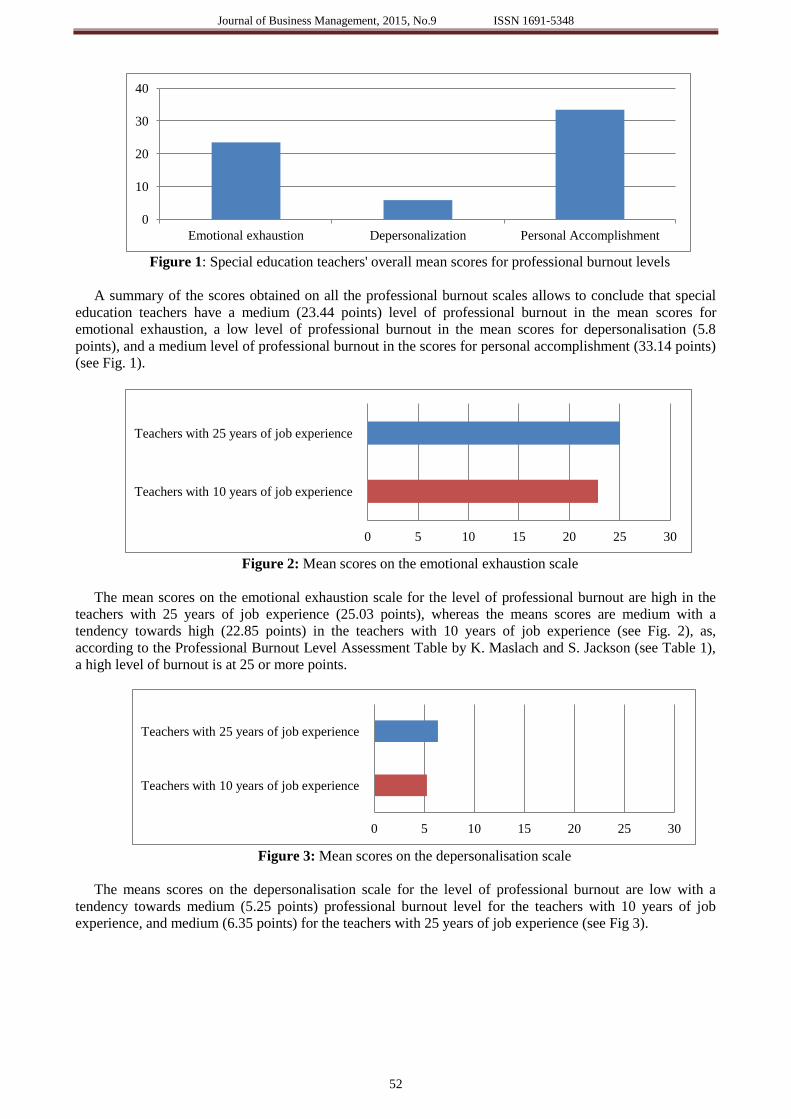
Journal of Business Management, 2015, No.9 ISSN 1691-5348
52
Figure 1: Special education teachers' overall mean scores for professional burnout levels
A summary of the scores obtained on all the professional burnout scales allows to conclude that special
education teachers have a medium (23.44 points) level of professional burnout in the mean scores for
emotional exhaustion, a low level of professional burnout in the mean scores for depersonalisation (5.8
points), and a medium level of professional burnout in the scores for personal accomplishment (33.14 points)
(see Fig. 1).
Figure 2: Mean scores on the emotional exhaustion scale
The mean scores on the emotional exhaustion scale for the level of professional burnout are high in the
teachers with 25 years of job experience (25.03 points), whereas the means scores are medium with a
tendency towards high (22.85 points) in the teachers with 10 years of job experience (see Fig. 2), as,
according to the Professional Burnout Level Assessment Table by K. Maslach and S. Jackson (see Table 1),
a high level of burnout is at 25 or more points.
Figure 3: Mean scores on the depersonalisation scale
The means scores on the depersonalisation scale for the level of professional burnout are low with a
tendency towards medium (5.25 points) professional burnout level for the teachers with 10 years of job
experience, and medium (6.35 points) for the teachers with 25 years of job experience (see Fig 3).
0
10
20
30
40
Emotional exhaustion Depersonalization Personal Accomplishment
0 5 10 15 20 25 30
Teachers with 10 years of job experience
Teachers with 25 years of job experience
0 5 10 15 20 25 30
Teachers with 10 years of job experience
Teachers with 25 years of job experience

Journal of Business Management, 2015, No.9 ISSN 1691-5348
53
Figure 4: Mean scores on the personal accomplishment reduction scale
The mean scores on the personal accomplishment scale for the level of professional burnout are medium
for the teachers with 25 years of job experience and the teachers with 10 years of job experience, i.e., 33.75
and 32.52 points respectively (see Fig. 4).
5.CONCLUSIONS
The results of the study do not confirm the hypothesis that there are statistically significant differences in
the levels of professional burnout between special education teachers whose length of employment in
education is 10 years and those whose length of employment in education is 25 years. There are no
statistically significant differences in the levels of professional burnout between the teachers with 10 or 25
years of job experience in education.
A summary of the scores obtained on all the professional burnout scales allows to conclude that special
education teachers have a medium (23.44 points) level of professional burnout in the mean scores for
emotional exhaustion, have a low level of professional burnout in the mean scores for depersonalisation (5.8
points), and have a medium level of professional burnout in the scores for personal accomplishment (33.14
points), and these are signals of professional burnout among the special education teachers. The results of the
research study are similar to those described in the theory (Maslach, 1998; Montgomery, Rupp, 2005) or
obtained in the studies conducted elsewhere (Skoryk, 2013).
This suggests that further research should be targeted at studying the factors which influence professional
burnout, such as working conditions and remuneration, working environment, conflicts
2014; Maslach, 2011; Hakanen, et al., 2006; Jackson, 2004).
The mean scores on the emotional exhaustion scale for the level of professional burnout are high (25.03
points) among the teachers with 25 years of job experience and medium with a tendency towards high (22.85
points) among the teachers with 10 years of job experience. Emotional exhaustion is the main component of
professional burnout, characterised by a feeling of depletion of the emotional resources, presence of anxiety,
feeling insulted, sense of emptiness, occurrence of the wish to isolate in order to get protection. The person
realises that they are not able to feel as they felt at the place of their employment before, the first symptoms
of depression and emotional breakdown occur (Maslach, 1998). The results of the study show that already
now the special education teachers might have all or some of these symptoms.
The means scores on the depersonalisation scale for the level of professional burnout are low with a
tendency towards medium (5.25 points) professional burnout level for the teachers with 10 years of job
experience, and medium (6.35 points) for the teachers with 25 years of job experience. Depersonalisation
involves negative, cynical reactions to the work performed by other people, the individual is not able to feel
free, relax, develops additions to various substances. This is suggestive of potential indifference in
communication with other people and pupils in the future and perception of the pupils as work objects.
Emotional disassociation from the hardships and problems of the pupils may occur. Thus, the job becomes a
formal duty and does not bring the previous enjoyment and satisfaction with the performance. This causes
self-dissatisfaction and the results of the work, and potentially higher demands towards the individual
himself/herself (Maslach, 1998).
The mean scores on the personal accomplishment scale for the level of professional burnout are medium
for the teachers with 25 years of job experience and the teachers with 10 years of job experience, i.e., 33.75
and 32.52 points respectively. This suggests that already now the special education teachers are not willing
to succeed in life and have reduced levels of capacity for work. Worsening of the quality of relationships,
0 5 10 15 20 25 30 35 40
Teachers with 10 years of job experience
Teachers with 25 years of job experience

Journal of Business Management, 2015, No.9 ISSN 1691-5348
54
and hostile attitudes towards the colleagues may occur in the future and, potentially, already now. Reduced
levels of the sense of job competence, self-dissatisfaction, feeling of being nothing, negative self-perception
from the professional point of view may occur (Maslach, 1998).
The results are suggestive of the necessity for preventive measures. To preclude further development of
professional burnout in the teachers, the management and the employees of the educational institutions
should evaluate and consider all the factors which influence professional burnout, i.e., not only the length of
employment, but also age, level of education, gender, working environment, professional relationships,
salary, personal factors, with no particular emphasis on any single influencing factor.
At policy level regular, paid supervision sessions should be held in order to control the symptoms of
professional burnout among the special education teachers, during which it is necessary to discuss any issues
the teachers find significant, to provide support in handling complex situations, to suggest alternative ways
of dealing with various situations in order to assure that the teachers have clearly defined individual roles and
limits of their competence, are encouraged to evaluate and analyse their performance and emotions,
understand the targets of their activities, and to achieve them sooner. At school management level alternative
stress control measures should also be facilitated, such as mutual consultations and support among the
colleagues, informal team-building events (e.g., various field trips, competitions, and joint celebrations).
REFERENCES
1. Abromaitiene, L., Sasnauskiene N. (2014), “Possibilities for Overcoming Professional Burnout: the Case of
Preschool Education Pedagogues”, the paper presented at The Past, the Present and the Future of Educational
Research Conference (ECER 2014), available at: http://www.eera-ecer.de/ (accessed: 2 September, 2014).
2. Ancane, G. (2004), „21.gadsimta moderna slimiba – izsikuma jeb izdegsanas sindroms”, Psihologijas pasaule, nr.
2004/05.
3. Antoniou, A. S., Ploumpi, A., Ntalla, M. (2013), “Occupational Stress and Professional Burnout in Teachers of
Primary and Secondary Education: The Role of Coping Strategies”, Psychology, 4(3A), 349-355.
4. Dreifelde – Gabruseva, I. (2009), „Izdegsanas un noguruma aiz lidzjutibas mazinasana ar makslas terapiju ilgstosas
socialas apruipes personalam, Master Thesis, Latvija, RSU.
5. Fernet, C., Guay, F., Senectal, C., Austin, S. (2012), “Predicting intraindividual changes in teacher burnout: The role
of perceived school environment and motivational factors”, Teaching and Teacher Education, 28, 514-525.
6. Friedman, I. A. (2000), “Burnout in teachers: Shattered dreams of impeccable professional performance”, JCLP/In
Session: Psychotherapy in Practice, 56, 595-606.
7. Hakanen, J. J., Bakker, A. B., Schaufeli, W. B. (2006), “Burnout and work engagement among teachers”, Journal of
School Psychology, 43, 495 – 513.
8. Hargreaves, L., Cunningham, M., Hansen, A., McIntyre, D., Oliver, C., Pell, T. (2007), “The Status of Teachers and
the Teaching Profession in England: Views from Inside and Outside the Profession”, Final Report of the Teacher
Status Project, University of Cambridge Faculty of Education, Department of Media and Communication,
University of Leicester.
9. Jackson, L. (2004), “Burnout and Engagement of Teachers in the North West Province”’, Thesis submitted in
fulfilment of the requirements for the degree Philosophy Doctor in Industrial Psychology at the Potchefstroom
Campus of the North-West University, available at:
http://dspace.nwu.ac.za/bitstream/handle/10394/227/jackson_ltb.pdf?sequence=1 (accessed: 10 November 2014).
10. Goddard, R., O’Brien, P., Goddard, M. (2006), “Work environment predictors of beginning teacher burnout”,
British Educational Research Journal, 32, 857–874.
11. Grigorjevs, E. (2014), „Latvijas Izglitibas un zinatnes darbinieku arodbiedribas ar labklajibas ministru parrunas
izdienas pensiju ieviesanas iespejas pedagogiem, Izglitiba un Kultura Latvija, available at: http://www.izglitiba-
kultura.lv/zinas/lizda-ar-labklajibas-ministru-parrunas-izdienas-pensiju-ieviesanas-iespejas-pedagogiem (accessed:
11 November 2014).
12. Koustelios, A. (2003), “Burnout among physical education teachers in Greece”, International Journal of Physical
Education, 40, 32-38.
13. Koustelios, A., Tsigilis, N. (2005), “Relationship between burnout and job satisfaction among physical education
teachers: A multivariate approach”, European Physical Education Review, 11, 189-203.
14. Kraft, U. (2006), “Burned Out”, Scientific American Mind, 17 (3), 28–3.
15. Maslach, C. (1998), “A multidimensional theory of burnout”, in C. L. Cooper (Ed.), Theories of organisational
stress, Oxford: Oxford University Press, 68-85.
16. Maslach, C. (2011), “Engagement research: Some thoughts from a burnout perspective”, European Journal of Work
and Organizational Psychology, 20, 47-52.
17. Maslach, C., Jackson, S. E. (1986), Maslach Burnout Inventory: Manual (2nd), Palo Alto, CA: Consulting
Psychologists Press.
18. Moncada, S., Llorens, C. (2013), “Teacher trade unions in solidarity for healthy and safe workplaces in the
economic crisis”, ETUCE Report, EU, available at:
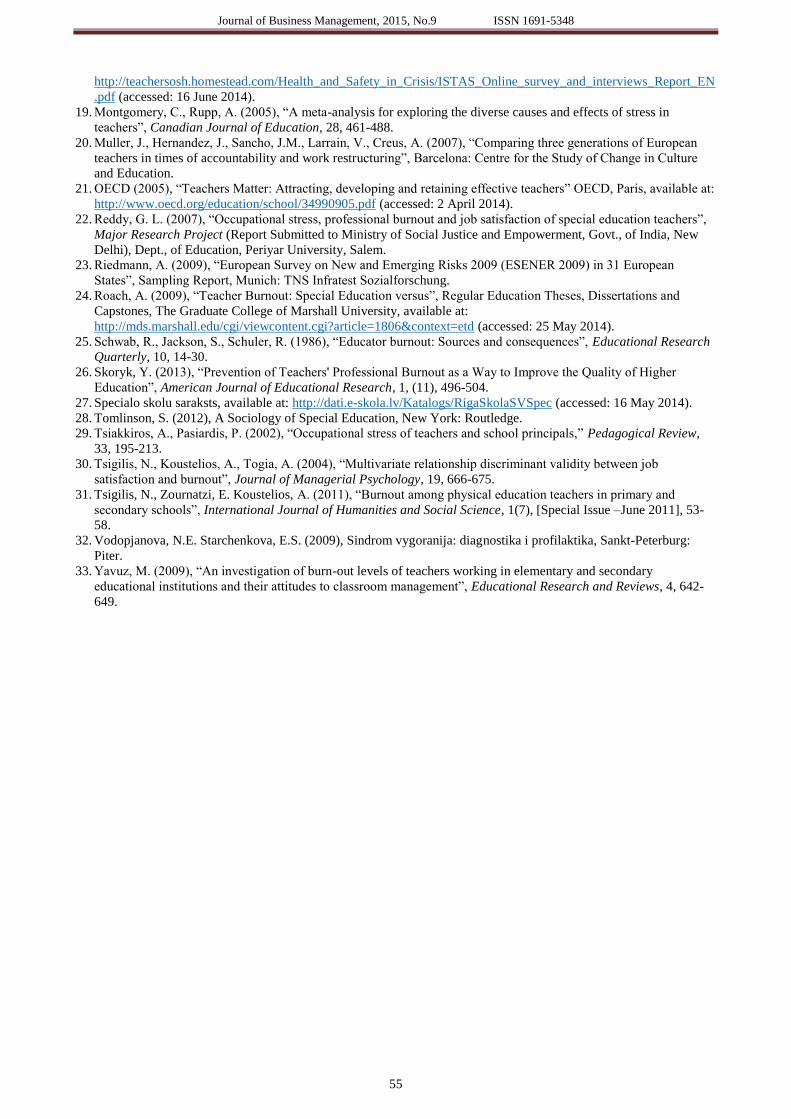
Journal of Business Management, 2015, No.9 ISSN 1691-5348
55
http://teachersosh.homestead.com/Health_and_Safety_in_Crisis/ISTAS_Online_survey_and_interviews_Report_EN
.pdf (accessed: 16 June 2014).
19. Montgomery, C., Rupp, A. (2005), “A meta-analysis for exploring the diverse causes and effects of stress in
teachers”, Canadian Journal of Education, 28, 461-488.
20. Muller, J., Hernandez, J., Sancho, J.M., Larrain, V., Creus, A. (2007), “Comparing three generations of European
teachers in times of accountability and work restructuring”, Barcelona: Centre for the Study of Change in Culture
and Education.
21. OECD (2005), “Teachers Matter: Attracting, developing and retaining effective teachers” OECD, Paris, available at:
http://www.oecd.org/education/school/34990905.pdf (accessed: 2 April 2014).
22. Reddy, G. L. (2007), “Occupational stress, professional burnout and job satisfaction of special education teachers”,
Major Research Project (Report Submitted to Ministry of Social Justice and Empowerment, Govt., of India, New
Delhi), Dept., of Education, Periyar University, Salem.
23. Riedmann, A. (2009), “European Survey on New and Emerging Risks 2009 (ESENER 2009) in 31 European
States”, Sampling Report, Munich: TNS Infratest Sozialforschung.
24. Roach, A. (2009), “Teacher Burnout: Special Education versus”, Regular Education Theses, Dissertations and
Capstones, The Graduate College of Marshall University, available at:
http://mds.marshall.edu/cgi/viewcontent.cgi?article=1806&context=etd (accessed: 25 May 2014).
25. Schwab, R., Jackson, S., Schuler, R. (1986), “Educator burnout: Sources and consequences”, Educational Research
Quarterly, 10, 14-30.
26. Skoryk, Y. (2013), “Prevention of Teachers' Professional Burnout as a Way to Improve the Quality of Higher
Education”, American Journal of Educational Research, 1, (11), 496-504.
27. Specialo skolu saraksts, available at: http://dati.e-skola.lv/Katalogs/RigaSkolaSVSpec (accessed: 16 May 2014).
28. Tomlinson, S. (2012), A Sociology of Special Education, New York: Routledge.
29. Tsiakkiros, A., Pasiardis, P. (2002), “Occupational stress of teachers and school principals,” Pedagogical Review,
33, 195-213.
30. Tsigilis, N., Koustelios, A., Togia, A. (2004), “Multivariate relationship discriminant validity between job
satisfaction and burnout”, Journal of Managerial Psychology, 19, 666-675.
31. Tsigilis, N., Zournatzi, E. Koustelios, A. (2011), “Burnout among physical education teachers in primary and
secondary schools”, International Journal of Humanities and Social Science, 1(7), [Special Issue –June 2011], 53-
58.
32. Vodopjanova, N.E. Starchenkova, E.S. (2009), Sindrom vygoranija: diagnostika i profilaktika, Sankt-Peterburg:
Piter.
33. Yavuz, M. (2009), “An investigation of burn-out levels of teachers working in elementary and secondary
educational institutions and their attitudes to classroom management”, Educational Research and Reviews, 4, 642-
649.
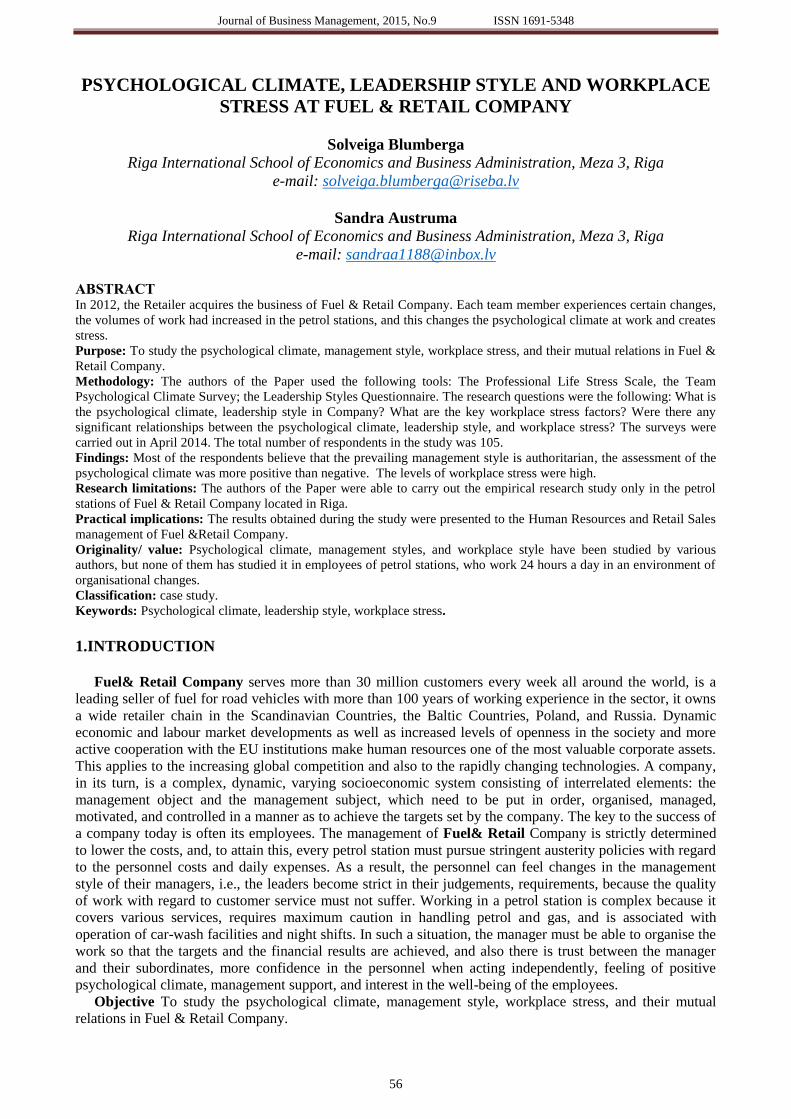
Journal of Business Management, 2015, No.9 ISSN 1691-5348
56
PSYCHOLOGICAL CLIMATE, LEADERSHIP STYLE AND WORKPLACE
STRESS AT FUEL & RETAIL COMPANY
Solveiga Blumberga
Riga International School of Economics and Business Administration, Meza 3, Riga
e-mail: [email protected]
Sandra Austruma
Riga International School of Economics and Business Administration, Meza 3, Riga
e-mail: [email protected]
ABSTRACT In 2012, the Retailer acquires the business of Fuel & Retail Company. Each team member experiences certain changes,
the volumes of work had increased in the petrol stations, and this changes the psychological climate at work and creates
stress.
Purpose: To study the psychological climate, management style, workplace stress, and their mutual relations in Fuel &
Retail Company.
Methodology: The authors of the Paper used the following tools: The Professional Life Stress Scale, the Team
Psychological Climate Survey; the Leadership Styles Questionnaire. The research questions were the following: What is
the psychological climate, leadership style in Company? What are the key workplace stress factors? Were there any
significant relationships between the psychological climate, leadership style, and workplace stress? The surveys were
carried out in April 2014. The total number of respondents in the study was 105.
Findings: Most of the respondents believe that the prevailing management style is authoritarian, the assessment of the
psychological climate was more positive than negative. The levels of workplace stress were high.
Research limitations: The authors of the Paper were able to carry out the empirical research study only in the petrol
stations of Fuel & Retail Company located in Riga.
Practical implications: The results obtained during the study were presented to the Human Resources and Retail Sales
management of Fuel &Retail Company.
Originality/ value: Psychological climate, management styles, and workplace style have been studied by various
authors, but none of them has studied it in employees of petrol stations, who work 24 hours a day in an environment of
organisational changes.
Classification: case study.
Keywords: Psychological climate, leadership style, workplace stress.
1.INTRODUCTION
Fuel& Retail Company serves more than 30 million customers every week all around the world, is a
leading seller of fuel for road vehicles with more than 100 years of working experience in the sector, it owns
a wide retailer chain in the Scandinavian Countries, the Baltic Countries, Poland, and Russia. Dynamic
economic and labour market developments as well as increased levels of openness in the society and more
active cooperation with the EU institutions make human resources one of the most valuable corporate assets.
This applies to the increasing global competition and also to the rapidly changing technologies. A company,
in its turn, is a complex, dynamic, varying socioeconomic system consisting of interrelated elements: the
management object and the management subject, which need to be put in order, organised, managed,
motivated, and controlled in a manner as to achieve the targets set by the company. The key to the success of
a company today is often its employees. The management of Fuel& Retail Company is strictly determined
to lower the costs, and, to attain this, every petrol station must pursue stringent austerity policies with regard
to the personnel costs and daily expenses. As a result, the personnel can feel changes in the management
style of their managers, i.e., the leaders become strict in their judgements, requirements, because the quality
of work with regard to customer service must not suffer. Working in a petrol station is complex because it
covers various services, requires maximum caution in handling petrol and gas, and is associated with
operation of car-wash facilities and night shifts. In such a situation, the manager must be able to organise the
work so that the targets and the financial results are achieved, and also there is trust between the manager
and their subordinates, more confidence in the personnel when acting independently, feeling of positive
psychological climate, management support, and interest in the well-being of the employees.
Objective To study the psychological climate, management style, workplace stress, and their mutual
relations in Fuel & Retail Company.
Journal of Business Management, 2015, No.9 ISSN 1691-5348
57
Theoretical framework of the research
Socio-psychological climate - the qualitative side of interpersonal relationship that manifests as an
aggregate of psychological conditions which either facilitates or hinders efficient common activity and
versatile personal or group development (Klauss, 2002). Psychological and organisational climate are
mentioned to describe climate in literature. Psychological climate refers to an individual (Payne and Pugh,
1976). Good psychological climate must be created and maintained by the manager. Maintaining
psychological climate is not only a responsibility of the manager, but also a creative process which requires
knowledge of human psychology, relationships, and emotional state (Pocebut and Ciker, 2002).
Psychological climate is also defined as the way how members of an organisation perceive and describe their
environment (Denison, 1996; Moran and Vilkwein, 1992; Verbeke,Volgering and Hessel, 1998).
Psychological climate will mediate the positive relationship between interpersonal aggression and employee
burnout (Bedi, Courcy, Paquet and Harvey, 2013). A.Vorobjovs (2002) believes that favourable
psychological climate in a team is characterised by full trust and empathy in the attitudes towards each other,
unselfish mutual assistance, full satisfaction of the communicative needs, a positive emotional background in
the interpersonal relationships is satisfaction with the status distributions among all team members, non-
existence of contradicting groupings. The latest research suggests that the psychological climate of the
organization is linked with the organizational effectiveness (Kataria, Garg and Rastogi, 2013).
The leader of the team plays a significant role in the creation of the psychological climate in it. In
building the psychological climate, the leader performs a significant social role, i.e., they bring in certain
personal and human features which determine the style of management, the quality of contact with their
subordinates, and their skills in building the motivation of the employees. The relationships between the
leader and the subordinate, the psychological climate, and the results of teamwork directly depend on the
style of management. The association between leadership styles (transactional and transformational) and
organizational outcome were fully mediated by the employees’ perception (Nazir, Akram and Arshad, 2014).
Efficient leaders and managers provide opportunities, so that people can feel proud for their job, and set
higher targets meant for further growth. As A.Vorobjovs (2002) writes, the authoritarian style of
leadership mostly results in a negative psychological climate. In case of the authoritarian style, the
leader exercises too much control over the private life and job, or does not try to have a deeper
understanding of the problems their employees might have. It should be noted that a democratic style of
management least facilitates workplace stress, whereas, right the contrary, an authoritarian style develops it
(Horisina, 2004; Zankovskij, 2002). The authoritarian style can assure high levels of job efficiency in terms
of quantitative indicators, but not always in terms of quality indicators. For employees’ instrumental
leadership is more effective in promoting employee effort and increasing job performance (Mulki,
Caemmerer and Heggde, 2015). These may be consequences of the fact that the operation of the company is
primarily based on strict control, rather than internal motivation of the employees (Renge, 2007).
The factors that influence the psychological climate in a company include: the employee content in the
company, their job specifics, level of education, age, gender, the personality of the leader of the organisation,
their management style, type of behaviour, workplace stress, and other.
R.S. Lazarus (1999) mentions that stress is a physiological and psychological response to excessive,
unpleasant stimulation and external conditions which imply threat. Stress causes complex changes in the
chemical processes of the body, by affecting the individual's mental and physiological processes (Lazarus
and Folkman, 1984). Selje (1979) believed that responses of certain types are caused by stress factors.
Workplace stress may be an obstacle in the attainment of the targets for the employees and also the
organisation. The work stress and its adverse effects on the physical and mental health of an employee
(Sohail and Rehman, 2015). The authors of the Paper wish to highlight that workplace stress is one of the
risk factors that affect employees. Stress causes a psychological and physical state which occurs when the
resources of the individual are insufficient to control the pressure exerted by the requirements and situations.
Stress and the resulting tension are as a result of a conflict between the individual abilities of the individual,
their skills, and the requirements at the place of work. Causes of stress, as such, cannot cause intensity of
tension if the individual is able to minimise stress themselves or with support of others, such as their
management, which, in its turn, influences changes in the behaviour in stress situations (Lang and Lee,
2005).
2.RESEARCH METHODOLOGY
The authors used several data collection tools in order to attain the aim: Team Psychological Climate
Questionnaire (Parygin,1999) to investigate the psychological climate. The following scores are offered for
Journal of Business Management, 2015, No.9 ISSN 1691-5348
58
the statements: 3 – The feature is always observed in the group 2 - The feature is observed in most situations 1 -
The feature is observed pretty often 0 - Equally observed Climate A and Climate B psychological feature. The
Professional Life Stress Scale, (Fontana,1991). The Stress Scale consists of 24 questions. The responses are
assessed using the key for the scale, and the score can be between 0 and 60. A score of 0 to 15 suggests that
the respondent has low workplace stress levels and that job-related stress has no untoward effects on the
physical or emotional condition of the respondent. The Leadership Styles Questionnaire (Iljin, 2012) was
used to determine the management styles, a questionnaire developed by the authors was used to highlight the
special properties of the business, and an analysis of the internal personnel documents was carried out.
The research questions in the Paper were the following: What is the psychological climate in Fuel &
Retail Company? What leadership styles do the managers of Fuel & Retail Company have? What are the key
workplace stress factors in Fuel & Retail Company? Are there any significant relationships between the
psychological climate, leadership style, and workplace stress?
The surveys were carried out in April 2014. The respondents received the questionnaire electronically, to
their e-mail addresses, with prior consent of the management of Fuel & Retail for the survey. The total
number of respondents in the survey was 105. Out of these, 78 were females and 27 were males. The
breakdown of the respondents by their positions was the following: petrol station sales personnel 53%,
deputy managers 17%, and managers 30%.
3.ANALYSIS OF RESEARCH RESULTS
The analysis of the documents and the data obtained in the survey designed by the authors reveals higher
levels of employee turnover in Fuel & Retail Company at the end of 2013. The explanation for this is
outflow of employees to other countries, particularly in the winter months when the number of work hours
was reduced and the salaries of the sales personnel decreased by 20%.
The reason for termination of employment for a large part of the respondents (22%) is non-compliance
(misappropriation of cash or products). 13% of the new employees demonstrated unsuccessful performance
during the trial period, for a wide range of reasons (insufficient expertise, night shifts, high volumes of
work). 17% find work in other companies. Trained personnel with good expertise are often enticed by other
companies. 8% leave the country, 8% see no career opportunities in the company. 6% have left because of
the salary, and 6% have not been able to combine working in shifts and their studies. 6% have left for family
reasons. Pretty often, one of the spouses already works abroad, and the other joins him/her in a year.
The personnel turnover calculations done by Fuel & Retail Company show that the percentages of the
dismissed employees against the total number of employees at the particular time were18% in 2009, 16% in
2010, 25% in 2011, 29% in 2012, 28% in 2013.
The results of the study into the psychological climate (Parygin,1999) show that the employees' overall
assessment of the psychological climate in the organisation is more positive than negative. The atmosphere
in Fuel & Retail Company is favourable, and positive relationships between the employees prevail, the mood
in the team is mostly brisk and joyful (64.% of the respondents agreed entirely, 33% agreed partially, and
only 2% disagreed entirely). Mutual respect dominates in the teams of Fuel & Retail Company, the personnel
is united, help the newcomers to the team, help each other in case of illness when it is necessary to fill in for
a colleague.
The results of the Management Styles Questionnaire show (Ilin, 2012) that the authoritarian style of
management dominates in the organisation (49%), characterised by focusing on the direct job-related issues
and ignoring the needs of the subordinates, 48% believe that the managers have the democratic style of
leadership when the employees are also involved in the decision-making processes, and 4% of the
respondents think that the leadership style is liberal, i.e., that the manager is more like a formality, and that
every employee may choose the job obligations and techniques themselves. The obtained results suggest that
the employees do not a common opinion regarding the leadership style of their managers, more than a half of
the respondents think that the managers of Fuel & Retail Company have the authoritarian style of leadership.
In their responses to the question: How do you evaluate the work of your direct manager? 86% of the
respondents have specified that their direct manager provides support and helps with advice, regularly
assesses the completed work, and helps to improve performance. This means that the leaders both help and
assess daily work, and perform their obligations actively. 10% of the respondents indicate that the leaders
allow expressing oneself and showing initiative, which is too little, because too much control results in
mechanical performance of the work. This will prove to be a disadvantage when, in a non-standard situation,
the personnel will not be able to think of a solution independently because they have never done it before.
When assessing the level of workplace stress (Fontana, 1991), 79 respondents have given the score of 4

Journal of Business Management, 2015, No.9 ISSN 1691-5348
59
(high) for their stress level, a 25 respondents have given the score of 3. When considering this fact regarding
workplace stress, the authors of the Paper agree to the opinion expressed by Mahmood and Bisaria
(Mahmood, Bisaria, 2008) that the further the individual is from the comfort zone, the higher the levels of
stress. The large amounts of work, dissatisfied customers, and the high requirements at work, as
demonstrated by the previously discussed questions, might be reasons why the levels of stress are so high.
People have individual responses to workplace stress. (Wichert, 2002). The respondents indicate that the key
work stress factors are those which make one experience additional tension, agitation, nervousness, alarm, or
a physiologically unpleasant process. In response to the question regarding the factor that cause stress at
work, those mentioned most frequently were the amount of work and time restrictions, followed by the
financial targets of Fuel & Retail Company, high requirements at work, dissatisfied customers and conflicts
with them, management style, unclear job tasks. It is important that the knowledge, expectations, abilities,
values, and attitudes of the individual meet those of the organisation and vice versa. If, however, there are
incompatibilities with regard to these aspects, this may cause stress and lower the levels of job satisfaction
(Lovelance, Rosen, 1996; Bretz, Judge, 1994).
To identify the correlations, the authors of the Paper used Spearman's rank correlation coefficient.
Spearman's rank correlation was chosen because the data did not match the normal distribution. There is a
statistically significant, negative, medium close correlation between the scales "'management assessment"
and "team characteristics" (r = - 0.214, p < 0.05), which means that the higher scores provided by the
respondents for the team characteristics, the lower scores they have provided for the manager (thus lowering
their significance). There is a statistically significant, positive, medium close correlation between the scale
"team characteristics" and "job selection criteria" (r = 0.214, p < 0.05). The higher the score provided by the
respondent for the team characteristics, the more important the job selection criteria are for them. There is a
statistically significant, positive, and close correlation between the scale "Positive aspects of psychological
climate" and the "Negative aspects of psychological climate (r = 819, p < 0.05). The higher the scores
provided by the respondents for the positive aspects of the psychological climate, the higher they assess the
negative aspects of the psychological climate too, as both are significant in a job setting.
There is no significant relationship between employee stress levels and the negative aspects of the
psychological climate, the job selection criteria, and the team characteristics.
Table 1
Spearman's rank correlation
Team
characteristics Stress level
Job selection
criteria
Negative aspects
of
psychological climate
Management
assessments
Correlation Coefficient -.214* -0.085 0.007 -0.112
Sig. (2-tailed) 0.028 0.39 0.942 0.255
N 105 105 105 105
Team
characteristics
Correlation Coefficient 1 -0.037 .214* -0.08
Sig. (2-tailed) . 0.707 0.029 0.418
N 105 105 105 105
Stress level
Correlation Coefficient -0.037 1 -0.037 0.054
Sig. (2-tailed) 0.707 . 0.71 0.582
N 105 105 105 105
Positive aspects
of psychological
climate
Correlation Coefficient -0.099 0.031 0.06 ,819**
Sig. (2-tailed) 0.316 0.753 0.545 0
N 105 105 105 105
To find out the relationship between the leadership styles and the psychological climate, Spearman's
correlation was used (see Table 2). There is a statistically significant, negative, medium close correlation
between the personnel management process assessments and the authoritarian style of leadership (r = - 0.198,
p < 0.05). Higher scores for the authoritarian style lower personnel process assessments, and exactly the
same negative correlation exists between the liberal style of management and personnel process assessments
(r = - 0.205, p< 0.05). There is a statistically significant, positive, medium close correlation between

Journal of Business Management, 2015, No.9 ISSN 1691-5348
60
personnel management process assessments and the democratic style of leadership (r = 0.259, p < 0.05). The
higher the scores provided by the respondents for the personnel management processes, their performance,
the higher their scores for the democratic style of management. The positive aspects of the psychological
climate negatively correlate with the liberal style of management (r = - 0.207, p < 0.05). This shows that
employees do not wish to work with a manager who has only formal powers, and that the characteristics of
positive psychological climate would also be lowered then.
Table 2
Correlation between leadership style, personnel management process assessments and the positive
aspects of the psychological climate Authoritarian style Democratic style Liberal style
Personnel process
assessment
Correlation Coefficient -.198* .259** -.205*
Sig. (2-tailed) 0.043 0.008 0.036
N 105 105 105
Positive aspects of
psychological climate
Correlation Coefficient 0.082 0.007 -.207*
Sig. (2-tailed) 0.407 0.946 0.034
N 105 105 105
4.CONCLUSIONS/DISCUSSION/SUGGESTIONS
The assessments provided by the respondents for the psychological climate in Fuel & Retail Company are
more positive than negative. The atmosphere at the petrol stations is favourable, and the employees enjoy
positive relationships which make them feel more secure during change of the management. Most of the
respondents (49%) believe that the authoritarian style of leadership prevails in Fuel & Retail Company, and
this proves that the leaders have changed and, for the large volumes of work, they opt less for the democratic
style of management to thereby quickly achieve that the employees are obedient, disciplined, and efficient.
The levels of workplace stress in Fuel & Retail Company are high, and this demonstrates that the
management and the employees are not able to adapt to the new circumstances. The job volumes, time
restrictions, the high requirements at work, customer dissatisfaction, and conflict situations with them are the
main causes of workplace stress in the employees. The employees believe that the assessments provided by
their direct supervisors justifiably include both criticism and appraisal. The positive characteristics of the
psychological climate most frequently observed in the results of the study are: open communication, mutual
trust, joy, optimism, and feeling safe. The employees consider that there are very many job obligations, but
they need to be performed. This suggests willingness and attempts to adapt to the new requirements at work.
The factors which influence the choice of job (job selection criteria): work in a stable company, working
conditions, prestige of the company, stable and fair salary, working with people. These are the most essential
for the employees according to their individual systems of values. There is a statistically significant, negative
correlation between the scales "management assessment" and "team characteristics", where an increase in
one score lowers the other. There is a statistically significant, negative correlation between the personnel
management process assessments and the authoritarian style of leadership. Increases in the levels of the
authoritarian style lower the personnel management process assessments, and there is exactly the same
negative correlation between the liberal style and the personnel management process assessments. There is a
statistically significant, positive correlation between the personnel management process assessments and the
democratic style of leadership. The higher the score provided by the respondent for the democratic style of
management, the higher their score provided for the personnel management processes in the company. The
positive aspects of the psychological climate negatively correlate with the liberal style of management, and
this shows that the employees do not wish to work with a manager who has merely formal powers. The
psychological climate characterises the organisational characteristics, such as structure, management style,
and structural complexity. Good psychological climate must be created and maintained by the manager. In
building the psychological climate, the manager has an essential social role. They bring in certain personal
and human characteristics which determine the style of management, quality of contact with the
subordinates, and skills associated with building motivation in the employees, lower stress levels, and
overload the employee experiences when the expectation from them is likely to be beyond the limits of their
ability or capacity. Workplace stress may be an obstacle in the attainment of the targets for the employees
and also the organisation.
The authors suggest that the company management use the scheduled annual discussion with the
Journal of Business Management, 2015, No.9 ISSN 1691-5348
61
managers to develop an action plan which would help the managers to change their leadership styles and
optimise their daily workloads. During the monthly discussions, the managers should, together with the
Retail Sales management, review the optimal working hours for each Fuel & Retail Company required for
the organisation of the business procedure and the performance of their obligations in view of the customer
flows. In order to maintain a positive psychological climate and reduce the levels of on-job stress, the
management might want to develop clear guidelines, including fixing the work completion deadlines. The
Human Resources Department and the Retail Sales Department should develop an action plan which would
reduce the levels of on-job stress within Fuel & Retail Company. The authors suggest that the workloads of
the sales staff at the counter be reconsidered by providing assistants responsible for the preparation of the
snacks, in order to reduce the numbers of stressful situations in the work of the cash registry operators. It
might be necessary to evaluate the new project implementation procedures followed by Fuel & Retail
Company, i.e., develop methods for bringing innovation into the daily operations without unwanted
additional stress. The company management should communicate with the managers of Fuel & Retail
Company to fix the work completion deadlines, communicate the objectives, tasks and the workflows to the
managers prior to launching any new projects in order to allow time for the assessment of the available
timelines and to avoid unwanted stress associated with the deadlines. The authors believe that one must not
forget that the key to corporate success in the current competitive environment is its employees. In this
context, the manager must be able to organise the work so that the targets and the financial results are
achieved, and also so that there is trust between the manager and their subordinates, more confidence in the
personnel when acting independently, feeling of positive psychological climate, management support, and
interest in the well-being of the employees.
The results obtained during the study were presented to the Human Resources and Retail Sales
management of Fuel &Retail Company, including the conclusions and recommendations.
REFERENCES
1. Bedi, A., et al. (2013), “Interpersonal Aggression and Burnout: The Mediating Role of Psychological Climate”,
Stress and Health, 29(5), 350-359.
2. Bretz, R. B., Judge, T. A. (1994), “Person-organization fit and the theory of work adjustment: Implications for
satisfaction, tenure, and career success”, Journal of Vocational Behavior, 44, 32-54.
3. Denison, D. R. (1996), “What is the difference between organizational culture and organizational climate? A
Native’s Point of View on a Decade of Paradigm Wars”, Academy of Management Review, 21, 619-654.
4. Fontana, D. (1991), Managing Stress, England and Wales: Wiley.
5. Horosina J. (2004), Darbinieku profesionala izdegsana”, Psihologijas Pasaule, 9, 27.
6. Ilin, E. P. (2012), Psihologija obshhenija i mezhlichnostnyh otnoshenij, Sankt-Peterburg: Izdatelskij dom "Piter".
7. Kataria, A., Garg, P., Rastogi, R. (2013), “Psychological Climate and Organizational Effectiveness: Role of Work
Engagement”, IUP Journal of Organizational Behavior, 12(3), 33-46.
8. Klauss, A. (2002), Zinibas vaditajam, Riga: Preses nams.
9. Lang, J.C., Lee, C.H. (2005), “Identity, accumulation, others' acceptance, job search self efficacy, and stress”,
Journal of Organisational Behavior, 26, 293–312.
10. Lazarus, R. S. (1999), Stress and emotion: A new synthesis, New York: Springer.
11. Lazarus, R. S., Folkmans, S. (1984), Stress, Appraisal and Coping, New York: Springer.
12. Lovelace, K., Rosen, B. (1996), “Differences in achieving person-organization fit among diverse groups of
managers”, Journal of Management, 22(5), 703-722.
13. Moran, E.T.,Volkwein, J.F. (1992), “The cultural approach to the formation of organizational climate”, Human
Relations, 45(1), 19-47.
14. Mulki, J.P., Caemerrer, B., Heggde, G. S. (2015), “Leadeship style, salesperson’s work effort and job performance:
The influence of power distance”, Journal of Personal Selling& Sales Management, 35(1), 3-22.
15. Nazir, A., Akram, M.S., Arshad, M. (2014), “Exploring the mediating role of CSR practices among leadership styles
and job satisfaction”, Pakistan Journal of Science, 66(4), 351-355.
16. Parygin, B. D. (1999), Socialnaja psihologija. Problemy metodologii, istorii i teorii. Sankt Peterburg: IGUP.
17. Pochebut, L. G., Chiker, V. A. (2002), Organizacionnaja socialnaja psihologija: Uchebnoe posobie. Sankt-
Peterburg: Izd-vo"Rech'".
18. Renge, V. (2007), Musdienu organizaciju psihologija. Riga: Zvaigzne ABC, 215
19. Selye, H. (1979), The stress of my life: A scientist’s memoirs, New York: Van Nostrand.
20. Sohail, M., Rehman, C.A. (2015), “Stress and Health at the Workplace-A Review of the Literature”, Journal of
Business Studies Quarterl, 6(3), 95-121.
21. Verbeke, W., Volgering, M., Hessels, M. (1998), “Exploring the conceptual expansion within the field of
organizational behavior: Organizational climate and organizational culture”, Journal of Management Studies, 25,
303-329.
22. Vorobjovs, A. (2002), Sociala psihologija, Riga: SIA Izglitibas soli.

Journal of Business Management, 2015, No.9 ISSN 1691-5348
62
23. Wichert, I. (2002), Job insecurity and work intensification: The effects on health and wellbeing. In B.Burchell,
D.Ladipo & F.Wilkenson (Eds.) Job insecurity and work intensification, New York: Routledge.
24. Zankovskij, A. (2002), Organizacionnaja psihologija, Moskva: Izdatelstvo Flinta.
Journal of Business Management, 2015, No.9 ISSN 1691-5348
63
EMPIRICAL TESTING OF ARCTIC MODEL FOR ASSESSMENT OF
COMPETENCE BASED SYNERGY IN ACQUISITION PROCESS
Andrejs Cirjevskis
Riga International School of Economics and Business Adminitration, Meza Street 3, Riga, Latvia
e-mail: [email protected]
Abstract
Purpose: the aim of this paper is to develop and empirically test an integrative research model which would help to
assess prerequisites of competence-based synergy in acquisition process.
Design/methodology/approach: What we wanted to know was how core competences should be evaluated as sources
of synergy in acquisition/alliance? Having answered this question analysis we have researched the latest theoretical
findings in antecedents of synergy in merger and acquisition process and empirically tested by means of illustrative case
study.
Findings: Based on literature review in depth, an ARCTIC model has been developed. We have selected illustrative
case study of Facebook acquisition of WhatsApp by in mid 2014 year and tested empirically developed methodology.
Research limitations/implications: Illustrative case study involved explores the competence transfer as main drivers
of successful acquisition process. The author suggests further empirical testing on illustrative case studies and possible
development of methodology for evaluation of all six factors.
Practical implications: Research identified four steps to investigate whether core competence transfer in an
acquisition process is an important source of synergy and whether is better to acquire or ally for competence transfer.
The ARCTIC model can be used effectively in evaluating core competencies as a means of synergy creation in the
M&A context.
Originality/value: The authors believe that six factors of ARCTIC models allow making preliminary evaluation of core
competences as sources of synergy in acquisitions and new ARCTIC model should be helpful to mangers facing
mergers, acquisitions and alliances, as well as to management academic specialists, studying this area.
Research paper: empirical research, testing of a model.
Keywords: synergy, core competence, value chain, M&A process, ARCTIC model.
“We have never once bought a company for the company. We buy
companies for excellent people”.
Mark Zuckerberg (CEO of Facebook), at an event in 2010 at Stanford University
1.INTRODUCTION
Acquisitions remain one of the most intriguing and controversial issues in contemporary management
science. The process of a new venture birth from combination of different resources and competences in
acquisition is very intriguing in terms of synergy. In situation, where one or both companies change business
process after acquisition, prediction of synergy and estimation of economic gains from this change has
crucial important. This article looks for interdependence between synergy gain in acquisition process and
core competences used in it from both sides. The aim of this paper is to develop an integrative and more
holistic research model which would help to estimate possible competence-based synergy in acquisition
process. In order to reach the aim the research question has been pondered: how core competences should be
evaluated as sources of synergy in acquisition? Our previous study developed a theoretical framework
ARCTIC which was tested empirically across a sample of twenty five cases of merger, acquisition or joint
venture process were selected and analyzed (Chirjevskis and Joffe, 2007). When it comes to current paper,
three main sources of information were used in this research: business study literature, news media and
company reports. In the beginning of this article, we will explore in-depth sources and types of synergy and
significance of core competence concept for company success before we present ARCTIC model in
application of Facebook acquisition of WhatsApp.
2.LITERATURE REVIEW
2.1.SYNERGY IN ACQUISITION
Synergy effect has been named as a major motive to initiate the process of M&A. This effect is commonly described
as 2+2=5 or according to Rappaport (1998) synergy increasing in competitiveness and resulting cash flows beyond what
the two companies are expected to accomplish independently. Recently a valuable piece of study was provided by
Journal of Business Management, 2015, No.9 ISSN 1691-5348
64
Bauer and Matzler (2014) in those researches on antecedents of M&A success. Seth (1990), Homburg and Bucerius
(2006), King, Slotegraaf and Kesner (2008) identified and resume in their prominent research stream in strategic
management literature that the strategic fit as decisive for M&A success. The central argument of Cartwright and
Schoenberg (2006) is that a high fit enlarges market power and productivity. Researchers Pehrsson (2006) as well as
Stimpert and Duhaime (1997) using the resource based perspective operationalized the construct of fit with product
market, resource, and/or supply chain-related similarity. Meyer and Altenborg (2008) argue that strategic fit is an
indicator for the synergy potential of a transaction. According to Cartwright and Schoenberg, (2006), Bijlsma-Frankema
(2001), Lodorfos and Boateng (2006), Nguyen and Kleiner (2003) one more important factor is cultural incompatibility
or misfit, this is one of the most cited reasons for the low success rates of M&As. Although it seems obvious that
cultural similarity fosters integration and success, there is empirical evidence that cultural differences have a strong
positive impact on synergy and potential realization and, therefore, on value creation as pointed out Cartwright and
Cooper (2001), Schraeder and Self (2003), Teerikangas and Very (2006).
The post merger integration phase is often cited to be decisive for M&A according to Haspeslagh and Jemison
(1991) and Stahl and Voigt (2008). In the post merger integration phase, well-established operational sequences and
patterns are partially or completely changed and, throughout the new company, harmonized as revealed by Haspeslagh
and Jemison (1991) and Buono and Bowditch (2003). Therefore, this phase is due to employee resistance and a cultural
clash, would be very risky. But acquisitions without any integration, resource redeployment and exploitation, as well as
the elimination of redundant resources, are not feasible, it has been found by Homburg and Bucerius (2006); Cording.
Christmann and King (2008); Karim (2006) and Pablo (1994). The study of Angwin (2004) also revealed that speed of
integration can lead to faster exploitation of synergies and to faster returns on investment. What’s more, Angwin (2004)
and Bauer and Matzler (2014) argue that speed leads to a faster exploitation of synergies and returns on investment,
reduces uncertainty among employees, minimizes time spent in a suboptimal condition, and takes advantage of the
momentum in the direct aftermath of a deal. Thus, synergies in acquisition are a function of strategic similarity which
foster internal advantages and relatedness to external settings, cultural fit, and the degree and speed of integration. In
absence of one or more elements, the process will go wrong from the very beginning. What’s more, Devers at al. (2013)
argue that CEOs will make acquisitions when they obtain information suggesting that the combination of their firm and
a target firm offers a firm-specific synergistic opportunity to create value by exploiting one or more common or
complementary resources or capabilities.
2.2 RESOURCES, CAPABILITIES AND CORE COMPETENCES
Study of core competencies is very important in context of this article, as they are very hard to find and
identify correctly, but at the same time lie at the very core of company competitiveness. Core competences
are part of the resource-based theory, so definition of resources is the first step. According to Sirower and
Mark (1997) all assets, capabilities, organizational processes, firm attributes, information, knowledge that
enables the firm to conceive of and implement strategies that improve its effectiveness and efficiency. Roots
of this theory come from Penrose (1959) whose theory of firm growth viewed organizations as bundles of
resources, administered by a certain network of individuals and groups. Later studies of 1980-s and 90-s
gave way to modern resource-based firm theories. Resources can be viewed by categories. For example,
Capron, Dussage and Mitchel (1998) have categorized them into R&D, manufacturing, marketing,
managerial and financial. Scholars Hill and Jones (2001) employ a broader view and divide them into
financial, physical, individual and organizational capital attributes. Grant research (2002) proposes even
easier way of categorization. Grant as a scholar (2002) views all resources as three categories. First –
tangible, financial and physical assets of the company. Then intangible resources – brands, reputation, know-
how and all other types of nonmaterial assets that by the author are much more important and valuable for
most companies than tangible resources. At last, third category is human resources, as abilities, knowledge,
experience and relationships of company employees. This resource type is hardly identifiable and cannot
appear on the balance sheet, but is still crucial for the success of an enterprise. Salter and Weinhold (1979)
specify a resource-based company strategy, when a firm acquires resources that create synergy effect with
resources, already under the control of the acquiring firm. Scholar Arnold (2005) implies that an
extraordinary resource “is one, which when combined with other resources, enables the firm to outperform
competitors and create new value-generating opportunities.
Majority of the authors differ capabilities and competencies from company resources, Hill and Jones
(2001) take different approach and outline “unique strengths that allow a company to achieve superior
efficiency, quality, innovation or customer responsiveness”. Defining core competence is at a core of modern
resource-based approach. Seminal article of Hamel and Prahalad (1990) had issued a brief definition that
core competence is a central value-creating capability of an organization. For these authors “core” is used to
distinguish one, that are fundamental to a company performance and competitiveness. Markides and
Williamson (1993) define core competences of the company as “production function” or catalysts for
efficient exploitation of strategic assets. These three characteristics are very important in usage of
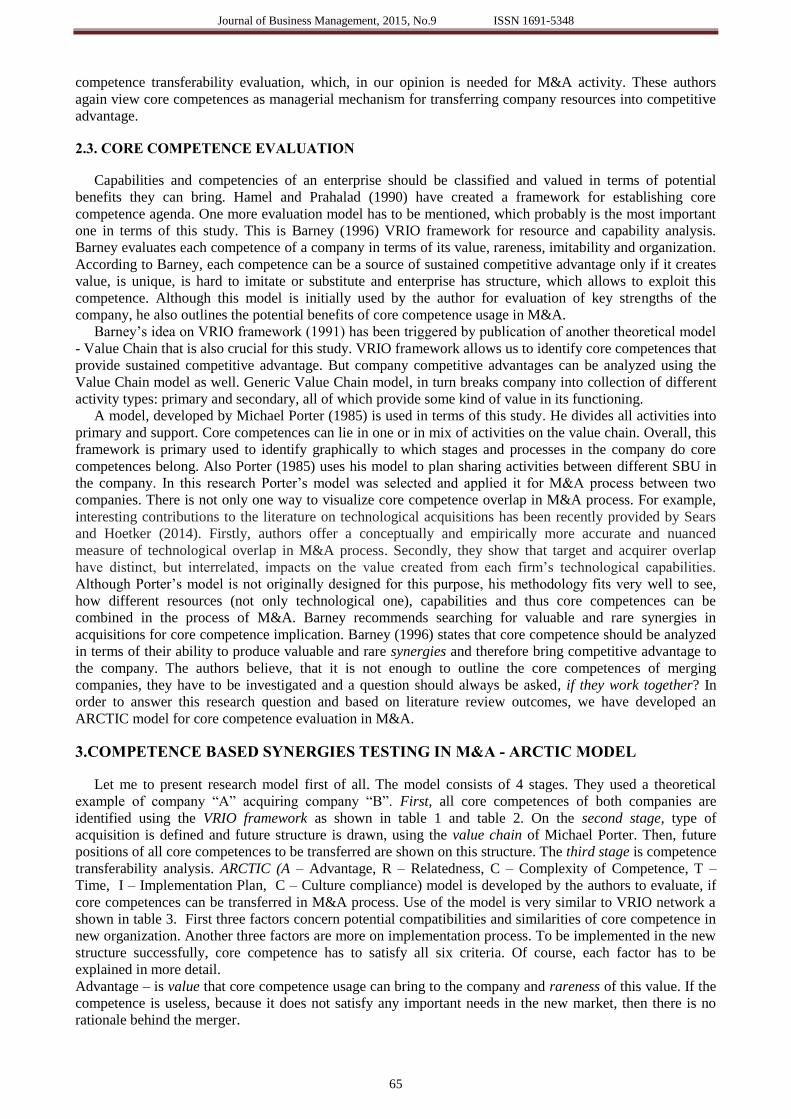
Journal of Business Management, 2015, No.9 ISSN 1691-5348
65
competence transferability evaluation, which, in our opinion is needed for M&A activity. These authors
again view core competences as managerial mechanism for transferring company resources into competitive
advantage.
2.3. CORE COMPETENCE EVALUATION
Capabilities and competencies of an enterprise should be classified and valued in terms of potential
benefits they can bring. Hamel and Prahalad (1990) have created a framework for establishing core
competence agenda. One more evaluation model has to be mentioned, which probably is the most important
one in terms of this study. This is Barney (1996) VRIO framework for resource and capability analysis.
Barney evaluates each competence of a company in terms of its value, rareness, imitability and organization.
According to Barney, each competence can be a source of sustained competitive advantage only if it creates
value, is unique, is hard to imitate or substitute and enterprise has structure, which allows to exploit this
competence. Although this model is initially used by the author for evaluation of key strengths of the
company, he also outlines the potential benefits of core competence usage in M&A.
Barney’s idea on VRIO framework (1991) has been triggered by publication of another theoretical model
- Value Chain that is also crucial for this study. VRIO framework allows us to identify core competences that
provide sustained competitive advantage. But company competitive advantages can be analyzed using the
Value Chain model as well. Generic Value Chain model, in turn breaks company into collection of different
activity types: primary and secondary, all of which provide some kind of value in its functioning.
A model, developed by Michael Porter (1985) is used in terms of this study. He divides all activities into
primary and support. Core competences can lie in one or in mix of activities on the value chain. Overall, this
framework is primary used to identify graphically to which stages and processes in the company do core
competences belong. Also Porter (1985) uses his model to plan sharing activities between different SBU in
the company. In this research Porter’s model was selected and applied it for M&A process between two
companies. There is not only one way to visualize core competence overlap in M&A process. For example,
interesting contributions to the literature on technological acquisitions has been recently provided by Sears
and Hoetker (2014). Firstly, authors offer a conceptually and empirically more accurate and nuanced
measure of technological overlap in M&A process. Secondly, they show that target and acquirer overlap
have distinct, but interrelated, impacts on the value created from each firm’s technological capabilities.
Although Porter’s model is not originally designed for this purpose, his methodology fits very well to see,
how different resources (not only technological one), capabilities and thus core competences can be
combined in the process of M&A. Barney recommends searching for valuable and rare synergies in
acquisitions for core competence implication. Barney (1996) states that core competence should be analyzed
in terms of their ability to produce valuable and rare synergies and therefore bring competitive advantage to
the company. The authors believe, that it is not enough to outline the core competences of merging
companies, they have to be investigated and a question should always be asked, if they work together? In
order to answer this research question and based on literature review outcomes, we have developed an
ARCTIC model for core competence evaluation in M&A.
3.COMPETENCE BASED SYNERGIES TESTING IN M&A - ARCTIC MODEL
Let me to present research model first of all. The model consists of 4 stages. They used a theoretical
example of company “A” acquiring company “B”. First, all core competences of both companies are
identified using the VRIO framework as shown in table 1 and table 2. On the second stage, type of
acquisition is defined and future structure is drawn, using the value chain of Michael Porter. Then, future
positions of all core competences to be transferred are shown on this structure. The third stage is competence
transferability analysis. ARCTIC (A – Advantage, R – Relatedness, C – Complexity of Competence, T –
Time, I – Implementation Plan, C – Culture compliance) model is developed by the authors to evaluate, if
core competences can be transferred in M&A process. Use of the model is very similar to VRIO network a
shown in table 3. First three factors concern potential compatibilities and similarities of core competence in
new organization. Another three factors are more on implementation process. To be implemented in the new
structure successfully, core competence has to satisfy all six criteria. Of course, each factor has to be
explained in more detail.
Advantage – is value that core competence usage can bring to the company and rareness of this value. If the
competence is useless, because it does not satisfy any important needs in the new market, then there is no
rationale behind the merger.
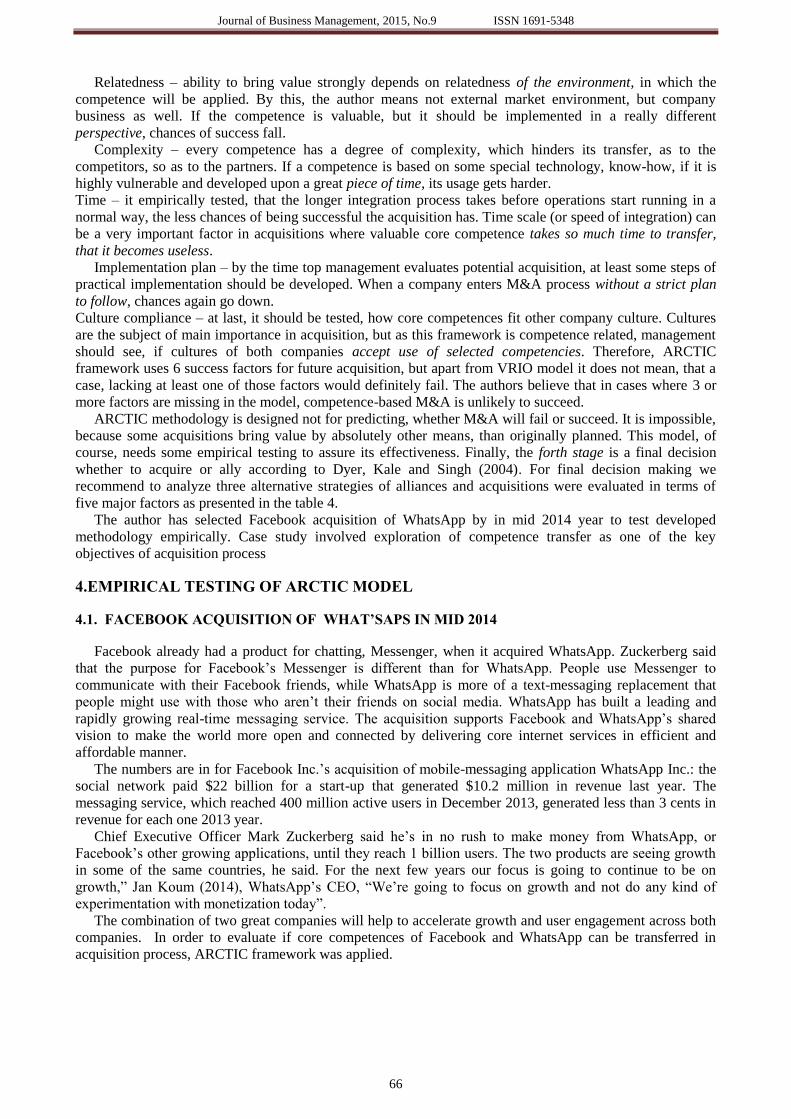
Journal of Business Management, 2015, No.9 ISSN 1691-5348
66
Relatedness – ability to bring value strongly depends on relatedness of the environment, in which the
competence will be applied. By this, the author means not external market environment, but company
business as well. If the competence is valuable, but it should be implemented in a really different
perspective, chances of success fall.
Complexity – every competence has a degree of complexity, which hinders its transfer, as to the
competitors, so as to the partners. If a competence is based on some special technology, know-how, if it is
highly vulnerable and developed upon a great piece of time, its usage gets harder.
Time – it empirically tested, that the longer integration process takes before operations start running in a
normal way, the less chances of being successful the acquisition has. Time scale (or speed of integration) can
be a very important factor in acquisitions where valuable core competence takes so much time to transfer,
that it becomes useless.
Implementation plan – by the time top management evaluates potential acquisition, at least some steps of
practical implementation should be developed. When a company enters M&A process without a strict plan
to follow, chances again go down.
Culture compliance – at last, it should be tested, how core competences fit other company culture. Cultures
are the subject of main importance in acquisition, but as this framework is competence related, management
should see, if cultures of both companies accept use of selected competencies. Therefore, ARCTIC
framework uses 6 success factors for future acquisition, but apart from VRIO model it does not mean, that a
case, lacking at least one of those factors would definitely fail. The authors believe that in cases where 3 or
more factors are missing in the model, competence-based M&A is unlikely to succeed.
ARCTIC methodology is designed not for predicting, whether M&A will fail or succeed. It is impossible,
because some acquisitions bring value by absolutely other means, than originally planned. This model, of
course, needs some empirical testing to assure its effectiveness. Finally, the forth stage is a final decision
whether to acquire or ally according to Dyer, Kale and Singh (2004). For final decision making we
recommend to analyze three alternative strategies of alliances and acquisitions were evaluated in terms of
five major factors as presented in the table 4.
The author has selected Facebook acquisition of WhatsApp by in mid 2014 year to test developed
methodology empirically. Case study involved exploration of competence transfer as one of the key
objectives of acquisition process
4.EMPIRICAL TESTING OF ARCTIC MODEL
4.1. FACEBOOK ACQUISITION OF WHAT’SAPS IN MID 2014
Facebook already had a product for chatting, Messenger, when it acquired WhatsApp. Zuckerberg said
that the purpose for Facebook’s Messenger is different than for WhatsApp. People use Messenger to
communicate with their Facebook friends, while WhatsApp is more of a text-messaging replacement that
people might use with those who aren’t their friends on social media. WhatsApp has built a leading and
rapidly growing real-time messaging service. The acquisition supports Facebook and WhatsApp’s shared
vision to make the world more open and connected by delivering core internet services in efficient and
affordable manner.
The numbers are in for Facebook Inc.’s acquisition of mobile-messaging application WhatsApp Inc.: the
social network paid $22 billion for a start-up that generated $10.2 million in revenue last year. The
messaging service, which reached 400 million active users in December 2013, generated less than 3 cents in
revenue for each one 2013 year.
Chief Executive Officer Mark Zuckerberg said he’s in no rush to make money from WhatsApp, or
Facebook’s other growing applications, until they reach 1 billion users. The two products are seeing growth
in some of the same countries, he said. For the next few years our focus is going to continue to be on
growth,” Jan Koum (2014), WhatsApp’s CEO, “We’re going to focus on growth and not do any kind of
experimentation with monetization today”.
The combination of two great companies will help to accelerate growth and user engagement across both
companies. In order to evaluate if core competences of Facebook and WhatsApp can be transferred in
acquisition process, ARCTIC framework was applied.
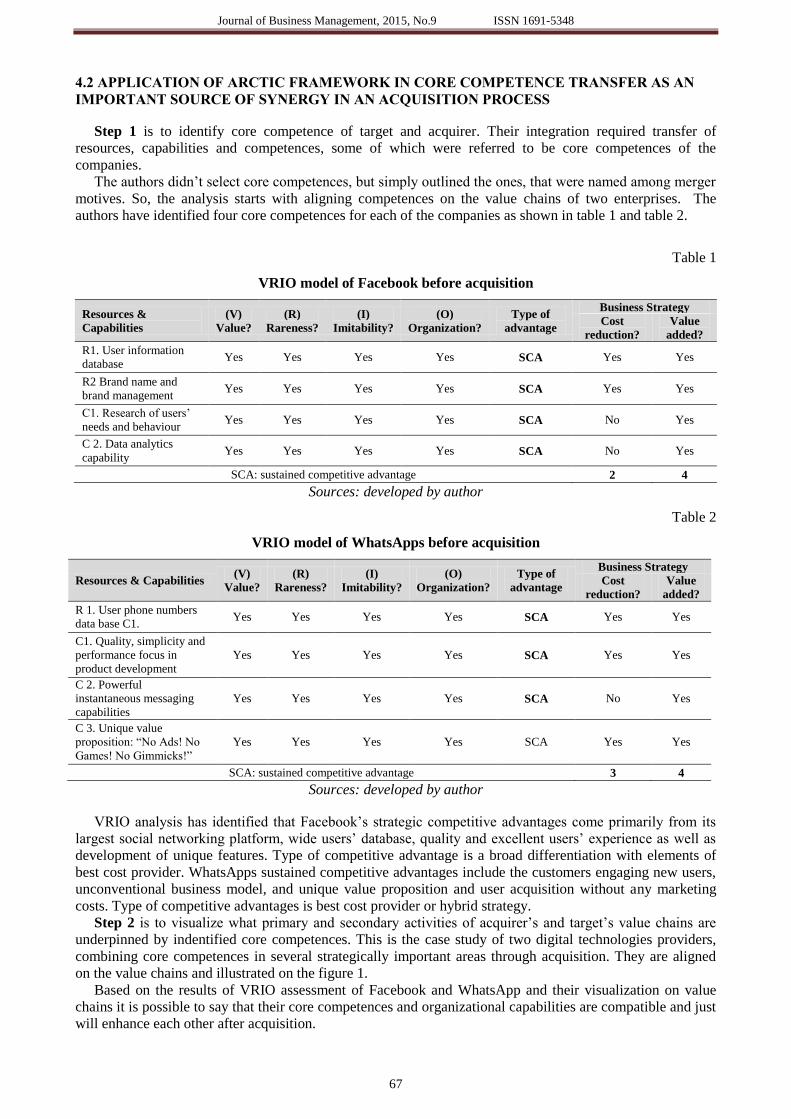
Journal of Business Management, 2015, No.9 ISSN 1691-5348
67
4.2 APPLICATION OF ARCTIC FRAMEWORK IN CORE COMPETENCE TRANSFER AS AN
IMPORTANT SOURCE OF SYNERGY IN AN ACQUISITION PROCESS
Step 1 is to identify core competence of target and acquirer. Their integration required transfer of
resources, capabilities and competences, some of which were referred to be core competences of the
companies.
The authors didn’t select core competences, but simply outlined the ones, that were named among merger
motives. So, the analysis starts with aligning competences on the value chains of two enterprises. The
authors have identified four core competences for each of the companies as shown in table 1 and table 2.
Table 1
VRIO model of Facebook before acquisition
Resources &
Capabilities
(V)
Value?
(R)
Rareness?
(I)
Imitability?
(O)
Organization?
Type of
advantage
Business Strategy
Cost
reduction?
Value
added?
R1. User information
database Yes Yes Yes Yes SCA Yes Yes
R2 Brand name and
brand management Yes Yes Yes Yes SCA Yes Yes
C1. Research of users’
needs and behaviour Yes Yes Yes Yes SCA No Yes
C 2. Data analytics
capability Yes Yes Yes Yes SCA No Yes
SCA: sustained competitive advantage 2 4
Sources: developed by author
Table 2
VRIO model of WhatsApps before acquisition
Resources & Capabilities (V)
Value?
(R)
Rareness?
(I)
Imitability?
(O)
Organization?
Type of
advantage
Business Strategy
Cost
reduction?
Value
added?
R 1. User phone numbers
data base C1. Yes Yes Yes Yes SCA Yes Yes
C1. Quality, simplicity and
performance focus in
product development
Yes Yes Yes Yes SCA Yes Yes
C 2. Powerful
instantaneous messaging
capabilities
Yes Yes Yes Yes SCA No Yes
C 3. Unique value
proposition: “No Ads! No
Games! No Gimmicks!”
Yes Yes Yes Yes SCA Yes Yes
SCA: sustained competitive advantage 3 4
Sources: developed by author
VRIO analysis has identified that Facebook’s strategic competitive advantages come primarily from its
largest social networking platform, wide users’ database, quality and excellent users’ experience as well as
development of unique features. Type of competitive advantage is a broad differentiation with elements of
best cost provider. WhatsApps sustained competitive advantages include the customers engaging new users,
unconventional business model, and unique value proposition and user acquisition without any marketing
costs. Type of competitive advantages is best cost provider or hybrid strategy.
Step 2 is to visualize what primary and secondary activities of acquirer’s and target’s value chains are
underpinned by indentified core competences. This is the case study of two digital technologies providers,
combining core competences in several strategically important areas through acquisition. They are aligned
on the value chains and illustrated on the figure 1.
Based on the results of VRIO assessment of Facebook and WhatsApp and their visualization on value
chains it is possible to say that their core competences and organizational capabilities are compatible and just
will enhance each other after acquisition.
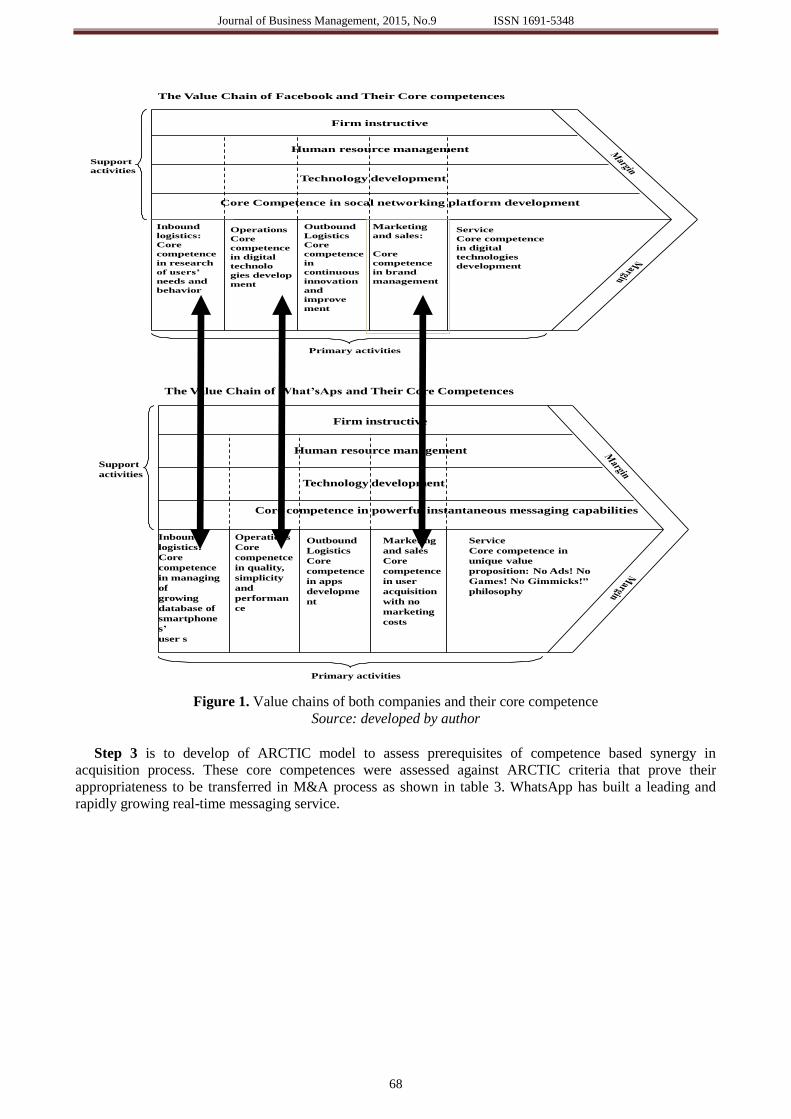
Journal of Business Management, 2015, No.9 ISSN 1691-5348
68
The Value Chain of Facebook and Their Core competences
Firm instructive
Human resource management
Core Competence in socal networking platform development
Operations
Core
competence
in digital
technolo
gies develop
ment
Outbound
Logistics
Core
competence
in
continuous
innovation
and
improve
ment
Service
Core competence
in digital
technologies
development
Support
activities
Primary activities
Marketing
and sales:
Core
competence
in brand
management
Technology development
Inbound
logistics:
Core
competence
in research
of users’
needs and
behavior
The Value Chain of What’sAps and Their Core Competences
Firm instructive
Human resource management
Technology development
Operations
Core
compenetce
in quality,
simplicity
and
performan
ce
Outbound
Logistics
Core
competence
in apps
developme
nt
Marketing
and sales
Core
competence
in user
acquisition
with no
marketing
costs
Service
Core competence in
unique value
proposition: No Ads! No
Games! No Gimmicks!”
philosophy
Support
activities
Primary activities
Inbound
logistics:
Core
competence
in managing
of
growing
database of
smartphone
s’
user s
Core competence in powerful instantaneous messaging capabilities
Figure 1. Value chains of both companies and their core competence
Source: developed by author
Step 3 is to develop of ARCTIC model to assess prerequisites of competence based synergy in
acquisition process. These core competences were assessed against ARCTIC criteria that prove their
appropriateness to be transferred in M&A process as shown in table 3. WhatsApp has built a leading and
rapidly growing real-time messaging service.

Journal of Business Management, 2015, No.9 ISSN 1691-5348
69
Table 3
ARCTIC Model for evaluation of competence – based synergies (Facebook acquisition of WhatsApps)
Core competence Advantage?
(A)
Relatedness?
(R)
Lack of
Complexity?
(C)
Time of
integration?
(T)
Implementation
plan? (I)
Culture
compliance?
(C)
FB Core competence in
research of users’ needs
and behavior
Yes
Yes
Yes
Yes
Yes
Yes
FB Core competence in
digital technologies
development
Yes
Yes
Yes
Yes
Yes
Yes
FB Core competence in
social platform
development
Yes
Yes
Yes
Yes
Yes
Yes
FB Core competence in
unique features
development
Yes
Yes
Yes
Yes
Yes
Yes
FB Core competence in
continuous innovation
and improvement
No
Yes
Yes
Yes
Yes
Yes
FB Core competence in
brand management
Yes
Yes
Yes
Yes
Yes
Yes
WA Core competence in
apps development
Yes
Yes
Yes
Yes
Yes
Yes
WA Core competence in
focused product
development
Yes
Yes
Yes
Yes
Yes
Yes
WA Core competence in
unique value
proposition: “No Ads!
No Games! No
Gimmicks!”
Yes
No
No
Yes
Yes
No
WA Core competence in
user acquisition with no
marketing costs
Yes
No
No
Yes
No
No
WA Core competence in
continuous innovation
and improvement
No
Yes
Yes
Yes
Yes
Yes
Source: developed by author
The acquisition supports Facebook and WhatsApp’s shared vision to make the world more open and
connected by delivering core internet services in efficient and affordable manner. The combination of two
great companies will help to accelerate growth and user engagement across both companies.
Step 4 is choosing by between acquisition and alliance. Facebook has spent $19 billion for WhatsApp
acquisition and further plans to keep it operating independently without any changes. Spending this
considerable amount of money, but with minimal integration raises the question of why a less expensive
strategic alliance was not chosen by Facebook. For example, via the alliance a smaller investment could
actually accomplish the same alignment, but including less risk. Moreover, the important alliance benefit that
it first provides in looking before leaping. However, taking into account the existing gap in product portfolio,
new market opportunities as well as competitive pressures Facebook has reasonably taken the aggressive
action of WhatsApp acquisition.
This allowed purchasing fast growing app and gaining control over a major competitor that somebody
else could have acquired. And the analysis below supports this decision. According to the framework of
Dyer et al. (2004) for deciding whether to acquire or ally, three alternative strategies of alliances and
acquisition were evaluated in terms of five major factors as presented in the table 4. Taking into account the
kind of resources companies plan to combine, the types of synergies they expect, and the market and
competitive factors they face, it is justified for Facebook to acquire WhatsApp instead of entering strategic
alliance with it. It is supported by all five Dyer’s factors.
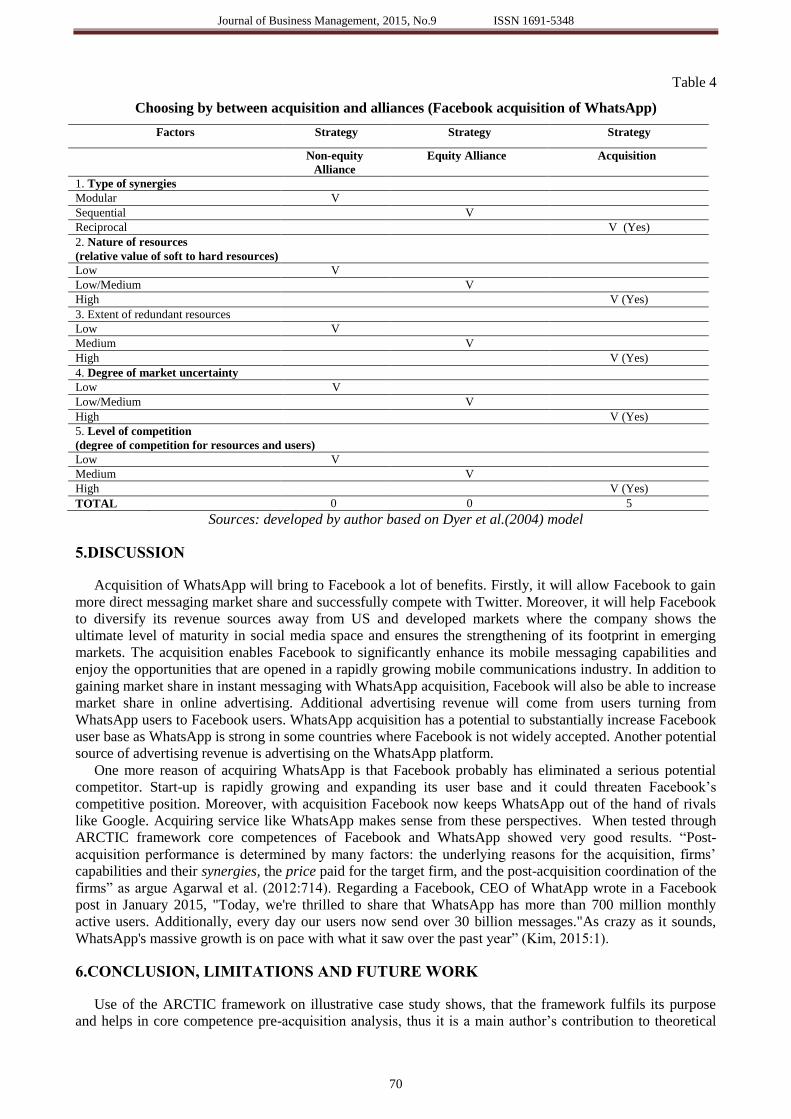
Journal of Business Management, 2015, No.9 ISSN 1691-5348
70
Table 4
Choosing by between acquisition and alliances (Facebook acquisition of WhatsApp)
Factors Strategy Strategy Strategy
Non-equity
Alliance
Equity Alliance Acquisition
1. Type of synergies
Modular V
Sequential V
Reciprocal V (Yes)
2. Nature of resources
(relative value of soft to hard resources)
Low V
Low/Medium V
High V (Yes)
3. Extent of redundant resources
Low V
Medium V
High V (Yes)
4. Degree of market uncertainty
Low V
Low/Medium V
High V (Yes)
5. Level of competition
(degree of competition for resources and users)
Low V
Medium V
High V (Yes)
TOTAL 0 0 5
Sources: developed by author based on Dyer et al.(2004) model
5.DISCUSSION
Acquisition of WhatsApp will bring to Facebook a lot of benefits. Firstly, it will allow Facebook to gain
more direct messaging market share and successfully compete with Twitter. Moreover, it will help Facebook
to diversify its revenue sources away from US and developed markets where the company shows the
ultimate level of maturity in social media space and ensures the strengthening of its footprint in emerging
markets. The acquisition enables Facebook to significantly enhance its mobile messaging capabilities and
enjoy the opportunities that are opened in a rapidly growing mobile communications industry. In addition to
gaining market share in instant messaging with WhatsApp acquisition, Facebook will also be able to increase
market share in online advertising. Additional advertising revenue will come from users turning from
WhatsApp users to Facebook users. WhatsApp acquisition has a potential to substantially increase Facebook
user base as WhatsApp is strong in some countries where Facebook is not widely accepted. Another potential
source of advertising revenue is advertising on the WhatsApp platform.
One more reason of acquiring WhatsApp is that Facebook probably has eliminated a serious potential
competitor. Start-up is rapidly growing and expanding its user base and it could threaten Facebook’s
competitive position. Moreover, with acquisition Facebook now keeps WhatsApp out of the hand of rivals
like Google. Acquiring service like WhatsApp makes sense from these perspectives. When tested through
ARCTIC framework core competences of Facebook and WhatsApp showed very good results. “Post-
acquisition performance is determined by many factors: the underlying reasons for the acquisition, firms’
capabilities and their synergies, the price paid for the target firm, and the post-acquisition coordination of the
firms” as argue Agarwal et al. (2012:714). Regarding a Facebook, CEO of WhatApp wrote in a Facebook
post in January 2015, "Today, we're thrilled to share that WhatsApp has more than 700 million monthly
active users. Additionally, every day our users now send over 30 billion messages."As crazy as it sounds,
WhatsApp's massive growth is on pace with what it saw over the past year” (Kim, 2015:1).
6.CONCLUSION, LIMITATIONS AND FUTURE WORK
Use of the ARCTIC framework on illustrative case study shows, that the framework fulfils its purpose
and helps in core competence pre-acquisition analysis, thus it is a main author’s contribution to theoretical

Journal of Business Management, 2015, No.9 ISSN 1691-5348
71
and practical issues of the topic of the paper. However, there are several limitations to use of the model.
First, as many strategic evaluation models it is subjective, because not necessary bases on exact numbers.
The model does not have a purpose of exact indications, but the author believes that use of different
information sources and careful analysis lower the subjectivity problem. Second limitation to framework
would be that it does not use all the factors, affecting core competence transfer. The authors tried to group
factors into larger group, for example, combining manageability, level of technology into complexity. A
third and a very important limitation is that ARCTIC framework views competences at the time of merger
and evaluates their potential in a way they are built. Sometimes receiving synergy requires elevating,
combining and creating new competences.
Overall, after evaluation and several limitations to the framework, proposed by the author, it may be
stated that: six factor framework ARCTIC allows to make preliminary evaluation of core competences as
sources of synergy in acquisitions. Our research question aimed to understand how core competences should
be evaluated as sources of synergy in acquisition/alliance? The answer to this question can be also
represented not only as different models of analysis given in Table 1,2,3,4 and Figure 1 but also as a logical
structure of competitive advantage as a product of competences based synergy in merger and acquisition
process given in Figure 2 .
The author believes that new model should be helpful to mangers facing mergers and acquisitions, as well
as to management academic specialists, studying this area. ARCTIC model further development is necessary.
The author suggests further empirical testing on illustrative case studies and possible development of
methodology for evaluation of all six factors. Our main contribution - ARCTIC model embedded in five step
process given in Figure 2, lay out also a conceptual framework for our future works adding step 5 and
checking competence based synergy outcomes. At last, new competence creation in M&A, as well as
competence leveraging and transformation are important issues, as in the context of already developed
models of strategic management, so as beyond of it.
Figure 2. Conceptual framework of sustained competitive advantages as a product of competence base
synergy in M&A process
Source: developed by author
ACKNOWLEDGEMENT
I am indebted to Lev Joffe, Manager at Monitor Deloitte, Management Consulting, Seattle, Washington in
USA for his insightful ideas provided in the construct of ARCTIC model. I would like to thank Yuliia
Fashchuk and Iuliia Shkurko for their research assistance, data collection and analyses for this paper. The
article’s preparation would not have been possible without their excellent cooperation. The research
supported by the National Research Program 5.2. “Economic Transformation, Smart Growth, Governance
and Legal Framework for the State and Society for Sustainable Development - a New Approach to the
Creation of a Sustainable Learning Community (EKOSOC-LV)”.
Step 1 • Identify core competence of target and acquirer on VRIO models
Step 2
•Visualize on Value Chains what primary and secondary activities of acquirer and target are underpinned by indentified core competences
Step 3
•Develop of ARCTIC model to assess prerequisites of competence based synergy in acquisition process
Step 4 •Choose between acquisition and alliance by analyzing of Dyer's factors
Step 5
•Assess post acquiaition performance as a result of competence based synergy
•Create new core competences by leveraging, recombining and transforming resources
Result •Sustain competetive advantage of merging company
Journal of Business Management, 2015, No.9 ISSN 1691-5348
72
REFERENCES
1. Angwin, D. (2004), Speed in M&A integration: the first 100 days, European Management Journal, 22(4), 418–
430.
2. Agarwal, R., Anand, J., Bercovitz, J., Croson, R. (2012), Spillover across organizational architectures: the role of
prior resource allocation and communication in post-acquisition coordination outcomes, Strategic Management
Journal, 33, 710-733.
3. Arnold, G. (2005), Corporate Financial Management, Harlow: Prentice Hall.
4. Barney, J. B. (1991). Firm resources and sustained competitive advantage. Journal of Management, 17, 99–120.
5. Barney, J. B. (1996), Gaining and sustaining competitive advantage, USA: Addison Wesley
6. Barton, Leonard (1992), Core capabilities and core rigidities: A paradox in managing new product development,
Strategic Management Journal, 13(S), 111-125
7. Bauer, F.& Matzler, K. (2014), Antecedents on M&A success: the role of strategic complementary, cultural fit, and
degree and speed on integration, Strategic Management Journal, 35, 269–291
8. Bijlsma-Frankema, K. (2001), On managing cultural integration and cultural change processes in mergers and
acquisitions. Journal of European Industrial Training, 25(2/3/4), 192–207.
9. Buono, A.F. &, Bowditch, J.L. (2003), The Human Side of Mergers and Acquisitions – Managing Collisions
between People, Cultures and Organizations. Beard Books: Washington, DC.
10. Capron, L., Dussage P. & Mitchel, W. (1998), Resource redeployment following horizontal acquisitions in Europe
and North America, 1988 – 1992, Strategic Management Journal, 19 (7), 631 – 661.
11. Cartwright, S. & Cooper, G,L. (2001). Managing Mergers, Acquisitions and Strategic Alliances - Integrating
People and Cultures. Butterworth-Heinemann: Oxford, UK.
12. Cartwright, S. & Schoenberg, R. (2006), Thirty years of mergers and acquisitions research: recent advances and
future opportunities, British Journal of Management, 17(S1), S1–S5.
13. Chirjevskis, A. & Joffe, L. (2007), How to create competence based synergy in M&A? The Icfai Journal of
Mergers & Acquisitions, Vol. IV, No. 1.
14. Cording, M., Christmann, P. & King, D. (2008), Reducing causal ambiguity in acquisition integration: intermediate
goals as mediators of integration decisions and acquisition performance. Academy of Management Journal, 51(4),
744–767.
15. Devers, C.E., McNamara, G., Haleblian, J., Yoder, M. (2013), Do they walk the talk? Gauging acquisition CEO
and director confidence in the value creation potential of announced acquisitions. Academy of Management
Journal, 6, 1679-1702.
16. Dyer, J. H., Kale P. & Singh H. (2004), When to Ally and When to Acquire, Harvard Business Review.
17. Frier, S. (2014), Facebook $22 Billion WhatsApp Deal Buys $10 Million in Sales, available at:
http://www.bloomberg.com/news/articles/2014-10-28/facebook-s-22-billion-whatsapp-deal-buys-10-million-in-
sales (accessed: 03 May 2015)
18. Grant, R. (2002), Contemporary Strategy Analysis: Concepts, Techniques, Applications, UK: Blackwell Business.
19. Haspeslagh, P. & Jemison, D.B. (1991), Managing Acquisitions. The Free Press: New York.
20. Hill, Ch. & Jones, G. (2001), Strategic management – an integrated approach, Boston: Houghton Mifflin.
21. Homburg, C & Bucerius, M. (2006), Is speed of integration really a success factor of mergers and acquisitions? An
analysis of the role of internal and external relatedness, Strategic Management Journal, 27, 347–367
22. Karim, S. (2006), Modularity in organizational structure: the reconfiguration of internally developed and acquired
business units, Strategic Management Journal, 27(9), 799–823.
23. Kim, E (2015). WhatsApp's Insane Growth Continues: 100 Million New Users in 4 Months. Available at:
http://www.businessinsider.in/WhatsApps-Insane-Growth-Continues-100-Million-New-Users-in-4-
Months/articleshow/45786867.cms (accessed: 03 May 2015)
24. King, D.R., Slotegraaf, R.J. & Kesner, I. (2008), Performance implications of firm resource interactions in the
acquisition of R&D-intensive firms, Organization Science, 19(2), 327–340.
25. Lodorfos, G. & Boateng, A. (2006), The role of culture in the merger and acquisition process: evidence from the
European chemical industry, Management Decision, 44(10), 1405–1421.
26. Markides, C. C. & Williamson P. J. (1993), Corporate diversification and organizational structure: A resource-
based view, Working Paper, London Business School.
27. Meyer, C.B. & Altenborg, E. (2008), Incompatible strategies in international mergers: the failed merger between
Telia and Telenor, Journal of International Business Studies, 39(3), 508–525.
28. Nguyen, H, & Kleiner, B.H. (2003), The effective management of mergers, Leadership and Organization
Development Journal, 24(8), 447–454.
29. Pablo, A.L. (1994), Determinants of acquisition integration level: a decision-making perspective, Academy of
Management Journal, 37(4), 803–836.
30. Pehrsson, A. (2006). Business relatedness and performance: a study of managerial perceptions, Strategic
Management Journal, 27(3), 265–282.
31. Penrose, E. T. (1959), A theory of the growth of the firm, Oxford: Basil Blackwell
32. Porter, M. E. (1985), Competitive advantage, New York: Free Press.
33. Prahalad, C. K. & Hamel G. (1990), The core competence of organization, Harvard Business Review, May – June,
79 – 93.
Journal of Business Management, 2015, No.9 ISSN 1691-5348
73
34. Rappaport, A. (1998), Creating Shareholder Value, New York: Free Press.
35. Salter, M. & Weinhold, W. (1979), Diversification through acquisition: Strategies for creating economic value,
New York: Free Press.
36. Schraeder, M. & Self, D. R. (2003), Enhancing the success of mergers and acquisitions: an organizational culture
perspective, Management Decision, 41(5), 511–522.
37. Sears, J & Hoetker, G. (2014), Technological overlap, technical capabilities and resource recombination in
technological acquisition, Strategic Management Journal, 35, 48-67.
38. Seth, A. (1990), Value creation in acquisitions: A re-examination of performance issues. Strategic Management
Journal, 11(2): 99–115.
39. Sirower, M. L. (1997), The synergy trap: how companies lose the acquisition game, New York: The Free Press.
40. Stahl, G.K. & Voigt, A. (2008), Do cultural differences matter in mergers and acquisitions? A tentative model and
examination, Organization Science, 19(1), 160–176.
41. Stimpert, J.L. & Duhaime, I. M. (1997), In the eyes of the beholder: conceptualization of relatedness held by the
managers of larger diversified firms, Strategic Management Journal, 18(2), 111–125.
42. Teerikangas, S. & Very. P. (2006), The culture-performance relationship in M&A; From Yes/No to How, British
Journal of Management, 17, 31–48.
Journal of Business Management, 2015, No.9 ISSN 1691-5348
74
OPTIMAL RISK/RETURN TRADE-OFF
OF THE 2ND PILLAR PENSION PLANS IN LATVIA
Jurijs Mihailovs
Citadele Bank, Latvia, 2A Republikas Laukums, Riga, LV-1010, Latvia
e-mail: [email protected]
Ilmars Kreituss
RISEBA University, 3 Meza Street, Riga, LV-1048, Latvia
e-mail: [email protected]
ABSTRACT
The 2nd
pension pillar in Latvia started to operate in 2001 but systematic quantitative research of all pension plans still
has not done. There are 21 pension plans in 2nd
pillar and participants always arise a question – which pension plan
better to choose.
The aim of this research is to make a quantitative analysis of all 2nd
pension pillar pension plans and define the best
ones for participants with high, medium and low risk tolerance.
The general statistical analysis of the 2nd
pillar pension system has done to bring out the risk/return ratio of each pension
plan, the holding period return, the assets over participant ratio and the growth speed of the system in the last five years.
Markowitz method of optimization is used to determine the optimal risk/return situation in active, balanced and
conservative investment plans and identify the best pension plans by its strategy. The risks and returns of each pension
plan were evaluated and compared to the several benchmarks. To test the people’s knowledge about their pension plans,
the survey was carried out and compared with the viewpoint of professionals.
It was found that there is a large disproportion between the optimal allocation of 2nd
pension funds and the actual
investment structure. Lack of knowledge of the general public about pension plans was identified. Practical
recommendations for pension plan participants have worked out in each risk category, depending on person’s risk
appetite.
Key words: pension funds, 2nd
pension pillar, Markowitz model, optimal risk/return ratio
1.INTRODUCTION
Latvia is one of the first countries in Central and Eastern Europe, launched a multi-level pension scheme.
A similar scheme has also been introduced in Sweden, Poland and Italy. Pension reform started in 1996,
when the parliament supported the concept of pension reform. The Law on State Pensions, which provided
implementation of 1st pension pillar came into force in 1996 and in 1998 entered into force the Law on
Private Pension Funds (3rd
pillar). The operation of the 2nd
pension pillar started in 2001 with the entry into
force of State Funded Pensions Act (State Funded Pensions Act, 2001).
The 3-pillar pension system in Latvia is quite new and it is still very hard for the private persons to aware
that every member of a pension plan now is an investor. When young adults start their business carriers, they
are often struck by a simple yet very difficult question, which 2nd
pillar pension plan to choose? All citizens
need to have a concise and impartial review on the whole pension system to maximize the efficiency and
returns on their investments. It is important to find the right pension plan provider and the right pension
plan. Timmerman (2014) shows that using a personalized search process can help to conduct a successful
provider. The assessment of performance of state-funded pension plans is quite important to the state to
ensure effective operation of pension system. Unfortunately systematic quantitative research of performance
of all 2nd
pension plans still has not done.
The goal of the current research is to analyze the current situation in the 2nd pillar pension plan system in
Latvia, to carry out quantitative analysis of all investment plans of 2nd
pension pillar and define the most
favourable pension plans for the participants with a high, medium and low risk tolerance. To make a right
option of offered pension plans and further application of appropriate life cycle strategy ensures optimal
performance. Antolín, Payet and J. Yermo (2010) showed that maintaining a constant exposure to risky
assets during most of the accumulation period, switching swiftly to bonds in the last decade before retirement
seem to produce adequate results. They provide higher expected benefits for a given level of risk than other
life cycle strategies.
To ensure correct assessment of pension plans the statistical analysis of all 2nd
pillar pension plans is
carried out, the risk/return ratio of each pension plan, the holding period return, the assets over participant
ratio and the growth speed of the system is found out. The 5-year period has chosen for analysis to cover the

Journal of Business Management, 2015, No.9 ISSN 1691-5348
75
same period of all 21 now existing 2nd
pillar pension plans. This research follows a purely quantitative
method of analysis using statistical and risk management techniques to make conclusions and provide
guidelines for participants of the 2nd
pillar pension plans. Markowitz model of optimization is used to
determine the optimal risk/return ratio in each risk category of investment plans and identify the best-
performing pension plans.
In addition, the survey is carried out to test the people’s knowledge about their pension plans. The
viewpoint of professionals was found out as well in in-depth interviews and both compared with real
situation.
2.STRUCTURE AND OPERATION OF PENSION SYSTEM
According to Fabozzi (2001) there are two basic and widely used types of pension plans: defined
contribution (DC) plans and defined benefits (DB) plans. In a DC plan, the plan sponsor is responsible only
for making specified contributions into the plan on behalf of qualifying participant. In a DB plan, the plan
sponsor agrees to make specified payments to qualifying employees at retirement. Clark and Urwin (2011)
point out that nowadays DB pension plans are mostly replaced by DC pension plans in OECD countries. In
some cases, this is the result of the closure of DB plans (e.g., the UK) whereas in other countries the
dominance of DC plans reflects the evolution of industry structure, employment practices and regulation
(e.g., the US) (Clark and Urwin, 2011).
Pension system in Latvia is based on DC pension plans as well. Pension capital is funded by regular
payments as a certain percentage of individual’s salary (State Funded Pensions Act, 2001). Pension system
reform in Latvia was developed 1994.-1995. (Ministry of welfare, 1996) and realized since 1996 (Zilite,
2000). The system includes a state compulsory unfunded pension scheme as the 1st pillar pension, a state
funded pension scheme as the 2nd
pillar pension and a 3rd
pillar that is a private voluntary pension scheme.
The pillars are thought to protect the system’s participants from demographical and financial risks associated
with retirement fund management. The pension system serves as both “obligatory (1st and 2
nd pillars) and
voluntary (3rd
pillar)” (State Funded Pensions Act, 2001) demand for retirement fund savings. It combines
both individual interests of people to save money for retirement and the solidarity for the elderly participants.
The main idea behind the pension system is that if a participant makes “bigger contributions to the system –
the larger the retirement fund he will accumulate during his life.
The 1st pension pillar is a state compulsory unfunded or non-accumulated pension scheme (Latvijas
Centralais depozitarijs, 2015). The contributions to this pillar are made through a social security tax that is
deducted from a person’s gross salary. The funds that have been paid by the existing workforce are divided
between the workers themselves and the actual generation of pensioners. This pension pillar follows the
logic of social security contributions – as longer the participant is working and paying social taxes as bigger
the state unfunded pension he will receive by the time of his retirement (Latvijas Centralais depozitarijs,
2015). To become a member of the 1st pillar pension an individual should have worked at least 10 years in a
paid employment (State Funded Pensions Act, 2001).
The 2nd
pillar pension started to operate after 1st of July 2001 when the State Funded Pensions Act
entered into force and some part of the social contributions was allocated for investments in capital markets.
These actions provide the possibility for capital gains of the existing pool of funds in the pension system.
The objective of the 2nd
pillar is to increase the value of the retirement funds over time by growing capital
and investing. The growth of the value of the personal retirement fund provides larger repayments as well as
increasing the overall amount of the pension. The main goal of the 2nd
pillar pension is to provide “a faster-
then-inflation growth of the invested funds” (Latvijas Centralais depozitarijs, 2015). The contributions to the
2nd
pillar pension are obligatory if a participant is born after 1st of July 1971 and are made automatically
from the gross salary of the participant who is paying social tax (State Funded Pensions Act, 2001).
Participant of 2nd
pillar pension system do not have to make additional social insurance payments. Total
amount of payments for retirement capital (20% from gross income) is constant and is divided in two parts:
for 1st
pillar pension and for 2nd
pillar pension. The proportion between 1st
and for 2nd
pillar is defined by law.
The part of 2nd
pillar has varied from 2% to 8 % since 2001, and now, in 2015, it is 5% (SSIA, 2013). The 3rd
pillar pension is a pension scheme that provides a possibility for participants to accumulate and grow their
additional retirement savings on voluntary bases. The aim of this pillar is to increase the potential gains and
the volume of retirement savings of a given participant. It means that in addition to the state’s 1st and 2nd
pillar pension the 3rd pillar pension participant may receive additional funds (Latvijas Centralais
depozitarijs, 2015).
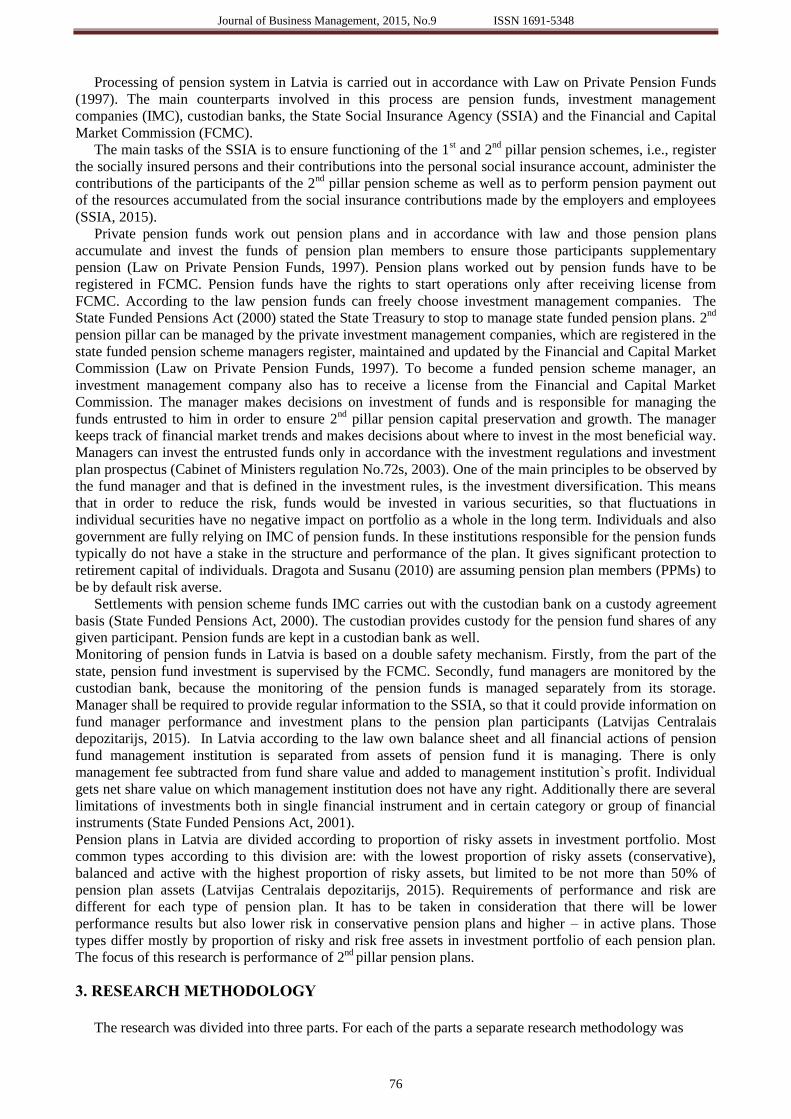
Journal of Business Management, 2015, No.9 ISSN 1691-5348
76
Processing of pension system in Latvia is carried out in accordance with Law on Private Pension Funds
(1997). The main counterparts involved in this process are pension funds, investment management
companies (IMC), custodian banks, the State Social Insurance Agency (SSIA) and the Financial and Capital
Market Commission (FCMC).
The main tasks of the SSIA is to ensure functioning of the 1st and 2
nd pillar pension schemes, i.e., register
the socially insured persons and their contributions into the personal social insurance account, administer the
contributions of the participants of the 2nd
pillar pension scheme as well as to perform pension payment out
of the resources accumulated from the social insurance contributions made by the employers and employees
(SSIA, 2015).
Private pension funds work out pension plans and in accordance with law and those pension plans
accumulate and invest the funds of pension plan members to ensure those participants supplementary
pension (Law on Private Pension Funds, 1997). Pension plans worked out by pension funds have to be
registered in FCMC. Pension funds have the rights to start operations only after receiving license from
FCMC. According to the law pension funds can freely choose investment management companies. The
State Funded Pensions Act (2000) stated the State Treasury to stop to manage state funded pension plans. 2nd
pension pillar can be managed by the private investment management companies, which are registered in the
state funded pension scheme managers register, maintained and updated by the Financial and Capital Market
Commission (Law on Private Pension Funds, 1997). To become a funded pension scheme manager, an
investment management company also has to receive a license from the Financial and Capital Market
Commission. The manager makes decisions on investment of funds and is responsible for managing the
funds entrusted to him in order to ensure 2nd
pillar pension capital preservation and growth. The manager
keeps track of financial market trends and makes decisions about where to invest in the most beneficial way.
Managers can invest the entrusted funds only in accordance with the investment regulations and investment
plan prospectus (Cabinet of Ministers regulation No.72s, 2003). One of the main principles to be observed by
the fund manager and that is defined in the investment rules, is the investment diversification. This means
that in order to reduce the risk, funds would be invested in various securities, so that fluctuations in
individual securities have no negative impact on portfolio as a whole in the long term. Individuals and also
government are fully relying on IMC of pension funds. In these institutions responsible for the pension funds
typically do not have a stake in the structure and performance of the plan. It gives significant protection to
retirement capital of individuals. Dragota and Susanu (2010) are assuming pension plan members (PPMs) to
be by default risk averse.
Settlements with pension scheme funds IMC carries out with the custodian bank on a custody agreement
basis (State Funded Pensions Act, 2000). The custodian provides custody for the pension fund shares of any
given participant. Pension funds are kept in a custodian bank as well.
Monitoring of pension funds in Latvia is based on a double safety mechanism. Firstly, from the part of the
state, pension fund investment is supervised by the FCMC. Secondly, fund managers are monitored by the
custodian bank, because the monitoring of the pension funds is managed separately from its storage.
Manager shall be required to provide regular information to the SSIA, so that it could provide information on
fund manager performance and investment plans to the pension plan participants (Latvijas Centralais
depozitarijs, 2015). In Latvia according to the law own balance sheet and all financial actions of pension
fund management institution is separated from assets of pension fund it is managing. There is only
management fee subtracted from fund share value and added to management institution`s profit. Individual
gets net share value on which management institution does not have any right. Additionally there are several
limitations of investments both in single financial instrument and in certain category or group of financial
instruments (State Funded Pensions Act, 2001).
Pension plans in Latvia are divided according to proportion of risky assets in investment portfolio. Most
common types according to this division are: with the lowest proportion of risky assets (conservative),
balanced and active with the highest proportion of risky assets, but limited to be not more than 50% of
pension plan assets (Latvijas Centralais depozitarijs, 2015). Requirements of performance and risk are
different for each type of pension plan. It has to be taken in consideration that there will be lower
performance results but also lower risk in conservative pension plans and higher – in active plans. Those
types differ mostly by proportion of risky and risk free assets in investment portfolio of each pension plan.
The focus of this research is performance of 2nd
pillar pension plans.
3. RESEARCH METHODOLOGY
The research was divided into three parts. For each of the parts a separate research methodology was

Journal of Business Management, 2015, No.9 ISSN 1691-5348
77
used.
In the first part the collection of secondary data was carried out through the download of daily values of
each pension plan on the manapensija.lv domain (Latvijas Centralais depozitarijs, 2015). To cover the same
almost 5-year period of all now existing pension plans the downloaded information spans from 2nd
of
February 2009, when the last of the 21 current pension plans started its operations, till 19th of December
2014. The daily prices of the investment plans have been converted to weekly by taking every 5th price of the
distribution, as the pension plans do not evaluate their shares on weekends and holidays. All in all secondary
data counts 6237 weekly prices of the investment plans and 6216 weekly continuous returns. In order to
analyze the secondary data, general statistical functions, such as continuous returns, average of continuous
returns (mean expected return), standard deviation of continuous returns (expected risk), holding period
returns, holding period yields, growth and risk/return calculations have been used. Applying these
calculations to the benchmarks gave the perspective tendencies of the 2nd
pillar pension plans to the general
market.
In the second part of the research the secondary data from the first part was analyzed using the mean-
variance model (Bodie, Kane and Marcus, 2014). The risks and returns of each pension plan were evaluated
and compared to the several benchmarks. The following analysis procedures were carried out:
Evaluation of the General statistics of the pension plan by its strategy. The General statistics include
Expected returns, Risk, Risk/Return ratio, Holding period return and Holding period yield.
Evaluation of the average weights of each of the above mentioned financial indices.
Construction of the covariance matrix using the MS Excel available data analysis tools and the
calculated daily holding period yields of each pension plan.
Minimization of the variance of the portfolio of pension plans by strategy in order to achieve the
minimal variance portfolio.
Maximization of expected return of the portfolio of pension plans by strategy in order to achieve the
target return portfolio.
Maximization of the slope to the efficient frontier enabled evaluation of the best performing
investment plan by percent’s in the portfolio weights.
All six steps mentioned above were used to determine the best performing investment plan by strategy.
In the third part of the research the survey was carried out to test the people’s knowledge about their
pension plans. In order to achieve statistically significant results 521 random people was surveyed in the age
of 18 to 65. The respondents were asked to answer 4 simple questions elaborating on their age, 2nd pillar
pension plan that they enlisted for, the expected annual return on their contributions to the plan and the
probable risk of losing a portion of their investments. To compare the opinion of ordinary people to
professional one, the same questions were asked in in-depth interviews to 5 professionals from banking
sector.
GENERAL STATISTICAL REVIEW OF THE 2ND
PILLAR PENSION PLANS
During almost the 5-year period from the inception date of the last of now present investment plans
(02.02.2009) to the end of 2014 the 2nd pillar pension system in Latvia according with the publically
available information (Latvijas Centralais depozitarijs, 2015) has grown significantly (see Table 1.).
Table 1
Growth of the 2nd
pillar pension system from 2009 till 2014 Category Date Change
02/02/2009 19/12/2014
PARTICIPANTS 1 074 549 1 249 433 +16.3%
ASSETS, EUR 707 730 335 1 989 125 470 +181%
SHARE PRICE (average) 1.62127 2.18358 +34.7%
ASSETS/PARTICIPANTS 658.63 1 592.01 +142%
Source: Latvijas Centralais depozitarijs (2015)
For the past 5 years the number of 2nd
pension pillar participants has increased by 16%, meaning that
workforce and the general labour climate has improved in Latvia. The assets under management have almost
tripled over 5 years. However the increase of 35% in 1 share price of all pension plan portfolios have
lowered the rate of generating of these shares in the pension accounts. An increase of 142% in assets under
management (AUM) over participants is a major improvement in the expected return of these portfolios.
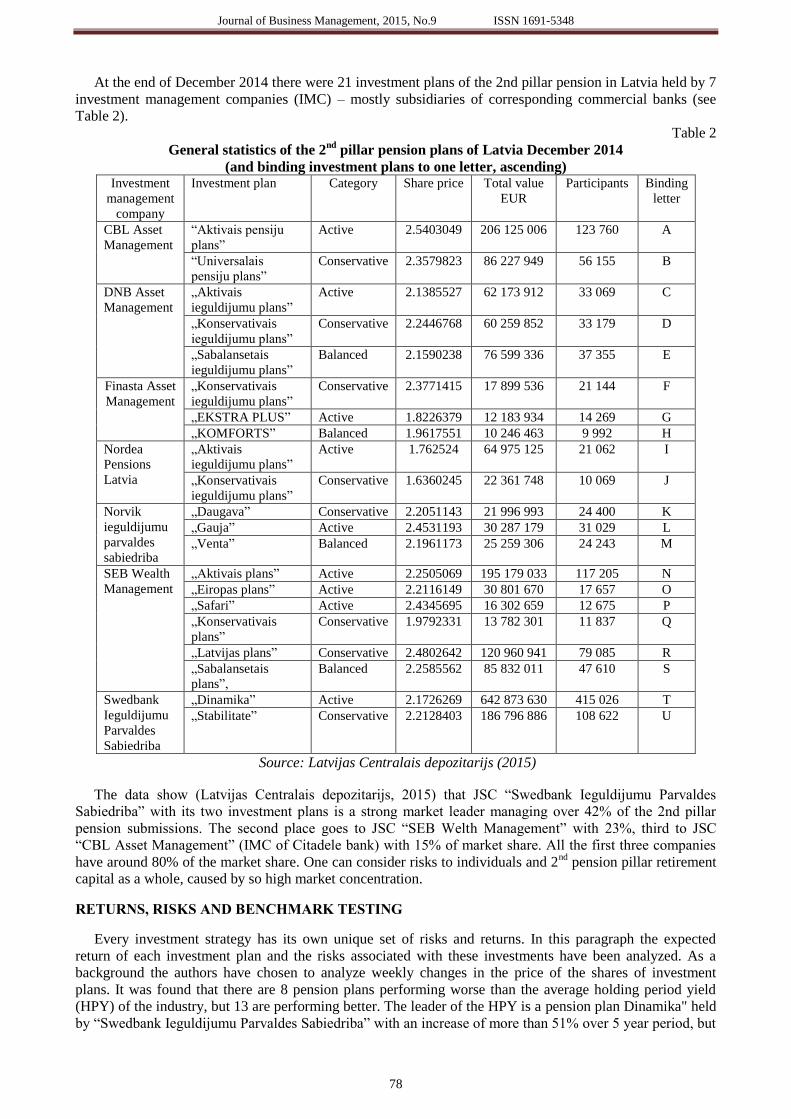
Journal of Business Management, 2015, No.9 ISSN 1691-5348
78
At the end of December 2014 there were 21 investment plans of the 2nd pillar pension in Latvia held by 7
investment management companies (IMC) – mostly subsidiaries of corresponding commercial banks (see
Table 2).
Table 2
General statistics of the 2nd
pillar pension plans of Latvia December 2014 (and binding investment plans to one letter, ascending)
Investment
management
company
Investment plan Category Share price Total value
EUR
Participants Binding
letter
CBL Asset
Management
“Aktivais pensiju
plans”
Active 2.5403049 206 125 006 123 760 A
“Universalais
pensiju plans”
Conservative 2.3579823 86 227 949 56 155 B
DNB Asset
Management
„Aktivais
ieguldijumu plans”
Active 2.1385527 62 173 912 33 069 C
„Konservativais
ieguldijumu plans”
Conservative 2.2446768 60 259 852 33 179 D
„Sabalansetais
ieguldijumu plans”
Balanced 2.1590238 76 599 336 37 355 E
Finasta Asset
Management
„Konservativais
ieguldijumu plans”
Conservative 2.3771415 17 899 536 21 144 F
„EKSTRA PLUS” Active 1.8226379 12 183 934 14 269 G
„KOMFORTS” Balanced 1.9617551 10 246 463 9 992 H
Nordea
Pensions
Latvia
„Aktivais
ieguldijumu plans”
Active 1.762524 64 975 125 21 062 I
„Konservativais
ieguldijumu plans”
Conservative 1.6360245 22 361 748 10 069 J
Norvik
ieguldijumu
parvaldes
sabiedriba
„Daugava” Conservative 2.2051143 21 996 993 24 400 K
„Gauja” Active 2.4531193 30 287 179 31 029 L
„Venta” Balanced 2.1961173 25 259 306 24 243 M
SEB Wealth
Management
„Aktivais plans” Active 2.2505069 195 179 033 117 205 N
„Eiropas plans” Active 2.2116149 30 801 670 17 657 O
„Safari” Active 2.4345695 16 302 659 12 675 P
„Konservativais
plans”
Conservative 1.9792331 13 782 301 11 837 Q
„Latvijas plans” Conservative 2.4802642 120 960 941 79 085 R
„Sabalansetais
plans”,
Balanced 2.2585562 85 832 011 47 610 S
Swedbank
Ieguldijumu
Parvaldes
Sabiedriba
„Dinamika” Active 2.1726269 642 873 630 415 026 T
„Stabilitate” Conservative 2.2128403 186 796 886 108 622 U
Source: Latvijas Centralais depozitarijs (2015)
The data show (Latvijas Centralais depozitarijs, 2015) that JSC “Swedbank Ieguldijumu Parvaldes
Sabiedriba” with its two investment plans is a strong market leader managing over 42% of the 2nd pillar
pension submissions. The second place goes to JSC “SEB Welth Management” with 23%, third to JSC
“CBL Asset Management” (IMC of Citadele bank) with 15% of market share. All the first three companies
have around 80% of the market share. One can consider risks to individuals and 2nd
pension pillar retirement
capital as a whole, caused by so high market concentration.
RETURNS, RISKS AND BENCHMARK TESTING
Every investment strategy has its own unique set of risks and returns. In this paragraph the expected
return of each investment plan and the risks associated with these investments have been analyzed. As a
background the authors have chosen to analyze weekly changes in the price of the shares of investment
plans. It was found that there are 8 pension plans performing worse than the average holding period yield
(HPY) of the industry, but 13 are performing better. The leader of the HPY is a pension plan Dinamika" held
by “Swedbank Ieguldijumu Parvaldes Sabiedriba” with an increase of more than 51% over 5 year period, but
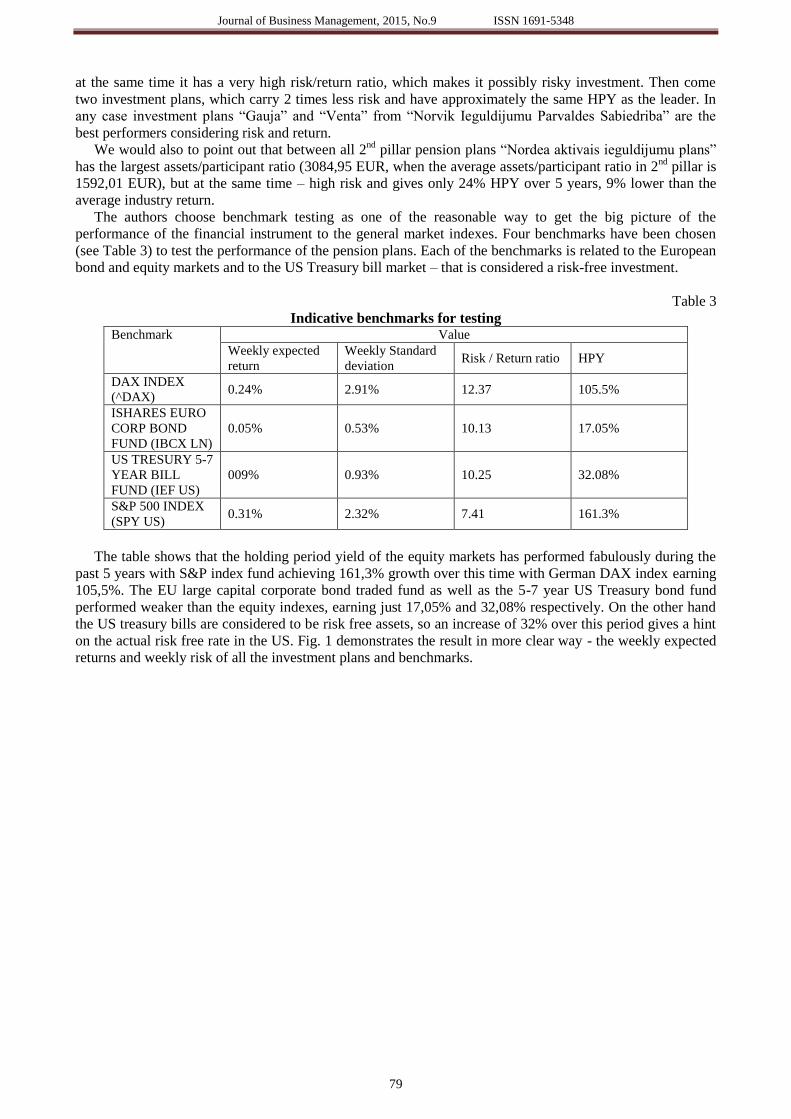
Journal of Business Management, 2015, No.9 ISSN 1691-5348
79
at the same time it has a very high risk/return ratio, which makes it possibly risky investment. Then come
two investment plans, which carry 2 times less risk and have approximately the same HPY as the leader. In
any case investment plans “Gauja” and “Venta” from “Norvik Ieguldijumu Parvaldes Sabiedriba” are the
best performers considering risk and return.
We would also to point out that between all 2nd
pillar pension plans “Nordea aktivais ieguldijumu plans”
has the largest assets/participant ratio (3084,95 EUR, when the average assets/participant ratio in 2nd
pillar is
1592,01 EUR), but at the same time – high risk and gives only 24% HPY over 5 years, 9% lower than the
average industry return.
The authors choose benchmark testing as one of the reasonable way to get the big picture of the
performance of the financial instrument to the general market indexes. Four benchmarks have been chosen
(see Table 3) to test the performance of the pension plans. Each of the benchmarks is related to the European
bond and equity markets and to the US Treasury bill market – that is considered a risk-free investment.
Table 3
Indicative benchmarks for testing Benchmark Value
Weekly expected
return
Weekly Standard
deviation Risk / Return ratio HPY
DAX INDEX
(^DAX) 0.24% 2.91% 12.37 105.5%
ISHARES EURO
CORP BOND
FUND (IBCX LN)
0.05% 0.53% 10.13 17.05%
US TRESURY 5-7
YEAR BILL
FUND (IEF US)
009% 0.93% 10.25 32.08%
S&P 500 INDEX
(SPY US) 0.31% 2.32% 7.41 161.3%
The table shows that the holding period yield of the equity markets has performed fabulously during the
past 5 years with S&P index fund achieving 161,3% growth over this time with German DAX index earning
105,5%. The EU large capital corporate bond traded fund as well as the 5-7 year US Treasury bond fund
performed weaker than the equity indexes, earning just 17,05% and 32,08% respectively. On the other hand
the US treasury bills are considered to be risk free assets, so an increase of 32% over this period gives a hint
on the actual risk free rate in the US. Fig. 1 demonstrates the result in more clear way - the weekly expected
returns and weekly risk of all the investment plans and benchmarks.
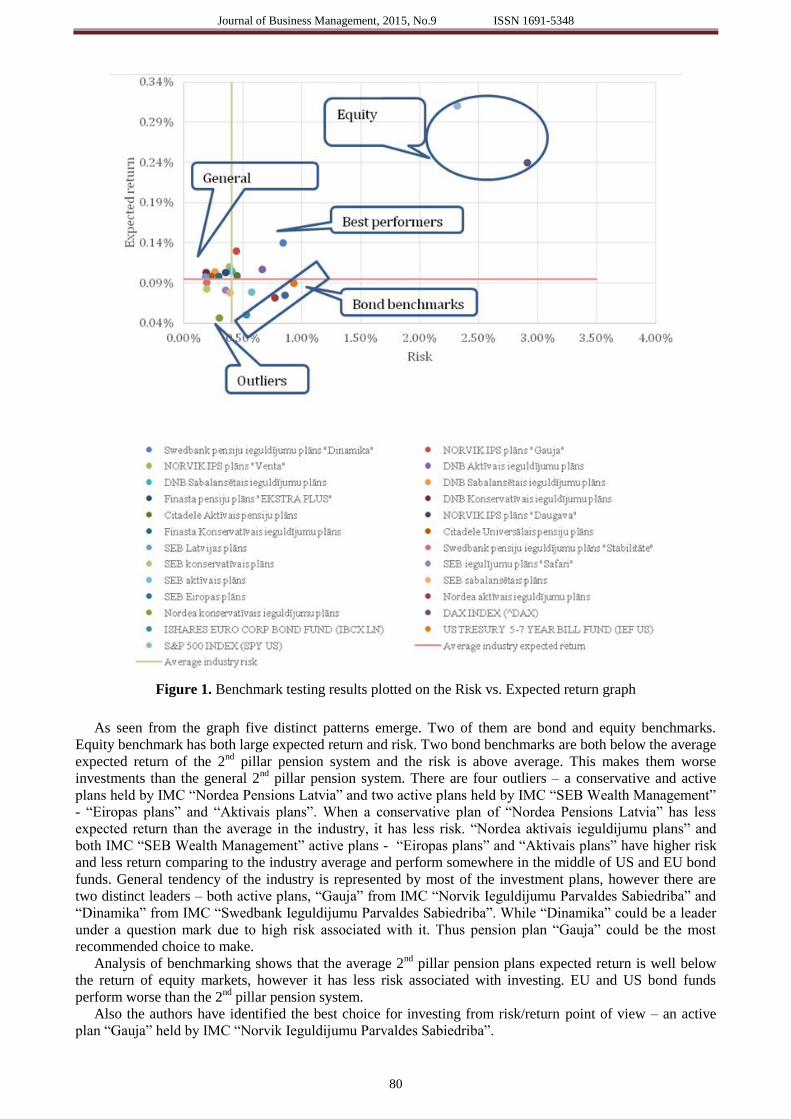
Journal of Business Management, 2015, No.9 ISSN 1691-5348
80
Figure 1. Benchmark testing results plotted on the Risk vs. Expected return graph
As seen from the graph five distinct patterns emerge. Two of them are bond and equity benchmarks.
Equity benchmark has both large expected return and risk. Two bond benchmarks are both below the average
expected return of the 2nd
pillar pension system and the risk is above average. This makes them worse
investments than the general 2nd
pillar pension system. There are four outliers – a conservative and active
plans held by IMC “Nordea Pensions Latvia” and two active plans held by IMC “SEB Wealth Management”
- “Eiropas plans” and “Aktivais plans”. When a conservative plan of “Nordea Pensions Latvia” has less
expected return than the average in the industry, it has less risk. “Nordea aktivais ieguldijumu plans” and
both IMC “SEB Wealth Management” active plans - “Eiropas plans” and “Aktivais plans” have higher risk
and less return comparing to the industry average and perform somewhere in the middle of US and EU bond
funds. General tendency of the industry is represented by most of the investment plans, however there are
two distinct leaders – both active plans, “Gauja” from IMC “Norvik Ieguldijumu Parvaldes Sabiedriba” and
“Dinamika” from IMC “Swedbank Ieguldijumu Parvaldes Sabiedriba”. While “Dinamika” could be a leader
under a question mark due to high risk associated with it. Thus pension plan “Gauja” could be the most
recommended choice to make.
Analysis of benchmarking shows that the average 2nd
pillar pension plans expected return is well below
the return of equity markets, however it has less risk associated with investing. EU and US bond funds
perform worse than the 2nd
pillar pension system.
Also the authors have identified the best choice for investing from risk/return point of view – an active
plan “Gauja” held by IMC “Norvik Ieguldijumu Parvaldes Sabiedriba”.

Journal of Business Management, 2015, No.9 ISSN 1691-5348
81
EVALUATION OF THE INVESTMENT PLANS BY THEIR STRATEGY
This paragraph reviews the research into efficient portfolios of active, balanced and conservative
investment plans. The best investment plan is determined by the percentage weight in the tangency point
portfolio – the greater the percentage – the better.
The table of general statistical data used for evaluation of active investment plans is presented in table 4.
Table 4
General statistics of Active investment plans
A C G I L N O P T
E(r) 0.099% 0.107% 0.103% 0.072% 0.130% 0.078% 0.075% 0.081% 0.140%
σ 0.450% 0.666% 0.352% 0.771% 0.443% 0.572% 0.856% 0354% 0.841%
σ/E(r) 4.5326 6.2363 3.4196 10.750 3.4200 7.3060 11.435 4.3822 6.0283
HPR 1.3417 1.2867 1.3560 1.2366 1.4678 1.2606 1.2480 1.2699 1.5116
HPY 34.17% 28.67% 35.60% 23.66% 46.78% 26.06% 24.80% 26.99% 51.16%
E(r) – weekly expected return; σ – weekly standard deviation; σ/E(r) – Risk-Return ratio; HPR – holding
period return; HPY – holding period yield.
These statistics show that active plans have a greater HPY, yet some of them are lagging behind and have
very high risk/return ratios, such as plan “I” and plan “O”. Plan “T”, has the highest HPY and an average
risk/return ratio. Investment plan “L” is an impressive candidate for being the best active plan, with the
smallest risk/return ratio, yet high HPY.
The author began to construct the joined portfolio of these investment plans to determine, which plan gets
the most percent’s in the optimal scenario. Therefore the covariance matrix was introduced using the data
analysis of the continuous returns of each investment plan. This matrix is the key to the minimization of the
variance of the joined portfolio of investment plans. The variance of the portfolio is calculated through the
multiplication of three matrixes and follows the formula (1):
By changing weights, where the sum of weights equal to 100% and cannot be negative, of the investment
plans in the portfolio the author has optimized the variance of the portfolio to be minimal. In the result the
Global minimal variance portfolio for the active investment plans gave the following percentage distribution
(table 5).
Table 5
Percentage distribution of Global minimal variance portfolio to active investment plans A C G I L N O P T
Weight - - 44.38% - 15.17% - - 40.44% -
This means that if a participator in the 2nd pillar pension fund is willing to be a member of an
active investment plan, but wants to be relatively safe from high volatility of active investments, he
should choose between three plans “G”, “P”, or least favourable “L”.
The Expected return of this portfolio was calculated using the multiplication of Expected return and the
Weights of the portfolio following the formula (2):
As a result the portfolio statistics for the Global minimal variance portfolio for active investment plans
are shown in a table 6.

Journal of Business Management, 2015, No.9 ISSN 1691-5348
82
Table 6
Statistics of the Global minimal variance portfolio of active investment plans Global minimal variance portfolio (active plans)
Variance Portfolio E(r) Portfolio σ σ/E(r)
9.73*10-6
0.098% 0.3119% 3.1830
Another efficient portfolio is introduced to develop the efficient frontier. This portfolio is configured to
be best yielding portfolio with a target return.
Investment plan “T” has the best weekly-expected return, so it will represent the “Target return portfolio”.
This investment idea will suit people, who do not care much about risk, their main goal is to earn as much as
possible.
The statistics for this portfolio will be the same as for the investment plan “T” and are presented below
(Table 7).
Table 7
Another efficient portfolio statistics for active investment plans Another efficient portfolio (active plans)
Variance Portfolio E(r) Portfolio σ σ/E(r)
7.08*10-5
0.14% 0.8415% 6.0283
The Optimal risky portfolio implies another optimization method. This method optimizes the slope to the
efficient frontier, enabling to evaluate the best performing investment plan by percent’s in the portfolio
weights. In order to do so the author has devised a formula (3):
By changing weights, where the sum of weights equal to 100% and cannot be negative, of the investment
plans in the portfolio the slope of CML has been optimized to be maximal. In the result the Optimal risky
portfolio for the active investment plans gave the following percentage distribution.
Table 8
Percentage distribution of Optimal risky portfolio to active investment plans A C G I L N O P T
Weight - - 52.22% - 47.78% - - - -
Investment plans “G” and “L” are the optimal way of investing in the active plans. They deliver both
reasonable return and are optimally balanced in risky situations, therefore being less volatile. As a result the
portfolio statistics for the Optimal risky portfolio for active investment plans are shown in a table 9.
Table 9
Statistics of the Optimal risky portfolio of active investment plans Optimal risky portfolio (active plans)
Slope Variance Portfolio E(r) Portfolio σ σ/E(r)
0.2773 1.16*10-5
0.1157% 0.3409% 2.9472
This leads to the construction of the efficient frontier and plotting these three portfolios on it. The process
of portfolio optimization has been finished by the author, yet there is one more thing to be calculated – the
covariance between the Global minimal variance portfolio and the Another efficient portfolio. The formula
(4) used for calculations is shown below.
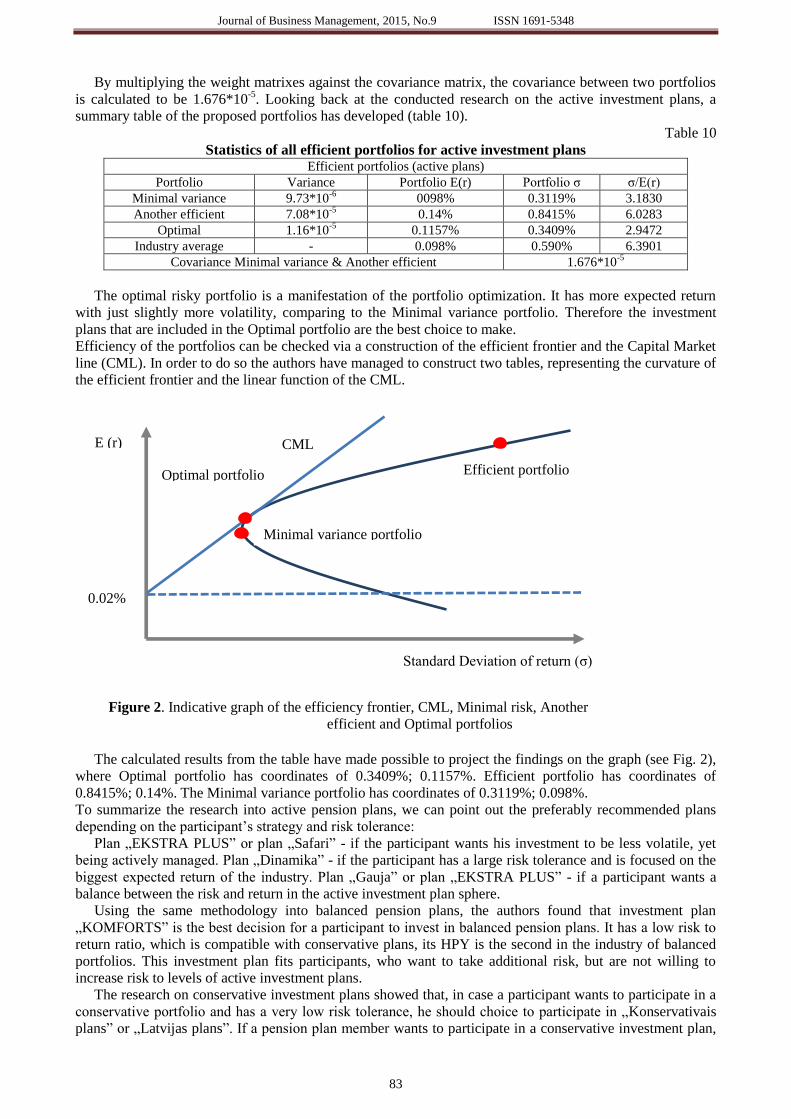
Journal of Business Management, 2015, No.9 ISSN 1691-5348
83
By multiplying the weight matrixes against the covariance matrix, the covariance between two portfolios
is calculated to be 1.676*10-5
. Looking back at the conducted research on the active investment plans, a
summary table of the proposed portfolios has developed (table 10).
Table 10
Statistics of all efficient portfolios for active investment plans Efficient portfolios (active plans)
Portfolio Variance Portfolio E(r) Portfolio σ σ/E(r)
Minimal variance 9.73*10-6
0098% 0.3119% 3.1830
Another efficient 7.08*10-5
0.14% 0.8415% 6.0283
Optimal 1.16*10-5
0.1157% 0.3409% 2.9472
Industry average - 0.098% 0.590% 6.3901
Covariance Minimal variance & Another efficient 1.676*10-5
The optimal risky portfolio is a manifestation of the portfolio optimization. It has more expected return
with just slightly more volatility, comparing to the Minimal variance portfolio. Therefore the investment
plans that are included in the Optimal portfolio are the best choice to make.
Efficiency of the portfolios can be checked via a construction of the efficient frontier and the Capital Market
line (CML). In order to do so the authors have managed to construct two tables, representing the curvature of
the efficient frontier and the linear function of the CML.
Figure 2. Indicative graph of the efficiency frontier, CML, Minimal risk, Another
efficient and Optimal portfolios
The calculated results from the table have made possible to project the findings on the graph (see Fig. 2),
where Optimal portfolio has coordinates of 0.3409%; 0.1157%. Efficient portfolio has coordinates of
0.8415%; 0.14%. The Minimal variance portfolio has coordinates of 0.3119%; 0.098%.
To summarize the research into active pension plans, we can point out the preferably recommended plans
depending on the participant’s strategy and risk tolerance:
Plan „EKSTRA PLUS” or plan „Safari” - if the participant wants his investment to be less volatile, yet
being actively managed. Plan „Dinamika” - if the participant has a large risk tolerance and is focused on the
biggest expected return of the industry. Plan „Gauja” or plan „EKSTRA PLUS” - if a participant wants a
balance between the risk and return in the active investment plan sphere.
Using the same methodology into balanced pension plans, the authors found that investment plan
„KOMFORTS” is the best decision for a participant to invest in balanced pension plans. It has a low risk to
return ratio, which is compatible with conservative plans, its HPY is the second in the industry of balanced
portfolios. This investment plan fits participants, who want to take additional risk, but are not willing to
increase risk to levels of active investment plans.
The research on conservative investment plans showed that, in case a participant wants to participate in a
conservative portfolio and has a very low risk tolerance, he should choice to participate in „Konservativais
plans” or „Latvijas plans”. If a pension plan member wants to participate in a conservative investment plan,
Efficient portfolio
Standard Deviation of return (σ)
E (r)
0.02%
CML
Optimal portfolio
Minimal variance portfolio

Journal of Business Management, 2015, No.9 ISSN 1691-5348
84
yet is willing to have the highest possible expected return, he should choose the investment plan
„Konservativais ieguldijumu plans” In order to achieve a balanced risk/return scenario the participant should
choose between investment plans „Latvijas plans”, „Konservativais ieguldijumu plans” or „Daugava”.
Investment plans “Universalais pensiju plans” and „Konservativais ieguldijumu plans” are outsiders of
conservative plan category, having the worst risk/return ratios, therefore having no representation in the
percentage distribution in any of the optimization processes.
VIEWPOINT ON 2ND
PILLAR PENSION PLANS
Pension system in Latvia is quite new, and it is important to understand how close to the real situation is
the evaluation of the risks and returns of pension plans by ordinary participants and compare it with the view
of the professionals and the real situation.
The survey showed real lack of knowledge of participants. 50, 48% of 521 respondent, taking part in the
survey, did not even know in which pension plan they are enlisted in. Thus we observe different pension plan
participant behaviour in Latvia. It was shown by Ballester (2014) that “in Spanish, European and
International markets a positive, significant relationship between pension plan flows and return, risk adjusted
return takes place. Participants make significant contributions to plans that have achieved high returns in the
past while the contributions and transfers to plans with poorer returns are smaller and less significant. The
legal status of the management company also has a significant effect on the monetary input into the pension
plans”. Participants pay increased attention to performance of pension plans during the crisis periods. Dushi,
Iams and Tamborini (2013) found that economic downturn had a considerable impact on workers’
participation and contributions to DC plans.
The weighted risk anticipated by the Latvia’s respondents showed a 4.74% standard deviation from mean
of weighted anticipated annual return of 7.18%. Applying the risk/return formula the authors has calculated
the anticipated risk/return ratio of the respondents to be 0.66. This is a strong indicator that respondents are
not aware of the risks that can emerge in investment plans. The Global minimal variance portfolio for
Conservative investment plans has a risk/return ratio almost 3 times higher, than the respondents think.
On the other hand the authors have managed to interview some people working in this industry. The
professionals were asked the same questions and the authors has performed the construction of the efficient
frontier and plotted the efficient portfolios, the real situation portfolio of 2nd pillar pension plans, the
situation as it’s been seen by the general public, the vantage point of the professionals and the optimal
portfolio (see Fig.3.).
Figure 3. The constructed graph of the 2nd
pillar pension plan system, featuring what people and
professionals think and what is the real situation (daily values).
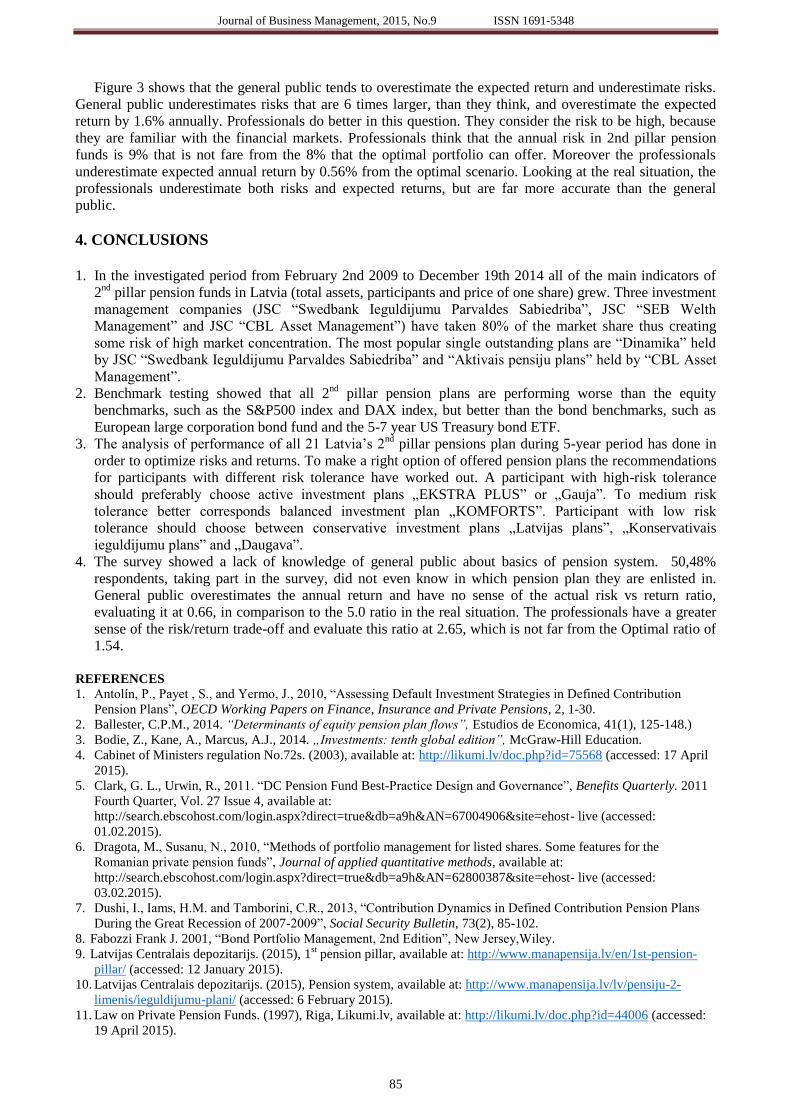
Journal of Business Management, 2015, No.9 ISSN 1691-5348
85
Figure 3 shows that the general public tends to overestimate the expected return and underestimate risks.
General public underestimates risks that are 6 times larger, than they think, and overestimate the expected
return by 1.6% annually. Professionals do better in this question. They consider the risk to be high, because
they are familiar with the financial markets. Professionals think that the annual risk in 2nd pillar pension
funds is 9% that is not fare from the 8% that the optimal portfolio can offer. Moreover the professionals
underestimate expected annual return by 0.56% from the optimal scenario. Looking at the real situation, the
professionals underestimate both risks and expected returns, but are far more accurate than the general
public.
4. CONCLUSIONS
1. In the investigated period from February 2nd 2009 to December 19th 2014 all of the main indicators of
2nd
pillar pension funds in Latvia (total assets, participants and price of one share) grew. Three investment
management companies (JSC “Swedbank Ieguldijumu Parvaldes Sabiedriba”, JSC “SEB Welth
Management” and JSC “CBL Asset Management”) have taken 80% of the market share thus creating
some risk of high market concentration. The most popular single outstanding plans are “Dinamika” held
by JSC “Swedbank Ieguldijumu Parvaldes Sabiedriba” and “Aktivais pensiju plans” held by “CBL Asset
Management”.
2. Benchmark testing showed that all 2nd
pillar pension plans are performing worse than the equity
benchmarks, such as the S&P500 index and DAX index, but better than the bond benchmarks, such as
European large corporation bond fund and the 5-7 year US Treasury bond ETF.
3. The analysis of performance of all 21 Latvia’s 2nd
pillar pensions plan during 5-year period has done in
order to optimize risks and returns. To make a right option of offered pension plans the recommendations
for participants with different risk tolerance have worked out. A participant with high-risk tolerance
should preferably choose active investment plans „EKSTRA PLUS” or „Gauja”. To medium risk
tolerance better corresponds balanced investment plan „KOMFORTS”. Participant with low risk
tolerance should choose between conservative investment plans „Latvijas plans”, „Konservativais
ieguldijumu plans” and „Daugava”.
4. The survey showed a lack of knowledge of general public about basics of pension system. 50,48%
respondents, taking part in the survey, did not even know in which pension plan they are enlisted in.
General public overestimates the annual return and have no sense of the actual risk vs return ratio,
evaluating it at 0.66, in comparison to the 5.0 ratio in the real situation. The professionals have a greater
sense of the risk/return trade-off and evaluate this ratio at 2.65, which is not far from the Optimal ratio of
1.54.
REFERENCES 1. Antolín, P., Payet , S., and Yermo, J., 2010, “Assessing Default Investment Strategies in Defined Contribution
Pension Plans”, OECD Working Papers on Finance, Insurance and Private Pensions, 2, 1-30.
2. Ballester, C.P.M., 2014. “Determinants of equity pension plan flows”, Estudios de Economica, 41(1), 125-148.)
3. Bodie, Z., Kane, A., Marcus, A.J., 2014. „Investments: tenth global edition”, McGraw-Hill Education.
4. Cabinet of Ministers regulation No.72s. (2003), available at: http://likumi.lv/doc.php?id=75568 (accessed: 17 April
2015).
5. Clark, G. L., Urwin, R., 2011. “DC Pension Fund Best-Practice Design and Governance”, Benefits Quarterly. 2011
Fourth Quarter, Vol. 27 Issue 4, available at:
http://search.ebscohost.com/login.aspx?direct=true&db=a9h&AN=67004906&site=ehost- live (accessed:
01.02.2015).
6. Dragota, M., Susanu, N., 2010, “Methods of portfolio management for listed shares. Some features for the
Romanian private pension funds”, Journal of applied quantitative methods, available at:
http://search.ebscohost.com/login.aspx?direct=true&db=a9h&AN=62800387&site=ehost- live (accessed:
03.02.2015).
7. Dushi, I., Iams, H.M. and Tamborini, C.R., 2013, “Contribution Dynamics in Defined Contribution Pension Plans
During the Great Recession of 2007-2009”, Social Security Bulletin, 73(2), 85-102.
8. Fabozzi Frank J. 2001, “Bond Portfolio Management, 2nd Edition”, New Jersey,Wiley.
9. Latvijas Centralais depozitarijs. (2015), 1st pension pillar, available at: http://www.manapensija.lv/en/1st-pension-
pillar/ (accessed: 12 January 2015).
10. Latvijas Centralais depozitarijs. (2015), Pension system, available at: http://www.manapensija.lv/lv/pensiju-2-
limenis/ieguldijumu-plani/ (accessed: 6 February 2015).
11. Law on Private Pension Funds. (1997), Riga, Likumi.lv, available at: http://likumi.lv/doc.php?id=44006 (accessed:
19 April 2015).

Journal of Business Management, 2015, No.9 ISSN 1691-5348
86
12. Ministry of welfare. (1996), "Pensiju sistemas reformas koncepcija", available at: http://www.lm.gov.lv/text/61
(accessed: 17 December 2014).
13. State Social Insurance Agency (SSIA). (2013), available at: http://www.vsaa.lv/lv/services/employees/funded-
pension-scheme (accessed: 12 March 2015).
14. State Social Insurance Agency (SSIA). (2015), available at: http://www.vsaa.lv/en/services/seniors/three-levels-of-
pension-system (accessed: 19 April 2015).
15. State Funded Pensions Act.(2000), Riga, Likumi.lv, available at: http://likumi.lv/doc.php?id=2341 (accessed: 12
April 2015).
16. Timmerman, T., 2014, “A right Way to Find the Right Retirement Plan Provider”, Benefits Quarterly, 4, 34-37.)
17. Zilite, L. (2000), “Pensiju sistema Latvija”, Averss un revers. Vol.4, available at:
https://www.makroekonomika.lv/pensiju-sistema-latvija (accessed: 17 April 2015).

Journal of Business Management, 2015, No.9 ISSN 1691-5348
87
EXPLORATORY STUDY OF E-SERVICES INTRODUCTION IN HEALTH
INDUSTRY
Tatjana Vasiljeva
Riga International School of Economics and Business Administration, Meža street 3, Rīga, Latvia
e-mail: [email protected]
Ingus Sinkovskis
Children’s Clinical University Hospital, Vienības gatve 45, Rīga, Latvia
e-mail: [email protected]
ABSTRACT
Health industry nowadays is experiencing fast growing of various electronic services introduction and wide usage of
Information and Communication Technology (ICT) for health care quality improvement. A number of studies show
increasing interest and necessity for various e-solutions introduction in health industry, such as mobile-health (m-
health), e-health, telemedicine etc. (Al Basheer Al Morshid S, Healy J. C, et al.). In Latvia similar process is occurring
showing that e-health processes and services implementation is one of the most important issues at the vast majority of
hospitals and health care institutions in the Republic of Latvia. The authors of the given research paper have analysed
the situation in relevant hospital in Y2014, conducted the survey amongst medical personnel and gathered data set for
assessment the satisfaction of ICT level by physicians and patients, which could essentially implicate the success of e-
service project introduction. Interpretation of data allowed carry out several recommendations that could be valuable for
similar health care institution management while introducing e-health services or another kind of manual operation
automation at medical institution.
Objective: according to research goal the authors formulated the hypothesis that introducing of various e-health
services at medical institution may substantially increase the satisfaction of the offered services by hospital’ patients
and increase the quality of medical care.
Design/methodology/approaches: critical analysis of literature sources, quantitative analysis and interpretation of the
data gathered by the survey from the Children’s Clinical University Hospital’ doctors, semi-structured interviews and
discussions with the top medical personnel of two biggest hospitals in Latvia.
Practical implications: The research could impact the behaviour of medical institutions’ top management and
stakeholders for better governing and managing e-health services introduction for medical care quality improvement.
Keywords: e-health services, information technology, medical care quality
1.INTRODUCTION
Effective usage of Information and Communication Technology for national health care could achieve the
main goal of creating and delivering well-designed, efficient and easy-accessible health systems. E-health
system should provide the national population of the country improved health services’ quality by ensuring
fast access to the medical specialists in various areas and reducing the time needed for visiting the doctor and
getting the appropriate service. At the same time while developing and implementing e-health system, we
need to respect the human rights of the patients, taking care of their personal data, data about persons’ health
status by following strong procedures and rules in information security area.
Many researchers have investigated different factors that could impact successful introduction of e-health,
such as Capacity – human resources knowledge and skills in ICT area; Infrastructure – access to information
and communication technologies; Enabling environment – policies and strategies to support the information
society, etc. (Dunbar A, et al, 2008). Many authors analyse the business and ICT representatives’
cooperation while introducing new ICT solutions (Silvius, A.J., De Haes, Van Grembergen; Silvius, A. J
Gilbert; Shpilberg, D., et al.; Spremić, M.; Vasiljeva T, Treiguts E.). They have indicated that business
persons’ knowledge and skills in ICT area as well as their equipment with modern ICT devices could
considerable facilitate and ease the introduction of new ICT solution at an enterprise.
We suppose it is the proper time to drill very deep in investigating abovementioned factors and clarify the
situation in our country learning to what extent the medical personnel in the typical hospital in the Republic
of Latvia is ready for wide using of ICT tools and introducing of e-services. To motivate our research the
authors asked two research questions:
Research Question 1: How does ICT environment affect the level of IT literacy of the medical personnel
at particular typical hospital and encourage adults to use their ICT devices and apply ICT skills for
successful introduction of new IT system?
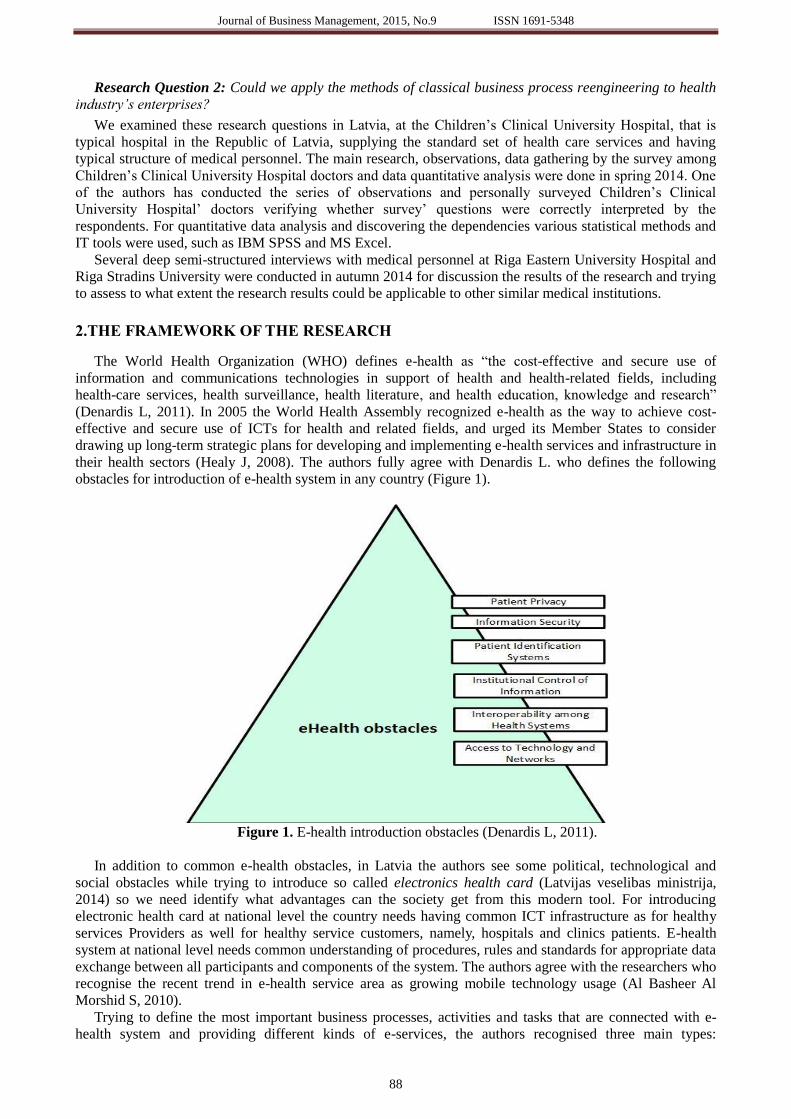
Journal of Business Management, 2015, No.9 ISSN 1691-5348
88
Research Question 2: Could we apply the methods of classical business process reengineering to health
industry’s enterprises?
We examined these research questions in Latvia, at the Children’s Clinical University Hospital, that is
typical hospital in the Republic of Latvia, supplying the standard set of health care services and having
typical structure of medical personnel. The main research, observations, data gathering by the survey among
Children’s Clinical University Hospital doctors and data quantitative analysis were done in spring 2014. One
of the authors has conducted the series of observations and personally surveyed Children’s Clinical
University Hospital’ doctors verifying whether survey’ questions were correctly interpreted by the
respondents. For quantitative data analysis and discovering the dependencies various statistical methods and
IT tools were used, such as IBM SPSS and MS Excel.
Several deep semi-structured interviews with medical personnel at Riga Eastern University Hospital and
Riga Stradins University were conducted in autumn 2014 for discussion the results of the research and trying
to assess to what extent the research results could be applicable to other similar medical institutions.
2.THE FRAMEWORK OF THE RESEARCH
The World Health Organization (WHO) defines e-health as “the cost-effective and secure use of
information and communications technologies in support of health and health-related fields, including
health-care services, health surveillance, health literature, and health education, knowledge and research”
(Denardis L, 2011). In 2005 the World Health Assembly recognized e-health as the way to achieve cost-
effective and secure use of ICTs for health and related fields, and urged its Member States to consider
drawing up long-term strategic plans for developing and implementing e-health services and infrastructure in
their health sectors (Healy J, 2008). The authors fully agree with Denardis L. who defines the following
obstacles for introduction of e-health system in any country (Figure 1).
Figure 1. E-health introduction obstacles (Denardis L, 2011).
In addition to common e-health obstacles, in Latvia the authors see some political, technological and
social obstacles while trying to introduce so called electronics health card (Latvijas veselibas ministrija,
2014) so we need identify what advantages can the society get from this modern tool. For introducing
electronic health card at national level the country needs having common ICT infrastructure as for healthy
services Providers as well for healthy service customers, namely, hospitals and clinics patients. E-health
system at national level needs common understanding of procedures, rules and standards for appropriate data
exchange between all participants and components of the system. The authors agree with the researchers who
recognise the recent trend in e-health service area as growing mobile technology usage (Al Basheer Al
Morshid S, 2010).
Trying to define the most important business processes, activities and tasks that are connected with e-
health system and providing different kinds of e-services, the authors recognised three main types:
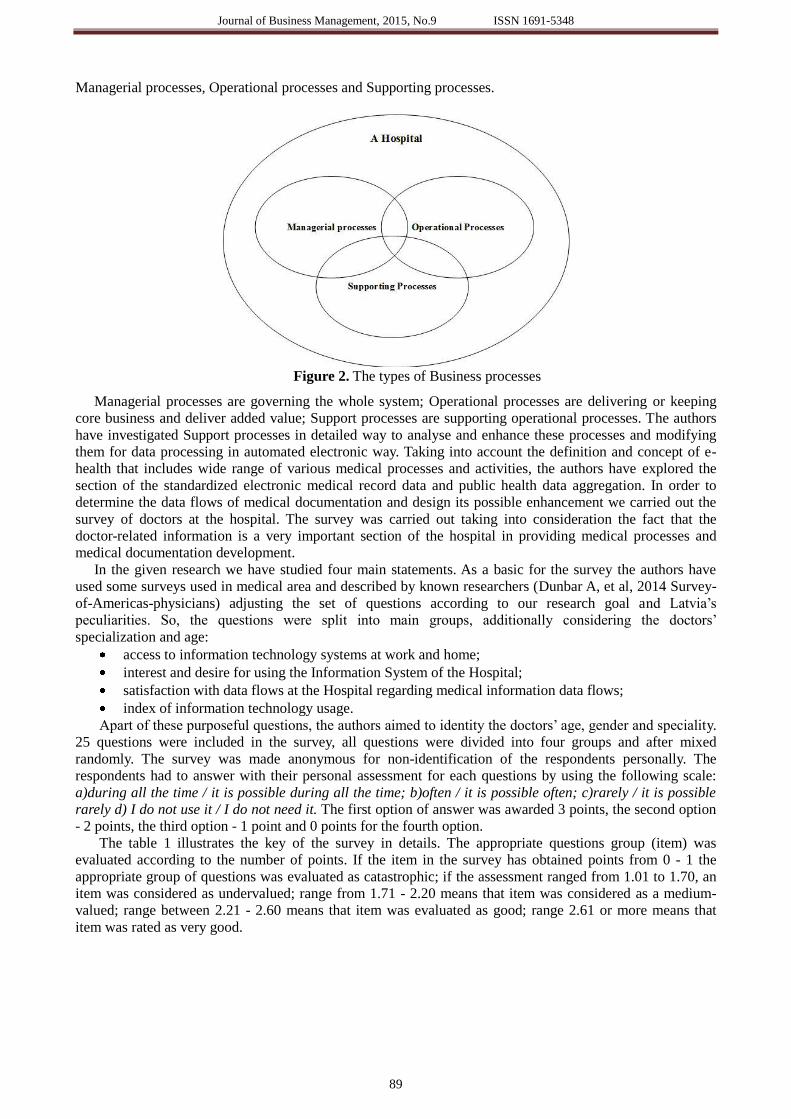
Journal of Business Management, 2015, No.9 ISSN 1691-5348
89
Managerial processes, Operational processes and Supporting processes.
Figure 2. The types of Business processes
Managerial processes are governing the whole system; Operational processes are delivering or keeping
core business and deliver added value; Support processes are supporting operational processes. The authors
have investigated Support processes in detailed way to analyse and enhance these processes and modifying
them for data processing in automated electronic way. Taking into account the definition and concept of e-
health that includes wide range of various medical processes and activities, the authors have explored the
section of the standardized electronic medical record data and public health data aggregation. In order to
determine the data flows of medical documentation and design its possible enhancement we carried out the
survey of doctors at the hospital. The survey was carried out taking into consideration the fact that the
doctor-related information is a very important section of the hospital in providing medical processes and
medical documentation development.
In the given research we have studied four main statements. As a basic for the survey the authors have
used some surveys used in medical area and described by known researchers (Dunbar A, et al, 2014 Survey-
of-Americas-physicians) adjusting the set of questions according to our research goal and Latvia’s
peculiarities. So, the questions were split into main groups, additionally considering the doctors’
specialization and age:
access to information technology systems at work and home;
interest and desire for using the Information System of the Hospital;
satisfaction with data flows at the Hospital regarding medical information data flows;
index of information technology usage.
Apart of these purposeful questions, the authors aimed to identity the doctors’ age, gender and speciality.
25 questions were included in the survey, all questions were divided into four groups and after mixed
randomly. The survey was made anonymous for non-identification of the respondents personally. The
respondents had to answer with their personal assessment for each questions by using the following scale:
a)during all the time / it is possible during all the time; b)often / it is possible often; c)rarely / it is possible
rarely d) I do not use it / I do not need it. The first option of answer was awarded 3 points, the second option
- 2 points, the third option - 1 point and 0 points for the fourth option.
The table 1 illustrates the key of the survey in details. The appropriate questions group (item) was
evaluated according to the number of points. If the item in the survey has obtained points from 0 - 1 the
appropriate group of questions was evaluated as catastrophic; if the assessment ranged from 1.01 to 1.70, an
item was considered as undervalued; range from 1.71 - 2.20 means that item was considered as a medium-
valued; range between 2.21 - 2.60 means that item was evaluated as good; range 2.61 or more means that
item was rated as very good.

Journal of Business Management, 2015, No.9 ISSN 1691-5348
90
Table 1
The key of the survey
Access to Information
Technology at work
and at home
Interest and desire for
using the IS of the
Hospital
Satisfaction with
medical information
data flows
Index of IT usage
0-1.0 Catastrophic 0-1.0 Catastrophic 0-1.0 Catastrophic 0-1.0 Catastrophic
1.01-1.70 Undervalued 1.01-1.70 Undervalued 1.01-1.70 Undervalued 1.01-1.70
Undervalued
1.71 –2.20 Medium-
valued
1.71–2.20 Medium-
valued
1.71 – 2.20 Medium-
valued
1.71–2.20 Medium-
valued
2.21 – 2.60 Good 2.21 – 2.60 Good 2.21 – 2.60 Good 2.21 – 2.60 Good
2.61 -3.0 Very good 2.61 -3.0 Very good 2.61 -3.0 Very good 2.61 -3.0 Very good
The survey was conducted at the Children’s Clinical University Hospital in 2014 February and March, the
respondents participated were chosen from various Hospital’ departments, with different specialities. The
participants were 34 doctors (5,6 % from all doctors at the Hospital) that means that the research covers
sufficient number of respondents and can be considered as valid. Four questionnaires were filled in with
some errors so they have not been accepted as complete and we analysed 30 surveys. For data processing
IBM SPSS was used.
The results of the survey were deeply discussed with nine leading doctors of Riga Eastern University
Hospital and Riga Stradins University in 2014 autumn.
In the given research the authors tried to recognize to what extent e-environment can impact and change
health care process and study how e-health could continue affecting the health care system and the routine
work of a medical institution in the future.
Analysing the gathered data, the authors have found out that 53% of respondents were man while 47%
women, comparing with the common staff structure it should be said that more men have answered the
survey as gender structure at the Hospital was 77% women and 23% men.
The validity of the questionnaire was checked using Cronbach Alpha Coefficient, calculating coefficient
for the entire study as a whole. Cronbach Alpha Coefficient was calculated 0.643 that corresponds with valid
and reliable survey data. Normal distribution can be determined with the Kolmogorov - Smirnov test that
compares the data from the questionnaires with data set distributed by the normal sample, which is equal to
the average value and dispersion. The normal distribution is useful to calculate, because it shows the average
random distribution. In our case the test results showed that the data obtained are representable.
Table 2
Descriptive statistics for the whole data set
Statistics parameter Access to
Information
Technology at work
and at home
Interest and
desire for using
the IS of the
Hospital
Satisfaction with
medical
information data
flows
Index of IT
usage
Missing 0 0 0 0
Mean 11,1000 10,9667 20,7667 8,4000
Std. Error of Mean ,33682 ,37900 ,65158 ,44875
Median 11,0000 11,0000 20,0000 9,0000
Mode 11,00a 12,00 19,00 9,00
Std. Deviation 1,84484 2,07586 3,56886 2,45792
Asymmetry
coefficient Skewness
,020 ,147 ,317 -,334
Std. Error of
Skewness
,427 ,427 ,427 ,427
Kurtosis -,497 ,027 ,002 ,788
Std. Error of Kurtosis ,833 ,833 ,833 ,833
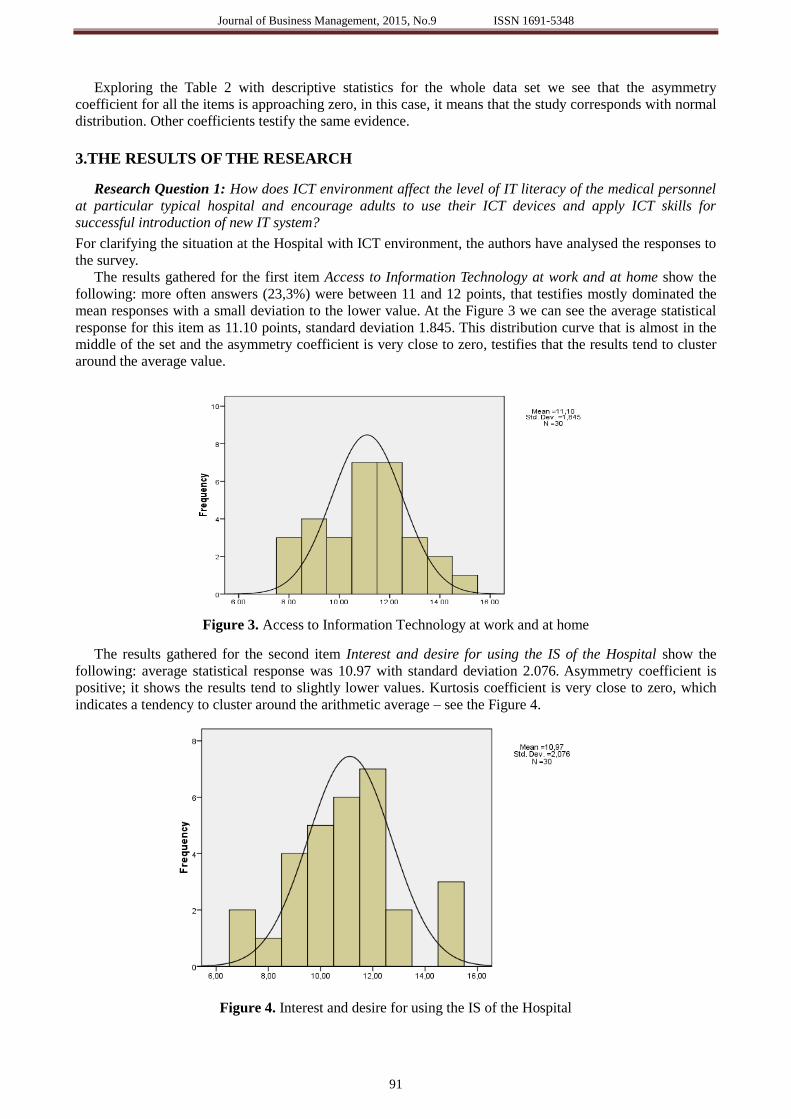
Journal of Business Management, 2015, No.9 ISSN 1691-5348
91
Exploring the Table 2 with descriptive statistics for the whole data set we see that the asymmetry
coefficient for all the items is approaching zero, in this case, it means that the study corresponds with normal
distribution. Other coefficients testify the same evidence.
3.THE RESULTS OF THE RESEARCH
Research Question 1: How does ICT environment affect the level of IT literacy of the medical personnel
at particular typical hospital and encourage adults to use their ICT devices and apply ICT skills for
successful introduction of new IT system?
For clarifying the situation at the Hospital with ICT environment, the authors have analysed the responses to
the survey.
The results gathered for the first item Access to Information Technology at work and at home show the
following: more often answers (23,3%) were between 11 and 12 points, that testifies mostly dominated the
mean responses with a small deviation to the lower value. At the Figure 3 we can see the average statistical
response for this item as 11.10 points, standard deviation 1.845. This distribution curve that is almost in the
middle of the set and the asymmetry coefficient is very close to zero, testifies that the results tend to cluster
around the average value.
Figure 3. Access to Information Technology at work and at home
The results gathered for the second item Interest and desire for using the IS of the Hospital show the
following: average statistical response was 10.97 with standard deviation 2.076. Asymmetry coefficient is
positive; it shows the results tend to slightly lower values. Kurtosis coefficient is very close to zero, which
indicates a tendency to cluster around the arithmetic average – see the Figure 4.
Figure 4. Interest and desire for using the IS of the Hospital
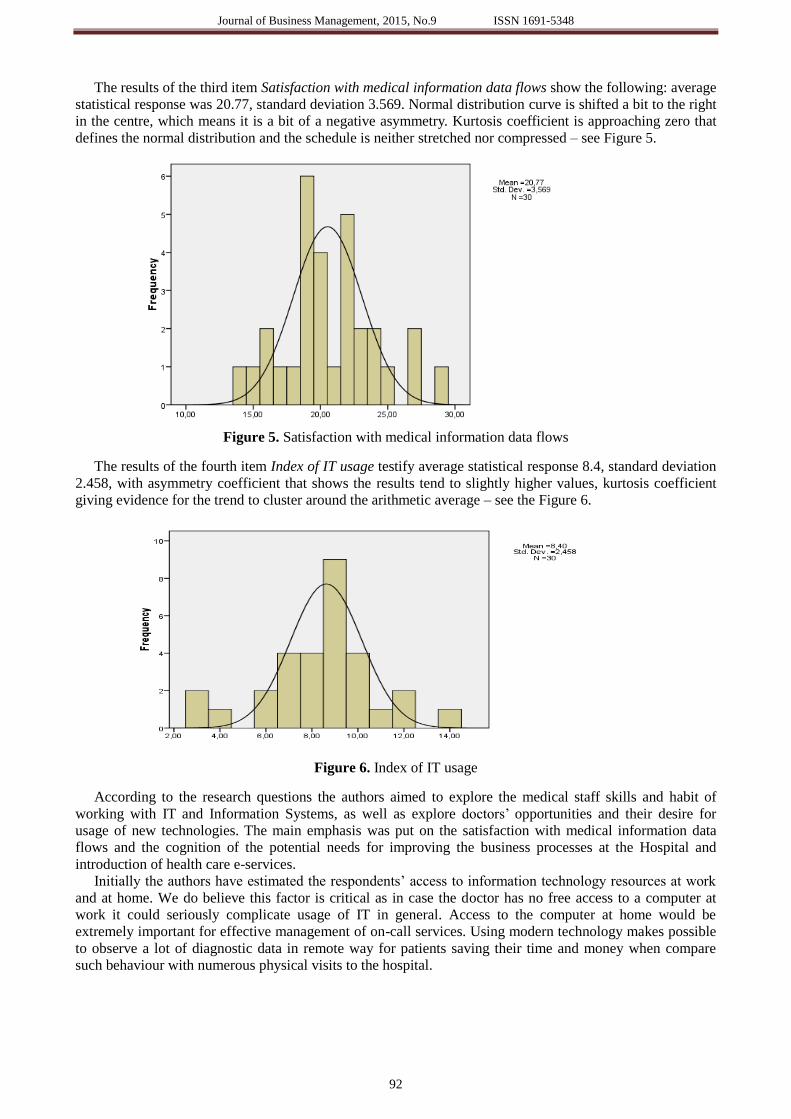
Journal of Business Management, 2015, No.9 ISSN 1691-5348
92
The results of the third item Satisfaction with medical information data flows show the following: average
statistical response was 20.77, standard deviation 3.569. Normal distribution curve is shifted a bit to the right
in the centre, which means it is a bit of a negative asymmetry. Kurtosis coefficient is approaching zero that
defines the normal distribution and the schedule is neither stretched nor compressed – see Figure 5.
Figure 5. Satisfaction with medical information data flows
The results of the fourth item Index of IT usage testify average statistical response 8.4, standard deviation
2.458, with asymmetry coefficient that shows the results tend to slightly higher values, kurtosis coefficient
giving evidence for the trend to cluster around the arithmetic average – see the Figure 6.
Figure 6. Index of IT usage
According to the research questions the authors aimed to explore the medical staff skills and habit of
working with IT and Information Systems, as well as explore doctors’ opportunities and their desire for
usage of new technologies. The main emphasis was put on the satisfaction with medical information data
flows and the cognition of the potential needs for improving the business processes at the Hospital and
introduction of health care e-services.
Initially the authors have estimated the respondents’ access to information technology resources at work
and at home. We do believe this factor is critical as in case the doctor has no free access to a computer at
work it could seriously complicate usage of IT in general. Access to the computer at home would be
extremely important for effective management of on-call services. Using modern technology makes possible
to observe a lot of diagnostic data in remote way for patients saving their time and money when compare
such behaviour with numerous physical visits to the hospital.
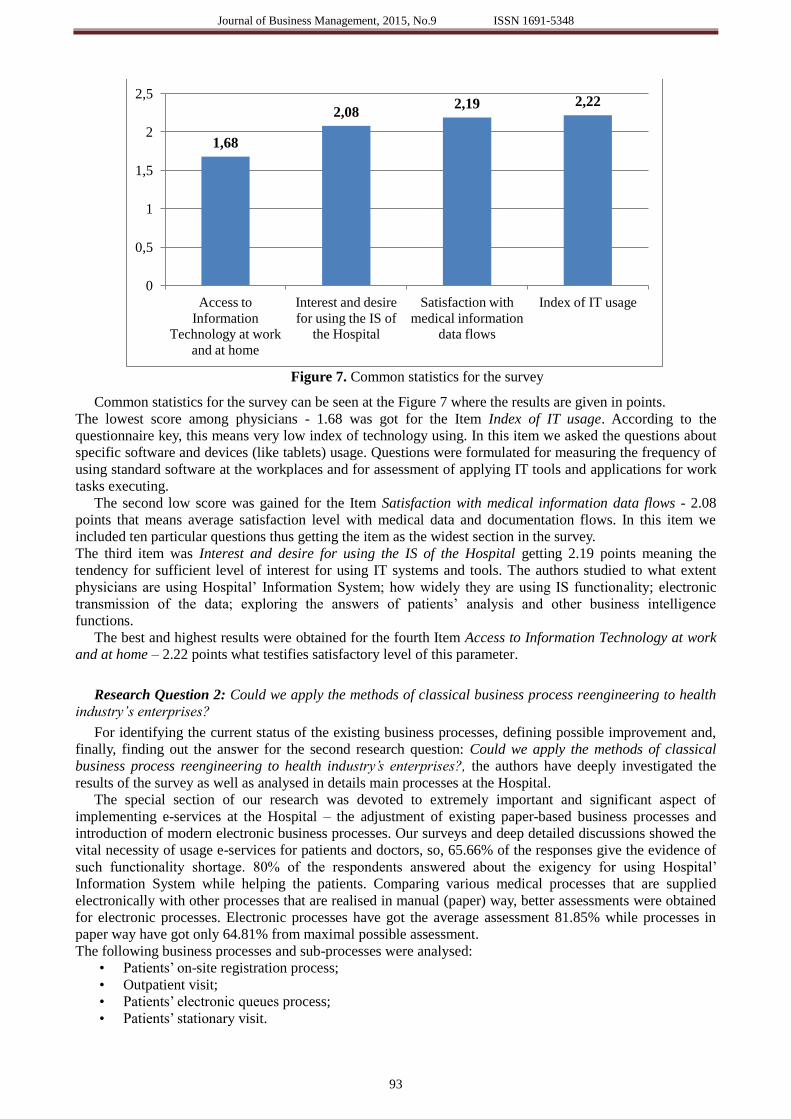
Journal of Business Management, 2015, No.9 ISSN 1691-5348
93
Figure 7. Common statistics for the survey
Common statistics for the survey can be seen at the Figure 7 where the results are given in points.
The lowest score among physicians - 1.68 was got for the Item Index of IT usage. According to the
questionnaire key, this means very low index of technology using. In this item we asked the questions about
specific software and devices (like tablets) usage. Questions were formulated for measuring the frequency of
using standard software at the workplaces and for assessment of applying IT tools and applications for work
tasks executing.
The second low score was gained for the Item Satisfaction with medical information data flows - 2.08
points that means average satisfaction level with medical data and documentation flows. In this item we
included ten particular questions thus getting the item as the widest section in the survey.
The third item was Interest and desire for using the IS of the Hospital getting 2.19 points meaning the
tendency for sufficient level of interest for using IT systems and tools. The authors studied to what extent
physicians are using Hospital’ Information System; how widely they are using IS functionality; electronic
transmission of the data; exploring the answers of patients’ analysis and other business intelligence
functions.
The best and highest results were obtained for the fourth Item Access to Information Technology at work
and at home – 2.22 points what testifies satisfactory level of this parameter.
Research Question 2: Could we apply the methods of classical business process reengineering to health
industry’s enterprises?
For identifying the current status of the existing business processes, defining possible improvement and,
finally, finding out the answer for the second research question: Could we apply the methods of classical
business process reengineering to health industry’s enterprises?, the authors have deeply investigated the
results of the survey as well as analysed in details main processes at the Hospital.
The special section of our research was devoted to extremely important and significant aspect of
implementing e-services at the Hospital – the adjustment of existing paper-based business processes and
introduction of modern electronic business processes. Our surveys and deep detailed discussions showed the
vital necessity of usage e-services for patients and doctors, so, 65.66% of the responses give the evidence of
such functionality shortage. 80% of the respondents answered about the exigency for using Hospital’
Information System while helping the patients. Comparing various medical processes that are supplied
electronically with other processes that are realised in manual (paper) way, better assessments were obtained
for electronic processes. Electronic processes have got the average assessment 81.85% while processes in
paper way have got only 64.81% from maximal possible assessment.
The following business processes and sub-processes were analysed:
• Patients’ on-site registration process;
• Outpatient visit;
• Patients’ electronic queues process;
• Patients’ stationary visit.
1,68
2,08 2,19 2,22
Access to
Information
Technology at work
and at home
Interest and desire
for using the IS of
the Hospital
Satisfaction with
medical information
data flows
Index of IT usage
0
0,5
1
1,5
2
2,5
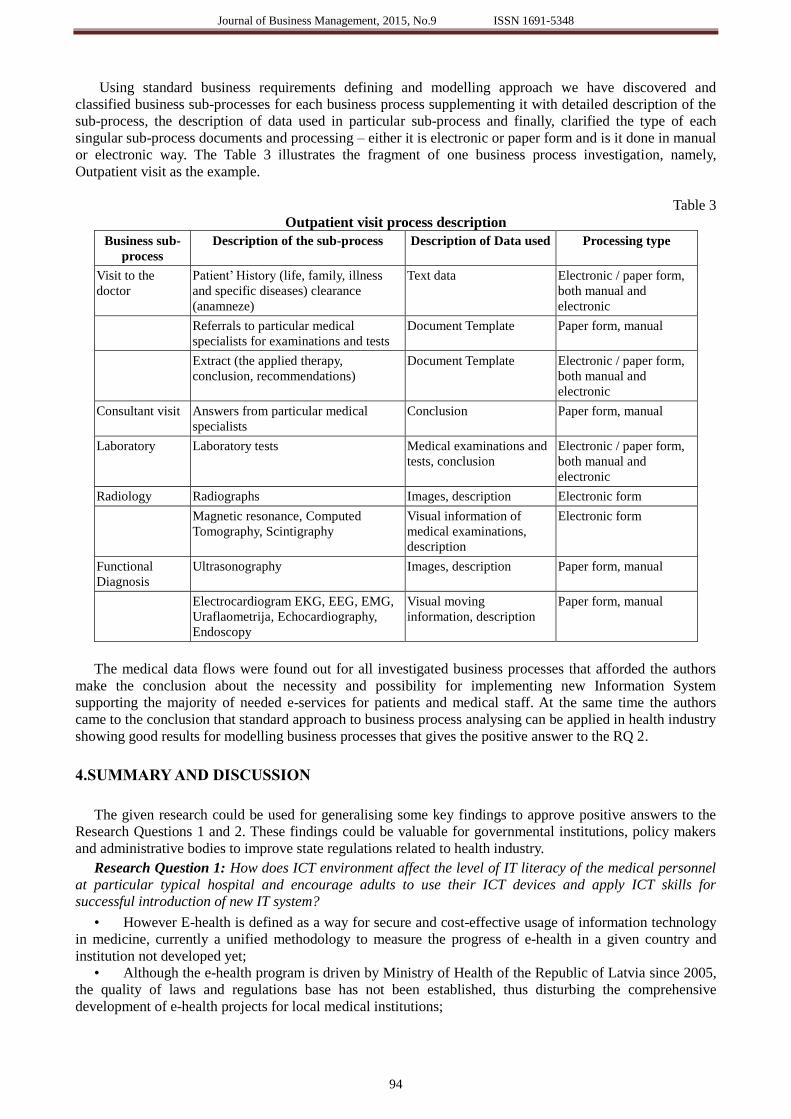
Journal of Business Management, 2015, No.9 ISSN 1691-5348
94
Using standard business requirements defining and modelling approach we have discovered and
classified business sub-processes for each business process supplementing it with detailed description of the
sub-process, the description of data used in particular sub-process and finally, clarified the type of each
singular sub-process documents and processing – either it is electronic or paper form and is it done in manual
or electronic way. The Table 3 illustrates the fragment of one business process investigation, namely,
Outpatient visit as the example.
Table 3
Outpatient visit process description
Business sub-
process
Description of the sub-process Description of Data used Processing type
Visit to the
doctor
Patient’ History (life, family, illness
and specific diseases) clearance
(anamneze)
Text data Electronic / paper form,
both manual and
electronic
Referrals to particular medical
specialists for examinations and tests
Document Template Paper form, manual
Extract (the applied therapy,
conclusion, recommendations)
Document Template Electronic / paper form,
both manual and
electronic
Consultant visit Answers from particular medical
specialists
Conclusion Paper form, manual
Laboratory Laboratory tests Medical examinations and
tests, conclusion
Electronic / paper form,
both manual and
electronic
Radiology Radiographs Images, description Electronic form
Magnetic resonance, Computed
Tomography, Scintigraphy
Visual information of
medical examinations,
description
Electronic form
Functional
Diagnosis
Ultrasonography Images, description Paper form, manual
Electrocardiogram EKG, EEG, EMG,
Uraflaometrija, Echocardiography,
Endoscopy
Visual moving
information, description
Paper form, manual
The medical data flows were found out for all investigated business processes that afforded the authors
make the conclusion about the necessity and possibility for implementing new Information System
supporting the majority of needed e-services for patients and medical staff. At the same time the authors
came to the conclusion that standard approach to business process analysing can be applied in health industry
showing good results for modelling business processes that gives the positive answer to the RQ 2.
4.SUMMARY AND DISCUSSION
The given research could be used for generalising some key findings to approve positive answers to the
Research Questions 1 and 2. These findings could be valuable for governmental institutions, policy makers
and administrative bodies to improve state regulations related to health industry.
Research Question 1: How does ICT environment affect the level of IT literacy of the medical personnel
at particular typical hospital and encourage adults to use their ICT devices and apply ICT skills for
successful introduction of new IT system?
• However E-health is defined as a way for secure and cost-effective usage of information technology
in medicine, currently a unified methodology to measure the progress of e-health in a given country and
institution not developed yet;
• Although the e-health program is driven by Ministry of Health of the Republic of Latvia since 2005,
the quality of laws and regulations base has not been established, thus disturbing the comprehensive
development of e-health projects for local medical institutions;
Journal of Business Management, 2015, No.9 ISSN 1691-5348
95
• The level of using ICT technologies and tools amongst the doctors is not very high however it shows
clear trend for improvement in the nearest future;
• During the research the authors could draw the conclusion that the doctors’ society is conservative
enough and changes in business processes are accepted relatively slow. At the same time our respondents
rated the advantages offered by the electronic process 17% more convenient than manual paper-based
processes;
• Based on the study conducted at the Children’s Hospital, the authors conclude that e-health is the
way to achieve successful, doctors more comfortable and more accessible to the population healthcare using
information and telecommunication technologies.
Research Question 2: Could we apply the methods of classical business process reengineering to health
industry’s enterprises?
• While researching business processes at the Children’s Hospital the authors can deduce that a
significant attention should be paid to the deep investigation of sub-processes, data flows, business
requirements identification for ensuring their amelioration using ICT tools;
• Standard approach for analyzing and modeling business processes and requirements could be
successfully applied to the manual processes in health industry institutions to draw new adjusted business
processes for e-service offering.
• For the successful realization of e-service project the IT team should include the experts who are
competent in both medicine and information technology and could apply the standard approach to business
environment investigation. Taking into account the conservative medical environment, a detailed training
plan with possible leeway should be developed and approved to introduce ICT reforms.
5.FURTHER RESEARCH
The authors consider the next step for the research should be investigating and testing the hypothesis, that
introducing of various e-health services at medical institution may substantially increase the satisfaction of
the offered services by hospital’ patients and increase the quality of medical care.
ACKNOWLEDGEMENTS
The authors would like to express the deepest thanks to the doctors at the Children’s Clinical University
Hospital, Riga Eastern University Hospital and Riga Stradins University for being extremely responsive,
sympathetic, accessible and answerable. Taking into consideration the high level of doctors’ load, we feel
deep gratitude to all doctors hoping that the results of our research can be used at other medical institutions
for fully leverage of ICT technologies at the hospitals and increasing well-being of population and life
quality.
REFERENCES
1. Al Basheer Al Morshid S., Mobile eHealth solutions for Developing Countries, Geneva: International
Telecommunication Union, https://www.itu.int/dms_pub/itu-d/opb/stg/D-STG-SG02.14.2-2010-PDF-E.pdf,
(2010), Accessed 18 February 2014. 2. Chong, Y.Y., Managing project risk: business risk management for project leaders. London: Prentice Hall, (2000).
3. Denardis L., Standards and eHealth, Geneva: ITU Telecommunication Standardization Bureau.
http://www.itu.int/dms_pub/itu-t/oth/23/01/T23010000120003PDFE.pdf, (2011), Accessed 22 March 2015.
4. Dufresne T., Martin J., Process modelling for E-Business, Fairfax: George Mason University
http://catalog.gmu.edu, (2003), Accessed 20 March 2015.
5. Dunbar A, et al, Building FOUNDATIONS eHealth, Report of the WHO Global Observatory for eHealth, World
Health Organization, (2008).
6. Healy J. C., Implementing e-Health in Developing Countries, Geneva: International Telecommunication Union
(ITU). http://www.itu.int/ITU-D/cyb/app/docs/e-Health_prefinal_15092008.PDF, (2008), Accessed 2 April 2015.
7. Silvius, A.J., De Haes, Van Grembergen. Exploration of cultural influences on business and IT alignment.
Proceedings of the 42nd Annual Hawaii International Conference on System Sciences, HICSS, art. no. 4755733.
http://www.scopus.com/inward/record.url?eid=2-s2.0-
78650760383&partnerID=40&md5=66a621bea20870d9ad031ae64ceff915, (2009), Accessed 20 February 2015.
8. Silvius, A. J Gilbert. Business and IT Alignment: What We Know and What We Don't Know. Information
Management and Engineering, ICIME '09. International Conference on. ISBN: 978-0-7695-3595-1. (2009).
9. Silvius, A., Turkiewicz, J., Keratsinov, A., Spoor, H. The Relationship between IT Outsourcing and Business and
IT Alignment: an Explorative Study. Computer Science and Information Systems, Vol. 10, No. 3, 973-998. (2013).
Journal of Business Management, 2015, No.9 ISSN 1691-5348
96
10. Shpilberg, D., et al. Avoiding the alignment trap in information technology. MIT Sloan Management Review 49
(1). (2007).
11. Spremić, M. IT Governance Mechanisms in Managing IT Business Value, WSEAS Transactions on Information
Science and Applications, Issue 6, Volume 6, June 2009, pp. 906-915, (2009):
12. Survey of America’s Physicians 2014: Practice Patterns and Perspectives,
http://www.physiciansfoundation.org/healthcare-research/2014-survey-of-americas-physicians-practice-patterns-
and-perspectives. (2014), Accessed 13 April 2015.
13. Tatjana Vasiļjeva, “Outsourcing of Software Development: Challenges for Management”, 5th International
Scientific Conference "Information Society and Modern Business", Latvia, Ventspils, Journal of Business
Management, No. 6, ISSN 1691 – 5348., p. 40 – 47, EBSCO, (2012).
14. Vasiljeva T, Joining EURO Community – Business and Information Technology Partnership: Lessons Learned in
Latvia, Journal of Business Management, No. 8, ISSN 1691 – 5348., p. 184-198, EBSCO, (2014).
15. Vasiljeva T, Treiguts E, Information Technology and Business Alignment as essential Factor for successful EURO
Introduction (Case of Latvia), Proceedings in 7-th International Conference „ An Enterprise Odyssey: Leadership,
Innovation and Development for Responsible Economy”, Zadar, Croatia, University of Zagreb, ISBN-13:978-953-
6025-91-6; ISBN-13:978-953-6025-92, (2014).
16. Vasiljeva T, Treiguts E, Social Networking and Corporate Business: future collaboration for Enterprises’
Development, INTED2013, Valencia, Spain, March, Web of Science, ISSN: 23401079, ISBN: 9788461626618,
Accession Number: WOS:000346699804038, (2013).
17. Walshe, K., Smith J., et al, Healthcare management. Glasgow: Bell & Bain Ltd., (2007).
18. World Health Organization, International Telecommunication Union, National eHealth Strategy Toolkit. Geneva:
World Health Organization and International Telecommunication Union, http://www.itu.int/ITU-D/cyb/app/e-
health/NeHSToolkit/form.phtml?file=http://www.itu.int/dms_pub/itu-d/opb/str/D-STR-E_HEALTH.05-2012-PDF-
E.pdf, (2012), Accessed 1 May 2015.
19. Latvijas Veselibas ministrija, Nozares politika, http://www.vm.gov.lv/lv/nozare/nozares_politika, (2014).
20. Neatliekamas mediciniskas palidzibas dienests, Par NMP dienestu. http://www.nmpd.gov.lv/nmpd/NMPD, (2014),
Accessed 1 May 2015.
21. EUROSTAT. Health care expenditure. http://epp.eurostat.ec.europa.eu/cache/ITY_SDDS/en/hlth_sha_esms.htm,
(2014), Accessed 30 April 2015.
22. Latvijas Veselibas ministrija, Budzeta izpilde.
http://www.vm.gov.lv/images/userfiles/budzets_2013%282%29.pdf, (2014), Accessed 28 March 2015.
23. Latvijas Veselibas ministrija, Reforma Latvijas veselibas aprupes sistema.
http://www.vm.gov.lv/images/userfiles/koncepc_infokgafika_20_11_2013%281%29.pdf, (2014), Accessed 28
March 2015.
24. Latvijas Veselibas ministrija, E-veseliba. http://www.vmnvd.gov.lv/lv/e-veseliba/par-e-veselibu, (2014), Accessed
28 March 2015.
Journal of Business Management, 2015, No.9 ISSN 1691-5348
97
IMPACT OF THE NATIONAL INNOVATION SYSTEM ON INNOVATION
Liene Resele
Ventspils University College, Inzenieru Street 101, Ventspils, Latvia, LV-3601
e-mail: [email protected]
ABSTRACT
Purpose. Aim of this research is, firstly – to outline the theoretical aspects connected with the impact of the national
innovation system (NIS) on innovation. Secondly – to create and test the methodology for the analysis of the impact of
the NIS on innovation for detecting the main innovation barriers. Thirdly – to elaborate recommendations for the
companies and the government to promote the implementation of innovation in Latvia by improving the NIS.
Methodology. The research is organized in three sections. Introduction has explained the background and necessity of
this research. The three sections include short overview of the main concepts and problematic issues connected with the
key concepts of this research, description of the methodology and analysis of the impact of the NIS on innovation and
recommendations for the promotion of innovation in Latvia improving the NIS.
Proposed methodology of analysis is based on the analysis of literature carried out by the author of this research. It is
tested on the analysis of impact of Latvia’s innovation system on innovation and includes interviews with experts of
NIS and survey of innovative companies.
Findings. After analysis of the NIS of Latvia there were identified innovation barriers referring to the NIS in general as
well as to the separate functions of the NIS. The research identified the following three broad issues: 1) the main
function that initiates the development of knowledge and innovation (influence of the direction of the search) is not
being implemented; 2) lack of cooperation between NIS participants; 3) inefficient and fragmented management of the
NIS. The main innovation barriers are: lack of financial resources, lack of qualified personnel and the lack of
appropriate support services.
Originality. Proposed methodology of analysis may be used by scholars as well as policy makers to assess the impact
of the NIS on innovation and to determine the main innovation barriers, to investigate the mismatch between policies
and problems, identify policy gaps and devise better policies for the promotion of innovation.
This research can be used by owners/managers of companies in the making of decisions connected with the innovation
process.
Category of paper: research paper.
Key words: innovation, innovative company, national innovation system, innovation barriers, innovation system
functions
1.INTRODUCTION
The growing importance of innovation in the situation when markets are becoming increasingly global,
lifestyle and needs of the customers are changing rapidly and technological opportunities are increasing
quickly is widely recognized. Nowadays, the ability to innovate has become one of the most significant
determinant of the development and competitiveness of the company. As the innovation is influenced by the
numerous internal and external factors, the implementation of innovation is associated with high risk and
high degree of uncertainty, it presents significant challenges to the management of the company. Therefore,
to reduce the risk and uncertainty, the company needs to understand the nature of the innovation, it
influencing factors (especially hampering factors), the available support instruments, as well as their
development process.
Successful innovation processes in companies are important also for the government, as the development
of the innovative entrepreneurship determines the country's economic development.
Innovation in the company and its influencing external factors are components of the NIS. To identify
the main factors influencing and hampering innovation and to develop the appropriate support instruments it
is necessary to carry out the analysis of the NIS.
2.OVERVIEW OF THE KEY CONCEPTS: INNOVATION, INNOVATIVE COMPANY,
INNOVATION BARRIERS, NATIONAL INNOVATION SYSTEM, INNOVATION
SYSTEM FUNCTIONS
Innovation is the key to economic development and competitiveness in the knowledge economy but there
is still no single generally accepted definition and classification of concepts “innovation”, “innovative
company”, “innovation barriers”, “national innovation system”, “innovation system functions”.
Analysing different innovation definitions proposed in the literature it can be concluded that the term
Journal of Business Management, 2015, No.9 ISSN 1691-5348
98
"innovation" is used as the process (for example, Forest, 1991; Galanakis, 2006; Zizlavsky, 2013) and as the
result (for example, Edquist, 2001; Parthasarthy and Hammond, 2002) (Gopalakrishnan and Damanpour,
1997; Quintana et al, 2011). Some authors provide broad scale innovation definition that can be used
generally (for example, Baregheh et al., 2009 from Lisetchi and Brancu, 2014; Forrest, 1991), while other
authors’ definitions refer to a particular innovation type (for example, Parthasarthy and Hammond, 2002).
Some innovation definitions explain the concept broader, including a number of aspects – innovation
outcomes (for example, new formations, new products, processes, knowledge, services) and/or innovation
objectives (for example, to compete successfully and to differentiate the company in the market), and/or used
resources (for example, new or existing scientific or technological knowledge, equipment, software and
human resources), and/or other aspects, while others – narrowly.
The two most important aspects defining innovation is the aspect of novelty and the economic benefit that
innovation brings to the company. Therefore innovation in this research is defined as the development and
implementation of new to the market or company or significantly improved product or process that brings
economic benefit to the company.
There are different classifications of innovation in the literature, which greatly complicates the
understanding of definitions of different types of innovation used by various authors and relationship
between different types of innovation. Such a lack of consistency in the classification of innovation can lead
to confusion on the subject of empirical research. However as the main innovation categories, which can
cover different types of innovation mentioned by various authors product and process, technological and
administrative, radical and incremental innovation can be mentioned (Rowley et al, 2011). In addition, any of
the first mentioned four types of innovation can be both radical and incremental.
Factors determining innovation have been widely studied in the literature with the aim to understand what
factors contribute to the development of innovation and relationship between these factors and activity of the
company. Smaller is the number of studies that contain alternative approach and that are focused to the
analysis of factors hampering innovation, their role in the innovation process and the extent to which they
slow down, premature stop or prevent implementation of innovation (Mohnen et al, 2008; Silva et al, 2007;
Lukjanska, 2010). Factors hampering innovation in the literature are called innovation barriers (Mirow et al,
2008 from Hueske et al, 2015). In this research division of innovation barriers into internal and external
barriers is used. Internal barriers arise inside the company and are associated with the resistance to
innovation (Holzl and Janger, 2013). External barriers result from the interaction of the company with other
companies and other actors of the NIS (Holzl and Janger, 2013).
Among small number of studies focused to the research of innovative company only few studies provide
clear definitions of the innovative company. Obvious classification of innovative companies also is not
provided in the literature. In this research innovative company is defined as the company that has developed
and implemented in the company or market new or significantly improved product or process that provides
economic benefit for the company.
With the aim to understand and analyse the nature and development of innovation there have been
developed a number of models, each of which focuses on different areas that were dominating in the period
of their development. Rothwell has grouped these models into five historic generations – the technology
push model, the market pull model, the coupling innovation process model, the functional integration model
and the systems integration and networking model (Rothwell, 1993 from Hobday, 2005). Over the time the
focus has turn from the linear to the systems models that are able better to grasp the complex innovation
process in the company – the feedback and exchange of information, knowledge and other resources between
the various stages of the innovation process and the external environment. Galanakis (Galanakis, 2006)
indicates that a new generation approach – the innovation systems approach was created in the 1980s and
1990s.
There is a consensus between science and policy communities that the most appropriate tool for the
analysis of innovation is the NIS approach (Ghazinoory and Bitaab, 2014; Hekkert et al, 2007; van Hemert et
al, 2013). In this research NIS is defined as the set of measures implemented within the cooperation between
the public and private sector to create, accumulate, change and use new knowledge with the aim to promote
the implementation of innovation and subsequently – the sustainable development of the economy.
Overview and analysis of NIS definitions, functions and methods of analysis is provided in the articles
“Measuring problems in small country National Innovation system” (Resele, 2014b) and “Measuring the
functionality of national innovation system” (Resele, 2014a).
Innovation system include factors that determine innovation – all important economic social, political,
organisational and other factors that influence creation, dissemination and use of knowledge (Edquist, 2008)
and affect the learning capacity of organisations and hence the capacity to develop innovation (Lundvall,
Journal of Business Management, 2015, No.9 ISSN 1691-5348
99
1992). Edquist, Liu and White, Johnson and Jacobsson, Hekkert uses factors determining innovation and
system specific functions as synonyms (Edquist 2001 from Suriyani et al, 2012; Liu and White, 2001;
Johnson and Jacobsson, 2000; Hekkert et al, 2007). Weak performance of functions creates innovation
barriers.
In this research as main or direct functions of the NIS are proposed two functions:
development of new knowledge;
use of knowledge,
and as support or indirect functions:
influence on the direction of search;
supply of resources;
creation and change of the “rules of the game”;
formation of the markets;
facilitation of information and knowledge exchange.
Analysis of the NIS functions helps to determine the impact of the NIS on innovation and to determine
the main innovation hampering factors or innovation barriers. Description of the methodology and analysis
of situation in Latvia is provided in the chapter two of this paper.
3.METHODOLOGY AND ANALYSIS OF THE IMPACT OF THE NATIONAL
INNOVATION SYSTEM ON INNOVATION
3.1.METHODOLOGY FOR THE ANALYSIS OF THE IMPACT OF NATIONAL INNOVATION
SYSTEM ON INNOVATION
Methodology for the analysis of the impact of NIS on innovation and for the identification of key factors
hampering innovation developed in this research rests on the synthesis of the research of Bergek (2008),
Chaminade et al (2012) and Hekkert et al (2007). It includes four steps:
identification of structural components of NIS;
identification and analysis of NIS functions;
identification of innovation barriers;
identification of key policy issues and elaboration of recommendations.
The first step involves setting the starting point for the analysis, i.e. defining the NIS in focus and
identifying structural components of NIS – actors, networks institutions. In the second step functions of NIS
are analysed describing what is actually going on in the NIS in terms of the seven key processes (two main
or direct functions and five support or indirect functions). In the third step their fulfilment is assessed (how
well they are implemented) and innovation barriers are identified. In the fourth step key policy issues related
to the innovation barriers (innovation hampering factors) are defined and recommendations elaborated.
Identification and analysis of the NIS is based on the analysis of theory, strategic documents and
regulations, studies, indexes and statistics, case studies, interviews with experts (representatives of actors of
NIS) as well as survey of innovative companies.
To plot a complex picture of the NIS in Latvia and its impact on innovation viewpoint not only of
innovative companies but also of representatives of all actors of Latvia’s NIS is taken into account. There
were carried out face to face interviews with 45 experts representing all actors of the Latvia’s NIS from 21
February 2014 to 26 March 2014 and survey of technology innovative companies from 7 May 2014 to 7
august 2014 in this research.
Experts for the interviews were selected on the basis of the following criteria (Lamprinopoulou, 2014):
belonging of the organization represented by the expert to the corresponding actors category of the
NIS and role of the organisation in the NIS;
knowledge, experience and contribution of the expert in relation to the NIS in general and/or certain
its functions, and/or development and implementation of innovation policy;
degree of influence of the expert in the organisation he/she represents.
Interviews of experts were carried out following twelve pre-prepared open ended questions.
The number of innovative companies, including technology innovative companies in Latvia cannot be
determined since in the data base of Central Statistical Bureau (CSB) there are not included statistical data
about innovation in the micro companies (companies with less than 10 employees). The lack of this
information significantly affects the overall assessment of the innovations in Latvia in both domestic and
foreign reports and surveys. According with the data of CSB in 2013 there were 93 775 economically active
Journal of Business Management, 2015, No.9 ISSN 1691-5348
100
individual merchants and commercial companies (excluding agricultural and fishing farms and self-
employed persons who perform economic activity), of which 86.2% corresponded to micro company
category in Latvia2.
It should be also mentioned that CSB indicates company as an innovative if during the reference period
(three years) it has implemented at least one innovation. Financial criteria that allow estimating the economic
benefit the innovation brigs to the company are not used.
Taking into account the lack of information about innovative companies in Latvia as well as non-use of
the financial criteria for the selection of the innovative companies as source for the survey of technology
innovative companies edition about innovative companies in 2011 in Latvia that have implemented new
products and services or new technologies (LIAA, 2012) as well as list of contestants of Export and
innovation award in 2011, 2012, 2013 in the category “Innovative product” was used.
Investment and Development Agency of Latvia selects innovative companies following also financial
criteria (LIAA, 2012) (two of the following criteria should be met):
at least 25% of current sales are made up of products that have been introduced or significantly
improved over the past five years;
the profit generated by new products or services that are not older than five years is at least 10% of
gross profit;
sales derived from the introduction of new products or services have increased annual turnover of the
company by more than 5%.
The survey in this research was conducted by means of electronic mail. A questionnaire was sent to the
technology innovative companies e-mail addresses. 71 questionnaires were received.
The questionnaire included thirteen questions. Five questions concerned the company's general indicators.
Two questions were related to the overall assessment of the NIS. Six questions concerned company’s
activities connected with the creation of knowledge and innovation. Intelligibility of questions was tested in
the three companies before the questionnaire was sent out to the other respondents.
Experts of the NIS and managers/owners of the technology intensive companies were asked to evaluate
the main innovation barriers for companies using five-point scale, 1 – having no impact, 2 – small impact, 3
– average impact, 4 – significant impact, and 5 – large impact.
Data processing and analysis was carried out using statistical methods, including correlation and analysis
of variance, factor analysis, ranking, time series analysis.
3.2.ANALYSIS OF THE IMPACT OF THE NATIONAL INNOVATION SYSTEM ON
INNOVATION IN LATVIA
There are many studies and surveys carried out by various organizations and researchers in the connection
with the knowledge creation and use. Fulfilment of the NIS functions can be assessed using these sources of
secondary data that can be classified as the external evaluation, such as the Global Competitiveness Report,
the Innovation Union Scoreboard. Aim of this research was to obtain the internal evaluation of NIS from all
its actors – creators of knowledge, users of knowledge as well as providers of the support functions.
Figure 1 contains evaluation from the experts about the innovation hampering factors – innovation
barriers and their initiating factors.
2 http://data.csb.gov.lv/pxweb/lv/uzreg/uzreg__ikgad__01_skaits/SR0043.px/table/tableViewLayout1/?rxid=cdcb978c-
22b0-416a-aacc-aa650d3e2ce0

Journal of Business Management, 2015, No.9 ISSN 1691-5348
101
Low cooperation between knowledge
creators and knowledge users
Lack of large companies
Lack of
intermediaries
Innovation discouraging
management model in
companies
Limited internal financial
resources of companies
Small number of scientists
implementing only
scientific activities
Low financing for science,
research and innovation
Aging
Lack of life science and
engineering specialists
Low capacity of
knowledge creation
Low capacity of
knowledge use
Frequent changes in composition of
political level actors
Lack of understanding of functioning
principles of NIS
Lack of innovation
policy
Lack of common
aims
Lack of coordinated activities
of all actors of NIS
Low cooperation between primary
and secondary actors of NIS
Low cooperation between secondary
actors of NIS
Fragmented
administration of public
funding
Unsettled patenting process and
its financingNot acquired EU
financing
Innovation
Figure 1. Main innovation barriers and their initiating factors: evaluation from experts
Source: composed by the author
Experts admit that formally all the necessary NIS actors exist but the NIS does not function because
activities of its actors are not coordinated and focused on the achievement of common aim defined in the
innovation policy. Cooperation between primary actors (knowledge creators and knowledge users),
cooperation between primary and secondary actors (providers of support) as well as between the secondary
actors was evaluated as insufficient. As the main reason for the week NIS and lack of innovation policy was
mentioned frequent changes in the composition of political level actors. For example, since 1990 until 2014
17 education ministers have changed3. It was also mentioned that employees of public administration
organisations lack understanding of functioning principles of the NIS and that dominant is the opinion that
market will adjust everything.
The management capacity of public organisations was assessed as low that for example significantly
impedes the absorption of the EU structural funds. Requirements stipulated in the laws and regulations are
not being met and such a failure does not provide for any sanctions.
Both public and private sector funding for science, research and innovation is significantly small, besides
administration of public funding is fragmented, as well as the achievable performance indicators are
inadequate. Unstable and scares financing contributes to the situation that number of scientists implementing
only scientific activities is small. Topical also is the problem of aging.
One of the main factors hampering capacity of knowledge and innovation creation was mentioned patent
acquisition process and it’s financing. Reference was also made to the lack of life science and engineering
specialists.
According with the results of factor analysis answers provided by the companies about the main
innovation barriers form four complex factors (groups of barriers) – financial limitation, disturbing market
conditions, lack of support, uncertainty and risk, which together explains 67.85% of the variance. The first
complex factor – financial limitation explains 22.85% of the variance and it includes four hampering factors:
limited financial resources, lack of financial support, lack of government support, too expensive financial
support. The second complex factor – disturbing market conditions explains 17.13% of the variance and
includes: lack of customers’ interest in innovative products or services, lack of competition in the domestic
market, need to meet the legislative requirements of the Republic of Latvia, need to meet the requirements of
EU and other international organizations. The third factor – lack of support explains 13.96% of the variance
and it includes: lack of qualified personnel, lack of support services, support services do not meet the
companies’ needs, lack of information on technology. The fourth complex factor – uncertainty and risk
explains 13.91% of the variance and includes: too high risk of failure, too high costs related to the
introduction of innovation, lack of information on market demand.
According with the evaluation of representatives of universities and research institutes five main factors
hampering innovation for companies is limited financial resources (4.8 from 5 point scale), lack of qualified
personnel in the labour market (4.40 from 5 point scale), lack of external financial support (4.40 from 5 point
scale), support services do not meet the companies’ needs (4.25 from 5 point scale) and lack of government
support (4.2 from 5 point scale) (Figure 2). Providers of the support as innovation barriers also indicated lack
3 http://izm.izm.gov.lv/ministrija/vesture/pec-kara.html
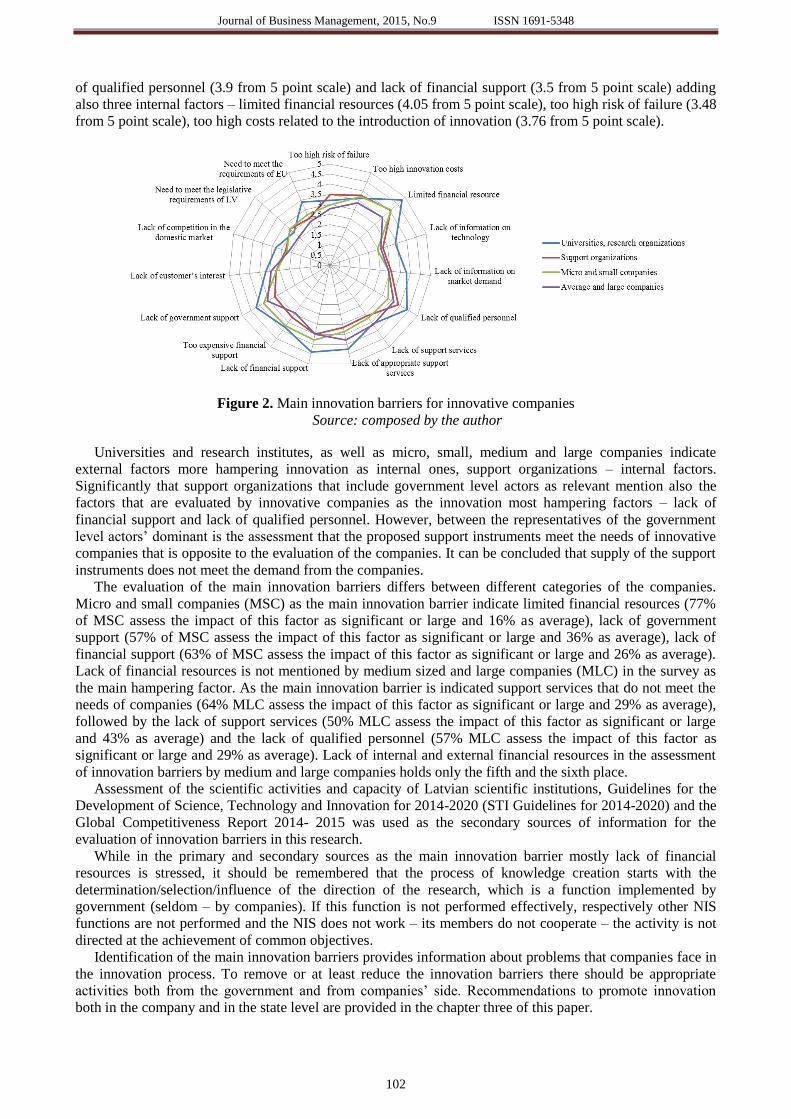
Journal of Business Management, 2015, No.9 ISSN 1691-5348
102
of qualified personnel (3.9 from 5 point scale) and lack of financial support (3.5 from 5 point scale) adding
also three internal factors – limited financial resources (4.05 from 5 point scale), too high risk of failure (3.48
from 5 point scale), too high costs related to the introduction of innovation (3.76 from 5 point scale).
Figure 2. Main innovation barriers for innovative companies
Source: composed by the author
Universities and research institutes, as well as micro, small, medium and large companies indicate
external factors more hampering innovation as internal ones, support organizations – internal factors.
Significantly that support organizations that include government level actors as relevant mention also the
factors that are evaluated by innovative companies as the innovation most hampering factors – lack of
financial support and lack of qualified personnel. However, between the representatives of the government
level actors’ dominant is the assessment that the proposed support instruments meet the needs of innovative
companies that is opposite to the evaluation of the companies. It can be concluded that supply of the support
instruments does not meet the demand from the companies.
The evaluation of the main innovation barriers differs between different categories of the companies.
Micro and small companies (MSC) as the main innovation barrier indicate limited financial resources (77%
of MSC assess the impact of this factor as significant or large and 16% as average), lack of government
support (57% of MSC assess the impact of this factor as significant or large and 36% as average), lack of
financial support (63% of MSC assess the impact of this factor as significant or large and 26% as average).
Lack of financial resources is not mentioned by medium sized and large companies (MLC) in the survey as
the main hampering factor. As the main innovation barrier is indicated support services that do not meet the
needs of companies (64% MLC assess the impact of this factor as significant or large and 29% as average),
followed by the lack of support services (50% MLC assess the impact of this factor as significant or large
and 43% as average) and the lack of qualified personnel (57% MLC assess the impact of this factor as
significant or large and 29% as average). Lack of internal and external financial resources in the assessment
of innovation barriers by medium and large companies holds only the fifth and the sixth place.
Assessment of the scientific activities and capacity of Latvian scientific institutions, Guidelines for the
Development of Science, Technology and Innovation for 2014-2020 (STI Guidelines for 2014-2020) and the
Global Competitiveness Report 2014- 2015 was used as the secondary sources of information for the
evaluation of innovation barriers in this research.
While in the primary and secondary sources as the main innovation barrier mostly lack of financial
resources is stressed, it should be remembered that the process of knowledge creation starts with the
determination/selection/influence of the direction of the research, which is a function implemented by
government (seldom – by companies). If this function is not performed effectively, respectively other NIS
functions are not performed and the NIS does not work – its members do not cooperate – the activity is not
directed at the achievement of common objectives.
Identification of the main innovation barriers provides information about problems that companies face in
the innovation process. To remove or at least reduce the innovation barriers there should be appropriate
activities both from the government and from companies’ side. Recommendations to promote innovation
both in the company and in the state level are provided in the chapter three of this paper.
Journal of Business Management, 2015, No.9 ISSN 1691-5348
103
4.IMPROVEMENT OF THE NATIONAL INNOVATION SYSTEM TO PROMOTE
INNOVATION IN LATVIA
The planned public support instruments for this planning period (2014-2020) are highlighted in the STI
Guidelines for 2014-2020.
Analysis of the STI Guidelines for 2014-2020 shows that greater number of activities is focused on the
support of science and research. To promote innovation development it is planned to continue support of
activities of technology transfer contact points, competence centres, business and technology incubators. It is
planned to extend the amount of early stage financing instruments, as well as the availability of scientific
infrastructure for companies. Corporate income tax discount for the companies that have made investments in the
research and development (R&D) and development of the joint technology transfer platform in the form of 2-3
technology transfer centres where the technology transfer experts and expanded technology transfer services
will be concentrated are the new planned activities for the years 2014-2020.
Based on the results of survey of innovative companies as the most necessary forms of support tax
discount, support for the development of new products and technology and implementation in the production
as well as support for the entrance in the foreign markets is mentioned. Important is also financial support of
patenting and prototyping as well as receiving credit on preferential terms. After comparing the planned state support instruments with the needed by companies it can be concluded that the
offer partly correspond with the demand. There still is unclear support for many important activities, for example,
patenting and prototyping.
From the analysis briefly described in this paper there could be developed several recommendations.
1. Internal innovation barriers can be prevented or reduced by companies on their own but to prevent or
reduce external barriers it is recommended to the companies to cooperate with the other actors of the NIS.
2. It is recommended to the managers/owners of the innovative companies in cooperation with the
Employers’ Confederation of Latvia and other organizations representing interests of industry with the aim
to promote the development of innovative entrepreneurship and improvement of the NIS, to guide the
addressing of the following questions:
a. development and adoption of the main law on innovation – “About innovative entrepreneurship”,
that defines and controls innovative entrepreneurship and foresees incentives for innovative companies;
b. development of the appropriate innovation support infrastructure in the public sector – open and
experimental laboratories, pilot factories, as well as providing support tools for the commercialisation
activities;
c. adoption of national programs, regulations, orders with the mutually coordinated periods of activity;
provision of permanent financing and constant conditions of the most successful national support
instruments;
d. provision of continuous support for the intermediary services between the researchers and the
entrepreneurs; development of the optimal model for this kind of service;
e. raising awareness about the intellectual property (IP) protection issues, development of the support
instruments for obtaining patents, arrangement of the IP protection issues in the laws and regulations, taking
into account the examples of good practice of other countries, for example, Sweden;
f. development of the support programs for academic staff and researchers for obtaining the business
knowledge and skills, including contact hours with the entrepreneurs.
3. It is recommended to the managers/owners of the innovative companies in order to prevent or reduce
innovation barriers to take the following activities:
a. to evaluate company’s resources and take into account existence of such external innovation barriers
as lack of financial support, lack of qualified personnel, lack of appropriate support services;
b. to develop the long-term strategy where company's activities are planned also at the international
level;
c. to evaluate the company's management model and its openness to innovation, if necessary, to make
changes;
d. to promote new knowledge and technology absorption capacity of the company's employees;
e. to carry out training of the employees regularly and to provide an opportunity to participate in the
exchange visits;
f. to build a team of professionals with complementary expertise.
4. It is recommended to Cross-sectoral Coordination Centre to take following activities:
a. to take the responsibility for the development and management of the NIS and the development and
implementation of the innovation policy;
Journal of Business Management, 2015, No.9 ISSN 1691-5348
104
b. to perform purposefully the analysis if the NIS and on this basis to develop and control the
implementation of the specific instruments aimed for the promotion of innovative entrepreneurship;
c. to be responsible for initiating laws and regulations and budget allocations;
d. to coordinate the flow of information about innovative entrepreneurship in Latvia;
e. to organize business experience exchange forums and informative educational activities;
f. to evaluate the effectiveness of the organisations providing public support in any form for the
knowledge and innovation generation process, make the audit of their functions, to evaluate the performance
indicators, based on the results obtained to perform the optimization of the number of the organisations;
g. to promote cooperation between the Ministry of Education and Science, the Ministry of Economy
and other public authorities at all levels.
5. Additional recommendations for the promotion of innovation aimed at the prevention or reduction
of the innovation barriers indicated in this research:
a. to develop and offer training programs for the change of mind-set and motivation of the
entrepreneurs in order to facilitate the transition to the business model that is oriented towards the fast
development, international entrepreneurship and sustainable competition;
b. to carry out the assessment of the technology absorption capacity of companies and to develop
appropriate tools for the promotion of this capability;
c. to activate the municipalities for the search and development of the new forms of support of
innovative entrepreneurship;
d. to develop the regional innovative entrepreneurship information centres or to expand the functions of
the existing innovation supporting organizations;
e. to activate the development of the scientific/technological/industrial parks, which operate in the
accordance with the world practice by attracting the national, EU and foreign direct investment;
f. to achieve the tax reduction to a level where all the taxes do not exceed the taxes in the neighbouring
EU member states and to introduce the tax incentives to boost the number of companies involved in the
research, development and innovation;
g. to encourage credit institutions also to evaluate and provide financing for the innovative projects;
h. to ensure the advance payments for the implementation of the companies’ projects approved in the
various EU programs;
i. to introduce the instruments for the support of the protection of IP abroad;
j. to increase the public procurement and to promote the public-private partnership projects;
k. to develop and support risk financing program for the early-stage innovative entrepreneurship.
5.CONCLUSIONS
1. This paper contains the main results, conclusions and recommendations of the doctoral thesis.
2. Conclusions and recommendations of this research were sent to the 71 innovative companies that
have participated in the survey. Answers were received from 9 companies.
3. None of the owners/managers of the 9 companies have objected to the conclusions and
recommendations. Recommendations as a whole were evaluated as good and possible to use in the
promotion of the implementation of innovation. Some respondents have suggested preparing some
recommendations more detailed.
4. As important issues promotion of the cooperation between entrepreneurs and scientists/researchers,
the need to approximate the qualification of workforce to the needs of companies, the promotion of the
justice in the country, the promotion of the access to the markets, the optimization of public administration,
the improvement of the innovation support infrastructure in the public sector, the establishment of the joint
coordinating centre, was highlighted.
5. There is a need for additional research of the impact of the NIS on innovation, of the innovation
barriers especially the internal barriers. The illustration of the methodology on the basis of analysis of one
NIS is not sufficient to draw conclusions on the usefulness of the framework.
REFERENCES
1. Bergek, A. at al. (2008), “Analyzing the functional dynamics of technological innovation systems: A scheme of
analysis”, Research Policy, 37, 407-429.
2. Chaminade, C. et al. (2012), “Measuring systematic problems in National Innovation Systems. An application to
Thailand”, Research Policy, 41, 1476-1488.
Journal of Business Management, 2015, No.9 ISSN 1691-5348
105
3. Delvenne, P. & Thoreau, F. (2012), “Beyond the “Charmed Circle” of OECD: New Directions for Studies of
National Innovation Systems”, Minerva, 50, 205-219.
4. Edquist, C. & Hommen, L. (2008), Small Country Innovation Systems. Globalization, Change and Policy in Asia
and Europe, Edward Elgar.
5. Edquist, C. (2001), “The Systems of Innovation Approach and Innovation Policy: An account of the state of the art”,
paper presented at the DRUID Conference, 12-15 June, Aalborg, available at:
http://www.druid.dk/uploads/tx_picturedb/ds2001-178 (accessed: 9 November 2013).
6. Fagerberg, J. & Sapprasert, K. (2011), “National innovation systems: the emergence of a new approach”, Science
and Public Policy, November, 669-679.
7. Forrest, J. E. (1991), “Models of the Process of Technological Innovation”, Technology Analysis & Strategic
Management, 3 (4), 439-453.
8. Galanakis, K. (2006), “Innovation process. Make sense using system thinking”, Technovation, 26, 1222-1232.
9. Ghazinoory, S. & Bitaab, A. (2014), “Social capital and national innovation system: a cross-country analysis”,
Cross Cultural Management, 21, 453-475.
10. Gopalakrishnan, S. & Damanpour, F. (1997), “A review of innovation research in economics, sociology and
technology management”, Omega, 25, 15-28.
11. “Guidelines for the Development of Science, Technology and Innovation for 2014-2020” (2013), Latvijas vestnesis,
30 December 2013, No 253.
12. Hekkert, M.P. et al. (2007), “Functions of innovation systems: A new approach for analysing technological change”,
Technological Forecasting and Social Change, 74, 413-432.
13. Hobday, M. (2005), “Firm-level Innovation Models: Perspectives on Research in Developed and Developing
Countries”, Technnology Analysis & Strategic Management”, 17(2), 121-146.
14. Holzl, E. & Janger, J. (2013), “Does the analysis of innovation barriers perceived by high growth firms provide
information on innovation policy priorities?”, Technological Forecasting & Social Change, 80, 1450-1468.
15. Hueske, A.-K.et al. (2015), “External environment, the innovating organization, and its individuals: A multilevel
model for identifying innovation barriers accounting for social uncertainties”, Journal of Engineering and
Technology Management, 35, 45-70.
16. Johnson, A. & Jacobsson, S. (2000), “The Emergence of a Growth Industry: A Comparative Analysis of the
German, Dutch and Swedish Wind Turbine Industries”, paper presented at the Schumpeter Conference, 28 June-2
July, Manchester, United Kingdom, available at: http://www.cric.ac.uk/cric/events/schumpeter/papers/100.pdf
(accessed: 10 October 2013).
17. Lamprinopoulou, C.et al. (2014), “Application of an integrated systemic framework for analysing agricultural
innovation systems and informing innovation policies: Comparing the Dutch and Scottish agrifood sectors”,
Agricultural Systems, 129, 40-54.
18. LIAA (2012), Innovative Companies in Latvia 2011, Riga.
19. Lisetchi, M. & Brancu, L. (2014), “The entrepreneurship concept as a subject of social innovation”, Procedia –
Social and Behavioral Sciences, 124, 87-92.
20. Liu, X. & White, S. (2001), “Comparing innovation systems: a framework and applications to China’s transitional
context”, Research Policy, 30, 1091-1114.
21. Lukjanska, R. (2010), “Internal and external innovation hindering obstacles at SME”, paper presented at the
International Scientific Conference BMRA 2010 “Innovation Driven Entrepreneurship”, 14-16 October, Vilnius,
available at: http://www.ism.lt/bmra/2010/CP%2039%20Renate%20Lukjanska.pdf (accessed: 20 April 2015).
22. Lundvall, B. (1992), A. National Systems of Innovation: Towards a Theory of Innovation and Interactive Learning,
London: Anthem Press.
23. Mohnen, P.et al. (2008), “Financial Constraints and Other Obstacles: Are they a Threat to Innovation Activity?”, De
Economist, 156 (2), 201-214.
24. Niosi, J. (2008), “Technology, Development and Innovation Systems: An Introduction”, Journal of Development
Studies, 44 (5), 613-621.
25. Parthasarthy, R. & Hammond, J. (2002), “Product innovation inputs and outcome: moderating effects of the
innovation process”, Journal Engineering and Technology Management, 19, 75-91.
26. Quintane, E.et al. (2011), “Innovation as a knowledge-based outcome”, Journal of knowledge management, 15,
928-947.
27. Resele, L. (2014a), “Measuring the functionality of National innovation system”, Journal of Business Management,
8, 52-62
28. Resele, L. (2014b), “Measuring problems in small country National Innovation System. An application to Latvia”,
in CD of the 6th International Scientific ECEE Conference „Economic Challenges in Enlarged Europe”, 15-17
June, Tallinn: Tallinn University of Technology, ISSN: 2382-6797
29. Rowley, J.et al. (2011), “Towards an innovation-type mapping tool”, Management Decision, 49 (1), 73-86.
30. Silva, M.et al. (2007), “Barriers to Innovation faced by Manufacturing Firms in Portugal: How to overcome it?”,
MPRA Paper No.5408, University of Beira Interior, Covilha, Portugal, 23 October.
31. Suriyani, M. et al. (2012), “The Missing Link of Human Capital Development in National System of Innovation
Model”, Advances in Natural and Applied Sciences, 6(6) 875-881.

Journal of Business Management, 2015, No.9 ISSN 1691-5348
106
32. Van Hemert, P.et al. (2013), “From innovation to commercialization through networks and agglomerations: analysis
of sources of innovation, innovation capabilities and performance of Dutch SMEs”, The Annals of Regional Science,
50, 425-452.
33. Zizlavsky, O. (2013), “Past, Present and Future of the Innovation Process”, International Journal of Engineering
Business Management, 5, 1-8.
Journal of Business Management, 2015, No.9 ISSN 1691-5348
107
LITERATURE REVIEW OF IDEA MANAGEMENT: FOCUSES AND GAPS
Elina Mikelsone
BA School of Business and Finance, K.Valdemara str.161, Riga, Latvia
e-mail: [email protected]
Elita Liela
BA School of Business and Finance, K.Valdemara str.161, Riga, Latvia
e-mail: [email protected]
ABSTRACT
Purpose: on the basis of idea management literature reviewidentify topical literature focuses, content, existing research
gaps and make suggestions on future researches in this field.
Design/methodology/approach: research is based on theoretical research methods, which include literature review and
descriptive statistics. This detailed literature review has considered 68 of scholarly empirical publications, conference
proceedings, books and popular market reports published over the last 33 years, i.e., from January 1982 to February
2015, in all research fields.
Findings: the results of the research revealed that the amount literature sources created from 2002 till March 2015 has
steadly grown, but it is still relatively low. Results probe that idea management mainly described in innovation as well
in information technology literature. Idea management is topical and perspective to research, the authors have
developed a large range of possible future research ways that shows that this topic is inexhaustible. There is a
perspective to create literature review with the focus on the terms of idea management and idea management systems
because research results reflect that there is no united view on these terms.
Research limitations: data collection of 7 databases with time focus from January 1982 to February 2015. Future
researches must include wider data collection as well as to continue to research dynamics and content of the literature
about this topic in future periods.
Originality/value: the paper gives overview about the idea management literature (reflecting the most often used
research methods, literature, and theories) and identifies literature and researchgaps.This paper emphasis potential
research objectives.It is hoped that this article will stimulate scholarly dialog and researches about idea management.
Paper type: Literature review
Keywords: Idea management, Idea management systems, Innovation, Innovation management, Literature review,
Research gap
1.INTRODUCTION
According to Karanjikar (2007) at information age, every organization has access to the same information
(tools, techniques, literature, conferences etc.), on the basis of it, the question how to achieve a breakthrough
successbecamemore important, and the solution given is idea management. Ideas are the potential trampoline
for many innovation ventures, several researchers and practitioners pointat the opportunity to improve
innovation through managing improvements in the front-end innovation (Khurana, Rosenthal, 1998; Day,
Gold, Kuczmarski, 1994; Zhang, Doll, 2001), including idea management. Nowadays,organizations seek
new ways of innovations (Westerski, Dalagamagas, Iglesias, 2013), but according to Iversen, Kristensen,
Liland, Berman, Enger, Losnedahl (2009) there is a gap between the existing importance of innovation and
the effectiveness and appropriateness of approaches and methods used to support and accelerate innovation.It
emphases that it is topical and important to research idea management not as a concept, but also its
application, methods etc. to develop appropriate comprehension how to use idea management to accelerate
and support innovation.This situation requires to identifythe main focuses and research gaps in existing
literature to determine topical and unexplored objectives for future researches as well as existing research
approaches (methods, theories, etc.) thatcould help to develop appropriate research structure.The aim of the
literature review is to identify literature dealing with idea management to explore topical focuses and
existing research gaps. Idea management has some connected terms, like, ideation, suggestion boxes etc., but
in this research authors will refer to the idea management as a complex process or tool of generating,
evaluating and implementing ideas.
Research aim: on the basis of idea management literature review to identify topical literature focuses,
content, existing research gaps and make suggestions to future researches in this field.
Research tasks: (1) to manage research in scientific databases to explore literature where idea
management is mentioned and to analyze selected literature; (2) create conclusions and suggestions for
future researches.
Journal of Business Management, 2015, No.9 ISSN 1691-5348
108
Research method: research is based on theoretical research methods, which include literature review and
descriptive statistics.
Research base: literature sources from 7 databases- Scopus, ScienceDirect, Google Scholar, Sage
Journals, Ebsco Academic Search Complete, Emerald, Web Science. In the research mainly secondary
sources (scientific papers, books etc.) and some tertiary sources (scientific papers sources for papers which
are not currently available in the full version) are used.
There is numerous literature with a modest literature review (most of this literature review sources have
literature review elements), but there is lack of specialized and deep literature reviews of idea management.
Novelty of this literature review is the count of analyzed literature sources (in this research 68) and the
research period (January 1982-March 2015), because the latest specialized literature review (Rose, Jensen,
2012) analyzed only 29 sources from 1982 to 2012.
2.LITERATURE REVIEW
According to Boell and Cecez-Kecmanovic (2010) literature review is one of the most important task for
scientific work and has to be done in all scientific disciplines and Boote and Beile (2005) reveals that it
impossible to create significant research without first understanding the literature in the field, but there is a
negative tendencyfor many researchers to have poor literature reviews.Authors had summarize the main
purposes for literature review from researches (Gall, Borg, Gall, 1996; Hart, 1999, Boote, Beile, 2005;
Bolderston, 2008):
1) Delimiting the research problem.
2) Seeking new lines of inquiry.
3) Avoiding fruitless approaches.
4) Identifying recommendations for further research (exploring research gaps).
5) Exploring important variables relevant to the topic.
6) Identifying the main methods, literature, theories that have been used.
7) Give overview about the research field, main findings in the area.
The main purposes of this research are (1) to give overview about the research field (detailed content
analysis and general data analysis (form of the literature source, dynamics) and identifying the main
methods, literature, theories that have been used; (2) to explore important variables relevant to the topic
(research perspectives (IT focus, internal or external idea management focus), structural (focus on design and
process) or social focus (focus on social capital, creativity, cognition etc.)); (3) to identifying
recommendations for further research, exploring research gaps.
Mostly idea management is connected with innovation literature, but it is important to include different
fields in the literature review - many researches (Webster, 2012; Fawcett, 2013; Randolph, 2009) highlight
that it helps to add valuable information to the research and to cover the whole field of research. Based on
this conclusion this literature review has multidisciplinary view.
Summarized literature covers period from 1983 to February 2015. The study ‘’Idea management in R-
and- D as a Human Information- Processing Analog’’ (Green, Bean, Snavely, 1983), according to research,
was the first publication in which the term idea management was mentioned.Scientific databases- Scopus,
ScienceDirect, Google Scholar, Sage Journals, Ebsco Academic Search Complete, Emerald, Web Science-
research was conducted in March 2015.
Novelty of this literature review is the count of analyzed literature sources (in this research 68) and the
research period (January 1982-March 2015), because the latest specialized literature review (Rose, Jensen,
2012) analyzed only 29 sources from 1982 to 2012.
3.RESEARCH METHODOLOGY
Research is based on theoretical research methods, which include literature review and descriptive
statistics. Literature review is sectioned in these research stages: (1) to research in 7 scientific databases to
explore literature where ‘’idea management’’ is mentioned; (2) to select literature directly about idea
management; (3) toexclude duplicates; (4) to analyze selected literature (including descriptive statistics).
Literature review is not restricted to definite academic field, because idea management could be
researched not only in innovation management context but in information technology literature as well.
Results of the literature review are analyzed in several dimensions: (1) general data analysis (form of the
literature source, dynamics); (2) research perspectives (IT focus, internal or external idea management
focus), structural (focus on design and process) or social focus (focus on social capital, creativity, cognition
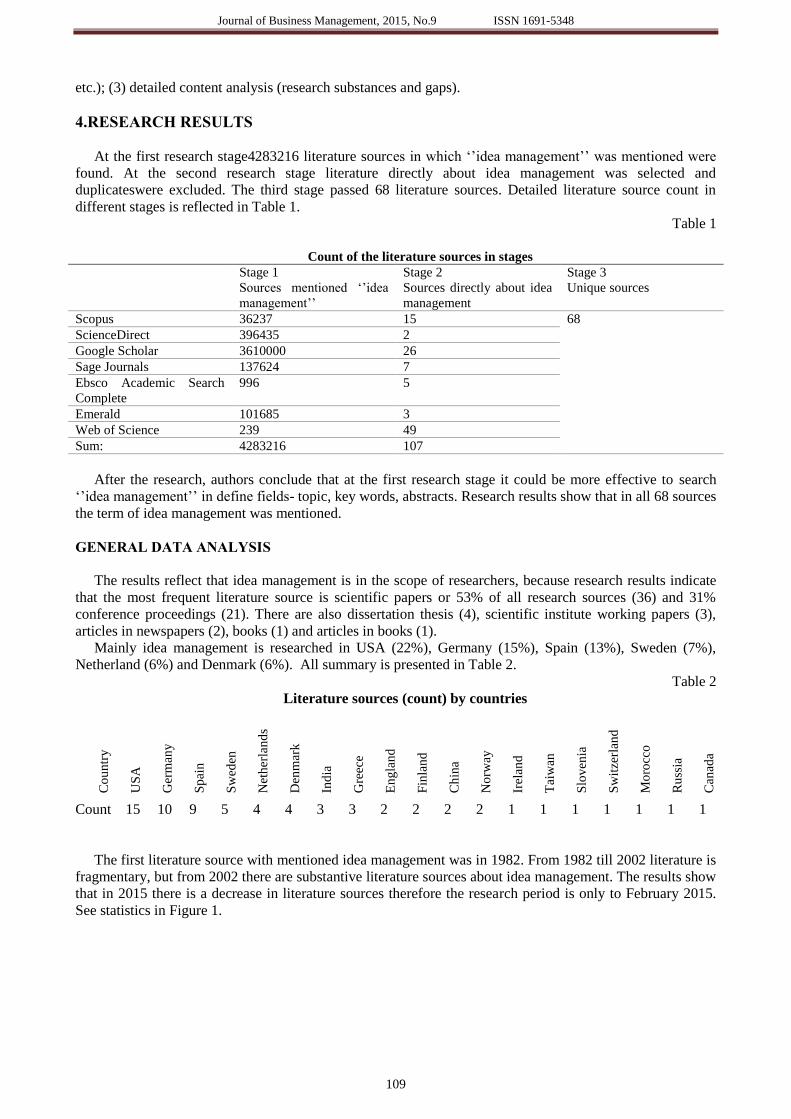
Journal of Business Management, 2015, No.9 ISSN 1691-5348
109
etc.); (3) detailed content analysis (research substances and gaps).
4.RESEARCH RESULTS
At the first research stage4283216 literature sources in which ‘’idea management’’ was mentioned were
found. At the second research stage literature directly about idea management was selected and
duplicateswere excluded. The third stage passed 68 literature sources. Detailed literature source count in
different stages is reflected in Table 1.
Table 1
Count of the literature sources in stages
Stage 1
Sources mentioned ‘’idea
management’’
Stage 2
Sources directly about idea
management
Stage 3
Unique sources
Scopus 36237 15 68
ScienceDirect 396435 2
Google Scholar 3610000 26
Sage Journals 137624 7
Ebsco Academic Search
Complete
996 5
Emerald 101685 3
Web of Science 239 49
Sum: 4283216 107
After the research, authors conclude that at the first research stage it could be more effective to search
‘’idea management’’ in define fields- topic, key words, abstracts. Research results show that in all 68 sources
the term of idea management was mentioned.
GENERAL DATA ANALYSIS
The results reflect that idea management is in the scope of researchers, because research results indicate
that the most frequent literature source is scientific papers or 53% of all research sources (36) and 31%
conference proceedings (21). There are also dissertation thesis (4), scientific institute working papers (3),
articles in newspapers (2), books (1) and articles in books (1).
Mainly idea management is researched in USA (22%), Germany (15%), Spain (13%), Sweden (7%),
Netherland (6%) and Denmark (6%). All summary is presented in Table 2.
Table 2
Literature sources (count) by countries
Co
un
try
US
A
Ger
man
y
Sp
ain
Sw
eden
Net
her
lan
ds
Den
mar
k
Ind
ia
Gre
ece
En
gla
nd
Fin
lan
d
Ch
ina
No
rway
Irel
and
Tai
wan
Slo
ven
ia
Sw
itze
rlan
d
Mo
rocc
o
Ru
ssia
Can
ada
Count 15 10 9 5 4 4 3 3 2 2 2 2 1 1 1 1 1 1 1
The first literature source with mentioned idea management was in 1982. From 1982 till 2002 literature is
fragmentary, but from 2002 there are substantive literature sources about idea management. The results show
that in 2015 there is a decrease in literature sources therefore the research period is only to February 2015.
See statistics in Figure 1.
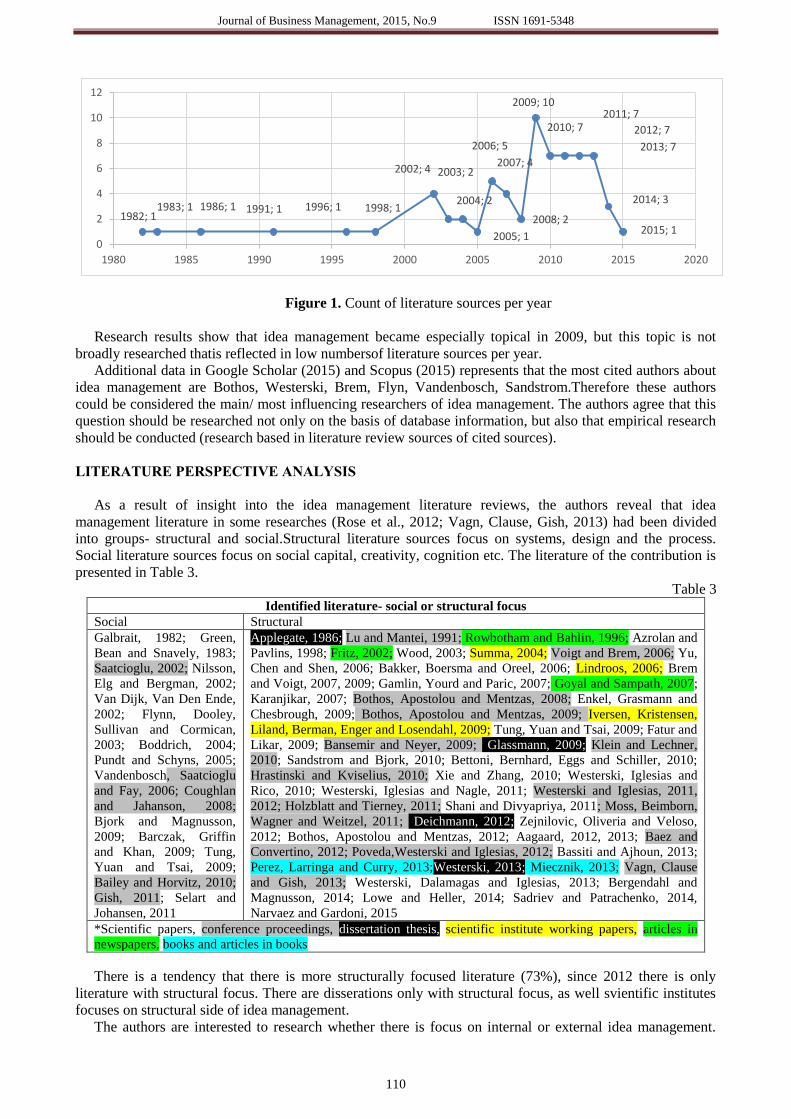
Journal of Business Management, 2015, No.9 ISSN 1691-5348
110
Figure 1. Count of literature sources per year
Research results show that idea management became especially topical in 2009, but this topic is not
broadly researched thatis reflected in low numbersof literature sources per year.
Additional data in Google Scholar (2015) and Scopus (2015) represents that the most cited authors about
idea management are Bothos, Westerski, Brem, Flyn, Vandenbosch, Sandstrom.Therefore these authors
could be considered the main/ most influencing researchers of idea management. The authors agree that this
question should be researched not only on the basis of database information, but also that empirical research
should be conducted (research based in literature review sources of cited sources).
LITERATURE PERSPECTIVE ANALYSIS
As a result of insight into the idea management literature reviews, the authors reveal that idea
management literature in some researches (Rose et al., 2012; Vagn, Clause, Gish, 2013) had been divided
into groups- structural and social.Structural literature sources focus on systems, design and the process.
Social literature sources focus on social capital, creativity, cognition etc. The literature of the contribution is
presented in Table 3.
Table 3 Identified literature- social or structural focus
Social Structural
Galbrait, 1982; Green,
Bean and Snavely, 1983;
Saatcioglu, 2002; Nilsson,
Elg and Bergman, 2002;
Van Dijk, Van Den Ende,
2002; Flynn, Dooley,
Sullivan and Cormican,
2003; Boddrich, 2004;
Pundt and Schyns, 2005;
Vandenbosch, Saatcioglu
and Fay, 2006; Coughlan
and Jahanson, 2008;
Bjork and Magnusson,
2009; Barczak, Griffin
and Khan, 2009; Tung,
Yuan and Tsai, 2009;
Bailey and Horvitz, 2010;
Gish, 2011; Selart and
Johansen, 2011
Applegate, 1986; Lu and Mantei, 1991; Rowbotham and Bahlin, 1996; Azrolan and
Pavlins, 1998; Fritz, 2002; Wood, 2003; Summa, 2004; Voigt and Brem, 2006; Yu,
Chen and Shen, 2006; Bakker, Boersma and Oreel, 2006; Lindroos, 2006; Brem
and Voigt, 2007, 2009; Gamlin, Yourd and Paric, 2007; Goyal and Sampath, 2007;
Karanjikar, 2007; Bothos, Apostolou and Mentzas, 2008; Enkel, Grasmann and
Chesbrough, 2009; Bothos, Apostolou and Mentzas, 2009; Iversen, Kristensen,
Liland, Berman, Enger and Losendahl, 2009; Tung, Yuan and Tsai, 2009; Fatur and
Likar, 2009; Bansemir and Neyer, 2009; Glassmann, 2009; Klein and Lechner,
2010; Sandstrom and Bjork, 2010; Bettoni, Bernhard, Eggs and Schiller, 2010;
Hrastinski and Kviselius, 2010; Xie and Zhang, 2010; Westerski, Iglesias and
Rico, 2010; Westerski, Iglesias and Nagle, 2011; Westerski and Iglesias, 2011,
2012; Holzblatt and Tierney, 2011; Shani and Divyapriya, 2011; Moss, Beimborn,
Wagner and Weitzel, 2011; Deichmann, 2012; Zejnilovic, Oliveria and Veloso,
2012; Bothos, Apostolou and Mentzas, 2012; Aagaard, 2012, 2013; Baez and
Convertino, 2012; Poveda,Westerski and Iglesias, 2012; Bassiti and Ajhoun, 2013;
Perez, Larringa and Curry, 2013;Westerski, 2013; Miecznik, 2013; Vagn, Clause
and Gish, 2013; Westerski, Dalamagas and Iglesias, 2013; Bergendahl and
Magnusson, 2014; Lowe and Heller, 2014; Sadriev and Patrachenko, 2014,
Narvaez and Gardoni, 2015
*Scientific papers, conference proceedings, dissertation thesis, scientific institute working papers, articles in
newspapers, books and articles in books
There is a tendency that there is more structurally focused literature (73%), since 2012 there is only
literature with structural focus. There are disserations only with structural focus, as well svientific institutes
focuses on structural side of idea management.
The authors are interested to research whether there is focus on internal or external idea management.
1982; 1 1983; 1 1986; 1 1991; 1 1996; 1 1998; 1
2002; 4 2003; 2
2004; 2
2005; 1
2006; 5
2007; 4
2008; 2
2009; 10
2010; 7 2011; 7
2012; 7
2013; 7
2014; 3
2015; 1 0
2
4
6
8
10
12
1980 1985 1990 1995 2000 2005 2010 2015 2020

Journal of Business Management, 2015, No.9 ISSN 1691-5348
111
Focus on internal idea management in the literature was especially pronounced from 1982 to 2006. It could
be explained by the distribution of open innovation ideas which appoint importance of both internal and
external ideas. The authors consider that this topic should be researched more deeplydetermining what kind
of factors influenced distribution of internal or external idea management in literature. Internal idea
management ideas are dominated in literature (74%), because only in 9% of literature focuses on external
idea management, but on idea management mix- 17% (3 literature sources were without any focus).
Distribution of literature see in Figure 2.
Figure 2. Identified literature- external/ internal/ mix focuses
Chesbrough (2003) revealed that organizations should work with smart people inside and outside the
organization. Chesbrough is one of the well-known open innovation researchers and with that conclusion
he highlights that organizations should use internal as well as external idea sources. The study of Miles et
al., (2005) emphases the aspects of cooperation in internal networks, but other studies focus (Bothos et
al., 2008; Chen et al., 2002) on external networks. The research (Brem et al., 2007) also shows that
integration of idea management is important for successful innovation. So, it is important to research
both factors and how to integrate them. The research results show that there are few researches which
research both.
IT aspects with idea management have been researched since 1986. The pioneer in this area was
Applegate (1986). 54% of all researched literature has focus on IT aspects, for example, tools,
opportunities etc. It is important to research IT aspects, for example, he study (INSEAD, 2012) revealed
that information technologies and their tools are among the elements which enhance innovation process.
According to Yoo et al. (2012) there is a growing significance of digital technologies in innovation
processes, Coughlan et al. (2008) also insists that with IT development there are accessible new idea
management tools. In the study Lin (2007) mentions that frequently these tools are applications which
allow users to share with opinions and resources. The researches (Schmidt, 2006; Richter et al., 2006)
reflect, for example, WebStorm, Idea Central, Cogni Streamer, which lets manage information,
communication, coordination and corporation in social networks and Bakker et al. (2006) emphases that
their significance only increases.
The authors consider that researched literature sources could be divided in two groups: (1) research of
specific idea management systems (for example, Fritz, 2012; Lu et al., 1991), but it is important
emphasize that there are researches which stress some specific idea management system features and
explore how to improve them, like data linkage (for example, Perez, Larrinaga, Curry, 2013), classifying
and comparing ideas (for example, Westerski et al., 2013) etc., (2) researches with the aim to develop
new idea management systems (for example, Applegate, 1986; Lindroos, 2006). See Table 4.
Galbraith, 1982; Green et al., 1983; Applegate,
1986; Lu et al., 1991; Rowbotham et al., 1996;
Azrolan et al., 1998; Saatchioglu, 2002; Van Dijk et al., 2002; Flynn et al., 2003; Wood, 2003; Boeddrich, 2004;
Summa, 2004; Pundt et al., 2005; Vandenbosch et al., 2005;
Voigt et al., 2006; Yu et al., 2006; Bakker et al., 2006; Lindroos, 2006; Gamlin et al., 2007; Goyal et al., 2007;
Coughlan et al., 2008; Bjork et al., 2009; Barczak et al.,
2009; Iversen et al., 2009; Fatur et al., 2009; Bansemir et al., 2009; Glassmann, 2009; Klein et al., 2010; Bettoni et al.,
2010; Bailey et al., 2010; Hrastinski et al., 2010; Xie et al.,
2010; Westerski et al., 2011a; Selart et al., 2011; Gish, 2011; Shani et al., 2011; Moss et al., 2011; Deichmann, 2012;
Zejnilovic at al., 2012; Aagaard, 2012, 2013; Poveda et al.,
2012; Bassiti et al., 2013; Perez et al., 2013; Vagn et al.,
2013; Bergendahl et al., 2014; Lower et al., 2014
Fritz, 2002; Nilsson et
al., 2002; Voigt et al.,
2006; Brem et al., 2007;
Enkel et al., 2009;
Brem et al., 2009; Sandstrom et al., 2010;
Westerski et al., 2012;
Baez et al, 2012; Sadriev et al., 2014;
Narvaez et al., 2015
Bothos et al., 2008; Tung et
al., 2009;
Westerski et al, 2011; Bothos et
al., 2012;
Westerski et al., 2013; Westerski
et al., 2013a
External Mix
Internal
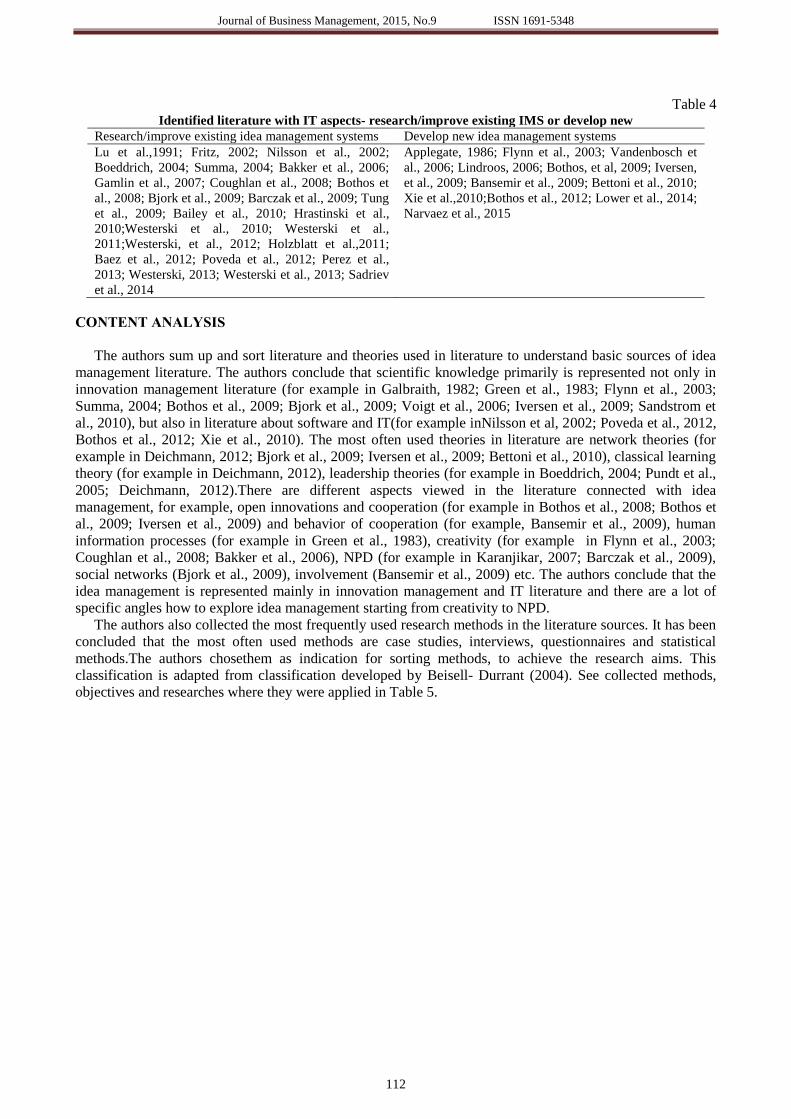
Journal of Business Management, 2015, No.9 ISSN 1691-5348
112
Table 4 Identified literature with IT aspects- research/improve existing IMS or develop new
Research/improve existing idea management systems Develop new idea management systems
Lu et al.,1991; Fritz, 2002; Nilsson et al., 2002;
Boeddrich, 2004; Summa, 2004; Bakker et al., 2006;
Gamlin et al., 2007; Coughlan et al., 2008; Bothos et
al., 2008; Bjork et al., 2009; Barczak et al., 2009; Tung
et al., 2009; Bailey et al., 2010; Hrastinski et al.,
2010;Westerski et al., 2010; Westerski et al.,
2011;Westerski, et al., 2012; Holzblatt et al.,2011;
Baez et al., 2012; Poveda et al., 2012; Perez et al.,
2013; Westerski, 2013; Westerski et al., 2013; Sadriev
et al., 2014
Applegate, 1986; Flynn et al., 2003; Vandenbosch et
al., 2006; Lindroos, 2006; Bothos, et al, 2009; Iversen,
et al., 2009; Bansemir et al., 2009; Bettoni et al., 2010;
Xie et al.,2010;Bothos et al., 2012; Lower et al., 2014;
Narvaez et al., 2015
CONTENT ANALYSIS
The authors sum up and sort literature and theories used in literature to understand basic sources of idea
management literature. The authors conclude that scientific knowledge primarily is represented not only in
innovation management literature (for example in Galbraith, 1982; Green et al., 1983; Flynn et al., 2003;
Summa, 2004; Bothos et al., 2009; Bjork et al., 2009; Voigt et al., 2006; Iversen et al., 2009; Sandstrom et
al., 2010), but also in literature about software and IT(for example inNilsson et al, 2002; Poveda et al., 2012,
Bothos et al., 2012; Xie et al., 2010). The most often used theories in literature are network theories (for
example in Deichmann, 2012; Bjork et al., 2009; Iversen et al., 2009; Bettoni et al., 2010), classical learning
theory (for example in Deichmann, 2012), leadership theories (for example in Boeddrich, 2004; Pundt et al.,
2005; Deichmann, 2012).There are different aspects viewed in the literature connected with idea
management, for example, open innovations and cooperation (for example in Bothos et al., 2008; Bothos et
al., 2009; Iversen et al., 2009) and behavior of cooperation (for example, Bansemir et al., 2009), human
information processes (for example in Green et al., 1983), creativity (for example in Flynn et al., 2003;
Coughlan et al., 2008; Bakker et al., 2006), NPD (for example in Karanjikar, 2007; Barczak et al., 2009),
social networks (Bjork et al., 2009), involvement (Bansemir et al., 2009) etc. The authors conclude that the
idea management is represented mainly in innovation management and IT literature and there are a lot of
specific angles how to explore idea management starting from creativity to NPD.
The authors also collected the most frequently used research methods in the literature sources. It has been
concluded that the most often used methods are case studies, interviews, questionnaires and statistical
methods.The authors chosethem as indication for sorting methods, to achieve the research aims. This
classification is adapted from classification developed by Beisell- Durrant (2004). See collected methods,
objectives and researches where they were applied in Table 5.
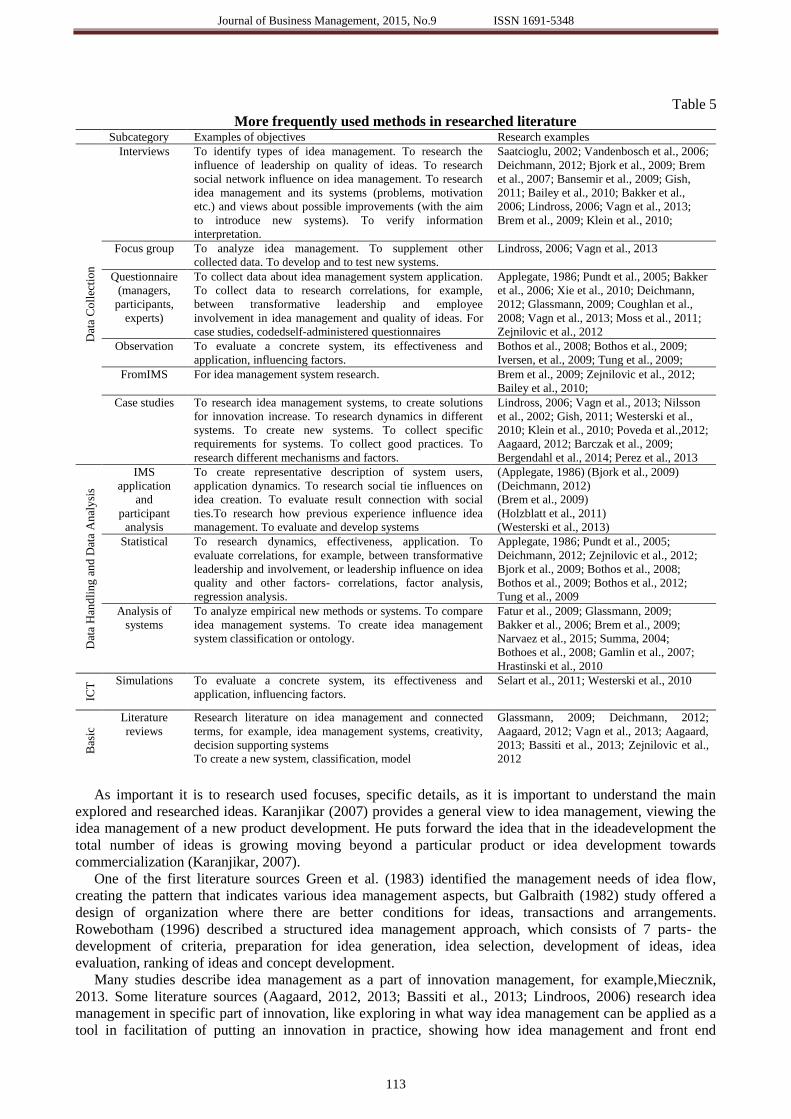
Journal of Business Management, 2015, No.9 ISSN 1691-5348
113
Table 5
More frequently used methods in researched literature Subcategory Examples of objectives Research examples
Dat
a C
oll
ecti
on
Interviews To identify types of idea management. To research the
influence of leadership on quality of ideas. To research
social network influence on idea management. To research
idea management and its systems (problems, motivation
etc.) and views about possible improvements (with the aim
to introduce new systems). To verify information
interpretation.
Saatcioglu, 2002; Vandenbosch et al., 2006;
Deichmann, 2012; Bjork et al., 2009; Brem
et al., 2007; Bansemir et al., 2009; Gish,
2011; Bailey et al., 2010; Bakker et al.,
2006; Lindross, 2006; Vagn et al., 2013;
Brem et al., 2009; Klein et al., 2010;
Focus group To analyze idea management. To supplement other
collected data. To develop and to test new systems.
Lindross, 2006; Vagn et al., 2013
Questionnaire
(managers,
participants,
experts)
To collect data about idea management system application.
To collect data to research correlations, for example,
between transformative leadership and employee
involvement in idea management and quality of ideas. For
case studies, codedself-administered questionnaires
Applegate, 1986; Pundt et al., 2005; Bakker
et al., 2006; Xie et al., 2010; Deichmann,
2012; Glassmann, 2009; Coughlan et al.,
2008; Vagn et al., 2013; Moss et al., 2011;
Zejnilovic et al., 2012
Observation To evaluate a concrete system, its effectiveness and
application, influencing factors.
Bothos et al., 2008; Bothos et al., 2009;
Iversen, et al., 2009; Tung et al., 2009;
FromIMS For idea management system research. Brem et al., 2009; Zejnilovic et al., 2012;
Bailey et al., 2010;
Case studies To research idea management systems, to create solutions
for innovation increase. To research dynamics in different
systems. To create new systems. To collect specific
requirements for systems. To collect good practices. To
research different mechanisms and factors.
Lindross, 2006; Vagn et al., 2013; Nilsson
et al., 2002; Gish, 2011; Westerski et al.,
2010; Klein et al., 2010; Poveda et al.,2012;
Aagaard, 2012; Barczak et al., 2009;
Bergendahl et al., 2014; Perez et al., 2013
Dat
a H
and
ling
an
d D
ata
An
aly
sis
IMS
application
and
participant
analysis
To create representative description of system users,
application dynamics. To research social tie influences on
idea creation. To evaluate result connection with social
ties.To research how previous experience influence idea
management. To evaluate and develop systems
(Applegate, 1986) (Bjork et al., 2009)
(Deichmann, 2012)
(Brem et al., 2009)
(Holzblatt et al., 2011)
(Westerski et al., 2013)
Statistical To research dynamics, effectiveness, application. To
evaluate correlations, for example, between transformative
leadership and involvement, or leadership influence on idea
quality and other factors- correlations, factor analysis,
regression analysis.
Applegate, 1986; Pundt et al., 2005;
Deichmann, 2012; Zejnilovic et al., 2012;
Bjork et al., 2009; Bothos et al., 2008;
Bothos et al., 2009; Bothos et al., 2012;
Tung et al., 2009
Analysis of
systems
To analyze empirical new methods or systems. To compare
idea management systems. To create idea management
system classification or ontology.
Fatur et al., 2009; Glassmann, 2009;
Bakker et al., 2006; Brem et al., 2009;
Narvaez et al., 2015; Summa, 2004;
Bothoes et al., 2008; Gamlin et al., 2007;
Hrastinski et al., 2010
ICT
Simulations To evaluate a concrete system, its effectiveness and
application, influencing factors.
Selart et al., 2011; Westerski et al., 2010
Bas
ic
Literature
reviews
Research literature on idea management and connected
terms, for example, idea management systems, creativity,
decision supporting systems
To create a new system, classification, model
Glassmann, 2009; Deichmann, 2012;
Aagaard, 2012; Vagn et al., 2013; Aagaard,
2013; Bassiti et al., 2013; Zejnilovic et al.,
2012
As important it is to research used focuses, specific details, as it is important to understand the main
explored and researched ideas. Karanjikar (2007) provides a general view to idea management, viewing the
idea management of a new product development. He puts forward the idea that in the ideadevelopment the
total number of ideas is growing moving beyond a particular product or idea development towards
commercialization (Karanjikar, 2007).
One of the first literature sources Green et al. (1983) identified the management needs of idea flow,
creating the pattern that indicates various idea management aspects, but Galbraith (1982) study offered a
design of organization where there are better conditions for ideas, transactions and arrangements.
Rowebotham (1996) described a structured idea management approach, which consists of 7 parts- the
development of criteria, preparation for idea generation, idea selection, development of ideas, idea
evaluation, ranking of ideas and concept development.
Many studies describe idea management as a part of innovation management, for example,Miecznik,
2013. Some literature sources (Aagaard, 2012, 2013; Bassiti et al., 2013; Lindroos, 2006) research idea
management in specific part of innovation, like exploring in what way idea management can be applied as a
tool in facilitation of putting an innovation in practice, showing how idea management and front end
Journal of Business Management, 2015, No.9 ISSN 1691-5348
114
innovation are related and may support each other. There is even idea management in front end innovations
in specific industriesresearched, for example, in the Aagaard study (2012) pharmacy, proposing conclusions
for effective facilitation of idea management.Confronting opinion is expressed by Barczak et al. (2009) who
concluded that results about idea management role in innovation management at an early stage is unclear, but
confirms the need for management improvement.
Sandstrom et al. (2010) indicated that the nature of innovation over the last decade has changed from
incremental innovation to business model innovation and open innovation and these changes also place new
demands on the idea management systems, the study revealed requirementsof how to meet this need. Bailey
et al. (2010) explores idea management in connection with specific innovation type- grassroots innovation.
The study researches how idea management could support grassroots innovation.
Saatcioglu (2002) detected certain manager archetypes in idea management, also Vandenbosch et al.
(2006) described the idea of archetype management, focusing on the leaders and how their personality type
affectsthe management of ideas, understanding of these types can improve management. The paper also
highlights an interesting idea that human idea management system can exist by itself, but the IT idea
management system cannot, which revealed an important part of various tool application and management.
But Selart et al (2011) described two thinking types- value-focused thinking and alternative thinking,
concluding that the value focused thinking influences idea management, it decreases the number of created
ideas but increases quality of ideas. Wood (2003) created descriptions of 4 types of organizations, which
reflects how they handle ideas. In this study the figure that illustrates these 4 types of organizationswas
developed which shows that not only do we need to generate ideas (be creative), but that we also must have a
system to put them in place (to innovate). Wood (2003) looks at idea management as at a process with
several stages –an effective idea-generation, idea handling, effective idea-evaluation process, idea
implementation, recognizing/ rewarding those involved- study describes also the preconditions and factors of
these stagesto be effective.
Lu et al. (1991) focused on the computerized drawing tools that support the design idea management,
focusing on the idea management of groups. Researchers created a compilation of ideas with the group
management activities, identifying user requirements and their implementation with CaveDraw system (Lu et
al., 1991). Also Goyal et al. (2007) describes the structure how companies can manage employee’s ideas (at
various levels). But Coughlan et al. (2008) examined the idea management process on individual and social
level, exploring how ideas occur in creative work and the strategies and tools used to represent and develop
them.
Vagn et al. (2013) concerns idea management in front-end innovation of R&D organizations. Research
shows how managers and employees navigate in organization structures, technical features, creativity and
interactions. Vagn et al, (2013) have created new theoretical framework of idea management that suggests a
dynamic network structure comprised of the dimensions of space, content and process. But Bergendahl et al.
(2014) addressed the paper to collaborative and competitive mechanisms used in firm-internal idea
management, revealing that the two approaches can be combined, and explored how their paradoxical
coexistence can be managed.
Iversen et al. (2009) and Shani et al. (2011) introduced new idea management conceptswhichare based on
a life-cycle perspective on innovation, where the aim is to support all phases of innovation.But the Bassiti et
al. (2013) constructed a new idea management life cycle that aims to support all activities of the front-end of
innovation; this cycle consists of four key parts: idea generation, evaluation, implementation and links. The
study described techniques that can be used in each part. Also Bansemir et al. (2009) presents the idea that an
organization needs new idea management concept- interactive idea management system that includes
multidisciplinary creation of teamsand social software applications.Voigt et al. (2006) and Brem et al. (2007)
recommended involving in the idea management not only internal sources of ideas, but also external ones in
a structured way, so creating an integrated idea management system. Brem et al. (2007) also highlights that
the earlier an integrated idea management is implemented, the greater is the probability of successful
innovations.Enkel et al. (2009) aimed to advance R&D, innovation and technology management perspective.
Researcher explored idea management as open innovation tool which could involve internal and external
ideas. Enkel et al. (2009) also highlights that the internet provides the opportunity to involve external sources
in idea management.
Integration of market pull and technology push in the corporate front end and innovation management
was researched by Brem et al. (2009), introducing advanced framework that can be used in today’s corporate
environment. But competition and cooperation in idea management were explored by Tung et al. (2010).
Bakker et al. (2006) researched idea management as a creativity management, the study focused on
industrial R&D organizations. Researchers developed crea-political process model in which there is an
Journal of Business Management, 2015, No.9 ISSN 1691-5348
115
ample room for the thought that ideas emerge and survive within a social-political context and the research
findings challenge the literature of idea management in organization to consider the political activities of
ideation in the whole process of creativity.Creativity research was also conducted in Van Dijk et al. (2002)
study which summarizes the organizational factors related to the management of creativity to transform the
creativity into ideas. Yu et al. (2006) developed an idea management model based on ‘’total innovation
management’’ with the aim to increase innovation results in companies in China, but Xie et al. (2010)
established the idea management system that covers the entire idea management process and helps team
building.
Lower et al. (2014) presented research results and practical experience regarding implementations of
PLM systems in a set of companies, namely, at the early stages of product planning and innovation
management. Lower et al. (2014) developed an extended data model in combination with a reference process
model for innovation and idea management and described implementation of that in a state of the art PLM
system. Moss et al. (2011) analyzed if knowledge management and innovation governance distinguish top
innovation performers, reflecting that the aim of idea management systems is to support human idea
management to increase innovation capacity.Holzblatt et al. (2011) explores how social media can affect the
process of innovation, idea management is viewedin the context of innovationand recommendations were
developed to assess and monitor the impact of social media on innovation, business strategy.
Flynn et al. (2003) in the paper present methodology to facilitate the organizational management of idea
generation process, an integrated software tool- Creations are also introduced. Software was also researched
by Summa (2004). Research mapped 26 existing commercially available idea management software and
evaluated the available technologies and software in relation to the idea management needs, evaluated their
functions and structures. In this research the author developed software selection methodology and
evaluation criteria that can also be usedin other studies. Research also highlights that it is unable to rank the
software and set out the reasons. From the same Innovation Management Institute, the study (Lindroos,
2006) revealed the development and theoretical basis of an idea management process in a medium-sized
organization producing physical products.Idea management in this research was explored in innovation as an
initial phase or front-end. In research it was indicated that all ideas management processes and tools should
be well introduced and applied. It also outlined the basics of the front end innovation support infrastructure.
Technologies for open innovation were investigated by Hrastinski et al. (2010). The paper explores how
current technologies are designed to support open innovation and develops the classification of open
innovation systems and one of the categories is an idea management system which lets users suggest,
evaluate and discuss ideas openly or within predefined categories. It is concluded that IT systems do not
support initial stages and definingof ideas. Also Nilsson et al. (2002) study exploredidea management
systems and developed recommendations for application of these systems to increase the innovation
capacity. It is concluded that idea management systems in organizations strengthen the innovation capacity
of enterprises. The paper explores main aspects for more useful applications- specific objectives, IT role,
creators’ role in the realization of the idea, the way in which ideas are turned into products (Nilsson et al.,
2002).
Fatures et al. (2009) developed the performance assessment methodology ofidea management, but
Glasmann (2009) established model '' Glassman Model for Managing Idea Generation '', which helps to
control idea management.
Sadriev et al. (2014) considers prerequisites of origins of the idea management systems and analyzes their
application, a special attention is paid to software. They also mentioned 3 types of idea management systems,
but without substations. The strong point is that the authors created one of the first brief idea management
system history. But one of the first researchers who divided idea management in groups was Gamlin et al.
(2007). They presented the idea of ''active'' idea management, so separating the newest idea management
type frompredecessor 'Suggestion Box' which we could call ‘’passive’’ idea management.Gamlin et al.
(2007) found that more successful idea management results are achieved whenidea management is conducted
parallel in real life and in the internet. The researcher in the paper discusses possible issues that can be
resolved with idea management and the basic elements of a successful IM and possible benefits.
Perez et al. (2013) analyze the impact of semantic-enabled idea management systems within a sustainable
innovation process, in particular, exploring how ideas can be enriched with contextual Linked Open Data. A
specific questionis also exploredby Baez et al. (2012) who presented the design of a dashboard for
facilitators in idea management systems, demonstrating how the dashboard helps facilitators in making more
efficient and effective decisions. Specific challenges in idea management are solved by a lot of others studies
(Westerski et al., 2011; Westerski et al., 2013; Westerski et al., 2012; Westerski et al., 2013a; Westerski et
al., 2010; Poveda et al., 2012). For example, Westerski et al. (2012) deal with one of the major challenges in
Journal of Business Management, 2015, No.9 ISSN 1691-5348
116
idea management systems- rapid and automatic assessment of idea value. To address this problem, the paper
proposes the use of opinion mining technique and anew metric that summarizes sentiments in the community
about ideasintroduced. Also Westerski et al. (2013a) focus on the assessment process and propose a number
of solutions that allowfiltering, comparing and evaluating the submitted ideas in idea management ideas.
Westerski et al. (2010) recommend to use sematic networking principles as a possibility for idea
management systems improvements but Poveda et al. (2012describes the design and the use of a semantic
search model as an innovation support system. Westerski et al. (2013) established ideas annotation
framework to facilitate the creation of ideas and Westerski et al. (2011) described the use of structured data
management systems and showed how this relationship can solve problems in idea management systems and
presenteda new IT tool- idea management system that helps collect, organize, select and manage innovative
ideas from people outside the organization.
Deichmann (2012) investigated the role of leadership styles on idea quantity, the role of social ties as an
important mechanism that people use to ‘’build’’ an idea, as well how success and failure experience of
people’s prior idea submission influences submission of new ideas and their performance, the forth idea that
he explored is the reciprocal dynamic between outcomes of prior creative ideas and the social structure of the
network. A similar research was developed by Bjork et al. (2009) who explored the interrelationship
between innovation idea quality and idea providers network connectivity, using social network analysis. The
results highlight that it is important that the possibility to interact with others should be supported and
facilitated but an open question is if the idea generation and social networks should be formalized. The
results show that there is a correlation betweenidea quality and idea provider network connectivity.
Similarly, Dechmann (2012) and Pundt et al. (2005) investigated the correlation between transformational
leadership and employee contribution to idea management. The paper revealed a strong correlation between
the intellectual stimulation and contributions toidea management as well asthe correlation between employee
contribution to idea management and transformational leadership is stronger when there is a positive
improvement culture in the organization.
In many researches when user innovator idea was researched it is focused on external sources, like,
consumers etc., but Zejnilovic et al. (2009) investigate the innovation proposals made by employee-user to
an idea management system. The results revealed ways for companies to increase the success rate of the
ideas submitted by a broad base of employees to idea management systems and to bring more radical ideas to
these systems. But there are studies which focus on external idea sources (Bothos et al., 2008) (Bothos et al.,
2009) (Bothos et al., 2012), reflecting thatidea management can be used outside the organization in
information aggregation markets, where professionals and users choose ideas that organizations implement.
Researches show that involvement of external resources in idea management is an effective and useful way
how to reduce time and costs by allowing ideas to generate and evaluate in virtual sessions.
Klein et al. (2010) researched BMW Finance Service experience, exploring howidea management helps
change management.Specific cases werealso explored by Narvaez et al. (2015). The paper offers idea
management processes thatcould support technological transfer between the Canadian Space Agency and
industrial partners through ICT, also Bettoni et al. (2010) create a new model for a concrete organization,
establishing idea management system for university. Boeddrich (2004) describes basic and specific
requirements for idea management. The study highlights benefits of internet-based system application-
motivation increase, transparency, rapid assessment, retention, less conflict with patent-related problems.
Gish (2011) reaches what lets various idea management activities to succeed and what leads to failure. Gish
emphases, that it is important that managers understand the design of idea management and daily work
process,as well as their connection.
Authors also reveal that it would be advisable to create literature reviews with the focus on the terms
‘’idea management’’ and ‘’idea management systems’’, because the research results reflect that there is no
united view on these terms. For example, majority of literature sources has described idea management as
process with 2-7 parts (some of them contrasting) and idea management as a part of innovation process. But
there are also other views on this term, like Galbraith (1982) term of idea management has used in individual
level as cognitive and social process etc. It is also very important to research the term ‘’idea management
system’’, because this term has been used with wide range of meanings, describing either process, system or
tool.
5. SUGGESTIONS FOR FUTURE RESEARCHES OR GAPS IN LITERATURE OF IDEA
MANAGEMENT
As important it is to research existing literature content, highlightinggaps is a crucial part of literature
Journal of Business Management, 2015, No.9 ISSN 1691-5348
117
review. The authors have collected unanswered questions from researches (excluding mentioned under
researched questions, but explored in other researches) and developed suggestions for future researches for
idea management researchers:
1) To create literature review with the focus on the terms of idea management and idea management
systems, because the research results reflect that there is no united view on these terms.
2) To examine connections between idea management systems or idea management networks and
different types of innovations, for example, radical and incremental innovations. To research how to
encourage a certain type of innovation with idea management, for example, radical innovation. Literature
shows that there are differences in idea management processes, but they are not fully researched.
3) To research empirically psychological factors in idea management.
4) To research the best methods and techniques for each idea management stage.
5) To create idea management system classification. For example, the study (Hrastinki et al., 2010)
classified open innovation technologies and one of the categories was idea management systems, it would be
advisable to create sub- categories for idea management systems.
6) To research quantity and quality of participation in idea management not only of ideas.
7) To probe the correlation between the size of the network and the quality of ideas. The study
(Zejnilovic et al., 2012) revealed a positive correlation, but the authors’ 5 years of practical experience with
idea management systems raise doubts about this conclusion.
8) To analyze if there are differences how social capital behaves in idea management if they generate,
evaluate and develop commercial or social ideas.
9) To explore motivation of participation in idea management.
10) To research support infrastructure for idea management systems in internet (from operative and
strategic perspectives).
11) To gather information about commercially available idea management software and examine how to
integrate them in idea management. The study (Iversen et al., 2009) reflects that there are no idea
management systems that support idea management at all innovation stages;theauthors consider that it would
be considerable to investigate this statement.
12) To research influencing factors. The studies (Cumming, 1999; Dooley, 2000; Flynn et al., 2003)
revealed these factors theoretically, but it could also be explored through empirical research.
13) To research problems in contemporaneous idea management systems and holistically investigate
idea management success elements.
14) To research what kind of idea sources (internal/external) to integrate in idea management, how to
find the balance, what kind of problems and benefits for these integrations. To investigate idea management
network factors that influence idea management.
15) To probe intellectual property protection aspect in idea management systems (who owns ideas)
16) To research how to organize idea management and investigate decision making main dimensions.
17) To explore how to develop and improve idea management networks over the time.
18) To explore social ties in idea management after the social exchange or the similarity-attraction
theory, to probe how to adjust social- psychological behavior changes in the contrasts of idea management
network sizes or strength of ties.
6.SUMMARISATION
Every invention, discovery and social improvement started with an idea. The study Fritz (2002) revealed
that we do not give ideas the same sort of attention than to other forms of intellectual property. According to
Saatcioglu (2002) researchers also pay relatively little attention to them, but there is also a contrasting
opinion by Zejnilovic et al. (2012) who insists that idea management has been researched for long time and
from many perspectives. The authors consider that this contrast arise because of the research advencements
in the last 15 years - till 2002 there was a lack of literature on idea management, but since 2002 amount of
literature sources on idea managementcreated has grown noticeably. But the authors also esteem that Fritz
(2002) and Saatchioglu (2002) conclusions are still topical, because although amount of literature has steadly
grown since 2002, it is still relatively low, and the authors could approve Gish (2011) that there is a growing
interest for idea management from researchers.The researches (Nillson et al., 2002) reflect that introduction
of an idea management system in organization strengthens innovation capacity, so it is a positive tendency in
the development and application of different idea management systems; according to Bansemir et al. (2009)
and Shani et al. (2011), for example, even many consulting companies (according to Frizt (2009), like, Price
Waterhouse, Ernest & Young) use idea management systems. Idea management is topical and perspective

Journal of Business Management, 2015, No.9 ISSN 1691-5348
118
research subject and the authors have developed a wide range of possible future researches that shows that
this topic is not exhausted.Based on the research, the following conclusions can be deducted:
1) The first literature source that mentioned idea management was in 1982. From 1982 till 2002
literature is fragmentary, but from 2002 there are substantive literature sources about idea management.
2) Literature on idea management mainly deals with idea management and idea management system
research, exploring their application and problems. Recent literature has begun to probe how idea
management systems could be used for specific objectives, for example, technology transfer and how idea
management is integrated in organizational processes.
3) The review reflects that idea management is represented in innovation management and IT literature.
4) The most often used theories in literature are network theories, classical learning and leadership
theories. There are different aspects viewed in the literature connected with idea management, for example,
open innovations, cooperation, behavior of cooperation, human information processes, creativity, NPD,
social networks, involvement etc.
5) Most of the literature sources focus on internal idea management, but only few of them reflect
internal and external idea management at once.
6) IT aspects are widely viewed in literature.
7) There are structural and social literature focuses, but the interplay between them is not revealed in
depth. There is a tendency to have more structural focused literature and since 2012 there has only been
literature with structural focus. Less revealed is the social side of idea management, so it is also a perspective
research field.
8) There is dominated focus on internal idea management in the literature.
9) The most commonly used methods in literature are case studies, interviews, questionnaires and
statistical methods, but idea management research could include a lot of other different research methods.By
these or new methods the authors encourage researchers to close the research gaps in idea management
literature.
10) There are a lot of possible future researches (according to research gaps), for example:
To research what types of innovation we can develop in different types of idea management
networks, because according to Dijk et al. (2002) companies invest a lot of finance in idea management
systems but there is a lack of radical innovations.
To research how to manage idea management, because, according to Gish (2011), without
appropriate application there will not be a great result.
To create literature review with the focus on the terms of idea management and idea management
systems, because the research results reflect that there is no united view on these terms.
To examine connections between idea management systems or idea management networks and
different types of innovations, for example, radical and incremental innovations. To research how to
encourage a certain type of innovation with idea management, for example, radical innovation. Literature
shows that there are differences in idea management processes, but they are not fully researched.
To gather information about commercially available idea management software and examine how to
integrate them in idea management. The study (Iversen et al., 2009) reflects that there are no idea
management systems that support idea management at all innovation stages; the authors consider that it
would be considerable to investigate this statement.
To research influencing factors. The studies (Cumming, 1999; Dooley, 2000; Flynn et al., 2003)
revealed these factors theoretically, but it could also be explored through empirical research, etc.
REFERENCES
1. Aagaard, A. (2012), ‘’Idea Management in support of Pharmaceutical Front End of Innovation’’, International
Journal of Technology, Policy and Management, 12(4), 373-386.
2. Aagaard, A. (2013), ‘’A theoretical model of supporting open source front end innovation through idea
management’’, International Journal of Business Innovation and Research, 7(4), 446-465.
3. Applegate, L.M. (1986), ‘’Idea management in organization planning (brainstorming, strategy)’’, dissertation,
University of Arizona, Arizona.
4. Azrolan, N. & Pavlins M.S. (1998), ‘’Idea management: Restructuring technology-based research to help achieve
corporate goals’’, Drug News Perspect, 11(3), 180-184.
5. Baez, M. & Convertino, G. (2012), ‘’Innovation Cockpit: A Dashboard for Faciliators in Idea Management’’, in
ACM 2012 conference proceedings of the international conforence in Seattle, Washington, USA, NY: ACM, 47-48.
Journal of Business Management, 2015, No.9 ISSN 1691-5348
119
6. Bailey, B.P. & Horvitz, E. (2010), ‘’What’s Your Idea? A Case Study of a Grassroots Innovation Pipeline within a
Large Software Company’’, in CHI2010 proceedings on the 28th annual CHI conference on human factors in
computing systems in Atlanta, USA, 2010, NY: ACM , 2065-2074.
7. Bakker, H., Boersma, K. & Oreel, S. (2006), ‘’Creativity (Ideas) Management in Industrial R&D Organizations: A
Crea- Political Process Model and an Empirical Illustration of Corus RD&T’’, Creativity and Innovation
Management, 15 (3), 296- 309.
8. Bansemir, B. & Neyer, A.K. (2009), ‘’From idea management systems to interactive innovation management
systems: Designing for interaction and knowledge exchange’’, Wirtschaftinformatik Proceedings, 1(1), 860-870.
9. Barczak, G., Griffin, A. & Kahn, B.K. (2009), ‘’PERSPECTIVE: Trends and Drivers of Success in NPD Practices:
Results of the 2003 PDMA Best Practices Study’’, Journal of Product Innovation Management, 26 (1), 3-23.
10. Bassiti, L. & Ajhoun, R. (2013), ‘’Toward an Innovation Management Framework: A Life-cycle Model with an Idea
Management focus’’, International Journal of Innovation, Management and Technology, 4(6), 551-559.
11. Beissel- Durrant, G. (2004),’’A Typology of Research Methods within the Social Sciences’’, working paper,
Southampton Statistical Sciences Research Institute, University of Southampton, Highfield, November.
12. Bergendah, M. & Magnusson, M. (2014), ‘’Combining collaboration and competition: a key to improved idea
management?’’, European Journal of International Management, 8(5), 528-547.
13. Bettoni, M., Bernhard, W., Eggs, C. & Schiller, G. (2010), ‘’Idea Management by Role Based Networked
Learning’’, in 11th European conference on knowledge management proceedings of the international conference,
London: Academic Publishing Limited, 107-116.
14. Bjork, J. & Magnusson, M. (2009), ‘’Where Do Good Innovation Ideas Come From? Exploring the Influence of
Network Connectivity on Innovation Idea Quality’’, Journal of Product Innovation Management, 26(1), 662-670.
15. Boeddrich, H.J. (2004). ‘’Ideas in the Workplace: A New Approach Towards Organizing the Fuzzy Front End of the
Innovation Process’’, Creativity and Innovation Management, 13(4), 274-285.
16. Boell, S., K., Cecez-Kecmanovic, D. (2010), ‘’Literature reviews and the hermeneutic circle’’, Australian Academic
and Research Libraries, 41 (2), 129-144.
17. Bolderston, A. (2008), ‘’Writing an Effective Literature Review’’, Journal of Medical Imaging and Radiation
Sciences, 39(2), 86-92.
18. Boote, D. N. & Beile, P. (2005), ‘’Scholars before researchers: On the centrality of the dissertation literature review
in research preparation’’, Educational Researcher, 34(6), 3-15.
19. Bothos, E., Apostolou, D. & Mentzas, G. (2008), ‘’A Collaborative Information Aggregation System for Idea
Management’’, in Conference on Internet and Web Applications and Sevices proceedings of the international
conference in Athens, Athens: IEEE, 289-296.
20. Bothos, E., Apostolou, D. & Mentzas, G. (2009), ‘’Collective intelligence for idea management with Internet-based
information aggregation markets’’, Internet Research, 19(1), 26-41.
21. Bothos, E., Apostoulou, D. & Mentzas, G. (2012), ‘’Collective intelligence with web-based information aggregation
markets: The role of market faciliation in idea management’’, Experts Systems with Applications, 39(1), 1333-1345.
22. Brem, A. & Voigt, K.I. (2007), ‘’Innovation management in emerging technology ventures – the concept of an
integrated idea management’’, Journal of Technology, Policy and Management, 7(3), 304 - 321.
23. Brem, A., & Voigt, K.I. (2009), ‘’ Integration of market pull and tschnology push in the corporate front end and
innovation management- Insights from the German software industry’’, Technovation, 29(1), 351-367.
24. Chen, K.Y. & Plott, C. (2002), ‘’Information Aggregation Mechanisms: Concept, Design and Implementation for a
Sales Forecasting Problem’’, working paper [1131], California Instotute of Technology, Pasadena, 27 March.
25. Chesbrough, H.W. (2003), Open Innovation: The New Imperative for Creating and Profiting from Technology,
Cambridge: Harward Business School Publishing.
26. Coughlan, T. & Johnson, P. (2008), ‘’Idea Management in Creative Lives’’, in Conference on Human Factors in
Computing Systems proceedings of the international conference, NY:ACM, 3081-3086.
27. Cumming, B. (1999), Undrstanding innovation form the cradle to grave. In Best Practice: Process Innovation
Management, Oxford: Butterworth-Heinemann.
28. Day, G.S., Gold, B. & Kuczmarski, T.D. (1994), ‘’Significant Issues for the Future of Product Innovation’’, Journal
of Product Innovation Management, 11(1), 69-75.
29. Deichmann, D. (2012), ‘’Idea Management: Perspectives from Leadership, Learning, and Network Theory’’,
dissertation, ERIM, Netherland.
30. Dooley, L. (2000), ‘’Systems innovation management’’, Product Planning & Control, 11(4), 369-379.
31. Enkel, E., Grassmann, O. & Chesbrough, H. (2009), ‘’Open R&D and open innovation: exploring the
phenomenon’’, R&D Management, 39(4), 311-316.
32. Fatur, P. & Likar, P. (2009), ‘’The development of a performance measurement methodology for idea
management’’, International Journal of Innovation and Learning, 6(4), 422-437.
33. Fawacett, J. (2013), ‘’Thoughts about conceptual models, theories, and literature reviews’’, Nursing science
quarterley, 26(3), 285-288.
34. Flynn, M., Dooley, L., Sullivan, D. & Cormican, K. (2003), ‘’Idea management for organizational innovation’’,
International Journal of Innovation Management, 7(4), 1-26.
35. Fritz, M. (2002), ‘’Idea management enabler’’, EContent, 25(8), 50.
36. Galbraith, J.R. (1982), ‘’Designing the innovating organization’’, Organizational Dynamics, 10(3), 5-25.

Journal of Business Management, 2015, No.9 ISSN 1691-5348
120
37. Gall, M. D., Borg, W. R., & Gall, J. P. (1996),Education research: An introduction (6th ed.), NY: Longman.
38. Gamlin, J.N., Yourd, R. & Patric, V. (2007), ‘’Unlock creativity with ‘’active’’ idea management’’, Research
Technology Manageent, 50(1), 13-16.
39. Gish, L. (2011), ‘’Experience with idea promoting initiatives: why they don’t always work’’, in 18th Conference on
Engineering Design: Impacting Society through Engineering Design proceedings of theinternational conference,
Copenhagen: Design Society, 83-92.
40. Glassmann, B.S. (2009),’’Improving idea generation and idea management in order to better manage the fuzzy front
end of innovation’’, disertation, Prude University, Lafayette.
41. Goyal, A. & Sampath, K. (2007), ‘’Institutionalizing innovation: look to employees for the next great idea’’, Ivey
Business Journal, 71(8), 1-5.
42. Green, S.G., Bean, S.A. & Snavely, B.K. (1983), ‘’Idea management in R&D as a human information processing
analog’’, Human Systems Management, 4(2), 98-112.
43. Hart, C. (1999),Doing a Literature Review: Releasing the Social Science Research Imagination.London: Sage.
44. Holzblatt, L. & Tierney, L.M. (2011), ‘’Measuring the effectiveness of social media on an innovation process’’, in
CHI EA '11 proceedings, NY:ACM, 697-712.
45. Hrastinski, S. & Kviselius, N.Z. (2010), ‘’A review of technologies for open innovation: Characterastics and future
trends’’, in Annual Hawaii International Conference on System Sciences proceedings,Kohla: IEEE, 1-10.
46. INSEAD (2012), The Global Innovation Index 2012, Geneva: WIPO.
47. Iversen, H., Kristensen, K., Liland, C.S., Berman, T., Enger, N. & Losnedahl, T. (2009), ‘’Idea Management: A
Life- cycle Perspective on Innovation’’, available at: http://www.ict-21.ch/com-
ict/IMG/pdf/39_IdeaManagement_Kjetil_Kristensen_FINAL.pdf (accessed: 10 April 2015).
48. Karanjikar, M.R. (2007), ‘’Funnel-reverse-funnel: the future model of idea management in new product
development’’, Futures Research Quarterly, 23 (3), 21-26.
49. Khurana, A. & Rosenthal, S.R. (1998), ‘’Toward holistic ‘’front end’’ in new product development’’, Journal of
Product Innovation Management, 15(1), 55-74.
50. Klein, D. & Lechner, U. (2010), ‘’Ideenmanagement im Rahmen von organisatorischem Wandel’’, im MKWI 2010–
IKT-gestutzte Unternehmens kommunikation proceedings, Gottingen: Universitatsverlag Gottingen, 1831-1842.
51. Lin, K.J. (2007), ‘’Building Web 2.0’’, Computer, 40 (1), 101-102.
52. Lindross, M. (2006), ‘’Developing Front-End idea management and information processing’’, working paper [39],
Innovation Management Institute, Helsinki University of Technology, 6 March.
53. Lowe, M. & Heller, J.E. (2014), ‘’PLM Reference Model for Integrated Idea and Innovation Management’’,
Product Lifecycle Management for a Global Market, IFIP Advances in Information and Communication
Technology, 442(1), 257-266.
54. Lu, I.M. & Mantei, M.M. (1991), ‘’Idea Management In a Shared Drawing Tool’’, in the Second European
Conference on Computer-Supported Cooperative Work proceedings of the international conference, Rotterdam:
Springer Netherlands, 97-112.
55. Miecznik, B. (2013), ‘’Ideen Management’’ im Able, T. (Ed.), Suchfeldbestimmung und Ideenbewertung :
Methoden und Prozesse in den frühen Phasen des Innovationsprozesses, London: Springer-Gabler, 143-168.
56. Miles, R.E., Miles, G. & Snow, C. (2005), ‘’Collaborative Entrepreneurship: How Communities of Networked
Firms Use Continuous Innovation to Create Economic Wealth’’, Stanford Stanford University Press.
57. Moss, B., Beimborn, D., Wagner, H.T. & Weitzel, T. (2011), ‘’The role of innovation governance and knowledge
management for innovation success’’, in the 44th Annual Hawaii International Conference on System Science
proceedings, Kohla: IEEE, 1-10.
58. Naravaez, J.L.M. & Gardoni, M. (2015), ‘’Harnessing idea management in the process of technology transfer at
Canadian Space Agency’’, International Journal on Interactive Design and Manufacturing, 9(33), 1-11.
59. Nilsson L., Elg, M. & Bergman, B. (2002), ‘’Managing ideas for the development of new products’’, International
Journal of Technology Management, 24(5/6), 498-513.
60. Perez, A., Larrinaga, F. & Curry, E. (2013), ‘’The Role of Linked Data and Semantic-Technologies for
Sustainability Idea Management’’, in Counsell, S. (Ed.), Software Engineering and Formal Methods, Berlin:
Springer-Verlag, 306-312.
61. Poveda, G., Westerski, A. & Iglesias, C. A. (2012), ‘’Application of Semantic Search in Idea Management
Systems’’, in conference for Internet Technology Secured Transactions proceedings of the internationa conference
in London, UK, London: IEEE, 230-236.
62. Pundt, A. & Schyns, B. (2005). ‘’Fuhrung im Ideenmanagement - Der Zusammenhang zwischen transformationaler
Fuhrung und dem individuellen Engagement im Ideenmanagement’’, Zeitschrift fur Personalpsychologie, 4(2), 55-
65.
63. Randolph, J. (2009), ‘’A guide to writing the dissertation literature review’’, Practical Assessment, Reseach &
Evaluation, 14(13), 1-13.
64. Richter, A. & Koch, M. (2007), Enterprise 2.0: Planung, Einfuhrung und erfolgreicher Einsatz von Social Software
in Unternehmen, Munchen: Oldenbourg.
65. Rose, A. & Jensen, V. (2012), ‘’A literature review of idea management’’, the paper presented at the 9th
NordDesign conference proceedings DS 71 of NordDesign, Aarlborg University, Denmark. 22-24 August, available
Journal of Business Management, 2015, No.9 ISSN 1691-5348
121
at: https://www.designsociety.org/publication/35610/a_literature_review_of_idea_management (accessed: 10 April
2015).
66. Rowbotham, L. & Bohlin, N. (1996), ‘’Structured Idea Management as a Value-Adding Process’’, available at:
http://www.adlittle.com/uploads/tx_extprism/1996_q2_31-36.pdf (accessed: 10 April 2015).
67. Saatcioglu, A. (2002), ‘’Using grounded inquiry to explore idea management for innovativeness’’, the paper
presented at Academy of Management Proceedings, available at:
http://proceedings.aom.org/content/2002/1/C1.19.abstract (accessed: 10 April 2015).
68. Sandriev, A.R. & Pratchenko, O.V. (2014), ‘’Idea management in the system of innovative management’’,
Mediterranean Journal of Social Sciences, 5(12), 155-158.
69. Sandstrom, C. & Bjork, J. (2010), ‘’Idea management systems for a changing innovation landscape’’, International
Journal of Product Development, 11 (3/4), 310-324.
70. Schmidt, J. (2006), ‘’Social Software: Onlinegestutztes Informations-, Identitats- und Beziehungsmanagement’’,
Forschgsjournal Neue Soziale Bewegungen, 18(2), 37-46.
71. Selart, M. & Johansen, S.T. (2011), ‘’Understanding the Role of Value- Focused Thinking in Idea Management’’,
Creativity and Innovation Management, 20(3), 196-206.
72. Shani, N. & Divyapriya, P. (2011), ‘’A Role of Innovative Idea Management in HRM’’, International Journal of
Management, 2(1), 69-78.
73. Summa, A. (2004), ‘’Software tools to support innovation process- focuss on idea management’’, working paper
[29], Innovation Management Institute, Helsinki University of Technology, 15 June.
74. Tung, W.F., Yuan, S.T. & Tsai, J.R. (2009), ‘’A custom collaboration service system for idea management of
mobile phone design’’, Human Factors and Ergonomics in Manufacturing, 19(5), 494-509.
75. Vagn, A.R., Clause, C. & Gish, L. (2013), ‘’Towards a new perspective of managing ideas in front-end innovation
as actor networks’’, the paper presented at the 63. International Conference on Engeneering design, 19-22 August,
Seoul, Korea, available at: http://orbit.dtu.dk/ws/files/58958235/ICED_13.pdf (accessed: 10 April 2015).
76. Van Dijk, C. & Van Den Ende, J. (2002), ‘’Suggestion systems: transferring employee creativity into practicable
ideas’’, R&D Management, 32(5), 387-395.
77. Vandenbosch, B., Saatcioglu, A. & Fay, S. (2006), ‘’Idea management: A systematic view’’, Journal of
Management Studies, 43(2), 259-288.
78. Voigt, K.I. & Brem, A. (2006), ‘’Integrated Idea Management in Emerging Technology Ventures’’, in IEEE
International Conference on Management of Innovation and Technology proceedings of the international
conference in Singapore, China, Singapore: IEEE, 211-215.
79. Webster, J. (2012). ‘’Analyzing the Past to Prepare for the Future: Writing a literature Review’’, MIS Quarterly,
26(2), 13-23.
80. Westerski, A. & Iglesias, A. (2012), ‘’Mining sentiments in idea management systems as a tool for rating ideas’’,
the paper presented at the International Conference on the Design of Cooperative Systems (COOP2012) of the
Large-Scale Idea Management and Deliberation workshop,30 May – 1 June, Marseille, France, available at:
http://www.gi2mo.org/files/papers/coop2012/opinions_coop2012_paper.pdf (accessed: 10 April 2015).
81. Westerski, A. & Iglesias, C.A. (2011), ‘’Exploiting structured linked data in enterprise knowledge management
systems: An idea management case study’’, in Enterprise Distributed Object Computing Conference Workshops
proceedings of the 15th IEEE International in Finland, Helsinki, 2011, Helsinki: IEEE , 395-403.
82. Westerski, A. (2013a), ‘’Semantic Technologies in Idea Management Systems: A Model for Interoperability,
Linking and Filtering’’, dissertation, Universidad Politécnica de Madrid, Madrid.
83. Westerski, A., Dalamagas, T. & Iglesias, C.A. (2013), ‘’Classifying and comparing community innovation in Idea
Management Systems’’, Decision Support Systems, 54(1), 1316-1326.
84. Westerski, A., Iglesias, C.A. & Nagle, T. (2011),’’ The road from community ideas to organisational innovation: a
life cycle survey of idea management systems’’, International Journal of Web Bases Communities, 7(4), 493-506.
85. Westerski, A., Iglesias, C.A. & Rico, F.T. (2010), ‘’A model for integration and interlinking of idea management
systems’’, Communications in Computer and Information Science, 108(1), 183-194.
86. Wood, A. (2003), ‘’Managing Employees' Ideas From Where do Ideas Come?’’, Journal for Quality &
Participation, 26(2), 22-26.
87. Xie, L. & Zhang, P. (2010), ‘’Idea Management System for Team Creation’’, Journal of Software, 5 (11), 1187-
1194.
88. Yoo, Y., Boland, J.,Lytinen, K. & Majchzak, A. (2012), ‘’Organizing for Innovation in the Digitalized World’’,
Organization Science, 23 (5), 1398-1408.
89. Yu, F.Z., Chen, J. & Shen, H.H. (2006), ‘’Idea Management Model for NPD Fuzzy Front End: Empirical Analysis
Based on All-key-elements Innovation in TIM’’, Chinese Journal of Management, 3(5), 573-579.
90. Zejnilovic, L., Oliveira, P. & Veloso, F. (2012), ‘’Employees as User Innovators: An Empirical Investigation of an
Idea Management System’’, SSRN Electronic Journal, 1(1), 1-38.
91. Zhang, Q. & Doll, W. (2001), ‘’The Fuzzy Front End and Success of New Product Development: A Casual Model’’,
European Journal of Innovation Management, 4(2), 95-112.

Journal of Business Management, 2015, No.9 ISSN 1691-5348
122