journal of chromatography a - chromatography central | … · 2017-10-03 · journal of...
TRANSCRIPT
Tdh
CJa
b
a
ARRAA
KDCOTTE
1
sociPcoa(d
rG
h0
Journal of Chromatography A, 1499 (2017) 158–164
Contents lists available at ScienceDirect
Journal of Chromatography A
jo ur nal ho me pag e: www.elsev ier .com/ locate /chroma
wo-dimensional gas chromatography with electron captureetection for the analysis of atmospheric ozone depletingalocarbons�
hang-Feng Ou-Yanga, Hsi-Che Huab, Yu-Chieh Choub, Ming-Kai Tengb, Wen-Tzu Liub,ia-Lin Wangb,∗
Department of Atmospheric Sciences, National Central University, Taoyuan 32001, TaiwanDepartment of Chemistry, National Central University, Taoyuan 32001, Taiwan
r t i c l e i n f o
rticle history:eceived 31 October 2016eceived in revised form 27 March 2017ccepted 2 April 2017vailable online 4 April 2017
eywords:eans switchFCszone depletion substancehermal desorption
a b s t r a c t
This study is to develop a GC × GC method with electron capture detection (ECD) to analyze atmospherichalocarbons in the concentration range of parts per trillion by volume (pptv). To enrich atmospherichalocarbons a home-built thermal desorption (TD) device was coupled to the GC × GC-ECD. The techniqueof flow modulation was adopted using a Deans switch for GC × GC. Several column combinations of firstand second dimensions were tested and the column set of DB–5 × TG-1301 was found to show the bestorthogonality for halocarbons. A series of modulation parameters were tested for their optimal settings.The modulation period (PM) was found to have minimal wrap-around when set at 3 s. The modulation ratio(MR) was determined to be 7.82 to ensure reproducible results and maximum sensitivity. The modulationduty cycle (DC) was calculated to be approximately 0.17. Nine halocarbons were separated successfullyand seven were calibrated with the use of a certified standard gas mixture. The correlation coefficients
2
wo-dimensional gas chromatographylectron capture detector(R ) were greater than 0.9972. The reproducibility was better than 1.90% as expressed in relative standarddeviation (RSD; N = 30) and the detection limits were in the range of pptv for the target halocarbons. A fieldtest by continuous analyzing ambient air with hourly resolution was performed to show the stability ofthe method as suggested by the homogeneity of certain halocarbons, while also reflecting concentrationvariation for others when emissions did arise.
© 2017 Elsevier B.V. All rights reserved.
. Introduction
Man-made halogenated trace gases are blamed for the strato-pheric ozone depletion [1,2]. Due to the extremely long lifetimesf some selected halocarbons in the atmosphere, these compoundsan drift to the stratosphere threatening the ozone layer by releas-ng chlorine or bromine atoms through photolysis [3]. The Montrealrotocol and its subsequent amendments were thus enacted toease the production and consumption of anthropogenic chloroflu-rocarbons (CFCs) and selected halocarbons [4,5]. Tropospheric
bundances and emissions of most ozone depleting substancesODS) hence started to decrease since mid-90s, resulting in theeclines in the atmospheric burden of chlorine and bromine� Selected paper from the 40th International Symposium on Capillary Chromatog-aphy and 13th GC×GC Symposium (RIVA 2016), 29 May - 3 June 2016, Riva delarda, Italy.∗ Corresponding author.
E-mail address: [email protected] (J.-L. Wang).
ttp://dx.doi.org/10.1016/j.chroma.2017.04.003021-9673/© 2017 Elsevier B.V. All rights reserved.
[2,6–8]. Although the threat of the CFCs on ozone depletion hasbeen greatly alleviated, the net radiative forcing of the halocarbonsas greenhouse gases is still considerable since they still contributeup to 11.5% of the net radiative forcing with the inclusion of theCFC replacements of hydrochlorofluorocarbons and hydrofluoro-carbons [9–13].
GC-ECD or GC–MS equipped with an enrichment device hasbeen a common method to analyze ambient halocarbons [14–18].The enrichment can be made either by using cryogens (e.g., liq-uid nitrogen) [19] or chemical sorbents with thermal desorption(TD) [16]. As more volatile compounds are invented and emittedinto the atmosphere, the complexity of air composition increasesover time and; thus, the analytical techniques with higher separa-tion resolution become ever more in demand. The conventional GCtechniques are often faced with limited separation efficiency that
may not be adequate in the modern era when multi-dimensionalseparation becomes more assessable and common. Though GC–MSis considered as a multi-dimensional technique in concept with theretention time as the first dimension (1-D) and the mass spectrum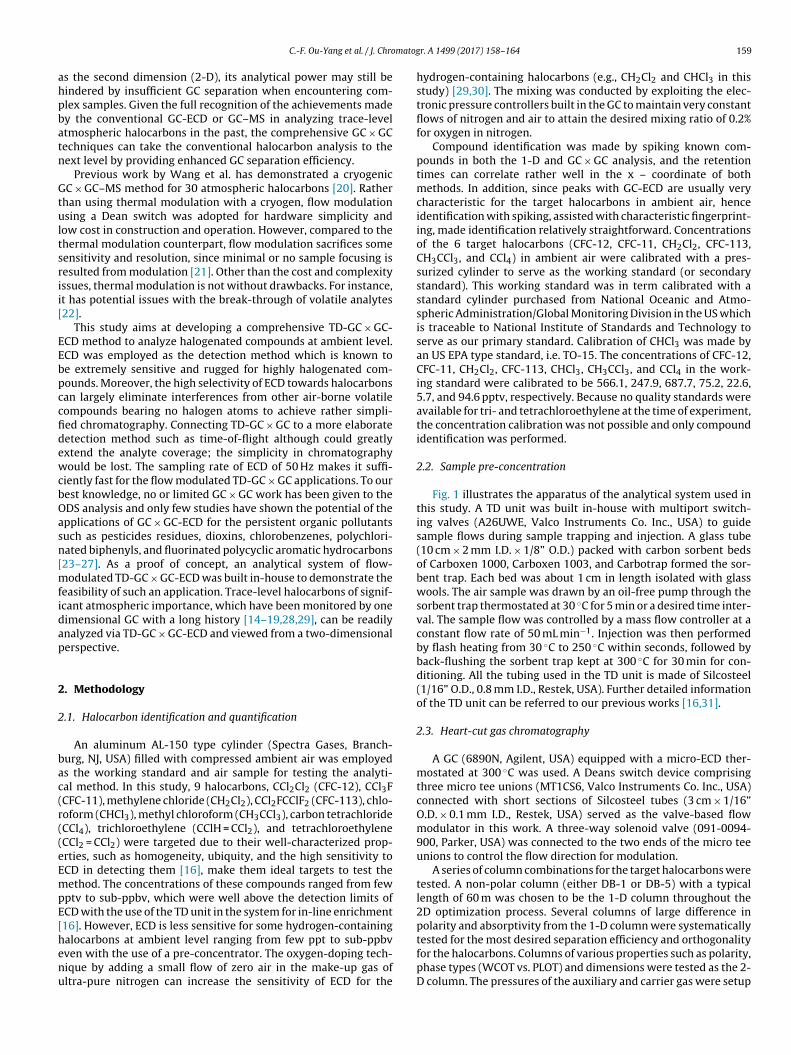
matog
ahpbatn
Gtultsrii[
EEbpccfidewcbOasn[mfidap
2
2
bac(r((eEmpE[henu
C.-F. Ou-Yang et al. / J. Chro
s the second dimension (2-D), its analytical power may still beindered by insufficient GC separation when encountering com-lex samples. Given the full recognition of the achievements madey the conventional GC-ECD or GC–MS in analyzing trace-leveltmospheric halocarbons in the past, the comprehensive GC × GCechniques can take the conventional halocarbon analysis to theext level by providing enhanced GC separation efficiency.
Previous work by Wang et al. has demonstrated a cryogenicC × GC–MS method for 30 atmospheric halocarbons [20]. Rather
han using thermal modulation with a cryogen, flow modulationsing a Dean switch was adopted for hardware simplicity and
ow cost in construction and operation. However, compared to thehermal modulation counterpart, flow modulation sacrifices someensitivity and resolution, since minimal or no sample focusing isesulted from modulation [21]. Other than the cost and complexityssues, thermal modulation is not without drawbacks. For instance,t has potential issues with the break-through of volatile analytes22].
This study aims at developing a comprehensive TD-GC × GC-CD method to analyze halogenated compounds at ambient level.CD was employed as the detection method which is known toe extremely sensitive and rugged for highly halogenated com-ounds. Moreover, the high selectivity of ECD towards halocarbonsan largely eliminate interferences from other air-borne volatileompounds bearing no halogen atoms to achieve rather simpli-ed chromatography. Connecting TD-GC × GC to a more elaborateetection method such as time-of-flight although could greatlyxtend the analyte coverage; the simplicity in chromatographyould be lost. The sampling rate of ECD of 50 Hz makes it suffi-
iently fast for the flow modulated TD-GC × GC applications. To ourest knowledge, no or limited GC × GC work has been given to theDS analysis and only few studies have shown the potential of thepplications of GC × GC-ECD for the persistent organic pollutantsuch as pesticides residues, dioxins, chlorobenzenes, polychlori-ated biphenyls, and fluorinated polycyclic aromatic hydrocarbons23–27]. As a proof of concept, an analytical system of flow-
odulated TD-GC × GC-ECD was built in-house to demonstrate theeasibility of such an application. Trace-level halocarbons of signif-cant atmospheric importance, which have been monitored by oneimensional GC with a long history [14–19,28,29], can be readilynalyzed via TD-GC × GC-ECD and viewed from a two-dimensionalerspective.
. Methodology
.1. Halocarbon identification and quantification
An aluminum AL-150 type cylinder (Spectra Gases, Branch-urg, NJ, USA) filled with compressed ambient air was employeds the working standard and air sample for testing the analyti-al method. In this study, 9 halocarbons, CCl2Cl2 (CFC-12), CCl3FCFC-11), methylene chloride (CH2Cl2), CCl2FCClF2 (CFC-113), chlo-oform (CHCl3), methyl chloroform (CH3CCl3), carbon tetrachlorideCCl4), trichloroethylene (CClH = CCl2), and tetrachloroethyleneCCl2 = CCl2) were targeted due to their well-characterized prop-rties, such as homogeneity, ubiquity, and the high sensitivity toCD in detecting them [16], make them ideal targets to test theethod. The concentrations of these compounds ranged from few
ptv to sub-ppbv, which were well above the detection limits ofCD with the use of the TD unit in the system for in-line enrichment16]. However, ECD is less sensitive for some hydrogen-containing
alocarbons at ambient level ranging from few ppt to sub-ppbvven with the use of a pre-concentrator. The oxygen-doping tech-ique by adding a small flow of zero air in the make-up gas ofltra-pure nitrogen can increase the sensitivity of ECD for ther. A 1499 (2017) 158–164 159
hydrogen-containing halocarbons (e.g., CH2Cl2 and CHCl3 in thisstudy) [29,30]. The mixing was conducted by exploiting the elec-tronic pressure controllers built in the GC to maintain very constantflows of nitrogen and air to attain the desired mixing ratio of 0.2%for oxygen in nitrogen.
Compound identification was made by spiking known com-pounds in both the 1-D and GC × GC analysis, and the retentiontimes can correlate rather well in the x – coordinate of bothmethods. In addition, since peaks with GC-ECD are usually verycharacteristic for the target halocarbons in ambient air, henceidentification with spiking, assisted with characteristic fingerprint-ing, made identification relatively straightforward. Concentrationsof the 6 target halocarbons (CFC-12, CFC-11, CH2Cl2, CFC-113,CH3CCl3, and CCl4) in ambient air were calibrated with a pres-surized cylinder to serve as the working standard (or secondarystandard). This working standard was in term calibrated with astandard cylinder purchased from National Oceanic and Atmo-spheric Administration/Global Monitoring Division in the US whichis traceable to National Institute of Standards and Technology toserve as our primary standard. Calibration of CHCl3 was made byan US EPA type standard, i.e. TO-15. The concentrations of CFC-12,CFC-11, CH2Cl2, CFC-113, CHCl3, CH3CCl3, and CCl4 in the work-ing standard were calibrated to be 566.1, 247.9, 687.7, 75.2, 22.6,5.7, and 94.6 pptv, respectively. Because no quality standards wereavailable for tri- and tetrachloroethylene at the time of experiment,the concentration calibration was not possible and only compoundidentification was performed.
2.2. Sample pre-concentration
Fig. 1 illustrates the apparatus of the analytical system used inthis study. A TD unit was built in-house with multiport switch-ing valves (A26UWE, Valco Instruments Co. Inc., USA) to guidesample flows during sample trapping and injection. A glass tube(10 cm × 2 mm I.D. × 1/8” O.D.) packed with carbon sorbent bedsof Carboxen 1000, Carboxen 1003, and Carbotrap formed the sor-bent trap. Each bed was about 1 cm in length isolated with glasswools. The air sample was drawn by an oil-free pump through thesorbent trap thermostated at 30 ◦C for 5 min or a desired time inter-val. The sample flow was controlled by a mass flow controller at aconstant flow rate of 50 mL min−1. Injection was then performedby flash heating from 30 ◦C to 250 ◦C within seconds, followed byback-flushing the sorbent trap kept at 300 ◦C for 30 min for con-ditioning. All the tubing used in the TD unit is made of Silcosteel(1/16” O.D., 0.8 mm I.D., Restek, USA). Further detailed informationof the TD unit can be referred to our previous works [16,31].
2.3. Heart-cut gas chromatography
A GC (6890N, Agilent, USA) equipped with a micro-ECD ther-mostated at 300 ◦C was used. A Deans switch device comprisingthree micro tee unions (MT1CS6, Valco Instruments Co. Inc., USA)connected with short sections of Silcosteel tubes (3 cm × 1/16”O.D. × 0.1 mm I.D., Restek, USA) served as the valve-based flowmodulator in this work. A three-way solenoid valve (091-0094-900, Parker, USA) was connected to the two ends of the micro teeunions to control the flow direction for modulation.
A series of column combinations for the target halocarbons weretested. A non-polar column (either DB-1 or DB-5) with a typicallength of 60 m was chosen to be the 1-D column throughout the2D optimization process. Several columns of large difference inpolarity and absorptivity from the 1-D column were systematically
tested for the most desired separation efficiency and orthogonalityfor the halocarbons. Columns of various properties such as polarity,phase types (WCOT vs. PLOT) and dimensions were tested as the 2-D column. The pressures of the auxiliary and carrier gas were setup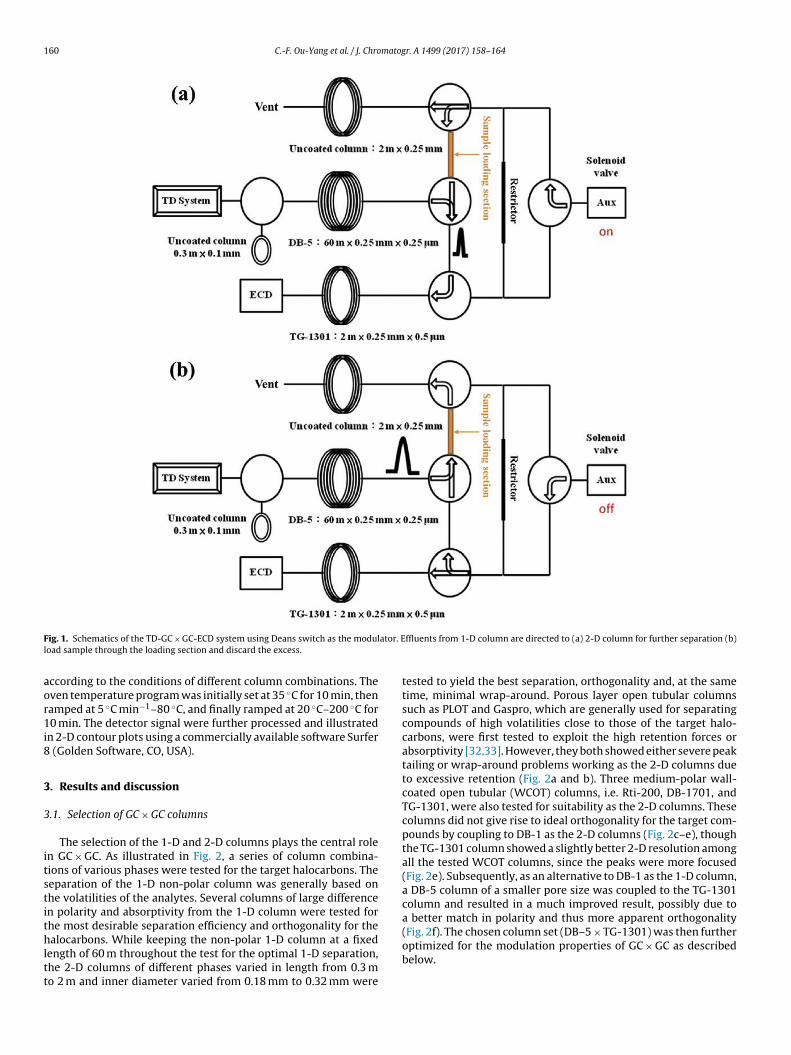
160 C.-F. Ou-Yang et al. / J. Chromatogr. A 1499 (2017) 158–164
F ator. El
aor1i8
3
3
itstithltt
ig. 1. Schematics of the TD-GC × GC-ECD system using Deans switch as the moduload sample through the loading section and discard the excess.
ccording to the conditions of different column combinations. Theven temperature program was initially set at 35 ◦C for 10 min, thenamped at 5 ◦C min−1–80 ◦C, and finally ramped at 20 ◦C–200 ◦C for0 min. The detector signal were further processed and illustrated
n 2-D contour plots using a commercially available software Surfer (Golden Software, CO, USA).
. Results and discussion
.1. Selection of GC × GC columns
The selection of the 1-D and 2-D columns plays the central rolen GC × GC. As illustrated in Fig. 2, a series of column combina-ions of various phases were tested for the target halocarbons. Theeparation of the 1-D non-polar column was generally based onhe volatilities of the analytes. Several columns of large differencen polarity and absorptivity from the 1-D column were tested forhe most desirable separation efficiency and orthogonality for the
alocarbons. While keeping the non-polar 1-D column at a fixedength of 60 m throughout the test for the optimal 1-D separation,he 2-D columns of different phases varied in length from 0.3 mo 2 m and inner diameter varied from 0.18 mm to 0.32 mm were
ffluents from 1-D column are directed to (a) 2-D column for further separation (b)
tested to yield the best separation, orthogonality and, at the sametime, minimal wrap-around. Porous layer open tubular columnssuch as PLOT and Gaspro, which are generally used for separatingcompounds of high volatilities close to those of the target halo-carbons, were first tested to exploit the high retention forces orabsorptivity [32,33]. However, they both showed either severe peaktailing or wrap-around problems working as the 2-D columns dueto excessive retention (Fig. 2a and b). Three medium-polar wall-coated open tubular (WCOT) columns, i.e. Rti-200, DB-1701, andTG-1301, were also tested for suitability as the 2-D columns. Thesecolumns did not give rise to ideal orthogonality for the target com-pounds by coupling to DB-1 as the 2-D columns (Fig. 2c–e), thoughthe TG-1301 column showed a slightly better 2-D resolution amongall the tested WCOT columns, since the peaks were more focused(Fig. 2e). Subsequently, as an alternative to DB-1 as the 1-D column,a DB-5 column of a smaller pore size was coupled to the TG-1301column and resulted in a much improved result, possibly due toa better match in polarity and thus more apparent orthogonality
(Fig. 2f). The chosen column set (DB–5 × TG-1301) was then furtheroptimized for the modulation properties of GC × GC as describedbelow.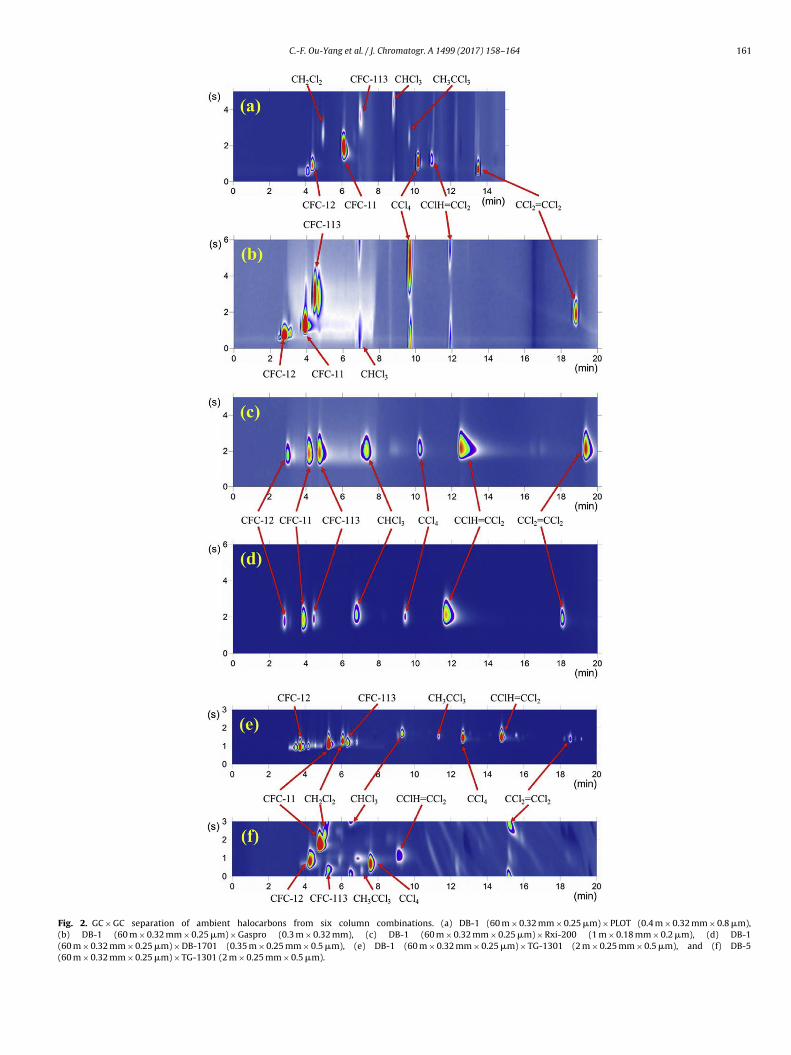
C.-F. Ou-Yang et al. / J. Chromatogr. A 1499 (2017) 158–164 161
Fig. 2. GC × GC separation of ambient halocarbons from six column combinations. (a) DB-1 (60 m × 0.32 mm × 0.25 �m) × PLOT (0.4 m × 0.32 mm × 0.8 �m),(b) DB-1 (60 m × 0.32 mm × 0.25 �m) × Gaspro (0.3 m × 0.32 mm), (c) DB-1 (60 m × 0.32 mm × 0.25 �m) × Rxi-200 (1 m × 0.18 mm × 0.2 �m), (d) DB-1(60 m × 0.32 mm × 0.25 �m) × DB-1701 (0.35 m × 0.25 mm × 0.5 �m), (e) DB-1 (60 m × 0.32 mm × 0.25 �m) × TG-1301 (2 m × 0.25 mm × 0.5 �m), and (f) DB-5(60 m × 0.32 mm × 0.25 �m) × TG-1301 (2 m × 0.25 mm × 0.5 �m).
1 matogr. A 1499 (2017) 158–164
3
ptTtD(wlsuw
pimnttTi00iar
uflpt[F[dsdgmpt
ttiaPtw(tara
itWotTghA
Table 1Quality assurance results.
Compound RSD (N = 30) R2 (5 points) Method DetectionLimit (ppt)a
CFC-12 1.22% 0.9969 24.9CFC-11 1.39% 0.9991 4.5CH2Cl2 1.88% 0.9987 5.4CFC-113 1.90% 0.9979 9.9CHCl3 1.44% 0.9982 5.6CH3CCl3 0.81% 0.9972 2.9
62 C.-F. Ou-Yang et al. / J. Chro
.2. Optimization of GC and modulation parameters
Because the Deans-switch was used as the flow modulator, theressure of the auxiliary flow controls the rapid swings betweenhe actions of sample loading and injection for modulation (Fig. 1).he pressure of the auxiliary flow ranging from 7 to 10 psi was firstested for the optimized setting. The elution of the analytes in the 2-
column needs to be rapid enough to avoid tailed or diffused peaksFig. S1a). However, if the pressure is set too high, the auxiliary gasould tend to impede the effluents from the 1-D column, causing
ess analytes to be sent into the 2-D column (Fig. S1c). Furthermore,erious co-elution could occur if the auxiliary flow pressure contin-es to increase (Fig. S1d). As a compromise, the auxiliary pressureas thus set at the optimal pressure of 7.5 psi (Fig. S1b).
The sample loading time stands for the duration of the air sam-le band being sent to the sampling line for loading sample as
ndicated in Fig. 1 (3 cm in length), which only applies to the flowodulation GC × GC instead of the thermal modulation type, since
o cryo-focusing is performed. The sample amount increases ashe sample loading time increases. However, up to a certain point,he filling will be complete and the excess sample will be vented.he optimal loading time is determined when the peak responses no longer increased. Various loading times ranging from 0.1 s to.7 s were tested (Fig. S2). As the loading time increased between
and 0.5 s (Fig. S2a–c), the peak intensity also increased accord-ngly. However, after 0.5 s the increase in intensity was no longerpparent (Fig. S2c and d), signaling an overflow of the sample. As aesult, the optimized loading time was set at 0.5 s.
There are three key common parameters that describe the mod-lation conditions of a GC × GC task for both the thermal andow modulation types: the modulation ratio (MR), the modulationeriod (PM) and the modulation duty cycle (DC). MR is the ratio ofhe width of the 1-D peak to the PM, as defined by Khummueng et al.34], which determines the reproducibility of the GC × GC results.or instance, MR = 1.5 can only suffice semi-quantitative analysis34]. MR should be greater than 2.5 to permit satisfactory repro-ucibility of the transferred effluents (RSD ∼ 1%) [35], and MR = 3hould be aimed at if trace level analysis with high precision isesired [34]. As a result, for our ambient-level analysis, making MRreater than 3 so that each component produces 3–4 pulses are ourinimal target to obtain precise results. However, this attempt is
erplexed by choosing an appropriate PM value and, at the sameime, avoiding wrap-around.
PM is the elapsed time for each transfer of a sample slice fromhe 1-D column to the 2-D column. Missing peaks and poor sensi-ivities can happen if the modulation period is too long. Conversely,f the modulation period is set too short, it is possible that wrap-round can occur. To inspect for wrap-around during the process ofM determination, a series of chromatograms were aligned back-o-back by repeated analyzing the standard air sample (Fig. S3). Itas found that when the PM was set as 7 s, both criteria of MR > 3
=3.35) and the wrap-around avoidance was achieved. However,he halocarbons at trace ambient level such as CH2Cl2, CH3CCl3,nd CCl2 = CCl2 became quantitatively undetectable in the GC × GCesults if the PM was set too large. Therefore, PM was set as 3 s tochieve MR = 7.82 as a compromised condition.
DC is defined as the fraction of PM during which the 1-D effluents sampled by the modulation [35]. The DC value was determinedo be approximately 0.3 in our final optimized GC × GC settings.
e acknowledged that this value was rather low compared to thatf the typical thermal modulation which has the DC value closeo unity. In our case, DC was sacrificed largely for peak resolution.
he high enrichment factor of an order of three with the TD devicereatly compensated for the lost sample. Meanwhile, the inheritedigh sensitivity of ECD also tolerated greatly such a sample loss.fter all the modulation parameters were determined and set, theCCl4 1.49% 0.9988 2.0
a The method detection limits are calculated based on 3� of the 100 mL aliquots.
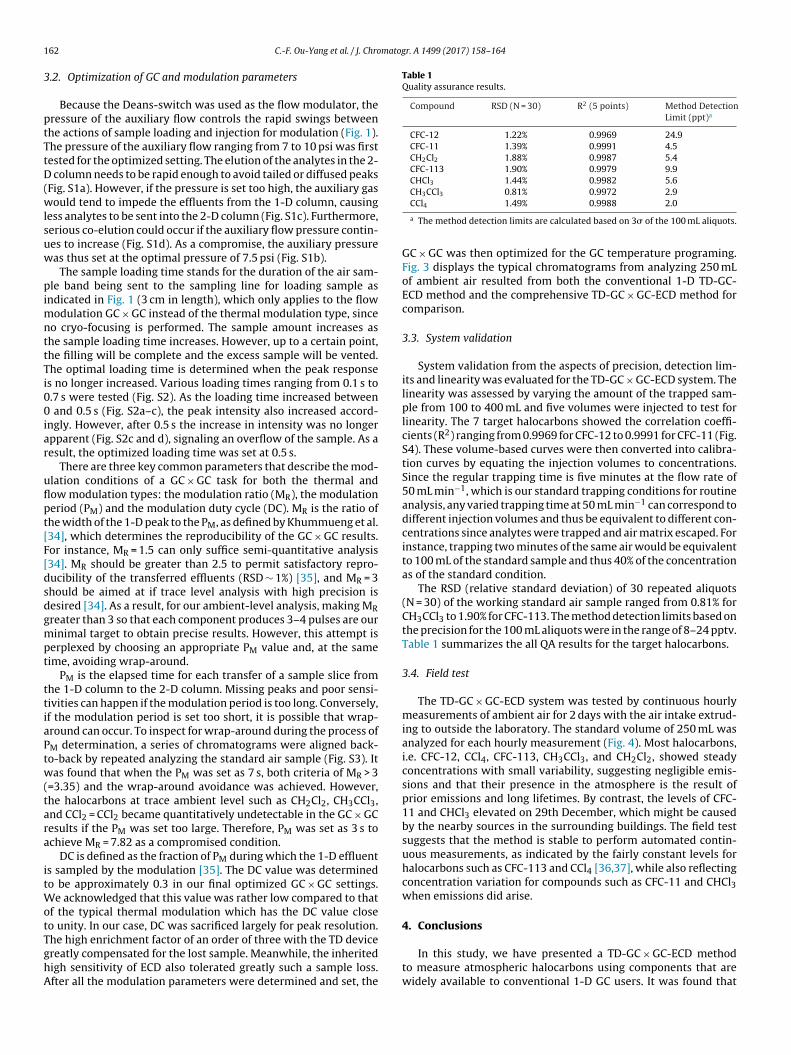
GC × GC was then optimized for the GC temperature programing.Fig. 3 displays the typical chromatograms from analyzing 250 mLof ambient air resulted from both the conventional 1-D TD-GC-ECD method and the comprehensive TD-GC × GC-ECD method forcomparison.
3.3. System validation
System validation from the aspects of precision, detection lim-its and linearity was evaluated for the TD-GC × GC-ECD system. Thelinearity was assessed by varying the amount of the trapped sam-ple from 100 to 400 mL and five volumes were injected to test forlinearity. The 7 target halocarbons showed the correlation coeffi-cients (R2) ranging from 0.9969 for CFC-12 to 0.9991 for CFC-11 (Fig.S4). These volume-based curves were then converted into calibra-tion curves by equating the injection volumes to concentrations.Since the regular trapping time is five minutes at the flow rate of50 mL min−1, which is our standard trapping conditions for routineanalysis, any varied trapping time at 50 mL min−1 can correspond todifferent injection volumes and thus be equivalent to different con-centrations since analytes were trapped and air matrix escaped. Forinstance, trapping two minutes of the same air would be equivalentto 100 mL of the standard sample and thus 40% of the concentrationas of the standard condition.
The RSD (relative standard deviation) of 30 repeated aliquots(N = 30) of the working standard air sample ranged from 0.81% forCH3CCl3 to 1.90% for CFC-113. The method detection limits based onthe precision for the 100 mL aliquots were in the range of 8–24 pptv.Table 1 summarizes the all QA results for the target halocarbons.
3.4. Field test
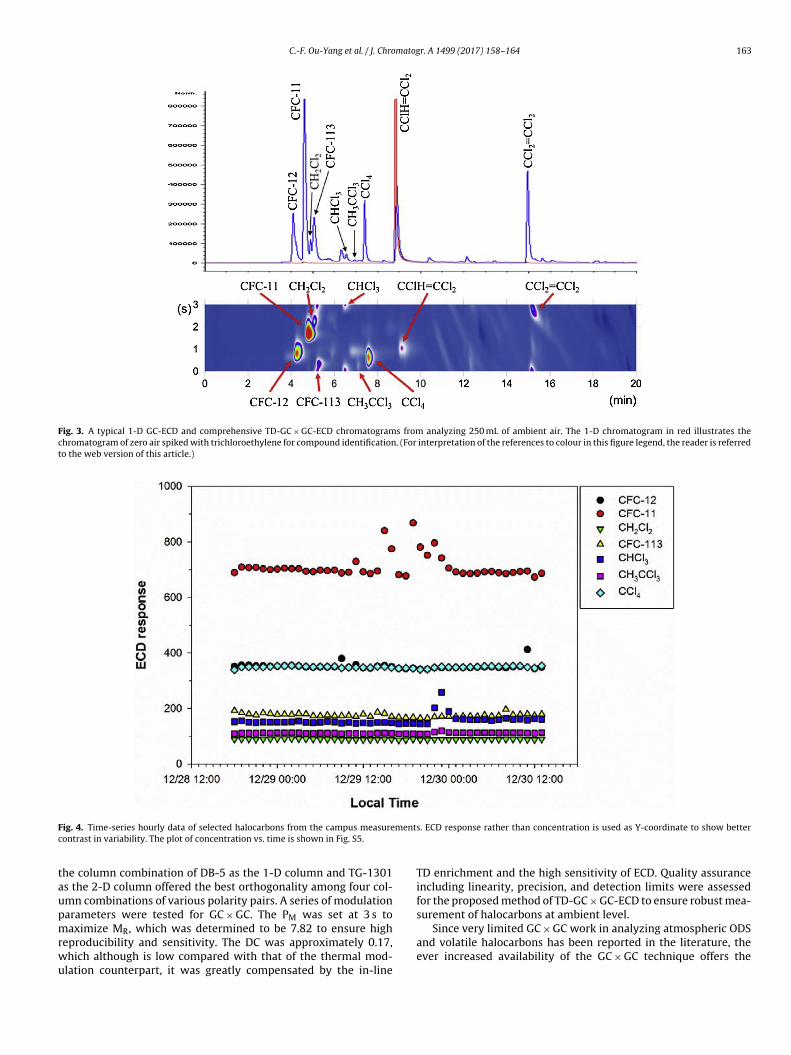
The TD-GC × GC-ECD system was tested by continuous hourlymeasurements of ambient air for 2 days with the air intake extrud-ing to outside the laboratory. The standard volume of 250 mL wasanalyzed for each hourly measurement (Fig. 4). Most halocarbons,i.e. CFC-12, CCl4, CFC-113, CH3CCl3, and CH2Cl2, showed steadyconcentrations with small variability, suggesting negligible emis-sions and that their presence in the atmosphere is the result ofprior emissions and long lifetimes. By contrast, the levels of CFC-11 and CHCl3 elevated on 29th December, which might be causedby the nearby sources in the surrounding buildings. The field testsuggests that the method is stable to perform automated contin-uous measurements, as indicated by the fairly constant levels forhalocarbons such as CFC-113 and CCl4 [36,37], while also reflectingconcentration variation for compounds such as CFC-11 and CHCl3when emissions did arise.
4. Conclusions
In this study, we have presented a TD-GC × GC-ECD methodto measure atmospheric halocarbons using components that arewidely available to conventional 1-D GC users. It was found that
C.-F. Ou-Yang et al. / J. Chromatogr. A 1499 (2017) 158–164 163
Fig. 3. A typical 1-D GC-ECD and comprehensive TD-GC × GC-ECD chromatograms from analyzing 250 mL of ambient air. The 1-D chromatogram in red illustrates thechromatogram of zero air spiked with trichloroethylene for compound identification. (For interpretation of the references to colour in this figure legend, the reader is referredto the web version of this article.)
F mentc
taupmrwu
ig. 4. Time-series hourly data of selected halocarbons from the campus measureontrast in variability. The plot of concentration vs. time is shown in Fig. S5.
he column combination of DB-5 as the 1-D column and TG-1301s the 2-D column offered the best orthogonality among four col-mn combinations of various polarity pairs. A series of modulationarameters were tested for GC × GC. The PM was set at 3 s toaximize MR, which was determined to be 7.82 to ensure high
eproducibility and sensitivity. The DC was approximately 0.17,hich although is low compared with that of the thermal mod-lation counterpart, it was greatly compensated by the in-line
s. ECD response rather than concentration is used as Y-coordinate to show better
TD enrichment and the high sensitivity of ECD. Quality assuranceincluding linearity, precision, and detection limits were assessedfor the proposed method of TD-GC × GC-ECD to ensure robust mea-surement of halocarbons at ambient level.
Since very limited GC × GC work in analyzing atmospheric ODS
and volatile halocarbons has been reported in the literature, theever increased availability of the GC × GC technique offers the
1 matog
aG
A
Tt
A
t0
R
[
[
[
[
[
[
[
[
[
[
[
[
[
[
[
[
[
[
[
[
[
[
[
[
[
[
[
3273–3279.[37] C.F. Ou-Yang, C.C. Chang, S.P. Chen, C. Chew, B.R. Lee, C.Y. Chang, S.A. Montzka,
G.S. Dutton, J.H. Butler, J.W. Elkins, J.L. Wang, Changes in the levels and
64 C.-F. Ou-Yang et al. / J. Chro
tmospheric halocarbon analysis, which used more conventionalC-ECD or GC–MS technique, an entirely new perspective.
cknowledgements
This study was finically supported by the Ministry of Science andechnology (formerly National Science Council), Taiwan, throughhe contract no. NSC 102-2113-M-008-002-MY3.
ppendix A. Supplementary data
Supplementary data associated with this article can be found, inhe online version, at http://dx.doi.org/10.1016/j.chroma.2017.04.03.
eferences
[1] S.A. Montzka, S. Reimann, A. Engel, K. Krüger, S. O’Doherty, W.T. Sturges, D.Blake, M. Dorf, P. Fraser, L. Froidevaux, K. Jucks, K. Kreher, M.J. Kurylo, A.Mellouki, J. Miller, O.J. Nielsen, V.L. Orkin, R.G. Prinn, R. Rhew, M.L. Santee, A.Stohl, D. Verdonik, Chapter 1 ozone-Depleting substances (ODSs) and relatedchemicals, scientific assessment of ozone depletion: 2010, in: Global OzoneResearch and Monitoring Project – Report No.52, World MeteorologicalOrganization, Geneva, Switzerland, 2011.
[2] L.J. Carpenter, S. Reimann, J.B. Burkholder, C. Clerbaux, B.D. Hall, R. Hossaini,J.C. Laube, S.A. Yvon-Lewis, Update on ozone-depleting substances (ODSs) andother gases of interest to the montreal protocol, scientific assessment ofozone depletion, in: Global Ozone Research and Monitoring Project – ReportNo.55, World Meteorological Organization, Geneva, 2014, pp. 2014.
[3] M.J. Molina, F.S. Rowland, Stratospheric sink for chlorofluoromethanes:chlorine atom-catalysed destruction of ozone, Nature 249 (1974) 810–812.
[4] UNEP, Montreal Protocol on Substances That Deplete the Ozone Layer: FinalAct, Montreal, 1987.
[5] UNEP, The Copenhagen Amendment (1992), in: The Amendment to theMontreal Protocol Agreed by the Fourth Meeting of the Parties, Copenhagen,1992.
[6] R.G. Prinn, J. Huang, R.F. Weiss, D.M. Cunnold, P.J. Fraser, P.G. Simmonds, A.McCulloch, C. Harth, S. Reimann, P. Salameh, S. O’Doherty, R.H.J. Wang, L.W.Porter, B.R. Miller, P.B. Krummel, Evidence for variability of atmospherichydroxyl radicals over the past quarter century, Geophys. Res. Lett. 32 (2005),http://dx.doi.org/10.1029/2004gl022228.
[7] M. Rigby, R.G. Prinn, S. O’Doherty, S.A. Montzka, A. McCulloch, C.M. Harth, J.Muhle, P.K. Salameh, R.F. Weiss, D. Young, P.G. Simmonds, B.D. Hall, G.S.Dutton, D. Nance, D.J. Mondeel, J.W. Elkins, P.B. Krummel, L.P. Steele, P.J.Fraser, Re-evaluation of the lifetimes of the major CFCs and CH3CCl3 usingatmospheric trends, Atmos. Chem. Phys. 13 (2013) 2691–2702.
[8] S.A. Montzka, J.H. Butler, B.D. Hall, D.J. Mondeel, J.W. Elkins, A decline intropospheric organic bromine, Geophys. Res. Lett. 30 (2003), http://dx.doi.org/10.1029/2003gl017745.
[9] M. Maione, U. Giostra, J. Arduini, F. Furlani, F. Graziosi, E. Lo Vullo, P. Bonasoni,Ten years of continuous observations of stratospheric ozone depleting gasesat Monte Cimone (Italy) – comments on the effectiveness of the MontrealProtocol from a regional perspective, Sci. Total Environ. 445 (2013) 155–164.
10] M.K. Vollmer, J. Muhle, C.M. Trudinger, M. Rigby, S.A. Montzka, C.M. Harth,B.R. Miller, S. Henne, P.B. Krummel, B.D. Hall, D. Young, J. Kim, J. Arduini, A.Wenger, B. Yao, S. Reimann, S. O’Doherty, M. Maione, D.M. Etheridge, S.L. Li,D.P. Verdonik, S. Park, G. Dutton, L.P. Steele, C.R. Lunder, T.S. Rhee, O.Hermansen, N. Schmidbauer, R.H.J. Wang, M. Hill, P.K. Salameh, R.L.Langenfelds, L.X. Zhou, T. Blunier, J. Schwander, J.W. Elkins, J.H. Butler, P.G.Simmonds, R.F. Weiss, R.G. Prinn, P.J. Fraser, Atmospheric histories and globalemissions of halons H-1211 (CBrClF2) H-1301 (CBrF3), and H-2402(CBrF2CBrF2), J. Geophys. Res. 121 (2016) 3663–3686.
11] S.A. Montzka, B.D. Hall, J.W. Elkins, Accelerated increases observed forhydrochlorofluorocarbons since 2004 in the global atmosphere, Geophys. Res.Lett. 36 (2009), http://dx.doi.org/10.1029/2008gl036475.
12] M. Rigby, R.G. Prinn, S. O’Doherty, B.R. Miller, D. Ivy, J. Muhle, C.M. Harth, P.K.Salameh, T. Arnold, R.F. Weiss, P.B. Krummel, L.P. Steele, P.J. Fraser, D. Young,P.G. Simmonds, Recent and future trends in synthetic greenhouse gasradiative forcing, Geophys. Res. Lett. 41 (2014) 2623–2630.
13] J.H. Butler, S.A.m Montzka, in, http://www.esrl.noaa.gov/gmd/aggi/aggi.html,2016.
14] S.A. Montzka, R.C. Myers, J.H. Butler, J.W. Elkins, S.O. Cummings, Globaltropospheric distribution and calibration scale of HCFC-22, Geophys. Res. Lett.20 (1993) 703–706.
15] P.G. Simmonds, S. Odoherty, G. Nickless, G.A. Sturrock, R. Swaby, P. Knight, J.Ricketts, G. Woffendin, R. Smith, Automated gas-chromatographmass-spectrometer for routine atmospheric field-measurements of the CFCreplacement compounds, the hydrofluorocarbons andhydrochlorofluorocarbons, Anal. Chem. 67 (1995) 717–723.
r. A 1499 (2017) 158–164
16] J.L. Wang, C.H. Wu, Construction and validation of a cryogen free gaschromatography-electron-capture detection system for the measurement ofambient halocarbons, Anal. Chim. Acta 461 (2002) 85–95.
17] B.R. Miller, R.F. Weiss, P.K. Salameh, T. Tanhua, B.R. Greally, J. Muhle, P.G.Simmonds, Medusa A sample preconcentration and GC/MS detector systemfor in situ measurements of atmospheric trace halocarbons, hydrocarbons,and sulfur compounds, Anal. Chem. 80 (2008) 1536–1545.
18] C.H. Wang, S.W. Chiang, J.L. Wang, Simultaneous analysis of atmospherichalocarbons and non-methane hydrocarbons using two-dimensional gaschromatography, J. Chromatogr. A 1217 (2010) 353–358.
19] J.L. Wang, C.J. Chang, W.D. Chang, C. Chew, S.W. Chen, Construction andevaluation of automated gas chromatography for the measurement ofanthropogenic halocarbons in the atmosphere, J. Chromatogr. A 844 (1999)259–269.
20] Y. Wang, X.B. Xu, L.Y. Yin, H.B. Cheng, T. Mao, K.P. Zhang, W.L. Lin, Z.Y. Meng,J.A. Palasota, Coupling of comprehensive two-dimensional gaschromatography with quadrupole mass spectrometry: application to theidentification of atmospheric volatile organic compounds, J. Chromatogr. A1361 (2014) 229–239.
21] J.V. Seeley, Recent advances in flow-controlled multidimensional gaschromatography, J. Chromatogr. A 1255 (2012) 24–37.
22] R.B. Gaines, G.S. Frysinger, Temperature requirements for thermal modulationin comprehensive two-dimensional gas chromatography, J. Sep. Sci. 27 (2004)380–388.
23] E.M. Kristenson, P. Korytar, C. Danielsson, M. Kallio, M. Brandt, J. Makela,Evaluation of modulators and electron-capture detectors for comprehensivetwo-dimensional GC of halogenated organic compounds, J. Chromatogr. A1019 (2003) 65–77.
24] A.M. Muscalu, E.J. Reiner, S.N. Liss, T. Chen, G. Ladwig, D. Morse, A routineaccredited method for the analysis of polychlorinated biphenylsorganochlorine pesticides, chlorobenzenes and screening of otherhalogenated organics in soil, sediment and sludge by GC×GC-�ECD, Anal.Bioanal. Chem. 401 (2011) 2403–2413.
25] J.M. da Silva, C.A. Zini, E.B. Caramao, Evaluation of comprehensivetwo-dimensional gas chromatography with micro-electron capture detectionfor the analysis of seven pesticides in sediment samples, J. Chromatogr. A1218 (2011) 3166–3172.
26] P. Haglund, P. Korytar, C. Danielsson, J. Diaz, K. Wiberg, P. Leonards, U.A.T.Brinkman, J. de Boer, GC×GC-ECD: a promising method for the determinationof dioxins and dioxin-like PCBs in food and feed, Anal. Bioanal. Chem. 390(2008) 1815–1827.
27] A.M. Muscalu, E.J. Reiner, S.N. Liss, T. Chen, Determination of polychlorinatedbiphenyls organochlorine pesticides, chlorobenzenes in sludge and sedimentsamples by GC×GC-�ECD, Int. J. Environ. Anal. Chem. 90 (2010) 1–13.
28] J.W. Elkins, D.W. Fahey, J.M. Gilligan, G.S. Dutton, T.J. Baring, C.M. Volk, R.E.Dunn, R.C. Myers, S.A. Montzka, P.R. Wamsley, A.H. Hayden, J.H. Butler, T.M.Thompson, T.H. Swanson, E.J. Dlugokencky, P.C. Novelli, D.F. Hurst, J.M.Lobert, S.J. Ciciora, R.J. McLaughlin, T.L. Thompson, R.H. Winkler, P.J. Fraser,L.P. Steele, M.P. Lucarelli, Airborne gas chromatograph for in situmeasurements of long-lived species in the upper troposphere and lowerstratosphere, Geophys. Res. Lett. 23 (1996) 347–350.
29] F.L. Moore, J.W. Elkins, E.A. Ray, G.S. Dutton, R.E. Dunn, D.W. Fahey, R.J.McLaughlin, T.L. Thompson, P.A. Romashkin, D.F. Hurst, P.R. Wamsley,Balloonborne in situ gas chromatograph for measurements in thetroposphere and stratosphere, J. Geophys. Res. 108 (2003), http://dx.doi.org/10.1029/2001jd000891.
30] E.P. Grimsrud, D.A. Miller, Oxygen doping of carrier gas in measurement ofhalogenated methanes by gas chromatography with electron capturedetection, Anal. Chem. 50 (1978) 1141–1145.
31] C.F. Ou-Yang, W.C. Liao, P.C. Wang, G.J. Fan, C.C. Hsiao, M.T. Chuang, C.C.Chang, N.H. Lin, J.L. Wang, Construction of a cryogen-free thermal desorptiongas chromatographic system with off-the-shelf components for monitoringambient volatile organic compounds, J. Sep. Sci. 39 (2016) 1489–1499.
32] J.L. Wang, G.Z. Din, C.C. Chan, Validation of a laboratory-constructedautomated gas chromatograph for the measurement of ozone precursorsthrough comparison with a commercial analogy, J. Chromatogr. A 1027(2004) 11–18.
33] W.C. Liao, C.F. Ou-Yang, C.H. Wang, C.C. Chang, J.L. Wang, Two-dimensionalgas chromatographic analysis of ambient light hydrocarbons, J. Chromatogr. A1294 (2013) 122–129.
34] W. Khummueng, J. Harynuk, P.J. Marriott, Modulation ratio in comprehensivetwo-dimensional gas chromatography, Anal. Chem. 78 (2006) 4578–4587.
35] J.V. Seeley, N.J. Micyus, S.V. Bandurski, S.K. Seeley, J.D. McCurry, MicrofluidicDeans switch for comprehensive two-dimensional gas chromatography, Anal.Chem. 79 (2007) 1840–1847.
36] C.C. Chang, G.G. Lo, C.H. Tsai, J.L. Wang, Concentration variability ofhalocarbons over an electronics industrial park and its implication incompliance with the Montreal Protocol, Environ. Sci. Technol. 35 (2001)
variability of halocarbons and the compliance with the Montreal Protocolfrom an urban view, Chemosphere 138 (2015) 438–446.