journal of environment and engineering
TRANSCRIPT
Journal of Environmentand Engineering
Vol. 6, No. 4, 2011
805
Development of External-Noise Reduction Technologies for Shinkansen High-Speed
Trains*
Takeshi KURITA** **Research and Development Center of JR East Group, East Japan Railway Company,
2-479 Nisshincho, Kita-ku, Saitama-shi, Saitama 331-8513, Japan E-mail: [email protected]
Abstract JR-East has been working on a research and development project to increase Shinkansen operation speed to 360 km/h. Methods of wayside noise reduction arise as major issues when increasing the Shinkansen’s operating speed, as it is necessary to keep wayside noise levels within those of existing Shinkansen trains, even at a speed of 360 km/h. Two high-speed test trains were developed: "FASTECH360S" (running only on Shinkansen lines) and "FASTECH360Z" (running on both Shinkansen and conventional lines converted to Shinkansen gauge). Both of the trains feature several new types of equipment for reducing pantograph noise and noise from the lower part of cars, which have the greatest impact on overall noise level in series E2-1000, operating at a maximum speed of 275 km/h. Running tests were conducted with the FASTECH360 trains to measure wayside noise at a point 25 meters from the center of the track and 1.2 meters above the ground. The results show that to operate at the same noise levels as trains in service (series E2 and E3 (coupled) running at 275 km/h), FASTECH360S and FASTECH360Z (coupled) would have to run at approximately 330 km/h, and FASTECH360S (solo) at approximately 340 km/h. Although the goal of 360 km/h is yet to be attained, it was confirmed that the countermeasures incorporated in the FASTECH360 trains greatly reduced wayside noise. These measures are used for the new generation Shinkansen trains, "Series E5" which have been in operation on the Tohoku Shinkansen line since March 2011.
Key words: Noise Reduction, High Speed Train, Pantograph Noise, Noise from Lower Part of Cars, Aerodynamic Noise, Environmental Noise
1. Introduction
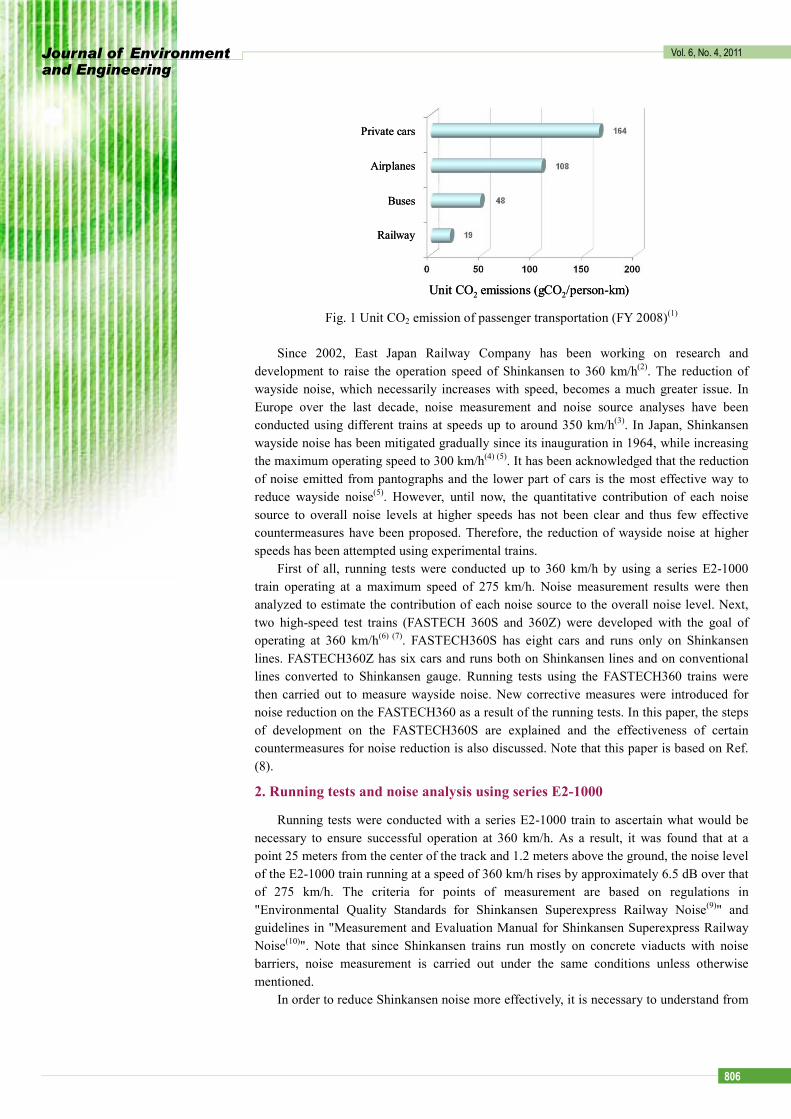
Railway systems are superior to other transportation modes in terms of carbon dioxide (CO2) emission. CO2 emitted per passenger-kilometer in rail transportation is about one-ninth of that of private cars and about one-sixth of that of airplanes, as shown in Fig. 1(1). Shifting passengers from other transportation modes to rail is one effective way to reduce CO2 emission in the transportation sector. Increasing maximum speed of Shinkansen trains could bring about such a shift, and greatly contribute to the reduction of CO2 emission.
*Received 31 May, 2011 (No. R-11-0306) [DOI: 10.1299/jee.6.805]
Copyright © 2011 by JSME
【Review Paper】
Journal of Environment and Engineering
Vol. 6, No. 4, 2011
806
Unit CO2 emissions (gCO2/person-km)
Private cars
Airplanes
Buses
Railway
Unit CO2 emissions (gCO2/person-km)
Private cars
Airplanes
Buses
Railway
Fig. 1 Unit CO2 emission of passenger transportation (FY 2008)(1)
Since 2002, East Japan Railway Company has been working on research and
development to raise the operation speed of Shinkansen to 360 km/h(2). The reduction of wayside noise, which necessarily increases with speed, becomes a much greater issue. In Europe over the last decade, noise measurement and noise source analyses have been conducted using different trains at speeds up to around 350 km/h(3). In Japan, Shinkansen wayside noise has been mitigated gradually since its inauguration in 1964, while increasing the maximum operating speed to 300 km/h(4) (5). It has been acknowledged that the reduction of noise emitted from pantographs and the lower part of cars is the most effective way to reduce wayside noise(5). However, until now, the quantitative contribution of each noise source to overall noise levels at higher speeds has not been clear and thus few effective countermeasures have been proposed. Therefore, the reduction of wayside noise at higher speeds has been attempted using experimental trains.
First of all, running tests were conducted up to 360 km/h by using a series E2-1000 train operating at a maximum speed of 275 km/h. Noise measurement results were then analyzed to estimate the contribution of each noise source to the overall noise level. Next, two high-speed test trains (FASTECH 360S and 360Z) were developed with the goal of operating at 360 km/h(6) (7). FASTECH360S has eight cars and runs only on Shinkansen lines. FASTECH360Z has six cars and runs both on Shinkansen lines and on conventional lines converted to Shinkansen gauge. Running tests using the FASTECH360 trains were then carried out to measure wayside noise. New corrective measures were introduced for noise reduction on the FASTECH360 as a result of the running tests. In this paper, the steps of development on the FASTECH360S are explained and the effectiveness of certain countermeasures for noise reduction is also discussed. Note that this paper is based on Ref. (8).
2. Running tests and noise analysis using series E2-1000
Running tests were conducted with a series E2-1000 train to ascertain what would be necessary to ensure successful operation at 360 km/h. As a result, it was found that at a point 25 meters from the center of the track and 1.2 meters above the ground, the noise level of the E2-1000 train running at a speed of 360 km/h rises by approximately 6.5 dB over that of 275 km/h. The criteria for points of measurement are based on regulations in "Environmental Quality Standards for Shinkansen Superexpress Railway Noise(9)" and guidelines in "Measurement and Evaluation Manual for Shinkansen Superexpress Railway Noise(10)". Note that since Shinkansen trains run mostly on concrete viaducts with noise barriers, noise measurement is carried out under the same conditions unless otherwise mentioned.
In order to reduce Shinkansen noise more effectively, it is necessary to understand from

Journal of Environment and Engineering
Vol. 6, No. 4, 2011
807
which area sound is generated and how much each noise source contributes to overall noise. Thus, the contribution of each noise source to the overall noise level was estimated for E2-1000 cars running at 275 km/h and at 360 km/h. Shinkansen noise sources are classified into the following five components (Fig. 2): pantograph noise (aerodynamic noise from pantographs, spark noise, sliding noise, etc.), noise from lower part of cars (rolling noise, aerodynamic noise from bogies, etc.), aerodynamic noise from upper part of cars (aerodynamic noise from gaps between cars, aerodynamic noise from uneven car surfaces, etc.), aerodynamic noise from train nose, and concrete-bridge noise (vibro-acoustic noise from concrete viaducts and noise barriers).
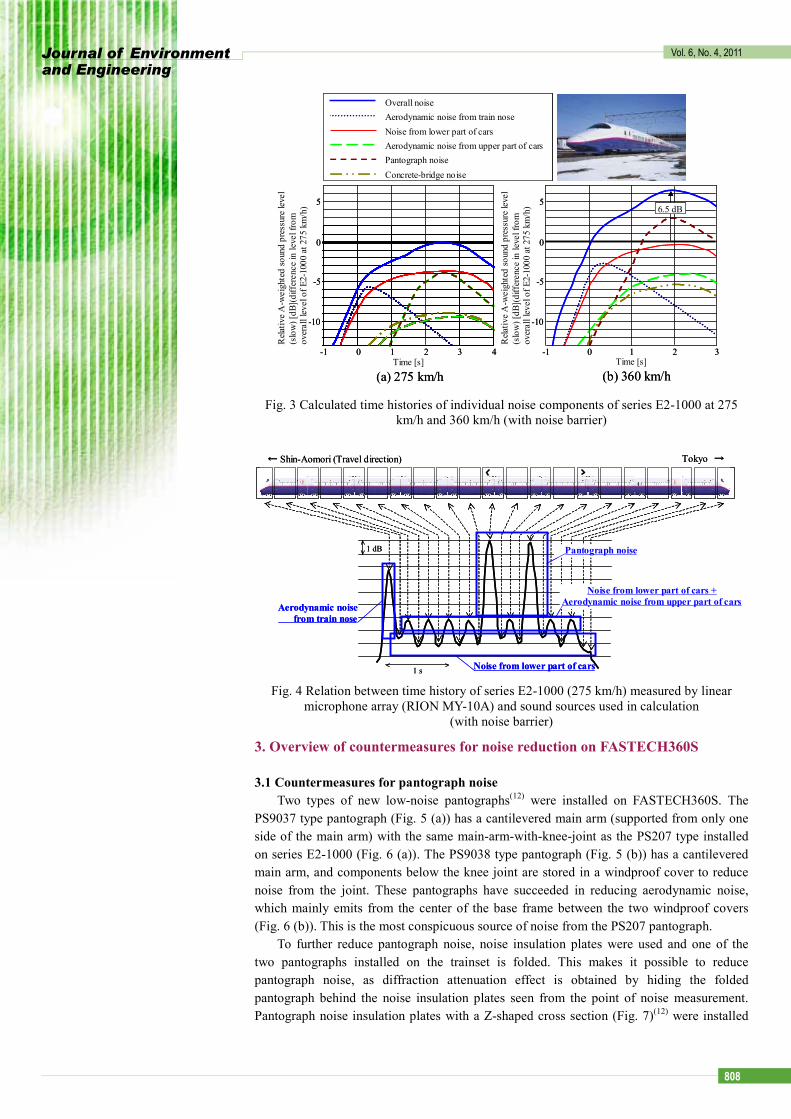
The time history of A-weighted sound pressure level (time weighting: SLOW) of each component was calculated based on the analyzing methods of Nagakura(11) and Kitagawa et al.(5). Calculation procedure is mentioned in the next paragraph, and results are shown in Fig. 3. Figure 3 (b) shows that pantograph noise and noise from the lower part of cars, in that order, have the greatest effect on overall noise level in series E2-1000 running at 360 km/h.
The time history of A-weighted sound pressure level (time weighting: SLOW) of concrete-bridge noise is estimated using the same method as Nagakura(11). The other four components are calculated as follows: First, the Shinkansen noise sources are replaced with twenty-one sound sources, using a time history measured by a linear microphone array (RION MY-10A, time weighting: 35 ms), as shown in Fig. 4. Peak noise levels at pantographs as seen in Fig. 4 (corresponding to pantograph nearest the gap between cars) are the sums of pantograph noise and inter-car noise (noise generated from gap between cars). Inter-car peak noise levels seen in Fig. 4 (peak noise levels at passage of inter-car gaps with no pantographs) are the sums of noise from the lower part of car and aerodynamic noise from the upper part of car. The first peak level corresponds to aerodynamic noise from train nose, and bottom levels correspond to noise from the lower part of car. Next, pantograph peak levels are divided into pantograph noise levels and inter-car peak levels. Inter-car peak levels are then divided into levels of noise from the lower part of cars and levels of aerodynamic noise from the upper part of cars, based on the method of Kitagawa et al.(5), also using a time history measured by use of a linear microphone array at low speed (160 km/h). The time history of A-weighted sound pressure level (time weighting: SLOW) of each component can be calculated with one or more sources corresponding to each component, according to Nagakura's method(11). Note that in general the peak level of the sum of these five time histories does not equal that of the measured overall time history, as this analyzing method includes several assumptions(5) (11). Therefore, four time histories (excluding that of the concrete-bridge noise) are adjusted using the differential between the peak level of the sum of these five time histories and that of the measured overall time history.
Pantograph noise
Concrete-bridge noiseNoise from lower part of cars
Aerodynamic noise from upper part of cars
Aerodynamic noise from train nose
Pantograph noise
Concrete-bridge noiseNoise from lower part of cars
Aerodynamic noise from upper part of cars
Aerodynamic noise from train nose
Fig. 2 Noise sources of Shinkansen
Journal of Environment and Engineering
Vol. 6, No. 4, 2011
808
(a) 275 km/h (b) 360 km/h
Overall noiseAerodynamic noise from train noseNoise from lower part of carsAerodynamic noise from upper part of carsPantograph noiseConcrete-bridge noise
6.5 dB
Time [s] Time [s]
0
Rela
tive
A-w
eigh
ted
soun
d pr
essu
re le
vel
(slo
w) [
dB](d
iffer
ence
in le
vel f
rom
ov
eral
l lev
el o
f E2-
1000
at 2
75 k
m/h
)
-5
-10
5
0 1 2-1 3 4 3210-1
0
Rela
tive
A-w
eigh
ted
soun
d pr
essu
re le
vel
(slo
w) [
dB](d
iffer
ence
in le
vel f
rom
ov
eral
l lev
el o
f E2-
1000
at 2
75 k
m/h
)
-5
-10
5
(a) 275 km/h (b) 360 km/h
Overall noiseAerodynamic noise from train noseNoise from lower part of carsAerodynamic noise from upper part of carsPantograph noiseConcrete-bridge noise
Overall noiseAerodynamic noise from train noseNoise from lower part of carsAerodynamic noise from upper part of carsPantograph noiseConcrete-bridge noise
6.5 dB
Time [s] Time [s]
0
Rela
tive
A-w
eigh
ted
soun
d pr
essu
re le
vel
(slo
w) [
dB](d
iffer
ence
in le
vel f
rom
ov
eral
l lev
el o
f E2-
1000
at 2
75 k
m/h
)
-5
-10
5
0 1 2-1 3 4 3210-1
0
Rela
tive
A-w
eigh
ted
soun
d pr
essu
re le
vel
(slo
w) [
dB](d
iffer
ence
in le
vel f
rom
ov
eral
l lev
el o
f E2-
1000
at 2
75 k
m/h
)
-5
-10
5
Fig. 3 Calculated time histories of individual noise components of series E2-1000 at 275
km/h and 360 km/h (with noise barrier)
← Shin-Aomori (Travel direction) Tokyo →
1 dB
1 s Noise from lower part of cars
Aerodynamic noisefrom train nose
Pantograph noise
Noise from lower part of cars +Aerodynamic noise from upper part of cars
← Shin-Aomori (Travel direction) Tokyo →
1 dB
1 s Noise from lower part of cars
Aerodynamic noisefrom train nose
Pantograph noise
Noise from lower part of cars +Aerodynamic noise from upper part of cars
Fig. 4 Relation between time history of series E2-1000 (275 km/h) measured by linear microphone array (RION MY-10A) and sound sources used in calculation
(with noise barrier)
3. Overview of countermeasures for noise reduction on FASTECH360S
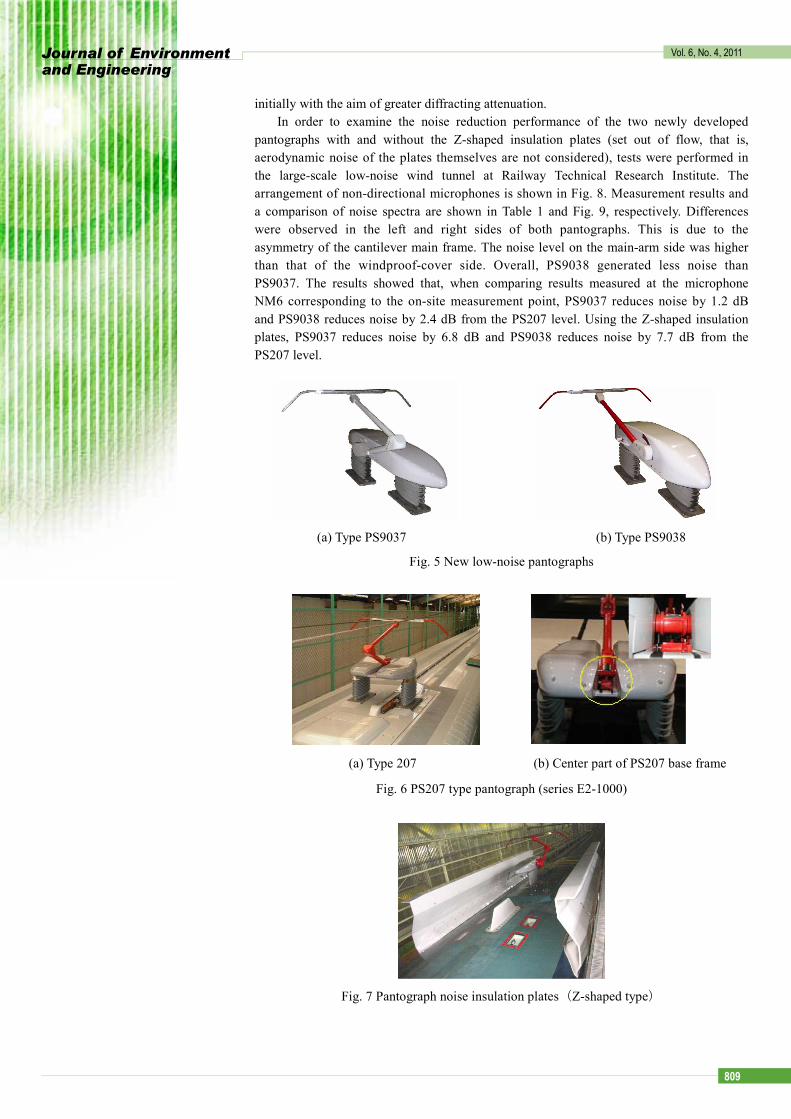
3.1 Countermeasures for pantograph noise Two types of new low-noise pantographs(12) were installed on FASTECH360S. The
PS9037 type pantograph (Fig. 5 (a)) has a cantilevered main arm (supported from only one side of the main arm) with the same main-arm-with-knee-joint as the PS207 type installed on series E2-1000 (Fig. 6 (a)). The PS9038 type pantograph (Fig. 5 (b)) has a cantilevered main arm, and components below the knee joint are stored in a windproof cover to reduce noise from the joint. These pantographs have succeeded in reducing aerodynamic noise, which mainly emits from the center of the base frame between the two windproof covers (Fig. 6 (b)). This is the most conspicuous source of noise from the PS207 pantograph.
To further reduce pantograph noise, noise insulation plates were used and one of the two pantographs installed on the trainset is folded. This makes it possible to reduce pantograph noise, as diffraction attenuation effect is obtained by hiding the folded pantograph behind the noise insulation plates seen from the point of noise measurement. Pantograph noise insulation plates with a Z-shaped cross section (Fig. 7)(12) were installed
Journal of Environment and Engineering
Vol. 6, No. 4, 2011
809
initially with the aim of greater diffracting attenuation. In order to examine the noise reduction performance of the two newly developed
pantographs with and without the Z-shaped insulation plates (set out of flow, that is, aerodynamic noise of the plates themselves are not considered), tests were performed in the large-scale low-noise wind tunnel at Railway Technical Research Institute. The arrangement of non-directional microphones is shown in Fig. 8. Measurement results and a comparison of noise spectra are shown in Table 1 and Fig. 9, respectively. Differences were observed in the left and right sides of both pantographs. This is due to the asymmetry of the cantilever main frame. The noise level on the main-arm side was higher than that of the windproof-cover side. Overall, PS9038 generated less noise than PS9037. The results showed that, when comparing results measured at the microphone NM6 corresponding to the on-site measurement point, PS9037 reduces noise by 1.2 dB and PS9038 reduces noise by 2.4 dB from the PS207 level. Using the Z-shaped insulation plates, PS9037 reduces noise by 6.8 dB and PS9038 reduces noise by 7.7 dB from the PS207 level.
(a) Type PS9037 (b) Type PS9038
Fig. 5 New low-noise pantographs
(a) Type 207 (b) Center part of PS207 base frame
Fig. 6 PS207 type pantograph (series E2-1000)
Fig. 7 Pantograph noise insulation plates(Z-shaped type)

Journal of Environment and Engineering
Vol. 6, No. 4, 2011
810
Flow
5m
Pantographhead center
Center between insulators
Windproof-coverside
Main-arm side
NM1
NM3
NM5
NM2
NM6
NM4
2.5m
Flow
5m
Pantographhead center
Center between insulators
Windproof-coverside
Main-arm side
NM1
NM3
NM5
NM2
NM6
NM4
2.5m
Fig. 8 Placement of microphones
Table 1 Noise measurement results (overall differences in level from PS207)
(velocity: 360 km/h) (unit: dB) Microphone numbers
Pantograph NM1 NM2 NM3 NM4 NM5 NM6
PS9037 -2.2 -3.0 -2.0 -2.6 -1.1 -1.2PS9037 (with Z-shaped insulation plates) -4.1 -4.6 -6.4 -6.8
PS9038 -1.7 -4.7 -2.3 -4.7 -1.4 -2.4PS9038 (with Z-shaped insulation plates) -4.2 -5.8 -6.9 -7.7
40
50
60
70
80
90
100
25 40 63 100
160
250
400
630 1k
1.6k
2.5k 4k
6.3k 10k
16k
O.A
.
1/3 Octave-band center frequency [Hz]
A-w
eigh
ted
soun
d pr
essu
re le
vel [
dB]
PS207PS9037PS9038PS9037 with Z-shaped insulation platesPS9038 with Z-shaped insulation plates
Fig. 9 Results of wind tunnel tests (measurement microphone: NM6) (velocity: 360 km/h)
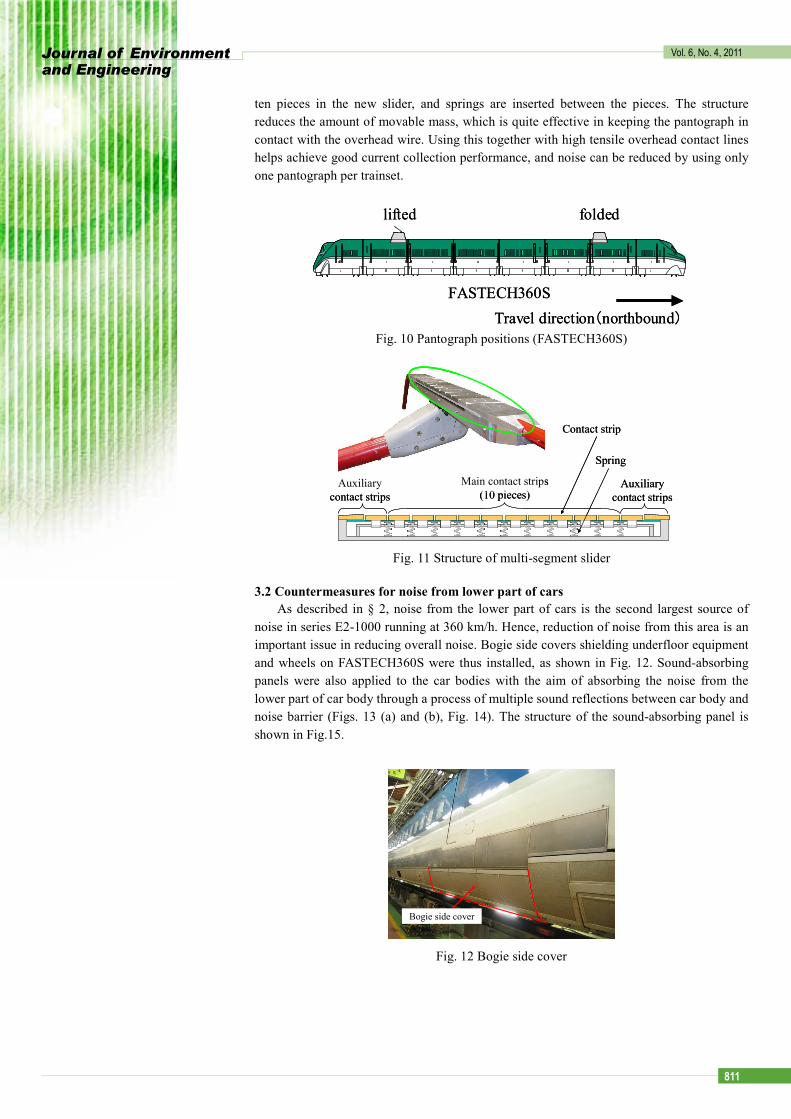
Conventionally, a Shinkansen train collects current using two pantographs per trainset to prevent arc that might be caused by contact loss. However, FASTECH360S is operated by folding one of the two pantographs, in other words, by using only one pantograph per trainset to collect current (Fig. 10, use of pantograph at rear of trainset in operation); therefore, the pantograph for FASTECH360S must have significantly higher current collection performance than PS207, to ensure minimum contact loss. A multi-segment slider(12) (Fig. 11) was developed to address this issue. The main contact strip is divided into
Journal of Environment and Engineering
Vol. 6, No. 4, 2011
811
ten pieces in the new slider, and springs are inserted between the pieces. The structure reduces the amount of movable mass, which is quite effective in keeping the pantograph in contact with the overhead wire. Using this together with high tensile overhead contact lines helps achieve good current collection performance, and noise can be reduced by using only one pantograph per trainset.
lifted folded
FASTECH360STravel direction(northbound)
lifted folded
FASTECH360STravel direction(northbound)
Fig. 10 Pantograph positions (FASTECH360S)
Contact strip
Spring
Main contact strips(10 pieces)
Auxiliarycontact strips
Auxiliarycontact strips
Contact strip
Spring
Main contact strips(10 pieces)
Auxiliarycontact strips
Auxiliarycontact strips
Fig. 11 Structure of multi-segment slider
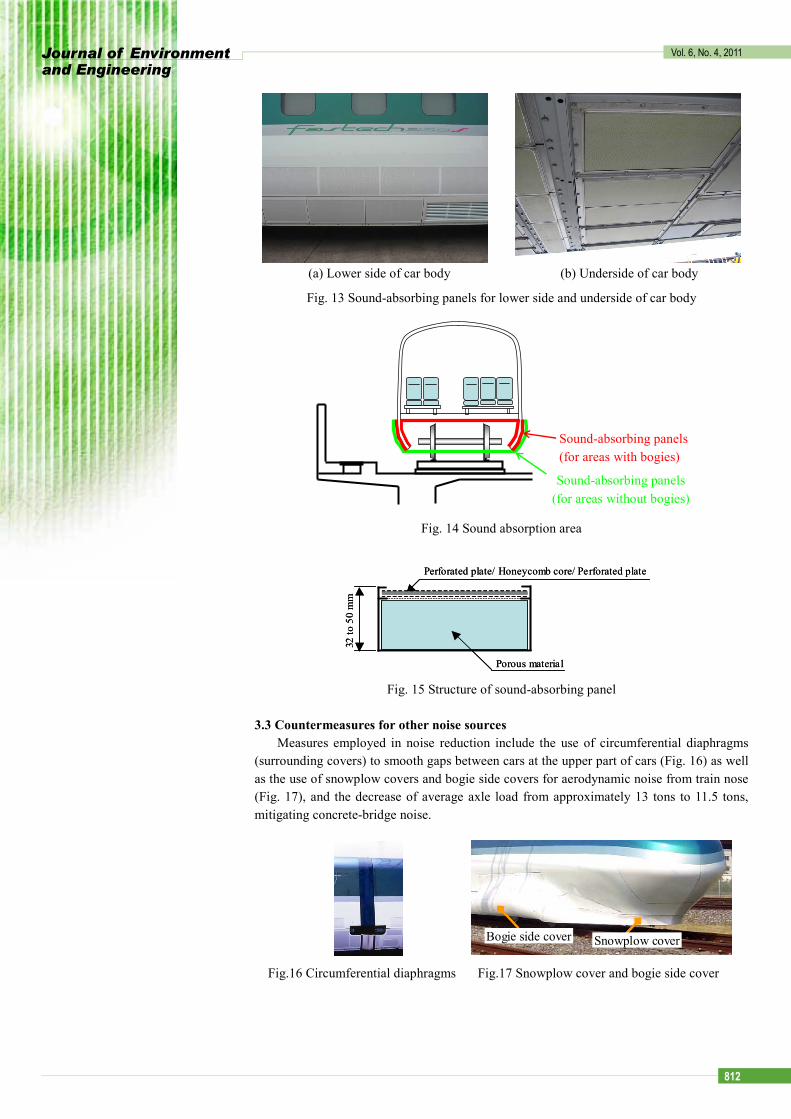
3.2 Countermeasures for noise from lower part of cars As described in § 2, noise from the lower part of cars is the second largest source of
noise in series E2-1000 running at 360 km/h. Hence, reduction of noise from this area is an important issue in reducing overall noise. Bogie side covers shielding underfloor equipment and wheels on FASTECH360S were thus installed, as shown in Fig. 12. Sound-absorbing panels were also applied to the car bodies with the aim of absorbing the noise from the lower part of car body through a process of multiple sound reflections between car body and noise barrier (Figs. 13 (a) and (b), Fig. 14). The structure of the sound-absorbing panel is shown in Fig.15.
Bogie side coverBogie side cover
Fig. 12 Bogie side cover
Journal of Environment and Engineering
Vol. 6, No. 4, 2011
812
(a) Lower side of car body (b) Underside of car body
Fig. 13 Sound-absorbing panels for lower side and underside of car body
Fig. 14 Sound absorption area
Porous material
Perforated plate/ Honeycomb core/ Perforated plate
32 to
50
mm
Porous material
Perforated plate/ Honeycomb core/ Perforated plate
32 to
50
mm
Fig. 15 Structure of sound-absorbing panel
3.3 Countermeasures for other noise sources Measures employed in noise reduction include the use of circumferential diaphragms
(surrounding covers) to smooth gaps between cars at the upper part of cars (Fig. 16) as well as the use of snowplow covers and bogie side covers for aerodynamic noise from train nose (Fig. 17), and the decrease of average axle load from approximately 13 tons to 11.5 tons, mitigating concrete-bridge noise.
Bogie side cover Snowplow coverBogie side cover Snowplow cover
Fig.16 Circumferential diaphragms Fig.17 Snowplow cover and bogie side cover
Sound-absorbing panels (for areas with bogies)
Sound-absorbing panels (for areas without bogies)

Journal of Environment and Engineering
Vol. 6, No. 4, 2011
813
4. Improvements resulting from running tests of FASTECH360S
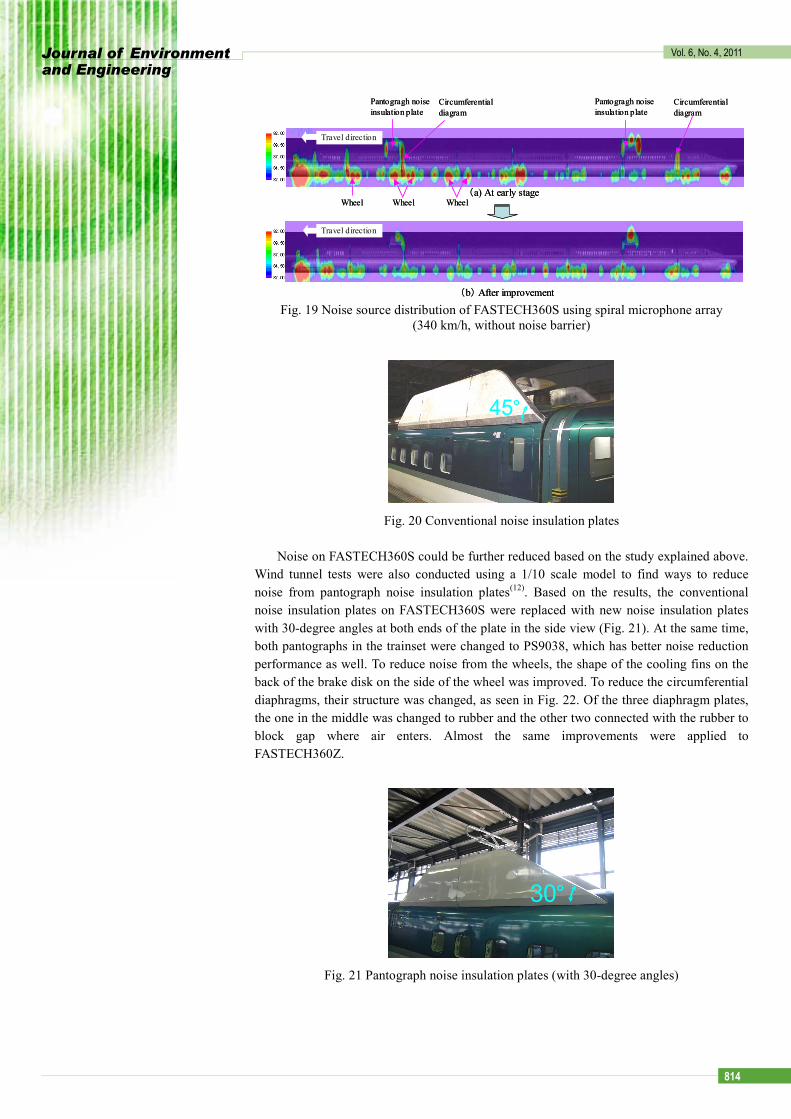
Figure 18 shows the schematic diagram of noise measurement for FASTECH360 using a spiral microphone array(13), the specifications of which are shown in Table 2. Figures 19 (a) and (b) show measurement results of noise source distribution of FASTECH360S at 340 km/h in the early stage of the running tests and after improvement, respectively. Figure 19 (a) shows that much noise is generated from the pantograph noise insulation plates, certain wheels and circumferential diaphragms. This brought about the need to study corrective measures for these noise sources.
Concerning pantograph noise insulation plates, Fig. 19 (a) shows that there are large noise sources at the front and rear ends of the plates in addition to the noise source around the pantograph head at the center of the plate. Running tests were also conducted by installing the flat insulation plates with 45-degree angles at both ends of the plate in the side view (“conventional noise insulation plates”). These had shown good performance in past running tests of series E2-1000(14). Figure 20 shows the conventional noise insulation plates installed on FASTECH360S. Figure 19 (b) shows the result of measuring noise source distribution with conventional noise insulation plates. The figure shows that the noise at both ends of the insulation plates is greatly reduced. Regarding noise from the wheels (at front half of the trainset), running tests were carried out blocking the ventilation route for the cooling fins on the back of the brake disk on the side of the wheel with aluminum tape. The test results proved that noise could be reduced to the level of the other wheels, as shown in Fig. 19 (b). It is likely that what is emitting from the wheels is aerodynamic noise from the cooling fins of brake disks. Regarding noise from the circumferential diaphragms, it was found that much noise was generated when air flowed into thin gaps between diaphragm plates. Thus, the noise could be reduced by blocking the gaps, as shown in Fig. 19 (b).
Noise barrier removed
Spiral microphone array
10m
5mLine sensor camera
φ4mSlab track
Noise barrier removed
Spiral microphone array
10m
5mLine sensor camera
φ4mSlab track
Fig. 18 Schematic diagram of measurement using spiral microphone array
Table 2 Specifications of spiral microphone array
Number of microphones 114 ch Shape of microphone array Archimedes' spiral
Diameter of microphone array approximately 4 m Microphone spacing 0.35 m
Object distance 10 m Frequency range 200 Hz - 2.5 kHz Spatial resolution 0.4 m at 1 kHz
Journal of Environment and Engineering
Vol. 6, No. 4, 2011
814
(a) At early stage
(b) After improvement
Travel direction
Pantogragh noiseinsulation plate
Circumferentialdiagram
Wheel Wheel Wheel
Travel direction
Pantogragh noiseinsulation plate
Circumferentialdiagram
(a) At early stage
(b) After improvement
Travel direction
Pantogragh noiseinsulation plate
Circumferentialdiagram
Wheel Wheel Wheel
Travel direction
Pantogragh noiseinsulation plate
Circumferentialdiagram
Fig. 19 Noise source distribution of FASTECH360S using spiral microphone array (340 km/h, without noise barrier)
45°
Fig. 20 Conventional noise insulation plates
Noise on FASTECH360S could be further reduced based on the study explained above.
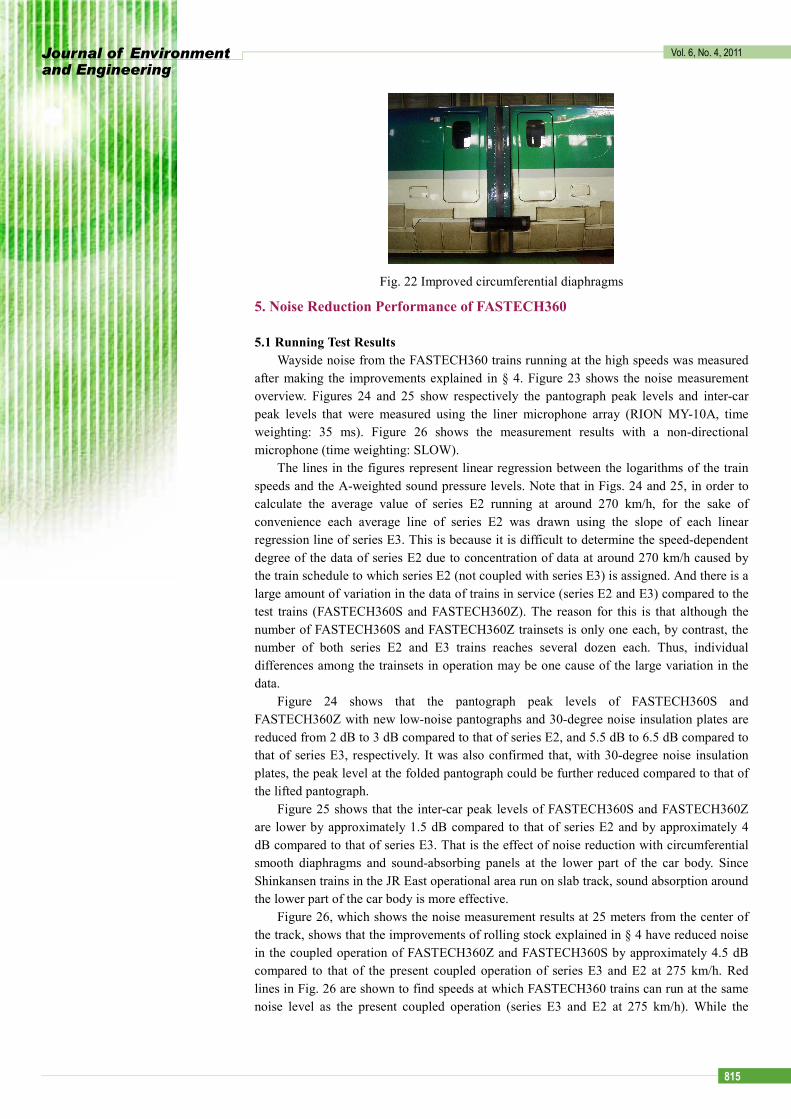
Wind tunnel tests were also conducted using a 1/10 scale model to find ways to reduce noise from pantograph noise insulation plates(12). Based on the results, the conventional noise insulation plates on FASTECH360S were replaced with new noise insulation plates with 30-degree angles at both ends of the plate in the side view (Fig. 21). At the same time, both pantographs in the trainset were changed to PS9038, which has better noise reduction performance as well. To reduce noise from the wheels, the shape of the cooling fins on the back of the brake disk on the side of the wheel was improved. To reduce the circumferential diaphragms, their structure was changed, as seen in Fig. 22. Of the three diaphragm plates, the one in the middle was changed to rubber and the other two connected with the rubber to block gap where air enters. Almost the same improvements were applied to FASTECH360Z.
30°
Fig. 21 Pantograph noise insulation plates (with 30-degree angles)
Journal of Environment and Engineering
Vol. 6, No. 4, 2011
815
Fig. 22 Improved circumferential diaphragms
5. Noise Reduction Performance of FASTECH360
5.1 Running Test Results Wayside noise from the FASTECH360 trains running at the high speeds was measured
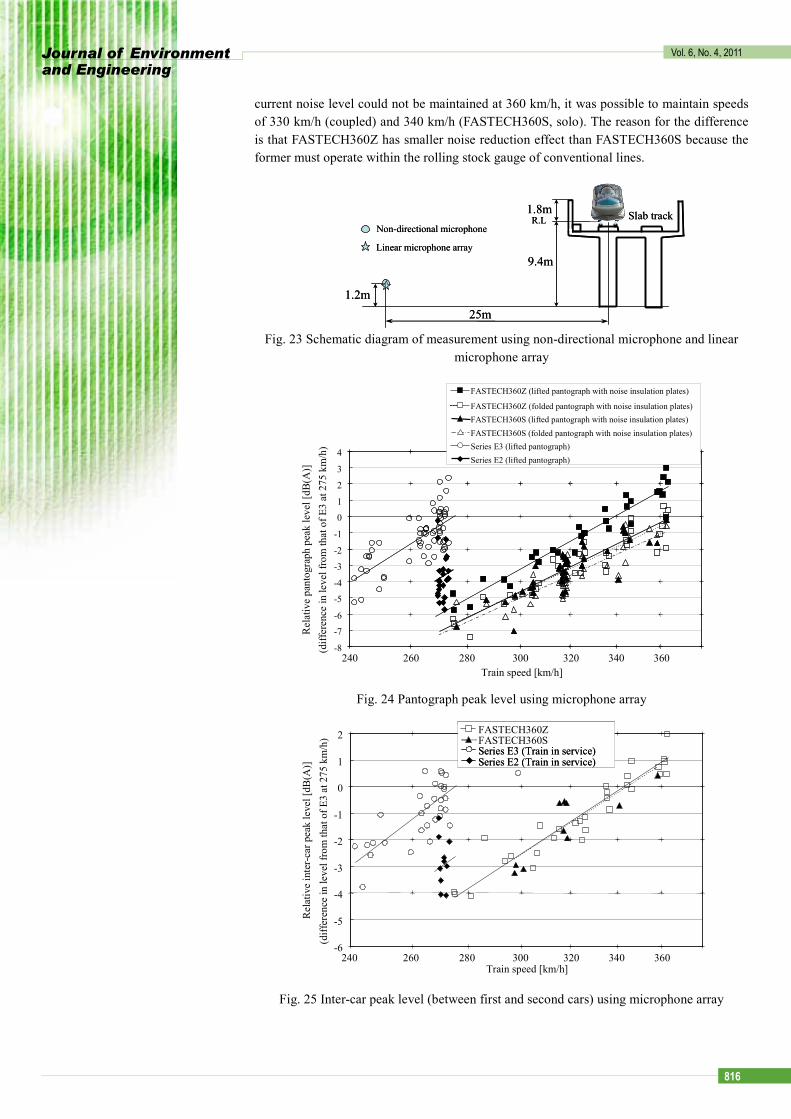
after making the improvements explained in § 4. Figure 23 shows the noise measurement overview. Figures 24 and 25 show respectively the pantograph peak levels and inter-car peak levels that were measured using the liner microphone array (RION MY-10A, time weighting: 35 ms). Figure 26 shows the measurement results with a non-directional microphone (time weighting: SLOW).
The lines in the figures represent linear regression between the logarithms of the train speeds and the A-weighted sound pressure levels. Note that in Figs. 24 and 25, in order to calculate the average value of series E2 running at around 270 km/h, for the sake of convenience each average line of series E2 was drawn using the slope of each linear regression line of series E3. This is because it is difficult to determine the speed-dependent degree of the data of series E2 due to concentration of data at around 270 km/h caused by the train schedule to which series E2 (not coupled with series E3) is assigned. And there is a large amount of variation in the data of trains in service (series E2 and E3) compared to the test trains (FASTECH360S and FASTECH360Z). The reason for this is that although the number of FASTECH360S and FASTECH360Z trainsets is only one each, by contrast, the number of both series E2 and E3 trains reaches several dozen each. Thus, individual differences among the trainsets in operation may be one cause of the large variation in the data.
Figure 24 shows that the pantograph peak levels of FASTECH360S and FASTECH360Z with new low-noise pantographs and 30-degree noise insulation plates are reduced from 2 dB to 3 dB compared to that of series E2, and 5.5 dB to 6.5 dB compared to that of series E3, respectively. It was also confirmed that, with 30-degree noise insulation plates, the peak level at the folded pantograph could be further reduced compared to that of the lifted pantograph.
Figure 25 shows that the inter-car peak levels of FASTECH360S and FASTECH360Z are lower by approximately 1.5 dB compared to that of series E2 and by approximately 4 dB compared to that of series E3. That is the effect of noise reduction with circumferential smooth diaphragms and sound-absorbing panels at the lower part of the car body. Since Shinkansen trains in the JR East operational area run on slab track, sound absorption around the lower part of the car body is more effective.
Figure 26, which shows the noise measurement results at 25 meters from the center of the track, shows that the improvements of rolling stock explained in § 4 have reduced noise in the coupled operation of FASTECH360Z and FASTECH360S by approximately 4.5 dB compared to that of the present coupled operation of series E3 and E2 at 275 km/h. Red lines in Fig. 26 are shown to find speeds at which FASTECH360 trains can run at the same noise level as the present coupled operation (series E3 and E2 at 275 km/h). While the
Journal of Environment and Engineering
Vol. 6, No. 4, 2011
816
current noise level could not be maintained at 360 km/h, it was possible to maintain speeds of 330 km/h (coupled) and 340 km/h (FASTECH360S, solo). The reason for the difference is that FASTECH360Z has smaller noise reduction effect than FASTECH360S because the former must operate within the rolling stock gauge of conventional lines.
1.2m25m
R.L
9.4m
1.8mNon-directional microphone
Linear microphone array
Slab track
1.2m25m
R.L
9.4m
1.8mNon-directional microphone
Linear microphone array
Slab track
Fig. 23 Schematic diagram of measurement using non-directional microphone and linear
microphone array
-8
-7
-6
-5
-4
-3
-2
-1
0
1
2
3
4
Train speed [km/h]
Rel
ativ
e pa
ntog
raph
pea
k le
vel [
dB(A
)](d
iffer
ence
in le
vel f
rom
that
of E
3at
275
km
/h)
FASTECH360Z (lifted pantograph with noise insulation plates)
FASTECH360Z (folded pantograph with noise insulation plates)FASTECH360S (lifted pantograph with noise insulation plates)FASTECH360S (folded pantograph with noise insulation plates)Series E3 (lifted pantograph)Series E2 (lifted pantograph)
240 260 280 300 320 340 360-8
-7
-6
-5
-4
-3
-2
-1
0
1
2
3
4
Train speed [km/h]
Rel
ativ
e pa
ntog
raph
pea
k le
vel [
dB(A
)](d
iffer
ence
in le
vel f
rom
that
of E
3at
275
km
/h)
FASTECH360Z (lifted pantograph with noise insulation plates)
FASTECH360Z (folded pantograph with noise insulation plates)FASTECH360S (lifted pantograph with noise insulation plates)FASTECH360S (folded pantograph with noise insulation plates)Series E3 (lifted pantograph)Series E2 (lifted pantograph)
240 260 280 300 320 340 360
Fig. 24 Pantograph peak level using microphone array
-6
-5
-4
-3
-2
-1
0
1
2
Train speed [km/h]
FASTECH360ZFASTECH360S
Rel
ativ
e in
ter-
car p
eak
leve
l [dB
(A)]
(diff
eren
ce in
leve
l fro
m th
at o
f E3
at 2
75 k
m/h
)
Series E2 (Train in service)
240 260 280 300 320 340 360
Series E3 (Train in service)
-6
-5
-4
-3
-2
-1
0
1
2
Train speed [km/h]
FASTECH360ZFASTECH360S
Rel
ativ
e in
ter-
car p
eak
leve
l [dB
(A)]
(diff
eren
ce in
leve
l fro
m th
at o
f E3
at 2
75 k
m/h
)
Series E2 (Train in service)Series E2 (Train in service)
240 260 280 300 320 340 360
Series E3 (Train in service)Series E3 (Train in service)
Fig. 25 Inter-car peak level (between first and second cars) using microphone array

Journal of Environment and Engineering
Vol. 6, No. 4, 2011
817
-6
-5
-4
-3
-2
-1
0
1
2
3
4
2 Train speed [km/h]
FASTECH360Z+FASTECH360SFASTECH360SSeries E3+Series E2 (Train in service)Series E2 (Train in service)
Rel
ativ
e A
-wei
ghte
d so
und
pres
sure
leve
l [dB
(A)]
(diff
eren
ce in
leve
l fro
m th
at o
f E3+
E2 a
t 275
km
/h)
240 260 280 300 320 340 360-6
-5
-4
-3
-2
-1
0
1
2
3
4
2 Train speed [km/h]
FASTECH360Z+FASTECH360SFASTECH360SSeries E3+Series E2 (Train in service)Series E2 (Train in service)
Rel
ativ
e A
-wei
ghte
d so
und
pres
sure
leve
l [dB
(A)]
(diff
eren
ce in
leve
l fro
m th
at o
f E3+
E2 a
t 275
km
/h)
240 260 280 300 320 340 360
Fig. 26 A-weighted sound pressure level using non-directional microphone
5.2 Amount of contribution of each noise component to overall noise The contribution of each component to overall noise in FASTECH360S cars running at
360 km/h was estimated in the same way as described in § 2. Figures 27 (a) and (b) show the calculated results in the case of series E2-1000 running at 360 km/h and in the case of FASTECH360S at 360 km/h, respectively. As shown in Figs. 27 (a) and (b), it was estimated that pantograph noise contribution was reduced by roughly 7 dB compared to that of E2-1000 at 360 km/h and the contribution of noise from the lower part of cars to the overall noise level was reduced by roughly 1 dB as well. Levels of the other components to the overall noise are also considered to be reduced as a result of the countermeasures mentioned in § 3.3.
Overall noiseAerodynamic noise from train noseNoise from lower part of carsAerodynamic noise from upper part of carsPantograph noiseConcrete-bridge noise
(a) E2-1000, 360 km/h (b) FASTECH360S, 360 km/h
6.5 dB
Time [s]3210-1
0
-5
-10
5
Time [s]3210-1
Rela
tive
A-w
eigh
ted
soun
d pr
essu
re le
vel
(slo
w) [
dB](d
iffer
ence
in le
vel f
rom
ov
eral
l lev
el o
f E2-
1000
at 2
75 k
m/h
)
0
-5
-10
5
Rela
tive
A-w
eigh
ted
soun
d pr
essu
re le
vel
(slo
w) [
dB](d
iffer
ence
in le
vel f
rom
ov
eral
l lev
el o
f E2-
1000
at 2
75 k
m/h
)
Overall noiseAerodynamic noise from train noseNoise from lower part of carsAerodynamic noise from upper part of carsPantograph noiseConcrete-bridge noise
Overall noiseAerodynamic noise from train noseNoise from lower part of carsAerodynamic noise from upper part of carsPantograph noiseConcrete-bridge noise
(a) E2-1000, 360 km/h (b) FASTECH360S, 360 km/h
6.5 dB
Time [s]3210-1
0
-5
-10
5
Time [s]3210-1
Rela
tive
A-w
eigh
ted
soun
d pr
essu
re le
vel
(slo
w) [
dB](d
iffer
ence
in le
vel f
rom
ov
eral
l lev
el o
f E2-
1000
at 2
75 k
m/h
)
0
-5
-10
5
Rela
tive
A-w
eigh
ted
soun
d pr
essu
re le
vel
(slo
w) [
dB](d
iffer
ence
in le
vel f
rom
ov
eral
l lev
el o
f E2-
1000
at 2
75 k
m/h
)
Fig. 27 Calculated time histories of individual noise components of series E2-1000 at 275
km/h and FASTECH360S at 360 km/h (with noise barrier)
6. Concluding remarks
The contribution of each noise component to overall noise levels was clarified through measurements and analysis of E2-1000 running at 275 km/h and then at 360 km/h. Based on the results of this analysis, two experimental trains, FASTECH360S and FASTECH360Z, were developed with a number of countermeasures for pantograph noise and noise from
Journal of Environment and Engineering
Vol. 6, No. 4, 2011
818
lower part of cars, and running tests were conducted using these trains. As a result, it was verified that the combination of certain measures described in this paper was rather successful in mitigating Shinkansen wayside noise.
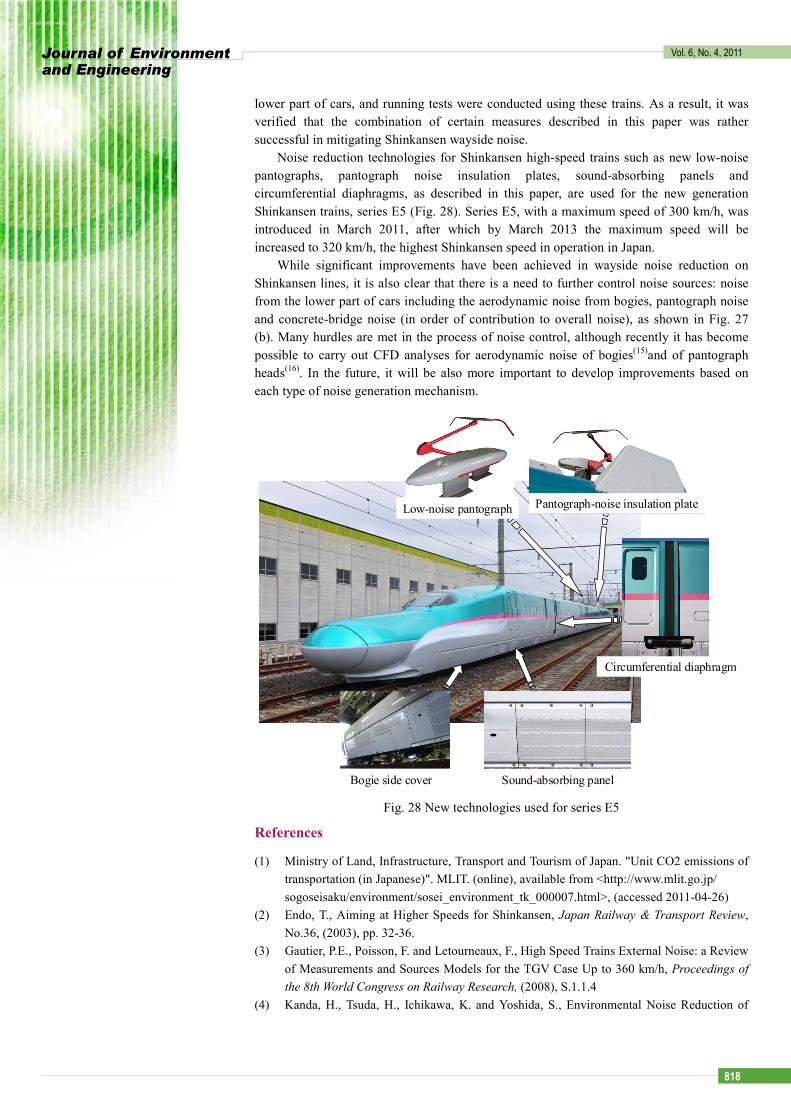
Noise reduction technologies for Shinkansen high-speed trains such as new low-noise pantographs, pantograph noise insulation plates, sound-absorbing panels and circumferential diaphragms, as described in this paper, are used for the new generation Shinkansen trains, series E5 (Fig. 28). Series E5, with a maximum speed of 300 km/h, was introduced in March 2011, after which by March 2013 the maximum speed will be increased to 320 km/h, the highest Shinkansen speed in operation in Japan.
While significant improvements have been achieved in wayside noise reduction on Shinkansen lines, it is also clear that there is a need to further control noise sources: noise from the lower part of cars including the aerodynamic noise from bogies, pantograph noise and concrete-bridge noise (in order of contribution to overall noise), as shown in Fig. 27 (b). Many hurdles are met in the process of noise control, although recently it has become possible to carry out CFD analyses for aerodynamic noise of bogies(15)and of pantograph heads(16). In the future, it will be also more important to develop improvements based on each type of noise generation mechanism.
Low-noise pantograph Pantograph-noise insulation plate
Circumferential diaphragm
Sound-absorbing panelBogie side cover
Low-noise pantograph Pantograph-noise insulation plate
Circumferential diaphragm
Sound-absorbing panelBogie side cover Fig. 28 New technologies used for series E5
References
(1) Ministry of Land, Infrastructure, Transport and Tourism of Japan. "Unit CO2 emissions of transportation (in Japanese)". MLIT. (online), available from <http://www.mlit.go.jp/ sogoseisaku/environment/sosei_environment_tk_000007.html>, (accessed 2011-04-26)
(2) Endo, T., Aiming at Higher Speeds for Shinkansen, Japan Railway & Transport Review, No.36, (2003), pp. 32-36.
(3) Gautier, P.E., Poisson, F. and Letourneaux, F., High Speed Trains External Noise: a Review of Measurements and Sources Models for the TGV Case Up to 360 km/h, Proceedings of the 8th World Congress on Railway Research, (2008), S.1.1.4
(4) Kanda, H., Tsuda, H., Ichikawa, K. and Yoshida, S., Environmental Noise Reduction of
Journal of Environment and Engineering
Vol. 6, No. 4, 2011
819
Tokaido Shinkansen and Future Prospect, Noise and Vibration Mitigation for Rail Transportation Systems: Proceedings of the 9th International Workshop on Railway Noise, Notes on Numerical Fluid Mechanics and Multidisciplinary Design, Vol. 99, (2008), pp. 1-8, springer.
(5) Kitagawa, T. and Nagakura, K., Aerodynamic Noise Generated by Shinkansen Cars, Journal of Sound and Vibration, Vol.231, No.3, (2000), pp. 913-924.
(6) Ido, A., Kurita, T., Wakabayashi, Y., Hara, M., Shiraishi, H. and Horiuchi, M., Development of Technologies for Minimizing Environmental Impacts, Proceedings of the 7th World Congress on Railway Research, (2006), T6.6.1.3.
(7) Wakabayashi, Y., Kurita, T., Yamada, H. and Horiuchi, M., Noise Measurement Results of Shinkansen High-Speed Test Train (FASTECH360S, Z), Noise and Vibration Mitigation for Rail Transportation Systems: Proceedings of the 9th International Workshop on Railway Noise, Notes on Numerical Fluid Mechanics and Multidisciplinary Design, Vol. 99, (2008), pp. 63-70, springer.
(8) Kurita, T., Wakabayashi, Y., Yamada, H. and Horiuchi, M., Reduction of Wayside Noise from Shinkansen High-Speed Trains, Journal of Mechanical Systems for Transportation and Logistics, Vol.4, No.1, (2011), pp. 1-12.
(9) Ministry of the Environment of Japan, Environmental Quality Standards for Shinkansen Superexpress Railway Noise (in Japanese), (1975)
(10) Ministry of the Environment of Japan, Measurement and Evaluation Manual for Shinkansen Superexpress Railway Noise (in Japanese), (2010)
(11) Nagakura, K., The Methods of Analyzing Shinkansen Noise, Quarterly Report of Railway Technical Research Institute, Vol.37, No.4, (1996), pp. 210-215.
(12) Kurita, T., Hara, M., Yamada, H., Wakabayashi, Y., Mizushima, F., Satoh, H. and Shikama, T., Reduction of Pantograph Noise of High-Speed Trains, Journal of Mechanical Systems for Transportation and Logistics, Vol.3, No.1, (2010), pp. 63-74.
(13) Takano, Y., Sasaki, K., Satoh, T., Murata, K., Mae, H. and Gotoh, J., Development of Visualization System for High Speed Noise Sources with a Microphone Array and a Visual Sensor, Proceedings of the 32nd International Congress and Exposition on Noise Control Engineering, (2003), pp. 2683-2690.
(14) Sato, T., Murata, K. and Sasaki, K., Countermeasures of Wayside Noise Reduction on Series E2-1000 Field Test (in Japanese), Proceedings of the 11th Jointed Railway Technology Symposium 2004 (in Japanese), (2004), pp. 331-332.
(15) Masson, E., Paradot, N. and Allain, E., The Numerical Prediction of the Aerodynamic Noise of the TGV POS High-Speed Train Power Car, Proceedings of the 10th International Workshop on Railway Noise, (2010), pp. 457-464.
(16) Ikeda, M. and Mitsumoji, T., Numerical Estimation of Aerodynamic Interference between Panhead and Articulated Frame, Quarterly Report of RTRI, Vol. 50, No. 4, (2009), pp. 227-232.