journal of financial economics -...
TRANSCRIPT
Contents lists available at SciVerse ScienceDirect
Journal of Financial Economics
Journal of Financial Economics 107 (2013) 655–670
0304-40
http://d
$ We
David H
and sem
Nationa
Souther
Univers
Any errn Corr
fax: þ1
E-m
davidr@
tstuart@
journal homepage: www.elsevier.com/locate/jfec
Strategic alliances, venture capital, and exit decisions in earlystage high-tech firms$
Umit Ozmel a, David T. Robinson b,n, Toby E. Stuart c
a Purdue University, Krannert School of Management, United Statesb Duke University and National Bureau of Economic Research, United Statesc Haas School of Business, University of California, Berkeley, United States
a r t i c l e i n f o
Article history:
Received 11 December 2009
Received in revised form
3 January 2012
Accepted 10 January 2012Available online 27 September 2012
JEL classification:
G32
G34
Keywords:
Strategic alliance
Venture capital
Initial public offering
5X/$ - see front matter & 2012 Published by
x.doi.org/10.1016/j.jfineco.2012.09.009
are grateful to Jim Brander, Laura Field,
su, Mark Leary, Michelle Lowry, Sean Nicho
inar participants at ISCTE—Lisbon Unive
l Bureau of Economic Research, Pennsylvan
n Methodist University, the University of Br
ity of Rochester, and Queen’s University for
ors are our own.
esponding author. Tel.: þ1 919 660 8023;
919 660 8025.
ail addresses: [email protected] (U. Oz
duke.edu (D.T. Robinson),
haas.berkeley.edu (T.E. Stuart).
a b s t r a c t
We study the trade-offs that biotech start-ups face in the private equity market when
they choose between raising firm-level capital from venture capitalists or project-level
capital from strategic alliance partners. Increased alliance activity makes future
alliances more likely, but future VC activity less likely. In contrast, venture capital
(VC) activity makes both future alliance and future VC activity more likely. Both types of
private capital raise the hazard of going public. Acquisition as an alternative to initial
public offering is made more likely by increased VC activity, but the link between
acquisition probabilities and alliance activity is less clear-cut. These results highlight
both the importance of alliance partners in resolving asymmetric information problems
in the capital acquisition process and the potential conflict of interest between different
sources of private equity.
& 2012 Published by Elsevier B.V.
1. Introduction
Early-stage fund-raising decisions are critical to thegrowth and survival of nascent companies. This is espe-cially true in high-technology sectors. Start-up companiesin these sectors not only require large capital injectionsbut also face a number of strategically distinct alternativesources of capital in private capital markets. In particular,
Elsevier B.V.
Thomas Hellmann,
lson, Bill Schwert,
rsity Institute, the
ia State University,
itish Columbia, the
helpful comments.
mel),
while venture capital (VC) is very active throughout thesector, many high-tech companies at the same time relyheavily on inter-firm commercialization agreements (stra-tegic alliances) for funding. Both types of funding areespecially important sources of private capital for biotech-nology firms (Lerner and Merges, 1998, and Stuart, Hoang,and Hybels, 1999).
In this paper, we explore how these alternative fund-ing sources in the private capital market interact with oneanother. We first ask how venture capital and strategicalliance funding complement or substitute for oneanother in the private capital market. Then we ask howthese funding sources affect exit outcomes. Becauseacquisition activity is common in this sector, we askhow choices in the private capital market affect the goingpublic decision as well as how they affect the possibilitythat a start-up company is acquired.
A major hurdle to empirical work in this area isthe dearth of data on private firms. Here, we develop anovel panel containing 1,899 privately held biotechnology
U. Ozmel et al. / Journal of Financial Economics 107 (2013) 655–670656
start-up companies that both received venture fundingand participated in alliance activity, but to varyingdegrees. The data begin at a company’s birth, and recordthe funding histories of the firms in question, as well asprevailing market conditions, at the time the firm receivesits initial funding and at the time of the focal fundingevent. This allows us to estimate the effect that strategicalliance and venture funding activity have on the prob-ability that a firm goes public or is acquired at a particulartime as a function of the time since its last funding eventand other factors.
Our results demonstrate the interplay between thetwo types of private equity capital and their joint impacton exit decisions. First we explore the interaction ofventure and alliance funding in the private equity market.Here we observe an asymmetry. Obtaining more fundingthrough strategic alliances lowers the probability that astart-up company receives another round of venturefinancing but raises the probability that it engages insubsequent alliance activity. In contrast, more ventureactivity increases both the hazard of future ventureactivity and the future of additional alliance activity.
More generally, these findings reflect two competingforces at work. The typical alliance contract in this settingaffords project-level decision rights and monitoring pro-visions to the alliance partner (Robinson and Stuart,2007a). This creates potential for conflicts of interest withventure capitalists (VCs), whose company-level invest-ments create exit motives that could be at odds with theintentions of the alliance partner, and whose company-level control and cash flow rights could be at odds withthe (typically project-level) decision rights of the alliancepartner. The opposing force is the complementary rolethat VCs and alliance partners play in resolving theasymmetric problems that firms face when they go public.Our results indicate that strategic alliance partners play acritical role in resolving asymmetric information, in spiteof the fact that alliance contracts often include terms thatdiminish the attractiveness of a potential investment toVC funders.
Next we explore the role that alliances and venturecapital play on the decision to go public or be acquired. Itis well established that firms with more venture fundingare at greater risk of going public. What is surprising,however, is the fact that strategic alliance activity also hasa high, if not greater, impact on the hazard of going public.
Increased VC activity unambiguously raises the hazardof being acquired. Alliances also play an important role inshaping acquisition outcomes. An increase in the numberof a start-up company’s previous alliances raises thehazard of being acquired. One explanation for this effectis that being linked tightly to an alliance partner can raisethe hazard of being acquired because that companybecomes a potential acquirer through the allianceprocess. Another explanation is that an active alliancehistory indicates that the focal start-up company is morelikely to have intellectual capital that is valued byacquirers.
Any attempt to establish a causal link between privatecapital market behavior and the later-stage exit decisionsmust deal with a variety of endogeneity concerns. First, a
link between past behavior and exit outcomes couldreflect unobserved heterogeneity in a start-up’s charac-teristics that drives preferential selection into the privatecapital market. To partially control for this, we allow forunobserved company-level heterogeneity by includingfrailty parameters in the hazard rate estimation. (This isdiscussed in detail in Section 3.) Frailty parameters guardagainst the possibility that time-invariant differencesacross start-ups drive their attractive as private equityrecipients or candidates for exit events.
It is important to acknowledge, however, that frailtyparameters in hazard models, which are effectively firm-level random effects, cannot absorb time-varying firm-level heterogeneity. We take additional steps to controlfor time-varying differences across firms by collectingdata that allow us to measure whether the start-upcompany has products in clinical trial stages with theFood and Drug Administration (FDA) at the time of thefunding event. We also control for the start-up’s previouspatenting activity. These time-varying measures allow usto partially control for the factors such as the quality ofthe company’s scientists or the state of its researchportfolio, which would be known to funders but difficultfor the econometrician to observe. Nevertheless, in theabsence of an instrumental variables specification or anatural experiment, we must caution against attachingcausal interpretations to our findings given the possibleunobserved heterogeneity that could remain.
Our paper is related to a number of works that explorethe determinants of the going public decision. Pagano,Panetta, and Zingales (1998) examine this question in asample of private Italian firms. They find that larger, moreprofitable companies go public. In recent work, Chemmanur,He, and Nandy (2010) find a similar relation betweenprofitability, performance, and going public in US Census ofManufactures data, and they also show that IPOs are morelikely among market leaders in more concentrated, and lessopaque, industries. Our work compliments these findings byfocusing on performance in private capital markets, insteadof product market performance, as drivers of the goingpublic decision. In that regard, our paper builds on Lerner(1994), which also examines the going public decisionamong biotech start-ups, but focuses on the role of theventure capitalist in timing access to the public capitalmarket. The venture capitalist’s role as facilitator could stemfrom professionalizing the start-up firm (Hellmann and Puri,2002), from providing access to financial capital (Gompersand Lerner, 1999) and other portfolio companies withcomplementary assets (Lindsey, 2008), or from certifyingthe quality of the start-up (Carter and Manaster, 1990; Hsu,2004; Megginson and Weiss, 1991). Recent work by Hsu(2006) uses a small sample of private technology start-upsreceiving funding from the Small Business InnovationResearch program and shows that the start-ups receivingfunding from VC firms are more prone to engage incommercialization strategies. These studies show that VCsadd value to start-ups in various ways as well as certifyingthe quality of start-ups and, consequently, increase thequality and future prospects of the start-ups. Because suchstart-ups are more likely to do an IPO, VC funding shouldincrease the likelihood of an IPO.

U. Ozmel et al. / Journal of Financial Economics 107 (2013) 655–670 657
Our findings also relate to recent work linking priceeffects in public and private capital markets to thepresence of alliance partners. Nicholson, Danzon andMcCullough (2005) find that strategic alliances createlarger step-ups in funding in the private equity market,and that this more than compensates for the apparentdiscounts that companies receive in early alliance deals.Stuart, Hoang, and Hybels (1999) show how alliancepartners play a certification role for young biotech start-up companies, drawing on evidence from IPO markets.
Our analysis is also related to numerous studiesexploring the role of strategic alliance partners as sourcesof capital for nascent firms. Most notably, Lerner, Shane,and Tsai (1998) show how strategic alliances are reliedupon more often during cold IPO markets. This paper’ssubject is closely related. However, instead of using thesubstitution of public markets and alliance capital as anidentification strategy for measuring differences in con-trol rights across financing regimes, we measure thechange in the probability of various exit decisions as afunction of current and past alliance activity.
Our estimation strategy is related to recent work in thecapital structure and investment literature. Our empiricalstrategy is similar to that of Leary and Roberts (2005),who use duration analysis to study firms’ capital structurerebalancing decisions. Whited (2006) uses a similar esti-mation strategy to measure the role of external financingconstraints on the timing of investment decisions.
The remainder of the paper is organized as follows.First, we discuss the relevant theory and offer a series ofempirical predictions to guide our analysis. This is con-tained in Section 2. In Section 3 we describe our data anddiscuss key features of our estimation strategy. Section 4contains our results exploring how funding opportunitiesin the private capital market evolve, and Sections 5 and 6explore exit outcomes. Section 7 considers robustnessissues, while 8 concludes.
2. Predictions
In this section we draw on past work to develop aseries of predictions about the role of venture capital andstrategic alliance funding on the probability of goingpublic. We start with predictions surrounding VC funding,because these are fairly unambiguous. Then we proceedto competing hypotheses surrounding the role of strategicalliance funding.
2.1. Venture capital
The predictions for venture capital and going publicare straightforward. We predict that increasing the VCfunding that a private biotechnology firm receives shouldincrease the probability that it goes public.
This prediction builds directly on the expressedmotives of venture capital investors. A VC investor pro-vides capital to a start-up with a view to a later exitopportunity, either in the form of an IPO or a sale toanother firm (Gompers and Lerner, 1999). Therefore, anygiven VC investor who has already invested in a biotech-nology company is likely to press for an attractive exit.
Moreover, the selection process that precedes the venturecapitalist’s investment decision favors biotechnologycompanies that have a higher estimated probability of asuccessful exit. Finally, the role that VCs play in theprofessionalization of start-up companies implies thatgreater VC contact is likely to predict a higher likelihoodof an exit (Hellmann and Puri, 2000, 2002).
We also predict that biotech start-up companies thatattract funding from VCs with central positions in the VCsyndicate network are more likely to undergo an IPO or asale to another company. Central, hence more connected,VCs have better access to extensive information channelsand typically will have earned reputations as successfulinvestors (Sorensen and Stuart, 2000; Podolny, 2001,Hochberg, Ljungqvist, and Yu, 2007). As a result, receivingfunding from central VCs is a form of certification of astart-up company’s quality (Stuart, Hoang, and Hybels,1999). In addition, because they are better able to accessprivate information in a timely manner, central VCs maybe more adept at pooling information collected by othermarket participants before committing to invest in anearly stage venture (Hochberg, Ljungqvist, and Yu, 2007).
It is important to acknowledge, however, that associa-tions between VC funding and exit outcomes are likely toarise from omitted variables. If some company attribute,such as scientific quality, attracts VC interest and allianceactivity, as well as elevates the likelihood of a successfulexit, then VC and alliances may signal underlying firmquality to an econometrician who does not observe it.This is one reason that it is so critical to our empiricalstrategy that we employ a statistical technique thatcontrols for unobserved, time-invariant, firm-level het-erogeneity, as well as include variables that allow us tomeasure time-varying firm quality.
The literature is clear on the expected associationbetween VC and exit events, but research is mixed onhow VC funding affects the likelihood that the start-upsubsequently contracts with alliance partners. At a prac-tical level, much of the financing raised in venture roundsis invested in the development of scientific programs thatgenerate intellectual property, which potentially forms thebasis for future alliance contracts. In addition, the value-adding functions of the VC described in Hellmann and Puri(2000, 2002) and others are likely to elevate the attrac-tiveness of portfolio companies as prospective alliancepartners. Likewise, Lindsey (2008) shows that VCs facilitatealliance activities among portfolio companies. In addition,Hochberg, Ljunqvist, and Lu (2007) find that better net-worked VCs have more successful portfolio companies inpart because their more extensive business connectionscan be brought to the aid of portfolio companies.
However, the incentives of VCs and alliance partnersmay depart in a few primary ways, both of which stemfrom the fact that alliance contract terms are project leveland VC investments are at the firm level. First, the twolevels of ownership may create incentives for managers toshift resources across projects, within firms. Specifically,managers at young companies often have the incentive toshift resource from alliance-based projects to otherswithin the firm, because profits from any products thatare developed under an alliance contract are shared with
U. Ozmel et al. / Journal of Financial Economics 107 (2013) 655–670658
the partner. Second, the contractual cash flow rightsthat are granted to alliance partners often place a de factocap on the upside of the equity value of the portfoliocompany. This occurs because an alliance contract oftengrants half or more of the revenues or profits of a start-ups development project to the alliance partner. In addi-tion, portfolio companies that have successfully raisedmany rounds of VC may have little need for additionalcapital from alliance partners. For these reasons, VCactivity may deter subsequent alliance formation.
2.2. Strategic alliances as substitutes to venture capital
The potential for strategic alliances to act as a sub-stitute for VC stems from several factors. As Robinson andStuart (2007a) note, VCs fund companies, not projects. Incontrast, strategic alliance partners generally sponsorresearch activity on a subset of projects that the biotech-nology company is operating.
The fact that venture capital and strategic alliancecapital have different implications for project-level man-agement inside the company is borne out by the featuresof the respective financial contracts. Strategic alliancecontracts typically stipulate project-level oversight thatis conducted by a team composed of members from boththe biotechnology company and the alliance partner.These contracts also frequently require that certainresources (typically man-hours of research personnel ornamed researchers at the biotechnology company) bedevoted to the project in question. Contracts typicallystate that the failure to perform along these dimensionsconstitutes breach and triggers termination. While thealliance partner has broad project-level oversight andmonitoring rights, it seldom has company-level oversightprovisions, such as board seats.1
In contrast, Kaplan and Stromberg (2003) show that VCcontracts typically allocate a majority of board seats tothe VC firm. Even when the venture capitalist does notgain a majority of board seats, it receives at least someboard representation, almost without exception. VCinvestors often lack the technical expertise to participatein the day-to-day management of biotechnology researchprojects.
The organizational differences contemplated andinstalled through these contracts create the potential forconflict of interest between these funding sources. Whenscarce resources must be allocated across projects, thealliance partner could press the biotechnology companyto divert resources away from other internal projects,toward projects that fall under the scope of the alliancecontract. Conversely, the biotech firm often faces theincentive to shift resources away from projects that areunder contract to partners because the firm retains thefull cash flows rights from solo projects. Any suchresource diversions that are overall value-destroying,even if they strictly benefit one project, should in princi-ple be frowned upon by the venture capitalist, becausethey stand to undermine the value of the venture
1 This description is taken from Robinson and Stuart (2007a).
capitalist’s exit opportunity. Thus, one reason that strate-gic alliances could substitute for venture capital is thatthe potential incentive conflicts between these sources offunding could drive away potential VC investors who fearpartial holdup at the hands of the strategic alliancepartner.
There are other reasons that alliance partners mightsubstitute for venture capital. Alliance partners maycrowd out venture capital by lowering a biotechnologystart-up company’s funding requirements and, hence,increasing its bargaining position. In addition, the provi-sions in alliance contracts that place limitations on achange in control may deter investment because VCscould anticipate the foreclosure of future exit optionsbecause of the presence of the alliance investor. Lastly, thecash flow right accorded to alliance partners may dimin-ish the upside of the start-up company’s equity value,which will decrease the likelihood of investment.
These arguments all suggest that increased strategicalliance activity could diminish the incentives for VCinvestors to participate and could also lower the start-up’s probability of going public.
2.3. Strategic alliances as complements to venture capital
The preceding arguments overlook the screening rolethat strategic alliance partners play in the biotechnologyindustry. By collaborating with a start-up in this sector, analliance partner sends a quality signal to outside obser-vers (Stuart, Hoang, and Hybels, 1999). This certificationrole can be substantial, especially given the high degree ofuncertainty surrounding the promise of novel technolo-gical approaches in the industry. Future investors, under-writers, and the public markets are more likely to lookmore favorably upon a start-up that has received certifi-cation from experienced industry insiders. As a result,certification mitigates uncertainty and other market par-ticipants’ cost of assessing the actual quality of a start-up(Stuart, Hoang, and Hybels, 1999), which increases a start-up’s chances of future funding events and successful exit.
Finally, just as VCs add value to start-ups, alliancepartners may improve their quality in several ways. Mostimportant, start-ups with more alliances may be in aposition to access some of the complementary assets oftheir partners, which can range from access to compoundlibraries and screening technologies, to the partner’sexpertise in managing the FDA clinical trials process, toaccess to the partner’s sales and marketing resources(Mitchell and Singh, 1996; Pisano, 1994; Shan, Walker,and Kogut, 1994; Singh and Mitchell, 2005; and Stuart,2000). Through access to these types of resources, allianceactivity can enhance the quality of the start-up, whichmay improve the start-up’s prospects for future VC fund-ing and its chances of a successful exit.
3. Data description and estimation strategy
In this section we describe our data sources, estima-tion strategy, variables, and summary statistics.
U. Ozmel et al. / Journal of Financial Economics 107 (2013) 655–670 659
3.1. Data sources and outcomes of interest
To test these predictions, we analyze a large sample ofventure capital–backed private biotechnology companies.We begin with all available records for VC-backed com-panies in the biotechnology sector from Thomson Finan-cial’s VentureXpert database. These data consist of 1,899companies that were founded before 2004. This is not arandom sample. All companies in the data received one ormore rounds of funding from VC investors. We thenaugment these data with data from Recombinant Capital’sStrategic Alliance database, SDC’s Mergers and Acquisi-tions database, and IMS Health’s R&D Focus database.
Our sampling strategy – conditioning on the presenceof VC funding – is designed in part to minimize the scopefor heterogeneity in firm quality to drive the estimates.Because we are effectively sampling only firms that are ofsufficient quality to attract at least one round of venturefunding, we purge our sample from extreme variation inquality by removing the lowest quality firms. This meansthat we do not have observations from firms that pursuethe strategy of forming alliances and forgoing all venturecapital funding. However, this most likely means that ourpoint estimates understate the degree of substitutabilitybetween the two types of funding. Many of the alliancetransactions listed on the Recombinant Capital websiteare culled from Securities and Exchange Commission(SEC) filings, and the firms in question often take aconservative approach to the relevant materiality thresh-olds (Lerner and Merges, 1998; Lerner, Shane, and Tsai,1998). Thus, conditioning on VC activity helps weed outfirms that would appear on Recombinant Capital but existonly to license existing technologies, etc., making ourstudy comparable to prior work in this area.
The firms in our data potentially experience four out-comes of interest. They receive a round of VC funding, theyform a strategic alliance, they are acquired by another firm,or they go public. We use the VentureXpert data toassemble the VC funding histories of these firms, includingthe date of founding of the company, the dates of all privateequity financing rounds, and the identities of the investorsin each round. We use the Deloitte Recap LLC (previouslyRecombinant Capital or ReCap) rDNA database to track thealliance activity of the companies in the data. ReCap scoursthe newswire, company websites, securities filings, andindustry news sources to identify information on strategicalliances in the biopharmaceutical arena. The alliance data,which now list more than 20,000 transactions, date back tothe early years of the biotech industry. In addition to themonth and year in which each transaction was established,the database contains basic information about the terms ofthe agreement.
For IPOs, we begin with VentureExpert data, whichgives us good coverage of biotech IPOs. As the bottomportion of Table 1 indicates, a total of 353 IPOs are in oursample. Most of these cluster among firms that were bornbefore the mid-1990s, and most of the IPOs themselvesoccurred in the mid 1990s.
To track acquisition outcomes, we augment Venture-Expert with data from the SDC’s Mergers and Acquisitionsdatabase to make up for the former’s sparse coverage of
M&A. We manually match the names of all VC-backedbiotech companies (as reported by VentureXpert) withthe universe of all targets in SDC’s Mergers and Acquisi-tions database, not just those flagged as biotech compa-nies. Through this process, we identified 230 acquisitionsof privately held biotech companies. For the most part,firms that are acquired are older at the time of acquisitionthan are firms from the same birth cohort that go public.For example, in 1987 there were 59 firm births in ourdata. Of these, 23 result in IPOs, with an average year ofIPO of 1992 (i.e., at age five years) while the 12 firms thatwere acquired had a mean age at acquisition of ten years.
In addition to these exit events, our data contain 5,203strategic alliance transactions and 7,148 venture capitalfinancing rounds.
3.2. Estimation strategy
Our objective empirically is to connect these outcomesof interest to variables that measure the firm’s quality andevolving sequence of prior outcomes. At the heart of thisexercise is the company’s hazard of one of the four eventsoccurring as a function of analysis time. That is, we areinterested in the probability of a funding event occurringduring a small interval of time t to tþDt as a function oftime and other firm and market characteristics. Becausewe are interested in modeling the probability of a fundingevent at a particular time as a function of the time sincethe last funding event, we must specify analysis time in amanner that both satisfies the underlying econometricassumptions of proportional hazard models and yieldscoefficients that have sensible economic interpretations.The identifying assumption is that, controlling for theright-hand side variables, two firms observed at the samepoint in analysis time have the same hazard of experien-cing an event. Therefore, calendar time would not be anappropriate choice for analysis time, even if we accountfor the staggered entry of companies into our sample,because this parametric choice would require all privatecompanies in the data in month t to be at identical risk ofan IPO or other funding event. Instead, we use the start-up company’s age (in months) as the unit of analysis time.
Formally, the hazard function for firm i at time t can beexpressed as
hiðtÞ ¼f iðtÞ
1�FiðtÞ, ð1Þ
where f(t) is the density function associated with theevent at time t and F(t) is the cumulative distributionfunction associated with the event at time t. Writing thesurvivor function, 1�FðtÞ, as S(t), this can be expressed as
hiðtÞ ¼ �d lnðSiðtÞÞ: ð2Þ
Following Leary and Roberts (2005), we write the hazardof firm i at time t as
hiðt9oiÞ ¼oihð0Þex0b, ð3Þ
where hð0Þ is the baseline hazard, x is a vector of covariates,and b is a coefficient vector. To estimate the hazardfunction, we follow techniques described in Leary andRoberts (2005) and create dummy variables corresponding

Table 1Time-series of firm births.
This table lists the number of firm births per year, along with the outcomes associated with them. The first column is the year of the cohort’s birth. The
second column lists the number of firms born in that year. The third column lists the number of firms from that cohort that eventually go public; the
fourth column, those that eventually are acquired. The fifth and sixth columns report the mean year in which the firm went public or was acquired. (For
the two firms that were acquired from the 1986 cohort, one was acquired in 1993 and one in 2004.) Then, in the remaining columns, we list the number
of strategic alliances, venture funding rounds, patents, and fraction of life spent with drugs in Food and Drug Administration (FDA) trials. Our data end in
2004, so these are reported as average total amounts per birth cohort through 2004. Columns 7 and 8 list total number of alliances and venture rounds,
respectively, through 2004. Columns 9 and 10 list the fraction of time in FDA trials (the number of months for which the FDA clinical trial dummy is one
divided by the total number of months) and the number of patents for firms in each birth cohort that later go public. The final two columns list the same
information for members of the birth cohort that did not go public on or before 2004.
Average total (through 2004) Number of
Birth Firm That exit via Mean year of Strategic VC If later IPO If never IPO
year births IPO Acquired IPO Acquired alliances rounds FDA Patents FDA Patents
o1980 62 29 6 1988 1988 147 228 0.1 4 0 3.5
1980 21 13 5 1987 1987 56 96 0.2 3.7 0 0.4
1981 42 28 4 1987 1989 120 188 0.2 8.1 0.1 4.1
1982 24 9 7 1988 1988 38 89 0.1 6.6 0 1.6
1983 33 14 6 1990 1992 83 158 0.1 5 0 2.3
1984 23 9 5 1987 1996 62 91 0 5.7 0 1.9
1985 38 11 5 1993 1990 99 204 0.3 4.8 0.1 1.9
1986 45 21 2 1992 – 132 173 0.1 4.7 0 2.1
1987 59 23 12 1992 1997 180 254 0.2 3.4 0.1 3.8
1988 49 23 6 1994 1996 152 236 0.3 3.1 0.1 2.2
1989 47 13 10 1995 1997 105 203 0.2 3.9 0 2.0
1990 47 10 12 1996 1995 131 210 0.4 8.5 0.1 1.3
1991 35 16 6 1996 1998 125 145 0.2 6.6 0.2 1.5
1992 81 27 15 1998 1999 321 377 0.5 5.6 0.2 4.1
1993 74 23 18 1998 1999 246 313 0.4 5 0.2 2.9
1994 79 19 16 1998 2000 277 355 0.4 3.4 0.1 2.7
1995 75 18 13 1999 2001 279 317 0.5 3.8 0.1 1.7
1996 102 15 26 2001 2001 314 389 0.4 1.5 0.2 1.0
1997 175 9 25 2000 2002 524 641 0.5 1.6 0.2 1.6
1998 179 6 9 2000 2002 484 616 0.5 5.8 0.2 1.0
1999 127 6 8 2003 2002 312 399 0.6 1.2 0.1 0.9
2000 251 6 10 2001 2003 556 769 0.3 0.3 0.2 0.3
2001 139 4 4 2004 2004 291 422 0.3 0 0.2 0.3
2002 59 1 0 – – 119 190 1 0 0.1 0.1
2003 25 0 0 – – 50 61 0 0 0.1 0.0
2004 12 0 0 – – 0 24 0 0 0.3 0.0
Total 1,903 353 230 5,203 7,148 0.3 4.5 0.2 1.4
U. Ozmel et al. / Journal of Financial Economics 107 (2013) 655–670660
to the deciles of firm age. Within each age decile, anexponential hazard function is estimated. This is akin to aspline specification of the baseline hazard rate, in which therate is assumed to be constant within each piece, but isallowed to vary freely between them.
The oi parameter in Eq. (3) is known as a frailtyparameter. It captures time-invariant, unmeasured, firm-level heterogeneity. As in Whited (2006) and Leary andRoberts (2005), we assume this parameter follows a gammadistribution. Because it is essentially a firm-level randomeffect, it only can absorb variation across firms, not variationwithin firms over time. This is why it is so critical to ouranalysis that we include information such as the stock ofpatents at a particular time, or whether a firm has drugs inclinical trials at a specific time, because this allows us tohold constant within-firm variation over time that wouldotherwise pollute our inferences of the link between early-stage and later-stage funding decisions.
All spells in the data that do not conclude in one of theevents we analyze are treated as being censored. This datastructure allows us to update independent variables on amonthly basis to reflect changes in companies’ financing,
alliance, or innovation histories, as well as the currentstate of the equity markets in the biotechnology sectorand overall market conditions.
3.3. Independent variables
Broadly, our independent variables fall into four cate-gories: venture capitalist characteristics, alliance his-tories, market characteristics, and company attributessuch as their stage in the FDA clinical trials process.
3.3.1. VC characteristics
For each firm i in month t, we include the number ofdistinct financing rounds the firm has experienced priorto month t. We call this measure ‘‘accumulated fundingrounds.’’
We measure the access to information channels andreputation of the venture capitalist using its centrality inthe VC syndication network. Following prior studies (e.g.,Hochberg, Ljungqvist, and Yu, 2007; Robinson and Stuart,2007a,b; Sorensen and Stuart, 2000; Podolny, 2001), we

U. Ozmel et al. / Journal of Financial Economics 107 (2013) 655–670 661
use the formula developed in Bonacich (1987), which is
Ci,t ¼XNt
j ¼ 1
ðatþdtCj,tÞRi,j,t , ð4Þ
where Cj,t is the centrality of the VC firm j at year t, andRi,j,t is the relation matrix that shows the number of co-investments between VC firms i and j for the time periodbetween t�5 and t. The variable Nt is the total number ofVC firms that were active at any time between t and t�5.dt is the weighting coefficient set equal to 0.75 of thereciprocal of the largest eigenvalue of R (Podolny, 1993,2001). We set a so that the maximum centrality for eachyear is equal to one.
One complication with specifying the influence of VCfirm centrality on the outcomes experienced by individualportfolio companies arises because venture-backed com-panies are commonly financed by syndicates of investors.As a result, the typical start-up company in our data isfinanced by multiple VC firms. We account for this in afew ways. First, we compute a proportional measure: Foreach start-up company-round, we compute the fraction oftotal VC firm-rounds in which a particular VC firm hasparticipated as of time t. This provides a set of weightsreflecting each venture capitalist’s participation in fund-ing a particular start-up company as of time t, and theseweights sum to one across VCs. We then use theseweights to augment overall VC centrality. We call thisvariable ‘‘VC centrality, weighted.’’ As a second measureof VC centrality, we simply measure the centrality of mostcentral venture capitalist among the VCs invested in thestart-up as of time t. Finally, we calculated the mean VCcentrality by taking the mean of the centralities of the VCsthat have invested in a start-up as of time t.
2 More information can be found at www.ovid.com/site/catalog/
DataBase/1244.jsp.
3.3.2. Alliance characteristics
We measure three attributes of biotech start-up com-panies’ strategic alliance histories. We include a time-varying count of the number of alliances the company hasentered during the past five years. We choose a five-yearsliding window because this has been the convention inthe alliance literature to account for the fact that mostalliance contracts will terminate within that period oftime. Ceteris paribus, because companies in the biotech-nology industry often require compelling technology toattract alliance partners, companies with greater numbersof recent alliances are more likely to be operating alongin-demand technological trajectories (Powell, Koput, andSmith-Doerr, 1996; Stuart, 1998, Stuart, 2000; Singh andMitchell, 2005).
In some cases the deals in our sample involve the saleof partial equity stakes to the alliance partner. Therefore,we also control for the amount of equity stakes sold to thestart-up’s previous partners. Likewise, many of the dealsin the data include provisions for substantial, nonequityinvestments by the alliance partner, typically in the formof research and development funding for the biotech. Wealso control for the cumulative research and developmentfunding and pledged milestone payments from a start-up’s past alliances because this conveys additional
information about the intensity of a start-up’s allianceactivity and perhaps, its level of funding need.
3.3.3. Time-varying measures of firm quality
To mitigate the aforementioned concern about time-varying, company-level, unobserved heterogeneity, weincorporate two time-varying measures of firm quality.First, we include the evolving stock of patents based (e.g.,Hagedoorn and Schakenraad, 1994; Shan, Walker, andKogut, 1994; and Stuart, 2000). Following prior studies,we record the date of the patent application, and accu-mulate the total number of patent applications during thepast five years (e.g., Sorensen and Stuart, 2000).
Second, we incorporate a measure of whether a firmhas compounds in FDA clinical trials. Our data source forinformation on drug projects in development comes fromIMS Health’s R&D Focus database. An observation in thisdatabase is a drug in development at a particular time.2
To use this information, we hand-match our data to theIMS data using FKA (formerly known as) company namesas often as possible, and we create a dummy variable forwhether a start-up company is listed in the IMS dataset ata particular time. For example, if Biotech ABC was born in1990, had a drug in clinical trials from 1992 to 1995, andagain from 1998 to 2001, then the dummy would be set tozero for 1990–1992, one for the 1992–1995 range, zerofor 1995–1998, one for 1998–2001, and zero thereafter.The idea behind coding the variable this way is that itprovides the most parsimonious way of capturing the factthat the firm’s expected future value could be varyingover time according to whether or not there is a viabledrug candidate in its pipeline.
These variables are summarized in Table 1. The fourright-most columns present average total patents as wellas the average fraction of a firm’s life (while private) thatis spent with a compound in clinical trials. To provide asense of how the trajectories of IPO and non-IPO firmsdiverge, we split each birth cohort according to whether itlater goes public or not. Firms that later go public spendon average about 30% of their time with a compound inclinical trials, while firms that never go public do so onlyabout 20% of the time. Firms that later go public generate4.5 patents, roughly three times the number of those thatdo not go public.
3.3.4. Market conditions
We also include biotech IPO market conditions. Forthis purpose, we measure the ‘‘intensity of IPO activity’’ inthe biotech industry. This variable is based on the fact, asGompers, Kovner, Lerner, and Scharfstein (2008) show,that IPO activity spurs VC activity. We keep a count of thenumber of IPOs that have occurred over the last threemonths, scaled by the number of venture-backed biotechcompanies at risk of an IPO during the same period. Thisratio is updated monthly. In addition to biotech IPOmarket conditions, we control for overall equity marketconditions using the Nasdaq composite monthly index

Table 2Summary statistics at 12, 24, and 36 months of age.
This table reports summary statistics for the firms in our sample at three points in their life: age 12 months, age 24 months, and age 36 months. The
column labeled ‘‘Overall’’ reports the grand mean across all firm-months in the data. (There are 1,903 firms and 156,433 firm-months.) For each age
category, ‘‘Private’’ denotes firms that never went public, and ‘‘Public’’ denotes firms that had an initial public offering (IPO) at some later point. The
column labeled ‘‘t(diff)’’ reports the t-statistic associated with the test that the means across the two groups at that time are equal. VC¼venture capital.
Age¼12 months Age¼24 months Age¼36 months
Variable Overall Private Public t (diff) Private Public t (diff) Private Public t (diff)
Total rounds of VC funding 1.53 0.39 0.72 �5.69 0.71 1.42 �8.56 1.29 2.00 �7.10
Total patents, last five years 1.01 0.14 0.14 0.16 0.32 0.50 �1.99 0.56 1.30 �2.63
Total alliances, last five years 0.48 0.04 0.31 �7.47 0.13 0.83 �8.18 0.26 1.47 �8.04
ln(Alliance Funding), last five years 0.19 0.00 0.16 �4.65 0.02 0.33 �6.12 0.05 0.59 �7.04
ln(Alliance Equity), last five years 0.07 0.00 0.05 �2.85 0.01 0.14 �4.54 0.02 0.36 �7.01
Time since last VC round 27.81 9.85 8.50 4.99 17.49 12.21 9.38 14.09 14.99 �1.05
Time since last alliance 36.47 10.86 9.85 5.74 21.83 18.84 6.20 30.60 25.79 5.37
VC centrality, weighted 0.03 0.02 0.07 �7.28 0.02 0.09 �9.37 0.03 0.09 �7.98
Maximum VC centrality 0.04 0.01 0.09 �6.62 0.02 0.13 �8.12 0.03 0.15 �8.43
U. Ozmel et al. / Journal of Financial Economics 107 (2013) 655–670662
return. In unreported robustness analyses, we use alter-native index return measures, in which we replace Nas-daq return with Standard & Poor’s 500 value-weightedand equal-weighted monthly index returns both with andwithout dividends.
3.4. Summary statistics
Table 2 reports summary statistics for the independentvariables based on whether the start-up company inquestion remained private throughout the sample or elsewent public at some point in its life. We report summarystatistics for firms at one, two, and three years of age.
The table clearly illustrates that start-ups that ulti-mately go public evolve along very different financingtrajectories than start-ups that ultimately remain private.At 12 months of age, start-ups that go public havereceived about twice as many VC funding rounds andare roughly eight times more likely to have had a strategicalliance, relative to those that remain private throughoutthe duration of our dataset. These start-ups have receivedboth more overall alliance funding and more allianceequity than firms that do not go public in our sample.The VC firms that fund companies that go public aremore central members of the VC network. The onlydimension along which we see no difference is in thestock of patents filed. However, by the time start-ups are24 months old, their patent histories also have begunto diverge in the same way that other variables hadalready departed at age 12 months. This difference ismarginally statistically significant at 24 months of ageand is highly statistically significant by the time firmsreach 36 months old.
4. The evolution of funding in the private market
We begin by estimating the hazard of a subsequentprivate equity funding event as a function of past fundinghistory and other firm characteristics. We investigate howpast funding and start-up company’s characteristicsimpact the hazard of receiving an additional round ofventure funding. Then we turn to the hazard of entering
into a strategic alliance. Because we have a particularinterest in the interplay between project-level (formingalliance) and company-level (receiving VC funding) finan-cing, we analyze the likelihood of occurrence of these twotypes of financing events via separate estimation ofdistinct hazard rates. That is, we estimate models of thetime to the next VC round, then we estimate models oftime to the next alliance. By estimating separate models,we allow both the baseline hazards and the parameterestimates on company and market-level covariates tovary. We discuss robustness issues associated with thisapproach in Section 7.
4.1. Time to the next VC round
Table 3 presents estimates of the hazard of a VCfunding round as a function of start-up company’s char-acteristics. A general result from the table is that a start-up with more prior rounds of VC funding is at anincreased hazard of receiving a future round of funding.Furthermore, start-ups with more central VCs fundingthem have higher hazard of getting one more VC fundinground.
The effect of an additional alliance on a start-up’shazard of VC funding is less clear-cut. In Column 1, wherewe control only the FDA clinical trial dummy, alliancecount has a positive impact on the hazard of subsequentfunding. Once we control for the accumulated number offunding rounds, however, this effect reverses, revealingthe fact that increased alliance activity reduces the hazardof future VC activity (Columns 3–9). Alliance count con-tinues to have negative and significant point estimateswhen we use alternative measures of VC centrality(Columns 10–11), and is robust to alternative measuresof market index returns (results available upon request).Furthermore, the magnitudes of the point estimates aresimilar across different models. However, neither the sizeof start-up’s alliances during the past five years nor theamount of equity sold to alliance partners seem to havean impact on the hazard of a new funding round. Thesefindings are in line with the possible conflict of interestsbetween VC investors and alliance partners.

Table 3Piecewise exponential hazard estimates of venture capital (VC) activity.
This table reports piecewise exponential hazard estimates of VC activity. A unit of observation is a particular firm in a given month. The dependent
variable is the time since the last VC funding event that the firm experienced. ‘‘Total VC rounds’’ is the number of rounds of VC funding the firm has
received prior to each date. ‘‘Total alliances, last five years’’ is the total number of strategic alliance partnerships that the firm has entered into over the
last five years. (A rolling sum over the last five years is used because alliances are usually not open-ended.) ‘‘Total patents, last five years’’ measures the
number of patent applications filed by the firm over the last five years prior to each date. The variable labeled ‘‘ln(Alliance Size), last five years’’ measures
the natural log of the amount of nonequity funding that the firm has received through strategic alliance partnerships over the last five years. ‘‘IPO
intensity’’. takes on the same value for each firm at a given time and is the ratio of the number of initial public offerings that have occurred over the last
three months prior to each date to the number of private biotech companies. ‘‘VC centrality’’ is a measure of the reputational quality of members of all the
venture capitalists that have invested in the firm up to that date. ‘‘VC centrality (weighted)’’ averages the Bonacich centrality for each VC firm in the most
recent round in which it participated, weighting by the recency of the round. ‘‘VC centrality (mean)’’ is the simple average across all venture capitalists
that have participated. ‘‘VC centrality (maximum)’’ is the maximum centrality of any venture capitalist that has invested. The hazard rate analysis is
performed using a piecewise exponential specification for the baseline hazard function. In addition, firm-level frailty effects are measured. The variable
lnðyÞ measures the significance of the firm-level frailty. Standard errors appear in parentheses below point estimates, which are expressed as hazard
impact factors.
(1) (2) (3) (4) (5) (6) (7) (8) (9) (10) (11)
Total VC rounds 1.342nn 1.349nn 1.350nn 1.351nn 1.351nn 1.351nn 1.337nn 1.337nn 1.327nn 1.315nn
(0.008) (0.008) (0.009) (0.009) (0.009) (0.009) (0.009) (0.009) (0.009) (0.009)
Total alliances, last five years 1.043nn 0.973nn 0.973nn 0.979n 0.983 0.984 0.979n 0.979n 0.978n 0.970nn
(0.009) (0.008) (0.008) (0.009) (0.010) (0.010) (0.010) (0.010) (0.010) (0.010)
FDA clinical trial dummy 1.188nn
1.346nn 1.224nn 1.224nn 1.224nn 1.226nn 1.234nn 1.232nn 1.232nn 1.236nn 1.234nn
(0.041) (0.058) (0.043) (0.044) (0.044) (0.044) (0.044) (0.044) (0.044) (0.044) (0.044)
Total patents, last five years 0.998 0.999 0.999 0.999 0.997 0.997 0.996 0.994
(0.004) (0.004) (0.004) (0.004) (0.004) (0.004) (0.004) (0.004)
ln(Alliance Equity), last five years 0.930 0.958 0.955 0.968 0.968 0.959 0.954
(0.041) (0.048) (0.048) (0.048) (0.048) (0.048) (0.047)
ln(Alliance Size), last five years 0.968 0.967 0.959 0.959 0.959 0.968
(0.025) (0.025) (0.025) (0.025) (0.025) (0.025)
IPO intensity 1.018nn 1.009 1.008 1.008 1.011n
(0.005) (0.005) (0.005) (0.005) (0.005)
VC centrality (weighted) 8.189nn 8.208nn
(1.066) (1.069)
Nasdaq return 0.906 0.906 0.947
(0.164) (0.164) (0.170)
VC centrality (mean) 4.366nn
(0.385)
VC centrality (maximum) 1.914nn
(0.084)
lnðyÞ 0.018nn 0.263nn 0.020nn 0.021nn 0.021nn 0.021nn 0.021nn 0.019nn 0.019nn 0.018nn 0.016nn
(0.006) (0.020) (0.006) (0.006) (0.006) (0.006) (0.006) (0.007) (0.007) (0.007) (0.007)
Number of observations 159,131 159,131 159,131 151,837 151,837 151,837 151,837 148,344 148,344 148,344 148,344
Number of firms 1,899 1,899 1,899 1,899 1,899 1,899 1,899 1,860 1,860 1,860 1,860
w2 2343 127.5 2355 2318 2321 2323 2336 2508 2508 2527 2497
w2 frailty 11.14 405.6 13.73 13.93 13.85 14.15 14.22 10.21 10.21 9.091 7.718
n, nn, and nnn denote statistical significance at the 10, 5 and 1 percent level, respectively.
3 In untabulated robustness tests, we also replace the Nasdaq
market return with other indexes. The loadings on alternative index
specifications are very similar to the reported coefficients, both quanti-
tatively and qualitatively. Results are available upon request.
U. Ozmel et al. / Journal of Financial Economics 107 (2013) 655–670 663
Table 3 also sheds light on the role of VC character-istics and market conditions on VC funding. Start-ups thathave successfully completed more VC funding roundshave higher hazard of receiving further VC funding. Asthe start-up receives a new funding round, its hazard ofnew VC funding round increases by more than 30%.Similarly, start-ups that have had prior investments frommore central VCs have a higher hazard of subsequent VCfunding. A 1 standard deviation increase in VC centralityincreases the hazard of new funding round by 18%. This isconsistent with the view that central VCs either add morevalue through their connections or provide strongersignals of start-up quality, which attracts subsequentinvestment.
The dummy for having drugs in FDA clinical trials has apositive and highly significant impact on the hazard of asubsequent funding round. This presumably reflects bothsupply and demand effects that push the firm toward
more capital. Companies whose products have reachedthe clinical trial stage would be expected to have morepromising future prospects, making these start-up com-panies more attractive investments for VC (the supplychannel). At the same time, taking drugs through theclinical trials process is an expensive endeavor, and firmswith drugs in clinical trials probably also have greaterdemand for venture capital than other firms.
In Columns 8–11, we have done robustness analysesusing alternative measures of VC centrality along with theNasdaq index return.3 The impact of the accumulatedfunding rounds, VC centrality, and alliance activity issimilar across these models.
U. Ozmel et al. / Journal of Financial Economics 107 (2013) 655–670664
The lnðyÞ parameter tests the significance of the oi
parameter in Eq. (3), which captures time-invariant firm-level heterogeneity. The significance of this parameterindicates that the company-level heterogeneity is impor-tant in our analysis, as we can reject the null of no firm-level heterogeneity.
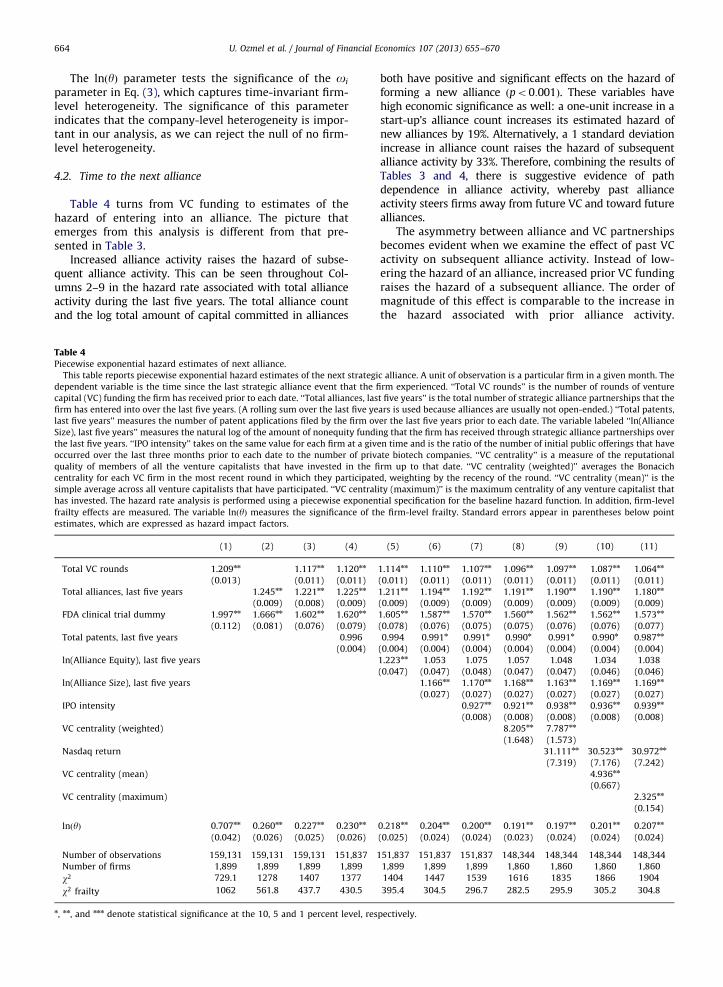
4.2. Time to the next alliance
Table 4 turns from VC funding to estimates of thehazard of entering into an alliance. The picture thatemerges from this analysis is different from that pre-sented in Table 3.
Increased alliance activity raises the hazard of subse-quent alliance activity. This can be seen throughout Col-umns 2–9 in the hazard rate associated with total allianceactivity during the last five years. The total alliance countand the log total amount of capital committed in alliances
Table 4Piecewise exponential hazard estimates of next alliance.
This table reports piecewise exponential hazard estimates of the next strategi
dependent variable is the time since the last strategic alliance event that the fi
capital (VC) funding the firm has received prior to each date. ‘‘Total alliances, las
firm has entered into over the last five years. (A rolling sum over the last five ye
last five years’’ measures the number of patent applications filed by the firm ov
Size), last five years’’ measures the natural log of the amount of nonequity fundi
the last five years. ‘‘IPO intensity’’ takes on the same value for each firm at a giv
occurred over the last three months prior to each date to the number of priv
quality of members of all the venture capitalists that have invested in the fi
centrality for each VC firm in the most recent round in which they participate
simple average across all venture capitalists that have participated. ‘‘VC central
has invested. The hazard rate analysis is performed using a piecewise exponen
frailty effects are measured. The variable lnðyÞ measures the significance of th
estimates, which are expressed as hazard impact factors.
(1) (2) (3) (4)
Total VC rounds 1.209nn 1.117nn 1.120nn
(0.013) (0.011) (0.011)
Total alliances, last five years 1.245nn 1.221nn 1.225nn
(0.009) (0.008) (0.009)
FDA clinical trial dummy 1.997nn 1.666nn 1.602nn 1.620nn
(0.112) (0.081) (0.076) (0.079)
Total patents, last five years 0.996
(0.004)
ln(Alliance Equity), last five years
ln(Alliance Size), last five years
IPO intensity
VC centrality (weighted)
Nasdaq return
VC centrality (mean)
VC centrality (maximum)
lnðyÞ 0.707nn 0.260nn 0.227nn 0.230nn
(0.042) (0.026) (0.025) (0.026)
Number of observations 159,131 159,131 159,131 151,837
Number of firms 1,899 1,899 1,899 1,899
w2 729.1 1278 1407 1377
w2 frailty 1062 561.8 437.7 430.5
n, nn, and nnn denote statistical significance at the 10, 5 and 1 percent level, res
both have positive and significant effects on the hazard offorming a new alliance ðpo0:001Þ. These variables havehigh economic significance as well: a one-unit increase in astart-up’s alliance count increases its estimated hazard ofnew alliances by 19%. Alternatively, a 1 standard deviationincrease in alliance count raises the hazard of subsequentalliance activity by 33%. Therefore, combining the results ofTables 3 and 4, there is suggestive evidence of pathdependence in alliance activity, whereby past allianceactivity steers firms away from future VC and toward futurealliances.
The asymmetry between alliance and VC partnershipsbecomes evident when we examine the effect of past VCactivity on subsequent alliance activity. Instead of low-ering the hazard of an alliance, increased prior VC fundingraises the hazard of a subsequent alliance. The order ofmagnitude of this effect is comparable to the increase inthe hazard associated with prior alliance activity.
c alliance. A unit of observation is a particular firm in a given month. The
rm experienced. ‘‘Total VC rounds’’ is the number of rounds of venture
t five years’’ is the total number of strategic alliance partnerships that the
ars is used because alliances are usually not open-ended.) ‘‘Total patents,
er the last five years prior to each date. The variable labeled ‘‘ln(Alliance
ng that the firm has received through strategic alliance partnerships over
en time and is the ratio of the number of initial public offerings that have
ate biotech companies. ‘‘VC centrality’’ is a measure of the reputational
rm up to that date. ‘‘VC centrality (weighted)’’ averages the Bonacich
d, weighting by the recency of the round. ‘‘VC centrality (mean)’’ is the
ity (maximum)’’ is the maximum centrality of any venture capitalist that
tial specification for the baseline hazard function. In addition, firm-level
e firm-level frailty. Standard errors appear in parentheses below point
(5) (6) (7) (8) (9) (10) (11)
1.114nn 1.110nn 1.107nn 1.096nn 1.097nn 1.087nn 1.064nn
(0.011) (0.011) (0.011) (0.011) (0.011) (0.011) (0.011)
1.211nn 1.194nn 1.192nn 1.191nn 1.190nn 1.190nn 1.180nn
(0.009) (0.009) (0.009) (0.009) (0.009) (0.009) (0.009)
1.605nn 1.587nn 1.570nn 1.560nn 1.562nn 1.562nn 1.573nn
(0.078) (0.076) (0.075) (0.075) (0.076) (0.076) (0.077)
0.994 0.991n 0.991n 0.990n 0.991n 0.990n 0.987nn
(0.004) (0.004) (0.004) (0.004) (0.004) (0.004) (0.004)
1.223nn 1.053 1.075 1.057 1.048 1.034 1.038
(0.047) (0.047) (0.048) (0.047) (0.047) (0.046) (0.046)
1.166nn 1.170nn 1.168nn 1.163nn 1.169nn 1.169nn
(0.027) (0.027) (0.027) (0.027) (0.027) (0.027)
0.927nn 0.921nn 0.938nn 0.936nn 0.939nn
(0.008) (0.008) (0.008) (0.008) (0.008)
8.205nn 7.787nn
(1.648) (1.573)
31.111nn 30.523nn 30.972nn
(7.319) (7.176) (7.242)
4.936nn
(0.667)
2.325nn
(0.154)
0.218nn 0.204nn 0.200nn 0.191nn 0.197nn 0.201nn 0.207nn
(0.025) (0.024) (0.024) (0.023) (0.024) (0.024) (0.024)
151,837 151,837 151,837 148,344 148,344 148,344 148,344
1,899 1,899 1,899 1,860 1,860 1,860 1,860
1404 1447 1539 1616 1835 1866 1904
395.4 304.5 296.7 282.5 295.9 305.2 304.8
pectively.
U. Ozmel et al. / Journal of Financial Economics 107 (2013) 655–670 665
In general, both of the VC measures – accumulatedfunding rounds and VC centrality – increases the hazardof alliances. A 1 standard deviation increase in centralityof the VC investors increases the hazard of next allianceby 17%, and the addition of a VC funding round elevatesthe hazard of a subsequent alliance by 10%.
This asymmetry is consistent with alternativecontracting arrangements creating a conflict of interestbetween VCs and alliance partners. When alliancepartners provide funding, they crowd out future VCfunding. But when VCs move first, they promote subse-quent alliance activity, presumably because their earlierpresence can preclude future alliance partners from con-tracting in ways that create conflicts of interest.
As with the hazard of new VC funding, the FDA clinicaltrial dummy continues to have a positive and highlysignificant impact in determining the hazard of formingnew alliances. This suggests that the companies whoseproducts have reached clinical trial stages are expected tohave more promising future prospects, making thesecompanies more attractive alliance partners and moreattractive investments for VC firms. In contrast, firms withmore patents are not necessarily more likely to form morealliances. In Models 4 and 5 there is an insignificantrelation, but in Models 6–11 there is a weakly significantnegative relation between a firm’s stock of patents and itspropensity to form alliances.
Market conditions also play an interesting role inalliance formation. When IPO intensity increases, thepropensity to engage in alliance activity declines, consis-tent with arguments in Lerner and Merges (1998). Thissuggests that as the market for private equities in thissector heat up, other forms of capital become moreattractive. In contrast, recent stock market performancehas a positive impact on the propensity to form alliances.4
In view of the large literature in finance that illustratesthe role that stock market conditions play on firm invest-ment, one interpretation of these findings is that the(usually larger, publicly traded) alliance partners use theadditional liquidity in their stock to increase their invest-ment activity, some of which includes strategic allianceswith other firms.
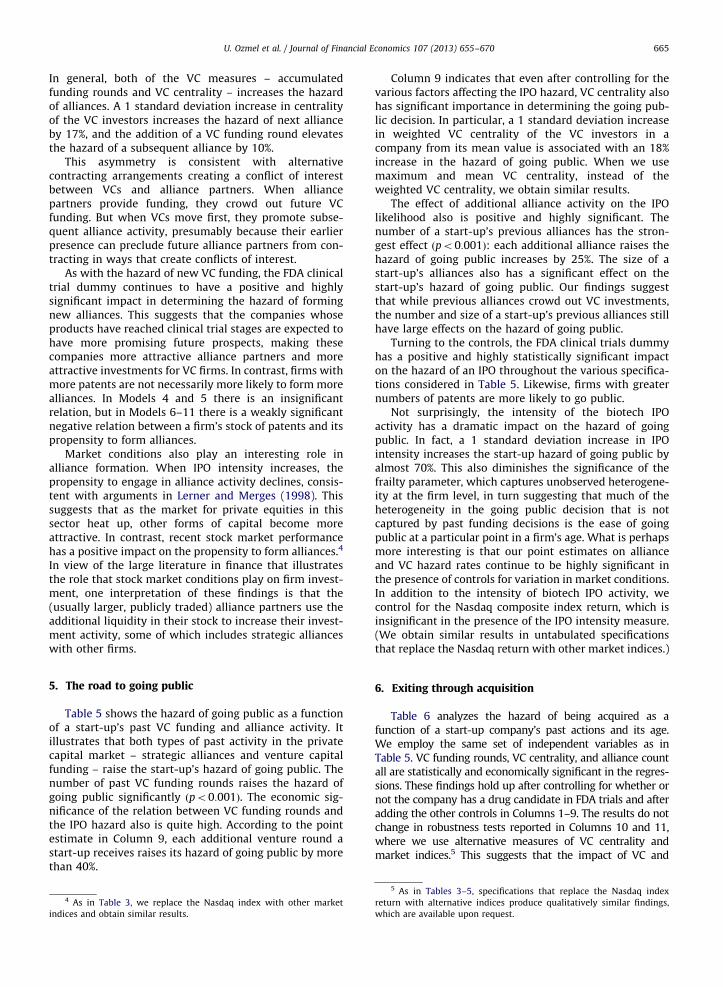
5. The road to going public
Table 5 shows the hazard of going public as a functionof a start-up’s past VC funding and alliance activity. Itillustrates that both types of past activity in the privatecapital market – strategic alliances and venture capitalfunding – raise the start-up’s hazard of going public. Thenumber of past VC funding rounds raises the hazard ofgoing public significantly ðpo0:001Þ. The economic sig-nificance of the relation between VC funding rounds andthe IPO hazard also is quite high. According to the pointestimate in Column 9, each additional venture round astart-up receives raises its hazard of going public by morethan 40%.
4 As in Table 3, we replace the Nasdaq index with other market
indices and obtain similar results.
Column 9 indicates that even after controlling for thevarious factors affecting the IPO hazard, VC centrality alsohas significant importance in determining the going pub-lic decision. In particular, a 1 standard deviation increasein weighted VC centrality of the VC investors in acompany from its mean value is associated with an 18%increase in the hazard of going public. When we usemaximum and mean VC centrality, instead of theweighted VC centrality, we obtain similar results.
The effect of additional alliance activity on the IPOlikelihood also is positive and highly significant. Thenumber of a start-up’s previous alliances has the stron-gest effect ðpo0:001Þ: each additional alliance raises thehazard of going public increases by 25%. The size of astart-up’s alliances also has a significant effect on thestart-up’s hazard of going public. Our findings suggestthat while previous alliances crowd out VC investments,the number and size of a start-up’s previous alliances stillhave large effects on the hazard of going public.
Turning to the controls, the FDA clinical trials dummyhas a positive and highly statistically significant impacton the hazard of an IPO throughout the various specifica-tions considered in Table 5. Likewise, firms with greaternumbers of patents are more likely to go public.
Not surprisingly, the intensity of the biotech IPOactivity has a dramatic impact on the hazard of goingpublic. In fact, a 1 standard deviation increase in IPOintensity increases the start-up hazard of going public byalmost 70%. This also diminishes the significance of thefrailty parameter, which captures unobserved heterogene-ity at the firm level, in turn suggesting that much of theheterogeneity in the going public decision that is notcaptured by past funding decisions is the ease of goingpublic at a particular point in a firm’s age. What is perhapsmore interesting is that our point estimates on allianceand VC hazard rates continue to be highly significant inthe presence of controls for variation in market conditions.In addition to the intensity of biotech IPO activity, wecontrol for the Nasdaq composite index return, which isinsignificant in the presence of the IPO intensity measure.(We obtain similar results in untabulated specificationsthat replace the Nasdaq return with other market indices.)
6. Exiting through acquisition
Table 6 analyzes the hazard of being acquired as afunction of a start-up company’s past actions and its age.We employ the same set of independent variables as inTable 5. VC funding rounds, VC centrality, and alliance countall are statistically and economically significant in the regres-sions. These findings hold up after controlling for whether ornot the company has a drug candidate in FDA trials and afteradding the other controls in Columns 1–9. The results do notchange in robustness tests reported in Columns 10 and 11,where we use alternative measures of VC centrality andmarket indices.5 This suggests that the impact of VC and
5 As in Tables 3–5, specifications that replace the Nasdaq index
return with alternative indices produce qualitatively similar findings,
which are available upon request.

Table 5Piecewise exponential hazard estimates of initial public offering (IPO) activity.
This table reports piecewise exponential hazard estimates of an IPO. A unit of observation is a particular firm in a given month. The dependent variable
takes on the value zero in all months prior to an IPO and takes on the value one in the month of the IPO and in all subsequent months. ‘‘Total VC rounds’’
is the number of rounds of venture capital (VC) funding the firm has received prior to each date. ‘‘Total alliances, last five years’’ is the total number of
strategic alliance partnerships that the firm has entered into over the last five years. (A rolling sum over the last five years is used because alliances are
usually not open-ended.) ‘‘Total patents, last five years’’ measures the number of patent applications filed by the firm over the last five years prior to each
date. The variable labeled ‘‘ln(Alliance Size), last five years’’ measures the natural log of the amount of nonequity funding that the firm has received
through strategic alliance partnerships over the last five years. ‘‘IPO intensity’’ takes on the same value for each firm at a given time and is the ratio of the
number of IPOs that have occurred over the last three months prior to each date to the number of private biotech companies. ‘‘VC centrality’’ is a measure
of the reputational quality of members of all the venture capitalists that have invested in the firm up to that date. ‘‘VC centrality (weighted)’’ averages the
Bonacich centrality for each VC firm in the most recent round in which they participated, weighting by the recency of the round. ‘‘VC centrality (mean)’’ is
the simple average across all venture capitalists that have participated. ‘‘VC centrality (maximum)’’ is the maximum centrality of any venture capitalist
that has invested. The hazard rate analysis is performed using a piecewise exponential specification for the baseline hazard function. In addition, firm-
level frailty effects are measured. The variable lnðyÞmeasures the significance of the firm-level frailty. Standard errors appear in parentheses below point
estimates, which are expressed as hazard impact factors.
(1) (2) (3) (4) (5) (6) (7) (8) (9) (10) (11)
Total VC rounds 1.847nn 1.610nn 1.573nn 1.523nn 1.510nn 1.438nn 1.411nn 1.415nn 1.408nn 1.402nn
(0.105) (0.072) (0.071) (0.068) (0.066) (0.053) (0.052) (0.052) (0.052) (0.053)
Total alliances, last five years 1.511nn 1.435nn 1.409nn 1.332nn 1.294nn 1.257nn 1.245nn 1.246nn 1.247nn 1.245nn
(0.055) (0.051) (0.051) (0.050) (0.049) (0.038) (0.036) (0.036) (0.036) (0.037)
FDA clinical trial dummy 2.600nn 1.755nn 1.585n 1.566n 1.552n 1.545n 1.778nn 1.799nn 1.800nn 1.821nn 1.831nn
(0.456) (0.280) (0.288) (0.293) (0.281) (0.276) (0.292) (0.292) (0.293) (0.298) (0.299)
Total patents, last five years 1.092nn 1.075nn 1.068nn 1.046nn 1.044nn 1.045nn 1.044nn 1.043nn
(0.024) (0.023) (0.023) (0.016) (0.015) (0.015) (0.015) (0.016)
ln(Alliance Equity), last five years 1.547nn 1.319 1.283 1.251 1.254 1.251 1.260
(0.214) (0.209) (0.180) (0.171) (0.172) (0.173) (0.175)
ln(Alliance Size), last five years 1.177 1.198n 1.192n 1.192n 1.197n 1.194n
(0.101) (0.090) (0.087) (0.088) (0.089) (0.089)
IPO intensity 1.209nn 1.206nn 1.204nn 1.205nn 1.206nn
(0.012) (0.012) (0.012) (0.012) (0.012)
VC centrality (weighted) 8.387nn 8.656nn
(5.370) (5.560)
Nasdaq return 0.308 0.312 0.324
(0.226) (0.228) (0.236)
VC centrality (mean) 3.990nn
(1.896)
VC centrality (maximum) 1.560n
(0.323)
lnðyÞ 3.751nn 2.098nn 3.164nn 3.472nn 2.983nn 2.808nn 1.666n 1.491 1.527 1.554n 1.567n
(0.717) (0.404) (0.544) (0.594) (0.576) (0.557) (0.353) (0.331) (0.337) (0.339) (0.341)
Number of observations 159,131 159,131 159,131 151,837 151,837 151,837 151,837 148,344 148,344 148,344 148,344
Number of firms 1,899 1,899 1,899 1,899 1,899 1,899 1,899 1,860 1,860 1,860 1,860
w2 437.7 408.9 603.9 604.8 614.2 617.8 869.8 872.4 875.0 872.7 869.6
w2 frailty 72.96 76.01 104.7 110.1 88.94 86.22 57.27 48.85 49.96 52.72 52.49
n, nn, and nnn denote statistical significance at the 10, 5 and 1 percent level, respectively.
U. Ozmel et al. / Journal of Financial Economics 107 (2013) 655–670666
alliance funding on the start-up’s exit outcomes cannot beattributed to observable firm-level differences. These empiri-cal associations indicate the value-adding and certificationbenefits of VC investors and alliance partners.
Column 9, which represents the full model, indicatesthat additional VC centrality and additional rounds of VCfunding raise the hazard of acquisition, just as they raisethe hazard of going public ðpo0:001Þ. The point estimatesindicate that the hazard rate for accumulated roundsremains at approximately 1.3 as additional variables areintroduced in Columns 2 through 11. A 1 standard devia-tion increase in the weighted centrality of the VCsinvesting in a start-up elevates the hazard of beingacquired by 28%. In Columns 10 and 11, we use meanand maximum VC centrality as alternative measures of VCcentrality with similar results.
Regarding the magnitudes associated with allianceactivity as reported in Table 6, each additional alliance
is estimated to raise the hazard of being acquired by 11%.One explanation for the significant impact of the alliancecount is that having more alliances increases the oddsthat one of the existing partners transitions to become anacquirer (Robinson and Stuart, 2007b). This occurs fre-quently because alliances provide windows into the start-up’s technology and the value of its future prospects,which mitigates information asymmetries between thestart-up and would-be acquirers that are also alliancepartners.
The size of the equity stakes that previous alliancepartners have acquired in a start-up is insignificant in thefull model. This may reflect two, offsetting effects. On onehand, if an alliance partner has acquired a large equityposition in a focal biotech, it may have done so with aneye to an eventual, outright purchase of the company. Onthe other hand, if one or more alliance partners possessesa large equity stake in a start-up and they choose not to
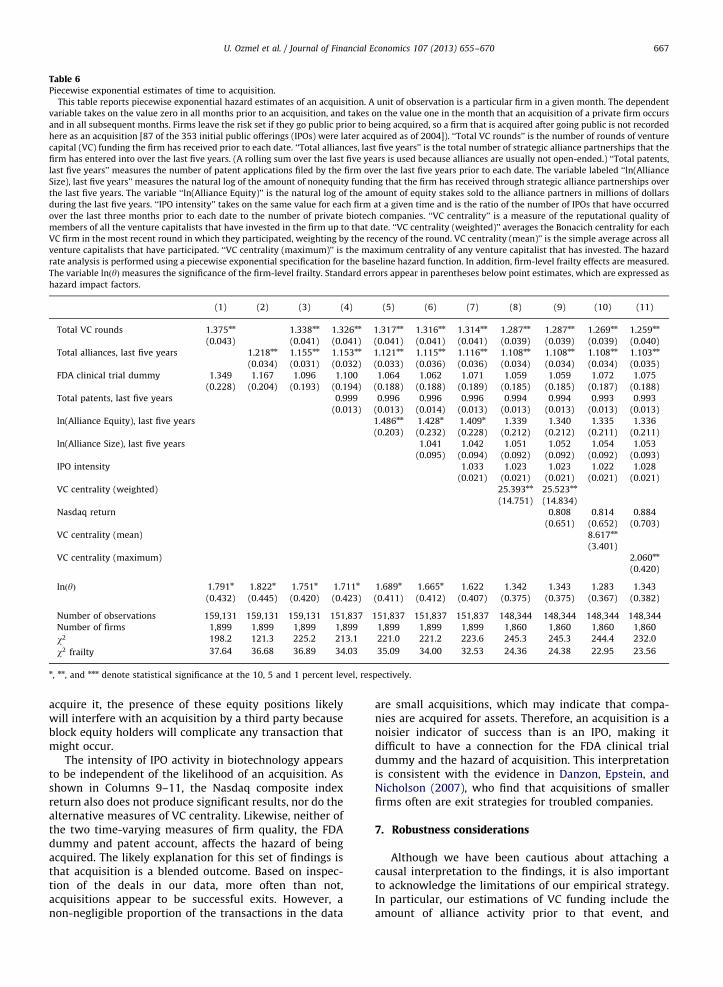
Table 6Piecewise exponential estimates of time to acquisition.
This table reports piecewise exponential hazard estimates of an acquisition. A unit of observation is a particular firm in a given month. The dependent
variable takes on the value zero in all months prior to an acquisition, and takes on the value one in the month that an acquisition of a private firm occurs
and in all subsequent months. Firms leave the risk set if they go public prior to being acquired, so a firm that is acquired after going public is not recorded
here as an acquisition [87 of the 353 initial public offerings (IPOs) were later acquired as of 2004]). ‘‘Total VC rounds’’ is the number of rounds of venture
capital (VC) funding the firm has received prior to each date. ‘‘Total alliances, last five years’’ is the total number of strategic alliance partnerships that the
firm has entered into over the last five years. (A rolling sum over the last five years is used because alliances are usually not open-ended.) ‘‘Total patents,
last five years’’ measures the number of patent applications filed by the firm over the last five years prior to each date. The variable labeled ‘‘ln(Alliance
Size), last five years’’ measures the natural log of the amount of nonequity funding that the firm has received through strategic alliance partnerships over
the last five years. The variable ‘‘ln(Alliance Equity)’’ is the natural log of the amount of equity stakes sold to the alliance partners in millions of dollars
during the last five years. ‘‘IPO intensity’’ takes on the same value for each firm at a given time and is the ratio of the number of IPOs that have occurred
over the last three months prior to each date to the number of private biotech companies. ‘‘VC centrality’’ is a measure of the reputational quality of
members of all the venture capitalists that have invested in the firm up to that date. ‘‘VC centrality (weighted)’’ averages the Bonacich centrality for each
VC firm in the most recent round in which they participated, weighting by the recency of the round. VC centrality (mean)’’ is the simple average across all
venture capitalists that have participated. ‘‘VC centrality (maximum)’’ is the maximum centrality of any venture capitalist that has invested. The hazard
rate analysis is performed using a piecewise exponential specification for the baseline hazard function. In addition, firm-level frailty effects are measured.
The variable lnðyÞmeasures the significance of the firm-level frailty. Standard errors appear in parentheses below point estimates, which are expressed as
hazard impact factors.
(1) (2) (3) (4) (5) (6) (7) (8) (9) (10) (11)
Total VC rounds 1.375nn 1.338nn 1.326nn 1.317nn 1.316nn 1.314nn 1.287nn 1.287nn 1.269nn 1.259nn
(0.043) (0.041) (0.041) (0.041) (0.041) (0.041) (0.039) (0.039) (0.039) (0.040)
Total alliances, last five years 1.218nn 1.155nn 1.153nn 1.121nn 1.115nn 1.116nn 1.108nn 1.108nn 1.108nn 1.103nn
(0.034) (0.031) (0.032) (0.033) (0.036) (0.036) (0.034) (0.034) (0.034) (0.035)
FDA clinical trial dummy 1.349 1.167 1.096 1.100 1.064 1.062 1.071 1.059 1.059 1.072 1.075
(0.228) (0.204) (0.193) (0.194) (0.188) (0.188) (0.189) (0.185) (0.185) (0.187) (0.188)
Total patents, last five years 0.999 0.996 0.996 0.996 0.994 0.994 0.993 0.993
(0.013) (0.013) (0.014) (0.013) (0.013) (0.013) (0.013) (0.013)
ln(Alliance Equity), last five years 1.486nn 1.428n 1.409n 1.339 1.340 1.335 1.336
(0.203) (0.232) (0.228) (0.212) (0.212) (0.211) (0.211)
ln(Alliance Size), last five years 1.041 1.042 1.051 1.052 1.054 1.053
(0.095) (0.094) (0.092) (0.092) (0.092) (0.093)
IPO intensity 1.033 1.023 1.023 1.022 1.028
(0.021) (0.021) (0.021) (0.021) (0.021)
VC centrality (weighted) 25.393nn 25.523nn
(14.751) (14.834)
Nasdaq return 0.808 0.814 0.884
(0.651) (0.652) (0.703)
VC centrality (mean) 8.617nn
(3.401)
VC centrality (maximum) 2.060nn
(0.420)
lnðyÞ 1.791n 1.822n 1.751n 1.711n 1.689n 1.665n 1.622 1.342 1.343 1.283 1.343
(0.432) (0.445) (0.420) (0.423) (0.411) (0.412) (0.407) (0.375) (0.375) (0.367) (0.382)
Number of observations 159,131 159,131 159,131 151,837 151,837 151,837 151,837 148,344 148,344 148,344 148,344
Number of firms 1,899 1,899 1,899 1,899 1,899 1,899 1,899 1,860 1,860 1,860 1,860
w2 198.2 121.3 225.2 213.1 221.0 221.2 223.6 245.3 245.3 244.4 232.0
w2 frailty 37.64 36.68 36.89 34.03 35.09 34.00 32.53 24.36 24.38 22.95 23.56
n, nn, and nnn denote statistical significance at the 10, 5 and 1 percent level, respectively.
U. Ozmel et al. / Journal of Financial Economics 107 (2013) 655–670 667
acquire it, the presence of these equity positions likelywill interfere with an acquisition by a third party becauseblock equity holders will complicate any transaction thatmight occur.
The intensity of IPO activity in biotechnology appearsto be independent of the likelihood of an acquisition. Asshown in Columns 9–11, the Nasdaq composite indexreturn also does not produce significant results, nor do thealternative measures of VC centrality. Likewise, neither ofthe two time-varying measures of firm quality, the FDAdummy and patent account, affects the hazard of beingacquired. The likely explanation for this set of findings isthat acquisition is a blended outcome. Based on inspec-tion of the deals in our data, more often than not,acquisitions appear to be successful exits. However, anon-negligible proportion of the transactions in the data
are small acquisitions, which may indicate that compa-nies are acquired for assets. Therefore, an acquisition is anoisier indicator of success than is an IPO, making itdifficult to have a connection for the FDA clinical trialdummy and the hazard of acquisition. This interpretationis consistent with the evidence in Danzon, Epstein, andNicholson (2007), who find that acquisitions of smallerfirms often are exit strategies for troubled companies.
7. Robustness considerations
Although we have been cautious about attaching acausal interpretation to the findings, it is also importantto acknowledge the limitations of our empirical strategy.In particular, our estimations of VC funding include theamount of alliance activity prior to that event, and

Table 7Interaction effects between alliances and venture capital (VC).
This table explores the interaction effects between previous alliance activity and previous VC funding activity. The key variable of interest is ‘‘VC/
alliance interaction,’’ which is simply the product of total VC rounds and total alliance count over the last five years. All other variables are described in
Table 2. Column 1 estimates the hazard of the next VC funding round (comparable to Table 3). Columns 2–4, respectively, estimate hazards of the next
alliance formation (Table 4), going public (Table 5), and being acquired (Table 6). lnðyÞ is the frailty parameter estimate, and w2 values test the goodness of
fit of the model and the frailty distribution. IPO¼ initial public offering.
VC round Alliance funding IPO Acquisition
(1) (2) (3) (4)
Total VC rounds 1.356nn 1.188nn 1.437nn 1.359nn
(0.009) (0.014) (0.053) (0.045)
Total alliances, last five years 1.047nn 1.331nn 1.316nn 1.270nn
(0.014) (0.015) (0.052) (0.056)
VC/alliance interaction 0.984nn 0.965nn 0.983n 0.960nn
(0.003) (0.003) (0.008) (0.009)
Nasdaq return 0.909 32.456nn 0.319 0.815
(0.165) (7.674) (0.233) (0.660)
Total patents, last five years 0.997 0.996 1.042nn 0.998
(0.004) (0.004) (0.014) (0.013)
ln(Alliance Equity), last five years 1.006 1.105n 1.276 1.393n
(0.050) (0.049) (0.168) (0.214)
ln(Alliance Size), last five years 0.976 1.180nn 1.194n 1.092
(0.025) (0.027) (0.085) (0.094)
IPO intensity 1.008 0.936nn 1.205nn 1.021
(0.005) (0.008) (0.012) (0.021)
VC centrality (weighted) 7.626nn 5.542nn 7.737nn 20.122nn
(1.001) (1.166) (4.946) (11.859)
FDA clinical trial dummy 1.214nn 1.394nn 1.732nn 0.996
(0.043) (0.069) (0.276) (0.173)
lnðyÞ 0.019nn 0.220nn 1.331 1.249
(0.007) (0.025) (0.321) (0.358)
Number of observations 148,344 148,344 148,344 148,344
Number of firms 1,860 1,860 1,860 1,860
w2 2547 2017 878.6 265.0
w2 frailty 10.56 339.6 40.47 22.69
n, nn, and nnn denote statistical significance at the 10, 5 and 1 percent level, respectively.
U. Ozmel et al. / Journal of Financial Economics 107 (2013) 655–670668
likewise, our estimations of alliance activity include thenumber of VC rounds prior to that event. These areestimated as independent equations, which allows sepa-rate baseline hazard functions to be estimated. However,this does not come without its own set of costs.In particular, an appealing alternative to our strategywould be to posit a bivariate distribution for the jointhazard of the two events (VC funding and allianceformation) and introduce exogenous parameters to eachoutcome that would allow us to identify the outcomesjointly. Unfortunately, this would require us to writedown a structural model of the joint distribution, as wellas posit variables that are related to one outcome, but notthe other. This is not feasible in the current setting.Nevertheless, as Kalbfleisch and Prentice (2002) pointout, with time-varying data, including counts of thecompeting risks as right-hand side variables is partly away to address the fact that the risks are not independent(see also Rodriquez, 2012).6 This is essentially theapproach we have taken in this paper.
6 It contains online course material for a biostatistics course that
covers the concepts referenced in the paper
One feasible alternative to this is to explore interac-tions between VC and alliance activity more directly.Table 7 presents this analysis. In each column, we repeatthe main specification (Column 9) of each durationanalysis (Tables 3–6), but introduce a new variable, whichis the interaction of the total number of VC rounds withthe total number of alliances formed over the lastfive years.
Each type of funding partnership provides three essen-tial sources of value to the firm. First, it provides directfunding. Second, it provides certification of quality touninformed outsiders, which in turn impacts the termsunder which a company is able to raise funding later(Nicholson, Danzon, and McCullough, 2005). Finally, ithelps connect the firm to other firms with resources thathelp the firm achieve its strategic objectives (Hochberg,Ljundqvist, and Lu, 2007; and Lindsey, 2008). The inter-action effects can help to assess the relative importance ofthese three value sources on net. If introductions arerelatively more important, then we would expect theinteraction term to be positive, as the presence of onetype of funding increased the impact of the other. If thefirst two factors outweigh the third, then we wouldexpect the interaction term to be negative.
U. Ozmel et al. / Journal of Financial Economics 107 (2013) 655–670 669
The main result from Table 7 is that VC funding andalliance formation are substitutes. This can be seen by thefact that, in each of the four columns, the interaction termhas a value that is statistically significantly less than one.This is intuitively clear and speaks to the signaling andcertification role of both, as we describe above. If theinteraction term were significantly greater than one, itwould suggest, for instance, that a key role of VC partner-ing was to help the firm identify suitable alliance partners,and this effect was stronger than the funding channel.
Because the interaction term is negative, when weinclude it in the regression specifications, the main effectsof VC and alliance funding are larger. For example,comparing the hazard ratios from Column 9 of Table 6with Column 4 of Table 7, the loading on the VC fundinground variable grows from 1.287 to 1.359, and the loadingon the total alliance variable goes from 1.108 to 1.27. Thisis most interesting in Column 1, where we examine thehazard of the next VC funding as a function of VC andalliance activity. In Table 3, the hazard ratio on totalalliances is greater than one alone but significantly lessthan one in specifications that include the prior rounds ofVC funding. With the interaction (Column 1 of Table 7),we again find that the main effect of alliances on later VCfunding is positive, but previous alliance activity attenu-ates the effect of prior VC funding rounds to such anextent that the overall effect of strategic alliance activityis negative (as can be seen from the point estimates inTable 3).
It is also important to acknowledge that the exitoutcomes that we study are associated with a set ofprices at which firms launch an IPO or are acquired, andthat these prices are interesting and important in theirown right. In untabulated results, we study how our keyindependent variables affect IPO underpricing, as well asIPO and merger valuations. First, a connection existsbetween IPO underpricing and the degree of prior VCand alliance activity. Consistent with Megginson andWeiss (1991), Barry, Muscarella, Peavy, and Vetsuypens(1990), Ljungqvist and Wilhelm (2003), and others, wefind that increased numbers of VC rounds and increasedVC centrality diminish underpricing. Alliance activity,patent activity, and the FDA dummy have no effect onunderpricing, which suggests that at least part of thequality signals they provide are incorporated into theoffer price. In addition, when we consider merger valua-tions, we find that increasing previous alliance activity isassociated with higher valuations at acquisitions. A fullanalysis of these findings is beyond the scope of thispaper, but these results are available upon request.
8. Conclusion
This paper is one of the first to analyze how theinterplay between alternative funding sources in theprivate capital market affects a start-up company’s exitdecisions from the private capital market. Strategic alli-ances and venture capital funding both raise the hazardthat a start-up company goes public as well the hazard ofbeing acquired.
The results surrounding the effect of VC funding onfirm exit are unsurprising. After all, VC funds invest inportfolio companies hoping to generate a return through afavorable exit. The findings here bear out this simpleintuition and illustrate the importance of the VC syndicatenetwork in bringing about this outcome. Furthermore,biotechnology companies that have VC investments frombetter networked VCs with more central positions in VCsyndicate networks are at substantially greater hazard ofgoing public. This finding suggests that central, i.e., betternetworked, VCs have more extensive information chan-nels, enabling them to add more value to their portfoliocompanies. Such VCs also certify the quality of theirportfolio companies, further increasing the chances ofsuccessful exit for start-ups funded by central VCs. Inaddition, previous alliance activity has a significant role inthe going public decision. One reason for this is thatalliances represent the start-up’s collaborative activity,which leads to the exchange of complimentary knowledgeand other resources.
We also find that previous VC and alliance activity bothincrease the hazard of new alliance formation. They haveopposite impacts on the hazard of new VC funding. Eventhough biotech companies that accumulated more VC fund-ing rounds are more likely to receive new VC funding,previous alliances lower the hazard of new VC funding inthe next period. One reason for this is the potential forconflict of interest between VC firms and alliance partners.VC equity stakes are horizontal slices of value across all of afirm’s potential product lines, whereas alliance cash flowrights tend to represent narrower, more vertical slices withina particular product line. Given the prevalence of strategicalliances, a deeper understanding of how early-stage firmsoptimally balance the competing interests of project-leveland company-level funding opportunities is an importantquestion for future research.
References
Barry, C., Muscarella, C., Peavy, J., Vetsuypens, M.R., 1990. The role ofventure capital in the creation of public companies: evidence fromthe going-public process. Journal of Financial Economics 15,213–232.
Bonacich, Phillip, 1987. Power and centrality: a family of measures.American Journal of Sociology 92, 1170–1182.
Carter, R.B., Manaster, S., 1990. Initial public offerings and underwriterreputation. Journal of Finance 45, 1045–1067.
Chemmanur, T., He, S., Nandy, D., 2009. The going public decisionand the product market. Review of Financial Studies 23,1855–1908.
Danzon, P.M., Epstein, A., Nicholson, S., 2007. Mergers and acquisitionsin the pharmaceutical and biotech industries. Managerial andDecision Economics 28, 307–328.
Gompers, P., Kovner, A., Lerner, J., Scharfstein, D., 2008. Venture capitalinvestment cycles: the impact of public markets. Journal of FinancialEconomics 87, 1–23.
Gompers, P.A., Lerner, J., 1999. The Venture Capital Cycle. MIT Press,Cambridge, MA.
Hagedoorn, J., Schakenraad, J., 1994. The effect of strategic technologyalliances on company performance. Strategic Management Journal15, 291–309.
Hellmann, T., Puri, M., 2000. The interaction between product marketand financing strategy: the role of venture capital. Review ofFinancial Studies 13, 959–984.
Hellmann, T., Puri, M., 2002. Venture capital and the professionali-zation of start-up firms: empirical evidence. Journal of Finance 57,169–197.

U. Ozmel et al. / Journal of Financial Economics 107 (2013) 655–670670
Hochberg, Y., Ljungqvist, A., Lu, Y., 2007. Whom you know matters:venture capital networks and investment performance. Journal ofFinance 62, 251–301.
Hsu, D.H., 2004. What do entrepreneurs pay for venture capital affilia-tion? Journal of Finance 59, 1805–1844.
Hsu, D.H., 2006. Venture capitalists and cooperative start-up commer-cialization strategy. Management Science 52, 204–219.
Kalbfleisch, J.D., Prentice, R.L., 2002. The Statistical Analysis of FailureTime Data. Wiley Interscience, New York.
Kaplan, S.N., Stromberg, P.M., 2003. Financial contracting theory meetsthe teal world: an empirical analysis of venture capital contracts.Review of Economic Studies 70, 281–315.
Leary, M., Roberts, M., 2005. Do firms rebalance their capital structures?Journal of Finance 60, 2575–2620.
Lerner, J., 1994. Venture capitalists and the decision to go public. Journalof Financial Economics 35, 293–316.
Lerner, J., Merges, R.P., 1998. The control of technology alliances: anempirical analysis of the biotechnology industry. Journal of Indus-trial Economics 46, 125–156.
Lerner, J., Shane, H., Tsai, A., 1998. Do equity financing cycles matter?Evidence from biotechnology alliances. Journal of Financial Econom-ics 67, 411–446.
Lindsey, L., 2008. Blurring firm boundaries: the role of venture capital instrategic alliances. Journal of Finance 63, 1137–1168.
Ljungqvist, A., Wilhelm Jr., W.J., 2003. IPO pricing in the dot-com bubble.Journal of Finance 58, 723–752.
Megginson, W., Weiss, K., 1991. Venture capital certification in initialpublic offerings. Journal of Finance 46, 879–903.
Mitchell, W., Singh, K., 1996. Survival of businesses using collaborativerelationships to commercialize complex goods. Strategic Manage-ment Journal 17, 169–195.
Nicholson, S., Danzon, P., McCullough, J., 2005. Biotech-pharmaceuticalalliances as a signal of asset and firm quality. Journal of Business 78,1433–1464.
Pagano, M., Panetta, F., Zingales, L., 1998. Why do companies go public?An empirical analysis. Journal of Finance 53, 27–64.
Pisano, G.P., 1994. Knowledge, integration, and the locus of learning: anempirical-analysis of process-development. Strategic ManagementJournal 15, 85–100.
Podolny, J.M., 2001. Networks as the pipes and prisms of the market.American Journal of Sociology 107, 33–60.
Powell, W.W., Koput, K.W., Smith-Doerr, L., 1996. Interorganizationalcollaboration and the locus of innovation: networks of learning inbiotechnology. Administrative Science Quarterly 41, 116–145.
Rodriguez, G., 2012. Website is data.princeton.edu. Princeton University.Robinson, D.T., Stuart, T., 2007a. Financial contracting in biotech strate-
gic alliances. The Journal of Law and Economics 50, 559–596.Robinson, D.T., Stuart, T., 2007b. Network effects in the governance of
strategic alliances. The Journal of Law Economics and Organization23, 242–273.
Shan, W.J., Walker, G., Kogut, B., 1994. Interfirm cooperation and startupinnovation in the biotechnology industry. Strategic ManagementJournal 15, 387–394.
Singh, K., Mitchell, W., 2005. Growth dynamics: the bidirectionalrelationship between interfirm collaboration and business sales inentrant and incumbent alliances. Strategic Management Journal 26,497–521.
Sorensen, J.B., Stuart, T.E., 2000. Aging, obsolescence, and organizationalinnovation. Administrative Science Quarterly 45, 81–112.
Stuart, T.E., 2000. Interorganizational alliances and the performance offirms: a study of growth and innovation rates in a high-technologyindustry. Strategic Management Journal 21, 791–811.
Stuart, T., Hoang, H., Hybels, R., 1999. Interorganizational endorsementsand the performance of entrepreneurial ventures. AdministrativeScience Quarterly 44, 315–349.
Stuart, T.E., 1998. Producer network positions and propensities tocollaborate: an investigation of strategic alliance formations in ahigh-technology industry. Administrative Science Quarterly 43,668–698.
Whited, T., 2006. External finance constraints and the intertemporalpattern of intermittent investment. Journal of Financial Economics81, 467–502.