journal of fluids and structures - georgia institute of...
TRANSCRIPT

Contents lists available at SciVerse ScienceDirect
Journal of Fluids and Structures
Journal of Fluids and Structures ] (]]]]) ]]]–]]]
0889-97
doi:10.1
� Cor
USA. Te
E-m
PleasStruc
journal homepage: www.elsevier.com/locate/jfs
Tree-inspired piezoelectric energy harvesting
William B. Hobbs a, David L. Hu a,b,�
a School of Mechanical Engineering, Georgia Institute of Technology, Atlanta, GA 30332, USAb School of Biology, Georgia Institute of Technology, Atlanta, GA 30332, USA
a r t i c l e i n f o
Article history:
Received 23 July 2010
Accepted 6 August 2011
Keywords:
Vortex induced vibrations
Piezoelectric energy harvesting
Tandem cylinders
46/$ - see front matter & 2011 Elsevier Ltd. A
016/j.jfluidstructs.2011.08.005
responding author at: School of Mechanical E
l.: þ1 404 894 0573; fax: þ1 404 894 8496
ail address: [email protected] (D.L. Hu).
e cite this article as: Hobbs, W.B.,tures (2011), doi:10.1016/j.jfluidstr
a b s t r a c t
We design and test micro-watt energy-harvesters inspired by tree trunks swaying in
the wind. A uniform flow vibrates a linear array of four cylinders affixed to piezoelectric
energy transducers. Particular attention is paid to measuring the energy generated as a
function of cylinder spacing, flow speed, and relative position of the cylinder within the
array. Peak power is generated using cylinder center-to-center spacings of 3.3
diameters and flow speeds in which the vortex shedding frequency is 1.6 times the
natural frequency of the cylinders. Using these flow speeds and spacings, the power
generated by downstream cylinders can exceed that of leading cylinders by more than
an order of magnitude. We visualize the flow in this system by studying the behavior of
a dynamically matched flowing soap film with imbedded styrofoam disks. Our
qualitative visualizations suggest that peak energy harvesting occurs under conditions
in which vortices have fully detached from the leading cylinder.
& 2011 Elsevier Ltd. All rights reserved.
1. Introduction
Energy harvesting is the process by which ambient energy is captured from external sources (thermal, wind, solar andhydrodynamic). One way to harvest energy is through the use of piezoelectricity, the ability of certain materials such asbone (Fukada and Yasuda, 1957), wood (Fukada, 1955) and ceramics to generate electric fields in response to mechanicalstrain. In this study, we investigate the feasibility of using biologically inspired kinetic sculptures to harvest energy byswaying in the wind. We examine primarily the use of ceramic piezoelectric transducers, but the principles we find may beapplied to transducers composed of other materials.
While primarily used for sensing pressure, ceramic piezoelectric transducers have been recently implemented inseveral designs for fluid flow energy harvesting. They are envisioned for use in generating micro- and milli-watts forpowering remote sensor networks and small-scale electronic devices. Some piezoelectrics replace electrical generators inconventional cam-driven rotating turbine designs (Priya et al., 2005). Other designs have been implemented to operateentirely differently from rotating designs. One example is the piezoelectric eel, an underwater sheet of piezoelectricpolymer that oscillates in the wake of a bluff body (Taylor et al., 2001). The ‘‘oscillating blade’’ generator resembles a stalkof corn, in which a piezoelectric transducer connects a steel leaf spring to leaf-like ears (Schmidt, 1992).
Vortex-induced vibration is one of the primary mechanisms by which moving fluids cause objects to undergooscillation, and is often capitalized upon in piezoelectric energy harvesting. The subject has a long history of experimental,theoretical and computational work, summarized in reviews by Bearman (1984), Williamson and Govardhan (2004), and
ll rights reserved.
ngineering, Georgia Institute of Technology, 801 Ferst Drive, MRDC 1308, Atlanta, GA 30332-0405,
.
Hu, D.L., Tree-inspired piezoelectric energy harvesting. Journal of Fluids anducts.2011.08.005
W.B. Hobbs, D.L. Hu / Journal of Fluids and Structures ] (]]]]) ]]]–]]]2
Blevins (1990), and more recently in Bearman (2011) and Sumner (2010). For a single cylinder in uniform flow, theperiodic shedding of vortices will generate lateral pressure asymmetries on the cylinder. If the cylinder is elastic,vibrations transverse to the flow direction will also occur (Tanida et al., 1973; Zhou et al., 1999). A second cylinderdownstream from the first will also vibrate due to vortices shed upstream (Allen and Henning, 2003; Gaydon andRockwell, 1999; Lin et al., 2002; Mittal and Kumar, 2001, 2004; Mizushima and Suehiro, 2005), and under certaincircumstances with larger amplitudes than that of the first cylinder (Huera-Huarte and Bearman, 2011). To and Lam (2007)investigated the behavior of a flexible cylinder placed upstream of a large stationary cylinder. Three and four cylindershave been studied in various arrangements, but the effect of cylinder vibration on flow structure is less frequently takeninto account. Several investigators have studied triangular arrays of fixed non-vibrating cylinders (e.g., Lam and Cheung,1988; Tatsuno et al., 1998). An array of cylinders arranged traverse to the flow has been studied for the purpose ofunderwater energy harvesting of the ocean’s currents (Bernitsas et al., 2008). However, the energy generation behindmultiple elastic cylinders arranged in a line received little attention. This is precisely the configuration for an orchard oftrees (de Langre, 2008; Dupont and Brunet, 2008), and in our energy-harvesting device.
In this study, we present the design of a new piezoelectric device that uses tree-like swaying to harvest wind energy.The power output of our design is on the order of micro-watts, which on the same order of magnitude as otherpiezoelectric energy devices. This level of power is adequate for powering ultra-low power micro-controllers with sensing,recording, and wireless communication capabilities. In Section 2, we overview our device design and use this physicalpicture to conduct a dimensional analysis of our design in Section 3. In Section 4, we describe the methods used to collectenergy data from our device and to dynamically match our system to a flowing soap film used for flow visualization.In Section 5, we present our experimental results, focusing on characterizing peak energy generation of our device over arange of device spacings and flow speeds. In Section 6, we discuss the efficiency of our device and provide guidelines forsetting up the device for maximum power generation. In Section 7, we discuss the implications of our work and suggestdirections for future research.
2. Device design considerations
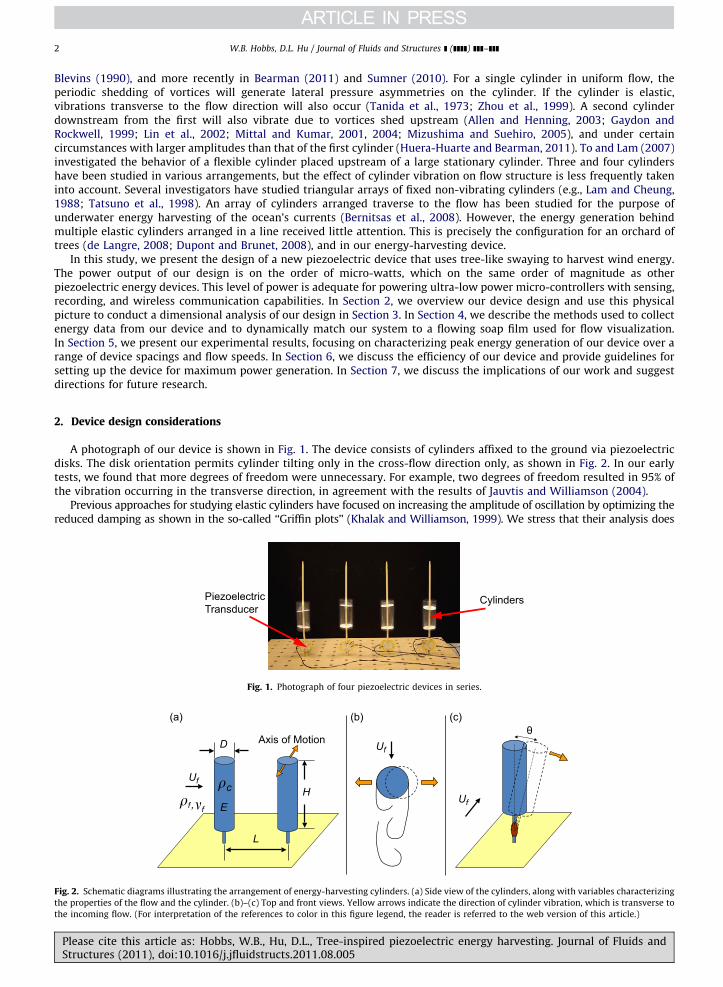
A photograph of our device is shown in Fig. 1. The device consists of cylinders affixed to the ground via piezoelectricdisks. The disk orientation permits cylinder tilting only in the cross-flow direction only, as shown in Fig. 2. In our earlytests, we found that more degrees of freedom were unnecessary. For example, two degrees of freedom resulted in 95% ofthe vibration occurring in the transverse direction, in agreement with the results of Jauvtis and Williamson (2004).
Previous approaches for studying elastic cylinders have focused on increasing the amplitude of oscillation by optimizing thereduced damping as shown in the so-called ‘‘Griffin plots’’ (Khalak and Williamson, 1999). We stress that their analysis does
PiezoelectricTransducer
Cylinders
Fig. 1. Photograph of four piezoelectric devices in series.
D
H
L
Uf
, E
Axis of Motion
Uf
θ Uf
�f �f
�c
Fig. 2. Schematic diagrams illustrating the arrangement of energy-harvesting cylinders. (a) Side view of the cylinders, along with variables characterizing
the properties of the flow and the cylinder. (b)–(c) Top and front views. Yellow arrows indicate the direction of cylinder vibration, which is transverse to
the incoming flow. (For interpretation of the references to color in this figure legend, the reader is referred to the web version of this article.)
Please cite this article as: Hobbs, W.B., Hu, D.L., Tree-inspired piezoelectric energy harvesting. Journal of Fluids andStructures (2011), doi:10.1016/j.jfluidstructs.2011.08.005

Table 1Comparison of key parameters between the two-dimensional soap film system and the three-
dimensional wind tunnel system.
Parameter 2-D System 3-D System
fs=fn 0.8–2.0 0.8–2.0
U (m/s) 1.1–2.8 1.8–4.3
Re 3550–8900 4100–9800
rc=rf 30 80
z 0.01870.005 0.07270.011
W.B. Hobbs, D.L. Hu / Journal of Fluids and Structures ] (]]]]) ]]]–]]] 3
not consider the role of the mechanical damping, which in our case is equivalent to power production. While we do reportdamping in this study (see Table 1), we do not optimize with respect to it. Instead, we focus on maximizing power output withrespect to cylinder spacing and flow speed. Efforts were also made to make the device’s cross-section as thin as possible so thatit could be implemented in large numbers while minimizing space. As shown in Fig. 1, we plan to implement our design inlarge numbers, which will enable us to take advantage of potential cooperative interactions, such as those observed in animalaggregations. In schools of fish, fish can minimize their swimming energy expended by harvesting vortex energy from fishupstream (Liao, 2007; Whittlesey et al., 2010). Similarly, we hope that an appropriate choice for the spacings of our devices willalso augment energy harvesting.
3. Dimensional analysis
The physical picture of our system is shown in Fig. 2. We consider an in-line array of cylinders with a geometrydescribed by cylinder diameter D, height H and center-to-center spacing L. The cylinders have material propertiesdescribed by density rc , elasticity E and dimensionless damping coefficient z. The fluid has density rf , viscosity m and far-field velocity U. Using dimensional analysis, we can write the power generated P, relative to other parameters, as
P¼ rf U3DH � g Re,L
D,H
D,
fs
fn,rc
rf
,z
!; ð1Þ
where rf U3DH is the rate of working of the fluid on the cylinder and the function g depends on Reynolds numberRe¼UD=n, dimensionless spacing L=D and cylinder height H=D, dimensionless shedding frequency fs=fn, mass ratio rc=rf
and damping coefficient z. We now discuss the significance and magnitude of these dimensionless groups in turn. Theirvalues are given in Table 1.
Over the velocities tested, the Reynolds number ranged from approximately Re¼4000 to 9000 indicating that viscosityeffects were negligible. Cylinders were much heavier than the fluid (providing a mass parameter rc=rf � 85). We note thatalthough the motion of the cylinder is rotational (see Fig. 2), the amplitude of motion is sufficiently small that we considerthe motion to be effectively two dimensional rather than three dimensional.
We used cylinders with dimensionless height H/D¼2.2 and dimensionless spacing L/D¼2–6. Decreasing thedimensionless height will play a role in making the flow more fully three dimensional by accentuating tip effects(vortices shed over the top of the cylinder). We keep this height at an intermediate value in order to increase the similaritybetween the piezoelectric system and our two-dimensional soap film visualizations.
Finally, the dimensionless group fs=fn is the ratio of vortex shedding frequency, fs, to the natural frequency, fn, of the elasticcylinders. In particular, resonance of the cylinder corresponds to fs=fn¼1. In our experiments, the natural frequency fn of ourcylinders was found experimentally to be 11 Hz, and cylinders under flow conditions continued to vibrate at 11–12 Hz. Sincewe expect high energy generation to occur at resonance, we tuned the flow speed U so that fs=fn ¼ 0:822:0.
To ease manufacturing, our devices consisted of rigid cylinders with an elastic hinge (the piezoelectric) at the base. Forthe sake of future workers, we also relate the group fs=fn to the intrinsic properties of an equivalent cylinder made of asingle homogeneous material. We assume that elastic cylinders for our system shed at the same frequency as rigid fixedcylinders. For a single rigid cylinder in flow, the frequency, fs, by which vortices are shed is given by the Strouhal numberS¼ fsD=U (Blevins, 1990). As specified for a circular cross-section by Blevins (1990), the Strouhal number for a singlecylinder is S¼0.2. Work by Igarashi (1986) would suggest that for fixed cylinders in tandem, a value of S¼0.2 is expectedfor flows with a Reynolds number below 10 000, with decreases to S¼0.14 during bistable behaviors. In our study, we willassume that oscillation of the cylinder has no impact on Strouhal number and use the value given by Blevins: S¼0.2.
Using the derivations of Van Eysden and Sader (2009), the resonant frequency for a circular beam in a fluid can bewritten according to the material properties of the beam and fluid:
fn �D
H2
E
rc
� �1=2
1þprf
4rc
� ��1=2
: ð2Þ
Please cite this article as: Hobbs, W.B., Hu, D.L., Tree-inspired piezoelectric energy harvesting. Journal of Fluids andStructures (2011), doi:10.1016/j.jfluidstructs.2011.08.005

W.B. Hobbs, D.L. Hu / Journal of Fluids and Structures ] (]]]]) ]]]–]]]4
Given that rf 5rc , we can write fs=fn as
fs
fn�
SUffiffiffiffiffiffiffiffiffiffiE=rc
p H
D
� �2
: ð3Þ
We do not explicitly use Eq. (3) in our methods. Instead, we predict fs (using the appropriate Strouhal number) and wemeasure fn directly with high-speed video, rather than inferring it through measurements of E. In the next section, wepresent our methods to measure peak power, as given in Eq. (1), specifically by characterizing the dependence of g oncylinder spacing and frequency ratio.
4. Methods
To design our devices and measure their performance, we used techniques from electrical engineering and fluidmechanics, which we discuss in turn.
4.1. Power measurements
We began by calibrating cylinder kinematic data (Fig. 2) with electrical measurements. Specifically, we used high-speed video to verify quantitatively that the angular velocity o of the cylinders was proportional to voltage output V:
o¼ cV ð4Þ
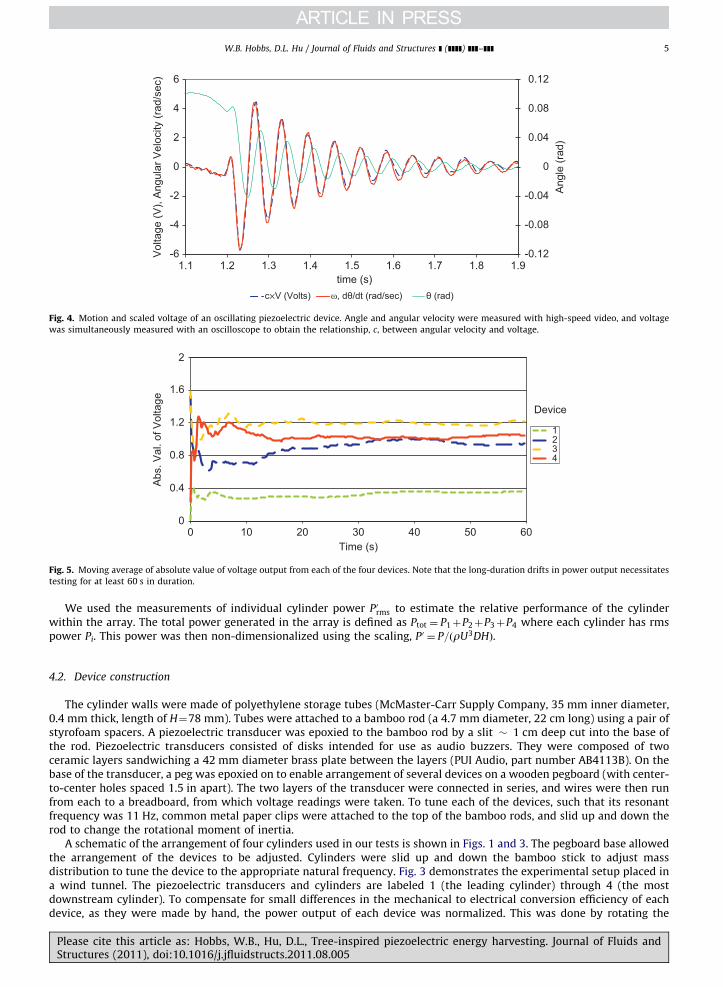
where o¼ dy=dt is the angular velocity. This was a logical relationship, as the voltage across a piezoelectric material isproportional to the rate of deformation of the material. Moreover, the deflection of our devices was less than y¼ 61, forwhich the small angle approximation is valid. The correlation constant c� 0:4 ðs VÞ�1 was found by measuring the voltageacross a 1 MO resistor while simultaneously measuring the displacement of the tip of the cylinder with calibrated high-speed video. The results of this testing are shown in Fig. 4, where the cylinder angle and angular velocity are plottedagainst the scaled voltage output of the piezoelectric transducer. The simple relation, Eq. (4), between voltage and angularvelocity, greatly simplified interpretation of our results: it allowed us to characterize cylinder kinematics by simplyrecording voltage rather than high-speed video.
To verify that tilting of our cylinders was primarily in the cross-flow direction, we performed high-speed video of thedevice. We observed less than 11 of tilting in the stream-wise direction (compared to 61 of tilting in the cross-streamdirection).
For all experiments, the voltage from each piezoelectric transducer was measured across a 1 MO resistance, using asampling rate of 200 Hz using a PC with a multichannel data acquisition board running LabViewTM. The power output, P,for each device was calculated using the well-known relation P¼ V2=R where R is the resistance. Tests were carried outwith a sampling duration of 60 s, and each test was then repeated 5 times to help insure the reliability of the data. Thesteady-state power for each cylinder was estimated by taking the root-mean-square (rms) power Prms ¼ ð
PtP
2ðtÞÞ1=2 using1200 total power measurements P at a series of time points t, with a sampling rate 200 Hz over a duration of 60 s. Notethat we use the rms power because this is the standard for electronics and power generation. We found that tests of such along duration (compared to the time-scale of cylinder motion 1/10 s) were necessary to obtain repeatable values forcylinder power. For example, Fig. 5 shows a plot of the 60-s moving average of the Prms of the four devices during a singletest. The high variation in voltage can be clearly seen in the first 5–10 s of the data.
Fan
Uf
1 2 3 4
1 m
0.5 m
0.5 m
> 1.0 m> 1.0 m
WindTunnel
Fig. 3. Schematic diagram of the wind tunnel used for testing. Cylinders are numbered 1 (leading cylinder) to 4 (most downstream cylinder). Air is drawn
through the tunnel, from the left to the right, by a box fan. To minimize edge effects, the first and last device in the series were positioned at least 0.1 m
from the ends of the 1 m long tunnel.
Please cite this article as: Hobbs, W.B., Hu, D.L., Tree-inspired piezoelectric energy harvesting. Journal of Fluids andStructures (2011), doi:10.1016/j.jfluidstructs.2011.08.005
0
0.4
0.8
1.2
1.6
2
0 10 20 30 40 50 60
Abs
. Val
. of V
olta
ge
Time (s)
Device
1234
Fig. 5. Moving average of absolute value of voltage output from each of the four devices. Note that the long-duration drifts in power output necessitates
testing for at least 60 s in duration.
-0.12
-0.08
-0.04
0
0.04
0.08
0.12
-6
-4
-2
0
2
4
6
1.1 1.2 1.3 1.4 1.5 1.6 1.7 1.8 1.9
Ang
le (r
ad)
Vol
tage
(V),
Ang
ular
Vel
ocity
(rad
/sec
)
time (s)c×V (Volts) �, dθ/dt (rad/sec) θ (rad)
Fig. 4. Motion and scaled voltage of an oscillating piezoelectric device. Angle and angular velocity were measured with high-speed video, and voltage
was simultaneously measured with an oscilloscope to obtain the relationship, c, between angular velocity and voltage.
W.B. Hobbs, D.L. Hu / Journal of Fluids and Structures ] (]]]]) ]]]–]]] 5
We used the measurements of individual cylinder power P0rms to estimate the relative performance of the cylinderwithin the array. The total power generated in the array is defined as Ptot ¼ P1þP2þP3þP4 where each cylinder has rmspower Pi. This power was then non-dimensionalized using the scaling, P0 ¼ P=ðrU3DHÞ.
4.2. Device construction
The cylinder walls were made of polyethylene storage tubes (McMaster-Carr Supply Company, 35 mm inner diameter,0.4 mm thick, length of H¼78 mm). Tubes were attached to a bamboo rod (a 4.7 mm diameter, 22 cm long) using a pair ofstyrofoam spacers. A piezoelectric transducer was epoxied to the bamboo rod by a slit � 1 cm deep cut into the base ofthe rod. Piezoelectric transducers consisted of disks intended for use as audio buzzers. They were composed of twoceramic layers sandwiching a 42 mm diameter brass plate between the layers (PUI Audio, part number AB4113B). On thebase of the transducer, a peg was epoxied on to enable arrangement of several devices on a wooden pegboard (with center-to-center holes spaced 1.5 in apart). The two layers of the transducer were connected in series, and wires were then runfrom each to a breadboard, from which voltage readings were taken. To tune each of the devices, such that its resonantfrequency was 11 Hz, common metal paper clips were attached to the top of the bamboo rods, and slid up and down therod to change the rotational moment of inertia.
A schematic of the arrangement of four cylinders used in our tests is shown in Figs. 1 and 3. The pegboard base allowedthe arrangement of the devices to be adjusted. Cylinders were slid up and down the bamboo stick to adjust massdistribution to tune the device to the appropriate natural frequency. Fig. 3 demonstrates the experimental setup placed ina wind tunnel. The piezoelectric transducers and cylinders are labeled 1 (the leading cylinder) through 4 (the mostdownstream cylinder). To compensate for small differences in the mechanical to electrical conversion efficiency of eachdevice, as they were made by hand, the power output of each device was normalized. This was done by rotating the
Please cite this article as: Hobbs, W.B., Hu, D.L., Tree-inspired piezoelectric energy harvesting. Journal of Fluids andStructures (2011), doi:10.1016/j.jfluidstructs.2011.08.005

CS
F
W
W
R
A
D
G
Oblique ViewFront View
Side View
Fig. 6. Schematic diagram (oblique, front and side views) of our soap film apparatus. Disks (D) in the soap film (F) are suspended from linear springs (S)
behind the film. The film flows top to bottom, pulled by gravity (G). The clamps are vertically adjustable along a rod (R), which is fixed to an angled
aluminum support (A). The wires (W) that support the film are also shown.
W.B. Hobbs, D.L. Hu / Journal of Fluids and Structures ] (]]]]) ]]]–]]]6
devices through each position, while keeping the other positions occupied, and measuring the average power output.Scaling factors (of 1.26, 1.0, 1.08 and 1.30 for devices 1–4) were applied such that each device, on average, would generatethe same amount of power given the same conditions. These scaling factors were then applied to each individual device’soutput for the remainder of our testing.
Flow velocity in the wind tunnel was controlled by a combination of built-in speed controls on the fan and a 120 VACVariacTM variable transformer. Calibration of the system for flow speed was provided by velocity measurements using ahand held anemometer, insuring that variation in velocity was less than 5% over the area that the piezoelectric deviceswould be placed.
The damping ratio z was calculated for the piezoelectric devices as well as the soap film system by measuring thelogarithmic decrement. Devices in each system were manually deflected and released (i.e., a step input) and the oscillatingresponse was recorded. By measuring the decreasing motion over at least four oscillations, the damping ratio wasestimated, as given in Table 1. We also verified using incremental deflection tests that the springs were indeed linear in therange of flow speeds considered.
To better understand the relation between vortex shedding and power output, a three-cylinder system was visualizedin a dynamically matched two-dimensional flowing soap film (Fig. 6). Detailed descriptions of using a soap film watertunnel are given in Beizaie and Gharib (1997) and Ristroph and Zhang (2008). We suspended styrofoam disks (diameterD¼12.5 mm) in the soap film using springs. Spring stiffness was chosen to provide dynamic similarity with thepiezoelectric system. Dimensionless parameters for our wind tunnel and soap film tests are given in Table 1. Tests wererun at two different spacings, L/D¼2 and 5, and two different flow speeds, which provided frequency ratios of fs=fn ¼ 0:5and 1.5.
5. Results
5.1. Peak power in the array
We characterized the power parameter space by collecting 96 piezoelectric power measurements (consisting of fourdevices across four different spacings and six flow speeds). Fig. 7 shows a contour plot of combined dimensionless power.Moving to the right on the contour plot corresponds to increased wind speed; moving upward corresponds to increasedspacing.
Clearly, Fig. 7 shows a global peak in power at spacings L=D near 3.3 and frequency ratios fs=fn near 1.6. We draw insighton the position of this peak using flow visualization of representative points (a–d) in Fig. 7. Images of the correspondingflows are shown in Fig. 8. There are clear visible differences between the flow structures corresponding to low poweroutput (a–b) and high power output (c–d). Specifically, in the high-power conditions (c-d), vortices are detached from theleading and second cylinder. This causes the second and third cylinder to be buffeted by the vortices from the arisingKarman (1963) vortex streets. Conversely, in the low-power conditions (a–b), the leading cylinder is trailed by regions of
Please cite this article as: Hobbs, W.B., Hu, D.L., Tree-inspired piezoelectric energy harvesting. Journal of Fluids andStructures (2011), doi:10.1016/j.jfluidstructs.2011.08.005

0 0.8 1 1.2 1.4 1.6 1.82.2
3.3
4.4
5.4
P' x 10-6
fs/fn
L/D
(a) (c)
(d)(b)
Low Power
High Power
5 10 15 20 25 30 35 40 45 50 55
Fig. 7. Contour plot of the dimensionless power, P01þP02þP03þP04, for all four devices as a function of frequency ratio fs=fn and spacing L/D. Regions of low
power (on the left) and high power (on the right) are labelled. In these regions are also labelled as four characteristic points (a–d) for which flow
visualizations were conducted in a soap film (Fig. 8).
Low
Pow
erH
igh
Pow
er
(a)
(b)
(c)
(d)
Fig. 8. Soap film visualizations of flow around three spring-loaded cylinders (1.25 cm diameter). Flow is from left to right and conditions have been
dynamically matched to the piezoelectric system, whose power output is given in Fig. 7. Specifically, (a–b) denote low power generation and (c–d) high power
generation.
Please cite this article as: Hobbs, W.B., Hu, D.L., Tree-inspired piezoelectric energy harvesting. Journal of Fluids andStructures (2011), doi:10.1016/j.jfluidstructs.2011.08.005
W.B. Hobbs, D.L. Hu / Journal of Fluids and Structures ] (]]]]) ]]]–]]] 7

W.B. Hobbs, D.L. Hu / Journal of Fluids and Structures ] (]]]]) ]]]–]]]8
recirculation. Clearly, vortices do not fully detach from the cylinders until after the most downstream cylinder. Weconclude that for generating high power, cylinder spacing and flow speeds should be sufficiently large for Karman vortexwakes to fully develop. This result is consistent with the work of Zdravkovich and others, who have shown that the liftof a trailing cylinder is strongly influenced by the alternating, discrete vortices in the wake of an upstream cylinder(Liang et al., 2009; Zdravkovich, 1987).
As shown by our flow visualizations, peak power is associated with a fully developed Karman vortex street. Conversely,at low wind speeds (Fig. 8a–b), Karman vortex streets are only generated by the most downstream cylinder. The remainingcylinders are surrounded by stagnant and recirculating regions, causing minimal cylinder vibration and a minimum inpower for the array: here P0tot � 5� 10�6 is at a global minimum. At such low wind speeds, changes in spacing (as shown inFig. 8a) do not appreciably develop the vortex street. Correspondingly, power appears to be relatively invariant of spacing.
We expect dimensional power to be dependent on wind-speed, as shown by the U3 scaling in Eq. (1). Surprisingly, thereappear to be further nonlinear effects, as dimensionless power also increases dramatically with flow speed, as shown bythe peak in power at high wind speeds on the right-hand side of Fig. 7. Thus, at high wind speeds, dimensionless power isP0tot � 55� 10�6, or 10 times higher than the dimensionless power at low wind speeds.
In order to further understand why there is such a dramatic increase in power for certain spacings and wind speeds, weestimate how relative power changes at different positions in the array. First, we average across all spacings (acrosshorizontal lines in Fig. 7) to find power due to changes in flow speed.
5.2. Relative power in the array for changes in wind speeds
Fig. 9 shows the relative power of cylinders 1–4 over a range of flow speeds. We observe highly nonlinear behavior.First, clearly, the leading cylinder generates negligible power (P0 ¼ 10�6) for all wind speeds. This reinforces the notion, assuggested by the soap film visualizations (Fig. 8), that a Karman vortex street is necessary for power generation in thissystem. Apparently, a Karman street following a cylinder is insufficient; instead, the cylinders should be buffeted by anincoming wake. The low power from the leading cylinder suggests to future workers that the leading cylinder might bereplaced with a dummy to reduce production costs.
At low flow speeds (so that fs=fn ¼ 0:8–1.0), all cylinders are at comparable power production (all within P0 ¼ 4� 10�6).At intermediate flow speeds (near resonance, fs=fn¼1.2 to 1.4), the third cylinder from the leading edge has a peak powerover an order of magnitude higher than the leading cylinder. Over the highest flow speeds (fs=fn41:4), the peak-producingcylinder is instead the most downstream one.
In Fig. 9, we observed how relative power in the array changed with flow speed. Results were averaged across spacings.How does relative power change with cylinder spacing? To answer this question, examine horizontal lines in Fig. 7.Specifically, by averaging power across all flow speeds, we can show how spacing influences power generation.
5.3. Relative power in the array for changes in spacing
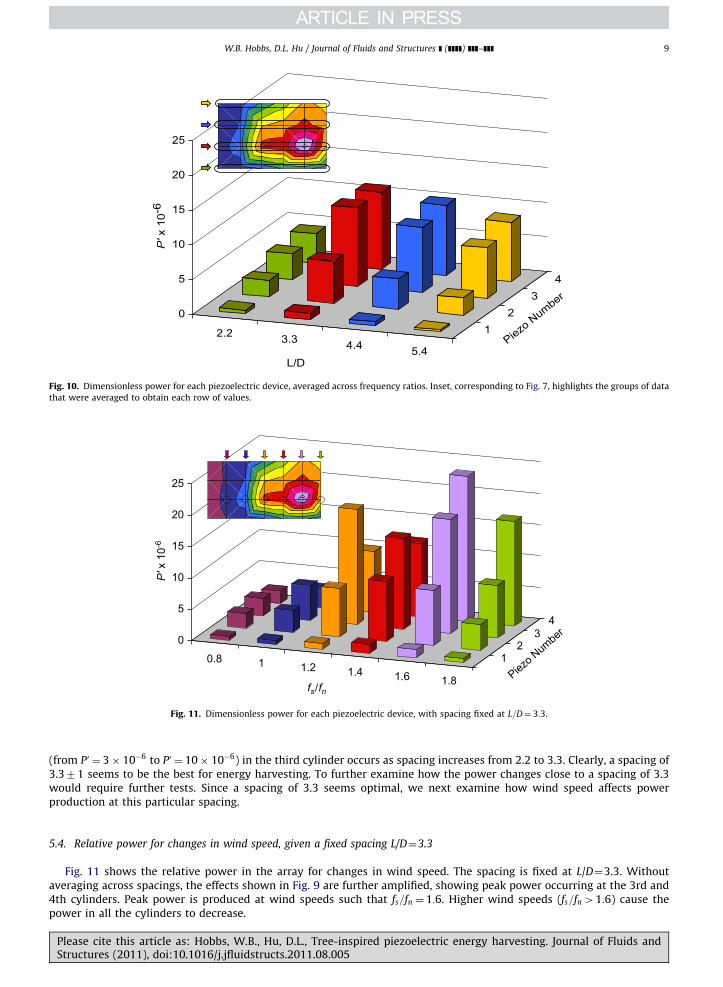
Fig. 10 shows the changes in relative power down the array over a range of spacings. This plot was generatedby averaging data across wind speeds. Similarly to Fig. 9, we observe that the leading cylinder exhibits the lowest poweroutput. Moreover, the third and fourth cylinders exhibit the greatest power generation. A substantial increase in power
12
34
1.81.61.41.210.8
0
5
10
15
20
25
Piezo N
umbe
r
fs/fn
P' x
10-
6
Fig. 9. Dimensionless power for each piezoelectric device, averaged across spacings. Inset, corresponding to Fig. 7, highlights the groups of data that were
averaged to obtain each row of values. Piezos are numbered 1–4, according to Fig. 3.
Please cite this article as: Hobbs, W.B., Hu, D.L., Tree-inspired piezoelectric energy harvesting. Journal of Fluids andStructures (2011), doi:10.1016/j.jfluidstructs.2011.08.005
12
34
5.44.43.32.2
0
5
10
15
20
25
Piezo N
umber
P' x
10-
6
L/D
Fig. 10. Dimensionless power for each piezoelectric device, averaged across frequency ratios. Inset, corresponding to Fig. 7, highlights the groups of data
that were averaged to obtain each row of values.
12
34
1.81.61.41.210.8
0
5
10
15
20
25
Piezo N
umbe
r
fs/fn
P' x
10-6
Fig. 11. Dimensionless power for each piezoelectric device, with spacing fixed at L=D¼ 3:3.
W.B. Hobbs, D.L. Hu / Journal of Fluids and Structures ] (]]]]) ]]]–]]] 9
(from P0 ¼ 3� 10�6 to P0 ¼ 10� 10�6) in the third cylinder occurs as spacing increases from 2.2 to 3.3. Clearly, a spacing of3.371 seems to be the best for energy harvesting. To further examine how the power changes close to a spacing of 3.3would require further tests. Since a spacing of 3.3 seems optimal, we next examine how wind speed affects powerproduction at this particular spacing.
5.4. Relative power for changes in wind speed, given a fixed spacing L/D¼3.3
Fig. 11 shows the relative power in the array for changes in wind speed. The spacing is fixed at L/D¼3.3. Withoutaveraging across spacings, the effects shown in Fig. 9 are further amplified, showing peak power occurring at the 3rd and4th cylinders. Peak power is produced at wind speeds such that fs=fn ¼ 1:6. Higher wind speeds (fs=fn41:6) cause thepower in all the cylinders to decrease.
Please cite this article as: Hobbs, W.B., Hu, D.L., Tree-inspired piezoelectric energy harvesting. Journal of Fluids andStructures (2011), doi:10.1016/j.jfluidstructs.2011.08.005

W.B. Hobbs, D.L. Hu / Journal of Fluids and Structures ] (]]]]) ]]]–]]]10
6. Efficiency and power output
In this section, we report the efficiency and maximum power generated by our device. We first note that these valuesdepend explicitly on the quality of the piezoelectric we used. Efficiency would very likely increase if our transducer wasreplaced with a higher quality piezoelectric bimorph, such as the one used by Priya et al. (2005).
Power output from each of our devices ranged from 1 to 5 mW for the wind conditions tested. This value is low incomparison to a device built by Priya (2005), which is smaller than our device, yet produces 3 orders of magnitude morepower. We suspect that the primary reason for this large discrepancy is the differences in quality of the piezoelectric used.Nevertheless, milli-watts and micro-watts are typical values for piezoelectric power generation. These values are in part somuch lower than conventional wind turbines because of their small size necessitated by the high cost of the piezoelectricmaterials.
As shown by other workers in piezoelectrics, power magnitude is not the only metric motivating their implementation.Piezoelectrics have been shown to be useful for mobile or low-power applications such as remote sensing, wireless datatransmission or LED lighting. We found that we were able to light a single ultra low-power LED under the wind conditionstested. We also found that four of our devices could provide power to low power micro-controllers capable of logging andtransmitting sensor data, such as the MSP430 Line (Texas Instruments, 2009).
For the flows considered (U ¼ 1:824:3 m=s) and the cross-sectional area of the device DH¼ 28 cm2, the incoming poweris rU3DH¼ 0:01620:22 W. Given the Betz efficiency of 59%, a wind turbine with the same cross-sectional area of ourcylinders would produce at most 0.01–0.1 W of power. Although wind turbines generate significantly more power, ourdevice still has several advantages. For example, our device may require less maintenance than a wind turbine as it has norotating parts and no gearbox. This simplicity also provides potential for the device to be scaled down in size more easilythan that of a wind turbine.
A portion of the energy of deformation of the piezoelectric material is harvested. Thus, the kinetic energy KE associatedwith the cylinder’s vibrating can give us an upper bound for the deformation energy. This KE¼ 1
2 Io2 where the moment ofinertia I¼MH2=12� 30 g cm2 using a cylinder mass of M¼ 10 g. Given an amplitude of vibration (y¼ 61¼ p=30 rad) andfrequency (f¼1/10 cycles s�1), the angular velocity is o¼ 1 rad s�1. Thus, the KE¼ 3� 10�6 J, which represents an upperbound of the energy that can be harvested per cycle. The maximum power that can be harvested is Pmax ¼ KE� f , whichmay be written as
Pmax ¼1
96prcD2H3yf 3, ð5Þ
where we have used M¼ 14rcpD2H as the mass of our device. Using the length and time-scales of our device, the maximum
possible power generated is Pmax ¼ 10�5 W, or 10 mW, with a maximum power harvested per unit area of 0:3 mW persquare cm. The scaling in Eq. (5) provides several possible avenues for improving energy generation. For example, a morecompliant piezoelectric material would increase the amplitude of bending y, but may decrease the frequency f. The easiestway to increase the energy generated is to build a larger device. For example, a device the size of a large oak tree (2 ordersof magnitude larger in all dimensions) would, by virtue of Eqs. (2) and (5), increase Pmax by four orders of magnitude, thusincreasing the power to the order of 1 W.
How does the power generated by each cylinder compare to this upper bound? The dimensionless power P0 is the ratioof the device’s power to the rate of working of the fluid over the cylinder’s area. Therefore P0 also denotes the efficiency ofour device. We found that leading cylinder in the flow has an efficiency of one millionth (P0 ¼ 1� 10�6). The low efficiencyis due largely because of the low mass of the device, which stores very little kinetic energy. The corresponding power perunit area is 10�7
210�8 W per square cm.As we saw from our measurements, a single cylinder in isolation would make a poor energy-harvester. Instead, the 3rd
and 4th cylinders in the array tend to generate the majority of the array’s power (each roughly generating 25 times thepower of the leading cylinder). Consequently, an array of four cylinders (in which the last two generate the most power)has an efficiency of P0 ¼ 55� 10�6, as shown in Fig. 7. Thus, the addition of more cylinders behind the leading one tends toincrease the efficiency of the group of devices, as the cross-sectional area remains fixed.
7. Discussion
The flow past a group of cylinders is a canonical example of a simple situation that can lead to complex behavior. Thisphysical picture has motivated much work, such as investigations of the flow through cities, plant wind vibrations, heattransfer of tube-banks, as well as fundamental fluid mechanics. Here, we have used this canonical system as the blueprintfor a novel piezoelectric device that uses vortex-induced vibrations to harvest wind energy. We found that such a devicenecessarily relies upon cooperative effects for peak energy harvesting. Specifically, we found that a piezoelectric cylinderworks poorly in isolation. However, when grouped together, the flows generated by upstream cylinders can dramaticallyincrease the power generated by cylinders downstream.
We demonstrated the cooperative effect of our piezoelectric tests using two independent experiments. First, we usedwind tunnel tests to measure the power produced by the array of cylinders as well as the relative power produced downthe array. Next, we conducted flow visualizations in a dynamically matched soap film. Our results suggest that high powerwas associated with full development of Karman vortex streets after the leading cylinder.
Please cite this article as: Hobbs, W.B., Hu, D.L., Tree-inspired piezoelectric energy harvesting. Journal of Fluids andStructures (2011), doi:10.1016/j.jfluidstructs.2011.08.005

W.B. Hobbs, D.L. Hu / Journal of Fluids and Structures ] (]]]]) ]]]–]]] 11
We found striking increase in power generated by simple changes in cylinder arrangement. For example, dimensionlesspower was found to increase by up to 300% at cylinder spacings of L/D¼3.3 compared to that of other spacings. This resultis consistent with the work of Zdravkovich and Pridden (1977), which found that cylinders with a spacing below L/D¼3would fail to shed vortices.
We were also able to investigate how our device would fare under different wind conditions. We showed that there isan optimal wind speed for power production. Finding the highest power at flow speeds associated with fs=fn ¼ 1:6 wasunusual, as we expected non-dimensional power to peak at or near resonance ðfs=fn ¼ 1Þ. One explanation for this revolvesaround our assumptions regarding vortex shedding frequency. First, we assumed that the vortex shedding frequency forthe oscillating cylinders would be the same as that of stationary cylinders, thus not accounting for effects of frequencylock-in. Second, we assumed that vortex shedding would only occur in the horizontal plane, which may not have beentrue, given the fairly low aspect ratio of the cylinders. These combined factors may have resulted in peak power to occur atfs=fn ¼ 1:6 rather than 1, but more study is necessary to understand this phenomenon.
Future generations of our device will likely use more than four cylinders, and more work is needed to understand thelimitations of adding devices. We found that for intermediate wind speeds, power increased up to the third device, andthen decreased at the fourth. However, for higher wind speeds, power increased through the fourth device. The causes forthese two behaviors may be resolved by adding more devices, until the relationship between power and position in thearray is better understood. We speculate that the explanation for these behaviors lies in a balance between the flowchanges caused by and the energy removed by upstream devices. Imaging of the vorticity on the flow and its time-dependence would provide a much-needed understanding of the behaviors observed.
Typical wind-harvesting devices, such as wind turbines, are meant to be used in isolation and in steady flow. Turbinesare rarely grouped in-line, as the resulting vortex shedding and unsteady flows cause stress to turbine blades. By studyingone- and two-dimensional arrays of devices, we hope future workers can devote more attention to energy harvesting thatrelies upon unsteady effects. We hope that we have drawn attention to the complex dynamics and potential advantages ofdesigning energy-harvesters to be arranged in a orchard-like fashion.
Appendix A. Supplementary material
Supplementary data associated with this article can be found in the online version of 10.1016/j.jfluidstructs.2011.08.005.
References
Allen, D., Henning, D., 2003. Vortex-induced vibration current tank tests of two equal-diameter cylinders in tandem. Journal of Fluids and Structures17, 767–781.
Bearman, P., 1984. Vortex shedding from oscillating bluff bodies. Annual Review of Fluid Mechanics 16, 195–222.Bearman, P., 2011. Circular cylinder wakes and vortex-induced vibrations. Journal of Fluids and Structures 27, 648–658.Beizaie, M., Gharib, M., 1997. Fundamentals of a liquid (soap) film tunnel. Experiments in Fluids 23, 130–140.Bernitsas, M., Raghavan, K., Ben-Simon, Y., Garcia, E., et al., 2008. Vivace (vortex induced vibration aquatic clean energy): a new concept in generation of
clean and renewable energy from fluid flow. Journal of Offshore Mechanics and Arctic Engineering 130, 041101.Blevins, R.D., 1990. Flow-induced Vibration, second ed. Van Nostrand Reinhold, New York.Dupont, S., Brunet, Y., 2008. Impact of forest edge shape on tree stability: a large-eddy simulation study. Forestry 81, 299–315.Fukada, E., 1955. Piezoelectricity of wood. Journal of the Physical Society of Japan 10, 97–103.Fukada, E., Yasuda, I., 1957. On the piezoelectric effect of bone. Journal of the Physical Society of Japan 12, 1158–1162.Gaydon, M., Rockwell, D., 1999. Vortices incident upon an oscillating cylinder: flow structure and loading. Journal of Fluids and Structures 13, 709–722.Huera-Huarte, F., Bearman, P., 2011. Vortex and wake-induced vibrations of a tandem arrangement of two flexible circular cylinders with near wake
interference. Journal of Fluids and Structures 27, 193–211.Igarashi, T., 1986. Characteristics of the flow around four circular cylinders arranged in line. Bulletin of the JSME 29, 751–757.Jauvtis, N., Williamson, C.H.K., 2004. The effect of two degrees of freedom on vortex-induced vibration at low mass and damping. Journal of Fluid
Mechanics 509, 23–62.Karman, T., 1963. Aerodynamics. McGraw-Hill Education.Khalak, A., Williamson, C., 1999. Motions, forces and mode transitions in vortex-induced vibrations at low mass-damping. Journal of Fluids and Structures
13, 813–851.Lam, K., Cheung, W., 1988. Phenomena of vortex shedding and flow interference of three cylinders in different equilateral arrangements. Journal of Fluid
Mechanics 196, 1–26.de Langre, E., 2008. Effects of wind on plants. Annual Review of Fluid Mechanics 40, 141–168.Liang, C., Papadakis, G., Luo, X., 2009. Effect of tube spacing on the vortex shedding characteristics of laminar flow past an inline tube array: a numerical
study. Computers & Fluids 38, 950–964.Liao, J., 2007. A review of fish swimming mechanics and behaviour in altered flows. Philosophical Transactions of the Royal Society B: Biological Sciences
362, 1973–1993.Lin, J.C., Yang, Y., Rockwell, D., 2002. Flow past two cylinders in tandem: instantaneous and averaged flow structure. Journal of Fluids and Structures
16, 1059–1071.Mittal, S., Kumar, V., 2001. Flow-induced oscillations of two cylinders in tandem and staggered arrangements. Journal of Fluids and Structures
15, 717–736.Mittal, S., Kumar, V., 2004. Vortex induced vibrations of a pair of cylinders at Reynolds number 1000. International Journal of Computational Fluid
Dynamics 18, 601–614.Mizushima, J., Suehiro, N., 2005. Instability and transition of flow past two tandem circular cylinders. Physics of Fluids 17, 104107.Priya, S., 2005. Modeling of electric energy harvesting using piezoelectric windmill. Applied Physics Letters 87, 184101.Priya, S., Chen, C.T., Fye, D., Zahnd, J., 2005. Piezoelectric windmill: a novel solution to remote sensing. Japanese Journal of Applied Physics: Part 2—Letters
& Express Letters 44, L104–L107.Ristroph, L., Zhang, J., 2008. Anomalous hydrodynamic drafting of interacting flapping flags. Physical Review Letters 101, 194502.
Please cite this article as: Hobbs, W.B., Hu, D.L., Tree-inspired piezoelectric energy harvesting. Journal of Fluids andStructures (2011), doi:10.1016/j.jfluidstructs.2011.08.005

W.B. Hobbs, D.L. Hu / Journal of Fluids and Structures ] (]]]]) ]]]–]]]12
Schmidt, V., 1992. Piezoelectric energy conversion in windmills. In: IEEE 1992 Ultrasonics Symposium Proceedings, vol. 2, pp. 897–904.Sumner, D., 2010. Two circular cylinders in cross-flow: a review. Journal of Fluids and Structures 26, 849–899.Tanida, Y., Okajima, A., Watanabe, Y., 1973. Stability of a circular-cylinder oscillating in uniform-flow or in a wake. Journal of Fluid Mechanics
61, 769–784.Tatsuno, M., Amamoto, H., Ishi-i, K., 1998. Effects of interference among three equidistantly arranged cylinders in a uniform flow. Fluid Dynamics
Research 22, 297–315.Taylor, G.W., Burns, J.R., Kammann, S.M., Powers, W.B., Welsh, T.R., 2001. The energy harvesting eel: a small subsurface ocean/river power generator.
IEEE Journal of Oceanic Engineering 26, 539–547.Texas Instruments, Inc., 2009. eZ430-Chronos Development Tool User’s Guide, SLAU292.To, A., Lam, K., 2007. Flow-induced vibration of a flexibly mounted circular cylinder in the proximity of a larger cylinder downstream. Journal of Fluids
and Structures 23, 523–528.Van Eysden, C., Sader, J., 2009. Resonant frequencies of a rectangular cantilever beam immersed in a fluid. Journal of Applied Physics 100, 114916.Whittlesey, R., Liska, S., Dabiri, J., 2010. Fish schooling as a basis for vertical axis wind turbine farm design. Bioinspiration and Biomimetics 5, 033005.Williamson, C.H.K., Govardhan, R., 2004. Vortex-induced vibrations. Annual Review of Fluid Mechanics 36, 413–455.Zdravkovich, M., 1987. The effects of interference between circular cylinders in cross flow. Journal of Fluids and Structures 1, 239–261.Zdravkovich, M.M., Pridden, D.L., 1977. Interference between 2 circular-cylinders—series of unexpected discontinuities. Journal of Industrial
Aerodynamics 2, 255–270.Zhou, C.Y., So, R.M.C., Lam, K., 1999. Vortex-induced vibrations of an elastic circular cylinder. Journal of Fluids and Structures 13, 165–189.
Please cite this article as: Hobbs, W.B., Hu, D.L., Tree-inspired piezoelectric energy harvesting. Journal of Fluids andStructures (2011), doi:10.1016/j.jfluidstructs.2011.08.005