journal of global trends in pharmaceutical sciencesjgtps.com/admin/uploads/mmokjj.pdf · into...
TRANSCRIPT

Kothapally DL et al, J. Global Trends Pharm Sci, 2019; 10(2): 6263 - 6276
6263
DESIGN AND CHARACTERIZATION OF ETHYL CELLULOSE-BASED COLON
SPECIFIC MICROSPHERE CONTAINING NAPROXEN USING 32 FACTORIAL
DESIGNS
Kothapally DL*, Sridhar Rao, Aleti P.
Research Scholar, JJT University, Jhunjhunu, Rajasthan, India.
Department of Pharmaceutics, Chaitanya College of Pharmacy Education and
Research, Hanamkonda , Telangana.
*Corresponding author E-mail:[email protected]
ARTICLE INFO ABSTRACT
Key Words
Eudragit, DSC,
Microsphere
The objective of the present study was to formulate and optimize colon
targeted Naproxenmicrospheres. To achieve these objective nine
formulations of microspheres wereprepared by emulsion solvent
evaporation method using Eudragit and Ethyl cellulose polymer. A 32
factorialdesign was employed in formulating the microspheres with
concentration of Ethyl Cellulose (X1) and PEG 600 (X2) as independent
variables. Percent drug release was considered asdependent variable. The
effect of drug-polymer concentration, surfactant concentration,cross-
linking agent and stirring speed were evaluated with respect to entrapment
efficiency,particle size, surface characteristics, micromeritic properties,
DSC study and in vitro drug release studies. The particle size and
entrapment efficiency were found to bevaried by changing various
formulation parameters like surfactant concentration andstirring speed etc.
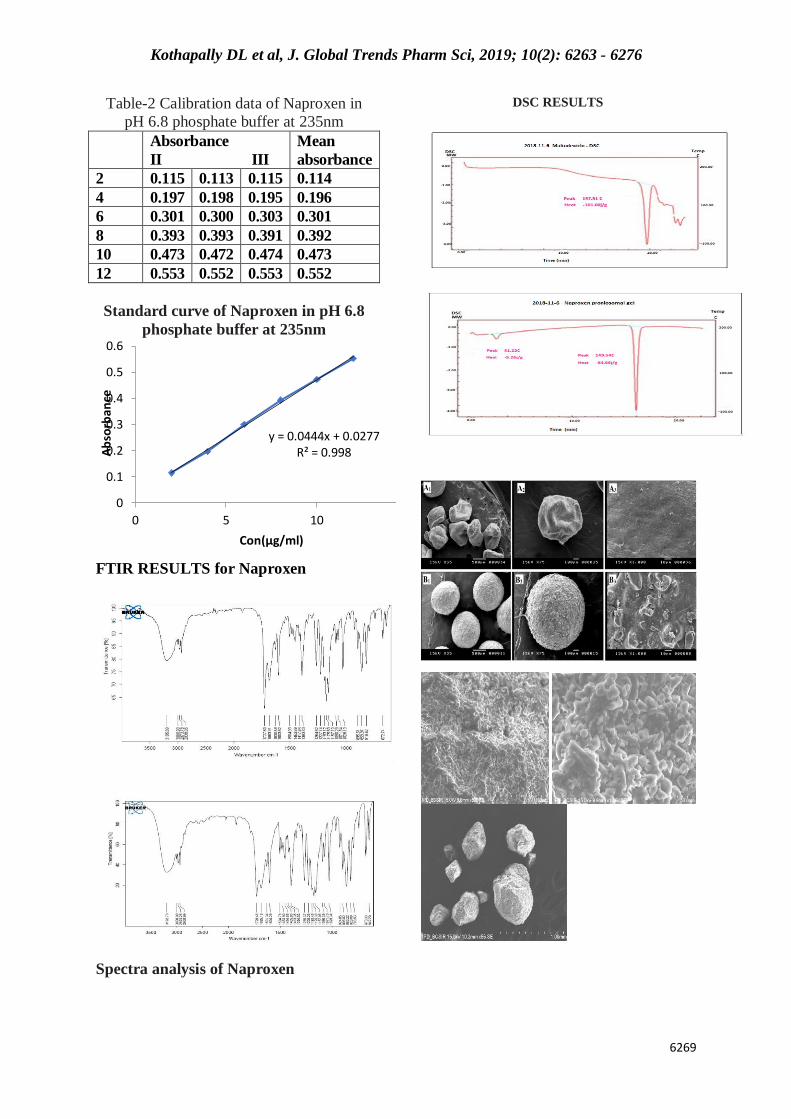
IR study confirmed the drug-polymer compatibility and scanning
electronmicroscopy indicates that the microspheres have the rough and
porous surface due toarising as a trace of solvent evaporation during the
process.
INTRODUCTION:
Oral drug delivery still is the preferred
route of administration for drug products.
The evolution of oral drug delivery
technology may be described by a three-
stage course to reach its current level. With
every step forward in drug delivery
technology, scientists strive to gain more
control over the pharmacokinetics of the
drug substance with the goal to increase
the therapeutic benefit-risk ratio or to
improve bioavailability.1,2 Delivery of
drug substances to the ileocolonic region
may be an essential element of successful
drug treatment (improved efficacy or
reduced systemic toxicity) in topical
treatment of the colon. Release of
mesalazine and corticosteroids in the
ileocolonic region has proved to be a
successful approach for the treatment of
ulcerative colitis. Extension of this
approach to other anti-inflammatory and
immunosuppressive drug substances (e.g.
Journal of Global Trends in Pharmaceutical Sciences
An Elsevier Indexed Journal ISSN-2230-7346

Kothapally DL et al, J. Global Trends Pharm Sci, 2019; 10(2): 6263 - 6276
6264
6-thioguanine, tacrolimus, ciclosporin A)
is envisaged as a promise. Moreover,
topical treatment of other colon
pathologies also appears to be rational
from a clinical pharmacological point of
view, such as Crohn’s disease (budesonide
, infliximab), colon cancer (sulindac) 3,4
luminal amoebiasis (antibiotics) , diarrhea
(prebiotics) an inflammatory bowel
disease (probiotics) . The common
denominator of these therapies is that a
high intraluminal concentration of drug
substance in the ascending colon is related
to a beneficial outcome of drug treatment.
Another reason for investigating oral
ileocolonic drug delivery may be found in
food science to support weight
management and the treatment of obesitas.
Consumer research has highlighted the
need to better control hunger when on a
diet to enhance and sustain compliance in
maximizing weight loss success.
According to recent market research in the
United States, the majority (53%) of
respondent’s claim to cheat on a diet
because they are hungry. Microspheres
have played a major role in the
development of controlled and or sustained
release drug delivery systems.
Microspheres have been of particular
interest from the pharmaceutical point of
view providing the possibility to achieve
sustained and controlled drug release.5
There are several publications based on
drug-containing microspheres using the
Eudragit series of polymers as the
encapsulating materials. The Eudragits are
a family of polymers based on acrylic and
methacrylic acids suitable for use in orally
administered drug delivery systems. These
polymers are available in various grades
possessing a range of physicochemical
properties8,9.
The objective of the investigation is to
design and develop colon targeted drug
delivery system of tinidazole microspheres
by using Eudragit L 100 and Ethyl
cellulose as a pH sensitive polymer. by
directly targeting the drug to colon.
Materials and methods
Materials: Naproxen was a gift sample
from Dr.Reddy Lab Hyderabad,Eudragit
L100 and Ethyl cellulose was procured
from MSN Lab Hyderabad.,all the solvents
are purchased from Evonik India Pvt. Ltd .
Method:
Preliminary studies for surfactant level
selection: Span 60 was used as surfactant
in the microsphere formulation, at various
concentration Span 60 was added and
evaluated for EE% and DR%,from data
obtained below it was confirmed that when
the surfactant concentration is 1.8 ml EE%
is high at various rpm the formulation of
microsphere trial formulation was prepared
Table: 1 Level of selection of span60
Batch code Span 60(ml) Drug(g.m) Polymer Ratio
Eudragit:EC
EE% DR%
A1 1.8 0.9 1:2 56.01±0.03 87.11±0.43
A2 1.8 0.9 1:2 61.33±0.11 89.02 ±0.72
andA3 1.1 0.9 1:2 42.01±0.33 72.66±0.17
A4 0.4 0.9 1:2 40.31±0.22 69.23±0.66
Preliminary studies for RPM level selection
and evaluated for EE% and DR%,The trial results are given below in table noXXXX
Table no: 2Level of selection of RPM
Batch code RPM Drug(g.m) Polymer Ratio
Eudragit:EC
EE% DR%
A5 2000 0.9 1:2 64.31±0.83 77.11±0.43
A6 2000 0.9 1:2 63.23±0.01 80.02 ±0.12
A7 1500 0.9 1:2 52.01±0.23 77.66±0.27
A8 1000 0.9 1:2 50.31±0.12 70.23±0.26
Kothapally DL et al, J. Global Trends Pharm Sci, 2019; 10(2): 6263 - 6276
6265
Preparation of Naproxen microspheres
Naproxen microspheres were prepared by
emulsification solvent evaporation method.
Accurately weighed EL 100 and EC in 1:2
ratios were dissolved in ethanol and
acetone to form a homogenous polymer
solution. Tinidazole was added into the
polymer solution and mixed thoroughly.
Plasticizer (dibutyl phthalate 50% w/v)
was added to above solution. The above
organic phase was slowly poured at 30 0 C
into liquid paraffin (15 mL) containing
span 60 of different concentrations with
stirring speed at different rpm to form a
smooth emulsion. Thereafter, it was
allowed to attain room temperature and
stirring was continued until residual
acetone and ethanol evaporated and
smooth walled, rigid and discrete
microspheres were formed. The
microspheres were collected by
decantation and the product was washed
with petroleum ether (400 -600C ), three
times and dried at room temperature for 3
h. The microspheres were then stored in a
desiccators over fused calcium chloride for
further use. Nine batches were performed
with optimization10,11
Table no: 3 Experimental Variables in 32 Factorial Design
Independent Variables Dependent Variables
X1=surfactant concentration Y1= % of drug release
X2=RPM Y2= Entrapment efficiency
Table no: 4 -32 Factorial Design for Tinidazole microsphere
Formulation code X1 X2
F1 +1 -1
F2 +1 0
F3 +1 +1
F4 0 -1
F5 0 0
F6 0 +1
F7 -1 -1
F8 -1 0
F9 -1 +1
Table no: 5-Fomulation chart of Tinidazole Microsphere
Formulation codeDrug(gm) Polymer Surfactant RPM
EL:EC concentration
F1 0.9 1:2 1.8 2000
F2 0.9 1:2 1.8 1500
F3 0.9 1:2 1.8 1000
F4 0.9 1:2 1.1 2000
F5 0.9 1:2 1.1 1500
F6 0.9 1:2 1.1 1000
F7 0.9 1:2 0.4 1000
F8 0.9 1:2 0.4 1500
F9 0.9 1:2 0.4 2000
Coded value Actualvalue X1(%) X2(rpm)
-1 0.4 1000
0 1.1 1500
+1 1.8 2000

Kothapally DL et al, J. Global Trends Pharm Sci, 2019; 10(2): 6263 - 6276
6266
Σn
Characterization of Tinidazole
microspheres
Drug-polymer interaction (FTIR) study
FTIR spectroscopy was performed on
Fourier transform infrared
spectrophotometer (IR Affinity-1,
Shimadzu, Japan).
Particle size: The particle size of the
microbeads was evaluated using an optical
microscope fitted with a calibrated
eyepiece micrometer under a
magnification of 40X. The particle
diameters of about 50 microbeads were
measured randomly and the average
particle size was determined using the
Edmondson’s equation:
Dmean = Σ nd
Where, n - stands for the number of
counted microbeads, and d - mean size
range.
% Drug content: Accurately weighed 100
mg microbeads were taken in a mortar
pestle, finely crushed and then small
quantity of water is added. It was then kept
overnight for complete solubilization of
pectin and drug release from it. After
suitable dilutions in methanol, absorbance
was measured in uv-vis spectrophotometer
and accordingly drug content is calculated.
The study was repeated threetimes.12,13
Entrapment efficiency: Microspheres
containing equivalent to 10 mg of drug
was allowed to equilibrate in 100 mL of
phosphate buffer pH 7.4 for 24 h. The
solution was filtered using Whatman filter
paper (44). The resulting solution was
analyzed using a UV spectrophotometric
method at 318nmin the presence of a blank
prepared from microspheres containing all
materials except the drug.
%Drugentrapment
=calculated drug concentration
theoretical drug concentration ×100
Differential scanning colorimetry (DSC)
DSC studies were performed using a DSC
METTLERSwitzerland with thermal
analyzer. Accurately weighed samples
(about 5 mg) were placed in a sealed
aluminium pan, before heating under
nitrogen flow (20 mL/min) at a scanning
rate of 20 _C per min from 40 to 300 _C.
An empty aluminium pan was used as
reference. DSC thermograms of pure
substances, their physical mixtures and
drug-loaded micro particles were recorded.
Surface morphology (SEM)
Scanning electron microscopy has been
used to determine the surface morphology
and texture. SEM studies were carried out
by using JEOL Model JSM-6390LV
scanning microscope.
Micromeritic properties of
microspheres: The flow properties of
microspheres were investigated by
determining the angle of repose, bulk
density, tapped density, Carr’s and
Hausner’s ratio. The angle of repose was
determined by the fixed-based funnel
method. Bulk and tapped densities were
measured in 10 mL of a graduated
cylinder. The cylinder was tapped from a
height of 2 inches until a constant volume
was obtained. The volume occupied by the
sample after tapping was recorded and
bulk density, tapped density, Carr’s index
and Hausner’s ratio was calculated.
In vitro drug release studies: In vitro
release study of microspheres was
performed in pH progression medium at
370 C ±0.50 C. The drug dissolution test of
microspheres was performed by the paddle
method (USP dissolution apparatus Type
II, Electro lab Limited, India).
Microspheres equivalent to 100 mg were
weighed accurately and put in muslin cloth
and tied this to paddle over the surface of
900 mL of dissolution medium. The
content was rotated at 100 rpm. The pH of
the dissolution medium was kept 1.2 for 2
h using 0.1 N HCl. After 2 h, the pH of the
dissolution medium was adjusted to 7.4
with 0.1 N NaOH and maintainedup to 8 h.
The samples were withdrawn from the

Kothapally DL et al, J. Global Trends Pharm Sci, 2019; 10(2): 6263 - 6276
6267
dissolution medium at various time
intervals using a pipette. The rate of drug
release was analyzed using UV
spectrophotometer (JASCO, Ahmadabad,
India).14
Kinetic treatment of dissolution data
There are number of kinetic models, which
described the overall release of drug from
the dosage forms. One of the approach to
investigate the kinetics of drug release
from controlled release formulation is by
using model dependent methods. Model
dependent methods are based on different
mathematical functions, which describe
the dissolution profile. Once a suitable
function has been selected, the dissolution
profiles are evaluated depending on the
derived model parameters. Following
models are evaluated.15
Zero order Kinetics
Drug dissolution from dosage forms that
do not disaggregate and release the drug
slowly can be represented by the equation:
Q0—Qt=K0t
Rearrangement of equation (9) yields
Where, Qt is the amount of drug dissolved
in time t, Q0 is the initial amount of drug in
the solution (most times, Q0= 0) and K0 is
the zero order release constant expressed
in units of concentration/time. To study the
release kinetics, data obtained from in
vitro drug release studies were plotted as
cumulative amount of drug released versus
time
First order Kinetics
This model has also been used to describe
absorption and/or elimination of some
drugs, although it is difficult to
conceptualize this mechanism on a
theoretical basis. The release of the drug
which followed first order kinetics can be
expressed by the equation:
log C = log C0 – KE t/2.303
where C0 is the initial concentration of
drug, K is the first order rate constant, and
t is the time. The data obtained are plotted
as log cumulative percentage of drug
remaining vs. time which would yield a
straight line with a slope of -K/2.303.
Higuchimodel
This model is based on the hypotheses that
(i) initial drug concentration in the matrix
is much higher than drug solubility; (ii)
drug diffusion takes place only in one
dimension (edge effect must be
negligible); (iii) drug particles are much
smaller than system thickness; (iv) matrix
swelling and dissolution are negligible; (v)
drug diffusivity is constant; and (vi)
perfect sink conditions are always attained
in the release environment.In a general
way it is possible to simplify the Higuchi
model as,
ft= Q = KK×t1/2
where, KH is the Higuchi dissolution
constant. The data obtained were plotted as
cumulative percentage drug release versus
square root of time
Hixson-Crowell model
Hixson and Crowell (1931) recognized
that the particles regular area is
proportional to the cube root of its volume.
They derived the equation:
WO— Wt=nt. Where, W0 is the initial
amount of drug in the pharmaceutical
dosage form, Wt is the remaining amount
of drug in the pharmaceutical dosage form
at time t and n (kappa) is a constant
incorporating the surface volume relation.
The equation describes the release from
systems where there is a change in surface
area and diameter of particles or tablets.
Tostudy the release kinetics, data obtained
from in vitro drug release studies were
plotted as cube root of drug percentage
remaining in matrix versus time.
Statistical design Design-Expert software (Design Expert
trial version 8.0.7.1;State-Ease Inc.,
Minneapolis, MN, USA) was used. A two-
Kothapally DL et al, J. Global Trends Pharm Sci, 2019; 10(2): 6263 - 6276
6268
factor three-level full factorial design was
used for systemic study of combination of
polymers. Polynomial models including
interaction and quadratic terms were
generated for the entire response variables
using multiple linear regression analysis
(MLRA) approach. The general form of
the MLRA model is represented in the
equation. Where Y is the dependent
variable; b0 is the arithmetic average of all
the quantitative outcomes of nine runs. b1,
b2, b12 are the estimated coefficients
computed from the observed experimental
response values of Y and X1 and X2 are
the coded levels of the independent
variables. The interaction term (X1X2)
shows how the response values change
when two factors are simultaneously
changed. Table 1 summarizes the
translation of the coded levels to the
experimental units used in the study and
Table X summarizes the experiment runs
used. In this study factorialdesign based on
the response surface method was
adoptedto optimize effective factors for the
release of the drugfrom the
microspheres.Analysis of variance
(ANOVA) and all statistical analysiswere
also performed using the software.
Calculation of theeffects was performed.
The significant effects would constitutethe
model. The F-value was then calculated by
comparingthe treatment variance with the
error variance. The multiplecorrelation co-
efficient was calculated which is a measure
ofthe amount of variation about the mean,
which is explainedby the model. The main
effects and interactions are plottedand
results interpreted. All assumptions
underlying theANOVA are checked. For
statistical purposes, the assumptions made
that residuals are normally distributed and
independent with constant variance.16
Spectrometric estimation of Naproxen.
The Lamda max of drug was obtained by
scanning 20µg/ml solution concentration
in the range of 200-400nm using UV-
Visible spectrometer and it was found that
317.9nm for phosphate buffer pH 6.8 and
pH 7.4
Table-1 Solubility of Naproxen in various
solvents
SOLVENT SOLUBILITY
Water Not soluble
Methanol Soluble
PH -6.8 buffer Partially Soluble
PH- 7.4 buffer Soluble
PH- 5.8 buffer Not soluble
RESULTS & DISCUSSION
Preparation of standard calibration curve of
Naproxen: Tinidazole (10 mg) was dissolved
in 0.1 N HCl and volume was made up to
100 mL in 100 mL volumetric flask. This
solution (100 mcg/mL) was further
dilutedwith 0.1 N HCl to obtain solution of 5
to 40 mcg/mL. Absorbance of each
solutionwas measured at 228 nm using
Shimadzu UV-1601 UV/Vis double
beamspectrophotometer and 0.1 N HCl as
reference standard. The standard curvewas
generated for the entire range from 5 to 40
mcg /mL. The results of standardcurve
preparation are shown in the Table 6,7 and
Figure 1&2
Drug –polymer compatiblity results:
The FTIR spectra of pure drug, Eudragit
and tinidazolemicrospheres were shown in
(Fig: 3). It shows that no incompatibility
reactions took place between drug and
excipients.
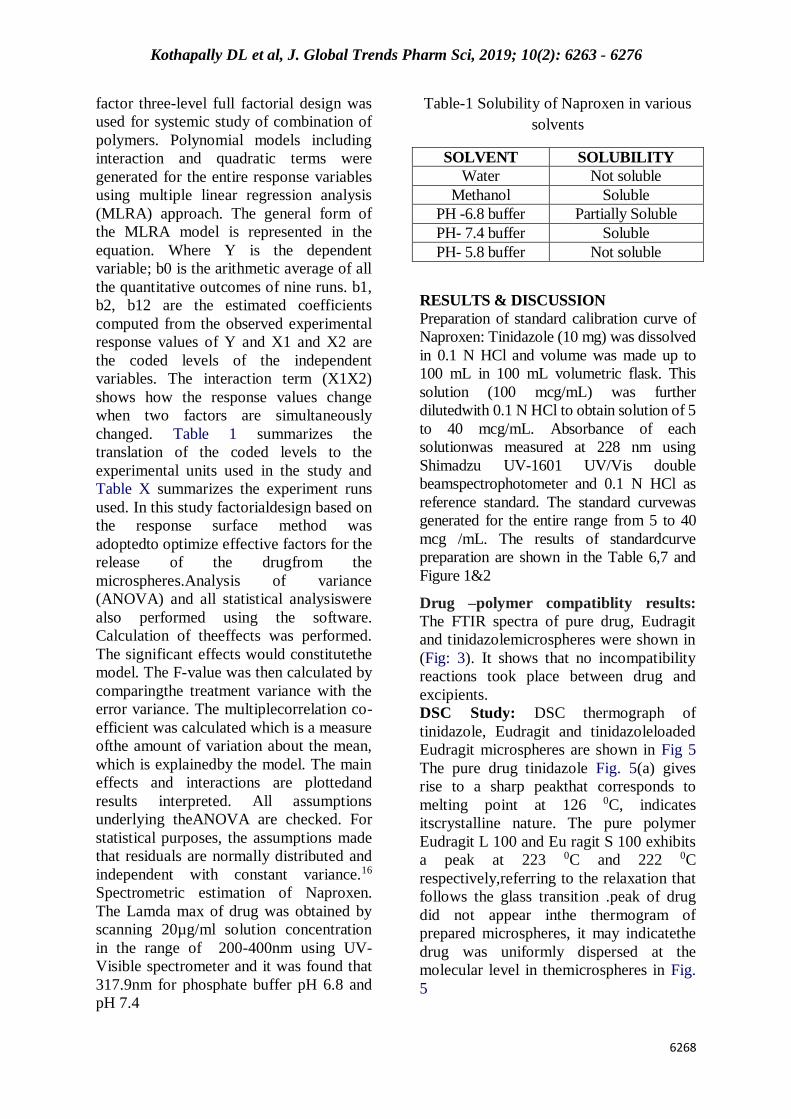
DSC Study: DSC thermograph of
tinidazole, Eudragit and tinidazoleloaded
Eudragit microspheres are shown in Fig 5
The pure drug tinidazole Fig. 5(a) gives
rise to a sharp peakthat corresponds to
melting point at 126 0C, indicates
itscrystalline nature. The pure polymer
Eudragit L 100 and Eu ragit S 100 exhibits
a peak at 223 0C and 222 0C
respectively,referring to the relaxation that
follows the glass transition .peak of drug
did not appear inthe thermogram of
prepared microspheres, it may indicatethe
drug was uniformly dispersed at the
molecular level in themicrospheres in Fig.
5
Kothapally DL et al, J. Global Trends Pharm Sci, 2019; 10(2): 6263 - 6276
6269
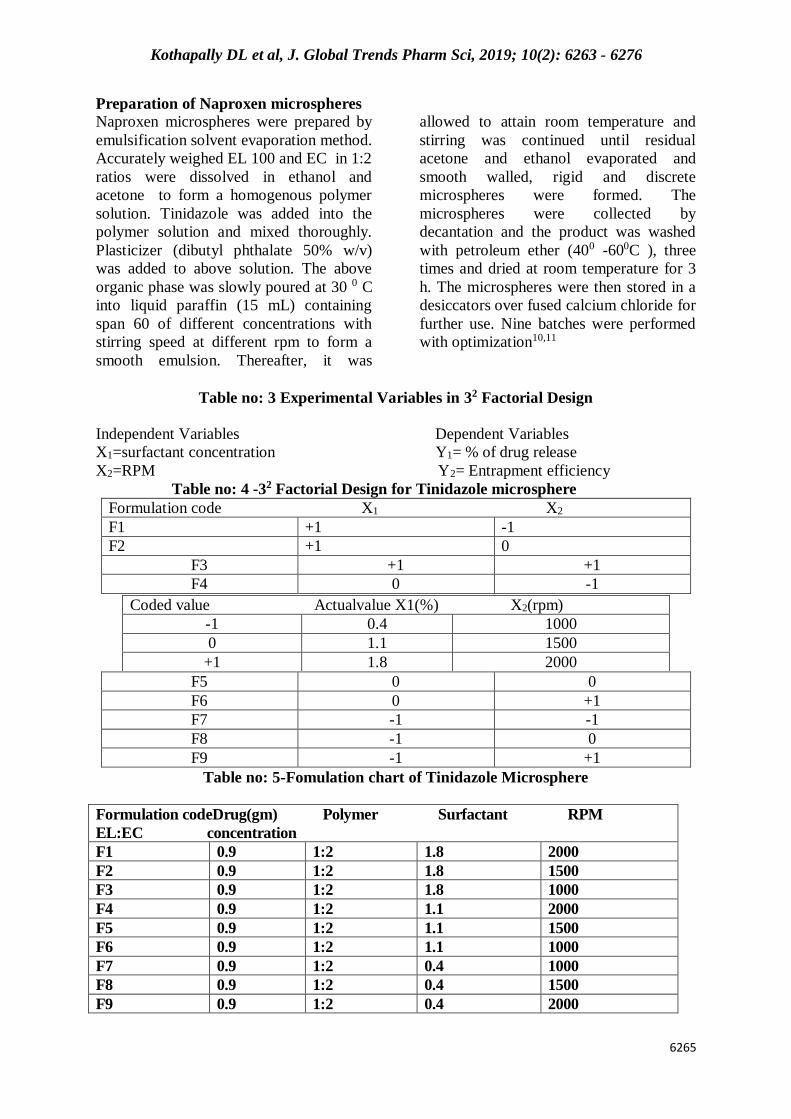
Table-2 Calibration data of Naproxen in
pH 6.8 phosphate buffer at 235nm
Absorbance
II III
Mean
absorbance
2 0.115 0.113 0.115 0.114
4 0.197 0.198 0.195 0.196
6 0.301 0.300 0.303 0.301
8 0.393 0.393 0.391 0.392
10 0.473 0.472 0.474 0.473
12 0.553 0.552 0.553 0.552
Standard curve of Naproxen in pH 6.8
phosphate buffer at 235nm
FTIR RESULTS for Naproxen
DSC RESULTS
Spectra analysis of Naproxen
y = 0.0444x + 0.0277R² = 0.998
0
0.1
0.2
0.3
0.4
0.5
0.6
0 5 10 15
Ab
sorb
ance
Con(µg/ml)

Kothapally DL et al, J. Global Trends Pharm Sci, 2019; 10(2): 6263 - 6276
6270
Micromeritic results
The value of angle of repose of
formulation within therange of 17.43±0.13
to 29.13±0.22 indicating good flow
properties for the microspheres. The bulk
density Values ranged between.0.197±0.53
to0.127±0.43 The tapped density values
ranged between0.219±0.03 and0.299±0.33
(gm/cm3). The Carr’s index values ranged
between28.63±0.03and28.63±0.03 which
can describe by Table 8
In vitro drug release profile
The in vitro release study was carried out
by buffer change method to mimic the GIT
environment. Drug release for the initial 2
h i.e. in 0.1 N HCL, The drug release is
found 91.84% at the end of 8 min pH 7.4
phosphate buffer, shown in Fig.6
Charaterisation of Microsphere of
different batches
Formulat
ion code
Entrapme
nt
efficiency
(%)
Avarage
particle
Mean
Dameter
(µm)
Specifi
c
Surface
area(m
2/g
×10-2)
F1 85.36±0.0
3
656.14±0
.04
1.34
F2 88.44±0.1
3
659.74±0
.02
1.36
F3 89.34±0.1
3
649.12±0
.01
1.34
F4 79.16±0.0 652.31±0 1.36
1 .32
F5 86.79±0.0
3
651.11±0
.31
1.38
F6 88.13±0.1
3
640.11±0
.33
1.38
F7 42.65±0.0
7
652.31±0
.28
1.32
F8 52.65±0.0
7
648.61±0
.18
1.31
F9 49.65±0.0
8
649.65±0
.07
1.32
Table 5.5: FTIR Spectra of Standard and Procured Naproxen
Functional
group
present
Wave Number (cm-1)
Standard Peak
Region
Standard
drug
Procured
drug
(from
figure 13)
Carboxyl
group (-
COOH)
O-H stretch
C=O stretch
C-O stretch
3500-2400
1730-1700
1320-1210
3175
1728
1229
3170.4
1727.91
1229.4
Aromatic ring
C=C-C stretch
1615-1580
1604
1604.48
Ethyl Aryl-O
stretch
Alkyl C-O
stretch
1270-1230
1150-1050
1260
1092
1264.11
1090.55

Kothapally DL et al, J. Global Trends Pharm Sci, 2019; 10(2): 6263 - 6276
6271
OPTIMIZATION RESULTS FOR NAPROXEN MICROSPHERE
ANOVA for Quadratic model
Response 1: EE
Source Sum of Squares df Mean Square F-value p-value
Model 99.37 5 19.87 5.37 0.0986 significant
A-Ethyl Cellulose 0.0523 1 0.0523 0.0141 0.9129
B-PEG 600 19.12 1 19.12 5.16 0.1077
AB 65.93 1 65.93 17.81 0.0243
A² 2.57 1 2.57 0.6939 0.4660
B² 11.70 1 11.70 3.16 0.1736

Kothapally DL et al, J. Global Trends Pharm Sci, 2019; 10(2): 6263 - 6276
6272
ANOVA for Quadratic model
Response 2: Particle Size
Source Sum of Squares df Mean Square F-value p-value
Model 89.01 5 17.80 3.81 0.1500 significant
A-Ethyl Cellulose 0.1980 1 0.1980 0.0424 0.8500
B-PEG 600 79.35 1 79.35 16.99 0.0259
AB 2.81 1 2.81 0.6007 0.4948
A² 5.19 1 5.19 1.11 0.3690
B² 1.46 1 1.46 0.3118 0.6155

Kothapally DL et al, J. Global Trends Pharm Sci, 2019; 10(2): 6263 - 6276
6273
ANOVA for Quadratic model
Response 3: DR%
Source Sum of Squares df Mean Square F-value p-value
Model 842.92 5 168.58 6.92 0.0711 significant
A-Ethyl Cellulose 80.67 1 80.67 3.31 0.1664
B-PEG 600 433.50 1 433.50 17.79 0.0243
AB 56.25 1 56.25 2.31 0.2259
A² 8.00 1 8.00 0.3284 0.6067
B² 264.50 1 264.50 10.86 0.0459
Micromeritic Properties of different batches of Naproxen Microsphere
630
640
650
660
670
F1 F2 F3 F4 F5 F6 F7 F8 F9
EE%
Formulationn
Entrapment Efficiency
Particle MeanDiameter(µm)
620
640
660
680
F1 F2 F3 F4 F5 F6 F7 F8 F9
Dia
me
ter(
µm
)
Formulationn
Particle Diameter(µm)
Particle MeanDiameter(µm)
Batch Angle of
Repose
Bulk
density(gm/cm3)
Tapped
density(gm/cm3)
Carr;s
Index
Hausner
ratio
F1 30.13±0.03 0.177±0.13 0.289±0.13 33.63±0.33 1.21
F2 31.23±0.13 0.189±0.03 0.299±0.33 41.63±0.33 1.03
F3 29.17±0.33 0.187±0.03 0.219±0.03 46.63±0.33 1.33
F4 29.44±0.03 0.147±0.13 0.289±0.03 33.63±0.33 1.25
F5 38.33±0.03 0.177±0.03 0.289±0.03 33.63±0.23 1.26
F6 24.33±0.13 0.185±0.02 0.289±0.03 33.63±0.13 1.22
F7 27.33±0.11 0.167±0.03 0.269±0.03 32.63±0.08 1.13
F8 21.33±0.13 0.188±0.23 0.279±0.03 33.63±0.06 2.03
F9 29.66±0.03 0.186±0.03 0.286±0.03 28.63±0.04 1.06

Kothapally DL et al, J. Global Trends Pharm Sci, 2019; 10(2): 6263 - 6276
6274
In-Vitro Release Profile of Naproxen Microsphere (F1-F3)
In-Vitro Release Profile of Naproxen Microsphere (F4-F6)
In-Vitro Release Profile of Naproxen Microsphere (F7-F9)
0
20
40
60
80
100
120
0 5 10 15
DR
%
Time(hr)
F1
F2
F3
0
20
40
60
80
100
120
0 5 10 15
DR
%
Time(hr)
F4
F5
F6
0
20
40
60
80
100
120
0 5 10 15
DR
%
Time(hr)
F7
F8
F9
Time(h) In-Vitro Release Profile(%)
F1 F2 F3 F4 F5 F6 F7 F8 F9
0.5 10.12 23.33 15.77 12.33 13.33 8.98 23.33 20.12 15.77
1 23.43 43.12 23.11 21.33 33.12 25.12 43.12 33.43 23.11
2 45.31 52.33 34.99 34.77 56.33 45.77 52.33 55.31 34.99
3 68.90 69.95 41.66 45.87 79.95 69.13 69.95 78.90 41.66
6 80.66 78.10 45.99 57.32 88.10 78.13 78.10 86.66 45.99
8 98.11 89.13 53.86 68.98 93.13 86.13 89.13 98.41 53.86
10 - 98.77 65.66 78.42 98.77 95.44 98.77 - 65.66
12 - - 69.33 86.77 99.13 - 69.33

Kothapally DL et al, J. Global Trends Pharm Sci, 2019; 10(2): 6263 - 6276
6275
RELEASE KINETICS OF NAPROXEN MICROSPHERE
TIME %CDR SQARE T LOG T LOG%CDR ARA LOG%ARA
0 0 0 0 0 0 0
1 15.96 1 0 1.203033 84.04 1.924486
2 25.17 1.414214 0.30103 1.400883 74.84 1.874134
3 34.91 1.732051 0.477121 1.54295 65.09 1.813514
4 43.75 2 0.60206 1.640978 56.25 1.750123
5 55.48 2.236068 0.69897 1.744136 44.52 1.648555
6 69.41 2.44949 0.778151 1.841422 30.59 1.485579
7 80.18 2.645751 0.845098 1.904066 19.82 1.297104
8 93.15 2.828427 0.90309 1.969183 6.85 0.835691
Release kinetics Results
Release kinetics was performed for the
optimized batch. In vitro drug release of
check point batch was best explained by
zero order as the plot showed highest
linearity. The pharmaceutical dosage
forms following this profile release the
same amount of drug by unit of time and it
is the ideal method of drug release in order
to achieve a pharmacological prolonged
action.Further, the mechanism of drug
release fitted well with Hixon-crowell
model, indicating sustain release
mechanism. The plots and results of this
study are shown in Figure
CONCLUSION
Eudragit microspheres of tinidazole were
successfullyprepared by emulsion solvent
evaporation technique. Theresults shown
in Table indicates that optimum
concentrationof surfactant (1. 8 ml) and
stirring speed (2000 rpm)showed higher
percent of entrapment efficiency while
changein stirring speed up to optimum
range and change thesurfactant
concentration up to optimum range change
thepercent entrapment efficiency (Table
4).
RFERENCES
1. Philip AK, Philip B. Colon targeted
drug delivery system: a review on
primary and novel approaches.
Oman Med J.2010; 25(2):79-87.
y = 11.239x + 1.4916R² = 0.9961
0
50
100
0 5 10
% C
DR
Time
Zero order kinetics
%CDR
Linear(%CDR)
y = 0.1844x + 0.7344R² = 0.6979
0
1
2
3
0 5 10
Log
% C
DR
Time
First order kinetics
LOG%CDR
Linear(LOG%CDR)
y = 1.4841x + 0.7124…
0
5
-1 0 1Log
% C
DR
log T
Higuchi model
LOG%CDR
Linear(LOG%CDR)
y = 0.6437x + 0.3056R² = 0.9156
0
2
4
0 1 2 3Lo
g %
CD
RSquare T
kores mayer peppas
LOG%CDR

Kothapally DL et al, J. Global Trends Pharm Sci, 2019; 10(2): 6263 - 6276
6276
2. ChourasiaMKandJainSK,“Pharmac
euticalapproachestocolontargeteddr
ugdelivery systems.” J. Pharm. Sci.
2003, 33-66.
3. Chourasia MK and Jain SK,
“Potential of guar gum
microspheres for target specific
drug release to colon.” J. Drug
Targeting. 2004, 12,435-442.
4. Vinay kumar KV, Siva kumar T
and Tamizh mani T, “Colon
targeting drug delivery system: A
review on recent approaches” Int.
J. Pharm. Biomed. Sci. 2011,
2(1),11-19.
5. Choudhury P K, Panigrahi T K,
Murthy P N, Tripathy N K, Behera
S and Panigrahi R, “Novel
Approaches and Developments in
Colon Specific Drug Delivery
Systems- A Review.” Webmed
central com. 2012,1-20.
6. Shendge RS and Sayyad FJ,
“Multiparticulate colon targeted
drug delivery systems: Prospects
and perspectives.”Inventi impact
NDDS, 2012, Issue 1,12-16.
7. Asghar LFA and Chandran S,
“Multiparticulate Formulation
Approach to Colon Specific Drug
Delivery: Current Perspectives.” J.
Pharm. Pharmaceut. Sci. 2006, 9
(3),327-338.
8. Cook W, Quinn ME, Sheskey PJ,
Pectin. In: Raymond RC, Sheskey
PJ and Quinn ME, Handbook of
pharmaceutical excipients, 6th Edn,
Pharmaceutical press and
American pharmaceutical
association, London, 2009, pp478-
479
9. Chang RK, Peng Y, Trivedi N,
Polymethacrylates. In: Raymond
RC, Sheskey PJ and Quinn ME,
Handbook of pharmaceutical
excipients, 6th Edn, Pharmaceutical
press and American pharmaceutical
association, London, 2009, pp525-
533.
10. Pellett MA, Calcium chloride. In:
Raymond RC, Sheskey PJ and
Quinn ME, Handbook of
pharmaceutical excipients, 6th Edn,
Pharmaceutical press and
American pharmaceutical
association, London, 2009, pp89-
90.
11. Yin Hsu F, Ding-Syuan Yu and
Huang CC, “Development of pH-
sensitive pectinate/alginate
microspheres for colon drug
delivery.” J. Mater. Sci: Mater.
Med.2012.
12. Mennini N, Furlanetto S, Cirri M
and Mura P, “Quality by design
approach for developing chitosan-
Ca-alginate microspheres for colon
delivery of celecoxib-
hydroxypropyl-þ-cyclodextrin-PVP
complex.” Eur. J. Pharm.
Biopharm. 2012, 80,67–75.
13. Das S, Chaudhury A and Ka-Yun
N, “Preparation and evaluation of
zinc–pectin– chitosan composite
particles for drug delivery to the
colon: Role of chitosan in
modifying in vitro and in vivo drug
release.” Int. J. Pharm. 2011,
406,11–20.
14. Simi SP, Saraswathi R, Sankar C,
Krisnan PN, Dilip C and Ameena
K, “Formulation and evaluation of
albendazole microcapsules for
colon delivery using chitosan.”
Asian Pacific J. Tropical Medicine.
2010,374-378.
15. Lucinda-Silva RM, Nunes Salgado
HR and Evangelista RC,
“Alginate–chitosan systems: In-
vitro controlled release of
triamcinolone and in-vivo
gastrointestinal transit.” Carbo.
Poly. 2010, 81,260–268.
16. Oliveira GF, Carvalhob LQ and
Evangelista RC, “Chitosan–pectin
multiparticulate systems associated
with enteric polymers for colonic
drug delivery.” Carbo. Poly. 2010,
82, 1004–1009.