journal of hydrology - eth zsewolf/pdf/yao-et-al.2017.joh.pdf · research papers estimation of...
TRANSCRIPT

Journal of Hydrology 553 (2017) 508–526
Contents lists available at ScienceDirect
Journal of Hydrology
journal homepage: www.elsevier .com/locate / jhydrol
Research papers
Estimation of high-resolution terrestrial evapotranspiration fromLandsat data using a simple Taylor skill fusion method
http://dx.doi.org/10.1016/j.jhydrol.2017.08.0130022-1694/� 2017 Elsevier B.V. All rights reserved.
⇑ Corresponding author at: Beijing Normal University, Beijing 100875, China.E-mail address: [email protected] (Y. Yao).
Yunjun Yao a,⇑, Shunlin Liang a, Xianglan Li b, Yuhu Zhang c, Jiquan Chen d, Kun Jia a, Xiaotong Zhang a,Joshua B. Fisher e, Xuanyu Wang a, Lilin Zhang a, Jia Xu a, Changliang Shao d, Gabriela Posse f, Yingnian Li g,Vincenzo Magliulo h, Andrej Varlagin i, Eddy J. Moors j, Julia Boike k, Craig Macfarlane l, Tomomichi Katom,Nina Buchmann n, D.P. Billesbach o, Jason Beringer p, Sebastian Wolf n, Shirley A. Papuga q, Georg Wohlfahrt r,Leonardo Montagnani s, Jonas Ardö t, Eugénie Paul-Limoges n, Carmen Emmel n, Lukas Hörtnagl n,Torsten Sachs u, Carsten Gruening v, Beniamino Gioli w, Ana López-Ballesteros x, Rainer Steinbrecher y,Bert Gielen z
a State Key Laboratory of Remote Sensing Science, Faculty of Geographical Science, Beijing Normal University, Beijing 100875, ChinabCollege of Global Change and Earth System Science, Beijing Normal University, Beijing 100875, ChinacCollege of Resource Environment and Tourism, Capital Normal University, Beijing 100048, ChinadCGCEO/Geography, Michigan State University, East Lansing, MI 48823, USAe Jet Propulsion Laboratory, California Institute of Technology, 4800 Oak Grove Dr., Pasadena, CA 91109, USAfClimate and Water Institute, Research Center of Natural Resources, National Institute of Agricultural Technology (CIRN-INTA), Hurlingham, ArgentinagNorthwest Institute of Plateau Biology, Chinese Academy of Sciences, Xining 810001, ChinahCNR-Institute of Mediterranean Forest and Agricultural Systems, Via Patacca, 85, 80040-Ercolano (Napoli), ItalyiA.N. Severtsov Institute of Ecology and Evolution, Russian Academy of Sciences, Moscow 119071, RussiajWageningen Environmental Research, Wageningen University and Research, Wageningen, The NetherlandskAlfred Wegener Institute for Polar and Marine Research, Telegrafenberg A43, 14473 Potsdam, GermanylCSIRO Land and Water, Floreat W.A. 6014, AustraliamResearch Faculty of Agriculture, Hokkaido University, Sapporo, 060-8589, JapannDepartment of Environmental Systems Science, ETH Zurich, Zurich, SwitzerlandoDepartment of Biological Systems Engineering and School of Natural Resources, University of Nebraska, Lincoln, Nebraska 68583, USAp School of Agriculture and Environment, The University of Western Australia, Crawley, WA 6020, Australiaq School of Natural Resources and the Environment, University of Arizona, Tucson, AZ 85721, USAr Institute of Ecology, University of Innsbruck, Innsbruck 6020, Austrias Faculty of Science and Technology, Free University of Bolzano, Piazza Università 5, Bolzano, Italyt Physical Geography and Ecosystem Science Lund University Sölvegatan 12, SE-223 62 Lund, SwedenuGFZ German Research Centre for Geosciences, Section Remote Sensing, 14473 Potsdam, Germanyv European Commission, Joint Research Centre, Ispra, Italyw Institute of Biometeorology, National Research Council, Via Caproni 8, 50145 Firenze, ItalyxDepartment of Ecology, Faculty of Sciences, University of Granada, Granada, 18071, SpainyKarlsruhe Institute of Technology (KIT), Institute of Meteorology and Climate Research (IMK-IFU), 82467 Garmisch-Partenkirchen, GermanyzCentre of Excellence PLECO, Department of Biology, University of Antwerp, Universiteitsplein 1, B-2610 Wilrijk, Belgium
a r t i c l e i n f o
Article history:Received 7 January 2017Received in revised form 20 July 2017Accepted 10 August 2017Available online 12 August 2017This manuscript was handled by CorradoCorradini, Editor-in-Chief, with theassistance of Magdeline Laba, AssociateEditor
Keywords:Terrestrial evapotranspiration
a b s t r a c t
Estimation of high-resolution terrestrial evapotranspiration (ET) from Landsat data is important in manyclimatic, hydrologic, and agricultural applications, as it can help bridging the gap between existingcoarse-resolution ET products and point-based field measurements. However, there is large uncertaintyamong existing ET products from Landsat that limit their application. This study presents a simple Taylorskill fusion (STS) method that merges five Landsat-based ET products and directly measured ET from eddycovariance (EC) to improve the global estimation of terrestrial ET. The STS method uses a weighted aver-age of the individual ET products and weights are determined by their Taylor skill scores (S). The valida-tion with site-scale measurements at 206 EC flux towers showed large differences and uncertaintiesamong the five ET products. The merged ET product exhibited the best performance with a decrease inthe averaged root-mean-square error (RMSE) by 2–5 W/m2 when compared to the individual products.To evaluate the reliability of the STSmethod at the regional scale, the weights of the STS method for these

Y. Yao et al. / Journal of Hydrology 553 (2017) 508–526 509
Eddy covarianceFusion methodLandsat dataHigh-resolution products
five ET products were determined using EC ground-measurements. An example of regional ET mappingdemonstrates that the STS-merged ET can effectively integrate the individual Landsat ET products. Ourproposed method provides an improved high-resolution ET product for identifying agricultural cropwater consumption and providing a diagnostic assessment for global land surface models.
� 2017 Elsevier B.V. All rights reserved.
1. Introduction Evapotranspiration with Internalized Calibration (Allen et al.,
The latent heat of evapotranspiration (ET), which is the sum ofthe heat flux from the earth’s surface to the atmosphere for soilevaporation, vegetation transpiration and evaporation of waterintercepted by plant canopies, plays an important role in manygeophysical applications (e.g., climatic forecasting, crop yield fore-casting and agricultural water resource management) (Jiménezet al., 2011; Kool et al., 2014; Liang et al., 2010; Wang andDickinson, 2012; Zhang et al., 2009). ET exhibits strong heterogene-ity across the land surface due to complex environmental controlsand biophysical feedback processes (Kalma et al., 2008; Mallicket al., 2009; Yao et al., 2014; Yuan et al., 2010). Large-scale net-works of direct biosphere-atmosphere measurements with theeddy covariance (EC) method have been widely used for site-scale studies. However, such local ET observations cannot repre-sent ET at regional to global scales (Baldocchi et al., 2001; Choiet al., 2009; Kustas and Anderson, 2009; Liu et al., 2016; Xuet al., 2011; Xu et al., 2016;Yao et al., 2015).
Remote sensing has provided us with an effective way to obtainspatially and temporally continuous ET data at a regional scale.Currently, there are various moderate spatial resolution satellite-based ET products available, such as the Moderate ResolutionImaging Spectroradiometer (MODIS) product (MOD16), which has1 km and 8 day of spatial and temporal resolution, respectively(Mu et al., 2007, 2011) or the EUMETSAT Satellite Application Facil-ity on Land Surface Analysis (LSA-SAF) product (LSA-SAF MSG)(Ghilain et al., 2011, 2012) with 5 km spatial resolution and dailytemporal resolution. However, validation results with direct mea-surements indicate that the MOD16 and LSA-SAF MSG ET productstend to consist of uncertainties at most FLUXNET flux tower sites(Chen et al., 2014; Hu et al., 2015; Kim et al., 2012). Other ET prod-ucts (including reanalysis and data assimilation datasets), such asthe European Centre for Medium-Range Weather Forecasts(ECMWF) ERA-40 reanalysis (Uppala et al., 2005) and the GlobalLand Data Assimilation System (GLDAS) datasets, have high tempo-ral resolution (daily) but rather coarse spatial resolution (�0.5�)(Kumar et al., 2006; Rodell et al., 2004). This relative coarse spatialresolution of global ET products limits the representation of theheterogeneous terrestrial biosphere.
The Landsat multispectral data record from the Thematic Map-per (TM) and the Enhanced Thematic Mapper Plus (ETM+) are valu-able data sources for producing ET product at rather high spatialresolution (�30 m) (Ju and Roy, 2008). They can also bridge thegap between existing coarse-resolution ET products and point-based field measurements and be used to validate coarse-resolution data. Various Landsat-based ET algorithms, roughly clas-sified as VNIR (visible and near infrared)-based remote sensingmethods and TIR (thermal infrared)-based remote sensing meth-ods, have been developed to estimate regional ET (Kalma et al.,2008; Li et al., 2009). VNIR-based remote sensing methods includesome empirical/statistical models (Glenn et al., 2008; Jung et al.,2010; Wang et al., 2007; Wang and Liang, 2008) and Penman-Monteith (PM)/Priestley-Taylor (PT) methods (Fisher et al., 2008;Jin et al., 2011; Mu et al., 2007, 2011; Priestley and Taylor, 1972;Yao et al., 2013), which usually use remotely sensed normalizeddifference vegetation index (NDVI) or leaf area index (LAI) to esti-mate ET. TIR-based remote sensing methods, such as the Mapping
2007), the two-source model (Anderson et al., 1997; Kustas andNorman, 1999; Norman et al., 1995), Surface Energy Balance Sys-tem (Su, 2002), Surface Energy Balance Algorithm for Land(Bastiaanssen et al., 1998), and the surface temperature versus veg-etation index triangle/trapezoid space (Jiang and Islam, 1999; Longand Singh, 2012; Tang et al., 2010; Zhang et al., 2005), calculate ETas the residual of surface energy balance (SEB) or PT method fromTIR-derived land surface temperatures (LST). Although these meth-ods provide reasonable ET estimates for Landsat data, they stillhave large uncertainties in regional ET simulations because of dif-ferent model structures and environmental variables employed(Chen et al., 2014; Choi et al., 2009; Liaqat and Choi, 2015; Liuet al., 2011; Liu et al., 2013).
This issue has been partially resolved by several data fusionmethods, such as Bayesian model averaging (BMA) and empiricalorthogonal function (EOF), which merge multiple ET products toimprove regional ET estimation (Feng et al., 2016; Yao et al.,2014, 2016; Zhu et al., 2016). For example, Yao et al. (2014) usedthe BMA method by merging five ET products to enhance daily ETestimates with smaller root mean square errors (RMSEs) than thoseof the individual products. Zhu et al. (2016) also documented thatthe BMAmethod by merging four ETmodels across north China hasthe advantage of generating more skillful and reliable predictionsthan the simple model averaging (SMA) scheme. Similarly, Fenget al. (2016) reported that the EOF fusion method was capable ofintegrating the two satellite-based ET datasets with improved con-sistency and reduced uncertainties. However, the complex struc-tures of these fusion methods, which affect their computationalefficiency for calculating the weightings for individual datasets,can limit their wide application.
To reduce the complexity of the fusion method and to generateglobal ET products with high spatial resolution, in this study wedeveloped a simple Taylor skill fusion (STS) method by mergingfive Landsat-based ET products produced by the individual algo-rithms and FLUXNET eddy covariance (EC) observations to improveterrestrial ET estimation. The objectives of this study are threefold:(1) to evaluate five Landsat-based ET datasets derived from fiveclassic ET algorithms using global long-term FLUXNET measure-ments from 206 flux tower sites; (2) to apply and validate theSTS method for five Landsat-based ET datasets to improve terres-trial ET estimation; and (3) give an example of mapping terrestrialET using the STS method and Landsat data.
2. Data
2.1. Landsat-based ET products
We produced the individual Landsat-based ET products usingfive classic ET algorithms. We only used five traditional Landsat-based ET products derived from VNIR-based remote sensing meth-ods in this article because there are some disadvantages whenapplying TIR-based remote sensing methods to ET estimations atthe global scale (Hope et al., 2005; Su, 2002). The forcing dataincludes Landsat NDVI data with 30 m spatial resolution and dailyModern Era Retrospective Analysis for Research and Applications(MERRA) meteorological data with 1/2 � 2/3 degree spatial resolu-

510 Y. Yao et al. / Journal of Hydrology 553 (2017) 508–526
tion. All coarse resolution MERRA data were spatially interpolatedinto 30 m using the method described by Zhao et al. (2005). Theo-retically, this spatial interpolation method improves the accuracyof meteorological data for each 30 m pixel because it uses a cosinefunction and the four MERRA cells surrounding a given pixel toremove sharp changes from one side of a MERRA boundary to theother (Zhao et al., 2005). The individual ET products (Table 1) arebriefly described below.
2.1.1. RS-PM ET productThe RS-PM ET product was produced based on a revised remote
sensing-based PM (RS-PM) algorithm (Monteith, 1965) modifiedfrom the Mu et al. (2007) algorithm (Appendix A). The input vari-ables include daily surface net radiation (Rn), relative humidity(RH), air temperature (Ta), and vapor pressure (e) from MERRA dataand LAI derived from Landsat NDVI data. The RS-PM ET product has30 m spatial resolution. The product has a 16-day temporal resolu-tion inherited from the Landsat data in the same time and filledvalues with �9999 are assigned for cloudy pixels. The product isglobal in coverage spanning 1998–2010 and future years are pro-duced periodically.
2.1.2. SW ET productThe Shuttleworth-Wallace dual-source (SW) model
(Shuttleworth and Wallace, 1985) was adopted to generate theSW ET product. The SW model accounts separately for the energybalance for vegetation and soil components of a soil-vegetationcanopy unity (Hu and Jia, 2015; Sellers et al., 1992; Shuttleworthand Wallace, 1985) (Appendix A). The SW ET product requires Rn,RH, Ta, e, and wind speed (WS) from MERRA data and LAI derivedfrom Landsat NDVI data. The SW ET product has global coverageduring the period of 1995–2009 at 30 m spatial resolution and16-day temporal resolution. The ET values for cloudy pixels are alsoset as �9999.
2.1.3. PT-JPL ET productThe PT-JPL ET product was produced using a novel PT algorithm
developed by Fisher et al. (2008). This algorithm (PT-JPL) considersthe effects of both atmosphere and ecophysiology to derive con-straints representing vegetation conductance without using anyground-based observed data (Appendix A). The input variablesare Rn, RH, Ta, e, and vegetation parameters (NDVI, LAI and absorbedphotosynthetically active radiation (FPAR)) derived from LandsatNDVI data. The PT-JPL ET product is available from 1998 to 2010globally and with 16-day temporal and at 30 m spatial resolution.
2.1.4. MS-PT ET productThe MS-PT ET product was generated based on the modified
satellite-based PT (MS-PT) model developed by Yao et al. (2013)and this model uses the apparent thermal inertia (ATI) derivedfrom diurnal air temperature range (DT) to parameterize surfacesoil moisture (SM) constraints (Appendix A). The MS-PT ET product
Table 1Summary of the Landsat ET products generated in this study for 2000–2009.
ET products Spatial resolution Temporal resolution Time Period Algorithms
RS-PM 30 m 16-day 1998–2010 Remote sensSW 30 m 16-day 1995–2009 ShuttleworthPT-JPL 30 m 16-day 1998–2010 Priestley-TayMS-PT 30 m 16-day 1997–2009 Modified satSIM 30 m 16-day 1998–2009 Simple hybr
only requires Rn, Ta, DT from MERRA data and NDVI from Landsatdata as inputs. The MS-PT ET product is generated at the samespatial resolution, temporal resolution, coverage period, and fillingvalues as the PT-JPL ET product for the period of 1997–2009.
2.1.5. SIM ET productA simple hybrid ET (SIM) formulation presented by Wang and
Liang (2008) is used in this study to generate the SIM ET product;further, the SIM algorithm partitions the Rn by introducing Ta, NDVI,DT and prior parameters (Appendix A). The SIM ET product is alsoavailable at 30 m spatial and 16-day temporal resolution over theglobal land surface from 1998 to 2009. The data processing stepincludes MERRA interpolation to the target grid size of 30 m.
2.2. Eddy covariance data
Five Landsat-based ET products and the STS fusion method wereevaluated and validated using a large data set of ground-measuredflux data. The data from 206 EC flux tower sites were provided byAmeriFlux, ChinaFlux, LathuileFlux, AsiaFlux, Arid/Semi-aridexperimental observation synergy network of China, Chineseecosystem research network (CERN), Asian AutomaticWeather Sta-tion Network (ANN), Swiss FluxNet and several individual principalinvestigators (PIs) of FLUXNET network. These EC flux tower sitesare mainly located in Europe, North America, and Asia, with threesites in Australia, four sites in South America and three sites inAfrica (Fig. 1). The sites cover 10 global plant functional types(PFTs): deciduous broadleaf forest (DBF, 28 sites), deciduousneedleleaf forest (DNF, 2 sites), evergreen broadleaf forest (EBF,13 sites), evergreen needleleaf forest (ENF, 54 sites), mixed forest(MIF, 10 sites), cropland (CRO, 31 sites), grassland (GRA, 36 sites),savanna (woody savanna and savanna) (SAW, 8 sites), shrubland(open, closed) (SHR, 13 sites) and wetland (WET, 11 sites). TheseEC flux tower sites were separated into two separate subsets forthe merging algorithm calibration (103 sites) and validation (103sites), each representing major global PFTs. These EC data coveredthe period of 2000–2009 (each tower to varying extent) and coverat least one growing season.
The half-hourly and hourly EC measurements (ET; sensible heatflux, H) were processed based on a method of gap filling and qual-ity control that used both the covariance of surface fluxes withmeteorological parameters and the temporal variations in surfacefluxes (Reichstein et al., 2005). These turbulent fluxes were com-plemented by measurements of Rn and soil heat flux (G). If lessthan 30% of the total data are missing, the daily values for Rn, ET,H and G were calculated the averages of the ground-measurements. Else, the daily value was set as invalid value (-9999). Because turbulent EC measurements are susceptible toincomplete energy balance closure (Leuning et al., 2012), we cor-rected the daily ET using the method proposed by Twine et al.(2000).
ETc ¼ ðRn � GÞ=ðHu þ ETuÞ � ETu ð1Þ
Forcing Inputs of the ETproducts
MERRA Landsat
ing-based Penman-Monteith algorithm Rn, RH, Ta, e NDVI-Wallace dual-source model Rn, RH, Ta, e, WS NDVIlor algorithm of Jet Propulsion Laboratory, Caltech Rn, RH, Ta, e NDVIellite-based Priestley-Taylor algorithm Rn, Ta, DT NDVIid algorithm Rn, Ta, DT NDVI

Fig. 1. Locations of the flux tower sites used to merge ET algorithm calibration (103 sites) and validation (103 sites).
Y. Yao et al. / Journal of Hydrology 553 (2017) 508–526 511
Accordingly, ETc is the corrected ET, and Hu and ETu are theuncorrected H and ET, respectively.
3. Methods
3.1. Simple Taylor skill fusion method
A simple Taylor skill fusion (STS) method is developed to mergethe five Landsat-based ET products into a single ET product. The STSfusion method uses a weighted average of all the Landsat-based ETproducts and the weights are determined by their Taylor skillscores (S) (Taylor, 2001). The S value of each ET product is calcu-lated using the direct EC ground-measurements for reference.The weights for all ET products sum up to one and the weightsare proportional to the S values of the five ET products. Thus, theweights can be expressed as:
Wi ¼ Si=Xni¼1
Si ð2Þ
Si ¼ 4ð1þ RiÞ4ðdi þ 1=diÞ2ð1þ RmaxÞ4
ð3Þ
where Wi is the weight for ET product i, Si is the Taylor skill score ofET product i and n is the number of ET products (n = 5 in this study).Ri is the correlation coefficient between the estimated ET for pro-duct i and the EC ground-measured ET. Rmax is the maximum corre-lation coefficient that is set to 1.0 in this study. di is the ratio of thestandard deviation of the estimated ET for product i to the standarddeviation of the corresponding EC ground-measured ET. S variesfrom zero (least skillful) to one (most skillful). The STS methodensures that the merged ET product has the maximal R2 and mini-mal error variance.
3.2. Assessment methods
R2, S, the root-mean-square error (RMSE) and the bias are usedto assess the performance of the STS method and the individualET products. R2 measures the agreement between satellite-basedestimated and ground-measured ET. RMSE characterizes the close-ness of the estimation and observations and is calculated as:
RMSE ¼ffiffiffiffiffiffiffiffiffiffiffiffiffiffiffiffiffiffiffiffiffiffiffiffiffiffiffiffiffiffiffiffi1N
XNj¼1
ðEj � OjÞ2vuut ð4Þ
Where N is the number of samples, Ej is the estimated ET forsample j and Oj is the EC ground-measured ET for sample j. The biasis also a metric to evaluate the predictive skill and it reflectsthe difference between the average of the estimation andobservations.
Bias ¼ 1N
XNj¼1
ðEj � OjÞ ð5Þ
4. Results and discussion
4.1. Validation of Landsat-based ET products
To assess the accuracy of the five Landsat-based ET products,the estimated ET from five Landsat-based ET products were directlycompared with EC ground- measurements at all 206 flux towersites for different PFTs. At the site scale, large differences werefound in the five Landsat-based ET products among different PFTs(Fig. 2). For both DBF and MIF sites, the RS-PM ET product has thelargest S (>0.74) and R2 (>0.73, p < 0.01) compared to the other fourET products, whereas the MS-PT ET product has the smallest RMSE(29.4 W/m2 for DBF and 20.4 W/m2 for MIF) and bias (<8 W/m2).For both ENF and WET sites, the SW ET product exhibits highest S(0.48 for ENF and 0.62 and WET) and the smallest RMSE (30.1 W/m2 and 22.3 W/m2). For all of the SAW sites, both RS-PM and SWET products have the highest accuracy with an average S of 0.68and average RMSE of approximately 20W/m2. The MS-PT ET pro-duct exhibits the highest S (>0.57) with an RMSE of less than25.5 W/m2, and R2 (>0.65) with a confidence level of p < 0.05 forboth EBF and CRO sites. For GRA and SHR sites, the SIM ET productwith the low RMSE of less than 26.3 W/m2 presents the highest S(>0.59) and R2 (>0.58, p < 0.05) compared to others. Most ET prod-ucts (excluding SW ET product) have the highest S and (more than0.68) and R2 (more than 0.66, p < 0.05) with the lowest averageRMSEs, less than 22 W/m2 for all of the DNF sites, compared tothose for the other land cover types. This may caused by a fewsamples for only 2 DNF sites artificially to highlight the good per-formance of these ET products. When we selected equal samplesfor all of the land cover types, most ET products still provide betterfits to the flux tower observations for DNF sites. According to the Svalues, the accuracies of both MS-PT and SIM ET products are thehighest for all ENF sites. Although the PT-JPL ET product does notresult in the highest S, it still has good accuracy for the variety ofvegetation types. Moreover, we found that none of the individual
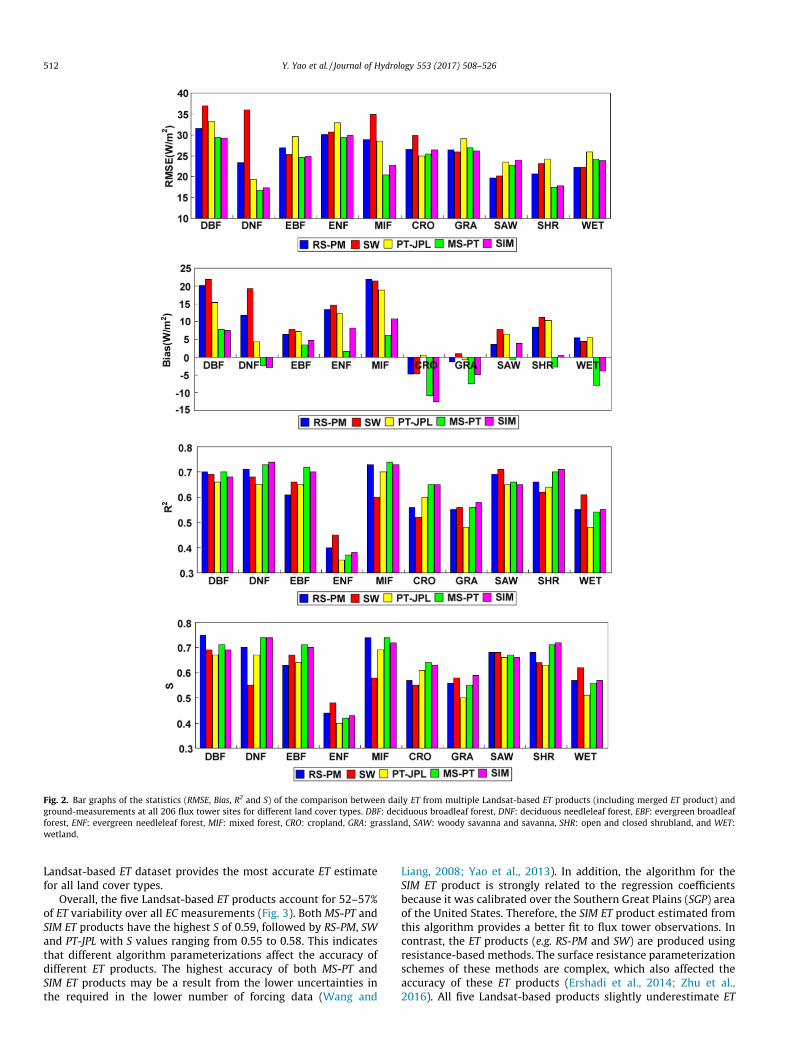
Fig. 2. Bar graphs of the statistics (RMSE, Bias, R2 and S) of the comparison between daily ET from multiple Landsat-based ET products (including merged ET product) andground-measurements at all 206 flux tower sites for different land cover types. DBF: deciduous broadleaf forest, DNF: deciduous needleleaf forest, EBF: evergreen broadleafforest, ENF: evergreen needleleaf forest, MIF: mixed forest, CRO: cropland, GRA: grassland, SAW: woody savanna and savanna, SHR: open and closed shrubland, and WET:wetland.
512 Y. Yao et al. / Journal of Hydrology 553 (2017) 508–526
Landsat-based ET dataset provides the most accurate ET estimatefor all land cover types.
Overall, the five Landsat-based ET products account for 52–57%of ET variability over all EC measurements (Fig. 3). Both MS-PT andSIM ET products have the highest S of 0.59, followed by RS-PM, SWand PT-JPL with S values ranging from 0.55 to 0.58. This indicatesthat different algorithm parameterizations affect the accuracy ofdifferent ET products. The highest accuracy of both MS-PT andSIM ET products may be a result from the lower uncertainties inthe required in the lower number of forcing data (Wang and
Liang, 2008; Yao et al., 2013). In addition, the algorithm for theSIM ET product is strongly related to the regression coefficientsbecause it was calibrated over the Southern Great Plains (SGP) areaof the United States. Therefore, the SIM ET product estimated fromthis algorithm provides a better fit to flux tower observations. Incontrast, the ET products (e.g. RS-PM and SW) are produced usingresistance-based methods. The surface resistance parameterizationschemes of these methods are complex, which also affected theaccuracy of these ET products (Ershadi et al., 2014; Zhu et al.,2016). All five Landsat-based products slightly underestimate ET

Fig. 3. Scatterplots of the daily ET from multiple Landsat-based ET products and ground-measurements at all 206 flux tower sites.
Y. Yao et al. / Journal of Hydrology 553 (2017) 508–526 513
compared to the measurements, which can be explained by thefact that the algorithms for producing these products are originallydeveloped based on the MODIS data.
Fig. 4. Weights for five Landsat-based ET products at the 103 calibration towersites.
4.2. Merging of the Landsat-based ET products
4.2.1. Calibration against tower measurementsTo merge five Landsat-based ET products according to the STS
method, the data collected at the 103 merging algorithm calibra-tion sites were considered as calibration data to determine weightsfor the individual ET products. Fig. 4 presents the weights for thefive Landsat-based ET products based on EC ground-measurements. Both MS-PT and SIM ET products have the highestweight of 20.5%, followed by RS-PM (20.2%) and SW (19.5%) ETproducts. In contrast, the weight for PT-JPL ET products is only19.3%, indicating its contribution to the merged ET estimates isthe smallest than for those of the other products. Although previ-ous studies showed that the PT-JPL algorithm driven by the MODISvegetation variables had the best performance compared to the PMalgorithm (Ershadi, et al., 2014; Yao et al., 2013), our result illus-trates that the PT-JPL algorithm driven by the Landsat vegetationvariables has the worst performance compared to other four algo-
rithms (RS-PM, SW, MS-PT and SIM). This may be caused by thespectral reflectance difference between Landsat and MODIS data,which resulted in the difference between Landsat and MODIS veg-etation variables (e.g. NDVI) (Jia, et al., 2012).
The statistical summaries of the STS method performance forthe 103 calibration sites among different land cover types are plot-ted in Fig. 5. One can notice that the STS-based ET estimation fordifferent land cover types have higher S and lower RMSEs

Fig. 5. Same as Fig. 2 but for the 103 calibration tower sites. The merged ET was calculated using the weights for five Landsat-based ET products at the 103 calibration towersites.
514 Y. Yao et al. / Journal of Hydrology 553 (2017) 508–526
compared to the individual Landsat-based ET products at the sitescale. For 27 ENF calibration sites, the STS method has a higher Sof 0.47 and R2 of 0.43 (p<0.05) and a lower RMSE of 27.8 W/m2 thanindividual ET products, though it presents the worst performancethan those at other land cover types. For 6 WET calibration sites,the STS method shows better performance than single ET products,with lower RMSEs of 22.4 W/m2 and higher S of 0.68. Similarly, theRMSEs of the STS-based ET estimation versus EC ground-measurements at 70 other calibration sites are all less than25W/m2 and the S values are all more than 0.7. Fig. 6 comparesdaily ET observations at all 103 calibration sites and ET estimatesfor the different ET products. The results show that the merged
ET product has the best performance with the highest S of 0.66and the lowest RMSE of 23.8 W/m2, compared to the other prod-ucts. This indicates that a reasonable choice of fusion method isfeasible to improve the accuracy of Landsat-based ET estimationby combining EC ground-measurements and multiple ET products.
4.2.2. Validation against EC measurementsThe performance of the STS method for the validation tower set
is similar to the results from the merging algorithm calibrationtower set (Fig. 7), though the S and R2 statistics for the partial val-idation set (e.g. DBF, ENF) are slightly smaller than the mergingalgorithm calibration set. The RMSE of the merged daily ET for dif-

Fig. 6. Scatterplots of the daily ET from multiple Landsat-based ET products (including merged ET product) and ground-measurements at the 103 calibration tower sites.
Y. Yao et al. / Journal of Hydrology 553 (2017) 508–526 515
ferent land cover types varies from 11.2 W/m2 to 32.4 W/m2, the R2
varies from 0.45 to 0.86, and the S is greater than 0.7 (excludingENF and WET). The merged ET decreases the RMSE by �2W/m2
for forests, cropland and grassland sites and �3W/m2 for othersites, and increases the S by approximately 0.03 and increasedthe R2 by more than 0.02 (p<0.05).
Fig. 8 illustrates a time series for clear-sky daily ground-measurements and estimated ET from multiple datasets for differ-ent land cover types. In comparison to the single Landsat-based ETproducts, the merged ET based on the STS fusion method producesseasonal ET variations that are closest to the ground-observedvalues. Overall, the S (R2) and RMSE of the merged ET wereapproximately 5% higher and 8% lower than those of the bestLandsat-based ET product, respectively (Fig. 9). The STS fusionmethod reduced the errors of the estimated ET by adjusting theweights of the single products through incorporation of ECground-measurements.
4.2.3. Implementation of merging the ET productsTo merge the five Landsat-based ET products to generate a new
ET dataset, we obtained the weights of the STSmethod using five ET
products and all EC ground-measurements. Fig. 10 demonstratesthe weights of different Landsat-based ET products when mergingthe ET, which is similar to the weights from the merging algorithmcalibration tower subset. One notices that the relative contribu-tions differ considerably for five Landsat-based ET products. Thegreatest contributors to the merged ET are both MS-PT and SIM,contributing 20.5%, followed by RS-PM (20.1%), SW (19.8%) andPT-JPL (19.1%).
Fig. 11 shows scatter plots of a comparison between dailymerged and ground-measured ET using ground observation dataat all 206 flux tower sites. The RMSE of the merged ET at the sitescale is 25.1 W/m2, the bias is 5.4 W/m2, the S is 0.61 and the R2
is 0.60 (p < 0.05). In comparison to the other five Landsat-basedET products, the merged ET product yields the highest accuracy(Fig. 3). Fig. 12 illustrates that the error histograms for the singleLandsat-based ET products are more biased compared to the ECobservations, whereas the merged ET using the STSmethod is morecentered around zero. A substantial number of previous studiesreported that the errors of the estimated ET from remotely senseddata is approximately 15–30% (Jung et al., 2010; Wang andDickinson, 2012; Yao et al., 2014) and the overall error of the

Fig. 7. Same as Fig. 2 but for the 103 validation tower sites for different land cover types. The merged ET was calculated using the weights for five Landsat-based ET productsat the 103 calibration tower sites.
516 Y. Yao et al. / Journal of Hydrology 553 (2017) 508–526
merged ET based on the STS method is approximately 10%. There-fore, the accuracy of the merged ET in this study can be applied toproduce global terrestrial Landsat-based ET product.
4.3. A case study of mapping regional ET
To map the regional ET from the Landsat-based ET products, weselected an example from the Landsat data of a 1.4 by 1.2 kmregion (33.77 �N-33.88 �N and 117.94 �E-118.09 �E) that mainlyincluded cropland to map daily ET (Fig. 13). Fig. 13 also showsthe corresponding spatial patterns in NDVI for August 12, 2005,
along with the associated frequency histogram. High vegetationcover fraction occurred on August 12 owing to rapid crop growth.
In Fig. 14, the spatial pattern of ET from each product is illus-trated along with a histogram showing the frequency distributionof values within the simulation domain. The maps of ET arestrongly positively correlated with the NDVI (R2 of more than0.91), which may be explained by the fact that higher vegetationtranspiration where there is a higher vegetation fractional cover.In terms of overall magnitude and spatial pattern, there are obvi-ous differences among the multiple Landsat-based ET products.In general, the merged ET has an intermediate ET value with a his-

Fig. 8. Example of a time series for daily ET as ground-measured and estimated using different Landsat-based ET products (including merged ET product) at ten validationsites. The merged ET was calculated using the weights for five Landsat-based ET products at the 103 calibration tower sites.
Y. Yao et al. / Journal of Hydrology 553 (2017) 508–526 517
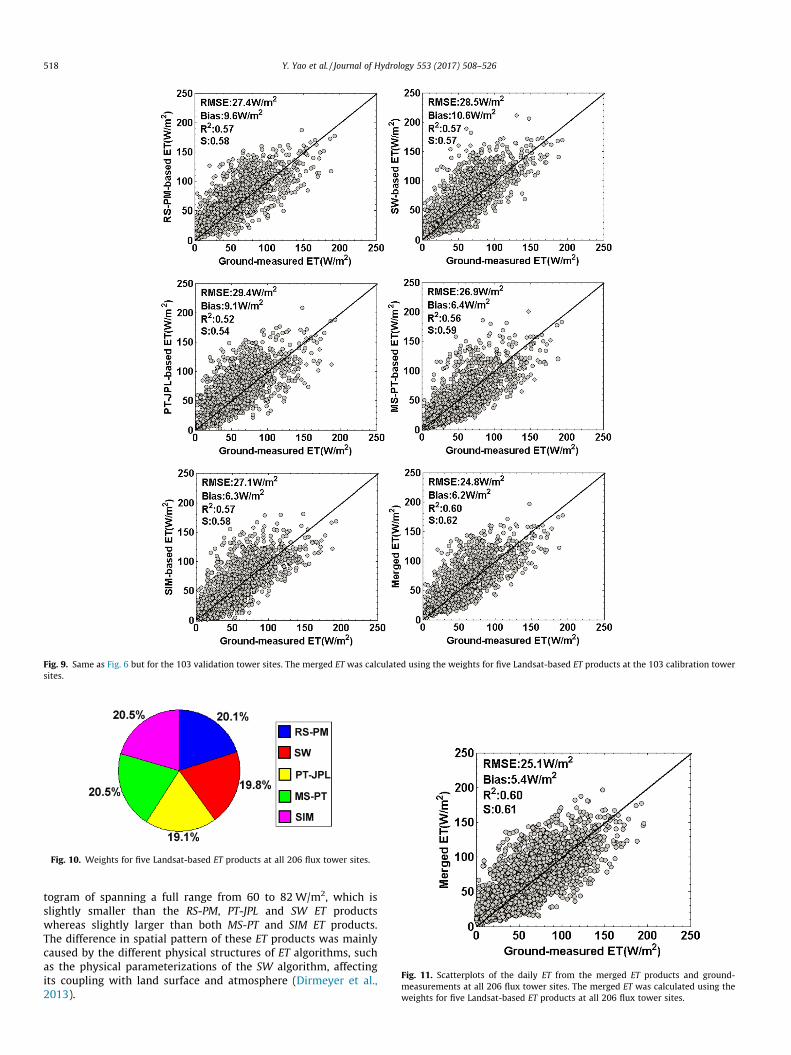
Fig. 9. Same as Fig. 6 but for the 103 validation tower sites. The merged ET was calculated using the weights for five Landsat-based ET products at the 103 calibration towersites.
Fig. 10. Weights for five Landsat-based ET products at all 206 flux tower sites.
Fig. 11. Scatterplots of the daily ET from the merged ET products and ground-measurements at all 206 flux tower sites. The merged ET was calculated using theweights for five Landsat-based ET products at all 206 flux tower sites.
518 Y. Yao et al. / Journal of Hydrology 553 (2017) 508–526
togram of spanning a full range from 60 to 82W/m2, which isslightly smaller than the RS-PM, PT-JPL and SW ET productswhereas slightly larger than both MS-PT and SIM ET products.The difference in spatial pattern of these ET products was mainlycaused by the different physical structures of ET algorithms, suchas the physical parameterizations of the SW algorithm, affectingits coupling with land surface and atmosphere (Dirmeyer et al.,2013).

Fig. 12. Error histograms for daily ET derived from five Landsat-based ET products, and the merged ET product for all 206 flux tower sites.
Y. Yao et al. / Journal of Hydrology 553 (2017) 508–526 519
4.4. Discussion
4.4.1. Uncertainties of the merged ET estimates4.4.1.1. Input errors. The varied accuracies of the merged ET pro-duct were affected by the input errors of the STS fusion method,which refers to the errors from the individual Landsat-based ETproducts and EC ground-measurements. The individual Landsat-based ET products are estimated using the meteorological variablesfrom MERRA data and vegetation parameters derived from Landsatdata. Previous studies showed that no single reanalysis dataset issuperior to others in terms of meteorological variables (Ta, RH, eand WS) to estimate land surface energy budgets (Shi and Liang,2014; Wang and Zeng, 2012; Zhu et al., 2012). Recent studiesrevealed large bias for MERRA data when compared to ground-measurements (Rienecker et al., 2011; Zhao et al., 2006). Yaoet al. (2015) found that daily Rn from MERRA tended to underesti-mate at high values compared to ground-measurements. In addi-tion, there also exist large biases in the vegetation parameters(e.g. LAI) retrieved from Landsat data (Ganguly et al., 2012).Eklundh et al. (2003) reported that Landsat data can only explain50–80% of the variation in LAI for coniferous forests. Thus, the
uncertainty from the individual and merged ET products could beinherited through errors from bothMERRA and Landsat data inputs.
The errors of the EC ground-measurements determine the accu-racy of the merged ET product because ground-measured ET is con-sidered as the ‘‘true” value for calibrating the individual products.Although EC measurements are relatively accurate for ET acquisi-tion, approximately 5–20% still exist (Foken, 2008). Moreover,there could be inaccuracies in interpreting their values owing tothe energy imbalance in the EC method (Mahrt, 2010). Foken(2008) pointed out that the EC method can only capture smalleddies and ignore large eddies in the lower boundary layer, whichinfluence the energy imbalance. Although we used the methodproposed by Twine et al. (2000) to correct the ET, currently noagreements or protocols have been reached for the causes and cor-rections of energy imbalance from eddy covariance measurement(Leuning et al., 2012; Wohlfahrt et al., 2009). These corrections stillcause large errors of EC measurements (Finnigan et al., 2003;Twine et al., 2000). Thus, input errors of the EC measurementsand error propagation through calculations, including EC data cor-rection, gridded interpolation and different data fusion, all con-tribute to the uncertainties of the merged ET product.

Fig. 13. (a) An example of a partial region of Landsat imagery with a false-color composite on August 12, 2005; (b) NDVI maps for August 12, 2005, and (c) frequencyhistograms for NDVI on August 12, 2005.
520 Y. Yao et al. / Journal of Hydrology 553 (2017) 508–526
4.4.1.2. Scaling effects. The error of the merged ET product intro-duced by the spatial mismatch between the flux tower site foot-prints and the individual Landsat-based ET pixel footprints is animportant issue. The footprint of the flux tower site is approxi-mately several hundred meters while the spatial resolution of theindividual Landsat-based ET products is only 30 m (Baldocchi,2008; McCabe and Wood, 2006). Directly using EC ground-measured ET as ‘‘true” value to merge the individual Landsat-based ET products would lead to large uncertainties in the mergedET estimates.
To investigate the impact of the resample scale of the individualLandsat-based ET products to the accuracy of the merged ET, weaveraged the daily ET from different Landsat-based ET productsby use of a 30-570 m window. Compared with the original ET esti-mates at 30 m, a substantial drop in ET estimation errors occurredwhen products were aggregated to slightly coarser resolutions(Fig. 15). With an increase in window size, a rise in estimationerrors appeared owing to the surface heterogeneity in ET. Whenspatial resolution arrived at 450 m, which is much larger than thatof TM (30 m), the individual and merged ET products had thesmallest RMSE. This supports the expectation that differences inthe resample scales owing to the higher surface heterogeneitydirectly influences the accuracy of the merged ET.
4.4.1.3. Fusion method. In the case of high-level data fusion for ter-restrial ET, the STS method constrains the error of the fused ET byintroducing EC ground-measurements to adjust the weights forthe individual Landsat-based ET products. To quantify the errorsof the different fusion methods, experiments with the same inputshave been performed for different fusion models, including Multi-ple Linear Regression (MLR), Simple Model Averaging (SMA), Baye-
sian Model Averaging (BMA) (Raftery et al., 1997), SupportedVector Machine (SVM) (Vapnik, 1999), Multivariate AdaptiveRegression Splines model (MARS) (Friedman, 1991), Random ForestRegression (RFR) (Breiman, 2001) and the STS method. The resultsof the leave-one-out cross-validation illustrated that the largestabsolute differences in RMSE and R2 of ET between the STS methodand other fusion methods are relatively low, by approximately1.0 W/m2 and 0.02 respectively (Table 2). Further, the STS pro-duced comparable accuracy but reduced the complexity of thefusion algorithm to improve computational efficiency when com-pared with other advanced fusion methods, indicating that theSTS method can effectively achieve the goal of ET products integra-tion in this study.
Although the STS method might have the statistical significanceto a certain degree, it obviously lacks of physical mechanism. TheSTS method only considers the combinations of different algo-rithms or datasets and it does not improve the satellite-basedretrieval algorithm itself in essence (Taylor, 2001; Yao et al.,2014). Therefore, the performance of the STS method is highlydependent on the weightings for individual datasets, which wascalibrated using the data from a lot of flux tower sites. Our nextstep is to develop a novel physical-based fusion algorithm by com-bining the residual of surface energy balance method and thewater balance equation to produce ET product for regionalapplication.
4.4.2. Implications for agricultural water consumption and globalmodels assessment
Quantifying ET using Landsat data is critical for mappingregional-scale ET at relatively high spatial resolution, acknowledg-ing agricultural and watershed water management (Anderson

Y. Yao et al. / Journal of Hydrology 553 (2017) 508–526 521
et al., 2008). The merged ET product in this study was estimatedusing Landsat NDVI without LST. NDVI change relatively slowlywhen compared with surface moisture conditions characterizedin the LST, and sampling frequency may be less of an issue(Anderson et al., 2012). Thus, these VNIR-based methods to ETmapping have some practical advantages over TIR-based methods(Glenn et al., 2011). However, NDVI offers no information aboutbare soil evaporation after crops have senesced (Anderson et al.,2008). Fortunately, meteorological relative humidity (RH) anddiurnal air temperature range (DT) can effectively characterizethe soil water deficit (Fisher et al., 2008; Wang and Liang, 2008).Recent studies indicate RH was superior to other water stress met-rics (including soil water content and VPD) in regional ET estima-tion (Yan and Shugart, 2010). In particular, for the period of themain winter wheat growing season, ET derived by VNIR-basedmethods demonstrated their reliability to characterize agriculturalmoisture conditions at a regional scale (Zhang et al., 2016). This
Fig. 14. Daily ET maps of a partial region shown in Fig. 13 with frequency histograms fro
suggests that the merged ET in this study can be used to identifyclimatically sensitive agricultural systems and provide a diagnosticassessment of agricultural crop water consumption.
Accurate estimates of global terrestrial ET will be important forunderstanding global energy, water and carbon cycles. However,current both coarse-resolution global ET products estimated byremote sensing or global climate models (GCMs) have not beenwell validated owing to the sparse ground-measurements, compli-cated surface characteristics and the spatial mismatch between theflux tower site footprints and the coarse-resolution global ET prod-ucts footprints (Anderson et al., 2012; Yebra et al., 2013; Yan et al.,2012). Like TIR-derived ET products, the merged ET product withhigh spatial resolution provides a reference dataset for evaluatingand validating coarse-resolution global ET products (e.g., GCMs)because it provides a bridge between the tower flux footprint scale(several decades and hundreds meters) and the grid scale ofcoarse-resolution global ET products with several hundred kilome-
m five Landsat-based ET products, and the merged ET product for August 12, 2005.

Fig. 15. Change of RMSE of estimating daily ET from five Landsat-based ET products,and the merged ET product with spatial resolutions at the 103 validation towersites. The merged ET was calculated using the weights for five Landsat-based ETproducts at the 103 calibration tower sites.
Table 2Comparison of the cross validation results of daily ET from multiple Landsat-based ETproducts and fused products. S represents the Taylor skill scores.
ET Products RMSE R2 S
STS 25.4 0.60 0.61MLR 26.2 0.59 0.60SMA 26.9 0.58 0.59BMA 24.9 0.61 0.62SVM 24.2 0.63 0.63MARS 24.4 0.62 0.62BFR 24.1 0.64 0.64RS-PM 27.9 0.56 0.58SW 29.6 0.55 0.57PT-JPL 29.8 0.52 0.55MS-PT 27.1 0.57 0.59SIM 27.6 0.57 0.59
Fig. 14 (continued)
522 Y. Yao et al. / Journal of Hydrology 553 (2017) 508–526

Y. Yao et al. / Journal of Hydrology 553 (2017) 508–526 523
ters. Further studies should focus on spatial upscaling of themerged ET product in this study to evaluate the different coarse-resolution global ET products.
5. Conclusions
We described a simple Taylor skill (STS) fusion method thatmerged five Landsat-based ET products produced by individualalgorithms and FLUXNET eddy covariance (EC) observations forimproving terrestrial ET estimation. These five Landsat-based ETproducts were also evaluated based on the globally distributedFLUXNET EC observations. We found that at the site scale, large dif-ferences were found in the five Landsat-based ET products amongdifferent plant functional types.
According to the STS method, weights for the individual ETproducts were calibrated based on the data collected at the 103merging algorithm calibration sites and the results show that themerged ET product has the best performance compared to the indi-vidual products. The performance of the STSmethod for the valida-tion tower subset was similar to the results from the mergingalgorithm calibration tower subset, though the S and R2 statisticsfor the partial validation set are slightly smaller than the mergingalgorithm calibration set.
The weights of the STS method using five ET products and all ECground-measurements were used to map the regional ET. Anexample of regional ET mapping shows that the STS-merged ETprovides valuable insights for agricultural ET estimation. Uncer-tainties of the STS-merged ET are also discussed. The merged ETproduct presented in this study provides the bridge between thetower flux footprint scale and the grid scale of coarse-resolutionglobal ET products. However, the STS method obviously lacks ofphysical mechanism. Our next step is to develop a novelphysical-based fusion algorithm by combining the residual of sur-face energy balance method and the water balance equation toproduce ET product for regional application.
Acknowledgements
This work used eddy covariance data acquired by the FLUXNETcommunity and in particular by the following networks: Ameri-Flux (U.S. Department of Energy, Biological and EnvironmentalResearch, Terrestrial Carbon Program (DE-FG02-04ER63917 andDE-FG02-04ER63911)), AfriFlux, AsiaFlux, CarboAfrica, CarboEuro-peIP, CarboItaly, CarboMont, ChinaFlux, Fluxnet-Canada (sup-ported by CFCAS, NSERC, BIOCAP, Environment Canada, andNRCan), GreenGrass, KoFlux, LBA, NECC, OzFlux, Swiss FluxNet,TCOS-Siberia, USCCC. We acknowledge the financial support tothe eddy covariance data harmonization provided by CarboEuro-peIP, FAO-GTOS-TCO, iLEAPS, Max Planck Institute for Biogeo-chemistry, National Science Foundation, University of Tuscia,Université Laval, Environment Canada and US Department ofEnergy and the database development and technical support fromBerkeley Water Center, Lawrence Berkeley National Laboratory,Microsoft Research eScience, Oak Ridge National Laboratory,University of California-Berkeley and the University of Virginia.Other ground-measured data were obtained from the GAME AAN(http://aan.suiri.tsukuba.ac.jp/), the Arid/Semi-arid experimentalobservation synergy and integration of northern China(http://observation.tea.ac.cn/), and the water experiments ofEnvironmental and Ecological Science Data Center for West China(http://westdc.westgis.ac.cn/water). This work was partiallysupported by the Natural Science Fund of China (No. 41671331),the National Key Research and Development Program of China(No.2016YFA0600102) and the National Science FoundationDivision of Earth Sciences Award #1255013 (S.A.P.). JBF
contributed to this manuscript from the Jet Propulsion Laboratory,California Institute of Technology, under a contract with theNational Aeronautics and Space Administration; he was supported,in part, by the NASA Science Utilization of the Soil Moisture Active-Passive Mission (SUSMAP) program.
Appendix A. Algorithms for Landsat-based ET products
A.1. RS-PM algorithm
The revised remote sensing-based PM (RS-PM) algorithm isdeveloped based on the Mu et al. (2011) algorithm, which isrevised from the PM equation and it can be computed as follows:
ET ¼ DðRn � GÞ þ qCpVPD=raDþ cð1þ rs=raÞ ðA1Þ
where D is the slope of the saturation water vapor pressure curve(Pa/K); c is the psychrometric constant (Pa/K); q is the density ofthe air (k/gm3); VPD is the vapor pressure deficit (Pa); ra is the aero-dynamic resistance (s/m) and rs is the surface resistance (s/m). racalculation is described in Mu et al. (2011). For calculating rs, Muet al. (2011) calculated the temperature and moisture constraintsfor stomatal conductance using different parameters among variousecosystem types. In this study, we revised the temperature con-straint (mT) with an optimum air temperature (Topt) set at 25 �C(Fisher et al., 2008; Yao et al., 2013; Yuan et al., 2010).
mT ¼ exp � Ta � Topt
Topt
� �2" #
ðA2Þ
We also revised the moisture constraint (Mu et al., 2007) (mVPD)by setting VPDclose and VPDopen as 650 Pa and 2900 Pa for all ecosys-tem types, respectively.
mVPD ¼1:0 VPD 6 VPDopen
VPDclose�VPDVPDclose�VPDopen
VPDopen < VPD < VPDclose
0:1 VPD P VPDclose
8><>: ðA3Þ
where close refers to nearly complete inhibition and open refers tono inhibition to transpiration. Yuan et al. (2010) also found that itis possible to set invariant model parameters across differentecosystem types to reduce the effects of misclassification of landcover types.
A.2. SW algorithm
The Shuttleworth-Wallace (SW) algorithm is designed by comb-ing two PM models for soil evaporation and vegetation transpira-tion (Shuttleworth and Wallace, 1985). The SW algorithm can bewritten as:
ET ¼ CsPMs þ CvPMv ðA4Þ
PMs ¼ DðRn � GÞ þ ðqCpVPD� DrasRncÞ=ðraa þ rasÞDþ c½1þ rss=ðraa þ rasÞ� ðA5Þ
PMv ¼ DðRn � GÞ þ ½qCpVPD� DracðRns � GÞ�=ðraa þ racÞDþ c½1þ rsc=ðraa þ racÞ� ðA6Þ
Cs ¼ 11þ ½RsRa=ðRcðRs þ RaÞÞ� ðA7Þ
Cv ¼ 11þ ½RcRa=ðRsðRc þ RaÞÞ� ðA8Þ
Ra ¼ ðDþ cÞraa ðA9Þ

524 Y. Yao et al. / Journal of Hydrology 553 (2017) 508–526
Rs ¼ ðDþ cÞras þ rssc ðA10Þ
Rc ¼ ðDþ cÞrac þ rscc ðA11Þwhere Cs and Cv (dimensionless) are the surface resistance coeffi-cients for soil and vegetation, respectively. PMs and PMv are vari-ables related to describe evaporation from soil and transpirationfrom vegetation, respectively. Rns and Rnc are Rn into soil and vege-tation, respectively. raa is aerodynamic resistances from vegetationcanopy height to reference height. ras and rac are aerodynamic resis-tances from the soil surface to canopy height and leaf to canopyheight, respectively. rss and rsc are the surface resistance for soiland vegetation, respectively. In general, rss is calculated using afunction of the top layer of soil moisture (Sellers et al., 1992). In thisstudy, we used RHVPD to replace soil moisture to calculate rssbecause RHVPD can be used to characterize soil moisture constraintsfor soil evaporation (Fisher et al., 2008) and it can be expressed as:
rss ¼ expð8:206� 4:255RHVPDÞ ðA12Þ
A.3. PT-JPL algorithm
Based on the Priestley-Taylor algorithm, Fisher et al. (2008)developed the PT-JPL algorithm by downscaling potential ET (PET)to actual ET and it is written as:
ET ¼ ETs þ ETc þ ETi ðA13Þ
ETs ¼ a½f wet þ ð1� f wetÞf sm�D
Dþ cðRns � GÞ ðA14Þ
ETc ¼ að1� f wetÞf gf T f MD
Dþ cRnc ðA15Þ
ETi ¼ af wetD
Dþ cRnc ðA16Þ
Where ETs refers to soil evaporation, ETc refers to vegetationtranspiration and ETi refers to the canopy interception evaporation.a is the PT coefficient (1.26). fwet is the wet surface fraction (RH4).fsm is the soil moisture constraint (RHVPD). fg is the green canopyfraction (fAPAR/fIPAR). fT is the plant temperature constraint (mT)and fM is the plant moisture constraint (fAPAR/fAPARmax). fAPAR is theabsorbed photosynthetically active radiation (PAR) and fIPAR is theintercepted PAR.
A.4. MS-PT algorithm
The modified satellite-based PT (MS-PT) algorithm developed byYao et al. (2013) estimates ET by calculating the sum of the unsat-urated soil evaporation (ETds), the saturated wet soil surface evap-oration (ETws), the canopy transpiration (ETv), and the canopyinterception evaporation (ETic). The total ET can be expressed as:
ET ¼ ETds þ ETws þ ETv þ ETic ðA17Þ
ETds ¼ að1� f wetÞf smD
Dþ cðRns � GÞ ðA18Þ
ETs ¼ af wetD
Dþ cðRns � GÞ ðA19Þ
ETv ¼ að1� f wetÞf cf TD
Dþ cRnc ðA20Þ
ETic ¼ af wetD
Dþ cRnc ðA21Þ
f sm ¼ 1DT
� �DT=DTmax
ðA22Þ
f wet ¼ f 4sm ðA23Þ
f c ¼NDVI � NDVImin
NDVImax � NDVIminðA24Þ
where DTmax is the maximum diurnal air temperature range (40 �C)and fc is vegetation cover fraction. NDVImin and NDVImax were theminimum and maximum NDVI during the study period, set as con-stants of 0.05 and 0.95 (Zhang et al., 2009) in this algorithm,respectively.
A.5. SIM algorithm
The simple hybrid ET (SIM) formulation was developed byWang and Liang (2008) based on satellite determination of surfacenet radiation, vegetation index, temperature, and DT and the SIMalgorithm can be written as:
ET ¼ Rnða0 þ a1NDVI þ a2Ta � a3DTÞ ðA25Þ
where a0 = 0.1440, a1 = 0.6495, a2 = 0.0090 and a3 = 0.0163. Thesecoefficients were calibrated using the ground measurements atthe Southern Great Plains (SGP) sites in the United States from Jan-uary 2002 to May 2005. Considering the SGP sites cover the varietyof land cover that includes grass, rangeland, pastures, crop fields,forests, and mixed cover-including vegetation and bare soil-andthat their locations also differ considerably from each other, it canbe used to estimate global terrestrial ET (Wang and Liang, 2008).
References
Allen, R.G., Tasumi, M., Trezza, R., 2007. Satellite-based energy balance formappingevapotranspiration with internalized calibration (METRIC)-model. J. Irrig. Drain.Eng. 133, 380–394.
Anderson, M.C., Allen, R.G., Morse, A., Kustas, W.P., 2012. Use of Landsat thermalimagery in monitoring evapotranspiration and managing water resources.Remote Sens. Environ. 122, 50–65.
Anderson, M.C., Norman, J.M., Diak, G.R., Kustas, W.P., Mecikalski, J.R., 1997. A two-source time-integrated model for estimating surface fluxes using thermalinfrared remote sensing. Remote Sens. Environ. 60, 195–216.
Anderson, M.C., Norman, J.M., Kustas, W.P., Houborg, R., Starks, P.J., Agam, N., 2008.A thermal-based remote sensing technique for routine mapping of land-surfacecarbon, water and energy fluxes from field to regional scales. Remote Sens.Environ. 112, 4227–4241.
Baldocchi, D., 2008. Breathing of the terrestrial biosphere: lessons learned from aglobal network of carbon dioxide flux measurement systems. Aust. J. Bot. 56, 1–26.
Baldocchi, D., Falge, E., Gu, L., Olson, R., Hollinger, D., Running, S., Anthoni, P.,Bernhofer, C., Davis, K., Evans, R., Fuentes, J., Goldstein, A., Katul, G., Law, B., Lee,X., Malhi, Y., Meyers, T., Munger, W., Oechel, W., Paw, U.K.T., Pilegaard, K.,Schmid, H.P., Valentini, R., Verma, S., Vesala, T., Wilson, K., Wofsy, S., 2001.FLUXNET: A new tool to study the temporal and spatial variability ofecosystem-scale carbon dioxide, water vapor and energy flux densities. Bull.Am. Meteorol. Soc. 82, 2415–2434.
Bastiaanssen, W., Menenti, M., Feddes, R., Holtslag, A., 1998. A remotesensingsurface energy balance algorithm for land (SEBAL). 1. Formulation. J.Hydrol. 212, 198–212.
Breiman, L., 2001. Random Forests. Mach. Learn. 45, 5–32.Chen, Y., Xia, J., Liang, S., Feng, J., Fisher, J., Li, X., Li, X., Liu, S., Ma, Z., Miyata, A., Mu,
Q., Sun, L., Tang, J., Wang, K., Wen, J., Xue, Y., Yu, G., Zha, T., Zhang, L., Zhang, Q.,Zhao, T., Zhao, L., Yuan, W., 2014. Comparison of satellite-basedevapotranspiration models over terrestrial ecosystems in China. Remote Sens.Environ. 140, 279–293.
Choi, M., Kustas, W.P., Anderson, M.C., Allen, R.G., Li, F., Kjaersgaard, J.H., 2009. Anintercomparison of three remote sensing-based surface energy balancealgorithms over a corn and soybean production region (Iowa, U.S.) duringSMACEX. Agric. For. Meteorol. 149, 2082–2097.
Dirmeyer, P.A., Jin, Y., Singh, B., Yan, X., 2013. Trends in land-atmosphereinteractions from CMIP5 simulations. J. Hydrometeorol. 14, 829–849.
Eklundh, L., Hall, K., Eriksson, H., Ardö, J., Pilesjö, P., 2003. Investigating the use ofLandsat thematic mapper data for estimation of forest leaf area index insouthern Sweden. Can. J. Remote Sens. 29, 349–362.

Y. Yao et al. / Journal of Hydrology 553 (2017) 508–526 525
Ershadi, A., McCabe, M., Evans, J., Chaney, N., Wood, E., 2014. Multi-site evaluationof terrestrial evaporation models using FLUXNET data. Agric. For. Meteorol. 187,46–61.
Feng, F., Li, X., Yao, Y., Liang, S., Chen, J., Zhao, X., Jia, K., Pinter, K., McCaughey, J.H.,2016. An empirical orthogonal function-based algorithm for estimatingterrestrial latent heat flux from eddy covariance, meteorological and satelliteobservations. Plos One 11, e0160150.
Finnigan, J.J., Clement, R., Malhi, Y., Leuning, R., Cleugh, H.A., 2003. A re-evaluationof long-term flux measurement techniques: Part I. Averaging and coordinaterotation. Bound. Layer Meteorol. 107, 1–48.
Fisher, J.B., Tu, K.P., Baldocchi, D.D., 2008. Global estimates of the land atmospherewater flux based on monthly AVHRR and ISLSCP-II data, validated at 16FLUXNET sites. Remote Sens. Environ. 112, 901–919.
Foken, T., 2008. The energy balance closure problem: An overview. Ecol. Appl. 18,1351–1367.
Friedman, J.H., 1991. Multivariate adaptive regression splines. Ann. Stat. 19, 1–67.Ganguly, S., Nemani, R., Zhang, G., Hashimoto, H., Milesi, C., Michaelis, A., Wang, W.,
Votava, P., Samanta, A., Melton, F., Dungan, J.L., Vermote, E., Gao, F., Knyazikhin,Y., Myneni, R., 2012. Generating global Leaf Area Index from Landsat: Algorithmformulation and demonstration. Remote Sens. Environ. 122, 185–202.
Ghilain, N., Arboleda, A., Gellens-Meulenberghs, F., 2011. Evapotranspirationmodeling at large scale using near-real time MSG SEVIRI derived data. Hydrol.Earth Syst. Sci. 15, 771–786.
Ghilain, N., Arboleda, A., Sepulcre-Canto, G., Batelaan, O., Ardo, J., Gellens-Meulenberghs, F., 2012. Improving evapotranspiration in a land surface modelusing biophysical variables derived from MSG/SEVIRI satellite. Hydrol. EarthSyst. Sci. 16, 2567–2583.
Glenn, E.P., Doody, T., Guerschman, J., Huete, A., King, E., McVicar, T., Van Dijk, A.,Van Niel, T., Yebra, M., Zhang, Y., 2011. Actual evapotranspiration estimation byground and remote sensing methods: The Australian experience. Hydrol.Process. 25, 4103–4116.
Glenn, E.P., Morino, K., Didan, K., Jordan, F., Carroll, K.C., Nagler, P.L., Hultine, K.,Sheader, L., Waugh, J., 2008. Scaling sap flux measurements of grazed andungrazed shrub communities with fine and coarse-resolution remote sensing.Ecohydrology 1, 316–329.
Hope, A.S., Engstrom, R., Stow, D.A., 2005. Relationship between AVHRR surfacetemperature and NDVI in arctic tundra ecosystems. Int. J. Remote Sens. 26,1771–1776.
Hu, G., Jia, L., Menenti, M., 2015. Comparison of MOD16 and LSA-SAF MSGevapotranspiration products over Europe for 2011. Remote Sens. Environ. 156,510–526.
Hu, G., Jia, L., 2015. Monitoring of evapotranspiration in a semi-arid inland riverbasin by combining microwave and optical remote sensing observations.Remote Sens. 7, 3056–3087.
Jiang, L., Islam, S., 1999. A methodology for estimation of surface evapotranspirationover large areas using remote sensing observations. Geophys. Res. Lett. 26,2773–2776.
Jia, Z., Liu, S., Xu, Z., Chen, Y., Zhu, M., 2012. Validation of remotely sensedevapotranspiration over the Hai River Basin. China. J. Geophys. Res. 117,D13113.
Jiménez, C., Prigent, C., Mueller, B., Seneviratne, S.I., McCabe, M.F., Wood, E.F.,Rossow, W.B., Balsamo, G., Betts, A.K., Dirmeyer, P.A., Fisher, J.B., Jung, M.,Kanamitsu, M., Reichle, R.H., Reichstein, M., Rodell, M., Sheffield, J., Tu, K., Wang,K., 2011. Global intercomparison of 12 land surface heat flux estimates. J.Geophys. Res. Atmos. 116, D02102.
Jin, Y., Randerson, J., Goulden, M., 2011. Continental-scale net radiation andevapotranspiration estimated using MODIS satellite observations. Remote Sens.Environ. 115, 2302–2319.
Ju, J.C., Roy, D.P., 2008. The availability of cloud-free Landsat ETM plus data over theconterminous United States and globally. Remote Sens. Environ. 112, 1196–1211.
Jung, M., Reichstein, M., Ciais, P., Seneviratne, S., Sheffield, J., Goulden, M., Bonan, G.,Cescatti, A., Chen, J., Richard, D., Johannes Dolman, A., Eugster, W., Gerten, D.,Gianelle, D., Gobron, N., Heinke, J., Kimball, J., Law, B., Montagnani, L., Mu, Q.,Mueller, B., Oleson, K., Papale, D., Richardson, A., Roupsard, O., Running, S.,Tomelleri, E., Viovy, N., Weber, U., Williams, C., Wood, E., Zaehle, S., Zhang, K.,2010. Recent decline in the global land evapotranspiration trend due to limitedmoisture supply. Nature. 467, 951–954.
Kalma, J., McVicar, T., McCabe, M., 2008. Estimating land surface evaporation: areview of methods using remotely sensed surface temperature dataaccomplished. Surv. Geophys. 29, 421–469.
Kim, H., Hwang, K., Mu, Q., Lee, S., Choi, M., 2012. Validation of MODIS 16 globalterrestrial evapotranspiration products in various climates and land cover typesin Asia. KSCE J. Civ. Eng. 16, 229–238.
Kool, D., Agama, N., Lazarovitch, N., Heitman, J.L., Sauer, T.J., Ben-Gal, A., 2014. Areview of approaches for evapotranspiration partitioning. Agric. For. Meteorol.184, 56–70.
Kumar, S.V., Peters-Lidard, C.D., Tian, Y., Houser, P.R., Geiger, J., Olden, S., Lighty, L.,Eastman, J.L., Doty, B., Dirmeyer, P., Adams, J., Mitchell, K., Wood, E.F., Sheffield,J., 2006. Land information system-an interoperable framework for highresolution land surface modeling. Environ Modell. Softw. 21, 1402–1415.
Kustas, W., Anderson, M., 2009. Advances in thermal infrared remote sensing forland surface modeling. Agric. For. Meteorol. 149, 2071–2081.
Kustas, W., Norman, J., 1999. Evaluation of soil and vegetation heat fluxpredictionsusing a simple two-source model with radiometric temperatures for partialcanopy cover. Agric. For. Meteorol. 94, 13–29.
Leuning, R., van Gorsel, E., Massman, W.J., Isaac, P.R., 2012. Reflections on thesurface energy imbalance problem. Agric. For. Meteorol. 156, 65–74.
Liang, S., Wang, K., Zhang, X., Wild, M., 2010. Review on estimation of land surfaceradiation and energy budgets from ground measurement, remote sensing andmodel simulations. IEEE J. Sel. Top. Appl. Earth Obs. Remote Sens. 3, 225–240.
Liaqat, U.W., Choi, M., 2015. Surface energy fluxes in the Northeast Asia ecosystem:SEBS and METRIC models using Landsat satellite images. Agric. For. Meteorol.214–215, 60–79.
Liu, S., Xu, Z., Song, L., Zhao, Q., Ge, Y., Xu, T., Ma, Y., Zhu, Z., Jia, Z., Zhang, F., 2016.Upscaling evapotranspiration measurements from multi-site to the satellitepixel scale over heterogeneous land surfaces. Agric. For. Meteorol. 230–231, 97–113.
Liu, S., Xu, Z., Wang, W., Jia, Z., Zhu, M., Bai, J., Wang, J., 2011. A comparison of eddy-covariance and large aperture scintillometer measurements with respect to theenergy balance closure problem. Hydrol. Earth Syst. Sci. 15, 1291–1306.
Liu, S., Xu, Z., Zhu, Z., Jia, Z., Zhu, M., 2013. Measurements of evapotranspirationfrom eddy-covariance systems and large aperture scintillometers in the HaiRiver Basin. China. J. Hydrol. 487, 24–38.
Li, Z.-L., Tang, R., Wan, Z., Bi, Y., Zhou, C., Tang, B., Yan, G., Zhang, X., 2009. A reviewof current methodologies for regional evapotranspiration estimation fromremotely sensed data. Sensors 9, 3801–3853.
Long, D., Singh, V., 2012. A two-source trapezoid model for evapotranspiration(TTME) from satellite imagery. Remote Sens. Environ. 121, 370–388.
Mahrt, L., 2010. Computing turbulent fluxes near the surface: neededimprovements. Agric. For. Meteorol. 150, 501–509.
Mallick, K., Bhattacharya, B.K., Rao, V.U.M., Reddy, D.R., Banerjee, S., Venhatesh, H.,Pandey, V., Kar, G., Mukherjee, J.P., Vyas, S., Gadgil, A.S., Patel, N.K., 2009. Latentheat flux estimation in clear sky days over Indian agroecosystems usingnoontime satellite remote sensing data. Agric. For. Meteorol. 149, 1646–1665.
McCabe, M.F., Wood, E.F., 2006. Scale influences on the remote estimation ofevapotranspiration using multiple satellite sensors. Remote Sens. Environ. 105,271–285.
Monteith, J., 1965. Evaporation and environment. Symp. Soc. Exp. Biol. 19, 205–224.Mu, Q., Heinsch, F., Zhao, M., Running, S., 2007. Development of a global
evapotranspiration algorithm based on MODIS and global meteorology data.Remote Sens. Environ. 114, 519–536.
Mu, Q., Zhao, M., Running, S., 2011. Improvements to a MODIS global terrestrialevapotranspiration algorithm. Remote Sens. Environ. 115, 1781–1800.
Norman, J.M., Kustas, W.P., Humes, K.S., 1995. Source approach for estimatingsoiland vegetation energy fluxes in observations of directional radiometricsurface temperature. Agric. For. Meteorol. 77, 263–293.
Priestley, C.H.B., Taylor, R.J., 1972. On the assessment of surface heat flux andevaporation using large-scale parameters. Mon. Weather Rev. 100, 81–92.
Raftery, A.E., Madigan, D., Hoeting, J.A., 1997. Bayesian model averaging for linearregression models. J. Am. Stat. Assoc. 92, 179–191.
Reichstein, M., Falge, E., Baldocchi, D., Papale, D., Aubinet, M., Berbigier, P.,Bernhofer, C., Buchmann, N., Gilmanov, T., Granier, A., Grünwald, T.,Havránková, K., Ilvesniemi, H., Janous, D., Knohl, A., Laurila, T., Lohila, A.,Loustau, D., Matteucci, G., Meyers, T., Miglietta, F., Ourcival, J.-M., Pumpanen, J.,Rambal, S., Rotenberg, E., Sanz, M., Tenhunen, J., Seufert, G., Vaccari, F., Vesala,T., Yakir, D., Valentini, R., 2005. On the separation of net ecosystem exchangeinto assimilation and ecosystem respiration: review and improved algorithm.Global Change Biol. 11, 1424–1439.
Rienecker, M.M., Suarez, M.J., Gelaro, R., Todling, R., Bacmeister, J., Liu, E., Bosilovich,M.G., Schubert, S.D., Takacs, L., Kim, G.K., Bloom, S., Chen, J.Y., Collins, D., Conaty,A., da Silva, A., Gu, W., Joiner, J., Koster, R.D., Lucchesi, R., Molod, A., Owens, T.,Pawson, S., Pegion, P., Redder, C.R., Reichle, R., Robertson, F.R., Ruddick, A.G.,Sienkiewicz, M., Woollen, J., 2011. MERRA: NASA’s modern-era retrospectiveanalysis for research and applications. J. Climate. 24, 3624–3648.
Rodell, M., Houser, P.R., Jambor, U., Gottschalck, J., Mitchell, K., Meng, C.J., Arsenault,K., Cosgrove, B., Radakovich, J., Bosilovich, M., Entin, J.K., Walker, J.P., Lohmann,D., Toll, D., 2004. The global land data assimilation system. Bull. Am. Meteor.Soc. 85, 381–394.
Sellers, P.J., Heiser, M.D., Hal, F.G., 1992. Relations between surface conductance andspectral vegetation indices at intermediate (100m2 to 15 km2) length scales. J.Geophys. Res. Atmos. 97 (D17), 19033–19059.
Shi, Q., Liang, S., 2014. Surface sensible and latent heat fluxes over the TibetanPlateau from ground measurements, reanalysis, and satellite data. Atmos.Chem. Phys. 14, 5659–5677.
Shuttleworth, W.J., Wallace, J.S., 1985. Evaporation from sparse crops-An energycombination theory. Q. J. R. Meteorol. Soc. 111, 839–855.
Su, Z., 2002. The surface energy balance system (SEBS) for estimation of turbulentheat fluxes. Hydrol. Earth Syst. Sci. 6, 85–99.
Tang, R., Li, Z., Tang, B., 2010. An application of the Ts-VI triangle method withenhanced edges determination for evapotranspiration estimation from MODISdata in arid and semi-arid regions: Implementation and validation. RemoteSens. Environ. 114, 540–551.
Taylor, K.E., 2001. Summarizing multiple aspects of model performance in a singlediagram. J. Geophys. Res. 106, 7183–7192.
Twine, T.E., Kustas, W.P., Norman, J.M., Cook, D.R., Houser, P.R., Meyers, T.P.,Prueger, J.J., Starks, P.J., Wesely, M.L., 2000. Correcting eddy-covariance fluxunderestimates over a grassland. Agric. For. Meteorol. 103, 279–300.
Uppala, S.M., KÅllberg, P.M., Simmons, A.J., Andrae, U., Da Costa Bechtold, V., Fiorino,M., Gibson, J.K., Haseler, J., Hernandez, A., Kelly, G.A., Li, X., Onogi, K., Saarinen,S., Sokka, N., Allan, R.P., Andersson, E., Arpe, K., Balmaseda, M.A., Beljaars, A.C.M.,Van De Berg, L., Bidlot, J., Bormann, N., Caires, S., Chevallier, F., Dethof, A.,
526 Y. Yao et al. / Journal of Hydrology 553 (2017) 508–526
Dragosavac, Fisher, M., Fuentes, M., Hagemann, S., Hólm, E., Hoskins, B.J.,Isaksen, L., Janssen, P.A.E.M., Jenne, R., Mcnally, A.P., Mahfouf, J.-F., Morcrette, J.-J., Rayner, N.A., Saunders, R.W., Simon, P., Sterl, A., Trenberth, K.E., Untch, A.,Vasiljevic, D., Viterbo, P., Woollen, J., 2012. The ERA-40 re-analysis. Q. J. Roy.Meteor. Soc. 131, 2961–3012.
Vapnik, V., 1999. The Nature of Statistical Learning Theory. Information Science andStatistics, Springer, New York.
Wang, A., Zeng, X., 2012. Evaluation of multireanalysis products with in situobservations over the Tibetan Plateau. J. Geophys. Res. 117, D05102.
Wang, K., Dickinson, R.E., 2012. A review of global terrestrial evapotranspiration:observation, modeling, climatology and climatic variability. Rev. Geophys. 50,RG2005.
Wang, K., Liang, S., 2008. An improved method for estimating globalevapotranspiration based on satellite determination of surface net radiation,vegetation index, temperature, and soil moisture. J. Hydrometeorol. 9, 712–727.
Wang, K., Wang, P., Li, Z.Q., Cribb, M., Sparrow, M., 2007. A simple method toestimate actual evapotranspiration from a combination of net radiation,vegetation index, and temperature. J. Geophys. Res. Atmos. 112, D15107.
Wohlfahrt, G., Haslwanter, A., Hortnagl, L., Jasoni, R., Fenstermaker, L., Arnone, J.,Hammerle, A., 2009. On the consequences of the energy imbalance forcalculating surface conductance to water vapour. Agric. For. Meteorol. 149,1556–1559.
Xu, T., Liu, S., Liang, S., Qin, J., 2011. Improving predictions of water and heat fluxesby assimilating MODIS land surface temperature products into common landmodel. J. Hydrometeorol. 12, 227–244.
Xu, T., Bateni, S.M., Margulis, S.A., Song, L., Liu, S., Xu, Z., 2016. Partitioningevapotranspiration into soil evaporation and canopy transpiration via a two-source variational data assimilation system. J. Hydrometeorol. 17, 2363–2370.
Yan, H., Shugart, H., 2010. An air relative-humidity-based evapotranspiration modelfrom eddy covariance data. J. Geophys. Res. Atmos. 115, D16106.
Yan, H., Wang, S.Q., Billesbach, D., Oechel, W., Zhang, J.H., Meyers, T., Martin, T.A.,Matamala, R., Baldocchi, D., Bohrer, G., Dragoni, D., Scott, R., 2012. Globalestimation of evapotranspiration using a leaf area index-based surface energyand water balance model. Remote Sens. Environ. 124, 581–595.
Yao, Y., Liang, S., Cheng, J., Liu, S., Fisher, J., Zhang, X., Jia, K., Zhao, X., Qin, Q., Zhao, B.,Han, S., Zhou, G.S., Zhou, G.Y., Li, Y., Zhao, S., 2013. MODIS-driven estimation ofterrestrial latent heat flux in China based on a modified Priestly-Tayloralgorithm. Agric. For. Meteorol. 171–172, 187–202.
Yao, Y., Liang, S., Li, X., Chen, J., Wang, K., Jia, K., Cheng, J., Jiang, B., Fisher, J., Mu, Q.,Grünwald, T., Bernhofer, C., Roupsard, O., 2015. A satellite-based hybridalgorithm to determine the Priestley-Taylor parameter for global terrestrial
latent heat flux estimation across multiple biomes. Remote Sens. Environ. 165,216–233.
Yao, Y., Liang, S., Li, X., Hong, Y., Fisher, J., Zhang, N., Chen, J., Cheng, J., Zhao, S.,Zhang, X., Jiang, B., Sun, L., Jia, K., Wang, K., Chen, Y., Mu, Q., Feng, F., 2014.Bayesian multimodel estimation of global terrestrial latent heat flux from eddycovariance, meteorological, and satellite observations. J. Geophys. Res. Atmos.119, 4521–4545.
Yao, Y., Liang, S., Li, X., Liu, S., Chen, J., Zhang, X., Jia, K., Xie, X., Munier, S., Liu, M., Yu,J., Lindroth, A., Varlagin, A., Raschi, A., Noormets, A., Pio, C., Wohlfahrt, G., Sun,G., Domec, J.C., Montagnani, L., Lund, M., Eddy, M., Blanken, P.D., Grünwald, T.,Wolf, S., Magliulo, V., 2016. Assessment and simulation of global terrestriallatent heat flux by synthesis of CMIP5 climate models and surface eddycovariance observations. Agric. For. Meteorol. 223, 151–167.
Yebra, M., Van Dijk, A., Leuning, R., Huete, A., Guerschman, J.P., 2013. Evaluation ofoptical remote sensing to estimate actual evapotranspiration and canopyconductance. Remote Sens. Environ. 129, 250–261.
Yuan, W., Liu, S., Yu, G., Bonnefond, J.-M., Chen, J., Davis, K., Desai, A.R., Goldstein, A.H., Gianelle, D., Rossi, F., Suyker, A.E., Verma, S.B., 2010. Global estimates ofevapotranspiration and gross primary production based on MODIS and globalmeteorology data. Remote Sens. Environ. 114, 1416–1431.
Zhang, J., Mu, Q., Huang, J., 2016. Assessing the remotely sensed Drought SeverityIndex for agricultural drought monitoring and impact analysis in North China.Ecol. Indic. 63, 296–309.
Zhang, K., Kimball, J.S., Mu, Q., Jones, L.A., Goetz, S.J., Running, S.W., 2009. Satellitebased analysis of northern ET trends and associated changes in the regionalwater balance from 1983 to 2005. J. Hydrol. 379, 92–110.
Zhang, R.H., Sun, X.M., Wang, W.M., Xu, J.P., Zhu, Z.L., Tian, J., 2005. An operationaltwo-layer remote sensing model to estimate surface flux in regional scale:Physical background. Sci. China Ser. D: Earth Sci. 48, 225–244.
Zhao, M., Heinsch, F.A., Nemani, R., Running, S.W., 2005. Improvements of theMODIS terrestrial gross and net primary production global data set. RemoteSens. Environ. 95, 164–176.
Zhao, M., Running, S., Nemani, R., 2006. Sensitivity of Moderate Resolution ImagingSpectroradiometer (MODIS) terrestrial primary production to the accuracy ofmeteorological reanalysis. J. Geophys. Res. Atmos. 111, G01002.
Zhu, G., Li, X., Zhang, K., Ding, Z., Han, T., Ma, J., Huang, C., He, J., Ma, T., 2016. Multi-model ensemble prediction of terrestrial evapotranspiration across north Chinausing Bayesian model averaging. Hydrol. Process. 30, 2861–2879.
Zhu, X., Liu, Y., Wu, G., 2012. An assessment of summer sensible heat flux on theTibetan Plateau from eight data sets. Sci. China. Ser. D: Earth Sci. 55, 779–786.