journal of legal, ethical and regulatory issues · the journal of legal, ethical and regulatory...
TRANSCRIPT

Volume 19, Number 2 Print ISSN: 1544-0036
Online ISSN: 1544-0044
JOURNAL OF LEGAL, ETHICAL AND
REGULATORY ISSUES
L. Murphy Smith, Editor
Murray State University
Katherine Taken Smith, Co-Editor
Murray State University
The Journal of Legal, Ethical and Regulatory Issues is owned and published by Jordan Whitney
Enterprises, Inc. Editorial content is under the control of the Allied Academies, Inc., a non-profit
association of scholars, whose purpose is to support and encourage research and the sharing and
exchange of ideas and insights throughout the world.

Authors execute a publication permission agreement and assume all liabilities. Neither Jordan
Whitney Enterprises nor Allied Academies is responsible for the content of the individual
manuscripts. Any omissions or errors are the sole responsibility of the authors. The Editorial
Board is responsible for the selection of manuscripts for publication from among those submitted
for consideration. The Publishers accept final manuscripts in digital form and make adjustments
solely for the purposes of pagination and organization.
The Journal of Legal, Ethical and Regulatory Issues is owned and published by Jordan Whitney
Enterprises, Inc., PO Box 1032, Weaverville, NC 28787 USA. Those interested in
communicating with the Journal, should contact the Executive Director of the Allied Academies
Copyright 2016 by Jordan Whitney Enterprises, Inc., Weaverville, NC, USA

EDITORIAL REVIEW BOARD MEMBERS
David Arnesen
Seattle University
Stephanie Huneycutt Bardwell
Christopher Newport University
Eugene Calvasina
Southern University & A & M College
Robert Cope
Southeastern Louisiana University
Debbie DuFrene
Stephen F. Austin State University
J. Keaton Grubbs
Stephen F. Austin State University
Theresa Hrncir
Southeastern Oklahoma State
Sandra McKay
Southeastern Louisiana University
Brian Winrow
Winona State University
Raymond Zimmermann
The University of Texas at El Paso
Suzanne Pinac Ward
University of Louisiana at Lafayette
Leigh Johnson
Murray State University
D.J. Parker
University of Washington - Tacoma
Taylor Klett
Sam Houston State University
Mohammad Fateh Ali Khan Panni
City University Bangladesh
Thomas R. Tudor
University of Arkansas at Little Rock
Treba Marsh
Stephen F. Austin State University
Roselie McDevitt
Fairfield University
Carlton C. Young
Mississippi State University at Meridian

Table of Contents
ONLINE SALES AND ITS IMPACT ON STATE AND LOCAL GOVERNMENT REVENUES: IS THERE A
SOLUTION?............................................................................................................................ ................................1
Thomas Bennett, Valdosta State University
Raymond J Elson, Valdosta State University
AN ANALYSIS OF THE ACCOUNTING AND FINANCIAL EFFECTS OF INCONSISTENT STATE AND
FEDERAL LAWS IN THE RECREATIONAL MARIJUANA INDUSTRY…………………………………..11
Kimberly Taylor, Murray State University
Randall B. Bunker, Murray State University
Leigh Redd Johnson, Murray State University
Ray Rodriguez, Idaho State University
TAX LOTTERIES: THE CROWDING-OUT OF TAX MORALE AND LONG-RUN WELFARE
EFFECTS……………………………………………………………………………………………………...…26
Marco Fabbri, Erasmus University Rotterdam
Daniela C. Wilks, Universidade Europeia-Laureate International Universities
MANAGING SOCIAL ENTERPRISES IN THE PHILIPPINES: CHALLENGES AND
STRATEGIES……………………………………………………………………………………………………39
Raymund B. Habaradas, De La Salle University
Patrick Adriel H. Aure, De La Salle University
THE PROPERTY TAX DEDUCTION - IMPACT ON GOVERNMENTS AND TAXPAYERS……………...57
Tina Owens, Valdosta State University
Raymond J. Elson, Valdosta State University
USING CAFRS TO ESTIMATE THE COSTS OF CORPORATE MISCONDUCT ON SOCIETY A
FRAMEWORK FOR CIVIC ACTION………………………………………………………………………….68
Shirley A. Hunter, University of North Carolina at Charlotte
MANAGEMENT DISCRETION OF ACCRUALS PRIOR TO THE DEMUTUALIZATION OF PROPERTY-
LIABILITY INSURANCE COMPANIES………………………………………………………………………90
Jane M. Weiss, University of Wisconsin-Whitewater
USING PERSONALITY TESTING AS PART OF THE EMPLOYEE SELECTION PROCESS: LEGAL AND
POLICY ISSUES FOR EMPLOYERS…………………………………………………………………………112
Gerald E. Calvasina, Southern Utah University
Richard V. Calvasina, University of West Florida

Journal of Legal, Ethical and Regulatory Issues Volume 19, Number 2, 2016
1
ONLINE SALES AND ITS IMPACT ON STATE AND
LOCAL GOVERNMENT REVENUES: IS THERE A
SOLUTION?
Thomas Bennett, Valdosta State University
Raymond J Elson, Valdosta State University
ABSTRACT
State and local governments are challenged to find alternative revenue sources to offset
the approximately $23.3 billion lost from their inability to collect sales taxes from e-tailers. The
issue is also impacted by the approximately 10,000 jurisdictions that might be entitled to sales
tax remittance. Since the sales tax collection and remittance involves interstate commerce, any
solution must be addressed at the federal level. However, Congress response has been slow, so
states are developing individual action plans to move the conversation forward.
The paper discusses the legislations that have been proposed to address sales tax
collection and remittance, and their correct status. It offers a potential solution that might end
the stalemate between Congress, states and local governments, and e-tailers.
INTRODUCTION
State and local governments are facing fiscal challenges due to declining revenues
without a corresponding change in expenditures. As a result, these entities are exploring
alternative revenue sources, such as the $23.3 billion in lost sales tax revenue in 2012 (most
recent year available) that they are prohibited from collecting on online and catalog purchases
(Hamilton, 2015). Alternative revenue sources such as an increase in property and income taxes
are not feasible since tax increases are unpopular with the public.
Sales taxes are an important revenue source for most jurisdictions, as it represents
approximately 20% of annual revenue (Streamlined, 2016). In fact, the Tax Foundation reported
that 45 states and the District of Columbia collect statewide sales taxes, and that 38 states collect
local sales taxes (Drenkard & Kaeding 2016). The collection of sales taxes is complicated by the
number of justifications (approximately 10,000) involved in the process (Harpaz, 2015), and the
different tax rates across states (Drenkard et al, 2016). The sales tax rates are depicted in Tables
A and B.

Journal of Legal, Ethical and Regulatory Issues Volume 19, Number 2, 2016
2
Table A
Source: Drenkard & Kaeding (2016)

Journal of Legal, Ethical and Regulatory Issues Volume 19, Number 2, 2016
3
Table B
SALES TAX RATES BY STATE
STATE STATE RATE RANGE OF LOCAL RATES
LOCAL RATES APPLY
TO USE TAX
Alabama 4.000% 0% - 8.5% Yes/No (1)
Alaska 0.000% 0% - 7.5% (4), (7) Yes/No (1)
Arizona 5.600% 0 - 7.10% (4), (7) Yes/No (2)
Arkansas 6.500% 0% - 5.50% (4), (7) Yes
California 7.500% (11) 0% - 2.5% (11) Yes
Colorado 2.900% 0% - 8% (7) Yes/No (1)
Connecticut 6.350% (8) 0% -1% N/A
Delaware 0.000% (3) 0% N/A
District of Columbia 5.750% 0% N/A
Florida 6.000% (8) 0% - 1.50% (4), (7) Yes
Georgia 4.000% (8) 1% - 4% Yes
Hawaii 4.000% (5), (8) 0% - 0.5% N/A
Idaho 6.000% 0% - 3% (7) No
Illinois 6.250% (8) 0% - 4.75% (7) No
Indiana 7.000% 0% N/A
Iowa 6.000% 0% - 2% (7) No
Kansas 6.500% (8) 0% - 5% (7) Yes
Kentucky 6.000% 0% N/A
Louisiana 5.000% (8) 0% - 7.75% (6) (7) Yes
Maine 5.500% (8) 0% N/A
Maryland 6.000% 0% N/A
Massachusetts 6.250% 0% N/A
Michigan 6.000% (8) 0% N/A
Minnesota 6.875% (8) 0% - 1% (7) Yes
Mississippi 7.000% (8) 0% - 1% (7) No
Missouri 4.225% .5% - 6.625% Yes/No (1)
Montana 0.000% 0% N/A
Nebraska 5.50% 0% - 2% (7) Yes

Journal of Legal, Ethical and Regulatory Issues Volume 19, Number 2, 2016
4
Table B
SALES TAX RATES BY STATE
Nevada 6.85% (10) 0% - 1.3% Yes
New Hampshire 0.000% 0% N/A
New Jersey 7.000% 0% N/A
New Mexico 5.125% .125% - 6.625% No
New York 4.00% 0% - 5% Yes
North Carolina 4.750% (8) 2% - 3% Yes
North Dakota 5.000% (8) 0% - 3% (4), (7) Yes
Ohio 5.750% 0 - 2.25% Yes
Oklahoma 4.500% 0% - 6.50% (7) Yes/No (1)
Oregon 0.000% 0% N/A
Pennsylvania 6.000% 0% - 2% (7) No
Rhode Island 7.000% 0% N/A
South Carolina 6.000% (8) 0% - 3% (7) Yes
South Dakota 4.000% (8), (9) 0% - 2% (7) Yes
Tennessee 7.000% (8) 1.5% - 2.75% (4) Yes
Texas 6.250% 0% - 2% (7) Yes
Utah 4.700% (8) 1% - 6.25% Yes
Vermont 6.000% (8) 0% - 1% (7) No
Virginia 4.300% (8) 1% - 2.2% Yes
Washington 6.500% .5% - 3.40% Yes
West Virginia 6.000% 0% - 1% Yes
Wisconsin 5.000% 0% - 1.75% (7) Yes/No (1)
Wyoming 4.000% (8) 0% - 4% (7) Yes
As noted in Table A, Tennessee and Arkansas have the highest combined state and
average local tax rates for 2016 at 9.46% and 9.30% respectively. Table B shows California with
the highest state tax rate at 7.5%, and three states (Delaware, Montana, Oregon) with no state or
local sales taxes. Table B also shows the wide range of local sales tax rates across states with
Louisiana having the highest potential rate at 7.75%. These rate differentials may induce
consumers to shop across borders or buy products online.
The increase in online sales is creating an ongoing problem for states since sales taxes
may not be collected by the merchant and remitted. The states in which consumers are making

Journal of Legal, Ethical and Regulatory Issues Volume 19, Number 2, 2016
5
online purchases believe the e-retailers should collect and remit the sales taxes since the revenue
is being removed from their jurisdiction, thus adding to revenue shortfalls.
Local “brick and mortar” retailers in such states are also losing sales with the relative
ease that online shopping provides consumers, thus causing the individual states to lose revenue
from such sales. Online retailers and selected members of Congress, believe online sales should
not be taxed at all as a continuance of a legislation, the Internet Tax Freedom Act of 1998
(Harpaz, 2015). This Act is discussed later in the paper. They also believe that online retailers
should only remit taxes to those states in which they have a physical presence.
Since interstate commerce is governed at the federal level, states have looked to the
federal government for a solution. The issue facing Congress is determining whether existing
legislation should stand or whether to adopt “pro state” legislation.
This paper discusses past legislation that attempted to assist municipalities in the
collection of sales tax revenue, and offers possible solutions.
LEGISLATIVE ACTIONS
Prior legislation at the federal level has attempted to bring clarity to the sales tax
collection challenges faced by states. Among these actions are (a) National Bellas Hess vs.
Department of Revenue of Illinois 1967, (b) Quill Corp. vs. North Dakota 1992, (c) the Internet
Tax Freedom Act of 1998, (d) the Streamlined Sales and Use Tax Agreement 1999, and (e) the
Marketplace Fairness Act. These legislations, acts, and agreements are discussed in this section.
In 1967, the Supreme Court heard National Bellas Hess vs. Department of Revenue of
Illinois. Illinois wanted Bellas Hess to collect sales tax on catalogue sales even though the
company was based in another jurisdiction, Kansas City, Missouri. The Supreme Court ruled, in
a 5-4 decision, that businesses had to have nexus in a state in order to collect sales tax for
interstate transactions by consumers in that state. It also ruled that it would take an act of
Congress to give states the ability to require businesses based in a different state to collect sales
tax. With no action by Congress, the Supreme Court’s decision was the law governing whether
or not states could collect the sales taxes (Bellas, 2012). This decision formed the groundwork
for online sales tax collection, and was further supported by another Supreme Court Case in
1992.
The Supreme Court issued the Quill Corp. vs. North Dakota opinion in 1992. North
Dakota believed Quill Corp. owed the state use tax collections from North Dakota residents
purchasing goods through the company’s catalogue. Quill Corp. claimed that since the company
did not have nexus, actual operations or employees in the state, they should not have to collect
the use tax for purchases made by North Dakota residents. Atkins (2005) noted that the Supreme
Court explained that a business had to be physically present in a state before that state could
require the business to collect use tax on its behalf.
The Supreme Court again ruled in favor of businesses this time by a larger majority (9-1).
It noted that with all of the different sales and use tax jurisdictions in the country, requiring
companies to collect sales and use tax for each jurisdiction would create enormous complications
for the businesses and threaten to deter them from providing interstate commerce. Unlike
National Bellas Hess vs. Department of Revenue of Illinois, in the Quill case, the Supreme Court
noted that Congress was better suited to resolve the issue and that it should do so by enacting
legislation. (Bellas, 2012)
The Internet Tax Freedom Act of 1998 (the “Act”) banned state and local governments
from taxing Internet access, or imposing multiple or discriminatory taxes on electronic

Journal of Legal, Ethical and Regulatory Issues Volume 19, Number 2, 2016
6
commerce (Stupak, 2016). This legislation was necessary for the Internet boom which later led to
increased online sales. Initially, companies took this Act to mean that all online commerce was
tax exempt, and online retailers enabled consumers to make tax-free purchases. This resulted in
losses to state and local governments who lost sales tax collection at actual storefronts from
consumers who migrated to online shopping. Stupak (2016) points out that the Act did not relate
to the taxation of electronic commerce across state borders. Many online retailers such as eBay
and Amazon now charge sales tax on all purchases; however, it is not clear which state is entitled
to the tax collection.
The Streamlined Sales and Use Tax Agreement (“SSUTA”) was passed in 1999 to
simplify the sales and use tax collection and administration process between retailers and state
governments. SSUTA was developed over eleven years by 44 states and more than 85 businesses
(Marketplace Fairness, 2016). It simplified and modernized sales and use tax administration in
order to substantially reduce the burden of tax compliance. SSUTA focuses on improving sales
and use tax administration systems for all sellers and for all types of commerce. SSUTA levels
the playing field since it provides states with the authority to compel online and catalog retailers
("remote sellers"), no matter where they are located, to collect sales tax at the time of a
transaction – just like the local retailers (i.e., physical stores). However, there is a caveat - states
are only granted this authority after they have simplified their sales tax laws (Streamlined, 2016)
Twenty-four states (including Georgia, Michigan, Ohio, and New Jersey), have passed
legislation conforming to simplification measures of the Streamlined Sales and Use Tax
Agreement. A governing body was established to oversee the terms of the agreements. The states
that have passed the legislation account for thirty-one percent of the country’s population
(Streamlined, 2016). States participating in the Streamlined Sales and Use Tax Agreement can
work more easily with online retailers so that both can achieve their end goal - revenue
maximization.
The Marketplace Fairness Act (“Fairness Act”) was introduced in Congress in 2011. It
would allow state governments to collect sales and use taxes from online retailers that did not
have operations in their state. The bill expired with no action in 2011 and was reintroduced in
2013. The Fairness Act was passed in the Senate but has not passed the House. The 2015
version, which was revised and brought to Congress, would require states to collect taxes on
online sales at the time of a transaction, no matter where they are located. The only caveat is that
states would need to simplify their sales tax laws. States are provided with two optionsi for
simplifying their tax laws in the proposal (Marketplace Fairness, 2016). No action was taken by
Congress on this proposal.
The Fairness Act seems practical in that each state would be able to receive the same
sales tax on transactions regardless of the initiation point (i.e., online on storefront). Technology
has enabled organizations to reduce transaction costs in the various business processes.
Therefore, technology should be able to help organizations overcome the technical,
administrative, and financial burden involved in tracking the various local tax rates across the
country. The tax authorities would rely on retailers for voluntary compliance which is consistent
with our current tax collection process.
CURRENT LEGISLATION
As noted earlier, there are approximately 10,000 different taxing jurisdictions in the US.
This makes it challenging for online retailers to try and collect sales and use taxes for all of the
different jurisdictions. The existence of multiple state tax rates (Table B) also complicates tax

Journal of Legal, Ethical and Regulatory Issues Volume 19, Number 2, 2016
7
collection process. Sales tax collection is an ongoing problem, since it existed with catalogue
sales, the previous hurdle that municipalities were trying to overcome. Congress has tried to
provide leadership in this area with little success. Among recent proposals are the Remote
Transaction Parity and Online Sales Simplification Acts.
In 2015, a group led by Representative Jason Chaffetz, the chairman of the United States
House Committee on Oversight and Government Reform, proposed legislation that would allow
states to collect sales taxes from businesses outside of their borders. Online retailers would be
liable to any state in which the business had actual employees. The legislation, the Remote
Transaction Parity Act, had support and help from the Marketplace Fairness Coalition (supports
the Marketplace Fairness Act). The bill would provide exemption to businesses with (a) $10
million or less in annual sales in the first year, (b) $5 million or less in the second year, and (c)
$1 million or less in the third year. All businesses would need to collect and remit sales taxes in
the fourth year after the passage of the legislation.
Like the Fairness Act before it, critics believe the Remote Transaction Parity Act would
create too many obstacles for online retailers. This includes the software expense needed to aid
in the collection of the sales tax, and the ability to understand the differing tax regulations for the
various jurisdiction. This could possibly lead to fraud by the online retailers in reporting the sales
to the states and the classification of taxable items sold (Ota, 2015).
Representative Robert Goodlatte, Chairman of the House Judiciary Committee, with the
backing of online retailers proposed legislation that challenges the Chaffetz bill. The bill, the
Online Sales Simplification Act, proposed that online retailers only remit sales taxes in their
home state. Their home state would be classified as the state in which the business has the most
employees, not necessarily where the home office is located. Under this proposal, online retailers
would be responsible for remitting sales tax receipts to the home state. Therefore, the consumer’s
home state would be able to collect sales taxes on a transaction, but only up to the level charged
by the seller’s home state (Ota, 2015).
Neither proposal has fared well in Congress and appeared to be “dead on arrival”. The
Remote Transactions Parity Act of 2015 was introduced in the House of Representatives in June
2015, and was referred to the Subcommittee on Regulatory Reform, Commercial and Antitrust
Law. House members are split on this Act along party lines, with conservatives believing that it
equates to a ‘de facto” tax increase which they strongly oppose.
The Online Sales Simplification Act was introduced to the House in January 2015 and did
not gain much traction. Its major obstacle was the U.S. Chamber of Commerce which suggested
that the bill would require businesses to collect sales tax based on the seller’s jurisdiction instead
of the purchaser, which would require the purchaser’s jurisdictional information to be reported.
The draft never moved any further in the House.
STATES ACTION PLANS
With continuing decline in revenue, governments are exploring other revenue sources and
cost reduction opportunities. For instance, the state of Alaska is considering the earnings from its
$53 billion Alaska Permanent Fund as a new resource source. The goal is to divert the funds that
were given annually to citizens to its general fund to help offset a $4 billion budget deficit
(Oldham, 2016). This is not an isolated situation and holds true for many state and local
governments, as sales tax, once a critical revenue source, is reduced due to the challenges of
collecting sales taxes from online retailers.

Journal of Legal, Ethical and Regulatory Issues Volume 19, Number 2, 2016
8
Congress has multiple bills to consider and has the opportunity to help find a solution to
the revenue decline from online sales that state and local governments are experiencing.
Meanwhile, states cannot wait for Congress to address their ability to collect sales tax from
Internet retailers in other states. As a result, thirteen states are addressing the issue in their own
unique ways
For instance, Alabama has begun enforcing an old law that allows it to tax out-of-state
retailers and will audit entities that do not comply with the law. Alabama’s goal is that this action
will lead to litigation, thus forcing Congress and the courts to respond. Colorado will require out-
of-state retailers that do not collect taxes to provide it with a list of in-state customers. This will
allow Colorado to enforce its use tax laws against those in-state customers (or residents). Utah is
attempting to pass legislation that “would expand its definition of a retailer’s physical presence
to include certain third-party delivery companies.” This legislation would require retailers to
follow a different taxation system in Utah, but not other states (Rubin, 2016).
CONCLUSION
The collection and remittance of sales taxes has resulted in strained relationships between
online retailers and state and local governments. Supreme Court cases such as National Bellas
Hess vs. Department of Revenue of Illinois and Quill Corp. vs. North Dakota established early
precedent for the collection and remittance of taxes. However, in a changing world, these rulings
are no longer adequate and the feuding parties are looking to Congress for help in resolving this
continuing battle. In this vacuum, states are creating new and unique solutions in order to
increase sales tax revenue just improving their financial conditions.
However, a patchwork of states actions will not solve the overall problem. Congress can
no longer remain on the sideline and differ its responsibility to states, especially since there are
viable options available. There is no perfect solution to resolving the sales tax collection problem
but the Remote Transaction Parity Act is a good starting point. For this Act to work, states would
need to agree and adopt legislation that conforms to the Streamlined Sales and Use Tax
Agreement. This would reduce the complexity online merchants face when trying to determine
which of the approximately 10,000 jurisdictions are due the sales tax remittance. The sales tax
rate used by the states, as shown in Tables A and B, would also need to be simplified. This
would provide online retailers with the opportunity to lower their costs of collecting and
administering the sales tax revenue to the state and local governments. Technology does offer
online retailers the ability to reduce transaction cost especially at it relates to shipping, and this
intelligence could be applied to the tax collection process.
In the past few years, Congress has been slow in performing its legislative duties. Online
sales are increasing and the revenue lost from sales taxes by governments is also increasing.
Congress and states must act immediately to resolve the online sales tax collection issues. As
revenue shortfall and budget deficits continue, state and local governments will have no choice
but to reduce services to their constituents or to raise taxes.

Journal of Legal, Ethical and Regulatory Issues Volume 19, Number 2, 2016
9
FOOT NOTES
1. Some of the cities and counties do apply use tax.
2. Some of the cities do apply use tax. The counties do not apply a use tax.
3. Delaware does not have a sales tax. They do have a rental tax of 1.991%.
4. A cap on the local sales/use tax applies on sales of any item of tangible personal property.
5. There is a .500% use tax on merchandise imported into the state for resale purposes. Imports for
consumption are taxed at the same rate as the sales tax.
6. The combined local rates for a particular city range from 1.8% to 7.75%.
7. Some local jurisdictions do not impose a sales tax.
8. The state has reduced rates for sales of certain types of items.
9. Sales and deliveries to certain Indian reservations are subject to the Tribal sales, use and excise taxes in
lieu of the state sales, use and excise tax. City sales tax may still apply.
10. The Nevada Minimum Statewide Tax rate of 6.85% consists of several taxes combined: Two state taxes
apply -- 2.00% Sales Tax and the 2.6% Local School Support Tax which equal the state rate of 4.6%. Two
county taxes also apply -- 0.50% Basicity-County Relief Tax and 1.75% Supplemental City-County Relief
Tax equals an additional city/county rate of 2.25% for a total of 6.85%. Previously, the matrix displayed
only these rates state level taxes. However, since the two county taxes apply to every county in the state,
Nevada's minimum statewide tax rate is considered to be 6.85%.
11. Note that the true California state sales tax rate is 6.25%. There is a statewide county tax of 1.25% and
therefore, the lowest rate anywhere in California is 7.5%. We have listed the combined state/county rate as
the state rate to eliminate confusion.
Source: Drenkard & Kaeding (2016).
END NOTES
The options are:
Option 1: A state can join the twenty-four states that have already voluntarily adopted the simplification measures
of the Streamlined Sales and Use Tax Agreement (SSUTA), which has been developed over the last eleven years by
forty-four states and more than eighty-five businesses with the goal of making sales tax collection easy. Any state
which is in compliance with the SSUTA and has achieved Full Member status as a SSUTA implementing state will
have collection authority on the first day of the calendar quarter that is at least 180 days after enactment.
Option 2: Alternatively, states can meet essentially five simplification mandates listed in the bill. States that choose
this option must agree to:
1. Notify retailers in advance of any rate changes within the state.
2. Designate a single state organization to handle sales tax registrations, filings, and audits.
3. Establish a uniform sales tax base for use throughout the state.
4. Use destination sourcing to determine sales tax rates for out-of-state purchases (a purchase made by a
consumer in California from a retailer in Ohio is taxed at the California rate, and the sales tax collected is
remitted to California to fund projects and services there).
5. Provide free software for managing sales tax compliance, and hold retailers harmless for any errors that
result from relying on state-provided systems and data.
Source: Streamlined, 2016

Journal of Legal, Ethical and Regulatory Issues Volume 19, Number 2, 2016
10
REFERENCES
Atkins, Chris. (2005). Important Tax Cases: Quill Corp. v. North Dakota and the Physical Presence Rule for Sales
Tax Collection. Tax Foundation. Retrieved on July 18, 2015 from http://taxfoundation.org/blog/important-
tax-cases-quill-corp-v-north-dakota-and-physical-presence-rule-sales-tax-collection
Bellas Hess, Quill, and Online Sales Tax Collection. (2012). Retrieved on July 18, 2015 from
http://blog.fedtax.net/2012/04/25/bellas-hess-quill-and-online-sales-tax-collection/
Drenkard, Scott and Nicole Kaeding, (2016). States and Local Sales Tax Rates in 2016. Tax Foundation Fiscal Fact
No. 514. Retrieved on April 16, 2016 from http://taxfoundation.org/article/state-and-local-sales-tax-rates-
2016
Hamilton, Billy. (2015). Groundhog Day: Waking Up to the Online Sales Tax Issue - Again. Tax Analysts.
Retrieved on July 16, 2015 from
http://www.taxanalysts.com/www/features.nsf/Features/E38E77A2F3F9AAD085257DF00006D282?Open
Document
Harpaz, Joe. (2015). Congress Renews Push For Internet Sales Tax...Will It Stick This Time? Retrieved on July 18,
2015 from http://www.forbes.com/sites/joeharpaz/2015/03/24/congress-renews-push-for-internet-sales-tax-
will-it-stick-this-time/
Marketplace Fairness Act. (2016). What is the Marketplace Fairness Act? Retrieved on May 15, 2016 from
http://marketplacefairness.org/
Oldham, J. (2016). May. The Party is over in Alaska. Bloomberg BusinessWeek, 18-19.
Ota, Alan. (2015). Online Sales Tax a Live-Wire Issue for Congress. Retrieved June 15, 2016 from
http://www.rollcall.com/news/online_sales_tax_a_live_wire_issue_for_congress-241545-1.html?pg=2
Rubin, Richard. 2016, February 23. States Set Up Fight Over Web Sales Tax. The Wall Street Journal. Retrieved on
March 30, 2016 from http://www.wsj.com/articles/states-seek-new-ways-to-tax-online-sales-
1456262265?cb=logged0.23880702114473884
Streamlined. (2016). The Streamlined Sales Tax Governing Board. Retrieved on May 15, 2016 from
http://www.streamlinedsalestax.org/
Stupak, Jeffrey. (2016). The Internet Tax Freedom Act in Brief. Congressional Research Service 7-5700. Retrieved
on May 15, 2016 from https://www.fas.org/sgp/crs/misc/R43772.pdf
Journal of Legal, Ethical and Regulatory Issues Volume 19, Number 2, 2016
11
AN ANALYSIS OF THE ACCOUNTING AND
FINANCIAL EFFECTS OF INCONSISTENT STATE AND
FEDERAL LAWS IN THE RECREATIONAL
MARIJUANA INDUSTRY
Kimberly Taylor, Murray State University
Randall B. Bunker, Murray State University
Leigh Redd Johnson, Murray State University
Ray Rodriguez, Idaho State University
ABSTRACT
The recreational marijuana industry exists in an environment of legislative uncertainty
created by states legalizing recreational marijuana while it is still considered illegal at the
federal level. The dichotomy between state and federal laws has created interesting accounting
and financial effects; including how financial institutions, CPAs, and the individual marijuana
businesses themselves are affected by the inconsistencies in the laws from an accounting and
finance perspective. The purpose of this study is to identify and examine the accounting and
financial effects of the inconsistencies between state and federal laws on the recreational
marijuana industry.
INTRODUCTION
The recreational marijuana industry exists in an environment of legislative uncertainty
resulting from states legalizing recreational marijuana while it is still considered illegal at the
federal level. For the recreational marijuana industry, legalization did not occur until 2012 when
Colorado first legalized it and has since been followed by three other states and Washington D.C.
The dichotomy between state and federal laws has created interesting accounting and financial
effects; including how financial institutions, CPAs, and the individual marijuana businesses
themselves are affected by the inconsistencies in the laws from an accounting and finance
perspective.
From a financial institution standpoint, one of the most important aspects that is
influenced by the differing state and federal laws includes providing services to marijuana-
related businesses while still adhering to federal banking regulations. Banks are subject to a
number of federal regulations that they must follow regardless of states’ stances on recreational
marijuana. When considering the accounting and financial effects from a marijuana business
owners perspective, there are a number of important aspects that can be considered. These
include the tax rates applied to business owners, the environment in which the business operates,
and the accounting methods used. From a CPAs perspective, there are numerous facets to
consider such as following available guidance and providing services to marijuana businesses
while remaining in accord with accounting standards.
The accounting and financial effects of the inconsistent laws from these perspectives are
not mutually exclusive and often connect to each other so that an effect in one area often causes
effects in the other areas as well. The purpose of this study is to identify and examine the

Journal of Legal, Ethical and Regulatory Issues Volume 19, Number 2, 2016
12
accounting and financial effects of the inconsistencies between state and federal laws on the
recreational marijuana industry.
LITERATURE REVIEW
Federal Legislation and Considerations
Past regulation-related research explores differences in societal opinions regarding the
ethicality of the use and legalization of certain drugs. For example, although the use of
performing-enhancing drugs (PEDs) by athletes is viewed as creating an unfair advantage and an
un-level playing field by some, Osei-Hwere, et al. note that sports fans are equally divided as to
whether PED use should be allowed in certain sports (2014). Likewise, much has been written
regarding the morality of the use and legalization of marijuana. On the one hand, some argue that
marijuana smoke is toxic and could lead to the use of more serious, dangerous drugs; however,
others note that marijuana is an effective treatment for certain conditions, thereby reducing
suffering (Clark, 2000), and that its legalization would reduce crime rates, save taxpayer money
and generally benefit both individuals and communities (Cussen, 2000).
Recreational marijuana is an emerging industry in the United States due to four states and
Washington, D.C. recently passing measures to legalize the recreational use of the drug.
However, marijuana is still illegal federally because it is a Schedule I drug under the Controlled
Substances Act (CSA) (CSA, 2012). Schedule I drugs are those that the federal government lists
as having a high potential for abuse, no accepted medical use, and lack of safety even under
medical supervision (CSA, 2012). The illegality of marijuana at the federal level allows for a
number of civil and criminal penalties that can be assessed against people who cultivate, sell, or
distribute marijuana even if legal by state standards (Gramlich and Houser, 2015), and the
federal government has prosecuted individuals for the use and possession of marijuana even
when such use and possession was permitted under state law (Barkacs, 2010). This creates a
unique dichotomy between federal and state laws.
According to the Internal Revenue Code (IRC), gross income is defined as all income
from whatever source derived (26 U.S.C. §61(a), 2012). As recognized in James v. United States
(1961), there is no inclusion of the word “lawful” when describing the sources through which
income can be derived. This means that although marijuana is considered illegal by the federal
government it is still subject to federal income taxes. It is treated the same as all other income,
whether legal or illegal.
The federal government further allows for a business to deduct all ordinary and necessary
business expenses from its gross income (26 U.S.C. §162(a), 2012). At the time the business
expense deduction was created it did not differentiate between businesses participating in a legal
trade from an illegal trade. This allowed for people conducting illegal businesses to continue to
deduct their business expenses from gross income, thus reducing their amount of taxable income
and, in turn, taxes due. This was highlighted in Jeffery Edmondson v. Commissioner (1981)
where Edmondson made the argument, and won the argument, that he should be allowed to
deduct the expenses related to his business of selling amphetamines, cocaine, and marijuana.
However, this deduction is no longer available for businesses that are involved in trafficking
Schedule I or II controlled substances as defined in the CSA due to the passage of Section 280E
of the IRC (26 U.S.C. §280E, 2012).

Journal of Legal, Ethical and Regulatory Issues Volume 19, Number 2, 2016
13
To further explain why Section 280E was created, the Joint Committee’s General
Explanation of the Revenue Provisions of the Tax Equity and Fiscal Responsibility Act of 1982
(1983) states that:
There is a sharply defined public policy against drug dealing. To allow drug
dealers the benefit of business expense deductions at the same time that the U.S. and its
citizens are losing billions of dollars per year to such persons is not compelled by the fact
that such deductions are allowed to other, legal enterprises. Congress believed that such
deductions must be disallowed on public policy grounds. (p.264)
This exclusion was created before any states legalized marijuana for medical or
recreational use. The application of Section 280E to marijuana businesses that are legal at the
state level but illegal at the federal level demonstrates how, although legal within their state,
these businesses are still coping with the difficulties of complying with federal laws.
Although marijuana-related businesses cannot deduct their business expenses from gross
income, Section 280E does not preclude businesses from deducting cost of goods sold (COGS).
Continuing to allow businesses to adjust gross income by the amount of COGS was done to
prevent possible challenges on the grounds of unconstitutionality (Joint Committee on Taxation,
1983). In Californians Helping to Alleviate Medical Problems, Inc. (CHAMP) v. Commissioner
of Internal Revenue (2007), the government acknowledged that Section 280E prevents taxpayers
from deducting business expenses, but it does not prevent businesses from claiming COGS.
However, because marijuana-related businesses fall under Section 280E, the IRS Office of Chief
Counsel issued Chief Counsel Advice which clarified that businesses should determine their
COGS using the inventory costing methods that existed when Section 280E was enacted
(McElroy, 2015).
A consequence of administering Section 280E in legalized states is that many cases have
been brought against the Internal Revenue Service (IRS) on the basis of deducting Section 280E
expenses with varying results. In CHAMP v. Commissioner of Internal Revenue (2007), the court
held that the taxpayer’s caregiving services and furnishing of medical marijuana were separate
business for the purposes of Section 280E. This allowed the taxpayer to deduct the portion of
expenses related to the primary, lawful caregiving portion of its business. However, in Olive v.
Commissioner of Internal Revenue (2015), the court found that the taxpayer’s business was of
limited scope and consisted of trafficking marijuana, which places it under the constraints of
Section 280E. Even where permitted by state law, marijuana businesses are considered to be
trafficking Schedule I drugs for the purpose of determining the applicability of Section 280E
(Canna Care, Inc. v. Commissioner of Internal Revenue, 2015).
As the number of states legalizing marijuana for medical and recreational use has
increased, many have argued in federal courts that marijuana should no longer be subject to the
Section 280E exclusion. However, this is not the judiciary’s decision to make and must be
addressed by Congress in order to be changed (Olive v. Commissioner, 2015). The same
argument has also been made to the IRS to which the response was the same, Congress would
have to change the IRC or the CSA (Keyso, 2011).
Due to the increasing number of states legalizing marijuana for medical and/or
recreational use, the Department of Justice (DOJ) has issued numerous memos to address various
aspects of the discrepancies in the legality of marijuana at the state and federal levels. The DOJ
has focused its enforcement of the CSA to reflect the priorities of the federal government (Cole,

Journal of Legal, Ethical and Regulatory Issues Volume 19, Number 2, 2016
14
2013). These priorities include items that would be important to the federal government
regardless of the state legalization of marijuana, including preventing the distribution of
marijuana to minors and preventing driving while under the influence of marijuana (Cole, 2013).
Although the DOJ has listed priorities for their enforcement of the CSA, they have also clearly
stated that businesses involved in the cultivation, distribution, or sale of marijuana are in
violation of the CSA and can be subject to potential prosecution (Cole, 2011). In addition to
potential violations of the CSA, the DOJ also issued a memo addressing the potential violations
of applicable laws that financial institutions could face in providing services to marijuana
businesses (Cole, 2014).
Banks and financial institutions are subject to numerous federal laws that put the legality
of working with state-legalized marijuana-related businesses into a gray area. The Money
Laundering Control Act, the Prohibition of unlicensed money transmitting businesses statute,
and the Bank Secrecy Act (BSA) are all laws that financial institutions must consider (Cole,
2014). Under the money laundering statutes, engaging in financial transactions with the proceeds
of certain illegal activities is considered a criminal offense (Money Laundering Control Act of
1986, 2012). Similarly, a money transmitting business that is involved in the transportation of
funds derived from criminal activities could be subject to fines or imprisonment for up to five
years (Prohibition of unlicensed money transmitting businesses, 2012). Banks and financial
institutions that fail to report transactions suspected of violating laws or regulations, the CSA in
this case, would also be in violation of the BSA (BSA, 2012). Due to the illegal nature of
marijuana at the federal level, it could serve as a basis for prosecution should an agency choose
to do so under any of the previously mentioned laws (Cole, 2014).
The Financial Crimes Enforcement Network (FinCEN), a bureau of the Department of
the Treasury, has also issued guidance to complement the 2014 DOJ memorandum with the goal
of improving the availability and clarity of financial services for marijuana-related businesses
(FinCEN, 2014). The guidance outlines multiple items that financial institutions should take into
consideration when determining the risks involved with providing services to marijuana
businesses. The basis of these items is rooted in conducting customer due diligence to ensure that
the institution can evaluate the risks associated with offering their services and also effectively
manage those risks (FinCEN, 2014). Furthermore, should the financial institution decide to
conduct business with the marijuana-related client, the institution would be required to file
suspicious activity reports (SARs) to be in compliance with FinCEN regulations (FinCEN,
2014). According to the FinCEN regulations, if the financial institution knows of or has a reason
to suspect that a transaction includes funds resulting from an illegal activity, was designed to
avoid regulations set forth in the BSA, or lacks a business or lawful purpose, then the institution
is required to file a SAR (FinCEN, 2012).
In addition to the laws and guidance issued by the DOJ and FinCEN, it is expected that
states that have legalized marijuana should have a strong regulatory environment in place to
ensure that the federal interests prioritized by the DOJ are protected (Cole, 2013). Although the
DOJ has issued memoranda concerning various aspects of marijuana-related businesses, they
have also made it clear that even in areas with strong regulatory systems, federal enforcement
action can be taken if evidence shows a person is violating any of the federal priorities (Cole,
2014). Federal guidance such as the DOJ memoranda and FinCEN guidance are not law, do not
protect people from prosecution, and merely “represent exercises of prosecutorial discretion”
(Canna Care, Inc. v. Commissioner of Internal Revenue, 2015, p. 9).

Journal of Legal, Ethical and Regulatory Issues Volume 19, Number 2, 2016
15
California was the first state to legalize medical marijuana in 1996 and Colorado and
Washington became the first states to legalize marijuana for recreational use in 2012 (AICPA,
2016). Colorado, Washington, Oregon, Alaska, and Washington, D.C. have approved initiatives
legalizing marijuana for recreational use. However, Washington, D.C. does not allow for the
legal sale of marijuana that the other states have approved. Washington, D.C. only approved
legalizing growing small amounts of marijuana for personal use on private property. Voter
initiatives have facilitated the legalization in these states and currently no state legislature has
legalized marijuana separately from a voter initiative (National Conference of State Legislatures,
2016). Although these states have legalized marijuana for recreational use, it is important to note
that marijuana is still illegal at the federal level due to the CSA. Table 1 compares the tax
structure for retail marijuana sales in the four states that have legalized sales.
Table 1
TAX STRUCTURES FOR RETAIL MARIJUANA SALES AS OF JANUARY 2016 State State Excise Tax Sales/Other Taxes Local Sales Tax
Alaska $50 per ounce of
marijuana sold at the
wholesale level
None (no statewide sales
tax)
Option to apply existing
local sales taxes (0-7.5%)
Colorado 15% tax on average
market sale rate + 10%
retail sales tax
2.9% state sales tax Option to apply existing
local sales taxes (0-8%)
Oregon 25% retail sales tax None (no statewide sales
tax)
Optional local sales taxes
not to exceed 3%
Washington 37% retail sales tax 6.5% state sales tax +
Business & Occupation
gross receipts tax
Option to apply existing
local sales taxes (0.5%-
3.1%)
Source: Institute of Taxation and Economic Policy (ITEP)
Effects on Financial Institutions
In memoranda issued by the DOJ, the agency outlined eight priorities that it
believes are important to the federal government (Cole, 2013, pp. 1-2):
1. Preventing the distribution of marijuana to minors;
2. Preventing revenue from the sale of marijuana from going to criminal enterprises, gangs, and
cartels;
3. Preventing the diversion of marijuana from states where it is legal under state law in some
form to other states;
4. Preventing state-authorized marijuana activity from being used as a cover or pretext for the
trafficking of other illegal drugs or other illegal activity;
5. Preventing violence and the use of firearms in the cultivation and distribution of marijuana;
6. Preventing drugged driving and the exacerbation of other adverse public health consequences
associated with marijuana use;
7. Preventing the growing of marijuana on public lands and the attendant public safety and
environmental dangers posed by marijuana production on public lands; and
8. Preventing marijuana possession or use on federal property.

Journal of Legal, Ethical and Regulatory Issues Volume 19, Number 2, 2016
16
The issuance of the 2014 DOJ memo and concurrently issued FinCEN guidance provided
some clarity on the federal policies pertaining to potential marijuana-related financial crimes
(Gard, 2014). However, even with the issued guidance, financial institutions are still hesitant to
provide services to marijuana-related businesses because banks can be held liable for financial
crimes even when acting in accordance with issued guidance and laws to their fullest abilities
(Gard, 2014). To date, there has been no definitive rule made that will protect financial
institutions from prosecution for providing services to state legal marijuana businesses. Although
creating enforcement priorities does assist banks in their determination of whether to provide
services, there is no guarantee that these priorities will continue to stay the same due to the high
turnover of political leaders in Washington (Gard, 2014). In addition to the possibility of
violating federal priorities and laws, large national banks are wary to provide services to
marijuana clients due to the fear of losing their federal insurance (Huddleston, 2014).
Further, the Money Laundering Control Act, the BSA, and the Prohibition of unlicensed
money transmitting businesses statute provide a possible basis for the prosecution of financial
institutions working with marijuana-related clients and constitute much of the basis for resistance
from banks (Cole, 2014). Financial institutions are hesitant to put themselves in a situation of
receiving money, directly or indirectly, from marijuana sales for fear of violating various laws at
the federal level (Stinson, 2015).
The DOJ also expects states to have a strong and effective regulatory system in place. If a
strong regulatory environment is not present then providing services to marijuana-related
businesses could conflict with the priorities set forth by the DOJ not by any particular fault of the
bank, but merely because of a lack of substantial, effective regulations in the state (Cole, 2014).
The evaluation of how strong and appropriate state regulations are in addition to the federal laws
currently in place are two important factors for financial institutions to consider when
determining their position on providing services to the marijuana industry.
The uncertainties that banks face when determining whether to allow marijuana-related
clients often lead them to err on the side of caution and causing them to not provide services to
the marijuana industry (ArcView Market Research, 2016). As such, many of the basic financial
functions that ordinary businesses and citizens utilize on a daily basis are not available to
marijuana-related businesses, including basic checking and credit card services (Stinson, 2015).
In addition to these basic functions, marijuana-related businesses are also generally unable to
receive loans and utilize electronic funds transfer systems (ArcView Market Research, 2016).
According to the director of the FinCEN, only 105 banks accept money from legal marijuana
businesses out of the 100,000 in the U.S. (Stinson, 2015). That amounts to approximately
0.105% of all banks in the nation.
Effects on Marijuana Business Owners
Although marijuana businesses are operating legally under certain state laws, much of
their business is still considered illegal by the federal government (Huddleston, 2015). Section
280E not only affects retail marijuana businesses but also any business that participates in the
cultivation, processing, or sale of marijuana whether for medical or recreational use (National
Cannabis, 2015). Marijuana businesses are disallowed from claiming the basic expenses that
other ordinary businesses are allowed to deduct such as advertising and employees’ salaries
(Huddleston, 2015).
Due to the existence of Section 280E, these marijuana businesses legalized by state law
are facing an effective federal income tax rate of up to 75 percent (Hargreaves, 2013). These

Journal of Legal, Ethical and Regulatory Issues Volume 19, Number 2, 2016
17
comparatively high effective tax rates stem from the inability to deduct business expenses when
determining taxable income for federal purposes (National Cannabis, 2015). The impact of the
high effective tax rates were mitigated slightly by high profits achieved by businesses with an
early mover advantage in the beginning. However, as more businesses enter the market and the
industry becomes more competitive, the impact will increasingly affect businesses (ArcView
Research, 2016). All things remaining equal, a marijuana business and an ordinary business with
the same revenue, COGS, and business expenses, can experience largely different effective tax
rates (National Cannabis, 2015). The tax burden experienced by marijuana businesses, coupled
with the lack of access to services provided by financial institutions, makes operating and
remaining profitable in the industry difficult (Barreras, Ittleman, & Fuerst, 2014).
As businesses attempt to navigate and comply with complex laws and regulations, the
guidance issued to assist them can sometimes have the opposite effect. Rather than encouraging
businesses to create a working relationship with the IRS, a recent IRS memo regarding how to
calculate COGS for the purposes of Section 280E is more likely to prompt businesses to consider
sidestepping the IRS (National Cannabis, 2015). This is because the memo narrowed the scope
of what expenses were considered to be a part of COGS, especially for retailers who are
disallowed from deducting the costs of storing and handling marijuana and general
administrative expenses (Huddleston, 2015). The current situation with Section 280E has led
some people to ignore the exclusion or choose to not pay taxes at all rather than lose the revenue
they would have made had the Section 280E exclusion not been in place (National Cannabis,
2015).
Although some businesses have chosen to circumvent the IRS when it comes to taxes,
most marijuana businesses that are licensed with a state want to pay state and federal taxes; this
legitimizes their businesses and the industry (National Cannabis, 2015). However, the complex
laws, exclusions, and guidance issued are often more than the average business owner can
understand. According to Karen Hawkins, director of the IRS’s Office of Professional
Responsibility, the recently issued memo regarding COGS calculations was too indecipherable
for most people to comprehend (Davison, 2015). This furthers the difficulties faced by
businesses when trying to correctly determine their taxable income and file their federal and state
taxes.
While the Joint Committee’s General Explanation of the Revenue Provisions of the Tax
Equity and Fiscal Responsibility Act of 1982 stated that the Section 280E exclusion was created
for public policy reasons (1982), some have questioned whether disallowing the deductions for
the legalized state licensed businesses is in line with the original legislative intent of the
exclusion (Barreras, Ittleman, & Fuerst, 2014). Regardless of whether the exclusion’s current
application is consistent with its original purpose, it is part of the federal law that is applicable to
all businesses that fall within its described bounds, which are those businesses trafficking
Schedule I and II controlled substances.
The high tax rates experienced by marijuana businesses and the inability to form
relationships with financial institutions are increasing hindrances to industry growth as a whole
(Huddleston, 2015; ArcView Research, 2016). High taxes are also often seen as an incentive for
businesses to commit tax evasion and a reason that the black market is still present even in states
that have legalized marijuana for recreational use (Merriman, 2010). One of the primary reasons
for legalizing marijuana is to bring it into a legal market and in turn eliminate the black market
where it was originally sold (Tax Policy Issues, 2016). According to a Marijuana Business Daily
research report, in states that have legalized marijuana for recreational use, 17 percent of users

Journal of Legal, Ethical and Regulatory Issues Volume 19, Number 2, 2016
18
still purchase solely from the black market and 16 percent purchase from both the black market
and legal market (Olson, 2015).
Effects on Certified Public Accountants
In addition to the lack of clear guidance for financial institutions, CPAs face similar
uncertainties when approaching the decision to provide services to marijuana-related clients.
Although almost half of the United States has legalized some form of marijuana, and four states
have completely legalized it, only seven state boards of accountancy have issued guidance in
relation to CPAs providing services to marijuana clients (AICPA, 2016). Of those seven state
boards, three are in states that have legalized marijuana for recreational use. The Colorado,
Oregon, and Washington state boards of accountancy have issued guidance for CPAs licensed in
their states, while Alaska has yet to issue any specific information in relation to providing
services for the marijuana industry (AICPA, 2016).
The Colorado State Board of Accountancy’s statement on providing services to the
marijuana industry states that there is nothing specifically prohibiting CPAs from providing
services for marijuana-related clients who are in compliance with the Colorado Medical
Marijuana Code and Colorado Retail Marijuana Code (AICPA, 2016). The guidance also
expresses that the Board’s position statement is not an endorsement for CPAs to work with
marijuana clients, does not act as a statement on the practicality of complying with all applicable
standards when providing services to marijuana-related businesses, and is not a statement about
marijuana enforcement outside of its jurisdiction (Colorado State Board of Accountancy, 2015).
Similar to Colorado, the Washington State Board of Accountancy’s position statement on
performing professional services to clients in the marijuana industry states that there is nothing
specifically prohibiting CPAs from providing these services (AICPA, 2016). However,
Washington’s Board of Accountancy is also careful to begin its statement with the phrase,
“Pending changes in federal marijuana enforcement policy” (Washington State Board of
Accountancy, 2014, p. 1). Beginning their position statement in this manner addresses the
dichotomy between state and federal laws and conveys that there is potential for the federal
government to adjust its position on marijuana. It also makes clear that the Board’s position
statement in regards to CPAs providing services to the marijuana industry is dependent on
federal policy. Through the position statement, the Executive Director also recommends that
CPAs providing services to the emerging marijuana industry carefully evaluate the potential risks
associated with providing these services and address them appropriately (Washington State
Board of Accountancy, 2014).
The Oregon Board of Accountancy took a similar but slightly different approach to its
guidance regarding providing services to the marijuana industry. The guidance provides that the
decision to offer services to marijuana clients is up to each individual CPA or firm and that
should they choose to provide any services they should consider all the potential risks involved,
including those that arise from the inconsistencies in state and federal laws (Oregon Board of
Accountancy, 2015). However, differing from Colorado and Washington, the Oregon State
Board of Accountancy’s guidance states that CPAs and CPA firms that choose to provide
services to the marijuana industry will not face action by the Board based solely on providing
services to marijuana businesses (AICPA, 2016).
In an issue brief prepared by AICPA staff in conjunction with the Colorado and
Washington state CPA societies, the AICPA recommended that firms considering the idea of
providing services to marijuana-related clients should review all guidance issued by the DOJ
Journal of Legal, Ethical and Regulatory Issues Volume 19, Number 2, 2016
19
(AICPA, 2016). According to the DOJ memo, Guidance Regarding Marijuana Enforcement,
providing services in states that have an effective regulatory system in place, but that threaten the
federal priorities listed previously, “will subject that person or entity to federal enforcement
action, based on the circumstances” (Cole, 2013, p.4). The lack of clear, explicit guidance and
rules relating to services that CPAs could offer makes it difficult for these licensed accountants
to determine what will put them in jeopardy of violating federal priorities (AICPA, 2016).
From an attestation standpoint, it is difficult for CPAs to determine what will and will not
violate federal priorities when comprehensive auditing standards for marijuana-related clients are
nonexistent (Barreras, Ittleman, & Fuerst, 2014). Although there is no explicit guidance for
providing services to the marijuana industry, there are a number of standards that are applicable
to all CPAs regardless of the industry in which they work that must be complied with throughout
an audit. According to the AICPA Code of Professional Conduct, Rule 1.400.001, members
should not act in a way that is discreditable to the accounting profession which includes failing to
follow the requirements of governmental bodies, commissions, or other regulatory bodies
(AICPA, 2014).
The difficulties for CPAs providing attestation services are especially prevalent in states
such as New Mexico and Minnesota, which have legalized marijuana for medicinal use. Both
states require annual audits of producers to be performed by independent CPAs (Minnesota
Statutes, 2015; New Mexico Administrative Code, 2015). According to an AICPA brief on state
marijuana laws and the CPA profession, a CPA in New Mexico sought advice from the New
Mexico Department of Health, who in turn wrote to the New Mexico Public Accountancy Board,
for direction on how to provide services to marijuana businesses (AICPA, 2016). The Board
responded by saying that it could not issue a letter authorizing CPAs to conduct audits of
marijuana businesses because it did not have the authority and that the Department of Health
should remove its audit requirement until federal and state laws no longer conflict (AICPA,
2016).
Another part of the AICPA Code of Professional Conduct is Rule 1.300.001 which
addresses the general standards that accountants in practice are expected to follow including:
professional competence, due professional care, planning and supervision, and sufficient relevant
data (AICPA, 2014). In terms of competency, CPAs who consider providing services to the
marijuana industry must decide whether they have sufficient knowledge to plan the engagement
properly. Although CPAs can gain competence through research, continuing professional
education, and working with people experienced and knowledgeable in the industry, this is not
easy due to the recent emergence of the industry and limited availability of such resources
(AICPA, 2016).
In addition to competency, when planning an engagement, CPAs must have a complete
understanding of a business entity, including the regulatory and legal environment of the
industry, in order to assess the risk of material misstatement for that client (AICPA, 2016). This
is an ever-present challenge for CPAs when the marijuana industry is constantly changing, there
are inconsistencies between the state and federal laws, and the possibility exists that the federal
government could criminalize the industry at the state level at any time (Borchardt, 2015). This
can also make it difficult for CPAs to obtain sufficient relevant data in relation to a client’s
compliance with laws and regulations, especially when the industry is illegal in itself from a
federal perspective (AICPA, 2016).
In determining the risk of material misstatement CPAs must consider the risks associated
with businesses participating in the marijuana industry (AICPA, 2016). The risks for marijuana-

Journal of Legal, Ethical and Regulatory Issues Volume 19, Number 2, 2016
20
related businesses are especially numerous. These risks result from multiple factors but one of
the most noticeable is the fact that marijuana businesses currently operate in an almost entirely
cash based industry (Gard, 2014). Operating solely in cash results in a lack of transparency for
accounting and auditing purposes (Stinson, 2015). This lack of transparency stems from
bookkeeping difficulties that result from working on a cash-only basis (Tax Policy Issues, 2016).
Auditors also typically reconcile a client’s count of funds to a bank’s count to increase the
reliability of information, however, this reliability is eliminated when businesses do not have a
relationship with a bank and CPAs must rely solely on the business’s record of cash (AICPA,
2016). Another concern for CPAs to consider is that operating on a cash basis provides
businesses with the opportunity to underreport revenues in order to report lower income for tax
purposes (Tax Policy Issues, 2016).
The difficulties CPAs face for providing services to marijuana-related clients from a tax
perspective are just as pervasive as for providing attestation services. There are numerous issues
that arise when businesses must determine their amount of taxable income for state and federal
purposes. These issues stem, in part, from the Section 280E exclusion that disallows the
deduction of business expenses from gross income for marijuana businesses (26 U.S.C. §280E,
2012). Tax practitioners are in need of clear guidance as to what can and cannot be deducted
under Section 280E (Davison, 2015). In order for CPAs to provide tax services to clients in an
industry that is characterized by legislative ambiguity, they must exercise due diligence
throughout the process of providing these services (AICPA, 2016). Part of the CPA’s due
diligence includes considering all information that is available to them to determine whether they
can ethically and practically perform the services. The Statements on Standards for Tax Services
(SSTS) and AICPA Code of Professional Conduct are particularly helpful when determining the
ethicality of providing services to marijuana-related clients (AICPA, 2016).
SSTS No. 1, 2, and 3 can help guide practitioners throughout the process of providing
services to marijuana-related clients. SSTS No. 1 provides practitioners with guidance on
recommending tax return positions. This is especially important for CPAs providing services in
the marijuana industry because due to the lack of firm guidance, practitioners must ensure
positions recommended to the client have a reasonable basis and are properly disclosed, if
necessary (AICPA, 2010). A prime example of this would be the COGS calculation, practitioners
should determine whether the taxpayer’s calculation is reasonable and if it should be disclosed or
not. The practitioner should also advise the taxpayer of any potential penalties that could be a
consequence of not disclosing certain tax return positions (AICPA, 2010).
SSTS No. 2 states that practitioners should make a reasonable effort to obtain all
necessary information for appropriate answers to questions on a tax return (AICPA, 2010). In
addition, SSTS No. 3 provides that a practitioner can, in good faith, use information provided by
the taxpayer without verification, unless the law requires supporting documentation (AICPA,
2010). It also provides that they should attempt to obtain support for tax information provided
whether through inquiry or referring to the prior year’s return, if feasible (AICPA, 2010). When
operating in a cash-based industry there is likely to be little verification available for much of a
marijuana business’s tax information. As such, practitioners should refer to SSTS No. 2 and 3 to
obtain answers to all necessary questions to sign the return, to determine whether information
can be included on the return, and the possible penalties that could arise from not including
information or including inaccurate information.

Journal of Legal, Ethical and Regulatory Issues Volume 19, Number 2, 2016
21
Due to the numerous concerns CPAs face when determining whether to provide services
to marijuana businesses, the AICPA provided the following eight questions for CPAs to consider
prior to providing services to the industry (AICPA, 2016, pp.12-13):
1. What, if any, is the position of my State Board of Accountancy on CPAs providing services to
marijuana growers/distributors?
2. What are the legal risks of providing services to these businesses in my state?
3. Is there a risk of prosecution to a CPA firm that provides services to marijuana-related businesses?
4. What is the likelihood that the Drug Enforcement Administration (DEA) or the Department of
Justice is going to prosecute this marijuana-related business?
5. How are CPAs in my state currently offering services to state-recognized medical marijuana
dispensaries?
6. How will providing the contemplated services affect my malpractice insurance? How will it affect
my professional liability insurance?
7. What is the likelihood that I may be disciplined, sanctioned, or lose my license for providing
services to these businesses?
8. What procedures/policies should I consider to assess whether the prospective client understands
the laws of his or her state concerning marijuana-related businesses and does the client follow
those rules?
The AICPA also recommends that CPAs consult with their lawyer and state board of
accountancy when venturing into the legal gray area that is involved with providing services to
the marijuana industry (AICPA, 2016). Although marijuana may be legal at the state level, the
illegality of the substance at the federal level results in an uncertain and risky area of business for
CPAs providing tax and audit services (Gramlich and Houser, 2014).
In addition to considering the preceding questions, prior to providing services to clients in
the marijuana industry, CPAs should also determine how their state board of accountancy defines
the “good moral character” requirement (AICPA, 2016). The issue with determining what is
considered good moral character is that few states define what it is, they merely state that a CPA
must have it in order to obtain a license (AICPA, 2016). As such, there is the potential for states
to consider providing services to the marijuana industry as violating the good moral character
requirement (Gramlich and Houser, 2015). This in turn could result in states choosing to not
grant or renew a license (Borchardt, 2015). CPAs could also theoretically face difficulties in
obtaining a reciprocal license from a state that has not legalized marijuana after providing
services to a marijuana business in a state that has legalized it (AICPA, 2016).
In addition to the potential difficulties with licensing, CPAs could face issues with their
malpractice insurance as well. A CPA must know what is specifically included and excluded in
their insurance coverage because liability policies typically have an exclusion for criminal acts
(AICPA, 2016). An example of this occurred in the legal profession where a Denver lawyer lost
her insurance coverage for providing services to marijuana clients even though the substance is
legal in Colorado (Wilson, 2014).
CONCLUSIONS AND COMMENTS
The dichotomy between state and federal laws concerning the marijuana industry has
created numerous issues for financial institutions, the accounting profession, and for business
owners. To date, no action has been taken on the part of the federal government to specifically
prohibit or encourage it. If this trend continues, of states legalizing recreational marijuana and

Journal of Legal, Ethical and Regulatory Issues Volume 19, Number 2, 2016
22
the federal government not taking explicit action, there are number of consequences that could
occur from an accounting and financial perspective.
If the federal government continues to issue limited guidance concerning recreational
marijuana and the enforcement of policies in regards to it, then businesses will continue to
operate in an environment of legal uncertainty. Consequently, as states continue to legalize
recreational use, it is likely that more precedents will be set in court for which businesses will be
able to use as a form of guidance. This would be similar to that of the CHAMP case that set the
precedent for entities with separate business activities being allowed to deduct expenses related
to the non-marijuana portion of the business. The experiences of businesses that have been in
practice for a number of years will essentially become the guidance and standards for the
industry due to the lack of federal guidance.
A lack of action at the federal level may also encourage more states to consider the
legalization of recreational marijuana if they believe businesses in the state will not be penalized
by the federal government for choosing to do so. More states legalizing marijuana will result in
the creation of additional marijuana-related businesses and, as such, the issues that are already
present for the businesses will continue and new issues are likely to arise. As new problems
come about, businesses will seek further guidance on how to approach them, which may not be
available due to the inconsistencies between the state and federal laws.
As the dichotomy between the state and federal governments continues, financial
institutions will remain wary of providing services to marijuana-related businesses due to the
possibility of being penalized by the federal government under a number of federal regulations.
The federal government has issued some guidance in regards to financial institutions providing
services to marijuana clients, stating that they must ensure they are in compliance with the
applicable federal regulations. This requires increased effort and diligence by the financial
institutions that many are currently not willing to engage in, the cost and potential risks of
providing services are not yet worth the benefits from the banks’ perspectives. If banks continue
to remain wary of providing services to the industry, it is likely that the number of intermediary
institutions that have begun to develop in recent years will increase in order to service the
growing marijuana business market.
However, if states continue to legalize recreational marijuana and the number of
marijuana-related businesses increases, it is possible that banks may reconsider their stance on
providing services if they believe the situation has reached a point where the benefits will
outweigh the potential costs. This situation is likely a long ways away though due to the high
number of regulations banks must adhere to, that if not complied with can be a criminal offense.
Financial institutions are currently not willing to risk their established positions in federally legal
industries to obtain a comparatively small portion of the federally illegal recreational marijuana
industry.
In order to comply with all existing standards and guidance, financial institutions must be
very knowledgeable of their potential clients. This includes performing customer due diligence
when considering providing services. As listed in Table 2 below, there are a number of activities
that can be performed in order to obtain this knowledge of the customer. By implementing these
activities, financial institutions are more likely to adhere to applicable standards and lessen the
risk of federal scrutiny.

Journal of Legal, Ethical and Regulatory Issues Volume 19, Number 2, 2016
23
Table 2
SAMPLE DUE DILIGENCE ACTIVITIES
1. Verifying with the appropriate state authorities whether the business is duly licensed and registered;
2. Reviewing the license application (and related documentation) submitted by the business for obtaining a
state license to operate its marijuana-related business;
3. Requesting from state licensing and enforcement authorities available information about the business and
related parties;
4. Developing an understanding of the normal and expected activity for the business, including the types of
products to be sold and the type of customers to be served (e.g., medical versus recreational customers);
5. Ongoing monitoring of publicly available sources for adverse information about the business and related
parties;
6. Ongoing monitoring for suspicious activity;
7. Refreshing information obtained as part of customer due diligence on a periodic basis and commensurate
with the risk.
Source: Financial Crimes Enforcement Network
From the perspective of the marijuana business owner, if new precedents arise from court
cases, proprietors will be able to implement those precedents accordingly into their businesses if
applicable. This provides for the possibility that business owners may find other legal ways to
reduce their taxable income and thus reduce their effective tax rates. As long as financial
institutions remain wary of providing services to the marijuana industry and business owners are
unable to establish relationships with banks, the recreational marijuana industry will continue to
work in a cash-only environment. This will result in businesses still being a target for theft due to
the large amounts of cash they have on hand. However, if financial institutions begin to offer
services to marijuana businesses or intermediary institutions grow, the industry will have the
opportunity to move away from a cash-only basis and the dangers for business owners and their
employees will be reduced.
If states continue to legalize recreational marijuana and the federal government maintains
their current position on the substance, CPAs will have to choose what they want to do. There is
nothing specific that prohibits CPAs from providing services to marijuana clients, however there
are standards that must be followed for all services they provide that they must consider. CPAs,
like financial institutions, would have to increase their level of due diligence when performing
work and be aware of the potential consequences should they do something incorrectly.
Understanding and applying the SSTS and the AICPA Code of Professional Conduct would be
beneficial from this perspective.
CPAs should also be careful to review their malpractice insurance coverage to ensure that
providing services to marijuana clients will not cause them to lose their insurance. As long as
marijuana remains illegal at the federal level it is possible that insurance carriers can consider
marijuana businesses to be taking part in a criminal act. In addition, each state board of
accountancy has separate and distinct rules governing CPAs licensed within the state.
Practitioners should ensure they are in compliance with all state regulations and that they do not
act in a way that could jeopardize their license. It is also worthy to note that there is the potential
for an uptick in IRS audits of marijuana-related businesses due to the increased opportunities for
tax evasion. These increased opportunities arise from the cash-only environment of the industry
and the lack of clear regulations and guidance that can result in business taking varying tax
positions, that may not all be correct.

Journal of Legal, Ethical and Regulatory Issues Volume 19, Number 2, 2016
24
REFERENCES
American Institute of CPAs (AICPA). (2010). Statements on Standards for Tax Services.
American Institute of CPAs (AICPA). (2014). Code of Professional Conduct.
American Institute of CPAs (AICPA). (2016). An Issue Brief on State Marijuana Laws and the CPA Profession.
ArcView Market Research and New Frontier Data. (2016). The State of Legal Marijuana Markets [Executive
Summary] (4th
ed.). Report to be released March 2016.
Bank Secrecy Act (BSA), 31 U.S.C. §5318(g) (2012).
Barkacs, L.L., & Barkacs, C.B. (2010). Do I Feel Your Pain? Medical Marijuana, the Workplace, and Federalism.
The Journal of Legal, Ethical and Regulatory Issues, 13(1), 67-74.
Barreras, M. R., Ittleman, A. S., & Fuerst, M. S. (2014). IRC § 280E - An Albatross For Marijuana Industry -
Law360. Retrieved March 19, 2016, from http://www.law360.com/articles/519253/irc-280e-an-albatross-
for-marijuana-industry
Borchardt, D. (2015). Tax Time Hits Hard for Marijuana Businesses. Retrieved March 19, 2016, from
http://www.forbes.com/sites/debraborchardt/2015/03/17/tax-time-hits-hard-for-marijuana-
businesses/#50039d4b2c2c
Californians Helping to Alleviate Medical Problems, Inc. v. Commissioner of Internal Revenue (CHAMP) (United
States Tax Court May 15, 2007).
Canna Care, Inc., A California Not-for-Profit Corporation v. Commissioner of Internal Revenue (United States Tax
Court October 22, 2015).
Clark, P. (2000). The Ethics of Medical Marijuana: Government Restrictions vs. Medical Necessity. Journal of
Public Health Policy, 21(1), 40-60.
Cole, J. M. (2011). Memorandum for United States Attorneys "Guidance Regarding the Ogden Memo in
Jurisdictions Seeking to Authorize Marijuana for Medical Use" (Department of Justice, Office of the
Deputy Attorney General).
Cole, J. M. (2013). Memorandum for All United States Attorneys "Guidance Regarding Marijuana Enforcement"
(U.S., Department of Justice, Office of the Deputy Attorney General).
Cole, J. M. (2014). Memorandum for All United States Attorneys "Guidance Regarding Marijuana Related
Financial Crimes" (Department of Justice, Office of the Deputy Attorney General).
Colorado State Board of Accountancy. (2015). Colorado Board of Accountancy’s Position Statement Regarding
Certified Public Accountant Certificate Holder’s Providing Services to the Marijuana Industry.
Controlled Substances Act (CSA), 21 U.S.C. §§812(b)(1) and 812(c), Schedule I(c)(10) (2012).
Cussen, M. & Block, W. (2000). Legalize Drugs Now! An Analysis of the Benefits of Legalized Drugs. American
Journal of Economics and Sociology, 59(3), 525-536.
Davison, L. (2015). Tax Practice: Hazy Marijuana Laws Cause Headaches for IRS, Side Effects for Practitioners
(Rep.). Retrieved March 14, 2016, from https://www.irs.gov/pub/irs-
utl/Hazy_Marijuana_Laws_Cause_Headaches_for_IRS.pdf
Financial Crimes Enforcement Network (FinCEN). (2012). FinCEN Suspicious Activity Report (FinCEN SAR)
Electronic Filing Instruction.
Financial Crimes Enforcement Network (FinCEN). (2014). BSA Expectations Regarding Marijuana-Related
Business.
Gard, J. S. (2014). Banks, Stay Wary of Marijuana-Related Businesses. Retrieved March 18, 2016, from
http://www.americanbanker.com/bankthink/banks-stay-wary-of-marijuana-related-businesses-1066321-
1.html
Gramlich, J., & Houser, K. (2015). Marijuana Business and Sec. 280E: Potential Pitfalls for Clients and Advisers.
Retrieved from http://www.thetaxadviser.com/issues/2015/jul/houser-jul15.html#fnref_31
Hargreaves, S. (2013). Marijuana dealers get slammed by taxes. Retrieved March 15, 2016 from
http://money.cnn.com/2013/02/25/smallbusiness/marijuana-tax/
Huddleston, T., Jr. (2014). Pot industry is a buzz-kill for banks. Retrieved April 5, 2016 from
http://fortune.com/2014/11/21/ancillary-businesses-cannabis-industry/
Huddleston, T., Jr. (2015). The marijuana industry's battle against the IRS. Retrieved March, 2016, from
http://fortune.com/2015/04/15/marijuana-industry-tax-problem/
James v. United States (United States Supreme Court 1961).
Jeffrey Edmondson v. Commissioner (United States Tax Court October 26, 1981).
Keyso, A. J. (2011). [Letter written December 16, 2010 to Fortney Pete Stark]. Washington, D.C.: Internal Revenue
Service.

Journal of Legal, Ethical and Regulatory Issues Volume 19, Number 2, 2016
25
McElroy, W. T., Jr. (2015, January 23). Taxpayers Trafficking in a Schedule I or Schedule II Controlled Substance -
- Capitalization of Inventoriable Costs (U.S., Internal Revenue Service, Office of Chief Counsel).
Merriman, D. (2010). The Micro-Geography of Tax Avoidance: Evidence from Littered Cigarette Packs in
Chicago. American Economic Journal: Economic Policy, 2(2), 61–84. Retrieved from
http://www.jstor.org/stable/25760063
Minnesota Statutes, §152.37, subdivision 2 (2015).
Money Laundering Control Act of 1986, 18 U.S.C. §§1956(a)(1) and 1957(a) (2012).
National Cannabis Industry Association. (2015). Internal Revenue Code Section 280E: Creating an Impossible
Situation for Legitimate Businesses.
National Conference of State Legislatures. (2016). Marijuana Overview. Retrieved from
http://www.ncsl.org/research/civil-and-criminal-justice/marijuana-overview.aspx
New Mexico Administrative Code, §7.34.4.23(B)(2) (2015).
Olive v. Commissioner of Internal Revenue (United States Court of Appeals, Ninth Circuit July 9, 2015).
Olson, B. (2015). Chart of the Week: Black Market Marijuana Taking Big Hit in States With Operating
Dispensaries, Rec Shops. Retrieved March 19, 2016, from http://mjbizdaily.com/chart-week-black-market-
marijuana-taking-big-hit-states-operating-dispensaries-rec-shops/
Oregon Board of Accountancy. (2015). Guidance for Licensees Providing Services to the Marijuana Industry.
Osei-Hwere, E.M., Armfield, G.G., Kinsky, E.S., Gerlich, R.N., & Drumheller, K. (2014). Ethical Implications of
Lance Armstrong’s Performance-Enhancing Drug Case. Journal of Legal, Ethical and Regulatory Issues, 17(1), 1-
13.
Prohibition of unlicensed money transmitting businesses, 18 U.S.C. §1960(b)(1)(C) (2012).
Stinson, J. (2015). States Find You Can't Take Legal Marijuana Money to the Bank. Retrieved from
http://www.pewtrusts.org/en/research-and-analysis/blogs/stateline/2015/1/5/states-find-you-cant-take-legal-
marijuana-money-to-the-bank
Tax Policy Issues Associated with Legalized Retail Marijuana: Testimony before the Vermont Senate Committee on
Finance (2016) (Testimony of Carl Davis and Richard Phillips).
United States Code, 26 U.S.C. §162(a) (2012).
United States Code, 26 U.S.C. §61(a) (2012).
United States Code, 26 U.S.C. §280E (2012).
United States Congress, Joint Committee on Taxation. (1983). General explanation of the revenue provisions of the
Tax Equity and Fiscal Responsibility Act of 1982: (H.R. 4961, 97th Congress, Public Law 97-248).
Washington: U.S. G.P.O.
Washington State Board of Accountancy. (2014). Position Statement of the Executive Director of the Washington
State Board of Accountancy.
Wilson, J. (2014,). Taxation of Medical Marijuana Dispensaries- Part Three of a Three-part Series. Retrieved from
http://wilsontaxlaw.com/newsresources/tax-publications/taxation-medical-marijuana-dispensaries-part-3/

Journal of Legal, Ethical and Regulatory Issues Volume 19, Number 2, 2016
26
TAX LOTTERIES: THE CROWDING-OUT OF TAX
MORALE AND LONG-RUN WELFARE EFFECTS
Marco Fabbri, Erasmus University Rotterdam
Daniela C. Wilks, Universidade Europeia-Laureate International Universities
ABSTRACT
This paper examines tax lottery policies as a method to reward consumers who request
business receipts for goods and services they have paid for. We argue that the evaluation of
the welfare effects of tax lotteries based solely on short-run tax revenue variations overlooks
important long- term sources of inefficiency. Tax lotteries may crowd out the willingness of
individuals with leading roles in shaping social norms to engage in voluntary third-party tax
enforcement, and thus cause long-term welfare losses. We sought support for our argument
analyzing the case of the Portuguese tax lottery and conducting an empirical study with a
sample of Portuguese nationals. Findings show that tax morale is a key determinant of
voluntary third-party tax enforcement, and that the level of education is positively associated
with the crowding out of the intrinsic motivation to engage in voluntary third-party tax
enforcement.
INTRODUCTION
For tax authorities, efficiently monitoring and sanctioning VAT evasion is a
challenging task. The 2015 VAT Gap report estimates that in 2013, EUR 168 billion in VAT
revenues were lost in the European Union due to non-compliance or non-collection. The so
called VAT Gap, the difference between the expected VAT revenue and the VAT actually
collected, equated to 15.2% of total expected VAT revenue of the 26 member states at that
time. The VAT GAP varied between 4% in the Netherlands, Sweden and Finland, and 41% in
Romania.
A common strategy for business owners to evade VAT is not to issue the invoice of a
business transaction and to pocket the equivalent amount of VAT. In recent years, tax
authorities in different countries have devised a new behavioral approach to engage
consumers in the fight against tax evasion. Tax lotteries were organized to motivate
consumers to request receipts for goods and services they have paid for. To isolate the
causal effects of tax lotteries on VAT revenue is not an easy undertaking, but an analysis of
the tax lotteries impact suggests a significant positive increase in net tax revenue a few years
after their implementation (Naritomi, 2013; Wan, 2010).
In this paper we argue that an evaluation of the welfare effects of tax lottery policies
based solely on short-term variation of VAT revenue may overestimate their welfare effects
by overlooking important long-term inefficiencies. Our analysis moves from the current
undisputed evidence that material incentives may crowd out non-financial motives, such as
moral values and civic virtues, while simultaneously determine unpredicted effects on
behavior (Bowles, 2008). This has been referred to as the “crowding-out effect” (Frey and
Jegen, 2001).
The argument advanced here is that implementing a tax lottery to encourage
consumers to ask for sales receipts may be counterproductive due to the crowding-out of the

Journal of Legal, Ethical and Regulatory Issues Volume 19, Number 2, 2016
27
intrinsic motivation to engage in voluntary third-party tax enforcement. An evaluation based
only on the short-term effects of tax lotteries disregards possible long-term indirect effects.
While the introduction of the tax lottery may determine a temporary raise of the net tax
revenue, the crowding-out effect may increase over time by spilling over to future generations.
This raises a fundamental question as to whether VAT losses caused by the crowding-out
effect are larger than the increase in tax revenue generated by the tax lottery (taking into
account the expense of the lottery prize).
Furthermore, tax lotteries may impact on the intergenerational transmission of norms
regarding tax morale, defined here as the intrinsic motivation to comply with tax duties or
the moral imperative to be honest regarding taxes (Feld and Frey, 2002; Lewis, 1982). This is
especially likely to happen if the crowding-out effect is concentrated on people who play a
pivotal role in shaping future generations’ social norms and values, such as highly educated
members of the population. Hence, irrespective of short-term positive impact evaluations,
the choice to implement tax lotteries may still create long-term inefficiencies and even a
permanent welfare loss.
The argument advanced here is supported by the findings of an empirical study
conducted in Portugal, which suggest that the tax lottery has mixed effects on the
propensity to engage in third-party tax enforcement. The lottery may motivate some
consumers to enforce the emission of invoices, but it also crowds-out the willingness to engage
in voluntary third-party tax enforcement in a sizeable fraction of the population. The crowding-
out effect is concentrated on the most educated people, who are more likely to have leading
roles in transferring tax morale to future generations. Hence, while evidence shows that the
Portuguese tax lottery boosted tax revenues and accordingly is considered to be a success by
the government, policy makers should be aware of this short-run evaluation, which may
compromise the long-run welfare effects of the tax lottery policy.
Although tax lotteries have been used in different countries to fight tax evasion,
they have received limited research attention. Moreover, to the best of our knowledge, no study
has focused explicitly on the possibility that tax lotteries crowd-out the willingness to
engage in voluntary third-party tax enforcement. The purpose of this study is to fill this gap.
The article proceeds as follows. It begins with a literature review of the rationale behind
the use of tax lotteries and a brief overview of work on tax evasion. The main focus is on
recent articles that analyze tax lottery policies as an instrument to enhance tax compliance.
The following section elaborates the claim that the crowding-out effect caused by tax
lotteries, if concentrated on people with higher level of education, may generate a long-term
reduction in VAT collection by hampering the intergenerational transmission of tax morale.
Section 4 describes the institutional details of the Portuguese tax lottery and the results of our
survey are discussed in section 5. In the last section, a conclusion is drawn and possible
avenues for future research are suggested.
LOTTERIES AGAINST TAX EVASION
Neoclassical economic models consider agents’ decision to engage in tax evasion as the
result of cost and benefit calculations (Allingham and Sandmo, 1972; Becker, 1968; Yitzhaki,
1974). This has been disputed, but if this were the case, to achieve compliance would be
prohibitively expensive (Blumenthal and Slemrod, 1992). Past regulation-related research that
analyses the difficulties in contrasting frauds and tax evasion includes work by Alleyne and
Elson (2013), Blazovich et al. (2013) and Drucker et al. (2012) to name a few. This line of

Journal of Legal, Ethical and Regulatory Issues Volume 19, Number 2, 2016
28
research confirms that tax evasion remains a widespread problem (Feige, 2007), and that the
costs of deterrence methods of tax enforcement are high and their effectiveness is low. This
explains the growing interest of scholars and policy makers in new approaches that
complement traditional enforcement methods (Feld and Frey, 2007; McMahon et al., 2016).
The current study focuses on VAT evasion. A key proposition advanced by prominent
scholars is that the presence of third-party tax enforcers supplements the centralized tax
enforcement system and thus constitutes a key ingredient in preventing tax evasion (Kleven et
al., 2006). However, in the context of VAT evasion, consumers have no material incentives to
enforce the emission of invoices. The VAT involved in the transaction will be redistributed to
the entire population, but the individual benefits only from a negligible fraction of the tax paid
by the business owner. On the other hand, the consumer bears material costs in requesting for
a receipt. First, because the consumer forgoes the possibility to engage in a collusive
agreement with the business owner which could give a discount equal to a fraction of the VAT
evaded. Second, if the social norm is positive towards tax evasion, the consumer by acting as
a third-party tax enforcer faces moral costs in requesting the emission of invoices (McGee,
2011).
Therefore, consumers enforcing VAT payment bear an individual cost and produce a
positive externality that they do not internalize. This situation is well captured by the
incentives scheme typical of a public good dilemma - voluntary contribution in the form of
third-party tax enforcement would be optimal and would enhance the social good, but the
dominant strategy for an individual payoff maximizer is to free-ride on contribution. Given this,
it is plausible to think that consumers engage in a suboptimal level of invoices emission
enforcement (Fabbri and Hemels, 2013).
Different strategies have been tried to encourage third-party enforcement of invoices
emission. Some European countries, for instance Belgium and Italy, attempted to oblige
consumers to request a receipt by imposing sanctions. This strategy was difficult to implement
and was ultimately ineffective. Conversely, a tax lottery system based on rewards instead of
sanctions may induce consumers to act as third-party tax enforcers. This is the rationale behind
the tax lottery incentives scheme. Consumers want to participate in a lottery to win a prize, and
accordingly are willing to request business receipts, which is the only means to participate in
the lottery. If the increase in VAT revenue generated by the lottery is larger than the prize
awarded, net tax revenue increases.
Although tax lottery policies have been common in some parts of the world since many
decades, they have been rare in Europe. So far, and only in recent years, Malta, Portugal and
Slovakia are the three EU countries that implemented a tax lottery to increase VAT compliance.
It should be noted, however, that the interest of European governments for the use of
lotteries in order to reinforce desirable behaviours has increased (Fooken et al., 2015). The
interest of governments and policy makers in tax lotteries is due to the belief they are a
cost-effective and easy to implement policy tool.
In recent years, scholarly work on the topic of lotteries has flourished. For example,
Martin and Dolan (2010) propose an incentive in form of lottery participation for
incentivizing timely submission of income tax declaration. Marchese (2009) shows that the
provision of in-kind incentives to consumers can reduce tax evasion. In the same vein,
Fabbri (2015) advances a theoretical model based on the Prospect Theory that establishes
boundary conditions for an implementation of a welfare-improving lottery. Empirical results
from laboratory experiments provide evidence that tax lottery can effectively reduce tax

Journal of Legal, Ethical and Regulatory Issues Volume 19, Number 2, 2016
29
evasion. Alm et al. (1992) investigated the use of tax lotteries in a laboratory setting, and
showed that lottery participation linked to compliance is more effective in lowering tax evasion
than fixed rewards and audits. It should be noted that findings from another study suggest that
there are gender differences. In the experiment conducted by Brockmann et al. (2015), while
female participants complied more when offered a conditional reward in the form of lottery
tickets, male participants reacted to the incentives by increasing tax evasion.
Contributions based on field data further confirm that implementing tax lotteries may
reduce VAT evasion. For instance, Wan (2010) explored the different time of implementation of
the tax lottery policy in Chinese provinces in order to estimate its effect on tax revenue over
five years. He found that for each dollar paid out as a prize, the Chinese government raised
additional thirty to forty US dollars of VAT revenue. In the same line, Naritomi (2015)
estimated the effect of the tax lottery implementation in the State of Sao Paulo, Brazil. She
explored a discontinuity in the way the level of the lottery prizes were assigned in order to
draw causal inferences about the lottery effects in the first few years after the introduction.
Results confirmed that the tax lottery lowered VAT evasion, and that the increase in tax
revenue exceeded the cost of the lottery prizes, hence generated a net VAT revenue increase.
To sum up, theoretical predictions and empirical evidence suggest that tax lotteries are a valuable
tool to fight tax evasion. However, a point worth noting is that all these studies focus on a short
period after the lottery introduction. As we will argue in the next section, in a long-run over a
longer period of time tax lotteries may cause a permanent reduction of VAT by crowding-out the
voluntary third-party tax enforcement.
TAX MORALE, FINANCIAL INCENTIVES AND THE CROWDING-OUT EFFECT
A wide strand of research in economics, economic psychology and other social sciences
suggests that incentives often fail to achieve the intended results, and in some cases can even
backfire. As explained before, the crowding out of the intrinsic motivation is known in the
literature as “the crowding-out effect,” and has been thoroughly studied. To give some
examples of work in this field, studies show that subsidies for high school matriculation have
only a small effect on girls and no effect on boys (Angrist and Lavy, 2009); incentives based on
academic achievement also proved to have limited effects on performance (Fryer 2010);
fines imposed to reduce hospital stay in Norway had the effect to increase hospitalization
(Holmas et al., 2010); monetary incentives to foster blood donations do not affect men’s
blood quantity collected and even lowered women’s contribution (Mellstrom & Johannesson,
2008); a (small) monetary reward to volunteers fundraising for non-profit organizations lowers
the amount of funds gathered (Gneezy and Rustichini, 2000). The above findings are in line
with the idea that to attach a financial value to something that is considered socially important
degrades one’s “moral standing” (Dubas et al., 2014). Or, as Morgan (2000, p.777) claims, “the
linkage between private gain from lotteries and public goods provision may actually reduce a
taste for altruism or ‘warm glow’ that individuals obtain through giving behaviour”.
From the foregoing it may be inferred that tax lottery policies, by offering a receipt for
enforcing the emission of a receipt, may generate a crowding-out effect and thus reduce the
number of third-party tax enforcers. As mentioned before, consumers do not obtain material
benefits from enforcing VAT payments. Therefore, third-party enforcement in this case may be
driven by non-material reasons, such as the willingness to contribute to the community well-
being (given that services are financed by taxes), or ethical concerns for justice (tax evaders
are unlawfully enriching themselves at the expenses of “good citizens”, who pay their taxes).

Journal of Legal, Ethical and Regulatory Issues Volume 19, Number 2, 2016
30
Research related to the ethical dimension of tax compliance points in this direction (Nickerson
et al., 2009; Bolt- Lee and Moody, 2009).
Empirical evidence shows that lottery incentives can be detrimental for consumers’
willingness to engage in third-party tax enforcement, and can impact on business owners’
reaction to the consumers’ enforcement action. In a laboratory experiment, Fuster and Meier
(2012) found that incentives have a detrimental effect on the peers’ willingness to punish free
riders. The authors run a public good game where participants (i) chose a level of
contribution to the public good and (ii) could punish peers whose contribution was below the
average. In a second treatment condition, subjects received an additional monetary incentive
in form of lottery tickets proportional to their contribution to the public good. Results showed
that, in the condition “with incentives”, peers punish less harshly contributions below the
average. Therefore, the introduction of the incentive did not increase the net level of public
good collected. This was explained by the author as the punishers being “over motivated” by
the incentive (i.e., by not contributing, the free rider had already decided to forgo the incentive)
and that free riders had not felt the shame or guilt for not having contributed (i.e., they had
already “paid the price” of not collecting the incentive).
The crowding-out effect discussed so far would be generated immediately by the lottery
introduction. Therefore, even a short-term estimation of the tax lotteries effect on VAT revenue
is sufficient to establish whether the crowding-out effect determines a net tax revenue loss or if it
is more than compensated by the lottery incentive to request invoices. However, another form of
crowding-out effect cannot be captured by a short-term empirical analysis. Indeed, it is possible
that the crowding-out effect spillover across generations. The process of transmission of social
norms and values from one generation to the following one operates through the influence of
both formal and informal institutions (Tabellini, 2010).
Educators and opinion leaders play a particularly important role in accomplishing
the transmission of social norms, including the willingness to engage in voluntary third-party
tax enforcement. Given their special role, should their internal motivation be negatively
affected for whatever reason, the consequences would be borne both directly (e.g., the
immediate change in their public behavior), and indirectly in future years (e.g., the public
leader would transmit to future generations a bundle of depleted values and norms) by the
society as a whole. As for third-party tax enforcement, if the public leaders’ internal
motivation is crowded-out by the introduction of tax lotteries, the welfare effects will involve
both an immediate reduction in the share of voluntary third-party tax enforcers (the direct,
short-term effect), and additionally a hampered transmission of the ethical commitment to
engage in third-party tax enforcement for the future generation (the indirect, long-term effect).
Furthermore, the indirect effect of crowding-out will continue to spread out across generations,
since for each public leader failing to transmit values and ethical norms, many citizens and future
public leaders will be negatively affected. The effect will be thus multiplied over time, which
will determine a progressive reduction of voluntary tax enforcement. Eventually, the decline in
net tax revenue may generate a permanent welfare loss. We can conclude that, in spite of the
benefits of the initial periods immediately after the introduction of the tax lottery, in the long-run
the policy effect may result in a permanent tax revenue loss.
Considering the key role of public leaders in shaping tax morale, it is important to
raise the question how the crowding-out generated by tax lotteries affects their willingness
to act as voluntary tax enforcers. Public leaders are on average more educated than the
average member of the population. Consistently, previous research shows that education has a

Journal of Legal, Ethical and Regulatory Issues Volume 19, Number 2, 2016
31
positive effect on tax morale and on the propensity to act as third-party tax enforcers
(Lewis, 1982; Ross and McGee, 2012). In the next section we report some preliminary
evidence that the crowding-out effect caused by the lottery is concentrated on the most
educated individuals. Hence, public leaders are especially affected by the crowding-out
effect. This fact supports our concerns regarding the problem of transmitting social norms
and values to future generations. Before presenting the results of our survey study, we shall
provide a brief overview of the Portuguese tax lottery.
THE PORTUGUESE TAX LOTTERY
In Portugal lost revenue to the shadow economy is estimated to be 26.81 per cent of
national output. VAT revenues represent around 60 per cent of the total indirect taxes and 25
per cent of total tax revenues. It is estimated that more than 20% of VAT remains
uncollected. As it is common in many countries, business owners benefit from not issuing the
invoices in all business transactions and by doing so they evade taxes. Traditional attempts
to foster tax compliance based on deterrence models have been ineffective, and tax evasion
has remained a widespread problem in the country. In an attempt to contrast the problem of
indirect tax evasion, in 2014 the tax lottery program was launched to engage consumers in
cracking down on tax evaders.
The lottery aims to motivate consumers to request receipts for goods and services they
have paid for. The bills can be for any amount and of any kind. The receipts are converted
into lottery tickets according to the value of each transaction. From April 2014 onwards
weekly lotteries have been held and up market cars offered as prizes. According to
governmental sources, the cost of the cars is outweighed by the increase in tax revenues, and
the number of sales transactions communicated to the tax authorities leapt by 45.4 per cent
in comparison to the previous year.
THE SURVEY STUDY
An empirical study was conducted in order to investigate the motivation underlying
intentions behind requesting sales receipts and the effect of the tax lottery on consumers’
willingness to act as third-party tax enforcers. More specifically, the aim of the study was
twofold. Firstly, to understand the reasons beyond respondents’ decision to engage in third-
party tax enforcement. Specially, whether and to what extent, respondents considered that
civic duties and ethical concerns were important to voluntarily enforce the emission of
invoices. Secondly, to verify whether the crowding-out effect of third-party tax enforcement
was confined to a specific population. Explicitly, to know if the crowding-out effect was related
to the level of education of the respondents.
Methodology
A questionnaire was constructed for the purpose of this study: 1. Information on demographics, including education level, and habits of participation in lottery games was
collected.
2. Respondents were asked how often they are used asked for a receipt (1 = always; 7 = never) and
whether the lottery had motivated them to ask more for receipts (1 = much more; 7 = much less).
Additionally, respondents were asked whether they watched the lottery draw on television (1 = always; 5 =
never).
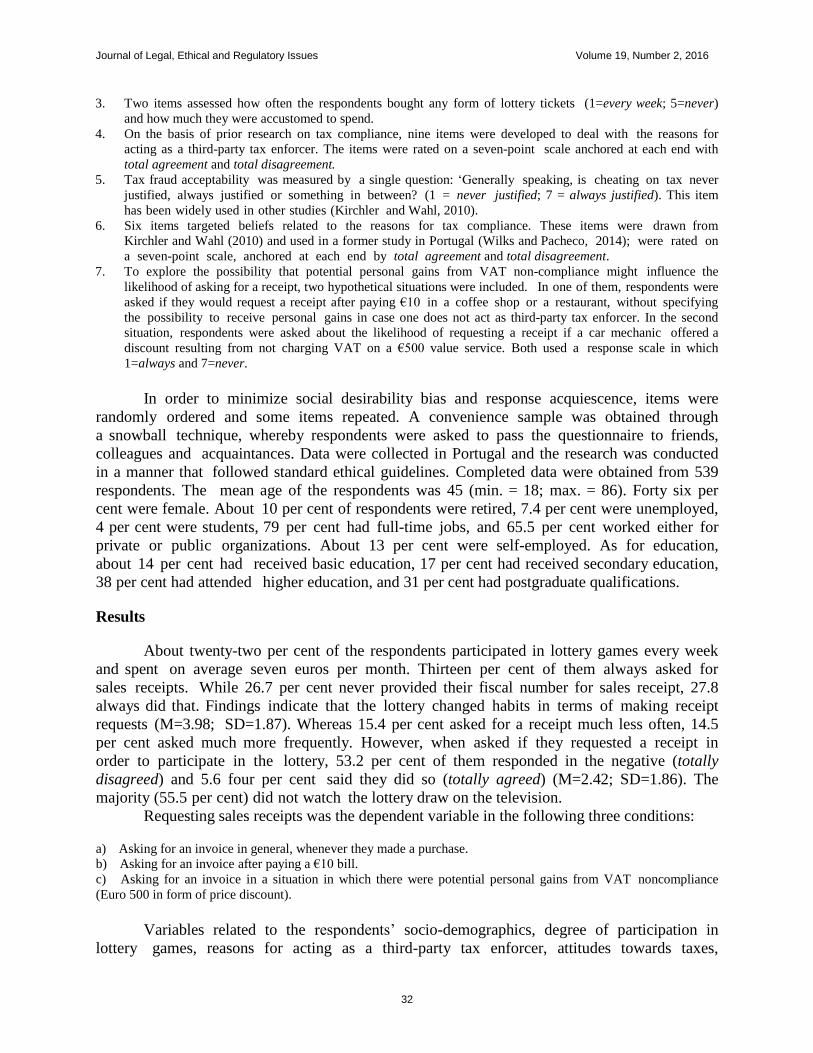
Journal of Legal, Ethical and Regulatory Issues Volume 19, Number 2, 2016
32
3. Two items assessed how often the respondents bought any form of lottery tickets (1=every week; 5=never)
and how much they were accustomed to spend.
4. On the basis of prior research on tax compliance, nine items were developed to deal with the reasons for
acting as a third-party tax enforcer. The items were rated on a seven-point scale anchored at each end with
total agreement and total disagreement.
5. Tax fraud acceptability was measured by a single question: ‘Generally speaking, is cheating on tax never
justified, always justified or something in between? (1 = never justified; 7 = always justified). This item
has been widely used in other studies (Kirchler and Wahl, 2010).
6. Six items targeted beliefs related to the reasons for tax compliance. These items were drawn from
Kirchler and Wahl (2010) and used in a former study in Portugal (Wilks and Pacheco, 2014); were rated on
a seven-point scale, anchored at each end by total agreement and total disagreement.
7. To explore the possibility that potential personal gains from VAT non-compliance might influence the
likelihood of asking for a receipt, two hypothetical situations were included. In one of them, respondents were
asked if they would request a receipt after paying €10 in a coffee shop or a restaurant, without specifying
the possibility to receive personal gains in case one does not act as third-party tax enforcer. In the second
situation, respondents were asked about the likelihood of requesting a receipt if a car mechanic offered a
discount resulting from not charging VAT on a €500 value service. Both used a response scale in which
1=always and 7=never.
In order to minimize social desirability bias and response acquiescence, items were
randomly ordered and some items repeated. A convenience sample was obtained through
a snowball technique, whereby respondents were asked to pass the questionnaire to friends,
colleagues and acquaintances. Data were collected in Portugal and the research was conducted
in a manner that followed standard ethical guidelines. Completed data were obtained from 539
respondents. The mean age of the respondents was 45 (min. = 18; max. = 86). Forty six per
cent were female. About 10 per cent of respondents were retired, 7.4 per cent were unemployed,
4 per cent were students, 79 per cent had full-time jobs, and 65.5 per cent worked either for
private or public organizations. About 13 per cent were self-employed. As for education,
about 14 per cent had received basic education, 17 per cent had received secondary education,
38 per cent had attended higher education, and 31 per cent had postgraduate qualifications.
Results
About twenty-two per cent of the respondents participated in lottery games every week
and spent on average seven euros per month. Thirteen per cent of them always asked for
sales receipts. While 26.7 per cent never provided their fiscal number for sales receipt, 27.8
always did that. Findings indicate that the lottery changed habits in terms of making receipt
requests (M=3.98; SD=1.87). Whereas 15.4 per cent asked for a receipt much less often, 14.5
per cent asked much more frequently. However, when asked if they requested a receipt in
order to participate in the lottery, 53.2 per cent of them responded in the negative (totally
disagreed) and 5.6 four per cent said they did so (totally agreed) (M=2.42; SD=1.86). The
majority (55.5 per cent) did not watch the lottery draw on the television.
Requesting sales receipts was the dependent variable in the following three conditions:
a) Asking for an invoice in general, whenever they made a purchase.
b) Asking for an invoice after paying a €10 bill.
c) Asking for an invoice in a situation in which there were potential personal gains from VAT noncompliance
(Euro 500 in form of price discount).
Variables related to the respondents’ socio-demographics, degree of participation in
lottery games, reasons for acting as a third-party tax enforcer, attitudes towards taxes,

Journal of Legal, Ethical and Regulatory Issues Volume 19, Number 2, 2016
33
moral beliefs regarding taxes (tax morale/civic duty)/, tax evasion acceptability and reasons for
tax compliance were treated as independent.
An exploratory Factor Analysis followed by Varimax rotation was conducted on the
nine items regarding the reasons for requesting a receipt. Two factors were extracted explaining
56 per cent of the total variance. Considering the pattern of loadings, the first factor was
labeled tax morale according to the content of the items, and explained 36.3 per cent of the
variance; the second factor was identified as being related to an interest in participating in
the tax lottery, and explained 19.7 per cent of the variance.
A Factor Analysis of the five items regarding the reasons for paying taxes yielded a
two-factor solution explaining 65.2 per cent of the variance. The first factor explained 44.7 of
the variance and was associated with a sense of public spirit in tax compliance. The Cronbach
alpha was .73. The second factor was fear of tax audits and explained 20.5 per cent of the
variance. Table 2 shows the means, standard deviations, Cronbach’s alphas and
intercorrelations among the variables. Composites were formed on the basis of the extracted
components and used in subsequent analyses as predictors in multiple regressions with the
other aforementioned independent variables. All the predictors were entered simultaneously
into the model. The model obtained explained 24.7 per cent of the variable “asking for a
receipt in general” and was statistically significant, F(13, 539) = 13.25, p < .001.
Table 1
MEANS, STANDARD DEVIATIONS, CRONBACH’S ALPHAS AND INTERCORRELATIONS
AMONG VARIABLES (N=539)
Variables M SD α 1 2 3
1. Moral beliefs regarding taxes 4.92 1.32 .73 -
2. Tax morale 5.42 1.20 .80 .46** -
3. To participate in the lottery 2.86 1.54 .70 .03 .20** -
*p<.05 level; **p<.01 (2-tailed).
Question 1) Which are the key determinants of third-party tax enforcement?
Condition a) Results for requesting a receipt in general
As shown in Table 3, there were significant effects for age and education.
Consistent with previous studies (McGee et al., 2012), older respondents and those with more
years of education asked for a receipt more frequently than younger respondents and those
with fewer years of education. Compared to the proportion of full-time employees, the share
of unemployed respondents who asked for a receipt was lower. There was no significant
relationship between asking for a receipt and reasons for tax compliance and fear of audits. Tax
morale was the largest contribution to the model.
Condition b) Results for requesting a receipt for a 10 Euro bill
The multiple linear regression with all the predictors and requesting a receipt after paying
€10 as the dependent variable explained 25.7 per cent of the variance and was statistically
significant, F(13, 539) = 13.95, p < .001. There were significant effects for education and
the variable is positive associated with requesting the receipt. This result signals that,
consistent with our reasoning in the previous section, more educated people tend to engage
in a higher level of voluntary third-party tax enforcement. Respondents who were
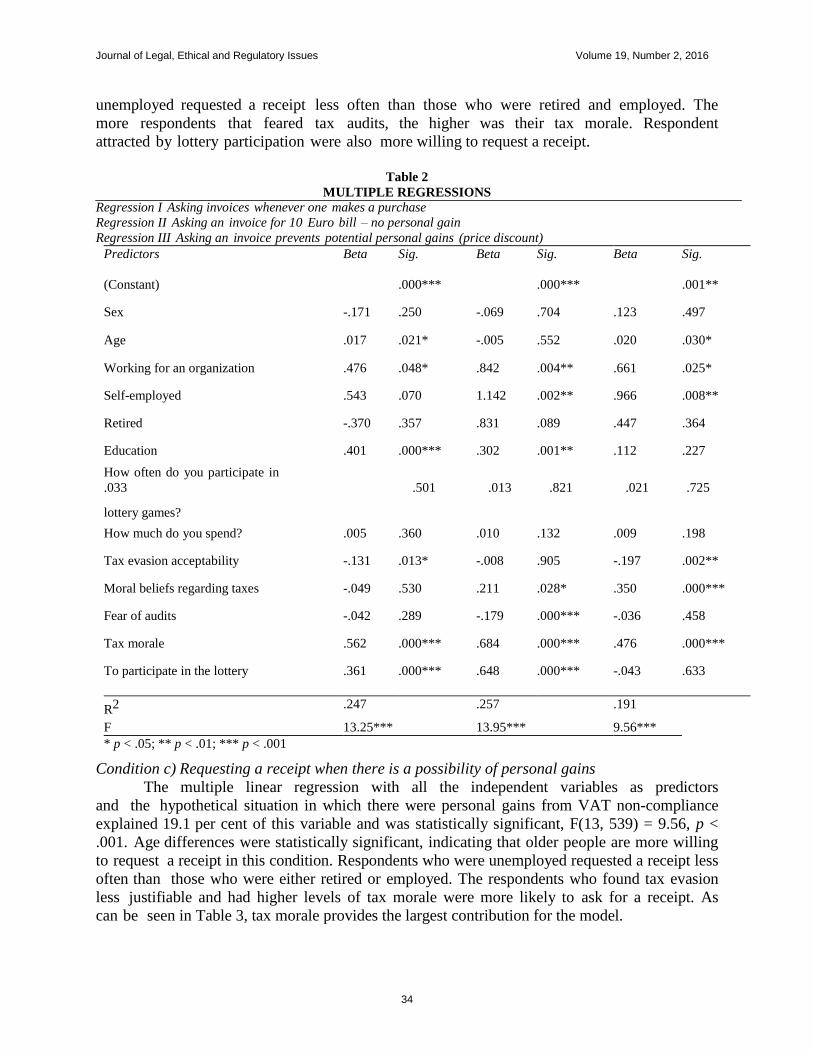
Journal of Legal, Ethical and Regulatory Issues Volume 19, Number 2, 2016
34
unemployed requested a receipt less often than those who were retired and employed. The
more respondents that feared tax audits, the higher was their tax morale. Respondent
attracted by lottery participation were also more willing to request a receipt.
Table 2
MULTIPLE REGRESSIONS
Regression I Asking invoices whenever one makes a purchase
Regression II Asking an invoice for 10 Euro bill – no personal gain
Regression III Asking an invoice prevents potential personal gains (price discount)
Predictors
(Constant)
Beta Sig.
.000***
Beta Sig.
.000***
Beta Sig.
.001**
Sex -.171 .250 -.069 .704 .123 .497
Age .017 .021* -.005 .552 .020 .030*
Working for an organization .476 .048* .842 .004** .661 .025*
Self-employed .543 .070 1.142 .002** .966 .008**
Retired -.370 .357 .831 .089 .447 .364
Education .401 .000*** .302 .001** .112 .227
How often do you participate in
.033 .501 .013 .821 .021 .725
lottery games?
How much do you spend? .005 .360 .010 .132 .009 .198
Tax evasion acceptability -.131 .013* -.008 .905 -.197 .002**
Moral beliefs regarding taxes -.049 .530 .211 .028* .350 .000***
Fear of audits -.042 .289 -.179 .000*** -.036 .458
Tax morale .562 .000*** .684 .000*** .476 .000***
To participate in the lottery .361 .000*** .648 .000*** -.043 .633
R2 .247 .257 .191
F 13.25*** 13.95*** 9.56***
* p < .05; ** p < .01; *** p < .001
Condition c) Requesting a receipt when there is a possibility of personal gains
The multiple linear regression with all the independent variables as predictors
and the hypothetical situation in which there were personal gains from VAT non-compliance
explained 19.1 per cent of this variable and was statistically significant, F(13, 539) = 9.56, p <
.001. Age differences were statistically significant, indicating that older people are more willing
to request a receipt in this condition. Respondents who were unemployed requested a receipt less
often than those who were either retired or employed. The respondents who found tax evasion
less justifiable and had higher levels of tax morale were more likely to ask for a receipt. As
can be seen in Table 3, tax morale provides the largest contribution for the model.

Journal of Legal, Ethical and Regulatory Issues Volume 19, Number 2, 2016
35
Question 2) Is the crowding-out effect influenced by education?
To answer this question, we explored the association between the level of education
and the crowding out of the willingness to engage in voluntary third-party tax enforcement.
Respondents stating that they never or almost never requested invoices were excluded from
the analysis, and the remaining respondents were divided into two categories according to their
level of education -“high education” (first degree or post-graduate education) and “low” levels
of education. The crowding-out effect was assessed by the question whether the lottery had
motivated them to ask more for receipts (1=much more; 7= much less).
Findings clearly indicate that the percentage of respondents who show a crowding-out
effect in the group of the most educated respondents is nearly the double of the group with
lower level of education (15% vs. 8% respectively). We then considered the impact of the
lottery on the will to request retail invoices with the view of wining the prize. Respondents
were motivated by the tax lottery to request invoices across different levels of education (31%
for both the high- and low- levels of education). This preliminary evidence suggests that a
sizeable fraction of consumers, who would not request for invoices, could be persuaded by
the tax lottery to engage in third- party tax enforcement.
Nevertheless, respondents who were willing to act as voluntary third-party tax enforcers
before the lottery, refused to continue doing so. Most importantly, the crowding-out effect was
found to be positively associated with the level of education, which supports our argument
regarding the possibility that the crowding-out effect might spill over across generations.
Should this be the case, an evaluation of tax lotteries effects on welfare would not be fully
captured by an empirical analysis focusing solely on the few years after the implementation of
the policy.
CONCLUSION
The purpose of the present investigation was to examine tax lottery policies as a
method to reward consumers who ask for sales receipts in order to reduce VAT collection. It
was argued that evaluations of the results of tax lotteries based on a short period of time might
overestimate the benefits of the policy due to the crowding-out effect of the willingness to act
as third-party tax enforcement, particularly of the most educated individuals. Given that these
individuals are responsible for the transmission of social norms, a consequent progressive
erosion of the willingness to act as third-party tax enforcement would spill over to future
generations at an increasing rate causing a decrease of the net tax revenue.
Our empirical study suggests that our concerns are well grounded. In the light of the
findings tax morale is an important determinant of third-party tax enforcement, and the
crowding-out effect caused by the tax lottery is concentrated on the most educated individuals.
These results provide support for our concerns about the possibility of long-term negative
welfare effects.
Whether the long-run increase in tax revenue generated by tax lotteries is larger than the
sum of direct and indirect crowding-out effects it is worth studying, but lies outside the
scope of the present study. The main conclusion to be drawn is that a short-term estimated
increase in net VAT revenue collected can be consistent with a long-term welfare loss. Hence
caution is necessary to evaluate the success of tax lotteries considering solely short-term
variation in tax revenue. Further research on the welfare effects of tax lotteries is clearly needed
to fully comprehend their welfare effects.

Journal of Legal, Ethical and Regulatory Issues Volume 19, Number 2, 2016
36
ACKNOWLEDGMENTS
We are grateful to the editor, Murphy Smith, and an anonymous Referee for their
valuable comments on an earlier version of this manuscript. We also wish to thank Luis
Pacheco for his assistance with the construction of the questionnaire and data collection.
ENDNOTES
1. CASE- Center for Social and Economic Research, Study to quantify and analyse the VAT Gap in the EU
Member States, 2015 Report. TAXUD/2013/DE/321,
http://ec.europa.eu/taxation_customs/resources/documents/common/publications/studies/vat_gap2013.pdf(accessed
16 September 2015).
2. There are other reasons in addition to the crowding-out effect to explain why economic incentives might not
work. First, strong monetary incentives might “overmotivate” an agent, leading to a more-than-optimal arousal
during the performance (Ariely et al., 2009). Second, incentives might alter individuals’ beliefs about the
behavior chosen by others (Galbiati and Vertova, 2008).
3. Public opinion perceived the measures as being unfair and protested vigorously against them (cit. needed).
As a consequence, Belgium and Italy revoked the sanctions soon after their introduction. Some countries
provided incentives to consumers for requesting receipts. Argentina and Bolivia tried to give consumers a
monetary refund equal to a percentage of the total VAT registered in each business receipt. However, this
scheme was difficult and costly to manage, and was soon abandoned it (see Fabbri and Hemels, 2013 for
deeper discussion of this issue).
4. The first tax lottery was introduced in Taiwan in 1951. For a historical overview about the use of tax lotteries,
see Fabbri (2015).
5. The term “incentives” used here refers to any intervention aiming at influencing the behavior by modifying costs
and benefits of a certain action, thus appealing exclusively to self-regarding preferences.
6. A complete review of studies reporting empirical evidence of motivation crowding-out effect lies outside the
scope of the present article. On the topic see Bowles & Polania-Reyes, 2012.
7. For official OECD statistics, see http://www.oecd.org/portugal/Portugal-Deepening-structural-reform-to-
support- growth-and-competitiveness.pdf
8. See http://www.oecd.org/ctp/consumption/presentation-session-5-filipe-abreu-portugal-second-global-forum-
on- vat.pdf.
9. For data analysis purposes, the results were reverse-coded.
REFERENCES
Alleyne, B.J. and R.J. Elson. ( 2013). The Impact of Federal Regulations on Identifying, Preventing, and
Eliminating Corporate Fraud. Journal of Legal, Ethical and Regulatory Issues, 16(1), 91-106.
Allingham, M. G., and A. Sandmo. (1972). Income tax evasion: a theoretical analysis. Journal of Public
Economics, 1(3-4), 323-338.
Alm, J., G. H. McClelland, and W. D. Schulze. (1992). Why do people pay taxes? Journal of public Economics,
48(1), 21-38.
Angrist, J., and V. Lavy. ( 2009). The effects of high stakes high school achievement awards: Evidence
from a randomized trial. The American Economic Review, 99(4), 1384-1414.
Ariely, D., A. Bracha, and S. Meier. (2009). Doing good or doing well? Image motivation and monetary
incentives in behaving prosocially. The American economic review, 99(1), 544-555.
Becker, G. S. (1968). Crime and Punishment: An Economic Approach. Journal of Political Economy, 76(2), 169-
217.
Blazovich, J.L., K.T. Smith, and L.M. Smith. (2013). An Examination of Financial Performance and Risk of
Environmentally Friendly ‘Green’ Companies. Journal of Legal, Ethical and Regulatory Issues, 16(1), 121-
134.
Bolt-Lee, C., and J. Moody. (2009). Change in the taxpayer-tax preparer relationship: The effects of Circular 230.
Journal of Legal, Ethical and Regulatory Issues, 12(1), 15.

Journal of Legal, Ethical and Regulatory Issues Volume 19, Number 2, 2016
37
Blumenthal, M., and J. Slemrod. (1992). The compliance cost of the US individual income tax system: A second
look after tax reform. National Tax Journal, 45(2), 185-202.
Bowles, S. (2008). Policies designed for self-interested citizens may undermine "the moral sentiments":
Evidence from economic experiments. Science, 320(5883), 1605-1609.
Bowles, S., & S. Polania-Reyes, S. ( 2012). Economic incentives and social preferences: substitutes or
complements? Journal of Economic Literature, 50(2), 368-425.
Brockmann, H., P. Genschel, and L. Seelkopf. ( 2016). Happy taxation: increasing tax compliance through
positive rewards? Journal of Public Policy, 1-26.
Drucker, M., K. A. Maguire, and K. M. Wolf. (2012). Penalties for Federal Tax Crimes: The IRS Arsenal.
Journal of Legal, Ethical and Regulatory Issues, 15(2), 53.
Dubas, K. M., S. M. Dubas, and R. Mehta. (2014). Theories of Justice and Moral Behavior. Journal of Legal,
Ethical and Regulatory Issues, 17(2), 17.
Fabbri, M. (2015). Shaping tax norms through lotteries. International Review of Law and Economics, 44, 8-15.
Fabbri, M., and S. Hemels. (2013). Do You Want a Receipt?’ Combating VAT and RST Evasion with Lottery
Tickets. Intertax, 41(8), 430-443.
Feige, E. L. (2007). The underground economies: Tax evasion and information distortion. Cambridge University
Press.
Feld, L. P., and B. S. Frey. ( 2007). Tax compliance as the result of a psychological tax contract: The role of
incentives and responsive regulation. Law & Policy, 29(1), 102-120.
Fooken, Jonas, Hemmelgarn, Thomas and Herrmann, Benedikt. ( 2015). Improving VAT compliance – random
awards for tax compliance. No 51 Taxation Papers, Directorate General Taxation and Customs Union,
European Commission. Retrieved on March 12, 2016 from
http://EconPapers.repec.org/RePEc:tax:taxpap:0051.
Frey, B. S., and L. P. Feld. ( 2002). Deterrence and morale in taxation: An empirical analysis. CESifo
Working Paper Series No. 760.
Frey, B. S., and R. Jegen. (2001). Motivation crowding theory. Journal of economic surveys, 15(5), 589-611.
Fryer Jr., R. G. (2010). Financial incentives and student achievement: Evidence from randomized trials. No.
w15898. National Bureau of Economic Research.
Fuster, A., and S. Meier. (2010). Another hidden cost of incentives: The detrimental effect on norm enforcement.
Management Science 56(1), 57-70.
Galbiati, R., and P. Vertova. (2008). Obligations and cooperative behaviour in public good games. Games and
Economic Behavior 64(1), 146-170.
Gneezy, U., and A. Rustichini. (2000). Pay enough or don't pay at all. Quarterly journal of economics, 791-810.
Holmås, T. H., E. Kjerstad, H. Lurås, and O. R. Straume. (2010). Does monetary punishment crowd out pro-
social motivation? A natural experiment on hospital length of stay. Journal of Economic Behavior &
Organization, 75(2): 261-267.
Kirchler, E., S. Muehlbacher, B. Kastlunger, and I. Wahl. ( 2010). Why pay taxes? A review of tax
compliance decisions. Developing alternative frameworks for explaining tax compliance, 15-31.
Kleven, H. J., C. T. Kreiner, and E. Saez. ( 2016). Why can modern governments tax so much? An agency
model of firms as fiscal intermediaries. Economica, 83(330), 219-246.
Lewis, A. (1982). The psychology of taxation. Blackwell.
Marchese, C. ( 2009). Rewarding the consumer for curbing the evasion of commodity taxes? FinanzArchiv:
Public Finance Analysis, 65(4), 383-402.
Martin, S. and P. Dolan. ( 2010). Dear Taxpayer, Congratulations! You’ve Won Your Money Back,
Harvard Business Review. Retrieved on 13 March 2016 at
https://hbr.org/2010/12/dear-mr-taxpayer-congratulation
McGee, Robert W., ( 2011). The ethics of tax evasion: Perspectives in theory and practice. Springer Science &
Business Media.
McGee, R. W., I. Nickerson, L. Pleshko, and M. Broihahn. ( 2012). The ethics of tax evasion: An
investigation into demographic differences. Journal of Legal, Ethical and Regulatory Issues, 15(1),
105.
McMahon, R., D. Pence, L. Bressler, and M. S. Bressler. (2016). New Tactics in Fighting Financial Crimes:
Moving beyond the Fraud Triangle. Journal of Legal, Ethical and Regulatory Issues, 19(1), 16.
Mellström, C., and M. Johannesson. (2008). Crowding out in blood donation: was Titmuss right? Journal of the
European Economic Association, 6(4), 845-863.
Morgan, J. (2000). Financing public goods by means of lotteries. The Review of Economic Studies, 67(4), 761-784.
Journal of Legal, Ethical and Regulatory Issues Volume 19, Number 2, 2016
38
Naritomi, J. (2013). Consumers as tax auditors. Unpub. paper, Harvard University.
Nickerson, I., L. Pleshko, and R. W. McGee. (2009). Presenting the dimensionality of an ethics scale pertaining
to tax evasion. Journal of Legal, Ethical and Regulatory Issues, 12(1), 1.
Ross, A. M., and R. W. McGee. (2012). Education Level and Ethical Attitude toward Tax Evasion: A Six-Country
Study. Journal of Legal, Ethical and Regulatory Issues, 15(2), 93.
Tabellini, G. ( 2010). Culture and institutions: economic development in the regions of Europe. Journal of the
European Economic Association, 8(4), 677-716.
Yitzhaki, S. ( 1974). Income tax evasion: A theoretical analysis. Journal of public economics 3(2), 201-202.
Wan, J. (2010). The incentive to declare taxes and tax revenue: the lottery receipt experiment in China. Review of
Development Economics, 14(3), 611-624.
Wilks, D. and L. Pacheco. (2014). Tax Compliance, Corruption and Deterrence: an Application of the Slippery
Slope Model. Interdisciplinary Insights on Fraud, 87.

Journal of Legal, Ethical and Regulatory Issues Volume 19, Number 2, 2016
39
MANAGING SOCIAL ENTERPRISES IN THE
PHILIPPINES: CHALLENGES AND STRATEGIES
Raymund B. Habaradas, De La Salle University
Patrick Adriel H. Aure, De La Salle University
ABSTRACT
The purpose of this paper is to uncover the challenges faced by Philippine for-profit
social enterprises as they pursue both financial and social objectives, and to determine the
strategies they utilize to achieve these dual bottom-lines. Our research builds on Dees and
Anderson’s work (2002) that proposed a set of strategies to address the challenges faced by for-
profit social ventures.
Utilizing multiple case study research design as proposed by Yin (2003), we gathered
primary data by interviewing key informants involved in the following social enterprises:
Greenius, Bayani Brew, and ECHOstore Sustainable Lifestyle. We also examined publicly
available data on these three companies, including those taken from their web sites, published
articles, and other studies conducted on these companies. We analyzed our data using the
following theoretical lenses: resource dependence theory and stakeholder theory. We also made
references to existing social entrepreneurship literature to augment our analysis.
Our case study research reveals that Philippine social enterprises indeed encounter
tensions as they pursue both their economic and social objectives. Successfully reconciling dual
bottom lines requires business acumen on the part of the social enterprise’s owners / managers,
who must not only know how to manage their internal operations efficiently, but also be able to
leverage on the resources of stakeholders that are sympathetic to the enterprise’s social mission.
Developing a strong brand attached to a quality product is also critical.
Our study contributes further to the vastly growing yet still largely unexplored area of
social entrepreneurship in the country. It also provides some guidance not only to aspiring
social entrepreneurs but also to business educators who could contribute to the development of a
new breed of entrepreneurs and managers of mission-driven enterprises. Our study also shows
policy makers that they should put in place measures that will encourage cross-sector
collaborations between the private sector, government, and civil society.
INTRODUCTION
Managers of for-profit social enterprises, just like their counterparts in traditional profit-
oriented firms, must adopt and implement appropriate business strategies to keep their operations
viable. In addition, they must deal with the complexity of creating both financial and social
value. According to Dees and Anderson (2002), for-profit social enterprises must face market
pressures that could lead to compromising social value. They must likewise face social and
political pressures that could lead to compromising financial performance.
For this study, we attempted to answer the following questions: (1) What are the
challenges faced by select Philippine social enterprises in their attempt to generate both financial
and social value? (2) What strategies do these social enterprises utilize to achieve both their
financial and social bottom lines? How do they implement them? Taking our cue from Dees and
Anderson (2002), we attempted to validate the following propositions:

Journal of Legal, Ethical and Regulatory Issues Volume 19, Number 2, 2016
40
Proposition 1: Philippine social enterprises experience tension in their attempts to jointly
achieve financial and social objectives, and are likely to comprise one bottom line over another
Proposition 2: Social enterprises that utilize Dees and Anderson’s proposed strategies
better manage challenges associated with having dual objectives.
BRIEF REVIEW OF RELATED LITERATURE
Heeding the Call for Social Responsibility
Our idea about what purpose business serves in society has evolved substantially over the
years. While there are still those who subscribe to Friedman’s (1970) contention that “the
business of business is business”, there has been increasing support for the notion that business
must fulfil an increasingly active role in addressing social problems. This idea is built along the
lines of Carroll’s (1991) articulation of the different responsibilities of business (economic, legal,
ethical, and philanthropic), which has since been labelled variously by scholars and practitioners
as corporate social responsibility, corporate citizenship, corporate governance, and corporate
sustainability. More recent conceptualizations of social responsibility that have gained
prominence in the business literature are ‘creating shared value’ (Porter & Kramer, 2006, 2011),
which encouraged big businesses to rethink how they can simultaneously create financial and
social value; and CSR 2.0 or transformative CSR (Visser, 2010, 2011), which calls for
businesses to embed CSR in their business models by adopting a systems perspective.
Businesses are driven to be more socially responsible for a variety of reasons. Some
engage in corporate social initiatives to promote advocacies or to address issues important to
their company’s target stakeholders (Taran & Betts, 2015). Others engage in corporate social
initiatives as a way to enhance their competitive contexts (Habaradas, 2013; Porter & Kramer,
2002). Others still see the need to embed ethics and governance in their company’s management
systems to meet global expectations (Obay, 2009).
For some businesses, though, addressing social problems is their primary goal, and
keeping themselves profitable is essential to sustain their operations. These are what we now
know as social enterprises (Dees & Anderson, 2006; Martin & Osberg, 2007; Yunus, 2007;
2010; Yunus, Moingeon, & Lehmann-Ortega, 2010).
Conceptualizations of Social Enterprise
Social enterprises refer “to the rapidly growing number of organizations that have created
models for efficiently catering to basic human needs that existing markets and institutions have
failed to satisfy” (Seelos & Mair, 2005, p.1). In other words, their primary business goal is to
create social value. For a social enterprise to be sustained, it must combine the four elements of
innovation, entrepreneurship, social value, and financial stability (Seelos & Mair, 2005).
A social enterprise is a tangible result of social entrepreneurship, which Mair and Marti
(2005) defined as a management process that produces both economic and social value through
improved use of resources to address a social need; and which Alvord, Brown, and Letts (2004)
defined as a business process that produces “innovative solutions” to address a social issue and
that subsequently mobilizes resources “for social transformation”.
Ridley-Duff and Bull (2011) identified two types of social enterprises: non-profit and for-
profit.

Journal of Legal, Ethical and Regulatory Issues Volume 19, Number 2, 2016
41
Non-profit social enterprises give more importance to fulfilling their missions over
making money (Dees, Emerson, & Economy, 2001; Nicholls, 2006; Ridley-Duff & Bull, 2011).
Though they may use commercial methods and adopt business practices in generating resources,
their ultimate bottom line is the social value they create through their services. Under the eyes of
the law, these enterprises often take the legal form of the traditional non-profit and civil society
organizations (Yunus, 2010).
For-profit social enterprises, on the other hand, are “legally incorporated as for-profit
entities” and “explicitly designed to serve a social purpose” (Dees and Anderson, 2002, p.2).
Dees and Anderson distinguish for-profit social enterprises from the following: (1) socially
responsible businesses or entities that seek financial gain while respecting ethics, communities,
and the planet; and (2) purely profit-motivated firms operating in the social sector. Sebastian
(2010), Yunus (2010), and Meloto (2013) refer to for-profit social enterprises as social business
enterprises or social businesses. Typically, these enterprises take the legal form of business
organizations.
Some scholars adopt a rather restrictive definition of a social enterprise, which excludes
non-profit organizations. Thompson and Doherty (2006), for example, defined social enterprises
as organizations “seeking business solutions to social problems” (p. 362). According to them,
social enterprises must be distinguished from other socially-oriented organizations “that bring
(sometimes significant) benefits to communities” but that do not seek to be ‘businesses’ (p.362).
However, most scholars (Dees, Emerson, and Economy, 2001; Dees and Anderson, 2002;
Mair and Noboa, 2003; Abu-Saifan, 2012) favor a more inclusive definition of social enterprises.
For example, Borzaga and Solari (2001, as cited by Mair and Noboa, 2003) said that a social
enterprise incorporates “traditional resources of non-profit organizations (donations and
voluntary participation), commercial revenue (originating from public and private customers and
founders), and business activity” (p.333), all towards achieving a social objective. Thus, social
enterprises can generally be characterized as organizational forms that have the following
characteristics: (a) they have a social purpose, i.e. they seek to solve pressing social problems;
and (b) they utilize commercial methods in their operations. These could include for-profit
enterprises with ‘mission-driven strategies’ or non-profit organizations with ‘earned income
strategies’ (Abu-Saifan, 2012).
Of particular interest to us are for-profit social enterprises, which Dees and Anderson
(2003) say “have virtues that are not easily mimicked” (p.5) by their non-profit or public sector
counterparts. For-profit social enterprises, they add, have the following potential benefits: (a)
promoting efficiency and innovation, (b) leveraging scarce public and philanthropic resources,
(c) being more responsive to fluctuating market demand, and (d) improving access to skilled
personnel.
Social Enterprise Organization Models
In implementing activities that create both financial and social value, social enterprises
must adopt the appropriate organizational design. Alter (2006) conceptualized alternative
organizational models of how social enterprises can pursue both mission and money while
managing the potential conflicts between the two bottom-lines.
The embedded social enterprise model shows how the social programs and the enterprise
activities are synonymous, meaning the implementation of activities simultaneously pursue the
money-mission relationship. Alter (2006) considers this organizational model sustainable and
viable due to the comprehensive relationship between the financial and social bottom lines.

Journal of Legal, Ethical and Regulatory Issues Volume 19, Number 2, 2016
42
The integrated social enterprise model shows how social programs only overlap with
business activities. Instead of synchronicity between enterprise activities and social programs,
there is only a sharing of costs, assets, and attributes. The relationship between money-making
activities and social programs is synergistic, i.e., both add value to one another (Alter, 2006).
The external social enterprise model shows social programs and business activities as
distinct from one another. This is seen typically in businesses being completely separate from
their non-profits (e.g., corporate foundations or partner NPOs). Businesses single-mindedly focus
on making money, often funding the efforts of non-profits. The latter solely focuses on pursuing
the social mission.
Alter (2006) states that social enterprises can combine models to capture more
opportunities in both commercial markets and social sectors.
Core Challenges and Strategies
Brown and Knudsen (2012) argue that for businesses that have both financial and social
objectives, it might be necessary to change the entire business culture to avoid ambiguous
visions and strategies. This argument builds on the points of Dees and Anderson (2002), who
articulated the core challenges in pursuing financial profit and social value generation. Other
authors (Abu-Saifan, 2012; Bull, 2007; Bull 2008; Cukier et al., 2011; Emerson, 2003; Nicholls,
2006; Yunus, 2010) echo the idea that social enterprises are engaged in a constant tug-of-war on
which to prioritize. Void of innovative and strategic thinking, the pursuit of one bottom line
seems to be at the expense of another bottom line.
To address these tensions, Dees and Anderson (2002) proposed the following strategies:
(a) avoid strategic vagueness regarding organization’s mission; (b) craft an integrated and
compelling business model; (c) measure performance creatively and test assumptions rigorously;
(d) maintain control in sympathetic hands; (e) invest time and energy creating a committed team;
(f) anticipate resistance and develop a strategy for dealing with it; (g) develop a brand reputation
for quality and performance; and (h) recognize limits of what can be done for-profit and use non-
profit partners or affiliates to provide complementary services.
Research Gap
Early literature on social enterprise / social entrepreneurship focused on its
conceptualization and definition. Recently, there have been attempts to create theories and
frameworks intended to improve the practice of managing social enterprises. However, these
theories require further testing and empirical evidence that could vary from country to country.
The Philippine setting offers an exciting context to test these theories and frameworks, given the
rising interest of individuals to set up, or be part of, for-profit social enterprises.
Given that social enterprises only got mainstream attention in both the academic and
practicing community in recent years, it is understandable that social enterprise theories are still
largely untested. As evidence, the casebook of Sebastian (2010) focused mostly on describing
social enterprises in the country. It is important, however, for researchers to develop, test, and
refine social enterprise frameworks so that we can be confident about their relevance as practical
guides for social entrepreneurs. To fill the aforementioned gap, we built on the frameworks of
Alter (2006) and of Dees and Anderson (2002) by undertaking this empirical study on Philippine
social enterprises.

Journal of Legal, Ethical and Regulatory Issues Volume 19, Number 2, 2016
43
RESEARCH FRAMEWORK, DESIGN, AND METHODOLOGY
Theoretical Foundations
For this study, we used resource dependence theory and stakeholder theory to help us
make sense of our data, and to generate relevant insights about the experiences of the social
enterprises we examined. Since strategy is basically interacting with the environment to achieve
organizational goals (Daft, 2007), these two theoretical lenses are relevant to our study, which
focused on strategies of social enterprises.
Resource dependence theory, as first articulated by Pfeffer and Salancik (1978),
characterizes business organizations as open systems that are dependent on contingencies in the
external environment. As Pfeffer and Salancik (1978) put it: “to understand the behavior of an
organization you must understand the context of that behavior – that is, the ecology of the
organization” (p.1). Resource dependence means that businesses depend on the environment for
scarce and valued resources they need for survival. To minimize their dependence, however,
businesses attempt to acquire control over these resources (Ulrich & Barney, 1984) in a variety
of ways. According to Daft (2007), adapting to or altering interdependent relationships is a
strategy that firms resort to when faced with resource or supply constraints. This could involve
“purchasing ownership in suppliers, developing long-term contracts or joint ventures to lock in
necessary resources, or building relationships in other ways” (pp. 90-91).
Stakeholder theory, on the other hand, looks into how managers see the purpose of the
firm and how they create relationships with the firm’s stakeholders to deliver on that purpose.
According to Freeman, Wicks and Parmar (2004), “economic value is created by people who
voluntarily come together and cooperate to improve everyone’s circumstance”; therefore,
managers must “develop relationships, inspire their stakeholders, and create communities where
everyone strives to give their best to deliver the value the firm promises” (p. 364).
Operational Framework
In our study, we combined the ideas of Alter (2006), who came up with three social
enterprise organizational models; and of Dees and Anderson (2002), who identified the core
challenges faced by for-profit social ventures and proposed several strategies to address these.
Together, these serve as our framework for description and analysis (see Figure 1). Given the
qualitative nature of our study, we simply determined whether there was evidence the three
social enterprises indeed encountered these challenges, and whether they utilized the proposed
strategies based on published accounts and statements given by key informants. We, then, placed
these social enterprises under one of the three categories identified by Alter, depending on how
their economic activities and social activities overlap.

Journal of Legal, Ethical and Regulatory Issues Volume 19, Number 2, 2016
44
Figure 1
OPERATIONAL FRAMEWORK
Case Study Research Design
We chose the case study research method because we examined a contemporary
phenomenon with some real life context, over which we had little control. We adopted the
multiple-case design because analytic conclusions independently arising from multiple cases
“will be more powerful than those coming from a single case alone” (Yin, 2003, p.53). We
recognize, though, that case studies are only “generalizable to theoretical propositions and not to
populations of universes.” Therefore, we cannot establish correlational or causal relationships,
but simply explain why or how these relationships exist (Yin, 2009).
Data Collection and Analysis
Consistent with the case study research design, we utilized as many sources of evidence
as practicable so as to achieve data triangulation (Yin, 2009). We began by collecting relevant
information about the three social enterprises (e.g. history, vision-mission, products and services)
from their web sites, published sources, and other available studies previously undertaken about
some of these social enterprises, including those by Aure, et. al. (2013) and Aguilar, et al.
(2013).

Journal of Legal, Ethical and Regulatory Issues Volume 19, Number 2, 2016
45
For the challenges faced by these enterprises and the strategies they utilized, we
depended largely on data collected from in-depth interviews conducted among key individuals
involved in these social enterprises. Our interviewees include the following: (1) the co-founder
of Greenius; (2) Ron Dizon, co-owner of Bayani Brew; (3) Xilca Alvarez, co-owner of Bayani
Brew; (4) Pacita Juan, co-founder of ECHOstore; (5) Jeannie Javellosa, President of ECHOsi
Foundation. We explained to these individuals the purpose of our study and secured their consent
to provide us with information through the in-depth interviews they granted.
The data we gathered became part of our case study database, which included the
following: interview transcriptions, detailed interview summaries, field notes, audio files, printed
materials, and online materials. Using these data, we came up with detailed case descriptions,
which included the following information: background of the company, its economic and social
activities, the challenges faced by the enterprise, and the strategies undertaken by the enterprise.
We largely depended on qualitative data coming from our interviews, which were either
paraphrased or expressed in actual quotations.
We then did a cross-case analysis that allowed us to uncover patterns across the three
social enterprises, and to understand how the different circumstances probably resulted into
varying levels of success. The results of this qualitative cross-case analysis allowed us to test the
propositions we earlier listed.
CASE DESCRIPTIONS
Case 1 – Greenius
Greenius started out in 2009 as a feasibility study school requirement submitted by five
students to a business incubation program in one of the Philippines’ prestigious business
universities. Its vision is to “raise the competitiveness of Philippine indigenous materials and
communities that produce them through global design brands”, while its mission is to “’wow’ the
world with stylish products from our very own indigenous materials”.
Greenius’ product line includes the following lines: bags, which were handmade and
crafted for women; and journals, which can be used to take notes during meetings and listing
down to-do’s, or by creative types to write a novel, sketch, or record thoughts, ideas, or feelings;
and tablet covers, a collection they claimed to be designed with balance between style and
functionality in mind — a great fit for 1st
- 4th
generation iPads. These products reach the market
through traditional stores (some retail stores and bookstores) and through online selling. Journals
and tablet covers are also sold as corporate giveaways.
Greenius received an initial boost when it won P350,000 worth of start-up capital and a
web site development package for its entry to a business plan competition in 2009. This
encouraged the team members to execute their business plan. At the time of the study, only two
of the original five former students were still involved in the business—the creative director, and
the director for marketing and social aspects of the business. They were later joined by two other
individuals as they ventured into what they claim as “eco-fashion”.
Greenius was not originally meant to be a social enterprise, but actually evolved into one.
According to our respondent: “My co-founders and I simply wanted to work with Philippine
indigenous materials.” This led them to a resettled community in Laguna that the Department of
Trade and Industry (DTI) recommended because of its flagship project involving the conversion
of water hyacinth into woven products. These water hyacinth are invasive plants that caused the
clogging of Laguna de Bay, which resulted into floods and which threatened the livelihood of

Journal of Legal, Ethical and Regulatory Issues Volume 19, Number 2, 2016
46
fishermen who found it difficult to navigate the waters to catch fish and shellfish. Community
members, however, were resourceful enough to convert the stalks of these water hyacinth into
material that looked like leather when a shiny coat was applied to it.
By engaging the women in rural communities in sourcing the company’s raw materials
and in producing their products, J&L provided livelihood to these communities even as it
addressed an environmental concern at the same time by helping restore water bodies previously
infested by the water hyacinth plant. According to our respondent, interacting with the
community made them appreciate how a business could affect people. “It was [our]
consciousness that grew,” she said.
Case 2 – Bayani Brew
Bayani Brew, a social enterprise affiliated with Gawad Kalinga, originated from the drink
that community mothers residing in the Gawad Kalinga (GK) Enchanted Farm mixed: native
iced tea. Using indigenous ingredients such as lemongrass, pandan, and talbos ng kamote (sweet
potato), Bayani Brew provides an “exciting alternative” to the usual sweetened powdered iced
teas and fruit juices. The enterprise sells locally prepared iced teas, which retails at
approximately Php48.00 per bottle. These ready-to-drink beverages, which come in two variants
– Kickass Lemongrass and Camotea Commotion –are sold in some restaurants, cafes, and social
enterprise stores across the Philippines.
In 2010, three GK volunteers – Ron Dizon, Shanon Khadka, and Xilca Alvarez (the Brew
Crew, for short)– stumbled upon an opportunity when Linda Manigas, one of the GK community
mothers (nanays), served guests and volunteers this “tsaang bukid”(farm tea) using a special
recipe passed on from previous generations (Aguilar, et. al., 2013).
GK founder Tony Meloto saw the massive potential for this native tea as a cold bottled
drink, which could revitalize a saturated beverage industry while fulfilling the mission of
developing the countryside and uplifting the plight of the farmers. Despite lacking experience in
the fast-moving consumer goods (FMCG) sector, the Brew Crew endeavored to craft a proudly
Filipino beverage that can eventually compete in the global market. The three capitalized on the
potential of this native tea as a cold bottled drink by engaging in product development. They
later registered the business in October 2012 (Bayani Brew, 2013). Bayani Brew’s vision and
mission is “brewing a generation of Filipinos crazy in love with our country”
(https://www.facebook.com/BayaniBrew). Its drinks are targeted at young adults aged 18-29 and
parents aged 30-44 concerned with the health of their children (Aguilar et al., 2013).
Aside from its efforts to promote its products through social media, Bayani Brew got the
attention of traditional media. It was featured in the Social Business Summit 2013 and in a
segment of ABS-CBN’s Kris TV. After the exposure in Kris TV, the demand for Bayani Brew
increased substantially from the previous average of three boxes a day to six to eight boxes a
day.
Bayani Brew also began exploring different distribution channels. It is one of the first
social enterprises in the Philippines that has penetrated independent restaurants, such as Juju
Eats, Wrong Ramen, Bo’s Coffee, Chicken Charlie, and Taste Central. Recently, it entered the
chain of wholesale clubs, S&R as well. Bayani Brew has also partnered with other social
enterprises, such as Human Nature, Souvenir Shop, and Dairy Hut, by selling its products in their
stores.
Bayani Brew pursues its social objective by creating sustainable livelihood opportunities
for the residents of the GK Enchanted Farm community. The company trains farmers and other

Journal of Legal, Ethical and Regulatory Issues Volume 19, Number 2, 2016
47
suppliers and makes sure that all production inputs are sourced locally. In the GK Enchanted
Farm alone, the farmers grow lemon grass, sweet potato, and pandan, which are used in the
production of tea. The company sources its raw materials from the farm and nearby
communities, and pays the farmers a relatively higher price. According to Ron Dizon, this is the
company’s way of “securing the supply chain”.
Also worth noting is how Bayani Brew builds a culture that greatly values the people
involved in the company. This is attested to by the employees, who appreciate the importance the
company gives to work-life balance. Since the farm is located very close to the community, this
allows farmers to go home to their families whenever there is a need to do so. Mothers who live
in the community can also easily monitor their children even while working.
Case 3 – ECHOstore Sustainable Lifestyle
ECHOstore Sustainable Lifestyle is the first green retail store in the Philippines.
Founders Pacita “Chit” Juan, Jeannie Javelosa, and Reena Francisco (also known as the
ECHOtrio) brought their extensive corporate / entrepreneurial experience to this venture that
advocates sustainable living. They set up a store that showcases the finest products made from
raw and all-natural materials, and created by talented craftsmen from various parts of the
country.
ECHOstore Serendra, which targets the high-end urban market, opened its doors in
September 2008. It was here where Juan, Javellosa, and Francisco brought together their network
of social enterprises, communities, foundations, and other organizations that needed not only
support but also a space for their products (home care, fashion, gifts, and personal care). Some of
the products were made by marginalized groups, including women prisoners, and the urban poor.
The retail store also offered organic, natural, and nontoxic goods, ranging from home cleaning
products to staples such as organic rice, sugar, and other produce.
ECHOstore, soon after, opened its second branch at the Podium in Mandaluyong City. In
2011, the ECHOtrio opened ECHOmarket Sustainable Farms and ECHOcafe (Culture,
Community, Coffee), two related concepts that completed the ECHOstore retail triad. Today,
ECHOstore has branches in Makati (ECHOstore Salcedo), Quezon City (ECHOstore Centris
Walk), Davao (ECHOstore Davao), and Cebu (ECHOstore Cebu). It also has an online store,
launched in 2013, which features lifestyle books authored by the ECHOtrio.
ECHOstore fulfills its social mission by serving as an outlet for products of women’s
groups, cultural communities, and other marginalized groups. But unlike other retail businesses
that simply source from these groups, ECHOstore has gone the extra mile by helping build the
capabilities of these groups in product design, packaging, and other important aspects of running
a business.
As the pioneering retail store that focused on fair-trade products made by small
communities, ECHOstore began to attract community-based enterprises that wanted their
products displayed for sale in the store. However, the ECHOtrio had to reject majority of the
products due to poor design and lack of visual appeal. They eventually worked closely with
national NGOs serving poor communities, which requested them to critique the product design
and packaging of these small producers. The ECHOtrio volunteered their time and expertise to
serve as mentors, and eventually launched the ECHOdesign Lab as a program.
Thus, the ECHOtrio, within a year of operating their first store found themselves
involved in a variety of activities. According to Javellosa, who was ECHOstore president during
its early years, “we were struggling at that period helping communities, selling products, and

Journal of Legal, Ethical and Regulatory Issues Volume 19, Number 2, 2016
48
trying to manage the whole process of bringing products to the market.” They later set up the
ECHOsi (Enabling Communities with Hope and Opportunities Sustainable Initiatives)
Foundation, which received funds from external parties that wanted to support their advocacy
and social mission. “We could not put the money under ECHOstore,” Javellosa explained,
“because it was not part of the business.”
The establishment of the foundation allowed the ECHOtrio to receive support from
government, and to work in partnership with various groups, especially NGOs, that are similarly
concerned with These are ongoing partnerships that allow ECHOstore to spread its advocacy for
sustainable living across the supply chain.developing communities. For example, they have
worked with the Peace and Equity Foundation (PEF) and the Partnership and Access Center
Consortium, Inc. (PACCI) in setting up ECHOVILLAGE stores throughout the country; and also
with the Department of Trade and Industry (DTI) and the Philippine Commission of Women
(PCW) for the GREAT Women Program.
CROSS-CASE ANALYSIS
Business Models of the Three Companies
For all three social enterprises, they create social value by providing employment to, or
creating business opportunities for, individuals and groups based in poor communities (see Table
1). All three firms initially provided training to their adopted (partner) communities and also
facilitated market access for their products. All three also developed recognizable brands even at
the early stages of their business life cycles.
Table 1
BUSINESS MODEL
Social enterprise Business model
Greenius Sourcing indigenous raw materials (e.g. water hyacinth fiber) from target communities
outsourcing the conversion of these raw materials into stylish products (e.g. luxury
bags, leather journals, tablet covers) selling these products at a premium price to
high-end markets through traditional stores, online selling, and targeted corporate
accounts
Bayani Brew Buying raw materials at relatively higher prices from GK Enchanted Farm and from
other local communities producing Bayani Brew in a rented brewing facility
selling the bottled iced tea to various distribution outlets
ECHOstore ECHOsi Foundation develops capabilities of women entrepreneurs to design, produce
and package quality products and to effectively manage other aspects of their businesses
ECHOstore buys and sells these products, using its own brand, in its retail outlets.
Based on Alter’s typology of social enterprise models, Greenius started out as an
integrated social enterprise because there was a sharing of assets and costs between enterprise
activities and social programs. However, it later became more of a conventional business that
simply sourced materials from, and outsourced the production to, communities.
Bayani Brew, on the other hand, has the characteristics of an integrated social enterprise,
in the sense that there is an overlap between the money-making activity of the business and its
social program. By providing employment, training, and some scholarships to the members of
the GK Enchanted Farm, the company fulfills its social mission. At the same time, the company

Journal of Legal, Ethical and Regulatory Issues Volume 19, Number 2, 2016
49
benefits from its affiliation with Gawad Kalinga, particularly in terms of using the farm’s
facilities for prototyping and market testing.
Finally, ECHOstore can be categorized under the embedded social enterprise model.
While there are two legal entities in the forms of the business and the foundation, there is a
comprehensive relationship between the economic and social activities of the two. Unlike other
typical corporate foundations that operate independently of the mother company and just
depends on it for funding, the ECHOsi Foundation plays a crucial role in the product
development and supplier management aspects of the business.
Challenges
All three social enterprises face the typical concerns of any other business, especially
those associated with keeping costs and expenses below revenue.
In the case of Greenius, for example, its desire to help its adopted community meant
having to procure the hyacinth leatherette for its luxury bags at a much higher price. This meant
that the company had to sell its bags at a premium price, which affected the demand for its
flagship product. The bags, which are priced at P2,500 to P4,000 per piece, are “a bit expensive”,
admits its creative director in an interview in 2012 with Entrepreneur Philippines, “but this is due
to the amount Greenius spends on the workers’ wages.” The co-founder of Greenius also hints at
the difficulties involved in producing luxury bags – “Ang dami kasing learning points sa bags, it
has to be… mas okay talaga yung quality” (There are a lot of learning points in producing luxury
bags, which must be impeccable in quality) (personal communication, October 25, 2013).
In the case of Bayani Brew, on the other hand, the owners’ decision not to draw salaries
from the company means that they are subsidizing business operations. Also, three French
interns / volunteers are contributing their time doing much of the marketing and communication
efforts of the company. While Bayani Brew is not shelling out cash for these services, these are
legitimate expenses that the company must later account for if it wants to make sound decisions
about its cost structure. The goal is for the company to eventually reach sales volumes that will
allow it to generate enough revenue to cover the full cost of its operations. Higher sales volumes
also means higher production levels, which will bring unit costs down.
Both companies also acknowledged the need to professionalize the management of their
businesses. Greenius addressed this by bringing in two partners that have strong managerial and
entrepreneurial backgrounds. These partners, however, prioritized the financial objectives of the
company, which led to a decision to deal with its suppliers in a more arms-length fashion, as
opposed to its more supportive and collaborative approach in the past. This was contrary to the
desire of one of the original co-owners to establish a strong presence in their target communities,
especially since they were initially involved in production and the development of raw materials.
However, this took much of her time, preventing her from dealing with actual and potential
customers. Being in the community also entailed additional costs, which the company could not
afford. This eventually led the company to move away from actual production, which it now
outsources, and to focus instead on marketing and branding activities. According to one of the
co-founders: “That was the decision I had to make, and my partners had to force me to make that
decision. We realized we can’t be all heart, but we can’t be just all money either. We needed to
make some compromises” (personal communication, October 25, 2013).
For Bayani Brew, the three owners (not all of whom have business backgrounds) now
juggle the various responsibilities among themselves. These responsibilities include setting
meetings, supervising the farm, overseeing production, and handling logistics. Khadka

Journal of Legal, Ethical and Regulatory Issues Volume 19, Number 2, 2016
50
acknowledged that the business has reached a stage, during which it needs someone who can
introduce a more systematic way of doing things. A more formal organizational set-up might be
required to facilitate the scaling up of the business (Aguilar, et. al., 2013). “We need people, such
as accountants and operations managers, who really know what they’re doing,” admits Alvarez,
who added that even if they wanted to involve fresh graduates in the business, “we cannot train
them since, in the first place, even we, as co-owners, do not know the details in managing these
functions.”
Fortunately for the owners and employees of Bayani Brew, they are largely operating
within the confines of the GK Enchanted Farm, an incubator that, according to Gawad Kalinga
founder Tony Meloto is both “forgiving enough” to allow for growth, yet “demanding enough”
to stimulate quality. The farm serves as a free research and development facility, where the
company can source its raw materials, do rapid prototyping, and undertake initial market
research through the feedback of people visiting the farm.
Among the three, only ECHOstore claims to be profitable, and has, in fact, expanded its
operations. It does not have a problem in terms of the ability of its founding owners, who have
clearly divided among themselves the responsibilities of running the affairs of the business and
of the foundation. It is now more concerned with improving the reliability of its network of
suppliers, who are mostly women entrepreneurs supported by the Great Women Project and
village enterprises selling their produce through the ECHOVILLLAGE stores. Given its
profitable status, it could very well grow the business steadily, and thus create more social value
in the process.
Strategies
Using the proposed strategies of Dees and Anderson (2006) as a guide, we determined
that ECHOstore utilizes all eight, Bayani Brew utilizes six out of the eight, and Greenius utilizes
two (see Table 2). All three have invested time and energy in creating a committed team, and
have developed a brand reputation for quality and performance. Based on our interviews, all
three recognize the importance of branding in selling their products.
Table 2
EVIDENCE THAT SOCIAL ENTERPRISES EXECUTE DEES AND ANDERSON’S (2002) PROPOSED
STRATEGIES
Strategies Greenius Bayani Brew ECHOstore
Avoid strategic vagueness regarding organization’s
mission
No Yes Yes
Craft an integrated and compelling venture model No Yes Yes
Measure performance creatively and test assumptions
rigorously
No No Yes
Maintain control in sympathetic hands No Yes Yes
Invest time and energy creating a committed team Yes Yes Yes
Anticipate resistance and develop a strategy for
dealing with it
No No Yes
Develop a brand reputation for quality and
performance
Yes Yes Yes
Recognize limits of what can be done for-profit and
use non-profit partners or affiliates to provide
complementary services
No Yes Yes

Journal of Legal, Ethical and Regulatory Issues Volume 19, Number 2, 2016
51
It is worth noting that Greenius does not have a non-profit partner or affiliate that allows
it to sustain its involvement in its adopted community. Its initial involvement with the resettled
community in Laguna did not have any follow-up. This could be due to a shift in strategic
direction brought about by the entry of two new partners, which made the company more
focused on its economic bottom line.
In contrast, Bayani Brew and ECHOstore have continuing engagements in their adopted
communities, which reflect their strong commitment to their social objective. Bayani Brew does
this by working closely with Gawad Kalinga, while ECHOstore does this through the ECHOsi
Foundation. This could be partly attributed to the clarity of vision of the leaders of these two
organizations.
In addition to the strategies listed by Dees and Anderson, the three companies have also
implemented several operational and functional strategies. Greenius, for example, has decided to
expand its product line and is now looking at other indigenous raw materials for its products. To
bring down its production costs, it is using multiple suppliers and outsourcing its production
activities. It is not clear, at this point, whether it will once again take an active role in developing
the capabilities of communities.
Bayani Brew, on the other hand, is aggressively seeking additional distribution outlets for
its bottled iced tea. In terms of production, the company is now renting a manufacturing facility,
which enables it to produce bigger volumes of its product. It is also engaged in product
development efforts directed towards the use of other local agricultural produce. The owners
have mentioned their intention of eventually turning over the business to the community, but it
has not reached the point of formulating its ownership and management succession plan.
For ECHOstore, the strategy is to develop more village enterprises through the
ECHOVILLAGE stores and the GREAT Women Project. This directly feeds into its retail
operations, and allows it to influence a wider network of suppliers and customers into adopting
practices that are consistent with a sustainable lifestyle.
CONCLUSIONS AND RECOMMENDATIONS
It is clear that for-profit social enterprises must deal with the same challenges faced by
traditional businesses. However, social enterprises carry the self-imposed burden of addressing
the needs of those belonging to the bottom-of-the-pyramid, at the risk of putting a strain on their
already limited resources.
For all three social enterprises, the resources available to them were scarce, especially in
the early stages of their respective business life cycles. For Greenius, it helped that it received
some start-up capital for having won a business plan competition in 2009. This allowed it to
support its operations, including its community development activities. When revenues did not
meet expectations, however, the company looked into bringing its costs down, which led to its
arms-length purchasing strategy towards its suppliers. With the entry of new business partners,
the interests of the shareholders took precedence over those of their supplier communities.
In contrast, ECHOstore did not allow the lack of resources to prevent it from fulfilling its
social mission. Through the smart execution of a compelling business model, it succeeded in
getting support from its various stakeholders. First, ECHOstore convinced its target market that
it was worth their money to buy green and all-natural goods at a premium, which allowed the
company to pay its suppliers at fair-trade prices. Second, it invested in the training of its
suppliers, particularly women entrepreneurs, instead of simply purchasing goods from them.
Third, it worked closely with government agencies, NGOs and funding institutions in fulfilling

Journal of Legal, Ethical and Regulatory Issues Volume 19, Number 2, 2016
52
its social mission. From a stakeholder perspective, ECHOstore succeeded in getting all its
stakeholders to work together to support its advocacy for sustainable living.
To a certain extent, Bayani Brew also depends on its various stakeholders to support its
social mission. What is being given priority, at this stage, is the interest of the employees and
community members of the GK Enchanted Farm. The shareholders / owners are subordinating
their economic interests to support the growth of the enterprise, which they eventually plan to
turn over to the community. They choose to do this in support of the mission of Gawad Kalinga,
which, in turn, provides it with the resources they need to undertake research and development
activities in the farm. GK also lends its goodwill to the business, which finds it easier to expand
its network of distribution outlets because of its GK connection. Therefore, its resources are
effectively augmented by being part of the GK network of social enterprises.
One important insight here is that while individual firms have a limited pool of resources,
whether human or material, there is an abundance of resources at the aggregate level, i.e. beyond
the traditional confines of a typical for-profit organization. Government agencies, non-
government organizations, other concerned groups and individuals have resources that can be
leveraged by social enterprises as they attempt to meet their dual objectives. This explains the
evident success of entities such as ECHOstore and GK Enchanted Farm. Could it be that the
tensions experienced by budding social enterprises are partly a result of the scarcity paradigm
that dominates current business and economic discourse? As our cases show, there seems to be
viable and exciting alternative – one that is based on collaborative effort and an abundance
paradigm.
Propositions Validated
Our three case studies provide some evidence that supports our propositions that: (a)
Philippine social enterprises experience tension in their attempts to jointly achieve financial and
social objectives; and (b) those that utilize Dees and Anderson’s proposed strategies are better
able to manage these challenges (see Table 3).
Table 3
VALIDATION OF PROPOSITIONS
Propositions Validated?
Proposition 1: Philippine social enterprises experience tension in their attempts to
jointly achieve financial and social objectives, and are likely to comprise one bottom
line over another.
Yes
Proposition 2: Social enterprises that utilize Dees and Anderson’s proposed strategies
better manage challenges associated with having dual objectives
Yes
This tension is quite pronounced in the case of Greenius, the original owners of which
were generally composed of greenhorns who had to deal with the challenge of keeping the
business viable even as they attempted to create additional social value. In the case of the owners
of Bayani Brew, it is quite clear to them that the social objective takes precedence. This explains
their decision not to receive compensation for their efforts, in the meantime, as the business
approaches the take-off stage. For them, especially Ron Dizon (who left a lucrative IT career in a
multinational company), the greater return on their investment is non-monetary. “If I would work
X hours a week, I might as well do it for something more meaningful,” says Ron. They realize,
though, that the social value created by Bayani Brew cannot be sustained without a viable
business model.

Journal of Legal, Ethical and Regulatory Issues Volume 19, Number 2, 2016
53
The tension is less pronounced in the case of ECHOstore, which seems to have found a
way to effectively address both financial and social objectives when it decided to create the
ECHOsi Foundation. The ECHOstore / ECHOsi structure is unique in the sense that the social
programs undertaken by ECHOsi, with the support of institutional partners, directly feed into the
retail business of ECHOstore. However, ECHOstore, as a distinct entity, is insulated from the
challenges of running a social program, and could focus on daily business concerns. It helps that
the ECHOtrio all have extensive business and / or entrepreneurial backgrounds before they
established ECHOstore. They brought with them a wealth of expertise that allows them to
effectively engage in supplier relations, product development, inventory management, and
market development, among others. Their business network and stature in the business
community have also allowed them to leverage on the resources of other groups that believed in,
and supported, their unique business and social proposition.
Clearly, ECHOstore has been most successful in utilizing the strategies proposed by Dees
and Anderson. And perhaps, this is the reason why, among the three social enterprises, it is also
the only one that claims to be profitable. The business is also growing as evidenced by its retail
outlets in Quezon City, Cebu, and Davao. However, ECHOstore will only expand further if it
finds like-minded people who subscribe to the sustainable living. Says Chit Juan: “It’s not about
the money. It’s the lifestyle. This is about walking the talk” (personal communication, November
22, 2013).
RECOMMENDATIONS
Drawing from the insights generated from the experiences of the three social enterprises,
we present the following recommendations to social enterprise owners / managers, policy
makers, and other researchers.
For Social Enterprise Owners / Managers
Social enterprises are more likely to succeed when they work closely with other groups in
fulfilling their social mission. This means that they must be open to collaborative arrangements
with other businesses, government agencies, or NGOs, especially those that bring along
resources and expertise that the social enterprise might not have. Bayani Brew’s experience
shows how it benefits from its association with other social enterprises affiliated with Gawad
Kalinga, and how synergies could be generated when they engage in joint activities.
Needless to say, social enterprises must be managed by people who have the
qualifications and / or the experience in running a business. For those established by young
entrepreneurs, there must be mechanisms to speed up the learning curve (e.g. training programs,
mentorships) that will enable them to gain the basic competencies needed to run various aspects
of the business, from production to marketing; and from human resource management to finance.
It also helps to be part of a community of like-minded people who can serve as a support group
for these young social entrepreneurs, something that is found in the GK Enchanted Farm.
For Policy Makers
Government can most effectively help social enterprises by creating an ecology of
support for enterprises that attempt to address specific community needs. The burden of creating

Journal of Legal, Ethical and Regulatory Issues Volume 19, Number 2, 2016
54
social value is, thus, shared by several concerned players, making it easier for the social
enterprise to achieve its dual objectives.
Through the Great Women Project of the Philippine Commission on Women (PCW), for
example, the government provided funding and institutional support for the ECHOsi Foundation
to develop the business skills of women entrepreneurs. This means that ECHOstore itself does
not have to carry the financial burden of providing grassroots training, but still provides social
value by providing women entrepreneurs in the rural areas market access for their products. This
successful partnership should be used as a model by other government agencies tasked to support
small and medium enterprises (SMEs), which would include a majority of social enterprises.
Government must also provide support to initiatives such as the GK Enchanted Farm in
Bulacan, which has served as a business incubator for several emerging social enterprises. A
similar business incubator for social enterprises can, perhaps, be replicated in another province in
Visayas or Mindanao, and be designated as a special economic zone that provides facilities and
incentives to business locators.
For Other Researchers
While our study provides empirical support for the propositions of Dees and Anderson
(2002) and illustrations of Alter’s (2006) social enterprise models, it would not hurt to do more
case studies, especially about social enterprises based in the Visayas and Mindanao, to determine
whether similar insights will be generated by additional cases operating in different contexts. It
might be worth testing too whether the following variables that we uncovered in our study are
indeed important factors in the success of social enterprises: (a) business acumen of social
enterprise owners / managers, (b) collaboration with other groups, and (c) ecology of support.
Since most of the social enterprise research, so far, are qualitative in nature, the insights
generated could not be generalized to a bigger population. This will require a sample survey that
will allow scholars to better understand the profiles, practices, challenges, concerns, structures
and strategies of social enterprises in the Philippines.
ACKNOWLEDGEMENT
The authors would like to thank the DLSU-Angelo King Institute (DLSU-AKI) and the
Commission on Higher Education – Philippine Higher Education Research Network (CHED –
PHERNet) for the support that allowed us to conduct our research on social enterprises in the
Philippines.
Journal of Legal, Ethical and Regulatory Issues Volume 19, Number 2, 2016
55
REFERENCES
Abu-Saifan, S. (2012). Social entrepreneurship definition and boundaries. Technology Innovation Management
Review, 2012, 22-27.
Aguilar, J., Gamboa, J. M., Ong, J. N., and Perez, S. J. (2013). Leveraging competitive context: Reconciling the dual
objectives of social enterprises. (Unpublished thesis). De La Salle University, Manila, Philippines.
Alter, S. K. (2006). Social enterprise models and their mission and money relationships. In A. Nicholls, Social
entrepreneurship: New models of sustainable social change (pp. 205-232). Oxford: Oxford University
Press.
Alvord, S., Brown, L. and Letts, C. (2004). Social entrepreneurship and societal transformation. Journal of Applied
Behavioral Science, 40(3), 260-282.
Brown, D. L., and Knudsen, J. S. (2012). No shortcuts: Achieving shared value means changing your business
culture. (SSRN Working Paper Series).
doi: http://dx.doi.org/10.2139/ssrn.2179926
Bull, M. (2007). ‘Balance’: The development of a social enterprise business performance tool. Social Enterprise
Journal, 3(1), 49-66.
Bull, M. (2008). Challenging tensions: Critical, theoretical and empirical perspectives on social enterprise.
International Journal of Entrepreneurial Behavior and Research, 14(5), 269-275.
Carroll, A. (1991). The pyramid of corporate social responsibility: Toward the moral management of organizational
stakeholders – balancing economic, legal, and social responsibilities, Business Horizons, July-August 1991,
pp. 39-48.
Cukier, W., Trenholm, S., Carl, D., and Gekas, G. (2011). Social entrepreneurship: A content analysis. Journal of
Strategic Innovation and Sustainability, 7(1), 99-119. Retrieved from
http://search.proquest.com/docview/885133692?accountid=28547
Daft, R. (2007). Understanding the theory and design of organizations. Thomson South-Western.
Dees, J. G., and Anderson, B.B. (2002). For-profit social ventures. International Journal of Entrepreneurship
Education, 2, 1-26.
Dees, J. G., and Anderson, B. B. (2006). Framing a theory of social entrepreneurship: Building on two schools of
practice and thought. Retrieved from http://www.redf.org/from-the-community/publications/457
Dees, J.G., Emerson, J., and Economy, P. (2001). Enterprising nonprofits: A toolkit for social entrepreneurs. NY:
John Wiley and Sons, Inc.
Emerson, J. (2003). The blended value proposition: Integrating social and financial returns. California Management
Review, 45(8), 35-51.
Freeman, R.E., Wicks, A. and Parmar, B. (2004). Stakeholder theory and “The corporate objective revisited”.
Organization Science, 15(3), 364-369.
Friedman, M. (1970). The social responsibility of business is to increase its profits, New York Times, 13 September.
Retrieved 18 February 2012 from
http://ca.geocities.com/busa2100/ miltonfriedman.htm
Habaradas, R. B. (2013). Corporate social initiatives in the Philippines: Experiences of four major corporations.
Journal of Legal, Ethical and Regulatory Issues, 16(2), 1-16.
Mair, J. and Noboa, E. (2003). Social entrepreneurship: How intentions to create a social enterprise get formed,
IESE Business School Working Paper No. 521, September 2003.
Martin, R. and Osberg S. (2007). Social entrepreneurship: The case for definition. Stanford Social Innovation
Review. 28-39. Retrieved from
www.ssireview.org/images/articles/2007SP_feature_martinosberg.pdf
Nicholls, A. (2006). Social entrepreneurship: New models of sustainable social change. Oxford: Oxford University
Press.
Obay, L. A. (2009). Corporate governance and business ethics: A Dubai-based survey. Journal of Legal, Ethical and
Regulatory Issues, 12(2), 29-47.
Pfeffer, J., and Salancik, G. (1978). The external control of organizations: A resource dependence perspective, New
York: Harper and Row.
Porter, M. E. and Kramer, M. R. (2002). The competitive advantage of corporate philanthropy. Harvard Business
Review (December 2002), pp. 56-68. Harvard Business School Publishing.

Journal of Legal, Ethical and Regulatory Issues Volume 19, Number 2, 2016
56
Porter, M. E. and Kramer, M. R. (2006). Strategy and society: The link between competitive advantage and
corporate social responsibility. Harvard Business Review, 84 (12). Retrieved from
http://hbr.org/2006/12/strategy-and-society-the-link-between-competitive-advantage-and-corporate-social-
responsibility/ar/1
Porter, M. E., & Kramer, M. R. (2011). Creating shared value. Harvard Business Review, 89 (1-2), 1-17. Retrieved
from http: hbr.org 2011 01 the-big-idea-creating-shared-value
Ridley-Duff, R. J., and Bull, M. (2011). Understanding social enterprise: theory and practice. London: Sage
Publications.
Sebastian, A. M. (2010). Blue way 2: Case studies on social business enterprises. Pasig City, Metro Manila,
Philippines: Anvil Publishing, Inc.
Seelos, C. and Mair, J. (2005). Social entrepreneurship: Creating new business models to serve the poor. Business
Horizons, 48, 241-246.
Taran, Z., and Betts, S. (2015). Corporate social responsibility and conflicting stakeholders interests: Using
matching and advocacy approaches to align initiatives with issues. Journal of Legal, Ethical and
Regulatory Issues, 18(2), 55-61.
Thompson, J. and Doherty, B. (2006). The diverse world of social enterprise: A collection of social enterprise
stories. International Journal of Social Economics, 33(5/6), 361-375.
Ulrich, D., and Barney, J. (1984). Perspectives in organizations: Resource dependence, efficiency, and population.
Academy of Management Review, 9, 471-481.
Visser, W. (2010). The age of responsibility: CSR 2.0 and the new DNA of business. Journal of Business Systems,
Governance, and Ethics, 5(3), 7-22. Retrieved from http://www.waynevisser.com/wp-
content/uploads/2012/06/paper_age_responsibility_wvisser.pdf
Visser, W. (2011). The ages and stages of CSR: Towards the future with CSR 2.0. CSR International Paper Series,
3.
Yin, R. (2003). Case study research: Design and methods, 3rd edition. Thousand Oaks, California: Sage
Publications, Inc.
Yin, R. (2009). Case study research: design and methods, 4th edition. Thousand Oaks, California: Sage Publications.
Yunus, M. (2007). Creating a world without poverty: Social business and the future of capitalism. New York: Public
Affairs.
Yunus, M. (2010). Building social business: The new kind of capitalism that serves humanity’s most pressing needs.
New York: Public Affairs.
Yunus, M., Moingeon, B., and Lehmann-Ortega, L. (2010). Building social business models: Lessons from the
grameen experience. Long Range Planning, 43(2), 308. Retrieved from
http://search.proquest.com/docview/288325167?accountid=28547

Journal of Legal, Ethical and Regulatory Issues Volume 19, Number 2, 2016
57
THE PROPERTY TAX DEDUCTION - IMPACT ON
GOVERNMENTS AND TAXPAYERS
Tina Owens, Valdosta State University
Raymond J. Elson, Valdosta State University
ABSTRACT
With an increasing federal deficit, lawmakers are looking at alternative revenue sources
to help reduce it. One such source is the approximately $182 billion that would be saved by
eliminating the deductibility of local real estate property taxes. This deduction is facing critics
who believe that the property tax deduction simply subsidizes local government for their
excessive spending while passing on the tax burden to the federal government. The authors
believe that all revenue generating sources should be explored by policy makers, including the
elimination of the property tax deduction. The paper explores the impact this decision could have
on homeowners, taxpayers, and local governments.
INTRODUCTION
With the federal debt at an all-time high and policy makers wanting to broaden the tax
base in exchange for lower marginal tax rates, legislators continuously look at tax reform,
specifically, deductions for mortgage interest, state and local taxes, and charitable contributions,
to serve their purposes. For decades there has been much debate about the possibility of
eliminating certain state and local taxes, to include state and local income taxes, real estate and
personal property taxes, and general sales taxes. While at a quick glance we see that these
eliminations could reap great monetary benefits for the federal government, a closer look will
reveal that there is more at stake than just the revenue gained. This paper examines the ways
different constituents are affected by the deductibility of real estate property taxes and whether
eliminating this tax provision is a viable option.
BACKGROUND
The Revenue Act of 1913 was enacted during Wilson’s presidency, and created the first
federal income tax, substantially replacing the revenue that was being acquired from tariffs with
revenue acquired by taxing an individual’s income. The Revenue Act of 1913 allowed itemized
deductions for taxes paid, to include almost any tax paid during the year.
In 1944, the standard deduction was introduced in the Individual Tax Act, as income
taxes were becoming more standard for everyone, instead of only the wealthy. It offered a tax
break to those middle and lower class taxpayers who did not have substantial deductions to
itemize. Itemized deductions grew between 1947 and 1979 and included deductions for items
such as state and local taxes, certain interest paid, charitable contributions, and special health
expenses. The revenue gained from these itemized deductions was diminished somewhat by the
also growing standard deduction, because taxpayers were benefiting more from the amount
received in the standard deduction than what they received when they itemized. In 1986, the Tax
Reform Act of 1986 (TRA86) was introduced, which eliminated or amended some of the tax
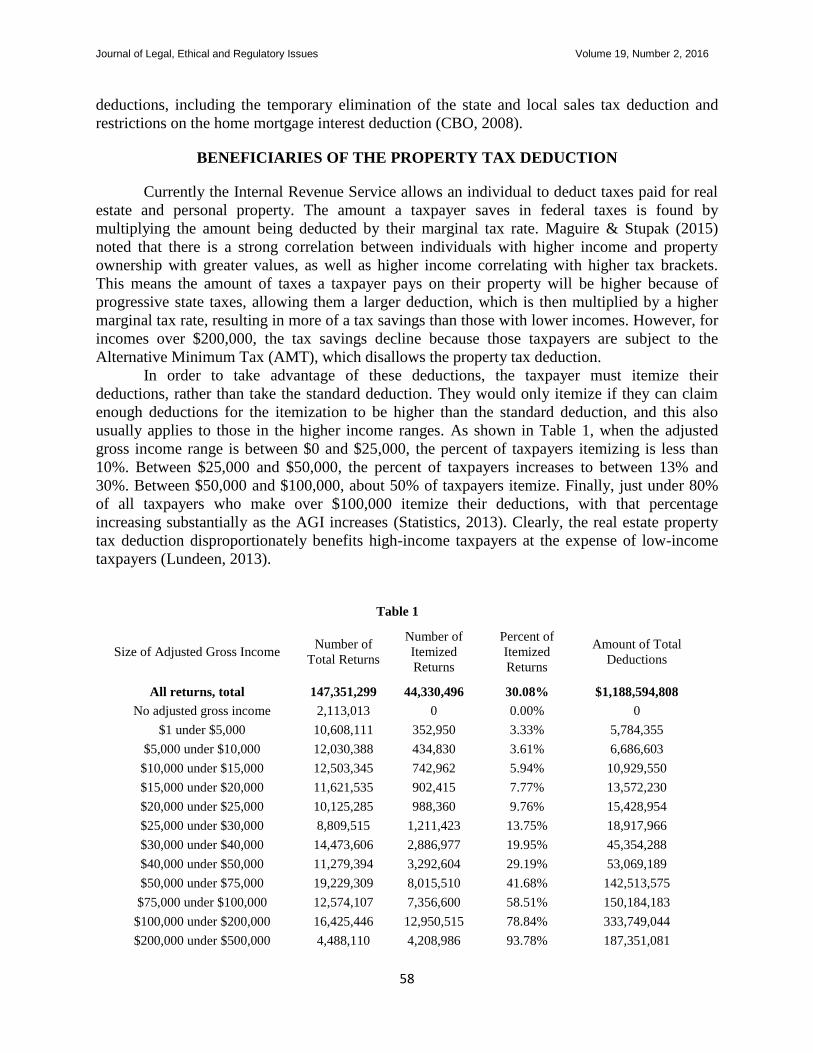
Journal of Legal, Ethical and Regulatory Issues Volume 19, Number 2, 2016
58
deductions, including the temporary elimination of the state and local sales tax deduction and
restrictions on the home mortgage interest deduction (CBO, 2008).
BENEFICIARIES OF THE PROPERTY TAX DEDUCTION
Currently the Internal Revenue Service allows an individual to deduct taxes paid for real
estate and personal property. The amount a taxpayer saves in federal taxes is found by
multiplying the amount being deducted by their marginal tax rate. Maguire & Stupak (2015)
noted that there is a strong correlation between individuals with higher income and property
ownership with greater values, as well as higher income correlating with higher tax brackets.
This means the amount of taxes a taxpayer pays on their property will be higher because of
progressive state taxes, allowing them a larger deduction, which is then multiplied by a higher
marginal tax rate, resulting in more of a tax savings than those with lower incomes. However, for
incomes over $200,000, the tax savings decline because those taxpayers are subject to the
Alternative Minimum Tax (AMT), which disallows the property tax deduction.
In order to take advantage of these deductions, the taxpayer must itemize their
deductions, rather than take the standard deduction. They would only itemize if they can claim
enough deductions for the itemization to be higher than the standard deduction, and this also
usually applies to those in the higher income ranges. As shown in Table 1, when the adjusted
gross income range is between $0 and $25,000, the percent of taxpayers itemizing is less than
10%. Between $25,000 and $50,000, the percent of taxpayers increases to between 13% and
30%. Between $50,000 and $100,000, about 50% of taxpayers itemize. Finally, just under 80%
of all taxpayers who make over $100,000 itemize their deductions, with that percentage
increasing substantially as the AGI increases (Statistics, 2013). Clearly, the real estate property
tax deduction disproportionately benefits high-income taxpayers at the expense of low-income
taxpayers (Lundeen, 2013).
Table 1
Size of Adjusted Gross Income Number of
Total Returns
Number of
Itemized
Returns
Percent of
Itemized
Returns
Amount of Total
Deductions
All returns, total 147,351,299 44,330,496 30.08% $1,188,594,808
No adjusted gross income 2,113,013 0 0.00% 0
$1 under $5,000 10,608,111 352,950 3.33% 5,784,355
$5,000 under $10,000 12,030,388 434,830 3.61% 6,686,603
$10,000 under $15,000 12,503,345 742,962 5.94% 10,929,550
$15,000 under $20,000 11,621,535 902,415 7.77% 13,572,230
$20,000 under $25,000 10,125,285 988,360 9.76% 15,428,954
$25,000 under $30,000 8,809,515 1,211,423 13.75% 18,917,966
$30,000 under $40,000 14,473,606 2,886,977 19.95% 45,354,288
$40,000 under $50,000 11,279,394 3,292,604 29.19% 53,069,189
$50,000 under $75,000 19,229,309 8,015,510 41.68% 142,513,575
$75,000 under $100,000 12,574,107 7,356,600 58.51% 150,184,183
$100,000 under $200,000 16,425,446 12,950,515 78.84% 333,749,044
$200,000 under $500,000 4,488,110 4,208,986 93.78% 187,351,081

Journal of Legal, Ethical and Regulatory Issues Volume 19, Number 2, 2016
59
$500,000 under $1,000,000 724,251 668,727 92.33% 59,933,251
$1,000,000 under $1,500,000 156,269 142,203 91.00% 23,112,957
$1,500,000 under $2,000,000 64,235 58,573 91.19% 12,986,625
$2,000,000 under $5,000,000 91,128 83,993 92.17% 32,815,865
$5,000,000 under $10,000,000 21,412 20,375 95.16% 17,636,345
$10,000,000 or more 12,839 12,493 97.31% 58,568,747
Source: Internal Revenue Service, Statistics of Income - Returns with Itemized Deductions by AGI;
http://www.irs.gov/uac/SOI-Tax-Stats---Individual-Statistical-Tables-by-Size-of-Adjusted-Gross-Income;
Table 1.2 - 2013
PROPERTY TAX IMPACT ON VARIOUS CONSTITUENTS
Federal Government
A report prepared by the Joint Committee on Taxation defines tax expenditures as
revenue losses attributable to provisions of the federal tax laws which allow a special exclusion,
exemption, or deduction from gross income, or which provide a special credit, a preferential rate
of tax, or a deferral of tax liability. Tax expenditures include any reduction in income tax
liabilities (Joint, 2013). Toder et al. (2013) identified the top five permanent tax expenditures for
owner-occupied housing. Listed at number three was the deductibility of state and local property
taxes at $30.6 billion (based on the 2010 federal budget).
State and local taxes, including property taxes, are one of the biggest deductions taken by
taxpayers. According to the Joint Committee on Taxation (2014), $182 billion will be lost
revenue between 2014 and 2018 due to property tax deductions. Not taking into consideration
the other effects that might come into play, such as behavior changes or a rise in the use of other
non-deductible taxes and fees, this is a large amount that policy makers often use to promote the
repeal of property tax deductions.
Feldstein & Metcalf (1987), however, argue that the actual amount of gained revenue
from eliminating state and local tax deductions could be lower than what is estimated. When
taxpayers are allowed to deduct taxes paid from their adjusted gross income, they develop the
perception that the cost of their property is lower. It is possible that eliminating a tax deduction at
the federal level could cause taxpayers to change their spending habits in ways that would lower
the amount of taxes they pay on their property in order to achieve the same lower cost. If state
and local governments aren’t raising enough revenue through the property taxes, they will turn to
financing their spending with non-deductible taxes and fees. Many of these non-deductible taxes
and fees come from higher taxes and fees to corporations, which have a larger impact on federal
revenue than individual income taxes. This means that even though federal revenue will be
increased by eliminating the property tax deduction, if you take into account the revenue lost due
to the higher taxes imposed upon corporations, the amount gained is not nearly what it looks like
at a glance.
There is also the issue of tax rate stability. Policy makers use tax reform as a way to
generate revenue for the federal budget. Sometimes, instead of raising the tax rate, tax reform
will broaden the tax base. For example, eliminating the deduction for property taxes does not
involve a raise in the federal tax rate, but would gain more revenue due to individuals having
greater taxable income because of the loss of the deduction from their adjusted gross income.

Journal of Legal, Ethical and Regulatory Issues Volume 19, Number 2, 2016
60
This means that the tax rate stays stable, yet the federal government can collect more in
revenues.
State and Local Governments
Property taxes constitute the largest source of a local government’s own revenue.
According to the Tax Policy Center, approximately 76 percent of the local revenue in the United
States in 2013 was derived from property taxes (Tax, 2013). This is illustrated in Table 2. These
taxes pay for expenditures toward education, roads and highways, police protection, and utilities.
Table 2
LOCAL PROPERTY TAXES AS A PERCENTAGE OF TOTAL LOCAL TAX REVENUE, SELECTED YEARS
2009-2013
State 2009 2010 2011 2012 2013
United States 80.5% 79.7% 77.5% 75.9% 76.0%
Alabama 40.6 38.5 38.2 39.0 40.1
Alaska 78.6 80.0 79.8 80.3 79.3
Arizona 81.8 80.5 79.5 79.1 75.9
Arkansas 90.9 90.4 89.9 90.1 89.0
California 85.2 84.8 70.9 69.2 69.7
Colorado 75.9 73.5 71.8 69.3 68.7
Connecticut 99.1 99.0 98.9 98.9 98.8
Delaware 85.0 84.9 86.7 87.2 86.5
District of Columbia 22.4 23.4 24.2 23.3 24.8
Florida 84.4 84.1 83.0 81.4 81.9
Georgia 81.3 79.1 76.2 72.9 72.5
Hawaii 80.1 79.6 80.3 79.4 77.0
Idaho 97.3 96.8 97.1 96.4 96.3
Illinois 81.9 80.6 80.2 77.1 74.0
Indiana 96.6 96.2 95.3 95.0 96.1
Iowa 96.9 97.8 96.0 97.9 98.1
Kansas 94.1 93.5 92.9 92.0 91.4
Kentucky 66.9 58.0 56.9 56.5 55.9
Louisiana 48.5 45.0 40.8 41.0 39.3
Maine 99.3 99.3 99.3 99.4 99.4
Maryland 65.1 64.7 62.2 59.8 60.5
Massachusetts 99.4 99.1 99.3 99.3 99.2
Michigan 91.6 91.4 91.5 92.3 93.2
Minnesota 96.0 95.8 95.6 95.3 95.3
Mississippi 94.5 94.6 94.4 94.1 94.0
Missouri 69.8 67.9 65.4 64.2 62.5
Montana 96.1 96.5 96.4 96.9 97.3
Nebraska 93.3 91.6 91.2 90.1 89.5
Nevada 67.5 66.5 66.4 61.1 63.8

Journal of Legal, Ethical and Regulatory Issues Volume 19, Number 2, 2016
61
New Hampshire 98.1 98.1 98.3 98.3 98.4
New Jersey 90.1 89.0 88.5 87.5 97.8
New Mexico 81.7 79.1 77.1 74.0 72.2
New York 68.4 67.9 67.7 64.9 63.0
North Carolina 82.4 81.8 81.1 81.1 81.6
North Dakota 96.5 95.7 96.4 95.8 96.7
Ohio 76.3 74.6 73.4 72.7 72.3
Oklahoma 70.0 65.9 65.3 63.2 59.9
Oregon 92.3 91.1 89.6 89.7 90.7
Pennsylvania 66.2 66.0 65.8 63.6 65.4
Rhode Island 99.1 99.1 99.0 99.0 99.1
South Carolina 93.2 93.1 93.1 92.6 91.8
South Dakota 90.6 89.8 89.3 88.5 87.8
Tennessee 67.9 66.1 64.2 64.3 67.4
Texas 85.8 85.0 84.3 83.5 83.6
Utah 81.8 77.8 77.7 77.7 77.3
Vermont 98.7 99.0 99.4 99.3 99.3
Virginia 69.0 68.6 67.9 67.5 68.5
Washington 69.9 69.2 66.9 62.4 61.7
West Virginia 81.8 81.0 80.7 80.1 79.6
Wisconsin 98.7 98.3 98.5 98.4 98.5
Wyoming 92.0 89.7 88.4 87.4 86.8
Source: Tax Policy Center - Local Property Tax as a Percentage of Local Tax Revenue;
http://www.taxpolicycenter.org/taxfacts/displayafact.cfm?DocID=518&Topic2id=90&Topic3id=92
While eliminating the property tax deduction does not take away from the amount of tax
dollars collected on real property, it may cause behavioral changes, as mentioned earlier.
Taxpayers may decide to buy a smaller home, a less expensive car, or decide against a boat
entirely, simply because they are no longer receiving a benefit from the taxes they are paying on
those assets. If their behavior results in lower property taxes collected, the local governments
could be largely impacted. The reverse also applies – if a taxpayer is getting a deduction for their
property taxes paid, they might be more apt to spend their savings on other state and local
initiatives such as education.
States rely more on income and sales taxes for their source of revenue, so the change in
behavior won’t be as impactful as it will be for local governments. In order to make up for the
lack in revenue from deductible taxes, state and local governments will have to raise their tax
rates or rely more heavily on non-deductible taxes.
The Congressional Budget Office (2008) noted that the property tax deduction serves as a
type of subsidy to the state and local governments. The state and local governments keep every
dollar of the tax revenue they bring in, but the residents do not bear the full burden of those taxes
because the deductions for those taxes that they paid lower their federal tax liability. For
example, if a taxpayer in the 28 percent tax bracket pays $100 in property taxes to their local
government, they will be able to deduct $28 from their federal taxes. This suggests that
essentially the taxpayer paid $72 to their local government and the federal government paid $28.
States that have higher incomes or higher tax rates will receive a larger subsidy from the federal

Journal of Legal, Ethical and Regulatory Issues Volume 19, Number 2, 2016
62
government than the lower income states. These state and local governments can then fund
projects that may not have a value equal to or greater than the cost of the project, but because the
federal government is essentially paying for a portion of it, their cost is lower, making the value
seem better. For example, if a city wants to build a parking garage that costs $1 million but only
has a value of $900,000, it is not an economically sound decision. But if that city relies on taxes
that are deductible, and the federal government is allowing deductions at an average of 25%,
then the cost of the garage to the city is now only $750,000, which makes it a great investment
for them, but is harmful when looking at the nationwide picture (Greszler & Dayaratna, 2015).
Heim & Abbas (2015) point to the theory of perception in discussing the deductibility of
real property taxes. When taxpayers are able to deduct their taxes paid from their federal income
tax, they have a perception of cost savings. This allows states to levy higher marginal tax rates to
support their spending, with the taxpayers believing that they are not spending more, because
they know they will be able to deduct their paid taxes. The changes states make to their tax rates
have a direct effect on federal revenues. If a state raises taxes and a taxpayer is allowed to deduct
more in taxes paid from their federal income, the federal government loses more revenue from
the expenditure of those deductions. Also, if a state lowers their tax rate, taxpayers deduct less
and federal revenue goes up. Therefore, the higher the marginal tax rate at a state or local level,
the higher the expenditure the federal government will have in property tax deductions, and the
lower their revenue will be. This encourages the federal government to then raise the federal
marginal tax rate. The higher federal marginal tax rate applies to every taxpayer, in every state,
regardless of income. All taxpayers will pay more in federal taxes.
Therefore, states and local governments are affected by the amount of taxes collected in
other states if those taxes are then being deducted from federal income (Horpedahl & Searles,
2014). When taxpayers from high income/high tax rate states deduct their paid taxes, and the
federal government decides to raise the marginal tax rate, those in the lower income/lower
property tax rate states get punished. They are already not getting the same kind of deductions on
their federal taxes, and now their taxes are going up to help offset the deductions taking place in
the wealthier states. This relationship is illustrated with the US map in Table 3 (Kapur, 2014).
As noted within, California and New York are high tax states and so their citizens receive the
highest benefit from property tax deduction (17 percent and 13 percent respectively). The other
states have much lower percentages of deductions, many less than 1 percent, yet the citizens are
paying the same marginal tax rates.

Journal of Legal, Ethical and Regulatory Issues Volume 19, Number 2, 2016
63
Table 3
School Districts
The primary income sources for school budgets are local assessed property taxes, state
subsidies, and Federal government subsidies. A report by the National Center for Education
Statistics noted that in fiscal year 2012, school districts reported $600.4 billion in total revenues.
The Federal government contributed $61.0 billion or 10.2 percent of all revenues, state
governments accounted for $271.4 billion or 45.2 percent of all revenues, and local governments
provided $267.9 billion or 44.6 percent of all revenues (Cornman, 2015).
Riddle (2011) discusses the impact that the deductibility of state and local income taxes
has on the education system. He suggests that taxpayers are more apt to take part in initiatives
such as college savings, higher education, or payment of education services if they know these
acts will later produce benefits on their federal tax return. This indirect subsidy can have a
notable impact on the education system and if taken away, could result in decreased revenue for
public education. In addition, Riddle (2011) points out that those states that receive the highest
amount of state and local tax deductions also tend to be the same states that are raising above
average revenues for K-12 education; likewise, the states that have the lowest average deductions
of state and local income taxes are bringing in lower than average revenues. This impact tends to
be felt on a larger scale in the states that have higher income and higher taxes (Riddle, 2011).
Taxpayers
One reason for support of the deductibility of property taxes is that it avoids the issue of
double taxation. Property is taxed at the state and local level, which, when paid, reduces the
amount of discretionary income. Supporters of the deduction claim that taxpayers should not be
taxed on income that was already paid to the state or local government for property taxes.

Journal of Legal, Ethical and Regulatory Issues Volume 19, Number 2, 2016
64
However, because the property tax deduction is only available to those who itemize, 69% of
taxpayers in 2012 did not even benefit from the deduction (Table 4). Those individuals are
already paying double taxes on their income. Of the other 31%, almost all of them claimed the
property tax deduction. As mentioned earlier, those with higher incomes pay higher taxes and are
in a higher tax bracket, making the amount of their deduction higher. This means that lower
income individuals do not benefit from the deduction the same way that higher income
individuals do. There are many supporters of the property tax deduction being eliminated who
want to see it gone simply for reasons of equality (Liebschutz & Lurie, 1986).
Table 4
INDIVIDUAL TAX RETURNS WITH ITEMIZED DEDUCTIONS
Tax
year
Total number
of returns
Returns with
Itemized
Deductions
Percent of
Total
Returns
Real estate
taxes
Percent of
Itemized
Returns
2004 132,226,042 46,335,237 35% 40,457,920 87%
2005 134,372,678 47,755,427 36% 41,310,587 87%
2006 138,394,754 49,123,555 35% 42,584,481 87%
2007 142,978,806 50,544,470 35% 43,604,421 86%
2008 142,450,569 48,167,223 34% 41,643,497 86%
2009 140,494,127 45,695,736 33% 39,987,898 88%
2010 142,892,051 46,644,509 33% 40,982,684 88%
2011 145,370,240 46,293,834 32% 40,138,213 87%
2012 144,928,472 45,581,697 31% 39,251,103 86%
2013 147,351,299 44,330,496 30% 37,803,131 85%
Source: Column B from Internal Revenue Service, Statistics of Income - Individual
income tax returns filed; Table 1.1
Source: Columns C, E, & G from Internal Revenue Service, Statistics of Income -
Individual income tax returns with itemized deductions; Table 2.1;
http://www.irs.gov/uac/SOI-Tax-Stats---Individual-Statistical-Tables-by-Size-of-
Adjusted-Gross-Income
However, the US tax system as a whole is highly progressive and disproportionately
impacts the top 20% of taxpayers who pay more than 80% of income taxes (Saunders, 2015). On
the other hand, the bottom 20% have a negative tax rate, i.e., they receive in tax credits than they
pay in taxes (Desilver, 2016).
The issue of fairness in the tax system is an area of concern for many. However,
reaching a consensus is quite challenging since some taxpayers argue for even higher rates on the
top 20%, and other for flatter tax rates. The impact of tax revenue on the federal government will
depend on the political climate and the personal situations of taxpayers. According to Desilver
(2016), based on 2014 adjusted gross income, the top 2.7% of taxpayers paid approximately 52%
of individual income taxes, while the lower 62% only contributed 5.7% of total taxes. Clearly,
the income lost from the lower taxpayers will not have a large impact on federal revenue.

Journal of Legal, Ethical and Regulatory Issues Volume 19, Number 2, 2016
65
REFORMING THE DEDUCTION
The public, and hence policymakers, are interested in reducing tax expenditures,
especially the favorable treatment of real estate taxes. However, policymakers are moving slowly
towards a decision in order to satisfy their various constituents. It is clear that maintaining the
status quo is not an option since the public is asking for change. A survey on property tax
deductions conducted by the National Journal of 1,001 adults noted that 42% of respondents
favored limiting it for all owners, 19% supported reducing it for high-income households and
31% recommended no change in the system (Harney, 2012).
There have been many solutions discussed, most of them being more middle of the road
options, instead of allowing or repealing property deductions altogether. One solution would be
to take the revenue the federal government gains from eliminating the deduction and use it to
lower the marginal tax rate (Grezler & Dayaratna, 2015). This is something that everyone,
regardless of income, would benefit from, instead of allowing the wealthy to become even
wealthier. Gravelle & Lowry (2015) offer four suggestions, to include putting a dollar cap on the
deduction, restricting the deduction to a certain percentage of adjusted gross income, limiting the
marginal tax rate of the deductions taken, and placing a floor at which the deduction can be
taken. Rueben (2005) suggests eliminating or making changes to the current AMT tax policy.
CONCLUSION
It is evident that allowing the deduction for property taxes benefits some homeowners
and not others. As noted in the paper, only approximately one-third of the total tax filers have the
opportunity to claim the property tax deduction because they are the percentage that itemize their
deductions. Most low-income households do not itemize and therefore forego the deduction.
Therefore, some property owners may not get to claim the deduction even though they pay taxes,
since they are unable to itemize. Higher-income households obtain the largest benefit and have
no limit on the amount they can deduct.
Policy makers are exploring various tax expenditures in an attempt to reduce the federal
budget deficit. The deficit is growing and these tax expenditures, if eliminated or reduced, could
bring in extra revenue to the federal government. However, the effect of these property tax
deductions will be concentrated on the local level of government because this is their main
source of revenue. Most importantly, it affects the school districts to an even greater extent. The
majority of the schools’ funding comes directly from property taxes. Many argue that eliminating
the deduction will decrease property tax revenues and eventually decrease the value of education.
In addition, the progressive nature of the tax system could potentially negatively affect the
work/earnings motivation of top earners as well as have a negative impact on home sales and the
housing market if the property tax deduction is eliminated.
A budget can be balanced in one of two ways – by increasing revenue or reducing
expenditures. The authors support Harney (2014) and others who believe that the property tax
deduction should be eliminated for all tax payers since most taxpayers will not see a major tax
increase. Perhaps this change will encourage local governments to become better stewards of tax
revenues, since citizens, having lost their tax deduction, will be unwilling to fund excessive
spending through tax increases.

Journal of Legal, Ethical and Regulatory Issues Volume 19, Number 2, 2016
66
REFERENCES
Congressional Budget Office. (2008). The deductibility of state and local taxes. Retrieved on August 29, 2016 from
https://www.cbo.gov/sites/default/files/110th-congress-2007-2008/reports/02-20-state_local_tax.pdf.
Cornman, Stephen. (2015). Revenues and expenditures for public elementary and secondary education: School year
2011-2012 (Fiscal Year 2012). National Center for Education Statistics Retrieved on August 29, 2016 from
http://nces.ed.gov/pubs2014/2014301.pdf.
Desilver, Drew. (2016). High-income Americans pay most income taxes, but enough to be ‘fair’? Pew Research
Center. Retrieved on August 29, 2016 from http://www.pewresearch.org/fact-tank/2016/04/13/high-
income-americans-pay-most-income-taxes-but-enough-to-be-fair/
Feldstein, M. S. & G. Metcalf. (1987). The effect of federal tax deductibility on state and local taxes and
spending. Journal of Political Economy, 95(4), 710-736.
Gravelle, Jane and Sean Lowry. (2013). May 21. Restrictions on itemized tax deductions: Policy options and
analysis. Congressional Research Service (R43079). Available at www.crs.gov.
Greszler, Rachel and Kevin Dayaratna. (2015). Time to end the federal subsidy for high-tax states. Retrieved on
August 29, 2016 from http://www.heritage.org/research/reports/2015/03/time-to-end-the-federal-subsidy-
for-high-tax-states.
Harney, Kenneth. (2014, March 9). Tax reform proposal would cut many real estate deductions. The Los Angeles
Times. Retrieved on August 29, 2016 from http://articles.latimes.com/2014/mar/09/business/la-fi-harney-
20140309.
Harney, Kenneth. (2012, December 21). Polls about tax deductions don’t clearly lean for or against changing federal
law. The Washington Post. Retrieved on July 7, 2013 from http://articles.washingtonpost.com/2012-12-
21/news/36018235_1_mortgage-interest-tax-deductions-interest-and-property-tax
Heim, B. & Y. Abbas. (2015). Does federal deductibility affect state and local revenue sources? National Tax
Journal, 68(1), 33-57.
Horpedahl, Jeremy and Harrison Searles. (2014, March 6). The deduction of state and local taxes from federal
income taxes. Mercatus Center at George Mason University. Retrieved on September 7, 2016 from
http://mercatus.org/sites/default/files/Horpedahl_State-Deductions_MOP_030614.pdf.
Joint Committee on Taxation. (2014, August 8). Estimates of federal tax expenditures for fiscal years 2014-2018
(JCX-97-14). House Committee on Ways and Means. Retrieved on July 20, 2015 from
https://www.jct.gov/publications.html?func=showdown&id=4664.
Joint Committee on Taxation. (2013, February 1). Estimates of federal tax expenditures for fiscal years 2012-2017
(JCS-1-13). House Committee on Ways and Means. Retrieved on July 7, 2014 from
https://www.jct.gov/publications.html?func=startdown&id=4503
Kapur, Sahil. (2014). GOP’s New Plan Hikes Taxes on Americans in Blue States. Retrieved on July 7, 2016 from
http://talkingpointsmemo.com/dc/gop-tax-plan-state-local-deduction-liberal-states
Liebschutz, S. & I. Lurie. (1986). The Deductibility of State and Local Taxes. Publius, 16(3), 51-70.
Lundeen, Andrew. (2013, September 23). Elimination of state and local tax deduction possible. Tax Foundation.
Retrieved on August 29, 2016 from
http://taxfoundation.org/blog/elimination-state-and-local-tax-deduction-possible
Maguire, Steven and Jeffrey Stupak. (2015). Federal Deductibility of State and Local Taxes. Congressional
Research Service (RL 32781) Retrieved on August 29, 2016 from
https://www.fas.org/sgp/crs/misc/RL32781.pdf.
Riddle, Wayne. (2011, April). How public education benefits from the federal income tax deduction for state and
local taxes and other special tax provisions. Center on Education Policy. Retrieved on July 7, 2014 from
http://eric.ed.gov/?id=ED518387.
Rueben, K. (2005). The Impact of Repealing State and Local Tax Deductibility. State Tax Notes, 497-513.
Statistics of Income. (2013). All Returns: Adjusted Gross Income, Exemptions, Deductions, and Tax Items.
Retrieved on July 7, 2014 from https://www.irs.gov/uac/SOI-Tax-Stats---Individual-Statistical-Tables-by-
Size-of-Adjusted-Gross-Income.
Saunders, Laura. (2015, April 11). Top 20% of earners pay 84% of income of income tax. The Wall Street Journal,
B8. Retrieved on August 29, 2016 from http://www.wsj.com/articles/top-20-of-earners-pay-84-of-income-
tax-1428674384

Journal of Legal, Ethical and Regulatory Issues Volume 19, Number 2, 2016
67
Tax Policy Center. (2013). Local Property Taxes as a Percentage of Total Local Tax Revenue. Retrieved on July 7,
2014 from
http://www.taxpolicycenter.org/taxfacts/displayafact.cfm?DocID=518&Topic2id=90&Topic3id=92.
Toder, E.J., Joseph Rosenberg, and A. Eng. (2013, July). Evaluating Broad-Based Approaches for Limiting Tax
Expenditures. Tax Policy Center. Retrieved on August 29, 2016 from
http://www.taxpolicycenter.org/publications/url.cfm?ID=412857.

Journal of Legal, Ethical and Regulatory Issues Volume 19, Number 2, 2016
68
USING CAFRS TO ESTIMATE THE COSTS OF
CORPORATE MISCONDUCT ON SOCIETY
A FRAMEWORK FOR CIVIC ACTION
Shirley A. Hunter, University of North Carolina at Charlotte
ABSTRACT
This study uses the event study methodology to question whether public officials in
Massachusetts adjudicated a reasonable settlement under Section 102A ½ (d) of Massachusetts
General Laws, Chapter 266, Crimes Against Property, against the Turner Broadcasting
Company. It uses statistical information disclosed in the Comprehensive Annual Financial
Reports (CAFRs) of Massachusetts to measure the impact of a corporate misdeed on society. In
2007, the Turner Broadcasting Company violated Massachusetts state laws by carrying out a
guerilla marketing campaign which resembled a terrorist threat. The advertising hoax created
mayhem in Boston, Cambridge, and Somerville resulting in the untimely provision of public
services to citizens. Turner Broadcasting Company made immediate restitution of $2 million to
Massachusetts. The results from applying algorithm measures to statistical data reported in the
CAFRs, provide evidence that Massachusetts accrue $1,999,341 in state expenditures and loss
productivity to remediate the event; thus the settlement of $2 million was reasonable. This study
has practical application for policymakers and the general public, it demonstrates the value-
relevance of the CAFRs and how they could be used to estimate the costs of corporate misdeeds
on society.
Keywords: CAFRs; public information; guerilla marketing; viral advertising
INTRODUCTION
What is the cost to society when corporations misbehave? At what level of the corporate
hierarchy is management deemed accountable for third parties’ agreements which violate the
public trust? This study provides a framework which government officials and accounting and
legal professionals could use to estimate the costs of corporate or any misconduct on society.
Public records, such as the Comprehensive Annual Financial Reports (CAFRs), provide detailed
financial and statistical information on local, state, and federal governments operations which are
publish annually on their websites. This is the first study to empirically use statistical data
disclosed in the CAFRs to measure the effects from a guerilla marketing campaign on society.
Guerilla marketing (Levinson, 1984) is defined as the art of being able to execute marketing
activities, using unconventional tactics to elicit consumer interest at minimum costs to the
advertisers. The majority of guerilla marketing is stage in public places (Cova and Saucet, 2014);
hence, if sites are not properly researched (Zuo and Veil, 2007) before execution, pandemonium
could result.
On January 31, 2007, a guerilla marketing campaign financed by the Turner Broadcasting
Company, a subsidiary of Time Warner Company, created mayhem in Boston and its
surrounding communities when an advertising hoax was classified as a suspected terrorist threat.
Following immense media coverage and finger pointing, a deal was announced in which Turner
Broadcasting agreed to pay $2 million to reimburse state, federal, and local law enforcement

Journal of Legal, Ethical and Regulatory Issues Volume 19, Number 2, 2016
69
agencies for the cost of responding to the threat (Zuo and Veil, 2007). As part of the settlement,
the Turner Broadcasting Company was resolved of all criminal and civil claims.
The ordeal surrounding the Turner Broadcasting Company’s advertising hoax is the
object of this study. This research uses the event study methodology to demonstrate how citizens
access to public and emergency services in the affected areas were severely compromised. It
shows that Turner Broadcasting Company paid a reasonable settlement of $2 million in
retribution to Massachusetts to offset remediation expenses incurred of $1,999,341. Thus, this
study has practical application for policymakers and the general public; it presents a framework
which can be used to estimate the social costs for corporate as well as individual acts which are
detrimental to society.
Corporate governance is increasingly becoming a topic of interest by scholars and
practitioners in public administration (Becht, Bolton, and Röell, 2005). The term corporate
governance is derived from an analogy between the governments of cities, nations or states and
the governance of corporations (Becht et al., 2005). Corporate governance refers to a framework
of rules, processes, or laws controlling an entity’s operations (Becht et al., 2005). Governance
policies are designed by internal and external stakeholders and senior management is responsible
for their enforcement. Corporations should ensure that their employees and third parties doing
business with them adhere to a code of professional conduct which supports their governing
philosophy. This study, involving Turner Broadcasting Company’s guerilla marketing campaign,
demonstrates that a corporation deemed to have a high standard of corporate social responsibility
may knowingly agree to a deceptive practice to promote a brand.
Levinson (1984, 1999) coined the term guerilla marketing and defines it as designing
unconventional systems of extreme advertising that rely more on time, energy, and imagination
to target consumers at minimal costs to the promoters. He further states that the innovative
approaches to guerrilla marketing utilize cutting edge technologies to create a memorable brand
experience. Typically, guerilla marketing campaigns are interactive and consumers are targeted
in unexpected places. Guerilla marketing tactics have become vogue due to the advent of the
social media networks. A variety of Fortune’s 500 are using guerilla marketing tactics, including
Unilever, Microsoft, Sony, and Ford, to enhance their brand image (Van der Lans, Van Bruggen,
Eliashberg, and Wierenga, 2009).
The guerilla advertising campaign financed by Turner Broadcasting System involved
hiring a third party, the Interference Company, to place electronically wired devices under
bridges and other obscure public locations throughout the three municipalities of Boston,
Cambridge, and Somerville (Boston Globe, 2007; Driscoll, 2007). The campaign went awry
because many of the citizenry reported the presence of the foreign objects to local fire and police
departments. These departments responded by initiating high alert safety procedures which were
constantly broadcast by the local media. For six intense hours on January 31st, 2007, travel
between and within the three municipalities was halted as investigations were conducted. In the
end, after sheer pandemonium, the local news announced that they had received a
communication from Time Warner, stating that what had ensued was in fact a hoax designed to
introduce a television show.
The late admittance of responsibility for the advertising event was not in the public
interest. Boston is the originating site of two of the hijacked 9/11 flights, so citizens may have a
heighten sense of awareness about public security (Zuo and Veil, 2007). Throughout the event
day, the story of the suspected terrorist threat was one of the wired headlines carried by Reuters,
CBS, and ABC, which are news dispatchers to CNN1. As shown in Figure 1, CNN is the cable

Journal of Legal, Ethical and Regulatory Issues Volume 19, Number 2, 2016
70
news network owned by the Time Warner Company. From a public interest perspective, this
study argues that news of the advertising debacle should have been more timely communicated
through the corporate hierarchy resulting in an immediate decision by management to suspend
the promotion.
Figure 1
The Time Warner Corporation
Time Warner is a leading media and entertainment company, its business segments include Turner Broadcasting
System, Inc., Warner Brothers, TimeInc., HBO, and AOL.
The remainder of this study is organized as follows. Section II presents prior literature on
corporate ethics, background information on the laws in Massachusetts which protect public and
private property, and a demographic profile of the citizens in the affected communities. Section
III discusses the research methodology and develops the set of suppositions about the timely
provisions of public services. In Section IV, the Comprehensive Annual Financial Reports
provide the data and contains a discussion of the results. Section V provides the concluding
remarks.
LITERATURE REVIEW AND PUBLIC INFORMATION
Literature Review
Past ethics-related research includes studies such as Blazovich and Smith (2011), which
examine the relationship between ethical corporate citizenship and financial performance and the
existence of a market premium for ethical corporate conduct over a four year period (2000 to
2003). Their sample data consist of the top 100 ethical firms identified by the Business Ethics
magazine. The sample was matched to a control group of firms based on a number of
accounting-based performance measures. Time Warner was one of the media and
communication firms recognized by Business Ethics; its two-digit SIC code 48, represented
Time Warner Corporation
(TWX)
Warner Brothers
(WB)
Turner Broadcasting
(TBS)
HBO AOL TimeInc.
Interferences Inc.
CNN

Journal of Legal, Ethical and Regulatory Issues Volume 19, Number 2, 2016
71
1.89% of the sample. Blazovich and Smith (2011) concluded that firms deemed ethical by
independent assessors are perceived as been less risky by investors; thus, they enjoy a lower cost
of capital than their counterparts.
A firm specific ethics-related study by Mobus (2012) scrutinized corporate social
responsibility (CSR) reporting by British Petroleum (BP) in the aftermath of an environmental
disaster that occurred on April 20, 2010. An explosion on the BP Deepwater Horizon rig resulted
in the spillage of over 4.9 million barrels of crude oil into the Gulf of Mexico and the death of a
number of rig employees. Drawing on prior literature examining financial transparency in capital
markets, Mobus (2012) questioned whether voluntary CSR reporting satisfies the tenets of full
disclosure for public investors. In the eight day event window following the disaster, Mobus
(2012) performed a comparative analysis of 45 media articles published by seven newspapers to
information voluntary disclosed by BP to test for transparency. The analysis was organized
around the three themes which normally guide CSR reporting of economics, environmental, and
social performance. The intent was to determine the accuracy of BP’s theme base CSR reporting.
Mobus (2012) conclusions suggest that voluntary CSR disclosure by BP provided them with too
much leeway for self-promotion rather than self-reflection or accountability for their actions. A
subsequent investigation by an independent commission revealed that refinery exploration
accidents have plagued BP for decades, thus not consistent with BP’s professed commitment to
safety and risk management in its CSR reports (Mobus, 2012).
Prior ethics related literature shows that corporations strategically manage their public
image. Reputational capital in contrast to earned capital can be easily swayed by public
investors. Most likely, the subscribers to the Business Ethics magazine constitute a distinguish
group of investors who limit their investment decision to socially responsible firms (Mobus,
2012). The oil and gas industry is under constant pressure by public interest groups, so BP was
managing its corporate image by voluntary disclosing selected CSR information to public
investors (Blazovich and Smith, 2011). Time Warner, the company of interest to this study, took
swift action to mitigate a public outcry against its advertising hoax. As social media evolves,
public awareness of corporate-ethics could increase and possibly influence the investment
decision.
Massachusetts General Laws, Chapter 266, Crimes against Property
Prior literature states that the most common pitfalls of guerilla marketing are trespassing
on private property, defacing private or public property and not getting the proper permits or
forewarning local authorities of the activities (Zuo and Veil, 2007). Massachusetts General
Laws, Chapter 266, contain147 Sections governing crimes against public and private property.
Chapter 266, Section 102, provides broad guidance on crimes involving the willful throwing or
placing of explosives at or near persons or property or the unlawful possession of such items. It
states individuals engaging in such acts shall be punished by imprisonment in the state prison for
not more than twenty years, or in the house or correction for not more than two and one half
years, or by a fine of not more than twenty-five thousand dollars, or both. Section 102A½, a
refinement, specifically outlines the penalty for the possession, transportation, use or placement
of hoax devices. Section 102A½ states as follows:
(a) Whoever possesses, transports, uses or places or causes another to knowingly or unknowingly
possess, transport, use or place any hoax device or hoax substance with the intent to cause
anxiety, unrest, fear or personal discomfort to any person or group of persons shall be punished
by imprisonment in a house of correction for not more than two and one-half years or by

Journal of Legal, Ethical and Regulatory Issues Volume 19, Number 2, 2016
72
imprisonment in the state prison for not more than five years or by a fine of not more than $5,000,
or by both such fine and imprisonment.
(b) For the purposes of Section 102A½, the term "hoax device" shall mean any device that would
cause a person reasonably to believe that such device is an infernal machine. For the purposes of
Section 102A½, the term "infernal machine" shall mean any device for endangering life or doing
unusual damage to property, or both, by fire or explosion, whether or not contrived to ignite or
explode automatically. For the purposes of this Section 102A½, the words "hoax substance" shall
mean any substance that would cause a person reasonably to believe that such substance is a
harmful chemical or biological agent, a poison, a harmful radioactive substance or any other
substance for causing serious bodily injury, endangering life or doing unusual damage to
property, or both.
(c) Section 102A½ shall not apply to any law enforcement or public safety officer acting in the
lawful discharge of official duties.
(d) The court shall, after a conviction, conduct a hearing to ascertain the extent of costs incurred,
damages and financial loss suffered by local, county or state public safety agencies and the
amount of property damage caused as a result of the violation of Section 102A½. A person found
guilty of violating Section 102A½ shall, in all cases, upon conviction, in addition to any other
punishment, be ordered to make restitution to the local, county or state government for any costs
incurred, damages and financial loss sustained as a result of the commission of the offense.
Restitution shall be imposed in addition to incarceration or fine; however, the court shall
consider the defendant's present and future ability to pay in its determinations regarding a fine. In
determining the amount, time and method of payment of restitution, the court shall consider the
financial resources of the defendant and the burden restitution will impose on the defendant.
In accordance with Massachusetts General Laws, Chapter 266, Crimes against Property,
the two individuals, Berdovsky and Stevens, hired by interference to carry-out the guerilla
marketing campaign were arrested in the evening by the Boston Police. They were charged with
violating Section 102A½ (a) and (b), which makes it a crime to place a “hoax device” with the
intent to incite the public. Both individuals were released on $2,500 bail from the Charlestown
District Court on February 1st. On February 2
nd, the Turner Broadcasting Company agreed to a
$2 million settlement and on February 10th
, the director of the Cartoon Network resigned. On
May 11th
, criminal charges were dropped against Berdovsky and Stevens in exchange for
community services and a public apology. Berdovsky and Stevens subsequently completed
between 60 and 80 hours of community services at the Spaulding Rehabilitation Center in
Boston.
The succession of remedial actions on the part of Time Warner Company suggests that its
intent was to preserve its corporate image. In less than 72 hours, Time Warner with reported
revenues of $15.955 millions in 20072 settled a breach of the public trust, involving 765,746
citizens in Massachusetts, for $2.0 millions. This study, thus, provides a framework to answer
the research question as to whether Massachusetts, whose functional mandate is to protect and
serve its citizens, adjudicated a reasonable settlement under Section 102A½ (d) on behalf of the
citizens of Boston, Cambridge, and Somerville against the Time Warner Company.
The Demographic Profile of Massachusetts
The public interest is central to a framework for civil action. Prior literature report
disparate views on how many individuals must be affected by an action for it to be viewed as a
topic of public interest (Jordan, 2008). The unit of calculation of public interest is also debatable.
Journal of Legal, Ethical and Regulatory Issues Volume 19, Number 2, 2016
73
From a utilitarian perspective, public interest is calculated with regard to the rights of its
members (Jordan, 2008). This suggests that certain doctrines, instituted by the federal (Bill of
Rights) and state (public safety) governments, could define the realm of public interest. For this
paper, public interest is limited to the individuals in Boston, Cambridge, and Somerville who
were affected by the guerilla marketing campaign.
Tables 1 and 2 present a profile of the average citizen most likely living or working in
one of the communities affected by the advertising hoax. Table 1, Panel A shows Boston with
589,141 citizens in 2007 to be more heavily populated than Cambridge at 102,200 and
Somerville at 74,405. Panel B reports employment statistics across four years; it shows that the
largest percentage (23%) of the state income tax filers consistently fall within the salary range of
$25,000 to $50,000. Panel C shows that the 2007 per capita income for Massachusetts was
$49,142 and that the services sector paid the highest mean salary at $151,712. Panel D shows
that the services sector routinely employs the largest number of individuals followed by the
Education and Health sectors. Panel E lists sixteen corporations which have headquarters located
in either Boston or Cambridge, so their employees would have been affected by the hoax
resulting in loss productivity on the event day.
Table 2, Panel A shows that higher education is the second largest employer in
Massachusetts. Panel B reports that 137,925 students were enrolled full-time in a public
university or college. Boston, Cambridge, and Somerville are the educational headquarters for
more than ten private colleges and universities, including Harvard, the Massachusetts Institute of
Technology, Northeastern, and Tufts with student populations exceeding 10,000. Statistics culled
from the websites of major universities in the Boston area report that approximately 30% of the
undergraduates commute on public transportation and that 90% of the graduate students live in
off-campus housing.

Journal of Legal, Ethical and Regulatory Issues Volume 19, Number 2, 2016
74
City 2004 2005 2006 2007 2008
Boston 559,034 559,034 596,763 589,141 575,993
Cambridge 100,135 100,135 102,740 102,200 101,303
Somerville 77,498 74,963 77,012 74,405 75,970
Massachusetts 6,439,000 6,434,000 6,429,000 6,434,000 6,450,000
$100,000 or higher 442,551 13% 483,066 14% 523,580 15% 564,095 16%
$75,001 to $100,000 270,812 8% 276,245 8% 281,678 8% 287,111 8%
$50,001 to $75,000 448,419 14% 451,322 13% 454,225 13% 457,128 13%
$25,001 to $50,000 792,312 24% 791,001 24% 789,690 23% 788,379 23%
$10,001 to $25,000 669,959 20% 662,540 20% 655,121 19% 647,702 19%
$10,000 or lower 690,528 21% 694,411 21% 698,293 21% 702,176 20%
Total 3,314,581 100% 3,358,584 100% 3,402,587 100% 3,446,590 100%
Footnote: (a) Estimates include - 2006 Fliers average of 2005 and 2007 fliers. 2008 fliers reflect 2007 fliers plus change from 2006 fliers.
Panel C: Massachusetts Mean Income Per Capita by Industry
1998 6,115.0 32,524 879 7,839 26,378 7,952 11,031 13,397 74,721 3,545 15,235 532
1999 6,144.0 34,227 1,007 8,886 27,798 8,542 12,378 14,231 81,706 3,766 16,172 534
2000 6,175.0 37,750 1,101 10,097 31,272 9,506 13,411 15,308 93,694 3,894 16,885 556
2001 6,363.0 38,875 760 11,463 26,675 5,238 10,806 11,358 112,815 4,023 17,461 562
2002 6,408.0 38,862 708 11,779 25,519 5,140 10,350 11,660 111,346 4,171 18,130 597
2003 6,432.0 39,449 769 11,808 25,616 5,206 10,931 12,047 113,871 4,223 18,527 661
2004 6,439.0 41,444 815 12,303 25,807 5,463 11,516 12,614 124,152 4,600 20,061 931
2005 6,434.0 43,355 1,091 12,963 26,009 5,424 11,450 12,771 129,116 4,659 20,214 1,031
2006 6,429.0 46,363 883 13,172 26,242 5,997 12,642 12,496 137,091 4,877 21,647 983
2007 6,434.0 49,142 945 12,819 28,498 6,224 13,271 12,601 151,712 5,037 23,473 1,028
2008 6,450.0 46,287 973 12,985 26,916 5,882 12,454 12,623 139,306 4,858 21,778 1,014
Panel D: Massachusetts Mean Number Employed by Industry
1998 413.0 108.5 575.7 536.4 221.6 97.8 262.8 441.6 1.4 421.8
1999 400.3 118.8 588.0 538.2 226.8 100.3 270.5 462.2 1.4 428.3
2000 403.1 129.2 596.8 545.6 228.1 111.1 274.6 493.0 1.4 435.3
2001 388.6 139.1 592.3 554.9 230.6 111.4 279.5 485.2 1.5 440.3
2002 348.8 140.8 579.8 568.4 228.1 99.6 284.9 453.6 1.6 436.1
2003 324.3 136.8 573.8 575.5 223.7 91.3 287.6 440.6 1.8 425.9
2004 312.9 138.4 572.1 582.2 219.7 87.4 290.8 451.1 1.9 421.5
2005 306.0 142.0 568.0 597.0 225.0 88.0 294.0 469.0 2.0 412.0
2006 306.0 142.0 568.0 597.0 225.0 88.0 294.0 469.0 1.8 412.0
2007 292.0 135.0 568.0 637.0 223.0 89.0 305.0 489.0 1.6 436.0
2008 292.0 135.0 568.0 637.0 223.0 89.0 305.0 489.0 1.4 436.0
Source: Commonwealth of Massachusetts - Comprehensive Annual Financial Report - Statistical Section
Panel A: Population
Income Level
Military
Services
Year
Manufacturin
g
Constructio
n
Trade,
Transportation,Ut
ilities
Education and
Health
Financial
Services
Information
Services
Leisure and
Hospitality
Services
Professional
Services
2007 Filers
Services
Federal
GovtRetail Trade
Natural
Resources and
Mining
Governme
nt
State
Local GovtYear
Population
(thousands)
Per Capita
Income
Mean Income by Industry
Agricultural
Mining Construction Manufacturing
Transportation
Utilities Wholesale Trade
Table 1
Descriptives Statistics by Personal Income and Private Sector Employers
% of Total 2006 Filers est.a % of Total
Panel B: Massachusetts Personal Tax Filers by Personal Income Level
% of Total 2008 Filers est.a
% of Total2005 Filers

Journal of Legal, Ethical and Regulatory Issues Volume 19, Number 2, 2016
75
Journal of Legal, Ethical and Regulatory Issues Volume 19, Number 2, 2016
76
The summary information reported in Tables 1 and 2 suggests that Boston, Cambridge,
and Somerville are densely populated communities; therefore, at any hour of the day, there is a
constant demand for public services. The Turner Broadcasting Company’s guerilla campaign
created social disorder in these communities. The average person who was affected by the
advertising hoax was a resident and either working or studying in one of the municipalities.
RESEARCH METHODOLOGY
Event Study Methodology
This study uses the event study methodology (Brown and Warner, 1980, 1985) to analyze
the effect of Turner Broadcasting Company’s marketing hoax in Massachusetts. An event study
is a statistical method that estimates the effect of a phenomenon on the value of the firm
(MacKinlay, 1997; McWilliams and Siegel, 1997). Event study methodology is typically used in
capital market research. The methodology computes the abnormal price return attributable to the
event being studied by adjusting it to the return that would occur from normal fluctuations in the
financial market (MacKinlay, 1997; McWilliams and Siegel, 1997).
For this research, the event study methodology is applied from a public interest
perspective; the phenomenon is the guerilla marketing campaign. The variable of interest is time.
The element of time is used to estimate the effect of the advertising hoax on the average citizen.
Normalcy in this context is defined as the prevailing safety and environmental conditions that
existed during similar hours on the days preceding and following the guerilla marketing event.
Abnormality from a public interest perspective is defined as any variances from the normal
response time of public officials to emergency requests from its constituents on the event day.
The event study framework for civil action entails a four step process. The first step is to
precisely define the event; for example, this incident stems from a guerilla marketing contract
negotiated between the Turner Broadcasting Company and Interference, a New York advertising
firm. The second step is to establish the event date and time. For example, the initial electronic
placard was discovered on January 31, 2007 at 9:00am by local citizens. Precise knowledge of
the circumstances surrounding the incident provides an audit trail which can be independently
validated. The third step is to define an estimation period or event window surrounding the
incident. For this study, a 3 day event window is used. The estimation period begins at 9:00am
on January 30th
(day -1) and ends at 4:00pm on February 1st
(day +1). The shorter the event
window, the easier it becomes to control for any extraneous noise (MacKinlay, 1997), the event
window is further restricted to the business hours of 9:00am to 4:00pm. This refinement of the
hours surrounding the event window leads to a more accurate measure of the phenomenon on
normality. The final step in the framework is to obtain data that is readily available to the public.
This study uses information from the Statistical Section of the Comprehensive Annual Financial
Report for Massachusetts (CAFR, 2007).
In Figure 2, the event study method is applied to test the market reaction to the Time
Warner Company’s (TWX) share price (MacKinlay, 1997; McWilliams and Siegel, 1997). On
January 30th
, day -1, TWX closed at $48.85 per share. It opened on January 31st at $48.20 per
share rose to a high of $48.83 and later closed at $48.47. This analysis shows that while the
market was open, TWX realized a $0.63 increase in share price on volume traded. Figure 3
shows that the trading volume for TWX was highest on January 31st at 12, 210,436 shares from
day -1 at 7,906,372 shares and later declines on day +1, or February 1st to 10,829,576. The
magnitude of the trading volume was significantly positive at a 54.4% increase in shares traded

Journal of Legal, Ethical and Regulatory Issues Volume 19, Number 2, 2016
77
on the event day which later declined by -11.3% on day +1. The fluctuations in TWX’s stock
volume could suggest that a nebulous event had transpired which the market was trying to
interpret. Zuo and Veil (2007) state that due to the [Massachusetts] government response to the
advertising hoax, the Aqua Teen Hunger Force cartoon received more media attention than
anticipated, as well as accolades for Turner Broadcasting and Interference, as companies willing
to cross the line between creativity and recklessness.
Figure 2
Time Warner Corporation Stock Price Week of January 29, 2007
46.50
47.00
47.50
48.00
48.50
49.00
49.50
1/29/2007 1/30/2007 1/31/2007 2/1/2007 2/2/2007
Date
Sto
ck P
ric
e Open
High
Low
Close

Journal of Legal, Ethical and Regulatory Issues Volume 19, Number 2, 2016
78
Figure 3
Time Warner Corporation Trading Volume Week of January 29, 2007
0.00
2,000,000.00
4,000,000.00
6,000,000.00
8,000,000.00
10,000,000.00
12,000,000.00
14,000,000.00
1/29/2007 1/30/2007 1/31/2007 2/1/2007 2/2/2007
Stock Trading Volume
Da
te
Volume
Development of the Suppositions
The event study framework is applied from a public interest perspective to determine
whether public services were compromised in Massachusetts by the hoax. The first group of
service providers examined using this framework is public safety officials. On the event day,
January 31st, the police and fire departments from Boston, Cambridge, and Somerville responded
to emergency calls reporting multiple sightings of the electronic placards. This study questions
whether an increase in the requests for emergency assistance compromised the normal response
time for emergency services? Prompt decisions had to be made by the dispatchers for the police
and fire departments on the most expedient way to allocate the available resources to meet this
increase in demand for public safety. This leads to the first supposition:
S1: Were public services, as measured by the response time of fire and police officials, in
Boston, Cambridge, and Somerville affected on January 31st by the advertising hoax financed by
the Turner Broadcasting Company?
The Massachusetts Bay Transportation Authority constitutes the second group of public
service providers (Massachusetts Bay Transportation Authority (MBTA), 2007). The MBTA is
the fifth largest transportation system in the United States. It provides services across 191 bus
routes, 14 commuter rail lines, 3 heavy rail lines, 3 ferry routes, and 1 light rail line. The MBTA
provides annual transportation services for approximately 4,510,400 riders or 357,578,991 trips
across their system. On the event day, the media advised the public of delays in MBTA’s
services. The MBTA suspended subway services at the Red, Green, and Orange subway stations
around the affected areas, instead bused commuters to surface sites along the subway route. This
interruption in services increased the commuting time for individuals. For example, the average
run time for the subway line from beginning to end station is 30 minutes. The second supposition
is as follows:

Journal of Legal, Ethical and Regulatory Issues Volume 19, Number 2, 2016
79
S2: Were public services, as measured by the commuting time on the MBTA system, in Boston,
Cambridge, and Somerville affected on January 31st by the advertising hoax financed by the
Turner Broadcasting Company?
The final provision of public services questions the impact of the hoax on road safety. At
9:00am on January 31st, local radio stations advised the public to avoid Sullivan Square in
Somerville (Exit 28 on Interstate 93) due to increased police presence in the area. No reasons
were given for this diversion, thus, traffic started to stall on Interstate 93 as lanes were closed
and cars were detoured off of the interstate into Boston. Several roadways were closed including
access to the Longfellow and Boston University Bridges in Cambridge. These detours lead to
traffic congestion on Interstate 93 and the city streets. The third supposition follows:
S3: Were public services, as measured by travel time on Interstate 93 and around Boston,
Cambridge, and Somerville affected on January 31st by the advertising hoax financed by the
Turner Broadcasting Company?
Statistical Test and Sample Data
The Means Difference T Test is used to answer the questions as to whether there are any
differences in each of the variables testing the response time for public services during the
sample period. A standard for normalcy will be derived from an estimation period calculated for
similar daily activities that occurred from January 30th
(day -1) to February 1st
(day +1) during
the event window. The impact of the hoax is measured by the difference between the actual time
(ATt) that was consumed on the event date, January 31st , relative to the expected normal times
of January 30th
E(ATt-1) and February 1st E(ATt+1). The difference will be called an Abnormal
Time Variable (ATVt). The expectation is that the E (ATVt) should equal zero, providing
evidence that the hoax did not impact on normal operations as hypothesized:
ATVt = ATt - E[ATt-1] (1)
ATVt = ATt - E[ATt+1] (2)
E [ATVt ] = 0 (3)
To answer supposition one, the data disclosed in the CAFRs of Boston, Cambridge, and
Somerville that measured the response rate of public officials to emergency situations was
applied. The time frame is from 9:00am to 4:00pm; it is segmented into hourly increments, for
example peak and off-peak working hours, to estimate the volume of the workload on public
safety officials.
The data for supposition two, examining the impact of the event on public transportation
was derived from the performance indicators reported by the MBTA. For example, on the event
date, January 31st 2007, local radio stations announced the suspension of transit station services
on the MBTA Red Line at many stops so the individuals were bused to the connecting stations.
The MBTA subway lines affected by the advertising hoax included the section of the Red Line
which runs from the JFK/UMass transit station in Boston through Harvard Square in Cambridge
to the Alewife Terminal Station in Somerville; the Orange Line which connects the transit station
Sullivan Square in Somerville to downtown Boston Downtown Crossing; and the Green Line
which runs from the Terminal Station Government Center with connectivity through transfer
stations surrounding Boston University bridge. The Coast Guard closed the Charles River to
water traffic, so all passengers riding on the MBTA Water Transportation Ferries were rerouted
to surface transportation (MBTA, 2007).
The third and final supposition examines the impact of the event on travel time on the
roadways using data also reported in the CAFRs. On the event date of January 31st, the local

Journal of Legal, Ethical and Regulatory Issues Volume 19, Number 2, 2016
80
radio stations broadcasted the travel times through various arteries in Boston, Cambridge, and
Somerville. Interstate 93, which connects the three municipalities, was reduced to one lane
earlier in the day and later traffic was rerouted to local roads. Motorists were also prohibited
from crossing the Longfellow and Boston University bridges due to the security risks. There
were 40 foreign objects investigated on the event date, the location of all of the sites were not
made available to the public.
RESULTS
Public Safety Services
To answer supposition one, the 2007 CAFR reports total expenditures in Massachusetts
at $48.9 millions of which 2.6% was spent on public safety and homeland security. About 2,389
police officers were assigned to Boston, 272 in Cambridge, and 109 officers to Somerville. The
total estimated calls to the Boston police in 2007 was 560,595, (CAFR, 2005) so each officer had
to respond to a minimum of 235 calls. The workload is slightly higher for the Cambridge police
department, where each officer had to respond to 345 calls. In Somerville, the workload factor at
4,225 calls for police services was 39.
The total calls for fire and non-fire services in Massachusetts increased by 1.7% to
642,322 calls in 2007. Approximately 90% of the calls were for non-fire but other emergency
services. In Boston, the total count for fire personnel was 1,611 (CAFR, 2004); Boston received
4,915 calls for services for a workload factor of 3.05. In Cambridge the number of calls for fire
and non-fire services increased slightly from 630 calls in 2006 to 669 in 2007 while Somerville
realized a 21% decline in request for services to 52 calls in 2007.
In Boston, the Police District A-1 was one of the areas targeted by Interference. In 2007
there were 2,831 police assisted crimes in District A-1 less than 0.1% of these crimes occurred in
January 2007. On a city wide basis 24,227 crimes were reported, 9.7% of these crimes occurred
in January. To meet the increase in emergency calls to District A-1 on the event day, police
personnel had to be reassigned from other high risks’ Districts to assist District A-1 with their
response to the advertising hoax.
For Cambridge, the focus area was the Massachusetts Institute of Technology (MIT) and
Harvard University (HU) since their campuses flank the Charles River. The Red Line subway
runs through these sections of Cambridge. Adjacent to the MIT campus, the Longfellow Bridge
connects Cambridge and Boston; and the Boston University and Harvard Street Bridges link the
HU section of Cambridge to Boston. Approximately 14.67% of the total reported crimes in the
MIT District or 11 out of 75 occurred in January. This number could be understated because all
of the major universities have public safety departments which students are more likely to call
for assistance than the local authorities. In the Somerville area, where Tufts University is located,
Tufts and downtown Somerville are covered by Police Precincts 1 to 3, approximately 8.4% of
their total crimes or 39 out of 463 happened in January.
The demand for public safety services is high in Boston; of the 24,227 crimes committed
in Boston; most were associated with acts of larceny and attempted larceny. Yet Boston records
one of the lowest levels of staffing ratios for police protection to the actual number of crimes
committed at 10.28 relative to Cambridge at 13.65 and Somerville at 36.76 per crime. These
statistics suggest that public safety, especially in the Boston area, was at risk on the event day
because police resources were already insufficient to serve the public interest.

Journal of Legal, Ethical and Regulatory Issues Volume 19, Number 2, 2016
81
Table 3 Panels A and B present the national statistics released by the Bureau of Justice
(BOJ) which show on average 31.0% of the police departments, including Massachusetts,
respond to larceny and attempted larceny in 10 minutes or less. For all other crimes with the
exception of Burglary and Vehicle Theft, more than 26.6% of the police departments respond
within 5 minutes. On January 31st, due to the heightened awareness alert issued by the Homeland
Security Agency, normal requests for police services were significantly delayed to the within one
day category.

Journal of Legal, Ethical and Regulatory Issues Volume 19, Number 2, 2016
82
Panel B reports the BOJ statistics on crime by time of occurrence. More than 50.0% of the
crimes of violence, especially aggravated assault, occur during the daytime hours from 6:00am to
6:00pm. On average 36.8% of the property crimes also occur during this period with household
burglary being the most frequent crime. These statistics suggest that citizens in the affected areas
in Massachusetts who were accustomed to a police response time of less than 10 minutes for
services, for example, aggravated assault or household burglary, were under duress for a
minimum of 50 minutes to a maximum of 6 hours as a result of the diversion of police resources
in response to the advertising hoax.
Table 3 Panel C presents the statistics from the CAFRs (2007) for the fire department.
The total number of fires in residential and commercial structures increased to 16,722 in 2007
from 15,507 the prior year. The overall increase in the demand for fire services comes at a time
when there has been a decline in the number of paid and volunteer fire fighters in Massachusetts.
The number of other fires, including those at outdoors parks or in vacant lots, increased by
17.9% in 2007 to 13,483. The amount of property damages due to structure fires decline in 2006
to $165.0 millions than drastically increased in 2007 to $268.0 millions. About 75.0% of the fires
in residential structures are caused by cooking and heating elements, these fires caused a mean
estimate of $16,027 in structural damages. The number of injuries and deaths from fire increased
to 1,133 in 2007 from 971 in 2006; Massachusetts lost 3 fire fighters in the line of duty and fire
personnel suffered 675 injuries. When resources are scarce, it becomes difficult for the fire
department to provide coverage over a broad area. Unlike the police department which may
experience a more constant demand for services, the request for fire service is somewhat
seasonal in Massachusetts. During the winter months from November through March, the fire
departments operate at peak capacity. In January, the fire department responded to 53,580 calls
for services.
Table 3 Panel D summarizes the results from testing for a difference in the response time
for public safety services as posited by supposition one. The assumption is a per capita hourly
wage of $27.30 (based on $49,142 annual salary). The standard response time is within 10
minutes for police services. Assuming that 1% of the population in Boston placed calls for police
services, a 50 minutes delay in the response time create duress in the public interest to the
equivalent of $134,029. As the delay persisted throughout the day in Boston, up to 5 hours and
50 minutes, about $938,207 from civil damages could be attributed to the hoax. The maximum

Journal of Legal, Ethical and Regulatory Issues Volume 19, Number 2, 2016
83
estimated financial consequences to the public interest in Cambridge and Somerville amount to
$162,754 and $118,490, respectively.
The standard response time for a fire department in the United States is within 4 minutes
for the first unit to arrive on the scene after notification (Nadile, 2008). The time for the initial
full alarm assignment to arrive is within 8 minutes. The fire unit initiates tactical operations
within 2 minutes of arrival. The standard response time in Boston is 8 minutes for one engine
company and three firefighters (Massachusetts Fire Incident Reporting System (MFIRS), 2007).
A 2 to 4 minutes variance adjustment is made to the response time depending on the time of day
and the location of the fire. The configuration of fire equipment responding to an alarm depends
on the seriousness and type of fire.
The risk to the public from a delayed in the response time due to fire is fairly pervasive
because of the spread effect in urban areas; a prolonged response time could result in a
catastrophe loss or injuries. For every minute beyond the standard 8 minutes response time for
fire services, could for example in Boston result in property damage ranging from an estimate of
$304 for an outdoor fire to a high of $16,027 for a structural fire. It is reasonable to assume that
the fire unit would arrive within 50 minutes, so the structural loss exposure estimated for 1% of
the fires in Boston, Cambridge, and Somerville is $903,282.
In summary, supposition one questions whether there were any differences in the
response time for public safety services in Boston, Cambridge, and Somerville due to the
advertising hoax. The results from Table 3 show that the public interest was not timely served
during the event window, consequently, the answer to supposition one is yes. Using the 1%
baseline estimate of the demand for services, the minimum cost to the public due to the abnormal
response time by public safely officials is estimated at $1,077,489.
Public Transportation Services
Table 4 presents the results from testing supposition two, the effect of the hoax on public
transportation. The MBTA estimates that 3,030,720 individuals age sixteen years of age and
older annually use its services. The standard weekday operating schedule has the first subway
train departing at 5:05am and the last train departing at 1:00am. The average commuting time on
the subway is 27.0 minutes. The AM rush hour is from 6:30am to 9:00am. The Midday subway
schedule runs from 9:00am to 3:30 and the PM rush hour is from 3:30pm to 6:30pm. During rush
hours, a train departs from the Alewife Station on the Red Line approximately every 9 minutes
and from the Oak Grove Station on the Orange Line and from Government Center on the Green
line every 6 minutes. During the Midday, the subway trains run on a slower schedule departing
from an Orange Line station every 9 minutes and on the Red Line every 13 minutes.

Journal of Legal, Ethical and Regulatory Issues Volume 19, Number 2, 2016
84

Journal of Legal, Ethical and Regulatory Issues Volume 19, Number 2, 2016
85
The MBTA has an operating standard of 150 minutes for the AM Rush hour, during this
period based on a 9 minutes departure time approximately 16.7 trains could run roundtrip from
the Alewife Station. The run from beginning to end terminal is about 30 minutes for the Red,
Orange, and Green Line trains. For the Midday schedule, about 43.3 roundtrips could be run on
the Green Line from Government Center and at the PM rush hour about 35 roundtrips from Oak
Grove on the Orange Line.
During the AM rush hour, the standard run time for the Red Line train from the
JFK/UMass station to the Harvard Square station in 22 minutes. The unit standard for the MBTA
load capacity is 238 passengers per run. The load factor is adjusted upward by 334% for the time
of day; the demand for subway service is higher during the AM and PM rush hours than during
the Midday periods. On January 31st between 8:30 and 9:00am, the standard load factor estimates
that 795 passengers boarded the Red Line train; a total of 3.3 roundtrips take 73 minutes to
transport 2,650 individuals.
Table 4 Panel A shows that the disruption in services on the Red Line increased the
commuting time by 49 minutes at 9:00am due to a detour on the JFK/UMass to Harvard Square
Station for estimated ridership of 2,650 passengers. The highest time delay of 95 minutes was
experienced at 12:00 noon on the JFK/UMass to Alewife Station near Tufts University. On the
Red Line from 9:00am to 4:00pm, total ridership estimated at 30,900 passengers, especially
students, was delayed due to the change in the mode of transport from subway to bus services.
The hourly wage is reduced fifty-percent to $13.65 to account for the student riders on the Red
Line, so civil damages are estimated to be $499,684.
Panels B and C report the results for passengers on the Green and Orange Lines, a highly
diverse group of commuters either working in the public and private sectors or students. Riders
on these subway lines were delayed a minimum of 12 minutes at 12:00 noon on the Orange Line
from Sullivan Square to Downtown Crossing to a maximum of 41 minutes at 12:00 noon on the
Green Line from the Government Center Station to Boston University West. The estimated
ridership along the Green Subway Line is 20,490 including 8,171 individuals who normally
commute by bus. Since passengers were off-loaded from the Green Line to busses, the
commuting time by bus increased 32 minutes at 9:00am on the Govt. Station to Boston Univ
West Station. The passenger load capacity for the Orange Line routes is 12,319, this route was
the least affected by the advertising hoax. Holding the hourly wage constant at the fifty percent
level of $13.65 due to the highest level of ridership occurring during non-peak hours at 12:00
noon, the estimates for commuters on the Green Line is $185,666 and $35,461 for the Orange
Line.
To sum up, the answer to supposition two is yes; there were time differences in the
provision of public transportation services during the event window. An analysis of the MBTA
services on January 31st relative to January 30
th and February 1
st revealed that the commuting
time on three of the subway lines was longer because passengers were diverted to surface
transportation services. The public interest was not served as a result of these unexpected delays
in the MBTA system. The advertising hoax caused an estimated $720,811 in loss productivity for
commuters using MBTA services.
Public Road Services
The third and final supposition examines the effects of the advertising hoax on the roadways.
Massachusetts has 3,213 miles of interstate highway and Interstate 93 takes up 1.9% of the
state’s interstate inventory. Table 5 provides the most recent information on the Annual Average

Journal of Legal, Ethical and Regulatory Issues Volume 19, Number 2, 2016
86
Daily Traffic on Interstate 93 by county and traffic patterns. Items 3 to 19 cover Exits 13 to 31
off of Interstate 93 which were directly affected by the advertising hoax.
The professional employment population is rather dense along Interstate 93, some of the
largest public and private sector employers are located along this interstate (see Table 1 Panel E).
For example reviewing Item 3 which describes Exit 13, on the Boston side of the Charles River
are the JFK Library and the University of Massachusetts. Items 8 and 9 describe Exits 20 and 22
which lead to Chinatown, Tufts Medical and Dental Schools, and the South Station – Amtrak;
Exits 23 through 25 affect the financial district, Suffolk University, the State Capital, and the
Callahan Tunnel to Logan Airport. Crossing the Longfellow and Boston University bridges to
the Cambridge side, at Exits 26 and 26A, there are MIT and HU campuses and at Exit 31 in
Somerville is Tufts University.
The Annual Average Daily Traffic (AADT) data shows vehicular traffic entering and
exiting Interstate 93 on a continuous basis and that these traffic patterns tend to be the highest
during the AM and PM rush hours. From Exits 13 to 31, the total AADT averages 1,472,828
vehicles. Throughout the event day, the radio stations periodically announced that the detours off
of Interstate 93 were causing traffic delays of more than 30 minutes. If 1% of the AADT was
affected for a minimum of a half-hour by these detours, then the public was penalized $201,041
in loss time. However, when consulting Tables 1 and 2, the mean salary for an individual
working in the professional services sector is $151,712 ($84.28 hourly wage). If 1% of the
professional services personnel were caught up in the traffic congestion along Interstate 93, then
the estimated costs to society for the 30 minutes delay increase to $1,241,276. Finally, this

Journal of Legal, Ethical and Regulatory Issues Volume 19, Number 2, 2016
87
analysis leads to a positive answer of yes to supposition three; it provides evidence that travel
time along Interstate 93 was adversely affected by the advertising hoax.
Discussion of the Results
In summary, this section demonstrates the value relevance of information reported in the
CAFRs. It shows how the event study methodology could be applied to examine statistical data
explaining a civil action. For this study, an event study framework was used to determine
whether an advertising contract negotiated between the Turner Broadcasting Company and
Interference served the public interest. The expectation that the Abnormal Time Variable
(E(ATVt) would be equal to zero, as evidence that the advertising hoax did not affect normal
operations was proven false. The results as examined by the three suppositions questioning the
timely provision of public services show that the public was abnormally affected by the guerilla
marketing event. The study estimates the costs associated with Supposition 1: Public Safety
Services at $1,077,489, Supposition 2: Public Transportation Services at $720,811, and
Supposition 3: Public Road Services of $201,041; thus showing that Massachusetts suffered a
loss of $1,999,341 either in state expenditures or loss productivity due to the advertising hoax
carried out by Interference. The Turner Broadcasting Company paid a settlement of $2,000,000
in retribution to Massachusetts for the publicity stunt which appears to be reasonable when
applying conservative algorithms to the statistical data disclosed in the CAFRs.
CONCLUSIONS
This study provides an empirical framework for civic action. It used public information to
explore the circumstances under which a significant public reaction ensues around a corporate
advertising event in Massachusetts. Specifically, the study examines the extent to which a viral
marketing campaign influenced the timely receipt of public services in Boston, Cambridge, and
Somerville on January 31st, 2007. The tests of the performance indicators governing the timely
delivery of public safety, transportation, and road services were done using a three day event
window. This analysis satisfies the precepts for the use and presentation of the event study
methodology as scientific evidence (Tabak and Dunbar, 1999).
Further, the study provides evidence of the emergent of a new advertising medium, viral
marketing (Zuo and Veil, 2007), which could challenge the public interest. Corporate boards of
directors and managers are legally bound to act in the best interest of their shareholders in their
pursuit of profits (Blazovich and Smith, 2011). Sometimes, this creates a moral hazard for
management when the quest for increased earnings trumps corporate governance policies placing
society in harm’s way. Despite the appeal of viral marketing to corporations, prior literature
states that no forecasting tools exist to measure its effects or to balance the risks inherent in its
application on the public (Van der Lans et al., 2009).
From a policy perspective, the study makes an important contribution to the growing
literature on social responsibility and government accounting. It shows the value relevance of
statistical information disclosed in the CAFRs. Future research in this area could include
applying the framework for civic action to estimate the costs accruing to governments for
remediating the effects from corporate misconduct including, for example, chemical spillages
into waterways which could adversely affect citizens (Moghe, 2014; Mobus, 2012). The study
provides public officials and accounting and legal professionals with an analytical framework
which could be easily adapted to measure the impact of any phenomenon on society.

Journal of Legal, Ethical and Regulatory Issues Volume 19, Number 2, 2016
88
END NOTES
1. http://www.cnn.com/2007/US/01/31/boston.bombscare/
2. Time Warner Inc. changed its basis of presentation of financial information in its 2009 Annual Report. This
change resulted in a recast of 2007 Revenues to $26.211 million from originally reporting of $15.955
million (TWX, 2009).
REFERENCES
Becht, M., Bolton, P., & Röell, A. (2005). Corporate governance and control. European Corporate Governance
Institute. Finance Working Paper No. 02/2002. Retrieved March 23, 2007, from
http://dx.doi.org/10.2139/ssrn.34361.
Blazovich, J.L., & Smith, L.M. (2011). Ethical corporate citizenship: does it pay? Research on Professional
Responsibility and Ethics in Accounting, 15, 127-163.
Boston Globe. (2007). Boston bomb scare. The Boston Globe Newspaper. Retrieved June 1, 2008, from,
http://www.boston.com/news/globe/city_region/breaking_news/2007/01/suspicious_oje_1.html.
Brown, S.J., & Warner, J.B. (1980). Measuring security price performance. Journal of Financial Economics. 8, 205-
258.
Brown, S.J., & Warner, J.B. (1985). Using daily stock returns the case of event studies. Journal of Financial
Economics. 14, 3-31.
Comprehensive Annual Financial Report (CAFR). (2004). Retrieved March 23, 2007, from
www.mass.gov/?pageID=publication+and+reports&L2=financial+report&sid=Aosc.
Comprehensive Annual Financial Report (CAFR). (2005). Retrieved March 23, 2007, from
www.mass.gov/?pageID=publication+and+reports&L2=financial+report&sid=Aosc.
Comprehensive Annual Financial Report (CAFR). (2007). Retrieved March 23, 2009, from
www.mass.gov/?pageID=publication+and+reports&L2=financial+report&sid=Aosc.
Cova, B., & Saucet, M. (2014). unconventional marketing: from guerrilla to consumer made. Legal Studies
Research Paper Series, 14-165.
Driscoll, E. (2007). Boston’s CBS affiliate reports about ten suspicious “hoax devices”discovered in Boston January
31, 2007 at 1:05p.m. Retrieved June 1, 2008, from http://www.Ed Driscoll.com.
Jordan, S.R. (2008). The faceless other of the public interest: public administration in a time of crisis. Administrative
Theory and Praxis, 30(2), 241-245.
Levinson, J.C. (1984). Guerrilla Marketing: Secrets for Making Big Profits from Your Small Business, Boston, MA:
Houghton Mifflin Company.
Levinson, J.C. (1999). Mastering Guerrilla Marketing, Boston, MA: Houghton Mifflin Company.
MacKinlay, A.C. (1997). Event studies in economics and finance. Journal of Economic Literature, 35(1), 13-39.
Massachusetts Bay Transportation Authority (MBTA) (2007). Annual Report Retrieved March
23, 2008, from http://www.mbta.com.
Massachusetts Fire Incident Reporting System (MFIRS) (2007). Annual Report Retrieved March 23, 2008, from
http://www.mass.gov/Eeops/docs/dfs/osfm/firedata/mfirs/2007 /annualreport.pdf
McWilliams, A., & Siegel, D. (1997). Event studies in management research: theoretical and empirical issues.
Academy of Management Journal, 40(3), 626-658.
Mobus, J.L. (2012). Corporate Social Responsibility (CSR) Reporting by BP: Revealing or Obscuring Risks.
Journal of Legal, Ethical and Regulatory Issues, 15(2), 35-52.
Moghe, Sonia. CNN News Report – Retrieved December 17, 2014, from CNN Headlines News.
Nadile, L. (2008). Codes and standards spotlight: NFPA Journal Interviews Carl Peterson about NFPA 1710. NFPA
Journal online exclusive. Retrieved May 30, 2008, from
http://www.nfpa.org/publicJournalDetail.asp?categoryID=1344&itemID=38833&src=NFPAJournal.
Tabak, D., & Dunbar, F. (1999). Materiality and magnitude: event studies in the courtroom. National Economic
Research Associates, Inc. NERA Working Paper No. 34. Retrieved March 23, 2007, from
http://www.ssrn.com/abstract=166408.
Time Warner, Inc. (2007). Annual Report to Stockholders Retrieved May 30, 2009, from
http://ir.timewarner.com/annuals.cfm.

Journal of Legal, Ethical and Regulatory Issues Volume 19, Number 2, 2016
89
Van der Lans, R.,Van Bruggen, G.H., Eliashberg, J., and Wierenga, B.A. (2009). A viral branching model for
predicting the spread of electronic word-of-mouth. ERIM Report Series Reference No. ERS-2009-029-
MKT. Retrieved May 30, 2010, from http://ssrn.com/abstract=1414683.
Zuo, L., & Veil, S. (2007). Guerilla marketing and the aqua teen hunger force fiasco. Public Relations Quarterly.
51(4), 8-11.

Journal of Legal, Ethical and Regulatory Issues Volume 19, Number 2, 2016
90
MANAGEMENT DISCRETION OF ACCRUALS PRIOR
TO THE DEMUTUALIZATION OF PROPERTY-
LIABILITY INSURANCE COMPANIES
Jane M. Weiss, University of Wisconsin-Whitewater
ABSTRACT
This study examines whether management of property-liability insurance companies use
their discretion in estimating the claim loss reserve in the year preceding demutualization. Since
valuation of a mutual insurance company is a critical component of the conversion process. I
posit that the incentive to manage surplus by either overstating or understating the insurer’s
largest accrual, claim loss reserves, is dependent on management’s role subsequent to the
conversion process. If management has a significant role (i.e., principal shareholder) after
conversion, the incentive is to overestimate the loss reserves to transfer wealth from
policyholders to themselves. The regression for 48 property-liability insurance companies that
demutualized identifies that claim loss reserves are overstated as a means to decrease surplus
and that a significant role by management in the post conversion company provides the incentive
to overstate the loss reserve in the year preceding the conversion. The study provides an
opportunity to study the impact of the regulatory process on management discretion in loss
reserves, provides further insight into the demutualization process, and extends earnings
management research. Finally, while prior literature identified stabilization of earnings and
avoidance of regulatory intervention as reasons for management discretion in loss reserves, this
study documents management of policyholders’ surplus for management benefit, as an additional
effect of discretion in the reserve estimate.
INTRODUCTION
The purpose of this study is to evaluate management flexibility in determining accounting
estimates in a specialized setting; property-liability insurance companies conversions from
mutual ownership to stock ownership. As discussed more fully below, the valuation of the
mutual insurance company is a critical component of the conversion process and provides
incentives for earnings (surplus) management. Therefore, surplus management is particularly
salient in the demutualization setting.
An insurance company's claim loss reserve is by far the largest accrual that involves
management discretion for these companies. Overestimating (underestimating) the reserves has
the effect of decreasing (increasing) policyholders' surplus. Insurance companies experiencing
growth and/or financial distress have an increased demand for additional surplus. Two methods
of obtaining this additional surplus are through internally generated funds (e.g., underwriting
profits) or externally generated funds (e.g., surplus notes, demutualization).
Demutualization is the conversion of a mutual insurance company to a stock company.
The difference between the two forms of organization is the claim to unassigned surplus. The
amount of unassigned surplus limits the amount of non-liquidating dividends available to
policyholders in a mutual insurance entity and to stockholders in a stock company. Even if the

Journal of Legal, Ethical and Regulatory Issues Volume 19, Number 2, 2016
91
company is a stock company, the stockholders’ claims are subordinate to the claims of
policyholders and other creditors.
This study examines whether managers of property-liability insurance companies use
their discretion in estimating the claim loss reserve accrual prior to the demutualization of the
company. The incentive to either overstate or understate the claim loss reserve is dependent on
management's role subsequent to the demutualization process. If management has a significant
role (i.e., principal shareholder) after demutualization, management's incentive will be to
overstate the estimated reserves to transfer wealth from policyholders' to themselves. By
overstating reserves, surplus is decreased resulting in a lower value for the company and lower
price paid to policyholders, therefore transferring wealth. I hypothesize that if management has
more than a limited role as an investor, in their self-interest, they will overestimate the insurer’s
loss reserve in years preceding demutualization as a method to decrease surplus. Alternatively, if
management has a limited role as an investor and an insurer intends to generate funds through
demutualization, managers acting in the best interests of policyholders will have the incentive to
increase firm value prior to demutualization. A limited role by management, after
demutualization, predicts that managers will increase surplus to increase firm value by
underestimating the loss reserve in the year preceding demutualization
The regression results of 48 property-liability companies that demutualized during the
period of 1982-1999 are consistent with the hypothesis of overstatement of reserves as a means
to decrease surplus. No evidence was found to support the understatement of reserves. The
results indicate that the management process has an impact on the reserve estimate in the year
preceding demutualization with the evidence suggesting that management incentives impact the
demutualization process. The impact on the demutualization process exists when there is no
change in management. The direct impact on surplus management by the demutualization
transaction itself appears to be limited. An insurance company’s financial condition does not
appear to impact the results.
The primary contribution of this paper is twofold. The first contribution is identifying
other potential reasons for management discretion in determining the reserve estimate. Prior
literature finds that management uses discretion in estimating claim loss reserves as a method of
stabilizing underwriting results and that financially distressed firms use their discretion as a
means to smooth earnings to avoid regulatory intervention. This study examines the management
of policyholders' surplus. Specifically, it addresses management’s discretion in estimating loss
reserves as a result of managers’ incentives within the conversion process. The second
contribution is to give further insight to the incentives of an insurer to demutualize. Prior
literature has found mixed results as to the reasons for an insurer to demutualize. Testing the
hypotheses of surplus management prior to demutualization will add further insight into these
incentives, including better access to capital, reduction in agency costs, and management self-
interest.
A secondary contribution is the extension to prior earnings management research. The
advantage of the insurers providing losses reserve development in regulatory reports allows more
direct and accurate tests of earnings management. Other earnings management research relies on
models that estimate potential earnings management. The insurance setting also provides an
opportunity to study earnings management research and the impact of the regulatory process on
management discretion. Within the insurance industry, regulation prevents some discretion in the
choice of accounting policies as well as the active involvement in the stock conversion process
through the state insurance commissioners.

Journal of Legal, Ethical and Regulatory Issues Volume 19, Number 2, 2016
92
The organization of this paper is as follows: Section 2 develops the demutualization
environment. Section 3 outlines the theoretical development for earnings management. The
sample is described in Section 4 with the model described in Section 5. Section 6 presents the
results of the empirical test while Section 7 summarizes the paper.
DEMUTUALIZATION ENVIRONMENT
Surplus
For the test conducted in this paper, it is important to understand the role that
policyholders' surplus has in an insurance company and the demutualization transaction. Three
primary purposes of surplus include 1) providing the initial funds to establish the company and
begin operations, 2) providing a continuing source of funds for growth, and 3) providing a safety
cushion to absorb adverse underwriting and investment experience without loss to policyholders.
Factors affecting surplus are derived from the second and third purposes and include
underwriting results, investment performance, loss reserve developments and growth rate. Due to
the adverse effects these factors could have on surplus, insurers are required by state insurance
regulators to maintain minimum surplus levels to continue operations and protect policyholders
from loss.
Insurance companies experience increased demand for capital as a result of growth and/or
financial distress. If a company intends to grow, this growth must be accompanied by increased
surplus. The traditional method to support growth is through internally generated profits. If the
internally generated funds are insufficient, the insurer looks for other sources to obtain the
surplus requirements. Financially distressed firms are firms that do not meet regulatory
requirements or meet the requirements but their financial strength is vulnerable to unfavorable
changes in underwriting or economic conditions. Not meeting or barely meeting the
requirements results in regulatory surveillance. Therefore, financially distressed insurance firms
have incentives to increase surplus by various methods. Raising capital through an equity
offering is one method. However, mutual insurance companies, which are owned by the
policyholders, do not have this option and are therefore required to demutualize to raise capital
through an equity offering.
Demutualization
There are various incentives for companies to demutualize. The two most prominent
incentives are better access to capital and reduced agency costs (Mayers & Smith, 2004).
Companies, both financially healthy and financially distressed, want better access to capital to
meet economic and competitive changes. Companies can meet these changes by either restricting
operations to reduce costs or to expand operations to spread its overhead (Fitzgerald, 1990).
Companies choosing the latter require additional capital and the necessary capital is obtainable
through either internally generated funds or externally generated funds, such as demutualization.
Up-front capital is required for expansion because statutory accounting principles do not allow
the acquisition expenses to be matched with the generated revenue as in generally accepted
accounting principles. Therefore, surplus is decreased as new business is written with the level of
surplus measuring the company's underwriting capacity and expansion through internally
generated funds (i.e., policyholders' surplus) is extremely difficult when underwriting losses
occur in successive years4.

Journal of Legal, Ethical and Regulatory Issues Volume 19, Number 2, 2016
93
Reduction of agency cost is another incentive for demutualization. The three functions
performed within an insurance company include: 1) the management function, 2) the owner
function, and 3) the customer function. These three functions of management, owner
(shareholder), and customer (policyholder) are separate in stock companies while owner and
customer are merged in mutual companies (policyholder) (Mayers & Smith, 1988). Fama and
Jensen (1983) argue that separation of decision making and risk bearing is likely to accompany
separation of decision making and decision control to minimize agency conflicts. Mayers &
Smith (1988) and Cagle, Lippert & Moore (1996) summarize the advantages and disadvantages
of stock and mutual companies in regards to agency conflicts.
An important stock company advantage is that many decision control mechanisms are
already in place, therefore limiting the agency conflict between managers and shareholders.
Some decision control mechanisms include: 1) shareholder monitoring, 2) the market for
corporate control, 3) the managerial labor market, 4) monitoring by analysts, institutions and
regulatory authorities, and 5) the capital and product markets. Another advantage to a stock
company is the ability to align manager's interest with shareholders' interest through performance
incentives. The disadvantage to stock companies is the additional agency conflicts between
shareholders and policyholders. In a stock company, managers are agents for the shareholders.
This relationship gives management the incentive to increase share value by altering investment,
financing, and dividend policies at the expense of policyholders. The expense to policyholders
may be increased probability of insolvency and reduced expected benefits of policyholders. This
incentive is further increased if performance incentives exist. This becomes an advantage to
mutual companies, because the merging of owner and customer functions eliminates the owners'
incentive to transfer wealth from the policyholder to shareholders.
At the same time, the advantages of stock companies are disadvantages for mutual
companies. In general, mutuals have fewer methods to monitor management, therefore
increasing agency problems between management and policyholders. Control mechanisms
include: 1) regulatory authority oversight, 2) presence of redeemable claims held by
policyholders, and 3) supervision by the board of directors. Heller (1986) argues that regulatory
oversight is the strongest control mechanism but at the expense of the mutual's flexibility and
efficiency in operations. A mutual's management is immune to pressures from policyholders due
to a lack of a mechanism for concentrating ownership (Heller, 1986). The only method to
influence management is through threat of exit (i.e., presence of redeemable claims) by
policyholders. However, the presence of redeemable claims is only effective if it is inexpensive
for policyholders to change insurers. If the cost of changing insurers is high, management is
immune to pressures from the owners.
Supervision by the board of directors also is limited since internal managers and residual
claimants choose outside board members. Since mutual companies are owned by policyholders,
performance incentives are unavailable to management. Because both forms of structure
minimize agency costs through different means, companies demutualizing may seek to reduce
existing agency conflicts. For example, a company may determine that the agency problem
between shareholders and policyholders is less costly than the agency conflict between
management and owners. While changing to a different organization structure may result in a
trade-off of conflicts and benefits, the demand for capital may outweigh this trade-off and lead to
demutualization.
The various methods of demutualization are determined by states (Fitzgerald, 1990). The
majority of states adopt a straight conversion plan and a majority of the companies included in

Journal of Legal, Ethical and Regulatory Issues Volume 19, Number 2, 2016
94
this paper's sample demutualized through some form of straight conversion. The general process
of a straight conversion is the valuation of the embedded equity claims of the policyholders, the
identification of policyholders, and the settlement in some form of stock, cash, or both to
policyholders. The remaining shares are sold to interested parties which accomplish the goal of
obtaining additional surplus2. Other types of conversions, but not as widely used, are preferred
stock bail-out, bulk reinsurance, and merger or consolidation (Fitzgerald, 1990).
Valuation
Important in the demutualization process is the valuation of the embedded equity claim of
policyholders. The valuation is important because insurance regulation requires distribution of
the embedded equity claim to policyholders. Demutualization is a corporate-control transaction
and corporate control transactions result in a high demand for information (DeAngelo, 1986).
The valuation process in the demutualization transaction occurs in a non-market setting since
there are no separately traded equities of these companies. Valuation of a company relies heavily
on accounting numbers, especially policyholders' surplus (Mayers & Smith, 2004). Due to the
impact of the valuation process on both the distribution of wealth and the social welfare of
parties involved, appropriate valuation in this non-market setting is a concern (Perry, 1990).
Determination of value affects the feasibility of control transactions.
Heller (1986) argues that there are two methods in determining value. The first method is
to value it administratively and consists of commissioning an appraisal committee to estimate
market value. This method is appropriate when the market for the firm's assets is thin, with few
bidders. The second method is a capital market valuation. This method is applicable only if there
are many bidders with the bids ultimately converging to a market price. Capital market valuation
is seldom used since most demutualizations do not solicit bids. All states except New York,
Ohio, and Wisconsin use an appraisal committee to determine value.
A common approach used by many state regulators is the adjusted book value approach
(Tillman, 1985). The approach starts with statutory financial statements (policyholders' surplus)
with adjustments to generally accepted accounting principles with other relevant adjustments.
One of the more significant adjustments is the elimination of the loss reserve
deficiency/redundancy. Due to the relative weight in valuation and the subjectivity in
determining reserve levels, reserve adjustments are sensitive to the valuation process. Once the
value of the embedded equity is determined, the processes of actual distribution to policyholders
and issuance of stock begins. In general, the distribution process uses a formula whereby mutual
policyholders, either overall or by type of policy over a predetermined time period, receive a pro-
rata portion of the equity (Heller, 1986). The stock issuance can be in the form of a private
offering (e.g., to a holding company and/or management) or a public offering.
Prior Research
Demutualization
Limited research exists regarding accounting issues of property-liability insurance
companies. A 20-year demutualization case study identified overall characteristics of companies
that have demutualized (Fitzgerald, 1990). The study documented that firms were primarily older
Midwest firms that operated in limited lines of insurance. These companies wrote insurance in
limited states and developed financial difficulties as a result of unprofitable underwriting
Journal of Legal, Ethical and Regulatory Issues Volume 19, Number 2, 2016
95
practices over a period of time. Unprofitable underwriting practices results in a combined ratio
exceeding 100% implying that the estimated insurance claims and operating expenses exceeded
the premium income3. Investment income is only remaining item to offset this loss and if it is not
sufficient to cover the excess insurance claims and operating expenses over premium income
(i.e., underwriting loss), depletion of capital is the result. Losses over a period of time mean that
net income is an unreliable source of expansion financing.
If net income is an unreliable source of financing, an insurer requires other access to
capital (i.e., additional surplus) to expand or survive. As mentioned earlier, one disadvantage of
mutual companies is the restricted access to capital. Unprofitable underwriting practices further
limit the access to capital which leads to demutualization as a means to raise additional surplus.
Fitzgerald (1990) results were determined without the use of any controls for exogenous factors.
In addition to examining the incentives to demutualize, Mayers & Smith (2004) examine
the accounting managements incentives associated with demutualization. They argue that
accounting information is important in the valuation process and that management is interested
in reducing the embedded equity value allocated to policyholders by managing surplus. To
investigate this argument, they examine the increase in loss reserves, the recognition (non-
recognition) of losses (gains) in the company’s asset portfolio, and the acceleration in claims
settlement to increase underwriting losses. Their results support the growth hypothesis in that
demutualization facilitates the acquisition of capital and reduces the growth restrictions imposed
by mutual companies. In managing surplus, their results suggest that companies have more
discretion in adjusting liabilities than managing investment and underwriting returns. The
evidence is also consistent with controlling management having personal motives for
demutualization. Their study does not evaluate the actual claim loss reserve development to test
management of loss reserves. They use a model that evaluates the discretionary component of
the change in total liabilities.
Earnings Management
Management's incentive to manage earnings has been examined in various contexts. The
form of the earnings management varies among these contexts and is not identified in all
contexts. DeAngelo (1986) and Perry & Williams (1994) studied going private transactions,
McNichols & Wilson (1988) examined income smoothing through the provision of bad debts,
Petroni (1992) and Weiss (1985) studied earnings management in insurance companies through
estimated loss reserves.
Demutualization is similar to going private transactions in that accounting numbers are
used to assess the fair value of the firm for settlement to shareholders in going private
transactions and policyholders in demutualization transactions. In both transactions, the role
management has subsequent to the transaction determines the incentive management has to
manage earnings. DeAngelo (1986) found no evidence that managers manage earnings prior to
the transaction but Perry & Williams (1994) identified mixed results of earnings management in
this context.
The similarity between McNichols & Wilson (1988), Weiss (1985), and Petroni (1992) is
that all three chose a single accrual to examine income smoothing. McNichols & Wilson (1988)
examined the allowance for bad debts and found evidence supporting earnings management
through this accrual. Weiss (1985) did a multivariate analysis of loss reserve estimates for stock
and mutual automobile insurers and found evidence supporting the smoothing of reported
financial position by discretion in estimating loss reserves. The study examined the automobile

Journal of Legal, Ethical and Regulatory Issues Volume 19, Number 2, 2016
96
liability insurance line using a pooled, cross-section time series regression. The smoothing of
financial results was examined by testing the significance of the relationship between loss
reserve error and actual combined ratio. Loss reserve error is the difference between the
estimated and actual development of claims paid using a five-year lag period. Tests also
examined exogenous economic developments such as inflation and interest rates. An increase in
inflation and/or interest rates will result in underreserving the loss reserve estimate. The
empirical analysis supported the hypothesis and concludes that exogenous economic
developments affect the degree of accuracy of loss reserve estimates.
Petroni (1992) investigated only stock property-liability insurance company’s managerial
choices in their estimates of the claim loss reserve. The findings support the hypothesis that the
incentive to underestimate the claim loss reserve is a decreasing function of the insurance
company's actual financial position. The sample was chosen from all stock property-liability
companies domiciled in the United States in 1979 and does not identify companies that have
demutualized. To test the understatement of reserves, Petroni divided the sample between
companies having financial difficulties and financially healthy companies. The subsamples were
developed using a set of ratios that determined the financial condition of the companies. After
controlling for tax rates and exogenous factors, the results of the research indicated that
managers of the financially troubled institutions bias downward their liability relative to other
insurers. This bias toward understating reserve increases as the risk of receiving regulatory
scrutiny increases. Regulatory scrutiny increases as insurers become more financially distressed.
A significant difference between this paper and the non-insurance industry papers is that,
like Petroni (1992), this paper is able to test the understated (overstated) liability directly by the
use of regulatory reports. In general, tests of abnormal accruals in other industries are based on
expected future cash receipts and payments from past and current transactions. The accuracy of
expected future cash flows is very difficult to measure directly. Measuring the accuracy of the
claim loss reserve can be done directly through regulatory reports that are issued subsequent to
the recording of the estimated liability. The reports identify the actual claims incurred to date and
enable comparison between actual and estimated reserves.
Since the (Weiss, 1985) paper studies both mutual and stock companies and the (Petroni,
1992) paper studies only stock companies, this paper differs because its sample only consist of
mutual companies. This paper also differs from the (Petroni, 1992) study in that the prior study
investigated financial distressed stock companies and management discretion in the claim loss
reserve. This paper also is interested in management discretion of reserves but is interested in
determining if the discretion is an effect of mangers' incentives within the demutualization
process. Demutualization does not necessarily mean that the company has financial troubles,
although financial troubles could be the reason for demutualizing.
For example, Heller (1986) argues that a company’s decision to demutualize depends on
the risks of the conversion process as well as on the advantages of operating as a stock company.
He argues that companies most likely to demutualize are rapid growth companies and companies
that face dim prospects as a mutual and therefore convert to revitalize the company. Therefore,
this paper will look at mutual firms that demutualize and control for financially troubled firms.
This study will differ from the (Weiss, 1985) study in that it will examine demutualized
companies and more than the automobile liability line of business. It will examine the total
business of property-liability companies that have demutualized. Instead of looking at
management discretion in estimating loss reserves for smoothing effects, this paper is interested
in management's surplus management within the demutualization transaction.

Journal of Legal, Ethical and Regulatory Issues Volume 19, Number 2, 2016
97
HYPOTHESES
The claim loss reserve is one of the largest liabilities on an insurance company's balance
sheet. Because of their relative size and degree of difficulty in achieving reasonable accuracy in
their determination, claim loss reserves are the most important and critical liability in the balance
sheet. In the short-run, overstatement (understatement) of this liability results in a decrease
(increase) to underwriting gains and policyholders' surplus. As the overstated (understated)
reserves develop, the overreserving (underreserving) of those losses will strengthen (depress)
future underwriting gains. The concern of regulators is that serious misestimating in reserves
affects the future financial condition of an insurer, possibly leading to insolvency. Exhibit A
summarizes the effects of understating claim reserves.
Anderson (1971) studied the effects of under-and-overevaluations in loss reserves. His
findings included the following conclusions. First, errors in loss reserves are of sufficient
magnitude to have significant effects on surplus and thus an influence on financial stability.
Second, changes in loss reserve margins may be a tool in stabilizing underwriting results. While
the evidence suggests the use of reserves as a smoothing technique, the evidence is not
conclusive. This paper is testing for the significant effect on surplus from overstatement
(understatement) of loss reserves.
Development of the hypothesis must consider management's incentive between loss
reserve management and demutualization. Schipper (1989) recommends that to test for earnings
manipulation, both economic incentives and circumstances surrounding the transaction need to
be considered. Demutualization requires valuation of the mutual company and the level of
surplus is a key component of the valuation process. Since loss reserve management impacts
surplus and therefore valuation, the link between loss reserve management and demutualization
is established. I review management's role (i.e., ownership/control) in the demutualization
process to identify the different economic incentives facing managers. It is recognized that in a
regulatory environment, there are features of the insurance setting that may control management
incentives. Examples of these features are the policyholders' contracts, fewer opportunities to
manage earnings, and active involvement in the demutualization process by state insurance
regulators. What is difficult to determine is the net effect of these features on management
incentives. An example of this difficulty is the possibility of ineffective controls due to the
regulators' lack of expertise in determining earnings management.
Management’s incentives to manage surplus for valuation purposes are dependent on the
role of management in the demutualization process. If management has much to gain from the
transaction, such as significant ownership interest in the newly formed stock company, their
incentive would be to manage earnings by overstating reserves, thereby reducing surplus.
Decreasing the surplus by overstating reserves could result in a lower value of the company and
therefore lower stock prices. Lower valuation results in a lower settlement to policyholders as
well as enables managers to buy stock at a lower price. This transfer of wealth from existing
shareholders to themselves result in an agency conflict between policyholders and management.
This incentive leads to the first hypothesis:
H1: The year prior to demutualization, managers of property-liability insurance companies who have
a significant ownership interest after demutualization will overstate their estimates of claim loss
reserves as a means to decrease the companies' surplus.
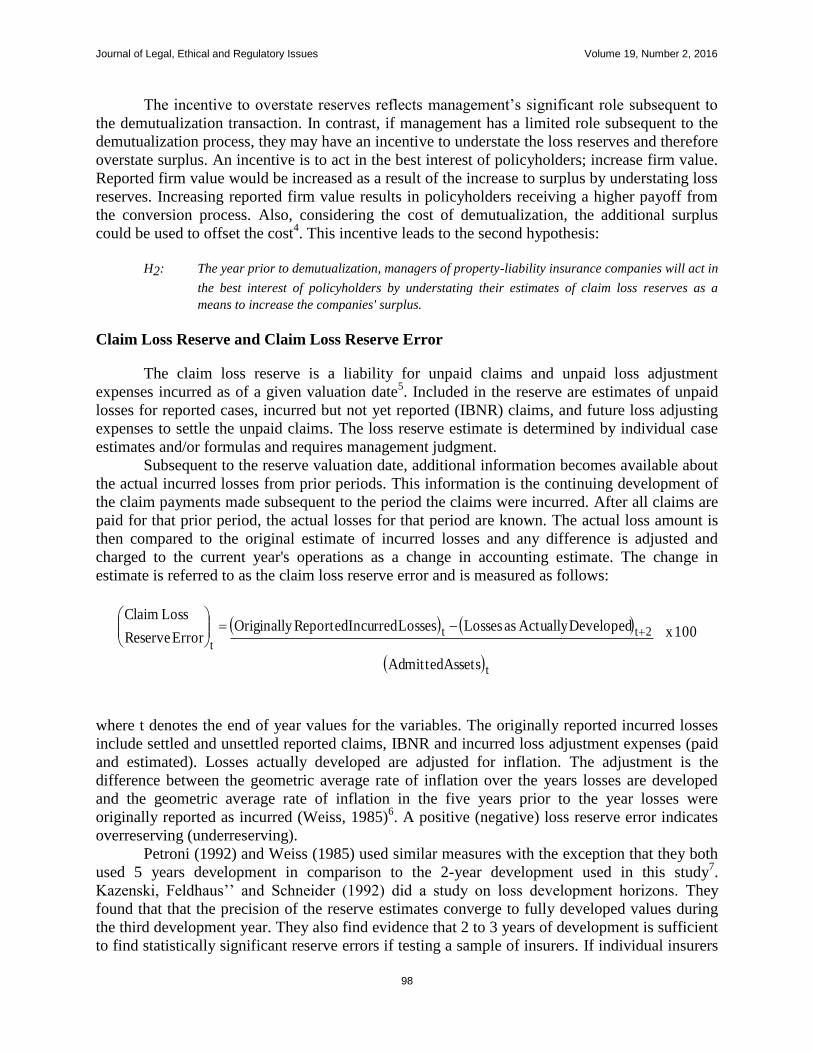
Journal of Legal, Ethical and Regulatory Issues Volume 19, Number 2, 2016
98
The incentive to overstate reserves reflects management’s significant role subsequent to
the demutualization transaction. In contrast, if management has a limited role subsequent to the
demutualization process, they may have an incentive to understate the loss reserves and therefore
overstate surplus. An incentive is to act in the best interest of policyholders; increase firm value.
Reported firm value would be increased as a result of the increase to surplus by understating loss
reserves. Increasing reported firm value results in policyholders receiving a higher payoff from
the conversion process. Also, considering the cost of demutualization, the additional surplus
could be used to offset the cost4. This incentive leads to the second hypothesis:
H2: The year prior to demutualization, managers of property-liability insurance companies will act in
the best interest of policyholders by understating their estimates of claim loss reserves as a
means to increase the companies' surplus.
Claim Loss Reserve and Claim Loss Reserve Error
The claim loss reserve is a liability for unpaid claims and unpaid loss adjustment
expenses incurred as of a given valuation date5. Included in the reserve are estimates of unpaid
losses for reported cases, incurred but not yet reported (IBNR) claims, and future loss adjusting
expenses to settle the unpaid claims. The loss reserve estimate is determined by individual case
estimates and/or formulas and requires management judgment.
Subsequent to the reserve valuation date, additional information becomes available about
the actual incurred losses from prior periods. This information is the continuing development of
the claim payments made subsequent to the period the claims were incurred. After all claims are
paid for that prior period, the actual losses for that period are known. The actual loss amount is
then compared to the original estimate of incurred losses and any difference is adjusted and
charged to the current year's operations as a change in accounting estimate. The change in
estimate is referred to as the claim loss reserve error and is measured as follows:
where t denotes the end of year values for the variables. The originally reported incurred losses
include settled and unsettled reported claims, IBNR and incurred loss adjustment expenses (paid
and estimated). Losses actually developed are adjusted for inflation. The adjustment is the
difference between the geometric average rate of inflation over the years losses are developed
and the geometric average rate of inflation in the five years prior to the year losses were
originally reported as incurred (Weiss, 1985)6. A positive (negative) loss reserve error indicates
overreserving (underreserving).
Petroni (1992) and Weiss (1985) used similar measures with the exception that they both
used 5 years development in comparison to the 2-year development used in this study7.
Kazenski, Feldhaus’’ and Schneider (1992) did a study on loss development horizons. They
found that that the precision of the reserve estimates converge to fully developed values during
the third development year. They also find evidence that 2 to 3 years of development is sufficient
to find statistically significant reserve errors if testing a sample of insurers. If individual insurers
Assets Admitted
100x DevelopedActually as LossesLosses Incurred Reported OriginallyError Reserve
Loss Claim
t
2ttt

Journal of Legal, Ethical and Regulatory Issues Volume 19, Number 2, 2016
99
are analyzed, a longer horizon may be needed. Because of those results and the fact that less data
would be required therefore keeping as many firms in the sample as possible, this study tests the
reserve error using a 2-year development horizon.
SAMPLE
The initial sample for this study consists of companies that demutualized during the
period of 1968-2004. The initial sample of 97 insurance companies was collected from Best's
Insurance Reports Property-Casualty (Best’s Reports). Best’s Reports are compiled by A.M.
Best Company, Inc. and contain qualitative as well as quantitative information about individual
companies. Annual statement information as well as a financial rating of individual companies is
included in this data source. Firms are eliminated from the sample if financial statement data and
loss reserve development data are not available. This data is used directly to measure the
financial health of the firm and the error in the claims loss reserves. The financial health of a
firm is determined from financial statement data available from either Best's Reports or the
insurer's Annual Statement. Loss reserve development data is obtainable from Schedule P of the
insurer's annual statement and includes a ten-year loss reserve development identifying actual
claims paid subsequent to the financial statement date when the original reserve estimate was
recorded (Exhibit A)8.
Forty-nine of the firms are eliminated from the initial sample for the following reasons:
1) no information was available for thirty-one insurers9, 2) five firms converted from a Lloyd's
company to a stock company10
, 3) two firms were placed in conservatorship after
demutualization11
, 4) eight firms primarily issue workers' compensation or medical malpractice
policies12
and, 5) three firms are 100% reinsured13
. The final sample consists of 48 companies
that demutualized during the years of 1982 through 1999. During this period, 16 firms were from
the first half of this period (1982-1990) with 32 firms from the last 9-years of the period (1991-
1999). None of the sample firms demutualized in either 1989 or 1990. Exhibit B identifies the 48
firms and dates of the demutualizations.
Table 1 reports the descriptive statistics for the 48 insurers. Panel A of the table gives the
statistics for a ten-year time period which includes the five years preceding demutualization, the
demutualization year and four years after demutualization. Panel B of Table 1 gives the statistics
for the five years prior to demutualization and Panel C gives the statistics for the year of
demutualization and the four years following the demutualization. For all data in Panel A, the
loss reserve mean (median) represents 31% (33%) of admitted assets and Panel B and Panel C
report means (medians) of 33% (33%) and 30% (31%) of admitted assets, respectively. Net
premium written increased in mean (median) by 25% (30%) between the years prior to
demutualization (Panel B) and the year of and after demutualization (Panel C). Surplus also
increased in mean (median) by 58% (69%) between the years. The increase in net premium
written and surplus would support the expansion and/or distress incentives for demutualization.
In addition, the descriptive statistics shown, combined with large standard deviations, suggest
that size varies significantly across demutualized insurers.

Journal of Legal, Ethical and Regulatory Issues Volume 19, Number 2, 2016
100
Table 1
DESCRIPTIVE STATISTICS FOR 48 PROPERTY-LIABILITY INSURERS
(In thousands)
Panel A: All Data a
Insurer
-Years
Median Mean Standard
Deviation
Minimum Maximum
NPW 449 8,619 26,404 43,941 -3,014 235,863
Admitted Assets 449 17,325 57,547 92,907 316 590,920
Loss Reserve 445 5,696 18,096 29,313 22 163,156
Surplus 447 7,139 17,870 24,965 141 127,528
Panel B: Data for years –1 to –5 b
Insurer
-Years
Median Mean Standard
Deviation
Minimum Maximum
NPW 243 7,862 23,733 40,700 -1,663 227,073
Admitted Assets 243 14,048 47,468 76,480 316 436,793
Loss Reserve 237 4,679 15,654 26,401 26 154,504
Surplus 241 5,046 14,083 19,535 141 114,347
Panel C: Data for years 0 to 4 c
Insurer
-Years
Median Mean Standard
Deviation
Minimum Maximum
NPW 206 10,248 29,554 47,388 -3,014 235,863
Admitted Assets 206 22,413 69,437 108,148 2,931 590,920
Loss Reserve 208 6,879 20,879 32,152 22 163,156
Surplus
206 8,504 22,300 29,539 557 127,528
a 10 years include 5 years prior to demutualization through 4 years after demutualization b Years include 5 years prior to demutualization to the year prior to demutualization c Years include year of demutualization to four years after demutualization
NPW: Net premium written
MODEL
I test whether a claim loss reserve error exists as a result of management’s incentive to
adjust policyholder surplus through the claim loss reserves. The regression results are based on
pooled cross-sectional time series data with controls for various insurer and exogenous economic
factors.

Journal of Legal, Ethical and Regulatory Issues Volume 19, Number 2, 2016
101
The model used to test the hypotheses is expressed as follows:
ERROR i t = t+1DISi t +2TAX i t+3DM i t+4DM*DIS i t+5 DM*MGMT i t + i t (1)
where
i = insurer index
t = year index
ERROR = reserve estimation error scaled by total admitted assets in year t;
DIS3 = dummy variable assigned a value of 1 if an insurer is determined to
be financially distressed and 0 otherwise or
DIS4: = Best rating assignment;
TAX = dummy variable, taking on the value of one in year t if insurer i incurred
taxes and 0 otherwise;
DM = dummy variable assigned value of 1 if year before demutualization and 0
otherwise;
MGMT = dummy variable assigned a value of 1 if change in management resulted
from the demutualization and 0 otherwise;
= error term.
Table 2 reports the descriptive statistics for all variables in the regression. The median
(mean) for the dependent variable, ERROR, is 2.525 (2.162). The positive numbers indicate that
overall, the firms’ claim loss reserves are overstated.
The paper’s focus is on the year prior to demutualization and management incentives to
manage surplus through the estimated loss reserves. I use the control variable DM to determine if
the demutualization event had an effect on the claim reserve error in the year preceding
demutualization. In the year prior to demutualization, the variable is assigned a 1; otherwise a 0
is assigned. A positive relationship to claim reserve error is expected with the coefficient
predicted to be positive when reserves are overstated.
The variable MGMT controls for the management incentive effects of managing surplus
through the estimated loss reserves. Best’s Reports for years prior to and after demutualization
were reviewed to determine if a change in management occurred. If there is no change in
management, the variable is assigned a 0; otherwise a 1 is assigned for a change in management.
The mean of the MGMT variable is 0.182, indicating that approximately one-fifth of the firms
changed management with demutualization.
The regression controls for financially distressed firms. Financially distressed firms have
incentives to understate reserves to avoid regulatory intervention. The regression is tested
separately using two different variables with both variables developed from the Best Rating
system14
. Best classifies the overall rating of A++ through B+ as secure ratings and the ratings of
B through F as vulnerable. Best uses NR for not rated. At times, Best will assign a FPR but not
an overall rating. Best classifies FPR’s of 5 through 9 as secure and FPR’s of 1 through 4 as
vulnerable. DIS3 is a dummy variable of 0 if rating is a secure rating and a variable of 1 if a
vulnerable rating15
. From Table 2, the mean of DIS3 is 0.269, suggesting that approximately one-
quarter of the insurer-years is considered distressed. Since DIS3 involves some subjectivity,
DIS4 is an alternate variable used and is the same variable that Petroni (1992) used in her paper
to test the adequacy of ratios used in determining distress. Financial ratings of A or A+ (FPR 8 or
9) are assigned a 1, B+ or A- (FPR 5-7) a 2, B- or B (FPR 4) as 3, C+ (FPR 3) a 4, and C or
lower (FPR 1 or 2) a 5. Non-rated insurers are assigned a 616
. From Table 2, the mean of DIS4 is
2.702, suggesting an average of B ratings and therefore vulnerable. Since non-rated insurers are
assigned a 6, DIS4 may be biased towards distressed. If distressed firms have more incentive to

Journal of Legal, Ethical and Regulatory Issues Volume 19, Number 2, 2016
102
understate and not overstate reserves, the coefficient would be positively correlated to a negative
claim loss error (Petroni, 1992). Since the claim reserve error reported in this study is positive,
indicating overreserving, the coefficient should be negatively correlated. A negative coefficient
is predicted.
I interact the DM variable with both MGMT and DIS to determine if MGMT and DIS are
different in the year prior to demutualization, in comparison to other years, as a result of the
demutualization. The coefficient on DM*MGMT will be negative since an overreserve
(underreserve) of losses is a result of no change (change) in management indicating a negative
relationship. The DM*DIS variable will be negatively correlated (coefficient negative) to the
claim loss reserve error if the error is a result of overstatement.
The model also controls for taxes and the effects of tax rates on the estimated loss
reserves17
. Scholes et al. (1990) argue that firms with a net operating loss (NOL) carryforward
are expected to have low tax rates and firms with no NOL carryforward high tax rates. The
insurance industry has a similar structure18
. Since the tax status of companies is not disclosed in
Best’s Reports but taxes incurred or refunds received/receivable are identified in the reports,
companies not currently paying taxes or receiving a refund on prior-year taxes are assigned a
variable of 0. Companies indicating incurred taxes for the year are assigned a variable of 1. The
mean is 0.481, indicating that slightly more insurer years are without taxes. Since overreserving
the loss reserve results in less income and underreserving produces more taxable income, the tax
variable should be negatively correlated to the reserve error. Since the average claim loss error
identifies overstatement, it is predicted that the coefficient is negative.
Table 2
DESCRIPTIVE STATISTICS OF VARIABLES FOR THE 48 PROPERTY-LIABILITY INSURERS
USED IN THE REGRESSION ANALYSIS
Variable Insurer-
Years
Median Mean Standard
Deviation
ERROR 377 2.525 2.162 5.104
DIS3 450 0 0.269 0.444
DIS4 450 2 2.702 1.905
MGMT 455 0 0.182 0.387
TAX 455 0 0.481 0.500
DM 455 0 0.107 0.310
DM*DIS3 450 0 0.038 0.191
DM*DIS4 450 0 0.356 1.221
DM*MGMT
455 0 0.018 0.132
ERROR = reserve estimation error scaled by total admitted assets in year t;
DIS = DIS3: dummy variable assigned a value of 1 if an insurer is determined to be financially distressed and 0 otherwise
or DIS4: Best rating assignment;
MGMT = dummy variable assigned a value of 1 if change in management resulted from the demutualization and 0
otherwise;
TAX = dummy variable, taking on the value of one in year t if insurer i incurred taxes and 0 otherwise;
DM = dummy variable assigned value of 1 if year before demutualization and 0 otherwise;

Journal of Legal, Ethical and Regulatory Issues Volume 19, Number 2, 2016
103
RESULTS
Univariate Analysis
I first examine the claim loss reserve error in the 5 years prior to demutualization. To
examine the claim loss reserve error, I calculate averages for each firm of various groupings of
years prior to demutualization and compare the averages to the year(s) prior to demutualization
for each firm. A paired comparison t-test is applied to the difference. Results for comparison of
three different groupings of the 5 years are reported in Table 3. The analysis of the first group
consisted of 5 years prior through 2 years prior to demutualization compared against the year
prior to demutualization. Group two compared the 5 years to 3 years prior to demutualization
against the year prior to demutualization. The last group compared the 5 years to 3 years prior to
demutualization against the prior 2 and 1 years.
Table 3 reports the results of the univariate analysis. The means for all three groups and
the median for the first two groups indicate overreserving rather than underreserving. Even
though the univariate results indicate no statistical significance, the results indicate that when the
year prior to demutualization is separated from the other prior years, a difference in the reserving
pattern appears. The mean and median for the first two groups are similar but the mean and
median of the third group differ from the mean and median of the first two groups. If the year
prior to demutualization is grouped with the second year prior to demutualization, not much
difference exists between those two years and the 5-years through 3-years preceding
demutualization19
. Statistical insignificance may be a result of other confounding factors that are
not controlled for in the univariate analysis. The sensitivity analysis section will test the claim
loss reserve error in the years preceding demutualization in a multiple regression setting.
Table 3
UNIVARIATE ANALYSIS OF CLAIM LOSS RESERVE ERROR FOR 48 INSURERS
2-YEAR DEVELOPMENT OF CLAIM LOSS RESERVE ERROR
Group Mean t-test
p-value
Median Wilcoxon
p-value
1. Year = -1
Year = -5 to -2
0.823 0.323 0.236 0.296
2. Year = -1
Year = -5 to -3
0.802 0.417 0.217 0.374
3. Year = -1, -2
Year = -5 to -3
0.300 0.638 -0.133 0.578
Regression Results
Table 4 reports the results of the multiple regression estimated over the ten-year period
for each of the 48 insurers resulting in 375 insurer-years. Panel A of Table 4 reports the
regression results with the distress variable DIS3. Since ERROR is positive, it is predicted that
Assets Admitted
100x DevelopedActually as LossesLosses Incurred Reported Originally
Error Reserve
Loss Claim
t
2tt
t

Journal of Legal, Ethical and Regulatory Issues Volume 19, Number 2, 2016
104
the DIS3, TAX, DM*DIS3, and DM*MGMT coefficients are negative and the DM coefficient
positive. All variable coefficients are as predicted.
The DM*MGMT has a negative coefficient of -5.163 that is statistically significant at less
than the 0.01 level. The DM coefficient of 1.695 is significant at the 0.10 level. The DIS3, TAX,
and DM*DIS3 coefficients are as predicted but are all insignificant. The insignificance of the
distress variables and interactive distress variables may be a result of approximately only one-
quarter of the firms being classified as distressed. I will test the sensitivity of the regression to
this variable in the sensitivity analysis section.
The results support the first hypothesis in that management will overstate the estimates of
claim loss reserves. It is hypothesized that managers with significant ownership interest will have
the incentive to overstate the estimated claim loss reserve as a means to decrease surplus. The
lower level of significance of the DM variable suggests that the management of claim loss
reserves is not only impacted by the intent to demutualize. The results do suggest that the
management process impacts the demutualization process. The results for the variable
DM*MGMT imply that, in comparison to other non-demutualization years, more management
incentive exists to overstate reserves in the year prior to demutualization.
Panel B of Table 4 reports the regression results with the distress variable, DIS4. The
results report the predicted negative coefficient for DM*MGMT (–4.383) and is statistically
significant at the 0.05 level. Similar to the first regression, since the ERROR is positive, it is
predicted that DIS4, TAX, and DM*DIS4 coefficients are negative and the DM coefficient
positive. All the coefficients are as predicted but only the DIS4 coefficient is significantly
negative at the 0.10 level. Achieving this level of significance for the DIS4 in this regression but
not for DIS3 in the first regression must be interpreted with caution. Since non-rated insurers are
arbitrarily assigned a 6, DIS4 may be biased towards distress.
Similar to the regression with the DIS3 distress variable, the first hypothesis is supported.
The difference between the two regressions is that the insignificance of the DM variable in the
second regression suggests that the management of claim loss reserves is not directly impacted
by the intent to demutualize. Similarities in both regressions include the suggestion that
management incentives do impact the demutualization process.
Sensitivity Analysis
In the univariate analysis, there exists some significance and therefore an indication of
changing reserve patterns between the year preceding demutualization and the other years prior
to demutualization. To test for the possibility of other factors influencing the results, I ran the full
regression but only for the years preceding demutualization. Table 5 reports the results of the
regression estimated over the 5-year period for the 48 insurers (234 insurer-years). The
coefficients of all variables are as predicted. The regression, with either distress variable, results
in significant DM, DM*MGMT and TAX coefficients.
Similar to the full regression with all insurer-years, the second hypothesis is supported.
The difference between the results of all years and the pre-demutualization years is that with
either DIS variable, the significance of the DM variable suggests that the management of claim
loss reserves is directly impacted by the intent to demutualize. This may be a result of truncating
the data. The significance of the DM*MGMT variable remains consistent throughout all
regressions and supports the hypothesis that more management incentive exists to overstate
reserves in the year prior to demutualization.

Journal of Legal, Ethical and Regulatory Issues Volume 19, Number 2, 2016
105
Table 4
REGRESSION RESULTS FOR 48 INSURERS
( 375 Insurer-Years)
ERROR i t = t + 1DISi t + 2TAX i t + 3DM i t +4DM*DIS i t + 5 DM*MGMT i t + i t,
Panel A: Two-Year Development with DIS (N=375)
Dependent
Variablea
Independent
Variable
Coefficient Standard Error t-statistic
ERROR
Adjusted R2 = 0.011 DIS3 -0.073 0.638 -0.12
TAX -0.422 0.543 -0.78
DM 1.695 1.006 1.69*
DM*DIS3 -1.441 1.669 -0.86
DM*MGMT
-5.163 1.989 -2.60***
Panel B: Two-Year Development with DIS4 (N=375)
Dependent
Variable a
Independent
Variable a
Coefficient Standard Error t-statistic
ERROR
Adjusted R2 = 0.022 DIS4 -0.279 0.151 -1.85*
TAX -0.688 0.546 -1.26
DM 2.012 1.469 1.37
DM*DIS4 -0.253 0.410 -0.62
DM*MGMT
-4.383 2.110 -2.08**
***(**/*) Statistical significance at the 0.01 (0.05/0.10) level
a Variables:
ERROR = reserve estimation error scaled by total admitted assets in year t;
DIS = DIS3: dummy variable assigned a value of 1 if an insurer is determined to be financially distressed and 0
otherwise or DIS4: Best rating assignment;
TAX = dummy variable, taking on the value of one in year t if insurer i incurred taxes and 0 otherwise;
DM = dummy variable assigned value of 1 if year before demutualization and 0 otherwise;
MGMT = dummy variable assigned a value of 1 if change in management resulted from the demutualization and otherwise.
In the pre-period, the results of the two distress variables, DIS3 and DIS4, are
insignificant, indicating less variation in distress across firms. The insignificance of the distress
variables and interactive distress variables may be a result of the subjectivity used in assigning a
distress variable and/or approximately only one-third of the firms being classified as distressed.
To test the sensitivity of this variable to the regression, I ran the regressions for all years without
the distress variable. Table 6 reports the results of this regression. The results report similar
coefficients and significance. The coefficient of -5.418 for DM*MGMT is as predicted and is
significant at less than the 0.05 level. The negative TAX coefficient of -0.366 and the DM
coefficient of 1.228 are as predicted but statistically insignificant. Results are similar to the full
regression and therefore continue to support the second hypothesis20
.

Journal of Legal, Ethical and Regulatory Issues Volume 19, Number 2, 2016
106
Table 5
REGRESSION RESULTS FOR 48 INSURERS YEARS PRIOR TO DEMUTUALIZATION
(234 Insurer-Years)
ERROR i t = t + 1DISi t + 2TAX i t + 3DM i t +4DM*DIS i t + 5 DM*MGMT i t + i t,
Panel A: Two-Year Development with DIS3 (N=234)
Dependent
Variable
Independent
Variable
Coefficient Standard Error t-statistic
ERROR
Adjusted R2 = 0.019 DIS3 -0.213 0.945 -0.23
TAX -1.530 0.822 -1.62*
DM 2.252 1.245 1.81*
DM*DIS3 -1.514 2.041 -0.74
DM*MGMT -5.284 2.344 -2.25**
Panel B: Two-Year Development with DIS4 (N=234)
Dependent
Variable a
Independent
Variable a
Coefficient Standard Error t-statistic
ERROR
Adjusted R2 = 0.034 DIS4 -0.407 0.231 -1.76*
TAX -1.671 0.817 -2.04**
DM 2.227 1.815 1.23
DDIS4 --0.166 0.503 -0.33
DMGMT
-4.472 2.481 -1.80*
***(**/*) Statistical significance at the 0.01 (0.05/0.10) level.
a Variables:
ERROR = reserve estimation error scaled by total admitted assets in year t;
DIS = DIS3: dummy variable assigned a value of 1 if an insurer is determined to be financially distressed and 0
otherwise or DIS4: Best rating assignment;
TAX = dummy variable, taking on the value of one in year t if insurer i incurred taxes and 0 otherwise;
DM = dummy variable assigned value of 1 if year before demutualization and 0 otherwise;
MGMT = dummy variable assigned a value of 1 if change in management resulted from the demutualization and 0
otherwise.
CONCLUSION
This study examined whether managers of mutual property-liability insurance companies
use their discretion in estimating the claim loss reserve accrual in the year preceding
demutualization of the company. Insurance companies experiencing growth and/or financial
distress have a need for additional surplus. The paper examines one of two methods that
companies have in obtaining additional surplus; demutualization. The insurance industry and the
demutualization process provide a specialized setting to examine earnings management. Since
the valuation process is a key component in the conversion process, opportunity for management
discretion in determining the reserve estimate is established. Because of the more accurate and
direct tests of the largest accrual on the balance sheet, claim loss reserves, the insurance industry
also provides a richer environment for examining earnings management. Therefore, the paper not
only provides a strong motivation for management incentives, but also grants the opportunity to
Journal of Legal, Ethical and Regulatory Issues Volume 19, Number 2, 2016
107
improve the measurement of earnings management since actual losses are compared to estimated
losses.
Table 6
REGRESSION RESULTS FOR 48 INSURERS
(375 Insurer-Years)
ERROR i t = t + 1TAX i t + 2DM i t + 3 DM*MGMT i t + i t,
Two-Year Development (N=375)
Dependent
Variable
Independent
Variable
Coefficient Standard Error t-statistic
ERROR
Adjusted R2 = 0.014 TAX -0.366 0.524 -0.70
DM 1.228 0.850 1.45
DM*MGMT
-5.418 1.966 -2.76**
***(**/*) Statistical significance at the 0.01 (0.05/0.10) level
a Variables:
ERROR = reserve estimation error scaled by total admitted assets in year t;
TAX = dummy variable, taking on the value of one in year t if insurer i incurred taxes and 0 otherwise;
DM = dummy variable assigned value of 1 if year before demutualization and 0 otherwise;
MGMT = dummy variable assigned a value of 1 if change in management resulted from the demutualization and 0 otherwise.
With companies changing from mutual companies to stock companies, I predict that
management will increase their discretion in estimating reserves to adjust surplus in alignment
with their incentives. It was predicted that if management has a limited role in the newly formed
company, the incentive of management would be to understate reserves as a means to increase
surplus, which would result in increased firm value for the policyholders. If managers have a
significant interest in the newly formed company, their incentive would be to overstate reserves,
to decrease surplus, resulting in lower firm value and lower payoff to policyholders. This would
enable mangers to buy the stock at a lower price.
The regression results support the hypothesis of overstatement of reserves. No evidence
was found to support the understatement of reserves. The results indicate that, in comparison to
other non-demutualization years, more management incentive exists to overstate reserves in the
year prior to demutualization. The demutualization transaction itself has limited impact on
surplus management.
Better access to capital for growth and/or financial distress is one reason for
demutualization. The descriptive statistics identify an increase in net premium written and
surplus as a result of the transaction, indicating expansion, which supports prior research
(Mayers & Smith, 1996). The regression results do not support poor financial condition as a
factor in demutualization.
The results of this study imply that a change in organizational structure does give
management an opportunity to manage earnings. Limitations of the study include small sample
size and the use of a proxy for some distress classifications. It is possible that stronger results are
not obtained because of the regulatory environment in which the change in organizational
structure operates. Future research could study the impact of the regulatory environment on the
insurer’s transactions.
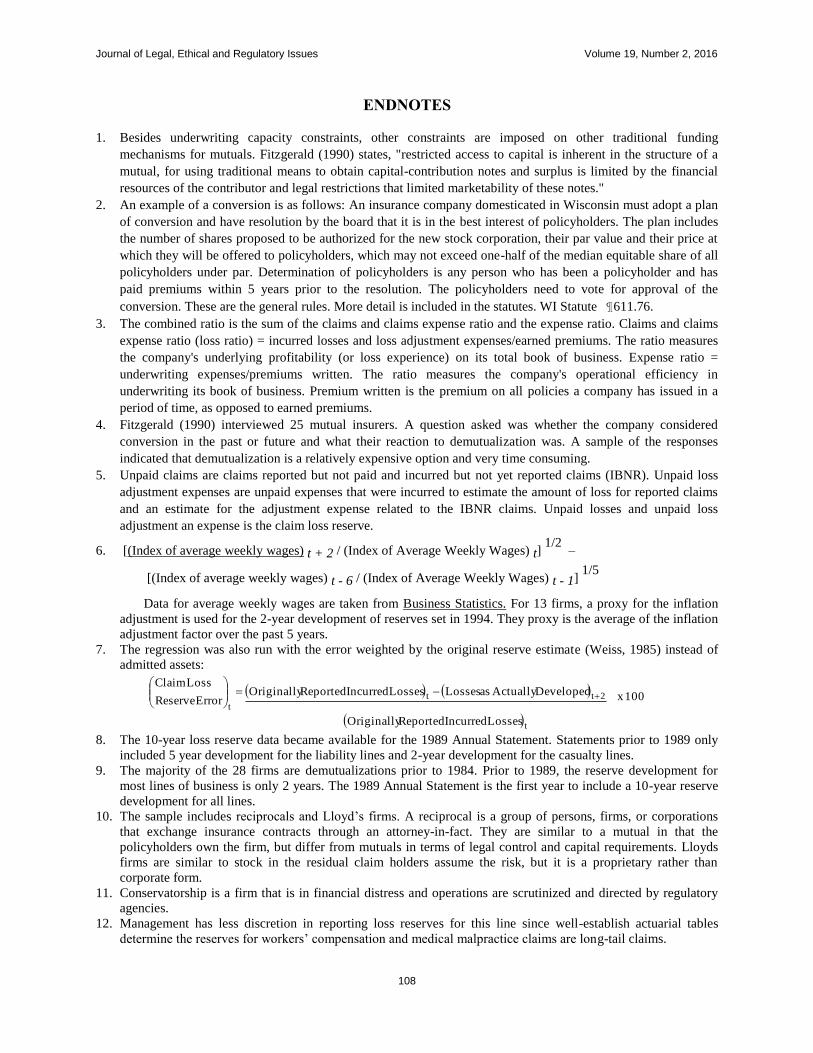
Journal of Legal, Ethical and Regulatory Issues Volume 19, Number 2, 2016
108
ENDNOTES
1. Besides underwriting capacity constraints, other constraints are imposed on other traditional funding
mechanisms for mutuals. Fitzgerald (1990) states, "restricted access to capital is inherent in the structure of a
mutual, for using traditional means to obtain capital-contribution notes and surplus is limited by the financial
resources of the contributor and legal restrictions that limited marketability of these notes." 2. An example of a conversion is as follows: An insurance company domesticated in Wisconsin must adopt a plan
of conversion and have resolution by the board that it is in the best interest of policyholders. The plan includes
the number of shares proposed to be authorized for the new stock corporation, their par value and their price at
which they will be offered to policyholders, which may not exceed one-half of the median equitable share of all
policyholders under par. Determination of policyholders is any person who has been a policyholder and has
paid premiums within 5 years prior to the resolution. The policyholders need to vote for approval of the
conversion. These are the general rules. More detail is included in the statutes. WI Statute ¶611.76.
3. The combined ratio is the sum of the claims and claims expense ratio and the expense ratio. Claims and claims
expense ratio (loss ratio) = incurred losses and loss adjustment expenses/earned premiums. The ratio measures
the company's underlying profitability (or loss experience) on its total book of business. Expense ratio =
underwriting expenses/premiums written. The ratio measures the company's operational efficiency in
underwriting its book of business. Premium written is the premium on all policies a company has issued in a
period of time, as opposed to earned premiums.
4. Fitzgerald (1990) interviewed 25 mutual insurers. A question asked was whether the company considered
conversion in the past or future and what their reaction to demutualization was. A sample of the responses
indicated that demutualization is a relatively expensive option and very time consuming.
5. Unpaid claims are claims reported but not paid and incurred but not yet reported claims (IBNR). Unpaid loss
adjustment expenses are unpaid expenses that were incurred to estimate the amount of loss for reported claims
and an estimate for the adjustment expense related to the IBNR claims. Unpaid losses and unpaid loss
adjustment an expense is the claim loss reserve.
6. [(Index of average weekly wages) t + 2 / (Index of Average Weekly Wages) t] 1/2
–
[(Index of average weekly wages) t - 6 / (Index of Average Weekly Wages) t - 1] 1/5
Data for average weekly wages are taken from Business Statistics. For 13 firms, a proxy for the inflation
adjustment is used for the 2-year development of reserves set in 1994. They proxy is the average of the inflation
adjustment factor over the past 5 years.
7. The regression was also run with the error weighted by the original reserve estimate (Weiss, 1985) instead of
admitted assets:
8. The 10-year loss reserve data became available for the 1989 Annual Statement. Statements prior to 1989 only
included 5 year development for the liability lines and 2-year development for the casualty lines.
9. The majority of the 28 firms are demutualizations prior to 1984. Prior to 1989, the reserve development for
most lines of business is only 2 years. The 1989 Annual Statement is the first year to include a 10-year reserve
development for all lines.
10. The sample includes reciprocals and Lloyd’s firms. A reciprocal is a group of persons, firms, or corporations
that exchange insurance contracts through an attorney-in-fact. They are similar to a mutual in that the
policyholders own the firm, but differ from mutuals in terms of legal control and capital requirements. Lloyds
firms are similar to stock in the residual claim holders assume the risk, but it is a proprietary rather than
corporate form.
11. Conservatorship is a firm that is in financial distress and operations are scrutinized and directed by regulatory
agencies.
12. Management has less discretion in reporting loss reserves for this line since well-establish actuarial tables
determine the reserves for workers’ compensation and medical malpractice claims are long-tail claims.
t
2tt
t
Losses Incurred Reported Originally
100x DevelopedActually as LossesLosses Incurred Reported OriginallyError Reserve
Loss Claim

Journal of Legal, Ethical and Regulatory Issues Volume 19, Number 2, 2016
109
13. Reinsurance is the transaction in which a reinsurer (the assuming party) assumes all (100%) or part of a risk
undertaken originally by another insurer (the ceding party). The ceding party pays the reinsurer a premium for
this transaction. The legal rights of the insured are not affected by this transaction. The insurance company
issuing the policy remains liable to the insured for payment of policy benefits.
14. A study comparing the Best’s Ratings and selected financial ratios (Ambrose and Seward, 1988) for predicting
insolvency concluded the two methods are statistically equivalent. (Petroni, 1992) used a subset of the financial
ratios from the (Ambrose and Seward, 1988) paper. The ratios consist of eight of the eleven ratios that
regulators use to evaluate financial condition and adequacy of claim loss reserves. The ratios are industry-
specific and are part of the Insurance Regulatory Information System (IRIS). This paper will use the Best’s
overall rating or financial performance rating (FPR)
15. Many firms were not rated during the year of demutualization and other years for various reasons. For those
years with no rating, the most recent rating prior to those years was used as a proxy for the non-rated period.
16. Assigning a 6 for non-rated is subjective and is unclear if non-rating is related to lower financial strength
relative to other ratings. Ambrose and Seward (1988) do find an increase proportion of insurers are not rated
prior to insolvency.
17. In general, demutualization is a tax-free transaction (per conversation with a partner of an accounting firm).
There are special circumstances that may cause the demutualization to be taxable. Since the data does not
indicate whether the transaction is tax-free or taxable, I make the assumption that the transactions are tax-free.
18. Basically, insurance companies are taxed as ordinary corporations. The differences include 1) modification of
tax law for insurance companies to allow expense recognition that is consistent SAP which results in a
mismatching of revenue and expenses and reduced taxable income in a period of expansion and 2) discounting
of claim loss reserves for tax purposes (present-value basis).
19. The tests were also run with the claim loss reserve error scaled by original reserve. The trend in the claim loss
reserve error for groups 1 and 2 in comparison to group 3 are similar to the tests when scaled by admitted assets.
20. The error term is tested on all regressions for heteroscedasticity and autocorrelation. Heteroscedasticity is tested
using the White (1980) method. The specification test does not reject the null hypothesis of homoscedastic
errors or independence of the error terms and explanatory variable (p=0.34). The Durbin-Watson test for
autocorrelation indicates that some autocorrelation does exist ( = 0.199).
REFERENCES
Ambrose, J.M. & J.A. Seward (1988). Best's ratings, financial ratios and prior probabilities in insolvency prediction.
Journal of Risk and Insurance, 55, 229-244.
Anderson, D.R. (1971). Effects of under and over evaluations in loss reserves. Journal of Risk and Insurance, 38,
585-600.
Best's Insurance Reports Property-Casualty Edition, Annual (A.M. Best, Oldwick, NJ).
Cagle, J.A., R.L. Lippert, & W.T. Moore (1996). Demutualization in the property-liability insurance industry.
Journal of Insurance Regulation, 14(3), 343-369.
DeAngelo, L. (1986). Accounting numbers as market valuation substitutes: A study of management buyouts of
public stockholders. The Accounting Review, 61(3), 400-420.
Fama, E. F. & M. C. Jensen (1983). Agency problems and residual claims. Journal of Law and Economics, 26, 327-
349.
Fitzgerald, J.F., (1990). Demutualization case studies: a 20-year history. Journal of Insurance Regulation, 9(2), 287-
310.
Heller, R.M. (1986). Demutualization: The economics won’t go away. Journal of Insurance Regulation, 5, 38-58.
Kazenski, P.M., W.R. Feldhaus, & H.C. Schneider (1992). Empirical evidence for alternative loss development
horizons and the measurement of reserve error. Journal of Risk and Insurance, 59, 668-681.
Mayers, D. & C. W. Smith, Jr. (2004). Incentives for managing accounting information: Property-liability stock-
charter conversions. Journal of Risk and Insurance, 71, 213-251.
Mayers, D. & C. W. Smith, Jr. (1988). Ownership structure across lines of property-casualty insurance. Journal of
Law and Economics, 31, 351-378.
McNichols, M. & G. P. Wilson (1988). Evidence of ‘earnings management’ from the provision for bad debts.
Journal of Accounting Research, 26, 1-31.

Journal of Legal, Ethical and Regulatory Issues Volume 19, Number 2, 2016
110
Perry, S. E. (1990). Accounting information in going-private transactions. Unpublished doctoral dissertation,
University of Wisconsin-Madison.
Perry, S. E. & T. H. Williams (1994). Earnings management preceding management buyout offers. Journal of
Accounting and Economics, 18, 157-179.
Petroni, K.R. (1992). Optimistic reporting in the property-casualty insurance industry. Journal of Accounting and
Economics, 15, 485-508.
Schipper, K., (1989). Commentary on Earnings Management. Accounting Horizons, 3(4), 91-102.
Scholes, M., P. Wilson & M. Wolfson (1990). Tax planning, regulatory capital planning, and financial reporting
strategy for commercial banks. Review of Financial Studies, 3, 625-650.
Tillman, H.T. (1985). Profiles in conversion. Best’s Review, May, 22-26, 104-107.
Troxel, T.E., & G.E. Bouchie (1995). Property-Liability Insurance Accounting and Finance (Fourth ed).
Pennsylvania: American Institute for CPCU.
Weiss, Mary (1985). A multivariate analysis of loss reserving estimates in property-liability insurers. Journal of Risk
and Insurance, 52, 199-221.
Exhibit A
ACCOUNTING EFFECTS OF SELECTED LOSS TRANSACTIONS
The following table illustrates the recording of a claim with an underestimation of the loss. Transactions
two and four would be affected in the opposite direction if the initial reserve was overestimated.
The first transaction is to record the claim liability and incurred expense as a result of policyholder’s
submitting claims for their losses. Transaction two records an increase to the liability and incurred losses. The
original loss recorded in transaction one was underestimated.
Partial payment is made to policyholder on reported loss in transaction three. At the time of final
settlement, the reserve is closed with any difference between the remaining reserve and final payment adjusted to the
Incurred Losses and Policyholder’s Surplus accounts.
Transaction
Loss Reserve
effect a
Incurred
Losses effect a
Underwriting
Gain effect a
Policyholder's
Surplus effecta
1. To record new loss claim-19x6
Increase
Increase
Decrease
Decrease
2. To increase the estimate
of total cost of the loss-19x6b
Increase
Increase
Decrease
Decrease
3. To make partial payment on
loss claim-19x7
Decrease
None
None
None
4. To make final payment at
amount greater than reserve-
19x7b
Decrease to
zero
Increase
Decrease
Decrease (deficiency
on reserve)
a
Loss Reserve, Incurred Losses, Underwriting Gain, and Policyholder's Surplus under Statutory Accounting
Principles (SAP) is similar to Current Liabilities, Cost of Goods Sold, Gross Profit, and Stockholders' Equity
under GAAP. b
To increase the estimate of total cost of the loss is representative of initially underreserving the loss. Therefore, the
initial decrease to Policyholders' Surplus is understated.
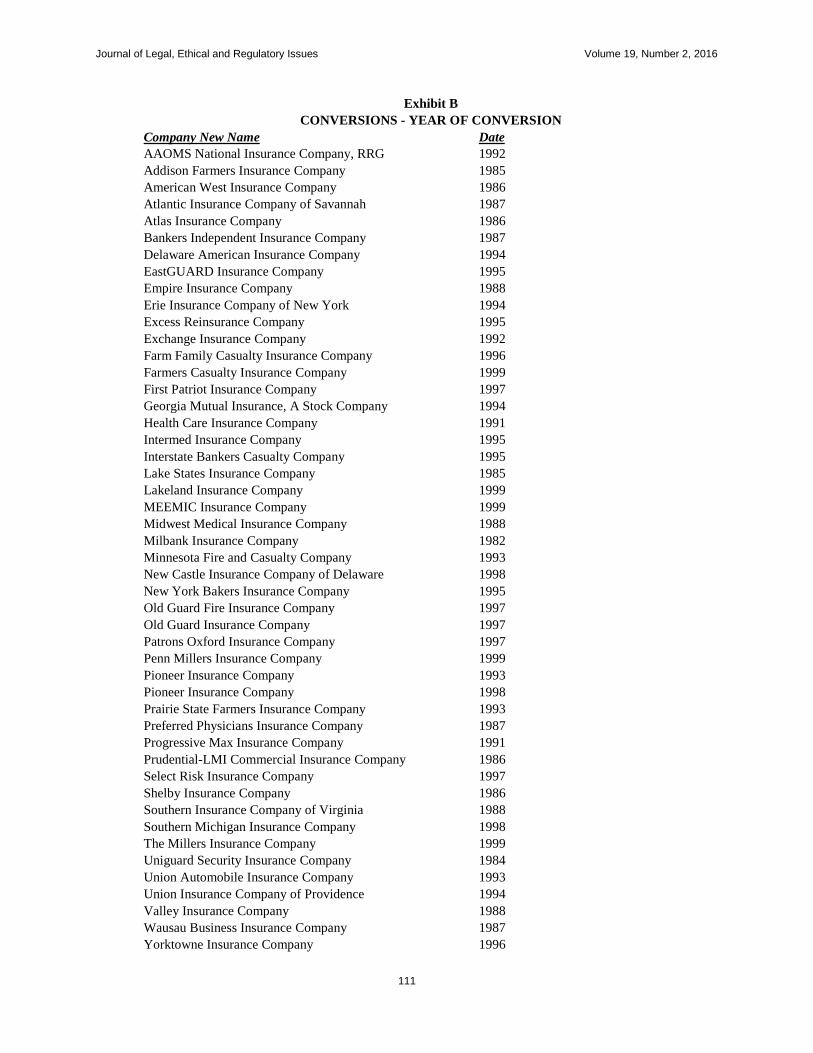
Journal of Legal, Ethical and Regulatory Issues Volume 19, Number 2, 2016
111
Exhibit B
CONVERSIONS - YEAR OF CONVERSION
Company New Name Date
AAOMS National Insurance Company, RRG 1992
Addison Farmers Insurance Company 1985
American West Insurance Company 1986
Atlantic Insurance Company of Savannah 1987
Atlas Insurance Company 1986
Bankers Independent Insurance Company 1987
Delaware American Insurance Company 1994
EastGUARD Insurance Company 1995
Empire Insurance Company 1988
Erie Insurance Company of New York 1994
Excess Reinsurance Company 1995
Exchange Insurance Company 1992
Farm Family Casualty Insurance Company 1996
Farmers Casualty Insurance Company 1999
First Patriot Insurance Company 1997
Georgia Mutual Insurance, A Stock Company 1994
Health Care Insurance Company 1991
Intermed Insurance Company 1995
Interstate Bankers Casualty Company 1995
Lake States Insurance Company 1985
Lakeland Insurance Company 1999
MEEMIC Insurance Company 1999
Midwest Medical Insurance Company 1988
Milbank Insurance Company 1982
Minnesota Fire and Casualty Company 1993
New Castle Insurance Company of Delaware 1998
New York Bakers Insurance Company 1995
Old Guard Fire Insurance Company 1997
Old Guard Insurance Company 1997
Patrons Oxford Insurance Company 1997
Penn Millers Insurance Company 1999
Pioneer Insurance Company 1993
Pioneer Insurance Company 1998
Prairie State Farmers Insurance Company 1993
Preferred Physicians Insurance Company 1987
Progressive Max Insurance Company 1991
Prudential-LMI Commercial Insurance Company 1986
Select Risk Insurance Company 1997
Shelby Insurance Company 1986
Southern Insurance Company of Virginia 1988
Southern Michigan Insurance Company 1998
The Millers Insurance Company 1999
Uniguard Security Insurance Company 1984
Union Automobile Insurance Company 1993
Union Insurance Company of Providence 1994
Valley Insurance Company 1988
Wausau Business Insurance Company 1987
Yorktowne Insurance Company 1996

Journal of Legal, Ethical and Regulatory Issues Volume 19, Number 2, 2016
112
USING PERSONALITY TESTING AS PART OF THE
EMPLOYEE SELECTION PROCESS: LEGAL AND
POLICY ISSUES FOR EMPLOYERS
Gerald E. Calvasina, Southern Utah University
Richard V. Calvasina, University of West Florida
ABSTRACT
An advantage often cited in the literature regarding internal hiring or promotion is that
current employees are known commodities regarding their “fit” with the organization’s culture
and work environment (Krell, 2015). The easily acquired intimate knowledge of current employees
creates a strong incentive to emphasize promoting from within when the need arises. As
organizations grow and labor markets become tighter, the lack of available promotable employees
may dictate that the employer look to external job markets to fill positions. Assessment as to
whether an external candidate’s personality will be a good fit for the organization is often
described as a key factor that influences the effectiveness of those individuals and also one of the
most difficult elements to assess in the selection process (Krell, 2015). In recent years,
technological advances in the nature of selection systems has enabled employers to increase their
use of online technology to screen job applicants’ personalities as to their potential fit with an
organization’s culture and work environment, and this increased use has not gone unnoticed by
US Equal Employment Opportunity Commission regulators (EEOC) (Lundquist, 2015). The
purpose of this paper is to examine legal and policy issues for employers when utilizing technology
to assess an applicant's personality as part of the employers screening of external applicants for
employment and policy and practice suggestions for employers to facilitate compliance with
EEOC guidelines.
INTRODUCTION
An advantage often cited in the literature regarding internal hiring or promotion is that
current employees are known commodities regarding their “fit” with the organization’s culture and
work environment (Krell, 2015). The easily acquired intimate knowledge of current employees
creates a strong incentive to emphasize promoting from within when the need arises. As
organizations grow and labor markets become tighter, the lack of available promotable employees
may dictate that the employer look to external job markets to fill positions. Assessment as to
whether an external candidate’s personality will be a good fit for the organization is often described
as a key factor that influences the effectiveness of those individuals and also one of the most
difficult elements to assess in the selection process (Krell, 2015). In recent years, technological
advances in the nature of selection systems has enabled employers to increase their use of online
technology to screen job applicants’ personalities as to their potential fit with an organization’s
culture and work environment, and this increased use has not gone unnoticed by US Equal
Employment Opportunity Commission regulators (EEOC) (Lundquist, 2015). The purpose of
this paper is to examine legal and policy issues for employers when utilizing technology to assess
an applicant's personality as part of the employers screening of external applicants for
employment, and policy and practice suggestions for employers to facilitate compliance with
EEOC guidelines.

Journal of Legal, Ethical and Regulatory Issues Volume 19, Number 2, 2016
113
In her April 15, 2015 testimony before the EEOC, Dr. Kathleen K. Lundqist, of APT
Metrics, Inc. testified that "candidates for jobs today are increasingly being screened using online
technology” (Lundquist, 2015). In the written report of Lundquist’s testimony, she cited a 2011
global assessment report by Fallaw and Kantrowitz (2011) that reported that employers are
utilizing a variety of online technology that includes
Online applications (some of which contain scored questions the answers to which may disqualify the
applicant from further consideration) ; biodata or personality tests administered online to thousands of candidates;
responses to "interview" questions which may be videotaped and uploaded online, and even online background checks.
In a survey of domestic and international organizations, 81 percent of the respondents indicated that they were utilizing
online assessments, and 83 percent indicated that they allow applicants to complete the assessments remotely in
unproctored settings (Fallaw & Kantrowitz, 2011).
As online technology that can be utilized in employee selection systems has become more
“affordable” the clear rationale for employers making more use of it in their selection processes is
associated with cost efficiency (Lundquist, 2015). The new technology provides employers with
the capability to screen large numbers of job applicants in an efficient manner and as long as
“adverse impact can be minimized or eliminated by these tools, employers are often willing to
sacrifice some level of validity to increase diversity and reduce the risk of litigation (Lundquist,
2015). There has been a long standing concern associated with the validity of personality
assessment tools in making selection decisions. It is this long standing concern associated with the
validity of personality assessment tools in making selection decisions that is the focus of this paper.
In spite of the long running concern associated with the validity of the instruments used according
to Lundquist, there continues to be "surprisingly little real validation evidence being collected to
substantiate the job relatedness of the instruments used” (Lundquist, 2015).
WHY PERSONALITY TESTING?
Over time, employers have utilized a variety of tools and procedures to screen applicants
for entry level positions and promotion opportunities attempting to identify individuals who have
more than just the requisite knowledge, skills, and abilities (KSA’s) to perform. The basic answer
as to why employers put so much effort in to making accurate selection decisions is the high cost
associated with turnover. Typical components of the cost of turnover identified in the literature are
listed in figure 1, and will vary by industry and job, but they are generally characterized as “an
expensive HR and managerial issue that must be constantly evaluated and addressed” (Mathis,
Jackson, & Valentine, 2014).
Figure 1
Components of Turnover Cost
Separation Costs
Vacancy Costs
Replacement Costs
Training Costs
Hidden and Indirect Costs (including lost productivity)
(Mathis, Jackson, & Valentine, 2014)

Journal of Legal, Ethical and Regulatory Issues Volume 19, Number 2, 2016
114
The use of personality testing as part of employer selection processes can be traced to the
1930’s. Caruth and Caruth (2009) detail an interesting history of the use of personality testing,
going back to Depression era employer efforts to find “hard-hitting sales types” of employees who
could sell their products. Subsequently, after World War Two, employers began to use personality
testing in making selection decisions for a variety of positions from “salespersons to management
trainees” (Caruth & Caruth, 2009). The 1971 US Supreme Court’s decision in Griggs v. Duke
Power is widely regarded as a watershed event for testing in general, and the issue of personality
testing “virtually vanished from view as a result of the Supreme Court’s decision (Caruth & Caruth,
2009).
MAJOR LEGAL PRINCIPLES RELEVANT TO EMPLOYMENT TESTING
The most basic legal concerns related to the use of testing in an employer’s selection
process are associated with allegations as to whether the tests are being utilized to intentionally
discriminate against minorities or do the tests have an adverse impact on minorities and are not
job-related for the position in question and consistent with business necessity under Title VII of
the 1964 Civil Rights Act (EEOC, 2010). The Uniform Guidelines on Employee Selection
Procedures or “UGESP” adopted by the EEOC under Title VII in 1978 provide uniform guidance
for employers about how to determine if their tests and selection procedures are lawful for purposes
of Title VII disparate impact theory of discrimination (EEOC, 2010). Other statutes that can be
utilized by plaintiffs in discrimination allegations involving employment testing and selection
procedures include Title I of the Americans with Disabilities Act (ADA) and the Age
Discrimination in Employment Act (ADA) (EEOC, 2010).
In a 2007 presentation to the EEOC, Carol Miaskoff from the EEOC’s Office of Legal
Counsel, gave a summary of the major legal principles relevant to employment testing (Miaskoff,
2007). In her statement, Miaskoff began by noting that in passing Title VII of the Civil Rights Act
of 1964,
Congress expressly allowed employment tests but only if they were not “designed, intended or used to discriminate
because of race, color, religious, sex or national origin" 42 U.S.C. § 703(h). This statutory provision specifically
pertained to “professionally developed ability tests.” (Miaskoff, 2007).
Miaskoff (2007) further noted, citing the US Supreme Court’s Griggs v. Duke Power
decision, that the Supreme Court
held that the legality of these “professionally developed tests” turned on whether they were job related. Noting that
“[t]he touchstone is business necessity,” 401 U.S. at 431 (Griggs v. Duke Power Co., 1971).
In the Supreme Court’s 1975 decision in Albemarle v. Moody, Miaskoff (2007) noted that
the Court further explained its standard regarding the use of testing and stated that “Title VII
forbids employers from giving these devices and mechanisms controlling force unless they are
demonstrably a reasonable measure of job performance” (Albemarle v. Moody, 1975).
Caruth and Caruth (2009) reported in their evaluation of the reemergence of the use of
personality testing in employer selection processes that under the EEOC’s UGESP “it is
abundantly clear that any paper-and-pencil psychological measures used as selection devices are
subject to statistical validation in terms of job relatedness”. They also reported that the EEOC in
rulings involving personality tests, have “looked upon these measures with disdain, holding that
personality tests are often low in both validity and reliability” and that the agency “has also raised

Journal of Legal, Ethical and Regulatory Issues Volume 19, Number 2, 2016
115
questions about the job relatedness of personality tests” (Caruth and Caruth, 2009).
Baez (2013), in his assessment of the use of personality test in employment selection,
concluded from his review of industrial/organizational (“IO”) psychology research that “there is no
generalizable evidence that personality measures can be recommended as good or practical tools
for employee selection… The best that can be said is that in some situations, for some purposes,
some personality measures can offer helpful predictions”. Baez further cited a 2010 review of the
academic literature on personality tests and job success by Robins and Judge “that found
correlations between personality and job success to fall in the .03 to .15 range” (Baez, 2013). Baez
(2013), putting these correlations in perspective noted that “personality tests used in employee
selection account for approximately 5% of an employee’s job success while the other 95% of their
performance is unaccounted for by personality”. Baez also reported that the correlations found in
the most recent research were “almost identical to what was noted in the 1960’s. As a result, the
conclusion is that there has been no measurable change in the data for the 50 years” (Baez, 2013).
RENEWED USE OF PERSONALITY TESTING IN EMPLOYEE SELECTION
Given the long standing legal issues and the lack of empirical support for the use of
personality testing in employee selection, the question arises as to why there has been an apparent
increase in the use of psychological testing, and personality testing that has been noted by
Lundquist and others since the mid 2000’s? Personality testing is now reported to be a “$500-
million-a-year industry” that has grown by about “10 percent annually in recent years.” The
personality testing business is clearly resurging since the days of Griggs v. Duke Power (Meinert,
2015). Meinert (2014), citing a 2014 survey of Society for Human Resource Management members
reported that “while many organizations use personality testing for career development, about 22
percent use it to evaluate job candidates”. In a Business & Legal Research (BLR) promotion for a
webinar on the use of personality test in hiring, it was reported that “7 in 10 applicants nationwide
now take some kind of personality test as part of the hiring process. That’s up from 3 in 10 just five
years ago” (BLR, 2015). The BLR promotional material highlighted the potential EEO legal
problem that employers can face when using personality tests as part of their selection processes
and noted the August 2015 $2.8 million settlement that Target Corporation entered into with the
EEOC in part because of the use of personality tests utilized in the selection process (BLR, 2015,
EEOC, 2015).
Meinert (2015) detailed in her article on the use of personality assessments concerns
associated with the use of personality tests and the possibility that they may discriminate against
individuals with mental illnesses in violation of the Americans with Disabilities Act (ADA).
Meinert (2015) reports on allegations that an online personality assessment utilized by
Kroger Co., led to complaints on behalf of an individual with bipolar disorder who was rejected for
jobs by a number of companies after completing online personality assessments where the
complainant alleged that “the questions on the online tests were similar to medical evaluations he
had undergone”. Under the ADA, pre-employment medical exams are prohibited before a
conditional job offer is made (EEOC, 2011).
In addition to the previously noted cost issues associated with employee turnover, Caruth
and Caruth (2009) assert the idea that “employers are continually looking for ways to improve the
human resource selection process” and thus given the “alleged” ability of personality testing to
provide employers with the potential to hire better qualified applicants, more employers have been
utilizing them. Caruth and Caruth (2009) also cite the EEOC’s lack of resources to “pursue
vigorously its anti-personality testing position” that has allowed some employment practice to “fall

Journal of Legal, Ethical and Regulatory Issues Volume 19, Number 2, 2016
116
through the cracks despite EEOC’s stated objections”. They also note the growth in the popularity
of online dating services. Their rationale for the connection to online dating and the increased use
of personality testing in selection processes by employers is interesting to say the least. Caruth and
Caruth (2009) assert that employers, looking for procedures to efficiently screen large numbers of
applicants and finding “compatible” employees have become enthralled with the idea of using
personality tests as selection devices just as online dating services like “eHarmony and match.com
hold out the promise of finding a compatible mate for dating or marriage through personality
testing”.
So, in spite of long standing legal issues, the lack of empirical support for their use, the
growth in use continues. Whitney Martin (2014) reported on another issue that she believes “should
have opened eyes and raised red flags in the business world” concerning the effectiveness of
“various HR practices”. Martin reported on research findings from a 2002 study to determine the
consistency between HR professionals’ beliefs and research findings on the effectiveness of
various HR practices. The study found that the “area of greatest disconnect was in staffing… where
more than 50% of respondents were unfamiliar with prevailing research findings (Martin, 2014).
The lack of familiarity with prevailing research in the use of psychological testing is further
evident in the long standing wide spread misuse by both public and private sector organizations of
the Minnesota Multiphasic Personality Inventory (MMPI) and the Myers-Briggs personality type
indicator. The MMPI was developed initially to test mental patients in the 1930s and the Myers-
Briggs “characterizes all of the world’s population into just 16 personality categories hardly useful
as a job-screening tool” (Daniel, 2005). Meinert (2015), citing the publishers of the Myers-Briggs
Type Indicator’s website, notes that the Myers-Briggs test “isn’t intended to be used in the hiring
process at all”.
WHAT SHOULD EMPLOYERS DO?
“Hire hard, manage easy” (Mathis, Jackson, & Valentine, 2014).
For those involved in selecting employees, Mathis, Jackson, and Valentine’s opening
exhortation in their discussion of selection in their Human Resource Management text book,
decision makers looking for short cuts to making selection decisions should be on notice that there
are no quick and easy methods or measures to accurately identify who will be a top performer and a
good fit (Mathis, Jackson, & Valentine, 2014). As the literature continues to note the high cost of
employee turnover, employers continue to search for ways to improve their ability to find who will
be right person for the position.
At the same time employers lament the high cost of employee turnover, another concern is
the time and cost associated with filling vacant positions. Roy Maurer (2016) cited recent research
in his June 2016 HR Magazine article that found that “the average time-to-hire for white-collar
positions is now a whopping 68 business days-26 days longer than it was in 2010”. Maurer also
noted that “the average time-to-fill for jobs across all U.S. industries has been steadily climbing
since 2009” (Maurer, 2016). This has occurred in spite of the fact that more and more organizations
are attempting to utilize technology in terms of hiring to become more efficient.
It is unethical and in many cases illegal to require job applicants to take the Indicator if the results will be used to
screen out applicants. The administrator should not counsel a person to or away from, a particular career, personal
relationship or activity based solely upon type information (Myers-Briggs, 2016).

Journal of Legal, Ethical and Regulatory Issues Volume 19, Number 2, 2016
117
More employers utilizing personality assessment in the selection process is just one of ways
that employers in recent years have been attempting to improve the selection of new employees.
This increase continues in spite of comments from researchers that “personality assessments are
among the least effective in predicting job performance” (Meinert, 2015). So what should
employers, who are concerned about the cost of turnover, concerned that their current selection
processes are not identifying applicants who will “fit” and be long term top performers, and
believing that utilizing personality assessments may be the missing link in their selection processes,
do?
First, determine if there is a need to modify your selection processes. Do you have a
turnover problem? Do you have employee “fit” issues that indicate that employees you are hiring
are not fitting in to the organization’s culture? These issues could be associated with allegations of
workplace harassment, bullying, and overall job satisfaction. Is the current uptick in the use of
personality assessment a passing fad? Remember Caruth & Caruth’s historical account of the use
of personality testing in the 1930’s? There is no apparent clear and convincing empirical research
that supports the upsurge in the use of personality testing, unless of course, you hold to the growth
in the online dating business (Caruth and Caruth, 2009). Firms that are serious about studying these
types of issues are well advised to employ competent/qualified Industrial Organizational
Psychologist (IOP) to lead the effort. Lisa Daniels in her Staffing Management piece on how to use
personality tests legally and effectively, cites reports that many people “are out there putting
amateur psychologist hats on and using personal opinions” and utilizing off the shelf test “they
don’t know enough about” in their selection processes (Daniels, 2005). This approach, while
clearly the low cost approach, can lead to enhanced legal risks. Daniels cites a prominent legal
expert in this field who reported that of six lawsuits filed over personality testing by the attorney,
“all tests were bought off-the-shelf and none was overseen by any IOP or an attorney” (Daniels,
2005).
Second, if you determine there is an issue that personality assessment may be part of the
solution, again, competent/qualified IOP and legal assistance is in order to make sure you are
following the EEOC’s Uniform Guidelines on Employee Selection. Daniels also advises that
“every test should adhere to The Standards of Educational and Psychological Testing, published by
the American Psychological Association in 1999” (Daniels, 2005).
Allen Smith’s 2016 article highlights the importance of familiarity with the EEOC Uniform
Guidelines on Employee Selection Procedures for organizations utilizing hiring tests as part of their
selection processes (Smith, 2016). The two important concepts addressed in the guidelines that can
create legal problems if ignored by employers utilizing tests are the issue of the predictive validity of
the test and whether or not use of the test has an adverse impact on the basis of protected class status.
Smith reiterates previously stated concerns addressed by Daniels with respect to organizations
utilizing “off the shelf” test in their selection processes (Smith, 2016). Smith relates a report from
one prominent attorney who reports that she “cannot begin to count the number of times that an HR
professional would approach me at industry meetings and confess that he or she just discovered
that one of the business leaders found a test off the internet and has been using it with applicants
without telling HR” and dealing with hiring managers who appear to “never heard of the Uniform
Guidelines on employee Selection Procedures” (Smith, 2016). The EEOC’s guidelines give
employers detailed options and direction with respect to the assessment of the validity of their test
in addition to guidance with respect to the analysis of pass rates. Best practices from the EEOC are
in Figure 2.

Journal of Legal, Ethical and Regulatory Issues Volume 19, Number 2, 2016
118
Figure 2
EMPLOYER BEST PRACTICES FOR TESTING AND SELECTION
Employers should administer tests and other selection procedures without regard
to race, color, national origin, sex, religion, age (40 or older), or disability.
Employers should ensure that employment tests and other selection procedures are
properly validated for the positions and purposes for which they are used. The test
or selection procedure must be job related and its results appropriate for the
employer’s purpose.
While a test vendor’s documentation supporting the validity of a test may be
helpful, the employer is still responsible for ensuring that its tests are valid under
UGESP.
If a selection procedure screens out a protected group, the employer should
determine whether there is an equally effective alternative selection procedure that
has less adverse impact and, if so, adopt the alternative procedure. For example, if
the selection procedure is a test, the employer should determine whether another
test would predict job performance but not disproportionately exclude the
protected group.
To ensure that a test or selection procedure remains predictive of success in a job,
employers should keep abreast of changes in job requirements and should update
the test specifications or selection procedures accordingly.
Employers should ensure that tests and selection procedures are not adopted
casually by managers who know little about these processes. A test or selection
procedure can be an effective management tool, but no test or selection procedure
should be implemented without an understanding of its effectiveness and
limitations for the organization, its appropriateness for a specific job, and whether
it can be appropriately administered and scored.
For further background on experiences and challenges encountered by employers,
employees, and job seekers in testing, see the testimony from the Commission’s
meeting on testing, located on the EEOC’s public web site at:
http://eeoc.gov/eeoc/meetings/archive/51607/index.html.
For general information on discrimination Title VII, the ADA and the ADEA see
EEOC’s web site at http://www.eeoc.gov/laws/statutes/index.cfm.
U. S. EEOC: Employment Tests and Selection Procedures (2010).
Meinert (2015) provides decision makers with some important guidance with respect to the
use of personality assessment. She starts with avoidance of a common mistake that decision makers
often make when attempting to solve problems and that is “failing to focus on what they are trying
to achieve”. Whether you are doing training needs assessments or trying to reduce turnover, before
you can begin to assess the usefulness of whatever test you utilize, you must have a goal/objective to
measure success or failure going forward. Meinert also presents managers who are looking to deal
with outside vendors for personality assessment suggestions regarding the right questions to ask:

Journal of Legal, Ethical and Regulatory Issues Volume 19, Number 2, 2016
119
Figure 3
QUESTIONS FOR VENDORS
What is the assessment designed to measure, and how will that benefit the organization?
Is the assessment reliable and accurate?
Does it effectively predict important workplace behaviors that drive metrics affecting
sales, customer satisfaction and turnover?
Does it come with a job analysis tool that allows you to identify behavioral job
requirements?
How easy is the assessment to take?
Does it come in multiple languages?
How easy is it to interpret results?
Is the assessment free of bias, and does it comply with federal guidelines? Meinert (2016).
One final bit of legal advice for organizations looking to utilize personality assessment as
part of their selection process, “Under Title VII, the employer – no matter who gives them the test –
is the one responsible” (Meinert, 2015). In spite of the increased use by organizations, there is still
wide spread controversy as to the validity and reliability of personality assessment in the selection
process. The law does not prohibit the use of any kind of test, so long as it is a valid and reliable
predictor of some job related/business necessity measure of performance. Decision makers must
assess the cost associated with validation, the benefits, and the potential legal risk before utilizing
tools that at this point in time are still not supported by consistent empirical evidence. Until more
consistent empirical evidence is forthcoming, hiring hard to manage easy should be the guiding
principle for attempting to find the right person to fill positions.

Journal of Legal, Ethical and Regulatory Issues Volume 19, Number 2, 2016
120
REFERENCES
Albemarle v. Moody, 422 U.S. 405 (1975).
Baez, H. Beau, 2013). Personality Test in employment selection: use with caution, Cornell HR Review. Retrieved
2/24/2016 from http://www.cornellhrreview.org/personality-tests-in-employment-selection-use-with- caution/
BLR, (2016). Workplace Personality Tests: Legal and Practical Essentials for Safe Hiring - On-Demand. Retrieved
12/19/2015 from http://store.blr.com/personality-012116-on-demand .
Caruth, Donald L. and Caruth, Gail D. (2009). The reemergence of personality testing as an employee selection
procedure, Supervision, pp. 9 – 13.
Daniel, Lisa (2005). Staffing Management: Use Personality Tests Legally and Effectively. Retrieved 5/26/2016 from
https://www.shrm.org/publications/staffingmanagementmagazine/editorialcontent/pages/0504_cover.aspx
EEOC, (2010). EEOC Fact Sheet on Employment Tests. Retrieved 7/7/2016, from
https://www.eeoc.gov/policy/docs/factemployment_procedures.html .
EEOC, (2015). EEOC Press Release, 8-24-2015, Target corporation to pay $2.8 million to resolve EEOC
discrimination finding. Retrieved 5/26/2016 from https://www.eeoc.gov/eeoc/newsroom/release/8-24- 15.cfm
Fallaw, S. S., & Kantrowitz, T. M. (2011). 2011 Global assessment trends report [White paper]. Retrieved from
http://www2.Shl.com/campaign/2011globalassessmenttrendsreport/thankyou.apx.
Griggs v. Duke Power Co., 401 U.S. 424 (1971).
Krell, Eric (2015). Look Outside or Seek Within? HR Magazine, January/February 2015, pp. 61 – 64.
Lundquist, Kathleen K. (2015). Written testimony of Kathleen K. Lundquist, Ph.D. APT Metrics, Inc. before the U.S.
Equal Employment Opportunity Commission Meeting of April 15, 2015. Retrieved 2/24/2016 from
https://www.eeoc.gov/eeoc/meetings/4-15-15/lundquist.cfm .
Martin, Whitney (2014). The problem with using personality tests for hiring, Harvard Business Review. Retrieved
9/7/2016 from https://hbr.org/2014/08/the-problem-with-using-personality-tests-for-hiring .
Mathis, Robert L., Jackson, John H. and Valentine, Sean R. (2014). Human Resource Management (Fourteenth
Edition), Stamford, CT, Cengage Learning.
Meinert, Dori (2015). Heads Up! HR Magazine, June 2015, 88 – 98.
Miaskoff, Carol (2007). Statement of Carol Miaskoff, EEOC Office of Legal Counsel, EEOC Meeting of May 16,
2007. Retrieved 6/16/2016 from https://www.eeoc.gov/eeoc/meetings/archive/5-16-07/miaskoff.html .
Myers-Briggs (2016). The Myers & Briggs Foundation, Ethical Guidelines. Retrieved 6/20/2016 from
http://www.myersbriggs.org/myers-and-briggs-foundation/ethical-use-of-the-mbti-instrument/ethical-
guidelines.htm .
Smith, Allen (2016). DOL cracks down on company’s use of hiring tests. Retrieved 6/17/2016 from
https://shrm.org/ResourcesAndTools/legal-and-compliance/employment-law/Pages/DOL-Cracks-Down-
on-Companys-Use-of-Hiring-Tests.aspx .
U. S. EEOC: Employment Tests and Selection Procedures (2010). Fact Sheet on employment tests and selection
procedures. Retrieved 2/24/2016 from https://www.eeoc.gov/policy/docs/factemployment_procedures.html