journal of management - iese blog...
TRANSCRIPT

http://jom.sagepub.com/Journal of Management
http://jom.sagepub.com/content/early/2012/02/29/0149206311436080The online version of this article can be found at:
DOI: 10.1177/0149206311436080
published online 1 March 2012Journal of ManagementYih-teen Lee and John Antonakis
Job Fit−Moderates PersonWhen Preference Is Not Satisfied but the Individual Is: How Power Distance
Published by:
http://www.sagepublications.com
On behalf of:
Southern Management Association
can be found at:Journal of ManagementAdditional services and information for
http://jom.sagepub.com/cgi/alertsEmail Alerts:
http://jom.sagepub.com/subscriptionsSubscriptions:
http://www.sagepub.com/journalsReprints.navReprints:
http://www.sagepub.com/journalsPermissions.navPermissions:
What is This?
- Mar 1, 2012OnlineFirst Version of Record >>
at Universidad de Navarra-Biblioteca on March 2, 2012jom.sagepub.comDownloaded from

When Preference Is Not Satisfied but the Individual Is: How Power Distance
Moderates Person–Job Fit
Yih-teen LeeIESE Business School
John AntonakisUniversity of Lausanne
One aspect of person–job fit reflects congruence between personal preferences and job design; as congruence increases so should satisfaction. The authors hypothesized that power distance would moderate whether fit is related to satisfaction with degree of job formalization. They obtained measures of job formalization, fit, and satisfaction, as well as organizational commit-ment, from employees (N = 772) in a multinational firm with subsidiaries in six countries. Confirming previous findings, individuals from low-power-distance cultures were most satisfied with increasing fit. However, the extent to which individuals from high-power-distance cultures were satisfied did not necessarily depend on increasing fit but mostly on whether the degree of formalization received was congruent with cultural norms. Irrespective of culture, satisfaction with formalization predicted a broad measure of organizational commitment. Apart from the novel extension of fit theory, the authors show how moderation can be tested in the context of polynomial response surface regression and how specific hypotheses can be tested regarding different points on the response surface.
Keywords: person–job fit; choice; job formalization; national culture; power distance; response surface methodology; moderation
1
Acknowledgments: We are grateful to the editor and to the reviewers for their helpful and developmental comments. We also thank Marius Brulhart, Jeffrey Edwards, Amy Kristof-Brown, Rafael Lalive, and Christian Zehnder for helpful suggestions we received in the different phases of this article. Any errors or omissions are our responsibility.
Corresponding author: John Antonakis, University of Lausanne, Internef 618, University of Lausanne, Lausanne 1015, Switzerland
E-mail: [email protected]
Journal of ManagementVol. XX No. X, Month XXXX xx-xx
DOI: 10.1177/0149206311436080© The Author(s) 2012
Reprints and permission: http://www.sagepub.com/journalsPermissions.nav
at Universidad de Navarra-Biblioteca on March 2, 2012jom.sagepub.comDownloaded from

2 Journal of Management / Month XXXX
Person–environment (PE) fit theory is a central concept in management research (Edwards, 2008; Kristof-Brown, Zimmerman, & Johnson, 2005; Schneider, 2001). PE fit theory suggests that congruence between attributes of a focal entity (P) and the environment (E) leads to positive outcomes (Edwards & Shipp, 2007; Hoffman & Woehr, 2006; Verquer, Beehr, & Wagner, 2003). Underlying the PE fit concept is the psychological mechanism of compatibility derived from need fulfillment and similarity (Edwards & Shipp, 2007; Kristof-Brown & Guay, 2010). Because human psychological processes are subject to the influence of culture (Bond & Smith, 1996; Lehman, Chiu, & Schaller, 2004), the phenomenon of PE fit may also vary across cultures.
National culture refers to value orientations (Kluckhohn & Strodtbeck, 1961). Culture is a system of shared meanings, a common frame of reference through which members of a society view their environment and their relations to one another (Hofstede, 2001). Gelfand, Leslie, and Fehr (2008) have underscored the potential biases inherited in management theories predominately developed in the United States. Marked by values of low power distance and individualism, such theories generally assume that people “are free to choose what they do and when they do it” (Gelfand et al., 2008: 496). However, the theories often fail to account for the effects of cultural values on the psychological processes that influence behavior (Lehman et al., 2004).
Although scholars have started to conduct PE fit studies outside the United States (Kristof-Brown & Guay, 2010), cross-cultural studies remain an exception (Gelfand, Erez, & Aycan, 2007; e.g., see Parkes, Bochner, & Schneider, 2001; Westerman & Vanka, 2005); the universality of PE fit across cultures remains unclear. We sought to extend PE fit theory by exploring the moderating role of culture and answer calls to examine the boundaries of PE fit theory, which “falls well short of criteria for developing strong theory” (Edwards, 2008: 167). Boundary conditions are the limits beyond which the theory does not hold (Edwards, 2008; Whetten, 1989) and are usually expressed as moderators that influence the form or strength of the relationships among variables. Identifying boundary conditions represents an important stage of theory building (Bacharach, 1989; Dubin, 1978; Edwards & Berry, 2010; Whetten, 1989) because it allows us to explicitly state and test the tacit assumptions embedded in theories (Bacharach, 1989).
Although culture may moderate various types of fit, to maintain parsimony in our theorizing we focused on one type of fit; similar to Edwards, Cable, Williamson, Lambert, and Shipp (2006), we chose to examine the needs–supplies, person–job fit—the match between one’s needs and preferences and what one gets from the job—with need fulfillment as its key psychological mechanism. Such processes are fundamental to human functioning (Dawis & Lofquist, 1984; Locke, 1976; see Kristof-Brown & Guay, 2010) but still subject to cultural influence (Erez, 2010; Schwartz & Sagiv, 1995). Furthermore, we investigated one job characteristic—formalization—for its importance in job design theories.1 To date, theoretical and empirical works have offered mixed results regarding the utility of formalization in job design (Juillerat, 2010; Organ & Greene, 1981; Podsakoff, Williams, & Todor, 1986). In addition to existing explanations based on types (e.g., Adler & Borys, 1996) or levels (e.g., Hempel, Zhang, & Han, in press) of formalization, our study may offer further insights on such mixed views of formalization from the PE fit perspective. We also focused on one cultural value, power distance (PD), given its pertinence in job formalization and job design
at Universidad de Navarra-Biblioteca on March 2, 2012jom.sagepub.comDownloaded from

Lee, Antonakis / Power Distance and Person–Job Fit 3
theories (Agarwal, 1993; Erez, 2010) and its effects on shaping one’s self-concept and certain psychological processes.
As the key mechanism underlying needs–supplies fit, the psychological theory of need fulfillment suggests that a match between what one prefers and what one gets will predict higher satisfaction (Kristof-Brown & Guay, 2010). However, are people necessarily more satisfied when they get what they want? Consider the following situation: Your boss invites you out to dinner. How satisfied would you be if (a) you order what you want or (b) your boss orders for you? Assume you are given no choice and your boss orders for you. Using an average Western mindset, one would expect that having a choice would be most gratifying and that receiving something one did not choose—or might not like—as being most dissatisfying. Thus, the more congruent one’s preferences are with what one receives, the more satisfied one is. Is this prediction valid in high-PD cultures? Perhaps not, as we briefly explain next.
The “person” component of the PE fit concept is built on culturally contingent theories of choice, self-concept, self-control, and agency (Iyengar & Lepper, 1999; Markus & Kitayama, 1991; Matsumoto, 2007; Morling & Evered, 2006). Power distance—the extent to which inequalities exist between social players and whether inequality is accepted (Hofstede, 2001; Maznevski, DiStefano, Gomez, Noorderhaven, & Wu, 2002)—affects individuals’ respect for authority; PD also affects the discretion and choices individuals can have. In our study, we used degree of job formalization in the organization as a proxy for the extent to which discretion is limited. In low-PD cultures, organizations are generally less hierarchical and the satisfaction of individuals depends on congruence between their preferences and the degree of job formalization received. These individuals expect to have their preferences fulfilled and will be dissatisfied if the degree of structuring is not congruent with what they prefer. That is, for them, individual agency and choice are important (see Patall, Cooper, & Robinson, 2008).
The satisfaction of individuals from high-PD cultures is not necessarily a function of preferences–supplies congruence. We suggest that individuals from high-PD cultures will not be completely dissatisfied when they do not get what they want if their preferences are contrary to cultural norms. Individuals from high-PD cultures are context sensitive and conform to authority; they do not value choice as a sina qua non of self-expressive significance; conforming to what has been provided by the organization (i.e., a highly formalized job), presumably reflecting cultural norms and the will of authority, might be more important than having one’s preference met (cf. Matsumoto, 2007). Thus, we examined the following questions: How do person–job fit patterns vary across high- and low-PD countries? What are the fit patterns when personal preferences are in conflict with cultural norms for individuals from high-PD cultures? To ensure that we have some external criterion by which to judge whether our theory holds both for high- and low-PD contexts, we also evaluated if satisfaction with formalization—whether reflecting “classical” theorizing or not—predicted a broad measure of organizational commitment.
Our key contributions are twofold. First, we contribute to the PE fit theory by explicitly identifying boundary conditions of the fit hypothesis. Second, there are no studies that have examined the moderating effect of culture on the person–job fit hypothesis using the Edwards (1994) response surface method for testing congruence. In addition, we specified the functional forms of our hypotheses with precise conjectures (Edwards & Berry, 2010) and demonstrated
at Universidad de Navarra-Biblioteca on March 2, 2012jom.sagepub.comDownloaded from
4 Journal of Management / Month XXXX
how to probe the form of the congruence relation by (a) testing the slopes at various points of the surface and (b) testing differences in predicted values at particular points of the surface.
Theoretical Background and Hypotheses
Fitting in the Job
PE fit can be defined as “the compatibility between an individual and a work environment that occurs when their characteristics are well matched” (Kristof-Brown et al., 2005: 281). One of the key contributions of PE fit theory is that individual performance stems not only from individual differences or organizational characteristics but from both of them (and even their interaction). Increasing fit is assumed to predict various psychological states and work outcomes (see Edwards, 1996; Kristof-Brown et al., 2005). Among various types of fit, person–job fit has been a key criterion for employee attraction and selection (Caplan, 1983; Carless, 2005). Person–job fit usually takes two forms: (a) The match between an individu-al’s knowledge, skills, and abilities with job specifications and (b) the congruence between what one values, needs, or prefers with what one receives from the job one performs (Kristof-Brown et al., 2005).
We focused our study on needs–supplies, or person–job, fit (specifically, the match between one’s preferred and received degree of job formalization) because of its strong theoretical and empirical foundations linking fit to outcomes (Kristof-Brown et al., 2005). The theory of need fulfillment (Dawis & Lofquist, 1984; Locke, 1976) suggests that indi-viduals will experience positive job attitudes to the extent that their needs are fulfilled (see also Edwards & Shipp, 2007; Kristof, 1996; Shaw & Gupta, 2004). Employees are expected to feel satisfied with their jobs when their preferences are fulfilled, as has been consistently shown (Kristof-Brown et al., 2005). Intuitively, one would expect to observe a symmetric pattern in person–job fit (e.g., for the degree of job formalization), as depicted in Figure 1A (see Conway, Vickers, & French, 1992). Satisfaction increases to the extent that needs and supplies become more congruent (note, as we argue later, that the fit line C-A should have a positive slope). How might culture affect the fit model? We discuss the potential influence of PD on fit next.
Impact of Power Distance on Person–Environment Fit
Culture affects how individuals think and act (Mead, 1978) and influences one’s self-concept (Markus & Kitayama, 1991; Matsumoto, 2007), how one values choices (Iyengar & Lepper, 1999), and how one exercises control over the environment and the self (Morling & Evered, 2006). Despite the fact that individuals may hold values that reflect their genetic heritage, personal experiences, and social locations (Au, 1999; Schwartz, 1999), “shared” values also influence individuals normatively (Parsons, 1951). Individual- and cultural-level values are not always in concordance with each other. As we suggest below, in certain cir-cumstances cultural norms may override individual preferences.
at Universidad de Navarra-Biblioteca on March 2, 2012jom.sagepub.comDownloaded from

Lee, Antonakis / Power Distance and Person–Job Fit 5
Figure 1Hypothesized Response Surfaces for Conventional Form of Needs–Supplies Fit
Figure 1A: This figure demonstrates the conventional response surface fit function. When there is fit (line C-A) between preference (Z) and perceived reality (X), individuals are most satisfied (Y). However, when there is lack of fit (Points B and D), individuals are most dissatisfied.
--
-0.5 1.5
2.5
--
-0.5
1.52.5
0
1
2
3
4
5
6Satisfaction
Perceived reality
-2.5-1.5
-0.5-2.5-1.5
-0.5
Preference
C
D
B
A
-2.5-1.5
-0.50.5 1.5
2.5
-2.5-1.5
-0.50.5
1.52.5
0
1
2
3
4
5
6
Satisfaction
Preference
Perceived reality
--
---
-
4
B
CD
A
Figure 1B:This figure is similar to the conventional response surface fit function in Figure 1A but demonstrates the pattern that satisfaction will generally be higher when needs (preference) and supplies (perceived reality) are both high (i.e., Point A) than when both are low (i.e., Point C; see Edwards & Shipp, 2007; Kristof-Brown & Guay, 2010; Kristof-Brown et al., 2005).
at Universidad de Navarra-Biblioteca on March 2, 2012jom.sagepub.comDownloaded from

6 Journal of Management / Month XXXX
Power distance and job formalization. In this study, we focus on one job characteristic, job formalization, which is a central dimension in organizational structure and job design (e.g., Pugh, Hickson, Hinings, & Turner, 1968; Vecchio & Keon, 1981). Job formalization refers to the extent to which an organization uses rules and procedures to prescribe behavior in performing certain jobs (Fredrickson, 1986). It concerns the degree to which organiza-tional functions are spelled out and job descriptions are specified and the extent to which firm policies, organization charts, plans, and objective-setting systems are articulated explic-itly, usually through written communications (Pugh et al., 1968; Wally & Baum, 1994).
What we expected is that the degree of preferred and actual job formalization might be affected by cultural values and in particular by PD. PD is arguably the most relevant cultural factor affecting job formalization and PE fit patterns. Increasing PD is related to increased job formalization because organizational members in high-PD countries tend to rely less on their own discretion and more on formal rules and authority (Hofstede, 2001). In other words, PD affects organizational structuring and autonomy (Huang & Van de Vliert, 2003). Individuals in high-PD societies, on the aggregate, tend to accept and conform to authority; bureaucracy and formalization may even reduce stress related to role ambiguity at work (Peterson et al., 1995). Studies also show that organizations in high-PD societies make extensive use of rules and procedures (i.e., formalization) as coordination mechanisms (Agarwal, 1993; Lincoln, Hanada, & McBride, 1986). Contrarily, in low-PD societies, individuals, on the aggregate, generally expect to have a choice regarding how their work is structured, require less supervi-sion, and are more autonomous. As a result, we hypothesized the following:
Hypothesis 1: The degree of perceived job formalization and personal preference for job formaliza-tion will be higher in high-PD cultures than in low-PD ones.
How the fit hypothesis might be moderated. Theoretically, instead of construing fit only as a match between what one values and what one receives, cultural values intervene in how individuals perceive the fit between their needs and preferences and the environment. More specifically, in high-PD contexts, if individual-difference preferences are in conflict with norms, personal preferences will cede. In this particular case, the norm is to respect and accept formal rules (i.e., high formalization). Individuals in low-PD contexts, however, do not see authority in the same light and expect to have choice insofar as their preferences are concerned (i.e., individuals might want more or less autonomy, and this choice must be accommodated).
At low levels of PD, individuals have a “license” to exercise choice over the fulfillment of their self-serving needs, and they will be satisfied in situations where their needs are ful-filled. As a result, individuals from low-PD cultures feel less need to comply and/or demon-strate self-control (Lalwani, Shavitt, & Johnson, 2006). Because of a hierarchical self-con-cept (Matsutmoto, 2007), individuals from high-PD cultures do not enjoy this “license.” Although they might exhibit individual differences in their preferences, fulfilling self-serving interests is not essential to reifying their self-concepts. Moreover, they tend to be less impul-sive and have greater self-control (Zhang, Winterich, & Mittal, 2010), and they are expected to play down their idiosyncratic needs while deferring to social norms and hierarchy (Hofstede, 2001; Oyserman, 2006). Conforming to authority is more important than self-gratification.
at Universidad de Navarra-Biblioteca on March 2, 2012jom.sagepub.comDownloaded from

Lee, Antonakis / Power Distance and Person–Job Fit 7
In high-PD contexts, those who have less power might still be relatively content in situa-tions where their preferences are not fulfilled (i.e., having reduced autonomy). For example, Asians tend to be more intrinsically motivated when choices are made for them by trusted authority figures; contrarily, Americans value personal choice (Iyengar & Lepper, 1999). Individuals from high-PD cultures may even perform better under disempowered conditions (Eylon & Au, 1999). Intrinsic job characteristics such as autonomy do not predict job satis-faction very well in high-PD countries (Huang & Van de Vliert, 2003). Such studies indicate that in high-PD cultures individual agency gives way to authority, and norms and individual preferences may not play a primordial role in the PE fit phenomenon. The few studies of fit in non-Western cultural settings also found that individual preferences tend to matter less in high-PD contexts (Nyambegera, Daniels, & Sparrow, 2001; Westerman & Vanka, 2005). We thus advance a general hypothesis regarding the moderating effect of PD and provide specific subhypotheses as to its form later2:
Hypothesis 2: The relationship between person–job fit and job satisfaction will be moderated by PD.
In low-PD cultures, congruence between preferences and what one gets will predict one’s satisfaction. Although in these contexts there is a cultural norm to value autonomy, individu-als will value choice and have a “license” to self-express. Thus, individuals will feel satisfied only when their preferences are fulfilled, whether they want low or high levels of job struc-ture, which is consistent with the conventional symmetric pattern of person–job fit (Conway et al., 1992).
Moreover, satisfaction will generally be higher when needs and supplies are both high than when both are low, as suggested by recent reviews (Kristof-Brown & Guay, 2010; Kristof-Brown et al., 2005), theory (e.g., Edwards & Harrison 1993; Edwards & Shipp, 2007), and empirical results (e.g., Edwards & Rothbard, 1999; Kalliath, Bluedorn, & Strube, 1999; Naus, van Iterson, & Roe, 2007). Therefore, the general relationship should look like Figure 1B, where satisfaction is highest along the fit line. As argued earlier, in low-PD cul-tures people normally prefer and receive a lower level of formalization. Hence, individuals preferring low formalization and receiving low formalization will be satisfied; however, those who prefer high formalization and receive it may be even more satisfied because, theo-retically, receiving something that one wants is more valued than not receiving something that one does not wish to have. Consider the restaurant case once more. An individual who does not like stewed snails with Roquefort cheese as a starter will be happy not to have it and to have nothing at all. Another individual who might like the snail dish and gets it as a starter will be comparatively happier than the former individual (just imagine the relief on the face of the first individual vs. the glee of the second!). Thus, we expect that satisfaction will be higher when preference and perceived formalization are both high than when both are low; we hypothesize the following.
Hypothesis 2a: For individuals from a low-PD context, satisfaction will be positively predicted by increasing congruence between individual preference and received job formalization. Moreover, satisfaction will be higher when preference and perceived formalization are both high than when both are low.
at Universidad de Navarra-Biblioteca on March 2, 2012jom.sagepub.comDownloaded from
8 Journal of Management / Month XXXX
For a summary of the expected forms of the surfaces and specific statistical tests corre-sponding to Hypotheses 2a, 2b, 2c, and 2d, refer to Table 1.
In high-PD contexts, if what an individual prefers corresponds to what the cultural norms ascribe, the individual will be satisfied when she gets what she prefers. Also, satisfaction will be higher when both needs and supplies are high than when both are low (Edwards & Shipp, 2007; Kristof-Brown et al., 2005), similar to the congruence form in low-PD cultures. The moderating effect of PD on fit becomes visible only when one’s personal preferences are in conflict with social norms (as we discuss in Hypotheses 2c and 2d below). Hence, high-PD individuals exhibit a “partial fit” at levels where preferred job formalization is high such that they are more satisfied when they prefer to have high job formalization and receive it as compared to when they do not receive it (see Figure 2). Thus, we hypothesize the following:
Hypothesis 2b: For individuals from a high-PD context, if their preferences are consistent with cultural norms, satisfaction will be positively predicted by increasing congruence between their preferred and the received formalization. Moreover, satisfaction will be higher when preference and perceived formalization are both high than when both are low.
In the following discussion, we differentiate two situations so as to have a clear under-standing of the fit phenomenon in a high-PD context: When one gets what one prefers (i.e., personal fit) versus when one does not get it (i.e., lack of personal fit). When individuals from high-PD cultures get what they prefer, will they be as satisfied as their counterparts in low-PD cultures if their preference is in conflict with cultural norms (i.e., they prefer low formaliza-tion and get it, indicating fit)? We argue that individuals in high-PD cultures incur psycho-logical costs for not conforming to the norms because they generally experience higher felt accountability (Frink & Klimoski, 1998). Also, to avoid making cultural faux pas, they tend to be more context sensitive (Kashima et al., 2004; Matsumoto et al., 2008) and have chronic accessibility to normative ought-to guides (Higgins, 1996). They also have higher regulatory strength to adjust themselves if they detect discrepancies from social norms (Baumeister & Heatherton, 1996).
Low job formalization implies higher personal autonomy, leading to increased personal control. Yet, people from high-PD cultures tend to rely on authority for clear orders and direc-tions (Dickson, Den Hartog, & Mitchelson, 2003); they also tend to avoid self-management (Kirkman & Shapiro, 2001). Upon receiving increased control, they may feel anxious about their performance and responsibility (Burger, 1989). In fact, individuals from high-PD cul-tures do not perform as well when empowered as compared to when disempowered (Eylon & Au, 1999). Erez and Earley (1987) also found that high-PD individuals outperformed low-PD individuals for whom goals had been assigned. As a result, when preferences and supplies are in conflict with cultural norms, high-PD individuals’ levels of satisfaction will be “taxed” for contradicting cultural norms; satisfaction in this instance will be lower than when fit is consistent with cultural norms, due to emotional regulation effects such as sup-pression (Matsumoto et al., 2008). For example, imagine a child in a high-PD culture who likes Western-style ice cream but is forbidden by her parents to eat it. If one day this child receives this ice cream without her parents’ consent, she may still feel satisfied for getting what she likes. However, such satisfaction is likely to be taxed to some extent by a sense of
at Universidad de Navarra-Biblioteca on March 2, 2012jom.sagepub.comDownloaded from

Lee, Antonakis / Power Distance and Person–Job Fit 9
Table 1Hypotheses Testing Regarding Specific Response Surface Forms
HypothesisExpected Shape of the
Response Surface Expected Results Empirical Results
Hypothesis 2a: For individuals from a low-PD context, satisfaction will be positively predicted by increasing congruence between individual preference and received job formalization. Moreover, satisfaction will be higher when preference and perceived formalization are both high than when both are low.
• Referring to Figure 1B, satisfaction will be high along the fit line (C-A) and lower toward the corners of lack of fit (i.e., Points B and D; hence, the slope of the C-B and C-D lines will be negative, whereas the slope of the D-A and B-A lines will be positive).
• The slope of the C-A line will be positive.
For low-PD group• Table 5: b3–b4 +
b5<0; b1 + b2>0.• Supported
• Table 6: Lines C-B and C-D have negative slopes; lines D-A and B-A have positive slopes.
• Supported
• Table 7: Point A > B, C, and D; Point C > B and D.
• Supported
Hypothesis 2b: For individuals from a high-PD context, if their preferences are consistent with cultural norms, satisfaction will be positively predicted by increasing congruence between their preferred and the received formalization. Moreover, satisfaction will be higher when preference and perceived formalization are both high than when both are low.
• Referring to Figure 2, the slope of the D-A line will be positive.
• The slope of the C-A line will be positive.
For high-PD groups• Table 5: b3–b4 + b5
is negative (but less significantly than that of low-PD group); b1 + b2> 0.
• Supported
• Table 6: D-A line has a positive slope.
• Supported
• Table 7: Point A > D.
• Supported
Hypothesis 2c: For individuals from a high-PD context, if their preference is in conflict with cultural norms, congruence between their preferred and received extent of formalization (i.e., Point C) will predict a level of satisfaction only slightly higher than the level at lack of fit (Point D).
• Referring to Figure 2, Point C will be only slightly higher than Point D; hence, the slope of the C-D line will still be negative yet less so as compared to low-PD cultures.
• Satisfaction at Point C (fit) will be taxed in its relative position to Point D (lack of fit).
For high-PD groups• Table 6: C-D line
has a negative slope yet with a lower level of magnitude and significance than that of low-PD group.
• Partially supported (The slope is not significant for the FR + IT high-PD group.)
• Table 7: Point C > D (yet only slightly so).
• Partially supported (Point C is not significantly higher than Point D for the FR + IT high-PD group.)
(continued)
at Universidad de Navarra-Biblioteca on March 2, 2012jom.sagepub.comDownloaded from

10 Journal of Management / Month XXXX
Table 1 (continued)
HypothesisExpected Shape of the
Response Surface Expected Results Empirical Results
Hypothesis 2d: For individuals from a high-PD context, if their preference is in conflict with cultural norms, lack of congruence between their preferred and received formalization (i.e., Point B) will predict a level of satisfaction higher than that in situations of lack of congruence where personal preference is consistent with cultural norms (i.e., Point D).
• Referring to Figure 2, Point B (lack of fit) will be lower than Point A (fit) yet will be higher than Point D (lack of fit). The slope of the B-A line will still be positive.
• Satisfaction at Point B (lack of fit) will be compensated in its relative position to Point A (fit) and Point D (lack of fit).
For high-PD groups• Table 6: Line B-A
has a positive slope, yet with a lower level of magnitude and significance than that of the low-PD group.
• Partially supported
(The slope is not significant for the FR + IT high-PD group.)
• Table 7:Point A > B; Point B > D.
• Partially supported (Point A is not significantly higher than Point B for the FR + IT high-PD group.)
Note: PD = power distance; FR = France; IT = Italy.
guilt or worry for doing something not allowed by her parents; that is, given the culture’s deference to authority and power, the individual incurs a psychological cost for fulfilling her needs (Lee, Pillutla, & Law, 2000). We therefore hypothesize:
Hypothesis 2c: For individuals from a high-PD context, if their preference is in conflict with cul-tural norms, congruence between their preferred and received extent of formalization (i.e., Point C) will predict a level of satisfaction only slightly higher than the level at lack of fit (Point D).
What might happen if individuals from a high-PD context prefer something going against the social norm (e.g., low level of formalization) but receive the contrary (i.e., obtain high levels of formalization, hence lack of personal fit)? We suggest that their satisfaction would be higher than it would be in low-PD cultures in situations of lack of fit. First, high-PD indi-viduals will still feel that they are being treated relatively fairly (Oyserman, 2006); in such cultural contexts, individuals tend to accept arbitrary treatment and are less likely to question authority (Lee et al., 2000). These individuals may not get upset about such “injustice” because they more readily accept power differentials (cf. Leung & Stephan, 1998). As a result, even if they do not get what they prefer, they legitimize what authority dictates.
Furthermore, when facing undesirable situations, people may (a) use primary control, wherein they attempt to change the environment so as to fit the self’s needs, or (b) mobilize secondary control, which reflects efforts directed inward to align the self with existing cir-cumstances (Rothbaum, Weisz, & Snyder, 1982). Secondary control refers to “the process by which people adjust some aspect of the self and accept circumstances as they are” (Morling & Evered, 2006: 269), aiming at “maximizing one’s fit to current conditions” (Rudolph, Dennig, & Weisz, 1995: 331) and hence restoring a more favorable affective state.
at Universidad de Navarra-Biblioteca on March 2, 2012jom.sagepub.comDownloaded from

Lee, Antonakis / Power Distance and Person–Job Fit 11
Note: This figure demonstrates our theorized response surface for high-power-distance cultures. Points A and D indicate situations where individual preference (i.e., high formalization) is consistent with cultural norms. Hence, individuals’ corresponding levels of satisfaction are similar to the levels of Points A and D in the conventional form in Figure 1. Points B and C, however, indicate situations where individual preference (i.e., low formalization) is in conflict with cultural norms. The level of satisfaction is thus taxed at Point C for violating cultural norms, even if individuals receive what they prefer. Similarly, the level of satisfaction at Point B is higher than in Figure 1 because it is compensated by cultural fit, even if individuals do not receive what they prefer.
Figure 2Hypothesized Response Surface for Needs–Supplies
Fit in High-Power-Distance Cultures
-2.5-1.5
-0.50.5
1.5 2.5
-2.5-1.5
-0.50.5
1.52.5
0
1
2
3
4
5
6
Satisfaction
PreferencePerceived reality
-2.5-1.5
-0.50.5
1.5 2.5
-2.5-1.5
0.51.5
2.5
0
1
2
3
4
5
6
A
B
C
D
In some contexts (e.g., high PD), people tend to use secondary control more often (Kojima, 1984; Morling & Evered, 2006), which may facilitate environmental adaptation (Weisz, Rothbaum, & Blackburn, 1984). Secondary or indirect control can be particularly present in cultures where employees have difficulty confronting authority figures (Greenberger & Strasser, 1986). It helps people to stay relatively satisfied in an initially uncomfortable situation (e.g., lack of fit with one’s preference) over which they have little control; that is, they cannot challenge authority or social norms. In high-PD cultures, people tend to cultivate a willingness to accept situations and demonstrate fewer externally targeted control attempts (Tweed, White, & Lehman, 2004). In such cultural contexts, the self is more pliable; when facing stressful situations, individuals often use emotion-focused coping (Folkman & Lazarus, 1988). These individuals may go through a kind of positive emotional reap-praisal, that is, “re-evaluating the emotion-eliciting stimuli” in a positive light, so as to preserve social order (Matsumoto et al., 2008: 926). We therefore expect individuals in this
at Universidad de Navarra-Biblioteca on March 2, 2012jom.sagepub.comDownloaded from

12 Journal of Management / Month XXXX
category to maintain moderate instead of low levels of satisfaction as the universalistic fit model would predict.
Thus, in high-PD contexts, even though individual preferences do exist, their impact on attitudinal outcomes is reduced particularly in situations where individual preferences are in conflict with sociocultural values. In other words, higher level cultural values may thus over-ride individual preferences. We thus hypothesize:
Hypothesis 2d: For individuals from a high-PD context, if their preference is in conflict with cul-tural norms, lack of congruence between their preferred and received formalization (i.e., Point B) will predict a level of satisfaction higher than that in situations of lack of congruence where personal preference is consistent with cultural norms (i.e., Point D).
Satisfaction with structuring and organizational commitment. Although satisfaction with organizational structuring is an important component of job satisfaction (Spector, 2003) and predicts job performance (Judge, Thoresen, Bono, & Patton, 2001), focusing only on orga-nizational structuring as the dependent variable would make the scope of the study quite narrow. Thus, to ensure that our results have broad implications, and to validate our fit theo-rizing with respect to satisfaction, we also looked at whether satisfaction with structuring predicted a general measure of organizational commitment. As results of previous studies would suggest, job satisfaction, whether measured as a global construct or a component fac-tor, is strongly related to organizational commitment (Mathieu & Zajac, 1990). Also, because organizational commitment is related to job performance and other outcome mea-sures (Mathieu & Zajac, 1990; Riketta, 2002; Wright & Bonett, 2002), our results will be more generalizable if our theorizing is confirmed. We thus test the following hypothesis:
Hypothesis 3: Irrespective of PD context, satisfaction with structuring will be positively related to organizational commitment.
Method
Sample
We used an online survey to collect data from national subsidiaries of a Taiwanese multi-national high-technology company in Taiwan, France, Germany, Italy, the Netherlands, and the United Kingdom (one subsidiary per country). The multinational granted us access to participants because it was interested to learn, among other things, how preferences for job formalization might vary across cultures. The company contacted participants by e-mail on our behalf, and the participants responded anonymously to the survey. The total sample size was 772, which reflects 29.78% of the total workforce of the company at those sites. Most of the participants were male (62%). Participants represented a wide array of job levels, including nonmanagement (60.5%), lower management (24.7%), middle management (10.5%), and top management (4.3%).
at Universidad de Navarra-Biblioteca on March 2, 2012jom.sagepub.comDownloaded from

Lee, Antonakis / Power Distance and Person–Job Fit 13
Data Analytical Strategy
We used a polynomial regression technique together with response surface methodology to test our congruence hypotheses (Edwards, 1994). We scale centered the constructs and centered the axes to facilitate interpretation of the derived response surfaces. We used the quadratic regression model because it can best capture the symmetrical nature of our fit hypothesis, as many other studies adopting polynomial regression method have shown (e.g., Kalliath et al., 1999; Kristof-Brown & Stevens, 2001). To test the moderating effect of PD on culture and to directly facilitate comparison of coefficients across the PD groupings, we used a Chow test (Chow, 1960). This test is analogous to testing the equality of coefficients in a multisample structural equation model (SEM).
Because our theory asserts that congruence between perceived and actual formalization affects satisfaction, which in turn affects commitment, we estimated a two-stage structural model (using STATA’s two-stage least squares estimator with robust standard errors):First stage:
(1)
Second stage:
(2)
where, for both equations, Sat = satisfaction with formalization, OrgCom = organizational commitment, X = perceived level of job formalization, Z = preference for job formalization, Gender = dummy variable indicating gender, Age = chronological age, Senior = seniority level (years), Edu = education level (dummy coded), Hierarch = hierarchical job level (dummy coded), and e and u = error terms (correlated, which is the default two-stage least squares estimator). We tested overidentifying constraints with a Hansen J test (analogous to a SEM chi-square test of fit).
Measures
We translated the English measures into the target languages. We applied the back-translation technique, and independent experts checked the results to ensure semantic equivalence (we also controlled for sample heterogeneity, discussed below). For all items, we used a 6-point scale with appropriate descriptor points (from 1 = strongly disagree to 6 = strongly agree).
Job formalization. This represented the extent to which an organization used rules and procedures to prescribe task-related behavior (Fredrickson, 1986). The independent vari-ables were (a) employees’ personal preference regarding the degree of job formalization in the workplace (i.e., preference) and (b) perceived degree of formalization in the job (i.e.,
Sat b b X b Z b X b XZ b Z b Gender
b Age b Senior bkk
= + + + + + + +
+ +=
0 1 2 32
4 52
6
7 822
4
2
4
∑ + ∑ +=
Edu b Hierarch ek mmm
.
OrgCom Sat Gender Age Senior Edukk
mm
k= + + + + + ∑ += =
γ γ γ γ γ γ γ0 1 2 3 42
4
2
4
∑∑ +Hierarch um ,
at Universidad de Navarra-Biblioteca on March 2, 2012jom.sagepub.comDownloaded from

14 Journal of Management / Month XXXX
perceived reality); the dependent variable was (c) employees’ satisfaction with the way their jobs were structured.
We developed four items to measure job formalization based in part on Kerr and Jermier’s (1978) measure and adapted with the conceptualizations offered by the organizational struc-ture literature (Galbraith, 1977; Wally & Baum, 1994). The basic items were “Employees of the company communicate through formally designed channels,” “Clear rules exist for reporting problems occurring in the fulfillment of one’s everyday tasks,” “There are well-defined job descriptions for most people working in the company,” and “Written reports are often required for everyday work.” We paraphrased the items with three leading sentences to measure individual preferences (α = .68), perceived job formalization (α = .82), and satisfac-tion (α = .86) with formalization. Thus, the three variables were commensurate and allowed a direct test of how their congruence predicted satisfaction (Caplan, 1987; Edwards, 1994).
Organizational commitment. We used four items from the Organization Commitment Questionnaire (Mowday, Steers, & Porter, 1979) to measure organizational commitment, focusing on the affective dimension (Allen & Meyer, 1990). The items were “I present this company to my friends as a great place to work,” “I am proud to tell others that I am part of this company,” “This company really inspires me to perform my job to the best of my abil-ity,” and “I really care about the fate of this company” (α = .82).
Power distance (country level). We used Hofstede’s (2001) PD index to group respondents from high- and low-PD countries. The Hofstede measures have shown good stability, given that they correlate strongly with other recent PD measures (e.g., those of van der Vegt, Van de Vliert, & Huang, 2005, r = .65, p < .001, and Carl, Gupta, & Javidan, 2004, r = .57, p < .01).
We created two high-PD groups and one low-PD group. We kept Taiwan separate to deter-mine whether the results from the high-PD European countries replicated those of Taiwan (and thus ensure that differences were due to PD and not to other cultural variables). The three groups were (a) Taiwan (n = 577) and (b) France and Italy (total n = 84), constituting the two high-PD groups, and (c) Germany, the United Kingdom, and the Netherlands (n = 111), which constituted the low-PD group.
Power distance (individual level). We used four items from the Cultural Perspectives Questionnaire (CPQ; see Maznevski et al., 2002) to check the validity of our PD group cat-egorization. Sample items were “People at higher hierarchical levels should make most of the important decisions for people below them” and “People at lower hierarchical levels should carry out the decisions of people at higher levels” (α = .65).
Control variables. These included age, gender, education level, seniority, and job level.
Results
Refer to Table 2 for descriptive statistics and correlations. On average, personal preference for formalization is slightly higher than perceived reality. Correlations among the variables were generally modest, except for higher correlations between perceived reality and satisfaction.
at Universidad de Navarra-Biblioteca on March 2, 2012jom.sagepub.comDownloaded from

Lee, Antonakis / Power Distance and Person–Job Fit 15
Country Groupings Classification
Controlling for measured covariates, planned contrasts indicated that the means of Taiwan (4.08) and the European high-PD group (3.93) on individual-level PD were significantly higher than the mean of the European low-PD group (3.54), F(2,724) = 299.46, p < .001. The means of the Taiwan and the European high-PD group did not differ and were each signifi-cantly higher than the mean of the European low-PD group. Also, mean PD country-level CPQ scores strongly correlated (Spearman ρ = .93, p < .01) with Hofstede’s (2001) PD mea-sure, justifying our PD groupings.
Confirmatory Factor Analysis
We first estimated a confirmatory factor analysis (CFA) model to test the construct valid-ity of the three job formalization measures (i.e., preference, perceived reality, and degree of satisfaction). We modeled the parallel nature of the items by including three method factors akin to a multitrait multimethod model. That is, we constrained the items of each job formal-ization factor to load on its respective theoretical factor; concurrently, we constrained each parallel item to load on a latent method factor, to capture the common variance inherent in the parallel items. Modeling this method variance in an a priori manner is not only justifiable but also necessary (Brown, 2006).
Furthermore, because of possible omitted variable bias and sample heterogeneity, which may correlate with the measures and affect model fit and parameter estimates (Antonakis, Bendahan, Jacquart, & Lalive, 2010; Muthén, 1989)—we partialled out the effect of the control variables from the model (i.e., regressed the factors on the control variables), using Mplus’s robust weighted least squares (WLSMV) estimator (Muthén, du Toit, & Spisic, in
Table 2Descriptive Statistics and Correlations for Measures of Perceived
Job Formalization, Personal Preference, Satisfaction, Organizational Commitment, and Individual-Level Power-Distance Orientation
M SD 1 2 3 4 5 6 7
1. Perceived reality 3.78 0.892. Personal preference 4.49 0.71 .34***3. Satisfaction 3.77 0.91 .79a*** .23***4. Organizational commitment 4.79 0.82 .41*** .11** .50***5. Individual-level power distance 3.99 0.77 .20*** .21*** .18*** .19***6. Age 33.38 6.73 .01 –.05 .04 .15*** .17***7. Male (=1, else = 0) 0.62 0.49 .08 .00 .09 .03 .09* .12**8. Seniority 5.11 5.25 .03 .01 .04 .12*** .18*** .56*** –.06
Note: N = 772.a. Although the correlation with perceived reality may seem high, the standardized partial correlation, when controlling for the rest of the quadratic polynomial terms and the control variables, is actually .57.*p < .05.**p < .01 ***p < .001.
at Universidad de Navarra-Biblioteca on March 2, 2012jom.sagepub.comDownloaded from
16 Journal of Management / Month XXXX
press). This multiple indicator, multiple causes (MIMIC) approach is computationally sim-pler than multiple-groups analyses, particularly in the case of multiple categorical and con-tinuous covariates.
The CFA for the formalization measures showed good fit: χ2(df = 100) = 120.12, p < .10, comparative fit index (CFI) = 1.00, root mean square error of approximation (RMSEA) = .02; however, one of the formalization items (“Written reports are often required for every-day work”) failed to load significantly on one factor (standardized λ = –.04) and had a low loading on another factor (standardized λ =.15). We thus removed this item, and the new model had excellent fit:3 χ2(df = 54) = 54.66, p > .10, CFI = 1.00, RMSEA = .00 (mean stan-dardized λs = .72); note, we predicted 33.77% of the variance in the latent factors using the controls (i.e., the MIMIC procedure). As for the organizational commitment factor, alone it exhibited the following fit: χ2(df = 44) = 61.19, p = .045, CFI = 1.00, RMSEA = .02 (mean standardized λs = .87). We then included all factors together in a CFA to provide an idea of the model fit and loadings: χ2(df = 128) = 315.90, p < .001, CFI = .99, RMSEA = .05; mean standardized loadings for organizational commitment items remained high (mean λs = .78) as did those for the formalization items for the substantive factor (mean λs = .67). Given our theory (and fit statistics), this model is, however, misspecified because it ignores the qua-dratic and interaction effects of the formalization factors on commitment (see next section).
Structural Model
We could not estimate a full SEM model—even with Mplus, which has advanced proce-dures for such models with latent-level interactions—because to model the nonlinear interac-tions required seven dimensions of integration (and the program could not estimate it); thus, we averaged the items of the measures and estimated the structural model using Stata. Although we did not model measurement error (which attenuates estimates), we took advan-tage of the postestimation routines of Stata to examine the response surfaces in a more nuanced way.
Hypotheses Testing
With respect to Hypothesis 1, which states that both preferred and perceived formalization will be higher in a high-PD culture, we simultaneously compared the means of perceived formalization and personal preference on formalization across the PD groupings. We con-ducted planned contrasts and included the control variables; we used a robust maximum likelihood multivariate regression estimator. Results indicated that Taiwan and the European high-PD group had significantly higher levels of perceived formalization (observed mean = 2.61)as well as preferred formalization (observed mean = 3.44) than did the European low-PD group (observed means were 2.34 and 3.05, respectively), χ2(2) = 52.10, p < .001. The Euro-pean high-PD group was significantly higher (marginally) than the low-PD group for both measures, χ2(2) = 5.22, p = .07. Furthermore, the European low-PD group was significantly lower on both measures than the Taiwan group, χ2(2) = 68.83, p < .001. This result supports Hypothesis 1.
at Universidad de Navarra-Biblioteca on March 2, 2012jom.sagepub.comDownloaded from
Lee, Antonakis / Power Distance and Person–Job Fit 17
Table 3Results of Two-Stage Least Square Regression
First-Stage Results
Job Satisfaction as DV
High PD Taiwan
(n = 577)
High PD FR + IT (n = 84)
Low PD UK + NL + D
(n = 111)
Control variables Male Included Included Included Education dummies Included Included Included Job-level dummies Included Included Included Seniority Included Included Included Age Included Included Included Constant 3.49*** 3.50*** 3.97***Target variables Perceived job formalization, b1(X) .72*** .58*** .37** Personal preference, b2(Z) .05 .09 .37* b3(X
2) .01 –.09 –.09 b4(X×Z) .12* .05 .60*** b5(Z
2) –.07 –.04 –.22*F 82.01 9.53 6.38R2 .69*** .71*** .53***
Second-Stage Results
Organizational Commitment as DV
High PD Taiwan
(n = 577)
High PD FR + IT (n = 84)
Low PD UK + NL + D
(n = 111)
Control variables Male Included Included Included Education dummies Included Included Included Job-level dummies Included Included Included Seniority Included Included Included Age Included Included Included Constant 2.57*** 2.82** 2.53**Target variable Job satisfaction .51*** .53** .64***F 20.42 2.91 3.59R2 .33*** .15** .28***Overidentification test, Hansen χ2(4) 7.72 5.70 8.79
Note: DV = dependent variable; PD = power distance; FR = France; IT = Italy; UK = United Kingdom; NL = Netherlands; D = Germany.*p < .05.**p < .01.***p < .001.
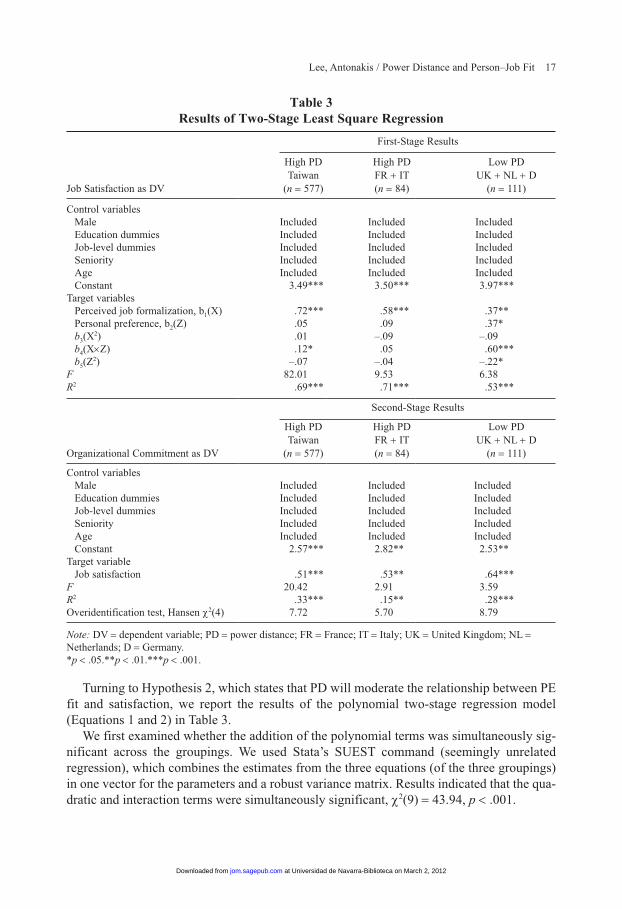
Turning to Hypothesis 2, which states that PD will moderate the relationship between PE fit and satisfaction, we report the results of the polynomial two-stage regression model (Equations 1 and 2) in Table 3.
We first examined whether the addition of the polynomial terms was simultaneously sig-nificant across the groupings. We used Stata’s SUEST command (seemingly unrelated regression), which combines the estimates from the three equations (of the three groupings) in one vector for the parameters and a robust variance matrix. Results indicated that the qua-dratic and interaction terms were simultaneously significant, χ2(9) = 43.94, p < .001.
at Universidad de Navarra-Biblioteca on March 2, 2012jom.sagepub.comDownloaded from

18 Journal of Management / Month XXXX
Next, we examined whether the partial coefficients of the fit measures differed across the groups; using Stata’s SUEST command, we simultaneously tested the difference in regression coefficients b1, b2, b3, b4, and b5 (for the measures X, Z, X 2, XZ, and Z 2 in Equation 1), respec-tively, across the three groups. The coefficients were significantly different (see Table 4). We then made similar comparisons among the regression estimates of the following pairs, respec-tively: Between the two high-PD groups, between Taiwan and the European low-PD group, and between the European high- and low-PD groups. The test showed that there was no sig-nificant difference between the sets of regression estimates of the two high-PD groups. How-ever, the coefficients of the low-PD group were significantly different to both the high-PD groups. The results suggested that the data of individuals from high- and low-PD cultures did not demonstrate the same fit patterns; also, the results from the two high-PD groups were essentially the same. Thus, Hypothesis 2 was supported.
Similarly, we tested whether the second-stage regression estimates regarding the impact of satisfaction on organizational commitment were equal across the three groups, posited in Hypothesis 3, following the procedures suggested by Clogg, Petkova, and Haritou (1995). Consistent with our expectations, the coefficients were significantly positive and were not significantly different across the three cultural groups. Hypothesis 3 was thus supported. Note too that the effects (of fit) we observed on satisfaction with structuring were channeled to organizational commitment via satisfaction in all groups, as the results of robust Sobel (1982) tests indicated.
To better interpret the nature of the quadratic polynomial regression models, we graphed the response surfaces of the estimated models for the three cultural groups (Figures 3, 4, and 5; refer to Table 1 for specific hypotheses and expected results regarding Hypotheses 2a, 2b, 2c, and 2d). We report the slopes and curvatures of lines of interest at particular points of the scale (Table 5). As expected, the response surface for the low-PD group (Germany, the United
Table 4Tests on the Equality of Structural Coefficients Across Groups
Comparison of the first-stage regression
coefficients (X, Z, X2, XZ, Z2 as IV, Sat
as DV)
Comparison of the second-stage regression coefficients (Sat as IV,
OrgCom as DV)
Groups of Comparisons df χ2 Difference z
TW (high PD) vs. FR and IT (high PD) vs. D and UK and NL (low PD)
10 30.85*** – –
TW (high PD) vs. FR and IT (high PD) 5 8.96 –.02 –.14TW (high PD) vs. D and UK and NL (low PD) 5 18.28** –.14 –.81FR and IT (high PD) vs. D and UK and NL (low PD) 5 22.62*** –.11 .48
Note: X = perceived job formalization; Z = personal preference; IV = independent variable; DV = dependent variable; Sat = satisfaction on job formalization; OrgCom = organizational commitment; TW = Taiwan; FR = France; IT = Italy; D = Germany; UK = United Kingdom; NL = Netherlands; PD = power distance.**p < .01.***p < .001.
at Universidad de Navarra-Biblioteca on March 2, 2012jom.sagepub.comDownloaded from
Lee, Antonakis / Power Distance and Person–Job Fit 19
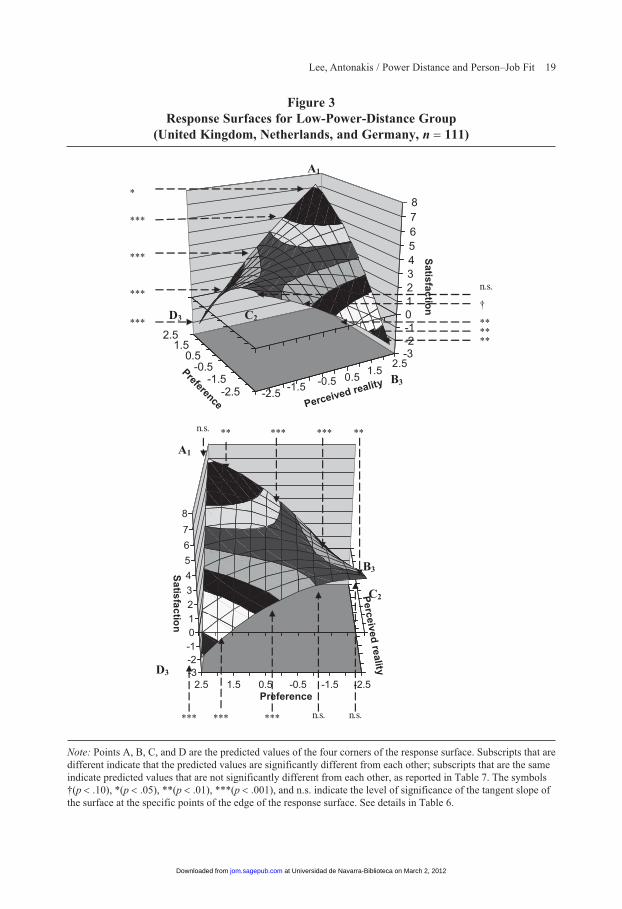
Figure 3Response Surfaces for Low-Power-Distance Group
(United Kingdom, Netherlands, and Germany, n = 111)
-2.5-1.5
-0.50.5
1.52.5
-3-2-1012345678
Satisfaction
Preference
2.5
-2.5
1.5-1.5
0.5-0.5
Perceived reality
-2.5-1.5-0.50.51.52.5-3-2-1012345678
Satisfaction
Perceived reality
Preference
A1
B3
C2D3
B3
C2
D3
n.s.
†
****
**
*
***
***
***
***
**n.s. ***
*** *** *** n.s. n.s.
*** **
A1
Note: Points A, B, C, and D are the predicted values of the four corners of the response surface. Subscripts that are different indicate that the predicted values are significantly different from each other; subscripts that are the same indicate predicted values that are not significantly different from each other, as reported in Table 7. The symbols †(p < .10), *(p < .05), **(p < .01), ***(p < .001), and n.s. indicate the level of significance of the tangent slope of the surface at the specific points of the edge of the response surface. See details in Table 6.
at Universidad de Navarra-Biblioteca on March 2, 2012jom.sagepub.comDownloaded from

20 Journal of Management / Month XXXX
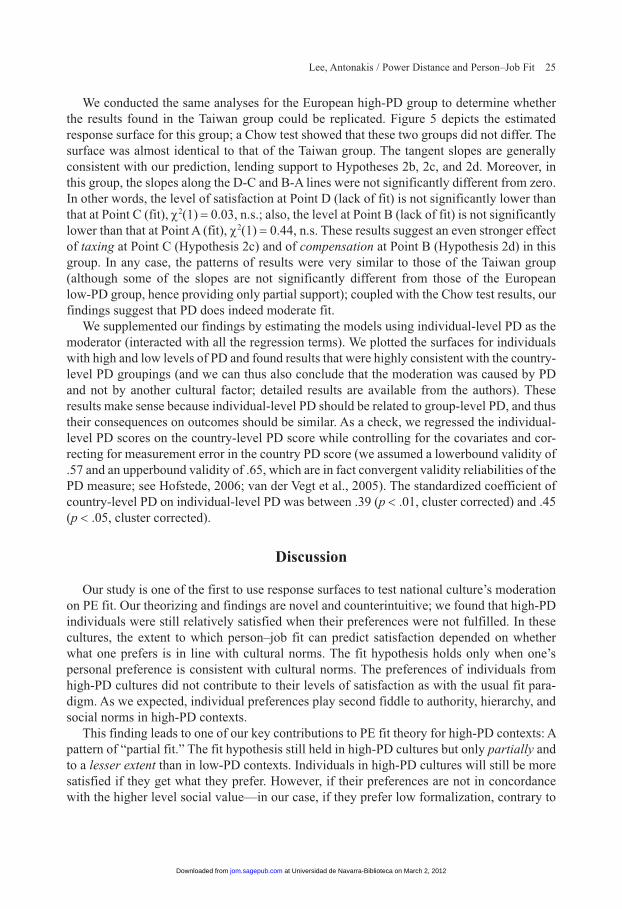
Figure 4Response Surfaces for High-Power-Distance Group 1 (Taiwan, n = 577)
-2.5-1.5
-0.50.5
1.52.5
0
1
2
3
4
5
6
Satisfaction
Preference
2.5
-2.5
1.5-1.5
0.5-0.5
Perceived reality-2.5-1.5
-0.50.5
1.52.5
-2.5-1.5-0.50.51.52.50
1
2
3
4
5
6
Satisfaction
Perceived reality
Preference
A1
B2
C3
D4
A1
B2
C3
D4
†
†
†
*
*
***
***
***
***
***
†*** n.s.n.s.
†n.s.n.s. † †
Note: Points A, B, C, and D are the predicted values of the four corners of the response surface. Subscripts that are different indicate that the predicted values are significantly different from each other; subscripts that are the same indicate predicted values that are not significantly different from each other, as reported in Table 7. The symbols †(p <. 10), *(p < .05), **(p < .01), ***(p < .001), and n.s. indicate the level of significance of the tangent slope of the surface at the specific points of the edge of the response surface. See details in Table 6.
at Universidad de Navarra-Biblioteca on March 2, 2012jom.sagepub.comDownloaded from

Lee, Antonakis / Power Distance and Person–Job Fit 21
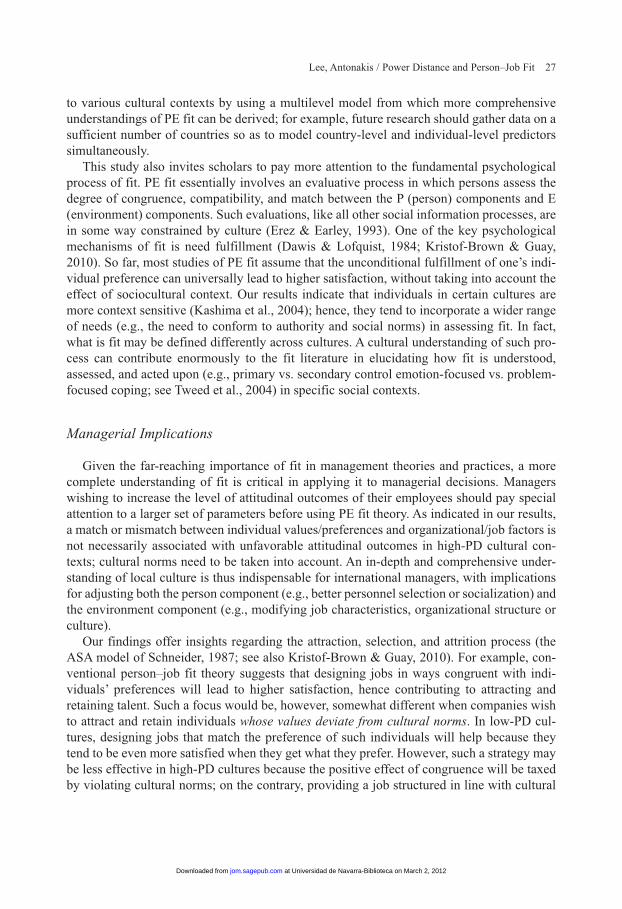
Figure 5Response Surfaces for High-Power-Distance Group 2 (France and Italy, n = 84)
Perceived reality-2.5-1.5
-0.50.5
1.52.5
00.511.522.533.544.55
Satisfaction
Preference
2.5
-2.5
1.5-1.5
0.5-0.5
-2.5-1.5-0.50.51.52.50
0.5
1
1.5
2
2.5
3
3.5
4
4.5
5
Satisfaction
Perceived reality
Preference
C2
A1
B1
D2
A1
B1
C2D2
*
n.s.
*
n.s.
n.s.
n.s.
n.s.
***
***
**
n.s.n.s. n.s. n.s. n.s.
n.s.n.s. n.s. n.s. n.s.
Note: Points A, B, C, and D are the predicted values of the four corners of the response surface. Subscripts that are different indicate that the predicted values are significantly different from each other; subscripts that are the same indicate predicted values that are not significantly different from each other, as reported in Table 7. The symbols †(p < .10), *(p < .05), **(p < .01), ***(p < .001), and n.s. indicate the level of significance of the tangent slope of the surface at the specific points of the edge of the response surface. See details in Table 6.
at Universidad de Navarra-Biblioteca on March 2, 2012jom.sagepub.comDownloaded from

22 Journal of Management / Month XXXX
Kingdom, and the Netherlands) demonstrated support for the symmetric PE fit hypothesis. The surface in Figure 3 is in fact consistent in form with our predictions in Figure 1B in that congruence between individual preference and organizational formalization leads to higher satisfaction. More specifically, satisfaction increased as perceived formalization became more congruent with preference, attaining its highest point around the line of congruence (i.e., X – Z = 0, or the C-A line in the figure). Satisfaction decreased as perceived formaliza-tion exceeded (i.e., toward Point B) or was less than (i.e., toward Point D) the preference. The curvature was significantly negative at X = 0 along the line X = –Z (b3 – b4 + b5 = –.92, p < .001), indicating that the surface is curved downward. This inversed U-shaped surface lends support to the conventional functional form of the fit hypothesis for the low-PD group.
To examine the functional form with further precision, we also tested the tangent slopes along the four borderlines of the surface (Table 6; see Appendix A for explanations on this procedure); we indicate the level of significance in Figure 3. These tests allow us to specifi-cally examine the nature of the fitted response surface at particular points. For example, moving from Point D (i.e., lack of fit) to Point A (i.e., fit), the slope is significantly positive at each point, indicating that individuals preferring high formalization had increasing satis-faction as they receive more of it. Similarly, the slopes of the B-A, C-B, and C-D lines are consistent with our prediction (Table 6). Moreover, satisfaction was higher when both prefer-ence and perceived formalization were high (i.e., when the organization is structured in a more formalized way) than when both were low; that is, the slope of the C-A line in Figure 3 was significantly positive (b1 + b2 = 0.73, p < .001), consistent with previous studies applying the polynomial regression method (Kristof-Brown & Guay, 2010; Kristof-Brown et al., 2005).
We further tested whether the predicted values of the four corner points on the response surfaces differed (Table 7; see Appendix B for explanations on this procedures). These results also show that the level of satisfaction at Point A is significantly higher than at Point C, both points of fit, χ2(1) = 15.48, p < .001. Point C in turn is higher than Points B and D, both points of lack of fit, χ2(1) = 7.76, p < .01, and χ2(1) = 15.23, p < .001, respectively. In sum, congru-ence generally leads to higher satisfaction. These results thus support Hypothesis 2a:
Table 5Slope and Curvature of the Surfaces Along Lines of Interests
Along X = Z Line Along X = –Z Line
Slope (b1 + b2)
Curvature (b3 + b4 + b5)
Slope (b1–b2)
Curvature (b3–b4 + b5)
High PDTaiwan
.77*** .06 .68*** –.18†
High PDFR + IT
.67*** –.08 .49* –.17
Low PDUK + NL + D
.73*** .28† –.00 –.92***
Note: PD = power distance; FR = France; IT = Italy; UK = United Kingdom; NL = Netherlands; D = Germany.†p < .10. *p < .05. ***p < .001.
at Universidad de Navarra-Biblioteca on March 2, 2012jom.sagepub.comDownloaded from

Lee, Antonakis / Power Distance and Person–Job Fit 23
Table 7Tests on the Equality Between Predicted Values on the Response Surfaces
High PD Taiwan
High PD FR + IT
Low PD UK + NL + D
Predicted Value at Specific Point
Points on the response surface
A 5.84 4.73 7.18 B 4.13 3.70 –2.19 C 1.99 1.40 3.52 D 0.75 1.24 –2.19
Test of Equality Between Predicted Values, χ2(1)
Along the edges of surfaces A vs. B 3.49† 0.44 18.08*** B vs. C 4.42* 1.94 7.76** C vs. D 3.52† 0.03 15.23*** D vs. A 165.51*** 20.76*** 43.88***
Along diagonal lines A vs. C 80.16*** 21.54*** 15.48*** B vs. D 25.95*** 5.56* 0.00
Note:Predicted values include the intercept and all controls at their mean values. PD = power distance; FR = France; IT = Italy; UK = United Kingdom; NL = Netherlands; D = Germany. †p < .10.*p < .05. **p < .01. ***p < .001.
Table 6Wald Tests for Slopes of Tangents Along the Edges of Response Surfaces
When Z (preference) = –2,5 When Z (preference) = +2,5Corresponding point on the response surface C B D A
Perceived reality X = –2.5 X = –1.5 X = 0 X = 1.5 X = 2.5 X = –2.5 X = –1.5 X = 0 X = 1.5 X = 2.5
High-PDTaiwan
0.36† 0.39* 0.43* 0.47† 0.49† 0.95*** 0.98*** 1.02*** 1.06*** 1.08***
High PDFR + IT
0.88* 0.71* 0.46 0.20 0.03 1.12** 0.95*** 0.70*** 0.44 0.27
Low PDUK + NL + D
–0.67 –0.86† –1.14** –1.42** –1.61** 2.34*** 2.16*** 1.87*** 1.59*** 1.40*
When X (perceived reality) = –2,5 When X (perceived reality) = +2,5Corresponding point on the response surface C D B A
Personal preference Z = –2.5 Z = –1.5 Z = 0 Z = 1.5 Z = 2.5 Z = –2.5 Z = –1.5 Z = 0 Z = 1.5 Z = 2.5
High PDTaiwan
0.12 –0.03 –0.25† –0.46** –0.61* 0.71† 0.56† 0.34† 0.12 –0.03
High PDFR + IT
0.18 0.10 –0.03 –0.16 –0.25 0.42 0.34 0.21 0.08 –0.01
Low PDUK + NL + D
–0.02 –0.47 –1.14*** –1.81*** –2.26*** 3.00** 2.55*** 1.88*** 1.20** 0.75
Note: Entries in the table are simple slopes along the corresponding lines at the specific point noted. PD = power distance; FR = France; IT = Italy; UK = United Kingdom; NL = Netherlands; D = Germany.†p < .10. *p < .05. **p < .01. ***p < .001.
at Universidad de Navarra-Biblioteca on March 2, 2012jom.sagepub.comDownloaded from

24 Journal of Management / Month XXXX
Satisfaction in low-PD contexts depends on increasing congruence, with highest satisfaction when congruence is at high rather than at low levels.
Refer to the response surface for the Taiwan and European high-PD groups (Figures 4 and 5), which are similar in form to our prediction shown in Figure 2. Regarding the results for Taiwan, individuals were most satisfied when they preferred high levels of formalization and received high levels of formalization (i.e., there is fit, Point A). If they preferred formal-ization and did not obtain it (i.e., there is lack of fit,Point D), they were most dissatisfied. The curvature of the surface along the line of incongruence (b3 – b4 + b5) is marginally negative and less significant than that of the low-PD group, χ2(1) = 11.95, p < .001(Bonferroni-corrected test, given that we tested the three groups against each other); this result indicates that satisfaction is higher along the line of congruence. The conventional fit pattern held for this part of the figure. The significant positive tangent slopes along the D-A lines (Table 6) and, given that Point A is higher than Point D, χ2(1) = 165.51, p < .001 (Table 7), also cor-roborated this view. Individuals were generally more satisfied when they received higher formalization (i.e., the slope of the C-A line in Figure 4 was significantly positive, b1 + b2 = 0.77, p < .001). Such results support Hypothesis 2b: When preferences are consistent with cultural norms, increasing congruence predicts satisfaction, with highest satisfaction at high rather than at low levels of congruence.
Contrarily, the fit phenomenon looked different at the other parts of the figure (i.e., toward line C-B, where preferences were in conflict with cultural norms). Individuals preferring low formalization and receiving low formalization (i.e., at Point C, indicating fit) were still more satisfied than those experiencing lack of fit at Point D (the slopes from C to D indicate a significant decrease; see Table 6). However, these negative slopes are weaker in terms of both magnitude and significance in comparison with those of the low-PD group—that is, the slopes at line C-D between the two groups are simultaneously and significantly different, χ2(2) = 10.74, p < .01. Furthermore, the level of satisfaction at Point C is only slightly higher than that at Point D, χ2(1) = 3.52, p < .10. These results provide support for Hypothesis 2c: In high-PD cultures in the case when individuals do not prefer much formalization (i.e., when preferences are inconsistent with cultural norms), congruence predicts only slightly higher satisfaction than when there is lack of congruence.
Similarly, individuals preferring low formalization yet receiving high formalization (i.e., at Point B, indicating lack of fit) were only slightly less satisfied than those at Point A where there is fit: The tangent slopes of the B-A line are also weaker in terms of both magnitude and significance in comparison with those of the low-PD group—that is, the slopes at line C-D between the two groups are simultaneously and significantly different, χ2(2) = 12.99, p < .01 (see Table 6). Also, the level of satisfaction at Point B is only marginally lower than that at Point A, χ2(1) = 3.49, p < .10. This result supports the theorized effect of secondary control to restore fit in an incongruent situation. Despite the lack of fit, these individuals (at Point B) are more satisfied than their counterparts at Point D, χ2(1) = 25.95, p < .001. Moreover, sat-isfaction at Point B (lack of fit) was even higher than that at Point C, where there is fit, χ2(1) = 4.42, p < .05; the tangent slopes along the C-B line were significantly positive, unlike the significantly negative C-B slopes in the low-PD group (see Table 6). Hypothesis 2d is sup-ported: In high-PD cultures in the case when individuals do not wish to receive much formal-ization, increasing incongruence predicts higher satisfaction (i.e., as formalization increases).
at Universidad de Navarra-Biblioteca on March 2, 2012jom.sagepub.comDownloaded from
Lee, Antonakis / Power Distance and Person–Job Fit 25
We conducted the same analyses for the European high-PD group to determine whether the results found in the Taiwan group could be replicated. Figure 5 depicts the estimated response surface for this group; a Chow test showed that these two groups did not differ. The surface was almost identical to that of the Taiwan group. The tangent slopes are generally consistent with our prediction, lending support to Hypotheses 2b, 2c, and 2d. Moreover, in this group, the slopes along the D-C and B-A lines were not significantly different from zero. In other words, the level of satisfaction at Point D (lack of fit) is not significantly lower than that at Point C (fit), χ2(1) = 0.03, n.s.; also, the level at Point B (lack of fit) is not significantly lower than that at Point A (fit), χ2(1) = 0.44, n.s. These results suggest an even stronger effect of taxing at Point C (Hypothesis 2c) and of compensation at Point B (Hypothesis 2d) in this group. In any case, the patterns of results were very similar to those of the Taiwan group (although some of the slopes are not significantly different from those of the European low-PD group, hence providing only partial support); coupled with the Chow test results, our findings suggest that PD does indeed moderate fit.
We supplemented our findings by estimating the models using individual-level PD as the moderator (interacted with all the regression terms). We plotted the surfaces for individuals with high and low levels of PD and found results that were highly consistent with the country-level PD groupings (and we can thus also conclude that the moderation was caused by PD and not by another cultural factor; detailed results are available from the authors). These results make sense because individual-level PD should be related to group-level PD, and thus their consequences on outcomes should be similar. As a check, we regressed the individual-level PD scores on the country-level PD score while controlling for the covariates and cor-recting for measurement error in the country PD score (we assumed a lowerbound validity of .57 and an upperbound validity of .65, which are in fact convergent validity reliabilities of the PD measure; see Hofstede, 2006; van der Vegt et al., 2005). The standardized coefficient of country-level PD on individual-level PD was between .39 (p < .01, cluster corrected) and .45 (p < .05, cluster corrected).
Discussion
Our study is one of the first to use response surfaces to test national culture’s moderation on PE fit. Our theorizing and findings are novel and counterintuitive; we found that high-PD individuals were still relatively satisfied when their preferences were not fulfilled. In these cultures, the extent to which person–job fit can predict satisfaction depended on whether what one prefers is in line with cultural norms. The fit hypothesis holds only when one’s personal preference is consistent with cultural norms. The preferences of individuals from high-PD cultures did not contribute to their levels of satisfaction as with the usual fit para-digm. As we expected, individual preferences play second fiddle to authority, hierarchy, and social norms in high-PD contexts.
This finding leads to one of our key contributions to PE fit theory for high-PD contexts: A pattern of “partial fit.” The fit hypothesis still held in high-PD cultures but only partially and to a lesser extent than in low-PD contexts. Individuals in high-PD cultures will still be more satisfied if they get what they prefer. However, if their preferences are not in concordance with the higher level social value—in our case, if they prefer low formalization, contrary to
at Universidad de Navarra-Biblioteca on March 2, 2012jom.sagepub.comDownloaded from

26 Journal of Management / Month XXXX
the social norms—they might still be comparatively satisfied when they get more structure. As argued earlier, we suggest that the mechanism that explains why they might still feel moderately satisfied is secondary control. This phenomenon can also be explained by the “carryover effect” mentioned by Edwards (1996); excess supplies in formalization help indi-viduals to fulfill other values and needs operating at the societal level (i.e., cultural fit). If they do get what they prefer (i.e., low formalization), the anxiety for having higher responsi-bility and for violating cultural norms—as illustrated by the example of a child getting ice cream forbidden by her parents—may reduce the level of satisfaction despite the congruence between personal preference and reality. PD thus moderates fit theory and turns it into a pat-tern of “partial fit” in high-PD contexts. We hope that our findings will influence fit theory to becoming a more contextually sensitive paradigm.
Theoretical Implications
As Edwards (2008) notes, PE fit theory lacks adequate consideration of boundary condi-tions. Despite the recent advances in PE fit theory and variations in functional forms of fit (Edwards & Shipp, 2007), few studies have provided systematical explanations for possible variations of functional forms across cultures. This article contributes to the refinement of PE fit theory by explicitly addressing one of its boundary conditions—national culture. Our results mimic the findings of Westerman and Vanka (2005), who observed that norms over-ride preferences when person–organization fit is concerned. We thus urge scholars to reex-amine possible cultural biases in basic assumptions undergirding fit theories, which assume that individuals are “largely independent and have freedom of choice” (Gelfand et al., 2008: 495).
Ignoring the possible effects of contextual factors provides an incomplete view of fit. Research has shown that judgments of satisfaction may be grounded primarily on intrapsy-chic experiences in some cultures, whereas they may be based more on social norms and obligations in others (Huang & Van de Vliert, 2003; Suh, Diener, Oishi, & Triandis, 1998). When the concept of self, control, and personal agency conveys different meanings to people from different cultures, their responses to PE fit may also differ. As Morling and Evered state, “People both influence their environments and adjust to them in a flexible blend that depends on culture and situation” (2007: 918). In fact, when faced with lack of fit, dissatisfaction may serve as an internal driver for individuals to change the situation (i.e., invoking primary con-trol; see Morling & Evered, 2006). However, in cultural contexts when individual agency is not emphasized, individuals exercise secondary control as a social adaptation mechanism.
Although individuals within one cultural setting may hold different values and prefer-ences (Au, 1999; Martin, 1992), these individuals are still exposed to the common societal values, which might influence their behavior (Salancik & Pfeffer, 1978). These two levels of values and preferences may coexist in the same person; they might also be structured in a hierarchical way and influence individuals’ reasoning and behavior. As in our example, in high-PD cultures social norms emphasizing the value of respecting rules and authority seem to override individual preferences in determining one’s satisfaction at work when there is a conflict of values between the two levels. Future research should extend PE fit applications
at Universidad de Navarra-Biblioteca on March 2, 2012jom.sagepub.comDownloaded from
Lee, Antonakis / Power Distance and Person–Job Fit 27
to various cultural contexts by using a multilevel model from which more comprehensive understandings of PE fit can be derived; for example, future research should gather data on a sufficient number of countries so as to model country-level and individual-level predictors simultaneously.
This study also invites scholars to pay more attention to the fundamental psychological process of fit. PE fit essentially involves an evaluative process in which persons assess the degree of congruence, compatibility, and match between the P (person) components and E (environment) components. Such evaluations, like all other social information processes, are in some way constrained by culture (Erez & Earley, 1993). One of the key psychological mechanisms of fit is need fulfillment (Dawis & Lofquist, 1984; Kristof-Brown & Guay, 2010). So far, most studies of PE fit assume that the unconditional fulfillment of one’s indi-vidual preference can universally lead to higher satisfaction, without taking into account the effect of sociocultural context. Our results indicate that individuals in certain cultures are more context sensitive (Kashima et al., 2004); hence, they tend to incorporate a wider range of needs (e.g., the need to conform to authority and social norms) in assessing fit. In fact, what is fit may be defined differently across cultures. A cultural understanding of such pro-cess can contribute enormously to the fit literature in elucidating how fit is understood, assessed, and acted upon (e.g., primary vs. secondary control emotion-focused vs. problem-focused coping; see Tweed et al., 2004) in specific social contexts.
Managerial Implications
Given the far-reaching importance of fit in management theories and practices, a more complete understanding of fit is critical in applying it to managerial decisions. Managers wishing to increase the level of attitudinal outcomes of their employees should pay special attention to a larger set of parameters before using PE fit theory. As indicated in our results, a match or mismatch between individual values/preferences and organizational/job factors is not necessarily associated with unfavorable attitudinal outcomes in high-PD cultural con-texts; cultural norms need to be taken into account. An in-depth and comprehensive under-standing of local culture is thus indispensable for international managers, with implications for adjusting both the person component (e.g., better personnel selection or socialization) and the environment component (e.g., modifying job characteristics, organizational structure or culture).
Our findings offer insights regarding the attraction, selection, and attrition process (the ASA model of Schneider, 1987; see also Kristof-Brown & Guay, 2010). For example, con-ventional person–job fit theory suggests that designing jobs in ways congruent with indi-viduals’ preferences will lead to higher satisfaction, hence contributing to attracting and retaining talent. Such a focus would be, however, somewhat different when companies wish to attract and retain individuals whose values deviate from cultural norms. In low-PD cul-tures, designing jobs that match the preference of such individuals will help because they tend to be even more satisfied when they get what they prefer. However, such a strategy may be less effective in high-PD cultures because the positive effect of congruence will be taxed by violating cultural norms; on the contrary, providing a job structured in line with cultural
at Universidad de Navarra-Biblioteca on March 2, 2012jom.sagepub.comDownloaded from
28 Journal of Management / Month XXXX
values but different from personal preferences may still work relatively well in attracting and retaining such employees because they will legitimize such designs and stay relatively satis-fied even if they do not get what they prefer.
Limitations and Suggestion for Future Research
Despite the contributions of our study, our results must be viewed in light of some limita-tions. First, because we collected data from the same source, common method bias represents a potential threat to the quality of the results. The risk of this bias should remain, however, acceptable for theoretical and methodological reasons. Theoretically, one way to avoid common source bias is to gather data at different points in time or to use different sources. These approaches, however, are possibly more limited than our approach. Gathering data in different time periods would be inadequate because some components of fit (e.g., supplies or preferences) may change as a function of time, thus affecting the fit components in a non-equivalent way, rendering spurious results. Thus, the relationship between fit and outcomes using a common source may reflect reality rather than artificial bias (see Caplan, 1987); it would not be possible, and indeed it would be meaningless, to use others’ ratings to measure a target individual’s preference, how the target sees reality, or how satisfied the target is (Crampton & Wagner, 1994).
On the methodological front, we explored the relationships between fit and outcomes by examining the response surface shapes as a function of culture rather than only looking at the correlations among variables; we also used strong controls that would be related to prefer-ences, satisfaction, and citizenship. If the response surfaces and their respective regression coefficients are moderated by culture in theoretically predictable ways, this result would suggest that respondents react differently to fit despite common source, common method variance (CSCMV). Also Siemsen, Roth, and Oliveira (2010) show that common method variance usually deflates rather than inflates quadratic and interaction effects. Hence, our study may be less susceptible to the problem of CSCMV. Furthermore, using Hofstede’s grouping of PD provided us with an external source of data, which reduced the problem of common source bias; given the models we estimated, it is very unlikely that these complex interactions were due to CSCMV (Evans, 1985). Nevertheless, future research might include separate measures (if it is theoretically defensible) and possibly model the dynamic nature of fit in longitudinal designs or use instrumental variables to purge variables from endogeneity bias (Antonakis et al., 2010).
Next, we grouped together different high-PD cultures for our grouping analyses. Although our results were supportive of this grouping procedure, future research should attempt to gather samples from a large variety of cultures to ascertain the extent to which our findings are replicated, especially in the context of a multilevel paradigm. Finally, we focused on one type (person–job) and one facet (job formalization) of fit, with one cultural value (PD) as a moderator; however, fit is multidimensional (Edwards & Shipp, 2007; Jansen & Kristof-Brown, 2006), thus limiting the generalizability of our results. Future research should broaden the scope of fit and explore other contextual factors beyond PD or even beyond national culture (Johns, 2001; Liden & Antonakis, 2009; Rousseau & Fried, 2001). Also, although we modeled only job formalization, we believe that constructs related to respect to authority (e.g., directive supervision, social distance, decision-making autonomy, bureaucracy) will yield similar fit patterns as a function of culture, having broader theoretical implications.
at Universidad de Navarra-Biblioteca on March 2, 2012jom.sagepub.comDownloaded from
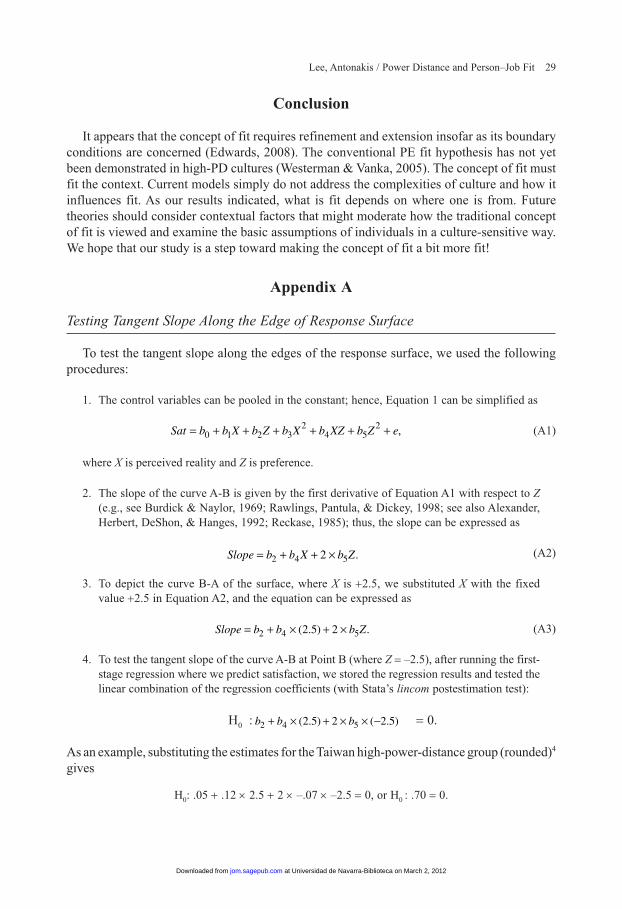
Lee, Antonakis / Power Distance and Person–Job Fit 29
Conclusion
It appears that the concept of fit requires refinement and extension insofar as its boundary conditions are concerned (Edwards, 2008). The conventional PE fit hypothesis has not yet been demonstrated in high-PD cultures (Westerman & Vanka, 2005). The concept of fit must fit the context. Current models simply do not address the complexities of culture and how it influences fit. As our results indicated, what is fit depends on where one is from. Future theories should consider contextual factors that might moderate how the traditional concept of fit is viewed and examine the basic assumptions of individuals in a culture-sensitive way. We hope that our study is a step toward making the concept of fit a bit more fit!
Appendix A
Testing Tangent Slope Along the Edge of Response Surface
To test the tangent slope along the edges of the response surface, we used the following procedures:
1. The control variables can be pooled in the constant; hence, Equation 1 can be simplified as
(A1)
where X is perceived reality and Z is preference.
2. The slope of the curve A-B is given by the first derivative of Equation A1 with respect to Z (e.g., see Burdick & Naylor, 1969; Rawlings, Pantula, & Dickey, 1998; see also Alexander, Herbert, DeShon, & Hanges, 1992; Reckase, 1985); thus, the slope can be expressed as
(A2)
3. To depict the curve B-A of the surface, where X is +2.5, we substituted X with the fixed value +2.5 in Equation A2, and the equation can be expressed as
(A3)
4. To test the tangent slope of the curve A-B at Point B (where Z = –2.5), after running the first-stage regression where we predict satisfaction, we stored the regression results and tested the linear combination of the regression coefficients (with Stata’s lincom postestimation test):
H0 : = 0.
As an example, substituting the estimates for the Taiwan high-power-distance group (rounded)4 gives
H0: .05 + .12 × 2.5 + 2 × –.07 × –2.5 = 0, or H0 : .70 = 0.
Sat b b X b Z b X b XZ b Z e= + + + + + +0 1 2 32
4 52 ,
Slope b b X b Z= + + ×2 4 52 .
Slope b b b Z= + × + ×2 4 52 5 2( . ) .
b b b2 4 52 5 2 2 5+ × + × × −( . ) ( . )
at Universidad de Navarra-Biblioteca on March 2, 2012jom.sagepub.comDownloaded from

30 Journal of Management / Month XXXX
Appendix A (continued)
Using the delta method (Oehlert, 1992) to approximate the variance of this estimate, we are then able to test whether the estimate differs from zero using a robust version of the Wald test.
5. We continued to test the slope at various points along the A-B line with Equation A3 (i.e., where Z = –1.5, 0, 1.5, and 2.5, moving from Point B to Point A), using the same procedure. As reported in Table 6, we obtained the tangent slope at five points along the A-B line of the response surface, as well as their level of significance.
Appendix B
Testing Equality Between Predicted Values of the Corner Points
To test the equality between predicted values of the corner points on the response surfaces, we used the procedures described below:
1. We estimated Equation 4, where Γrefers to the control variables listed in the appendix table.
(A4)
2. We used Stata’s margins to test whether the predicted values of the corner points on the response surfaces differed. For example, to test whether Points B and C differ (for the high-power-distance Taiwan group), we obtain predicted values of satisfaction at Point B (X = 2.5, Z= –2.5) and Point C (X = –2.5, Z = –2.5), holding constant the controls at their means:
Column 1Column 2 Column 3 Column 4 Column 5 Column 6
CoefficientMean of Controls
Values of IVs at B
Values of IVs at C
Predicted value at B Columns 1×3
Predicted value at C Columns 1×4
Perceived job formalization, b1(X) 0.72 – 2.50 –2.50 1.81 –1.81Personal preference, b2(Z) 0.05 – –2.50 –2.50 –0.12 –0.12b3(X
2) 0.01 – 6.25 6.25 0.08 0.08b4(X×Z) 0.12 – –6.25 6.25 –0.74 0.74b5(Z
2) –0.07 – 6.25 6.25 –0.46 –0.46
Control variables Column 1×2 Column 1×2
Male 0.05 0.59 – – 0.03 0.03Education Dummy Variable 2 0.02 0.11 – – 0.00 0.00Education Dummy Variable 3 0.02 0.67 – – 0.01 0.01Education Dummy Variable 4 0.04 0.17 – – 0.01 0.01Job Level Dummy 2 –0.02 0.26 – – 0.00 0.00Job Level Dummy 3 0.11 0.10 – – 0.01 0.01Job Level Dummy 4 0.17 0.03 – – 0.01 0.01Seniority 0.00 5.45 – – –0.01 –0.01Age 0.00 33.05 – – 0.01 0.01Constant 3.49 – – – 3.49 3.49
Sum predicted value 4.13 1.99
3. Using the delta method (Oehlert, 1992) to approximate the variance of this estimate, we are then able to test whether the two predicted values differ from each other, using a robust version of the Wald test.
Sat b b X b Z b X b XZ b Z ekk
c
= + + + + + + +=
∑0 1 2 32
4 52
1
Γ .
at Universidad de Navarra-Biblioteca on March 2, 2012jom.sagepub.comDownloaded from

Lee, Antonakis / Power Distance and Person–Job Fit 31
Notes
1. For the purpose of this study (a) the reference point for actual formalization was the organization (i.e., the “environment” component of fit) as observed by the individual, (b) for personal preferences for formalization (i.e., the “person” component of fit) the reference point is the individual, and (c) for satisfaction with fit we refer to satisfaction for formalization. As discussed later, we used individual and country-level power distance (PD)—which taps respect for authority—as a moderator of the fit pattern.
2. We acknowledge that other cultural dimensions such as collectivism also shape one’s self-concept (Markus & Kitayama, 1991). Yet we contend that it is PD that moderates person–job fit because collectivism refers to defer-ence to one’s in-group, group goals, and interdependence; however, PD refers to deference to authority, which is more relevant to job design. Empirically we also conducted analysis with collectivism at both the individual level and the country level and did not find significant results as we did with PD.
3. Note when using the robust weighted least squares (WLSMV) estimator, the MPlus program adjusts the degrees of freedom, which are not calculated in the same way as with normal theory maximum likelihood estimation.
4. The exact values (to four decimal places) are .0474 + (.1177) × (2.5) + (2) × (–.0736) × (–2.5) = .70965 (which corresponds to the rounded value of .71 we report in Table 6).
References
Adler, P. S., & Borys, B. 1996. Two types of bureaucracy: Enabling and coercive. Administrative Science Quarterly, 41: 61-89.
Agarwal, S. 1993. Influence of formalization on role stress, organizational commitment, and work alienation of salespersons: A cross-national comparative study. Journal of International Business Studies, 24: 715-739.
Alexander, R., Herbert, G., DeShon, R., & Hanges, P. 1992. An examination of least-squares regression modeling of catastrophe theory. Psychological Bulletin, 111: 366-379.
Allen, N. J., & Meyer, J. P. 1990. The measurement and antecedents of affective, continuance and normative com-mitment to the organization. Journal of Occupational Psychology, 63: 1-18.
Antonakis, J., Bendahan, S., Jacquart, P., & Lalive, R. 2010. On making causal claims: A review and recommenda-tions. Leadership Quarterly, 21: 1086-1120.
Au, K. Y. 1999. Intra-cultural variation: Evidence and implications for international business. Journal of International Business Studies, 30: 799-812.
Bacharach, S. B. 1989. Organizational theories: Some criteria for evaluation. Academy of Management Review, 14: 496-515.
Baumeister, R. F., & Heatherton, T. F. 1996. Self-regulation failure: An overview. Psychological Inquiry, 7(1): 1-15.Bond, M. H., & Smith, P. B. 1996. Cross-cultural social and organizational psychology. Annual Review of
Psychology, 47: 205-235.Brown, T. A. 2006. Confirmatory factor analysis for applied research. New York: Guilford Press.Burdick, D. S., & Naylor, T. H. 1969. Response surface methods in economics. Review of the International
Statistical Institute, 37:18-35.Burger, J. M. 1989. Negative reactions to increases in perceived personal control. Journal of Personality and Social
Psychology, 56: 246-256.Caplan, R. D. 1983. Person–environment fit: Past, present and future. In C. L. Cooper (Ed.), Stress research: Issues
for the eighties: 35-78. Chichester, UK: Wiley.Caplan, R. D. 1987. Person–environment fit theory: Commensurate dimensions, time perspectives, and mechanisms.
Journal of Vocational Behavior, 31: 248–267Carl, D., Gupta, V., & Javidan, M. 2004. Power distance. In R. J. House, P. J. Hanges, M. Javidan, P. W. Dorfman,
& V. Gupta (Eds.), Culture, leadership, and organizations: The GLOBE study of 62 societies: 513-563. Thousand Oaks, CA: Sage.
Carless, S. A. 2005. Person–job fit versus person–organization fit as predictors of organizational attraction and job acceptance intentions: A longitudinal study. Journal of Occupational and Organizational Psychology, 78: 411-429.
at Universidad de Navarra-Biblioteca on March 2, 2012jom.sagepub.comDownloaded from

32 Journal of Management / Month XXXX
Chow, G. C. 1960. Tests of equality between sets of coefficients in two linear regressions. Econometrica, 28: 591-605.Clogg, C. C., Petkova, E., & Haritou, A. 1995. Statistical methods for comparing regression coefficients between
models. American Journal of Sociology, 100: 1261-1293.Conway, T. L., Vickers, R. R., & French, J. R. 1992. An application of person–environment fit theory: Perceived
versus desired control. Journal of Social Issues, 48: 95-107.Crampton, S. M., & Wagner, J. A. 1994. Percept–percept inflation in microorganizational research: An investigation
of prevalence and effect. Journal of Applied Psychology, 79: 67-76.Dawis, R. V., & Lofquist, L. H. 1984. A psychological theory of work adjustment. Minneapolis: University of
Minnesota Press.Dickson, M. W., Den Hartog, D. N., & Mitchelson, J. K. 2003. Research on leadership in a cross-cultural context:
Making progress, and raising new questions. Leadership Quarterly, 14: 729-768.Dubin, R. 1978. Theory building. New York: Free Press.Edwards, J. R. 1994. The study of congruence in organizational behavior research: Critique and a proposed alterna-
tive. Organizational Behavior and Human Decision Processes, 58: 51-100.Edwards, J. R. 1996. An examination of competing versions of the person–environment fit approach to stress.
Academy of Management Journal, 39: 292-339.Edwards, J. R. 2008. Person–environment fit in organizations: An assessment of theoretical progress. Academy of
Management Annals, 2:167-230.Edwards, J. R., & Berry, J. W. 2010. The presence of something or the absence of nothing: Increasing theoretical
precision in management research. Organizational Research Methods, 13: 668-689.Edwards, J. R., Cable, D. M., Williamson, I. O., Lambert, L. S., & Shipp, A. J. 2006. The phenomenology of fit:
Linking the person and environment to the subjective experience of person–environment fit. Journal of Applied Psychology, 91: 802-827.
Edwards, J. R., & Harrison, R. V. 1993. Job demands and worker health: Three-dimensional reexamination of the relationship between person–environment fit and strain. Journal of Applied Psychology, 78: 628-648.
Edwards, J. R., & Rothbard, N. P. 1999. Work and family stress and well-being: An examination of person–environment fit in the work and family domains. Organizational Behavior and Human Decision Processes, 77: 85-129.
Edwards, J. R., & Shipp, A. J. 2007. The relationship between person–environment fit and outcomes: An integrative theoretical framework. In C. Ostroff & T. A. Judge (Eds.), Perspectives on organizational fit: 209-258. New York: Lawrence Erlbaum.
Erez, M. 2010. Culture and job design. Journal of Organizational Behavior, 31: 389-400.Erez, M., & Earley, P. C. 1987. Comparative analysis of goal-setting strategies across cultures. Journal of Applied
Psychology, 72: 658-665.Erez, M., & Earley, P. C. 1993. Culture, self-identity, and work. New York: Oxford University Press.Evans, M. G. 1985. A Monte Carlo study of the effects of correlated method variance in moderated multiple regres-
sion analysis. Organizational Behavior and Human Decision Processes, 36: 305-323.Eylon, D., & Au, K. Y. 1999. Exploring empowerment cross-cultural differences along the power distance dimen-
sion. International Journal of Intercultural Relations, 23: 373-385.Folkman, S., & Lazarus, R. S. 1988. Coping as a mediator of emotion. Journal of Personality and Social
Psychology, 54: 466-475.Fredrickson, J. W. 1986. The strategic decision process and organizational structure. Academy of Management
Review, 11: 280-297.Frink, D. D. Klimoski, R. J. 1998. Toward a theory of accountability in organizations and human resources manage-
ment. Research in Personnel and Human Resources Management, 16: 1-51.Galbraith, J. R. 1977. Organization design. London: Addison-Wesley.Gelfand, M. J., Erez, M., & Aycan, Z. 2007. Cross-cultural organizational behavior. Annual Review of Psychology,
58: 479-514.Gelfand, M. J., Leslie, L. M., & Fehr, R. 2008. To prosper, organizational psychology should . . . adopt a global
perspective. Journal of Organizational Behavior, 29: 493-517.Greenberger, D. B., & Strasser, S. 1986. Development and application of a model of personal control in organiza-
tions. Academy of Management Review, 11: 164-177.Hempel, P. S., Zhang, Z.-X., & Han, Y. in press. Team empowerment and the organizational context: Decentralization
and the contrasting effects of formalization. Journal of Management.
at Universidad de Navarra-Biblioteca on March 2, 2012jom.sagepub.comDownloaded from

Lee, Antonakis / Power Distance and Person–Job Fit 33
Higgins, E. T. 1996. The “self digest”: Self-knowledge serving self-regulatory functions. Journal of Personality and Social Psychology, 71: 1062-1083.
Hoffman, B. J., & Woehr, D. J. 2006. A quantitative review of the relationship between person–organization fit and behavioral outcomes. Journal of Vocational Behavior, 68: 389-399.
Hofstede, G. 2001. Culture’s consequences: Comparing values, behaviors, institutions, and organizations across nations (2nd ed.). Thousand Oaks, CA: Sage.
Hofstede, G. 2006. What did GLOBE really measure? Researchers’ minds versus respondents’ minds. Journal of International Business Studies, 37: 882-896.
Huang, X., & Van de Vliert, E. 2003. Where intrinsic job satisfaction fails to work: National moderators of intrinsic motivation. Journal of Organizational Behavior, 24: 159-179.
Iyengar, S. S., & Lepper, M. R. 1999. Rethinking the value of choice: A cultural perspective on intrinsic motivation. Journal of Personality and Social Psychology, 76: 349-366.
Jansen, K. J., & Kristof-Brown, A. 2006. Toward a multidimensional theory of person–environment fit. Journal of Managerial Issues, 18: 193-214.
Johns, G. 2001. In praise of context. Journal of Organizational Behavior, 22: 31-42.Judge, T. A., Thoresen, C. J., Bono, J. E., & Patton, G. K. 2001. The job satisfaction–job performance relationship:
A qualitative and quantitative review. Psychological Bulletin, 127: 376-407.Juillerat, T. L. 2010. Friends, not foes? Work design and formalization in the modern work context. Journal of
Organizational Behavior, 31: 216-239.Kalliath, T. J., Bluedorn, A. C., & Strube, M. J. 1999. A test of value congruence effects. Journal of Organizational
Behavior, 20: 1175-1198.Kashima, Y., Kashima, E., Farsides, T., Kim, U., Strack, F., Werth, L., & Yuki, M. 2004. Culture and context-
sensitive self: The amount and meaning of context-sensitivity of phenomenal self differ across cultures. Self and Identity, 3: 125-141.
Kerr, S., & Jermier, J. M. 1978. Substitutes for leadership: Their meaning and measurement. Organizational Behavior and Human Performance, 22: 375-403.
Kirkman, B. L., & Shapiro, D. L. 2001. The impact of cultural values on job satisfaction and organizational com-mitment in self-managing work teams: The mediating role of employee resistance. Academy of Management Journal, 44: 557-569.
Kluckhohn, F. R., & Strodtbeck, F. L. 1961. Variations in value orientations. Evanston, IL: Row, Peterson.Kojima, H. 1984. A significant stride toward the comparative study of control. American Psychologist, 39:
972-973.Kristof, A. L. 1996. Person–organization fit: An integrative review of its conceptualizations, measurement, and
implications. Personnel Psychology, 49: 1-49.Kristof-Brown, A. L., & Guay, R. P. 2010. Person–environment fit. In S. Zedeck (Ed.), APA handbook of industrial
and organizational psychology: 3-50. Washington, DC: American Psychological Association.Kristof-Brown, A. L., & Stevens, C. K. 2001. Goal congruence in project teams: Does the fit between members’
personal mastery and performance goals matter? Journal of Applied Psychology, 86: 1083-1095.Kristof-Brown, A. L., Zimmerman, R. D., & Johnson, E. C. 2005. Consequences of individuals’ fit at work: A meta-
analysis of person–job, person–organization, person–group, and person–supervisor fit. Personnel Psychology, 58: 281-342.
Lalwani, A. K., Shavitt, S., & Johnson, T. 2006. What is the relation between cultural orientation and socially desir-able responding? Journal of Personality and Social Psychology, 90: 165-178.
Lee, C., Pillutla, M., & Law, K. S. 2000. Power-distance, gender and organizational justice. Journal of Management, 26: 685-704.
Lehman, D. R., Chiu, C.-Y., & Schaller, M. 2004. Psychology and culture. Annual Review of Psychology, 55: 689-714.
Leung, K., & Stephan, W. G. 1998. Perceptions of injustice in intercultural relations. Applied and Preventive Psychology, 7: 195-205.
Liden, R. C., & Antonakis, J. 2009. Considering context in psychological leadership research. Human Relations, 62: 1587-1605.
Lincoln, J. R., Hanada, M., & McBride, K. 1986. Organizational structures in Japanese and U.S. manufacturing. Administrative Science Quarterly, 31: 338-364.
at Universidad de Navarra-Biblioteca on March 2, 2012jom.sagepub.comDownloaded from

34 Journal of Management / Month XXXX
Locke, E. A. 1976. The nature and causes of job satisfaction. In M. D. Dunnette (Ed.), Handbook of industrial and organizational psychology: 1297-1349. Chicago: Rand McNally College Publishing.
Markus, H. R., & Kitayama, S. 1991. Culture and the self: Implications for cognition, emotion, and motivation. Psychological Review, 98: 224-253.
Martin, J. 1992. Cultures in organizations. Oxford, UK: Oxford University Press.Mathieu, J. E., & Zajac, D. M. 1990. A review and meta-analysis of the antecedents, correlates, and consequences
of organizational commitment. Psychological Bulletin, 108: 171-194.Matsumoto, D. 2007. Individual and cultural differences on status differentiation: The Status Differentiation Scale.
Journal of Cross-Cultural Psychology, 38: 413-431.Matsumoto, D., Yoo, S. H., Nakagawa, S., & 37 Members of the Multinational Study of Cultural Display Rules.
2008. Culture, emotion regulation, and adjustment. Journal of Personality and Social Psychology, 94: 925-937.Maznevski, M. L., DiStefano, J. J., Gomez, C. B., Noorderhaven, N. G., & Wu, P. C. 2002. Cultural dimensions at
the individual level of analysis: The cultural orientations framework. International Journal of Cross Cultural Management, 2: 275-295.
Mead, M. 1978. Culture and commitment: The new relationships between the generations in the 1970s. New York: Columbia University Press.
Morling, B., & Evered, S. 2006. Secondary control reviewed and defined. Psychological Bulletin, 132: 269-296.Morling, B., & Evered, S. 2007. The construct formerly known as secondary control: Reply to Skinner 2007.
Psychological Bulletin, 133: 917-919.Mowday, R. T., Steers, R. M., & Porter, L. W. 1979. The measurement of organizational commitment. Journal of
Vocational Behavior, 14: 224-247.Muthén, B. O. 1989. Latent variable modeling in heterogenous populations. Psychometrika, 54: 557-585.Muthén, B. O., du Toit, S. H. C., & Spisic, D. in press. Robust inference using weighted least squares and quadratic
estimating equations in latent variable modeling with categorical and continuous outcomes. Psychometrika.Naus, F., van Iterson, A., & Roe, R. A. 2007. Value incongruence, job autonomy, and organization-based self-
esteem: A self-based perspective on organizational cynicism. European Journal of Work and Organizational Psychology, 16: 195-219.
Nyambegera, S., Daniels, K., & Sparrow, P. 2001. Why fit doesn’t always matter: The impact of HRM and cultural fit on job involvement of Kenyan employees. Applied Psychology: An International Review, 50(1): 109-140.
Oehlert, G. W. 1992. A note on the delta method. American Statistician, 46: 27-29.Organ, D. W., & Greene, C. N. 1981. The effects of formalization on professional involvement: A compensatory
process approach. Administrative Science Quarterly, 26: 237-252.Oyserman, D. 2006. High power, low power, and equality: Culture beyond individualism and collectivism. Journal
of Consumer Psychology, 16: 352-357.Parkes, L. P., Bochner, S., & Schneider, S. K. 2001. Person–organization fit across cultures: An empirical investiga-
tion of individualism and collectivism. Applied Psychology: An International Review, 50(1): 81-108.Parsons, T. 1951. The social system. London: Routledge & Kegan Paul.Patall, E. A., Cooper, H., & Robinson, J. C. 2008. The effects of choice on intrinsic motivation and related out-
comes: A meta-analysis of research findings. Psychological Bulletin, 134: 270-300.Peterson, M. F., Smith, P. B., et al. 1995. Role conflict, ambiguity, and overload: A 21-nation study. Academy of
Management Journal, 38: 429-452.Podsakoff, P. M., Williams, L. J., & Todor, W. T. 1986. Effects of organizational formalization on alienation of
professionals and nonprofessionals. Academy of Management Journal, 29: 820-831.Pugh, D. S., Hickson, D. J., Hinings, C. R., & Turner, C. 1968. Dimensions of organizational structure.
Administrative Science Quarterly, 13: 65-105.Rawlings, J. O., Pantula, S. G., & Dickey, D. A. 1998. Applied regression analysis: A research tool (2nd ed.).
New York: Springer.Reckase, M. D. 1985. The difficulty of test items that measure more than one ability. Applied Psychological
Measurement, 9: 401-412.Riketta, M. 2002. Attitudinal organizational commitment and job performance: A meta-analysis. Journal of
Organizational Behavior, 23: 257-266.Rothbaum, F., Weisz, J. R., & Snyder, S. S. 1982. Changing the world and changing the self: A two-process model
of perceived control. Journal of Personality and Social Psychology, 42: 5-37.
at Universidad de Navarra-Biblioteca on March 2, 2012jom.sagepub.comDownloaded from

Lee, Antonakis / Power Distance and Person–Job Fit 35
Rousseau, D. M., & Fried, Y. 2001. Location, location, location: Contextualizing organizational research. Journal of Organizational Behavior, 22: 1-13.
Rudolph, K. D., Dennig, M. D., & Weisz, J. R. 1995. Determinants and consequences of children’s coping in the medical setting: Conceptualization, review, and critique. Psychological Bulletin, 118: 328-357.
Salancik, G. R., & Pfeffer, J. 1978. A social information processing approach to job attitudes and task design. Administrative Science Quarterly, 23: 224-253.
Schneider, B. 1987. The people make the place. Personnel Psychology, 40: 437-453.Schneider, B. 2001. Fits about fit. Applied Psychology: An International Review, 50: 141-152.Schwartz, S. H. 1999. A theory of cultural values and some implications for work. Applied Psychology: An
International Review, 48: 23-47.Schwartz, S. H. & Sagiv, L. 1995. Identifying culture-specifics in the content and structure of values. Journal of
Cross-Cultural Psychology, 26: 92-116.Shaw, J. D., & Gupta, N. 2004. Job complexity, performance, and well-being: When does supplies–values fit mat-
ter? Personnel Psychology, 57: 847-879.Siemsen, E., Roth, A., & Oliveira, P. 2010. Common method bias in regression models with linear, quadratic, and
interaction effects. Organizational Research Methods, 13: 456-476.Sobel, M. E. 1982. Asymptotic intervals for indirect effects in structural equations models. In S. Leinhart (Ed.),
Sociological methodology: 290-312. San Francisco: Jossey-Bass.Spector, P. E. 2003. Industrial and organizational psychology: Research and practice. New York: Wiley.Suh, E. M., Diener, E., Oishi, S., & Triandis, H. C. 1998. The shifting basis of life satisfaction judgments across
cultures: Emotions versus norms. Journal of Personality and Social Psychology, 74: 482-493.Tweed, R. G., White, K., & Lehman, D. R. 2004. Culture, stress, and coping: Internally- and externally-targeted
control strategies of European Canadians, East Asian Canadians, and Japanese. Journal of Cross-Cultural Psychology, 35: 652-668.
van der Vegt, G. S., Van de Vliert, E., & Huang, X. 2005. Location-level links between diversity and innovative climate depend on national power distance. Academy of Management Journal, 48: 1171-1182.
Vecchio, R. P., & Keon, T. L. 1981. Predicting employee satisfaction from congruency among individual need, job design, and system structure. Journal of Organizational Behavior, 2: 283-292.
Verquer, M. L., Beehr, T. A., & Wagner, S. H. 2003. A meta-analysis of relations between person–organization fit and work attitudes. Journal of Vocational Behavior, 63: 473-489.
Wally, S., & Baum, J. R. 1994. Personal and structural determinants of the pace of strategic decision making. Academy of Management Journal, 37: 932-956.
Weisz, J. R., Rothbaum, F. M., & Blackburn, T. C. 1984. Standing out and standing in: The psychology of control in America and Japan. American Psychologist, 39: 955-969.
Westerman, J. W., & Vanka, S. 2005. A cross-cultural empirical analysis of person–organization fit measures as predictors of student performance in business education: Comparing students in the United States and India. Academy of Management Learning and Education, 4: 409-420.
Whetten, D. A. 1989. What constitutes a theoretical contribution? Academy of Management Review, 14: 490-495Wright, T. A., & Bonett, D. G. 2002. The moderating effects of employee tenure on the relation between organiza-
tional commitment and job performance: A meta-analysis. Journal of Applied Psychology, 87: 1183-1190.Zhang, Y., Winterich, K. P., & Mittal, V. 2010. Power-distance belief and impulsive buying. Journal of Marketing
Research, 47: 945-954.
at Universidad de Navarra-Biblioteca on March 2, 2012jom.sagepub.comDownloaded from