journal of materials chemistry a - university of...
TRANSCRIPT
Journal ofMaterials Chemistry A
PAPER
Ope
n A
cces
s A
rtic
le. P
ublis
hed
on 3
1 M
arch
201
4. D
ownl
oade
d on
07/
05/2
014
08:1
2:43
. T
his
artic
le is
lice
nsed
und
er a
Cre
ativ
e C
omm
ons
Attr
ibut
ion
3.0
Unp
orte
d L
icen
ce.
View Article OnlineView Journal | View Issue
aDoctoral Training Centre in Sustainable C
Claverton Down, Bath, UKbCentre for Sustainable Chemical Techn
University of Bath, Claverton Down, Bath, U
† Electronic supplementary information (thermodynamic data implemented as Penergy surface plots. See DOI: 10.1039/c4t
Cite this: J. Mater. Chem. A, 2014, 2,7829
Received 20th February 2014Accepted 28th March 2014
DOI: 10.1039/c4ta00892h
www.rsc.org/MaterialsA
This journal is © The Royal Society of C
Ab initio thermodynamic model of Cu2ZnSnS4†
Adam J. Jacksona and Aron Walsh*b
Thin-film solar cells based on the semiconductor Cu2ZnSnS4 (CZTS) are a promising candidate for terawatt-
scale renewable energy generation. While CZTS is composed of earth abundant and non-toxic elements,
arranged in the kesterite crystal structure, there is a synthetic challenge to produce high-quality
stoichiometric materials over large areas. We calculate the thermodynamic potentials of CZTS and its
elemental and binary components based on energetic and vibrational data computed using density
functional theory. These chemical potentials are combined to produce a thermodynamic model for the
stability of CZTS under arbitrary temperatures and pressures, which provide insights into the materials
chemistry. CZTS was shown to be thermodynamically stable with respect to its component elements
and their major binary phases binaries under modest partial pressures of sulfur and temperatures below
1100 K. Under near-vacuum conditions with sulfur partial pressures below 1 Pa decomposition into
binaries including solid SnS becomes favourable, with a strongly temperature-dependent stability window.
1 Introduction
Inorganic thin-lm solar cells consist of several materials (acombination of metallic, semiconducting and insulatingcompounds) arranged in a particular order to exploit thephotovoltaic effect. The deposition and optimisation of eachlayer requires a specic set of conditions and sometimeschemical treatments to ‘activate’ their performance. The role ofcompositional and structural variations in limiting perfor-mance for a range of solar cell technologies is known.1 Thedevelopment of processing and annealing conditions has beenlargely empirical in the past; however, the importance ofchemical thermodynamics in this area is beginning to berecognised.2
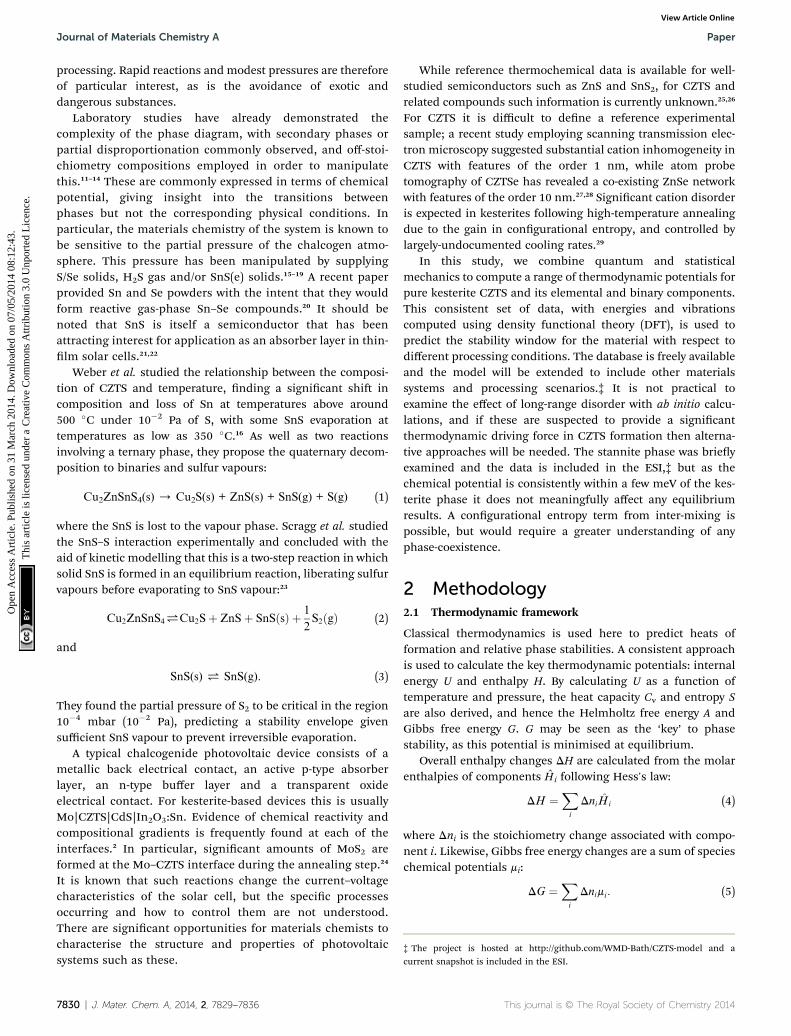
Cu2ZnSnS4 (CZTS), a quaternary chalcogenide semi-conductor, was introduced as a photovoltaic material in 1988 byIto and Nakazawa.3 Several crystal structures are known, butwhile early work assumed the stannite structure (space groupI�42m), the lowest-energy structure is now known to be the kes-terite structure (space group I�4, Fig. 1). Computational work hasshown this to be a few meV per formula unit lower in ground-state energy than the stannite and CuAu-derived structures.4 Alllow-energy crystal structures are related to the face-centredcubic zincblende lattice, with Cu, Zn and Sn distributed overone sublattice and S lling a second sublattice.
hemical Technologies, University of Bath,
ologies and Department of Chemistry,
K. E-mail: [email protected]
ESI) available: Material properties andython modules. Source code for freea00892h
hemistry 2014
In recent years CZTS and Se-containing variations have comeunder particular attention as a candidate for large-area thin-lm cells, with a current record light-to-electricity conversionefficiency of 12.6% in a Se-dominated cell.5 The record efficiencyfor Se-free CZTS is 8.4%.6 Its distinct advantages over competingtechnologies are the combination of a direct optical bandgaparound the “optimum” 1.5 eV and its abundant, inexpensiveelemental components.3–5,7,8 The reserves and production ratesof these materials suggest that CZTS is a strong contender forglobal-scale generation compared to peers including Cu(In,-Ga)(S,Se)2, CdSe and CdTe.9 The long-term requirements forsuch generation are expansive, forming part of “country-sizedrenewable facilities”.10 Large-scale production requires a prag-matic process, preferably one which is adaptable to “roll-to-roll”
Fig. 1 Tetragonal unit cell of kesterite structured CZTS. Alternatelayers of Cu (orange) with Zn (blue) and Sn (green) alternate with layersof interstitial sulfur atoms (yellow) in an extended zinc blende-likearrangement of tetrahedral coordination environments.
J. Mater. Chem. A, 2014, 2, 7829–7836 | 7829
‡ The project is hosted at http://github.com/WMD-Bath/CZTS-model and acurrent snapshot is included in the ESI.
Journal of Materials Chemistry A Paper
Ope
n A
cces
s A
rtic
le. P
ublis
hed
on 3
1 M
arch
201
4. D
ownl
oade
d on
07/
05/2
014
08:1
2:43
. T
his
artic
le is
lice
nsed
und
er a
Cre
ativ
e C
omm
ons
Attr
ibut
ion
3.0
Unp
orte
d L
icen
ce.
View Article Online
processing. Rapid reactions and modest pressures are thereforeof particular interest, as is the avoidance of exotic anddangerous substances.
Laboratory studies have already demonstrated thecomplexity of the phase diagram, with secondary phases orpartial disproportionation commonly observed, and off-stoi-chiometry compositions employed in order to manipulatethis.11–14 These are commonly expressed in terms of chemicalpotential, giving insight into the transitions betweenphases but not the corresponding physical conditions. Inparticular, the materials chemistry of the system is known tobe sensitive to the partial pressure of the chalcogen atmo-sphere. This pressure has been manipulated by supplyingS/Se solids, H2S gas and/or SnS(e) solids.15–19 A recent paperprovided Sn and Se powders with the intent that they wouldform reactive gas-phase Sn–Se compounds.20 It should benoted that SnS is itself a semiconductor that has beenattracting interest for application as an absorber layer in thin-lm solar cells.21,22
Weber et al. studied the relationship between the composi-tion of CZTS and temperature, nding a signicant shi incomposition and loss of Sn at temperatures above around500 �C under 10�2 Pa of S, with some SnS evaporation attemperatures as low as 350 �C.16 As well as two reactionsinvolving a ternary phase, they propose the quaternary decom-position to binaries and sulfur vapours:
Cu2ZnSnS4(s) / Cu2S(s) + ZnS(s) + SnS(g) + S(g) (1)
where the SnS is lost to the vapour phase. Scragg et al. studiedthe SnS–S interaction experimentally and concluded with theaid of kinetic modelling that this is a two-step reaction in whichsolid SnS is formed in an equilibrium reaction, liberating sulfurvapours before evaporating to SnS vapour:23
Cu2ZnSnS4#Cu2Sþ ZnSþ SnSðsÞ þ 1
2S2ðgÞ (2)
and
SnS(s) # SnS(g). (3)
They found the partial pressure of S2 to be critical in the region10�4 mbar (10�2 Pa), predicting a stability envelope givensufficient SnS vapour to prevent irreversible evaporation.
A typical chalcogenide photovoltaic device consists of ametallic back electrical contact, an active p-type absorberlayer, an n-type buffer layer and a transparent oxideelectrical contact. For kesterite-based devices this is usuallyMo|CZTS|CdS|In2O3:Sn. Evidence of chemical reactivity andcompositional gradients is frequently found at each of theinterfaces.2 In particular, signicant amounts of MoS2 areformed at the Mo–CZTS interface during the annealing step.24
It is known that such reactions change the current–voltagecharacteristics of the solar cell, but the specic processesoccurring and how to control them are not understood.There are signicant opportunities for materials chemists tocharacterise the structure and properties of photovoltaicsystems such as these.
7830 | J. Mater. Chem. A, 2014, 2, 7829–7836
While reference thermochemical data is available for well-studied semiconductors such as ZnS and SnS2, for CZTS andrelated compounds such information is currently unknown.25,26
For CZTS it is difficult to dene a reference experimentalsample; a recent study employing scanning transmission elec-tron microscopy suggested substantial cation inhomogeneity inCZTS with features of the order 1 nm, while atom probetomography of CZTSe has revealed a co-existing ZnSe networkwith features of the order 10 nm.27,28 Signicant cation disorderis expected in kesterites following high-temperature annealingdue to the gain in congurational entropy, and controlled bylargely-undocumented cooling rates.29
In this study, we combine quantum and statisticalmechanics to compute a range of thermodynamic potentials forpure kesterite CZTS and its elemental and binary components.This consistent set of data, with energies and vibrationscomputed using density functional theory (DFT), is used topredict the stability window for the material with respect todifferent processing conditions. The database is freely availableand the model will be extended to include other materialssystems and processing scenarios.‡ It is not practical toexamine the effect of long-range disorder with ab initio calcu-lations, and if these are suspected to provide a signicantthermodynamic driving force in CZTS formation then alterna-tive approaches will be needed. The stannite phase was brieyexamined and the data is included in the ESI,‡ but as thechemical potential is consistently within a few meV of the kes-terite phase it does not meaningfully affect any equilibriumresults. A congurational entropy term from inter-mixing ispossible, but would require a greater understanding of anyphase-coexistence.
2 Methodology2.1 Thermodynamic framework
Classical thermodynamics is used here to predict heats offormation and relative phase stabilities. A consistent approachis used to calculate the key thermodynamic potentials: internalenergy U and enthalpy H. By calculating U as a function oftemperature and pressure, the heat capacity Cv and entropy Sare also derived, and hence the Helmholtz free energy A andGibbs free energy G. G may be seen as the ‘key’ to phasestability, as this potential is minimised at equilibrium.
Overall enthalpy changes DH are calculated from the molarenthalpies of components Hi following Hess's law:
DH ¼Xi
DniHi (4)
where Dni is the stoichiometry change associated with compo-nent i. Likewise, Gibbs free energy changes are a sum of specieschemical potentials mi:
DG ¼Xi
Dnimi: (5)
This journal is © The Royal Society of Chemistry 2014
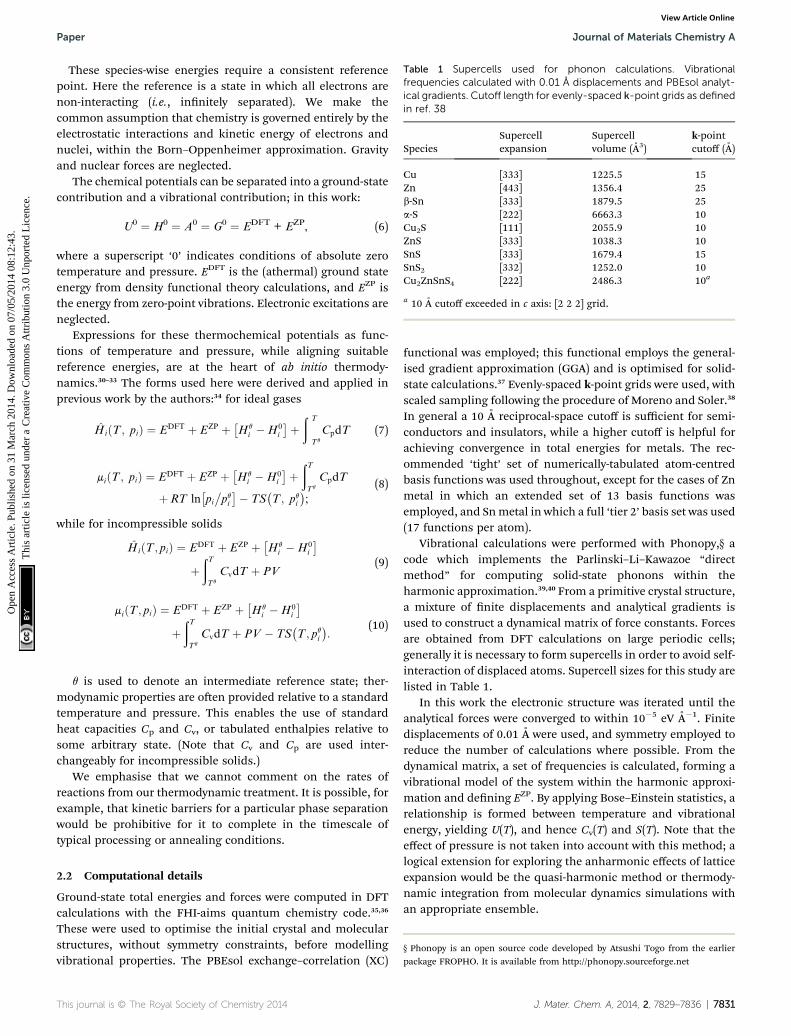
Table 1 Supercells used for phonon calculations. Vibrationalfrequencies calculated with 0.01 A displacements and PBEsol analyt-ical gradients. Cutoff length for evenly-spaced k-point grids as definedin ref. 38
SpeciesSupercellexpansion
Supercellvolume (A3)
k-pointcutoff (A)
Cu [333] 1225.5 15Zn [443] 1356.4 25b-Sn [333] 1879.5 25a-S [222] 6663.3 10Cu2S [111] 2055.9 10ZnS [333] 1038.3 10SnS [333] 1679.4 15SnS2 [332] 1252.0 10Cu2ZnSnS4 [222] 2486.3 10a
a 10 A cutoff exceeded in c axis: [2 2 2] grid.
Paper Journal of Materials Chemistry A
Ope
n A
cces
s A
rtic
le. P
ublis
hed
on 3
1 M
arch
201
4. D
ownl
oade
d on
07/
05/2
014
08:1
2:43
. T
his
artic
le is
lice
nsed
und
er a
Cre
ativ
e C
omm
ons
Attr
ibut
ion
3.0
Unp
orte
d L
icen
ce.
View Article Online
These species-wise energies require a consistent referencepoint. Here the reference is a state in which all electrons arenon-interacting (i.e., innitely separated). We make thecommon assumption that chemistry is governed entirely by theelectrostatic interactions and kinetic energy of electrons andnuclei, within the Born–Oppenheimer approximation. Gravityand nuclear forces are neglected.
The chemical potentials can be separated into a ground-statecontribution and a vibrational contribution; in this work:
U0 ¼ H0 ¼ A0 ¼ G0 ¼ EDFT + EZP, (6)
where a superscript ‘0’ indicates conditions of absolute zerotemperature and pressure. EDFT is the (athermal) ground stateenergy from density functional theory calculations, and EZP isthe energy from zero-point vibrations. Electronic excitations areneglected.
Expressions for these thermochemical potentials as func-tions of temperature and pressure, while aligning suitablereference energies, are at the heart of ab initio thermody-namics.30–33 The forms used here were derived and applied inprevious work by the authors:34 for ideal gases
HiðT ; piÞ ¼ EDFT þ EZP þ �Hq
i �H0i
�þð T
Tq
CpdT (7)
miðT ; piÞ ¼ EDFT þ EZP þ �Hq
i �H0i
�þðTTq
CpdT
þRT ln�pi�pqi�� TS
�T ; pqi
�;
(8)
while for incompressible solids
HiðT ; piÞ ¼ EDFT þ EZP þ �Hq
i �H0i
�þðTTq
CvdT þ PV(9)
miðT ; piÞ ¼ EDFT þ EZP þ �Hq
i �H0i
�þðTTq
CvdT þ PV � TS�T ; pqi
�:
(10)
q is used to denote an intermediate reference state; ther-modynamic properties are oen provided relative to a standardtemperature and pressure. This enables the use of standardheat capacities Cp and Cv, or tabulated enthalpies relative tosome arbitrary state. (Note that Cv and Cp are used inter-changeably for incompressible solids.)
We emphasise that we cannot comment on the rates ofreactions from our thermodynamic treatment. It is possible, forexample, that kinetic barriers for a particular phase separationwould be prohibitive for it to complete in the timescale oftypical processing or annealing conditions.
§ Phonopy is an open source code developed by Atsushi Togo from the earlierpackage FROPHO. It is available from http://phonopy.sourceforge.net
2.2 Computational details
Ground-state total energies and forces were computed in DFTcalculations with the FHI-aims quantum chemistry code.35,36
These were used to optimise the initial crystal and molecularstructures, without symmetry constraints, before modellingvibrational properties. The PBEsol exchange–correlation (XC)
This journal is © The Royal Society of Chemistry 2014
functional was employed; this functional employs the general-ised gradient approximation (GGA) and is optimised for solid-state calculations.37 Evenly-spaced k-point grids were used, withscaled sampling following the procedure of Moreno and Soler.38
In general a 10 A reciprocal-space cutoff is sufficient for semi-conductors and insulators, while a higher cutoff is helpful forachieving convergence in total energies for metals. The rec-ommended ‘tight’ set of numerically-tabulated atom-centredbasis functions was used throughout, except for the cases of Znmetal in which an extended set of 13 basis functions wasemployed, and Snmetal in which a full ‘tier 2’ basis set was used(17 functions per atom).
Vibrational calculations were performed with Phonopy,§ acode which implements the Parlinski–Li–Kawazoe “directmethod” for computing solid-state phonons within theharmonic approximation.39,40 From a primitive crystal structure,a mixture of nite displacements and analytical gradients isused to construct a dynamical matrix of force constants. Forcesare obtained from DFT calculations on large periodic cells;generally it is necessary to form supercells in order to avoid self-interaction of displaced atoms. Supercell sizes for this study arelisted in Table 1.
In this work the electronic structure was iterated until theanalytical forces were converged to within 10�5 eV A�1. Finitedisplacements of 0.01 A were used, and symmetry employed toreduce the number of calculations where possible. From thedynamical matrix, a set of frequencies is calculated, forming avibrational model of the system within the harmonic approxi-mation and dening EZP. By applying Bose–Einstein statistics, arelationship is formed between temperature and vibrationalenergy, yielding U(T), and hence Cv(T) and S(T). Note that theeffect of pressure is not taken into account with this method; alogical extension for exploring the anharmonic effects of latticeexpansion would be the quasi-harmonic method or thermody-namic integration from molecular dynamics simulations withan appropriate ensemble.
J. Mater. Chem. A, 2014, 2, 7829–7836 | 7831

Journal of Materials Chemistry A Paper
Ope
n A
cces
s A
rtic
le. P
ublis
hed
on 3
1 M
arch
201
4. D
ownl
oade
d on
07/
05/2
014
08:1
2:43
. T
his
artic
le is
lice
nsed
und
er a
Cre
ativ
e C
omm
ons
Attr
ibut
ion
3.0
Unp
orte
d L
icen
ce.
View Article Online
2.3 Crystal structures
Ternary phases and metal alloys were disregarded at this initialstage. The structure for CZTS was drawn from previous work,and optimised for the basis set and XC functional used in thisstudy.41
The initial structure of Cu was obtained from the InorganicCrystal Structure Database (ICSD) in the form of a simple face-centred cubic cell (collection code 64699).42 For Zn an initialstructure was drawn from the ICSD (collection code 64990)consisting of a 2-atom hexagonal-close-packed unit cell. Stan-dard local geometry-optimisation algorithms (also tested in theplane-wave code VASP) struggled to nd the energy-minimisinggeometry as Zn is so in the c-axis. A series of xed c-values weretested over increments of 0.025 A, while relaxing the a and bparameters to nd optimal a and c values; b, a, b, g and theatomic positions were then xed to the P63/mmc space group. Forb-Sn the lattice constant was drawn from the ICSD (collectioncode 40039) and a 2-atom face-centred-cubic cell constructed.The a-S structure was based on a previous DFT study and is alarge triclinic cell containing 32 S atoms; this in turn is asymmetry reduction from an orthorhombic conventional cell.43
The structures of Cu2S phases have been previously studiedusing X-ray crystallography and density functional theory; whilethe high-temperature and cubic structures contain partially-occupied sites, low-Cu2S has a well-dened, albeit large, 144-atom monoclinic unit cell.44 SnS2 is the binary phase corre-sponding to the formal oxidation state in CZTS (i.e. Sn(IV)). A 3-atom hexagonal unit cell was obtained from the ICSD (collec-tion code 100612). An 8-atom orthorhombic structure for thestable Pnma phase of SnS was drawn from recent work on thephase stability of this material.43 ZnS is encountered in (andgives its name to) both the zincblende and wurtzite crystalstructures. The starting point was 2-atom zincblende primitivecell with a lattice parameter a ¼ 5.4053 A from reference data.45
A corresponding set of calculations were performed for thewurtzite phase of ZnS; the results are not considered here as thezincblende ground state is more stable and preferred formodelling, but the results are available as part of the ESI.† Theinitial and optimised structural parameters for all other phasesare included in Table 2.
2.4 Sulfur vapours
The thermochemistry of sulfur has been studied relativelylightly given its abundance and the scale of application. Whilesulfur vapours are known to consist of a series of rings from S8down to the dimer S2, data for the intermediate rings andequilibrium mixtures is relatively scarce. Standard thermo-chemical tables prefer to treat the gas phase as an idealdiatomic gas, as do other treatments of the CZTS equilib-rium.2,23,26 However, the vapour phase of sulfur is thought tocontain a mixture of the cyclic allomorphs, and even above1200 K may only be around 70% S2.46–48
In the condensed phase, the stable structure a-S is amolecular solid formed of packed S8 rings. In the absence of acomprehensive model, calculations here consider a-S solid andthe S2 and S8 vapours; the true behaviour of the mixture is
7832 | J. Mater. Chem. A, 2014, 2, 7829–7836
expected to be somewhere between the effect of these purespecies. DFT-optimised structures were used for the groundstate energies of the S2 dimer and S8 ring. Temperature-dependent data was drawn from the NIST-JANAF thermo-chemical data tables; these are based on spectroscopy andassume ideal behaviour.26
3 Results
We begin by reporting the vibrational properties for each solidcompound of interest. The resulting thermodynamic potentialsare then combined to assess the formation of CZTS with respectto its constituent elements and isovalent binary suldes. Finallythe decomposition liberating SnS and sulfur vapour isconsidered.
3.1 Lattice dynamics
Optimised ground-state lattice parameters are given in Table 2.The only signicant shis in structure are for a-S (a large, so,molecular crystal) and to a lesser extent the c parameters of Znmetal and SnS2, which are weakly bound. Following the proce-dure outlined above, phonon densities of states and bandstructures were computed for CZTS, Cu, Sn, Zn, a-S, Cu2S, ZnS,and SnS2. While there have been isolated reports of individualphases, this is the rst consistent collection of phonon data forthese materials.
The phonon dispersion for CZTS is shown in Fig. 2, while theremaining curves are available in the ESI.† The general behav-iour is similar to previous work by Khare et al., but lacks LO-TOsplitting at the G point, which was not considered in this case.49
The 16-atom unit cell of kesterite results in 48 (3N) modes.There are two blocks of bands, which spread from 0 to 171 cm�1
and from 251 to 350 cm�1. The calculated phonon density ofstates (DOS) (Fig. 2) shows activity between around 270 and 250cm�1; from experimental studies the Raman spectrum is knownto contain two distinct peaks at about 286 and 337 cm�1 (A1modes).11
The associated total energies and thermal properties havebeen packaged into a Python code for ease of use and manip-ulation. These are also available as ESI, and as part of acontinuing project online.†
3.2 Standard thermodynamic properties of CZTS
3.2.1 Heat of formation. The formation enthalpy is denedwith respect to the component elements in their (solid) stan-dard states,
2Cu + Zn + Sn + 4S # Cu2ZnSnS4 (11)
The standard formation enthalpy of kesterite CZTS at298.15 K and under 1 bar of pressure is calculated to be�3.83 eV per formula unit (�369.1 kJ mol�1). At standardconditions the effect of temperature and pressure is small(<1 meV) as there is no gas component to the reaction.However, stability is determined by the Gibbs free energy offormation, DGf.
This journal is © The Royal Society of Chemistry 2014

Fig. 3 Gibbs free energy of formation of kesterite CZTS from elementsin their standard states (eqn (12)). Contours represent energies inkJmol�1. S is in the solid a-sulfur phase. The y-axis represents pressure
Table 2 Lattice parameters for CZTS, elemental and binary precursors, before and after unit cell optimisation with the PBEsol functional. Nosymmetry constraints were enforced except for the case of Zn metal (discussed in Section 2.3). Except where other references are given, initialstructures were drawn from the Inorganic Crystal Structure Database and collection codes are given in their respective discussions above.42 a, band c are the lattice vector lengths in A; a, b and g are the angles between the vectors in degrees. Calculated enthalpies of formation, DHq
f , aregiven for compounds at standard conditions of 298.15 K and 1 bar pressure
Material Structure Space group a b c a b g
DHqf
(kJ mol�1)
Cu2ZnSnS4 (kesterite) Initial41 I�4 5.434 5.434 10.856 90.00 90.00 90.00 �369.13Optimised 5.383 5.383 10.727 89.98 89.99 89.99
Cu Initial Fm�3m 3.615 3.615 3.615 90.00 90.00 90.00Optimised 3.567 3.567 3.567 90.00 90.00 90.00
Zn Initial P63/mmc 2.665 2.665 4.947 90.00 90.00 120.00Optimised 2.614 2.614 4.775 90.00 90.00 120.00
b-Sn Initial I41/amd 4.589 4.589 4.589 60.00 60.00 60.00Optimised 4.614 4.614 4.614 60.10 60.10 60.10
a-S Initial43 Fddd 14.349 14.237 7.885 74.74 73.21 32.01Optimised 13.788 13.283 8.335 75.15 68.51 36.02
Cu2S Initial44 P21/c 14.424 11.865 13.003 90.00 116.77 90.00 �46.24Optimised 14.870 11.744 13.095 90.00 115.97 90.00
SnS Initial43 Pnma 11.106 3.989 4.238 90.00 90.11 90.08 �97.70Optimised 11.083 3.982 4.229 90.00 90.00 90.00
SnS2 Initial P�3ml 3.605 3.605 5.460 90.00 90.00 120.00 �120.97Optimised 3.654 3.654 6.016 89.95 90.04 120.00
ZnS Initial F�43m 3.822 3.822 3.822 60.00 60.00 60.00 �156.74Optimised 3.789 3.789 3.789 59.98 59.98 59.98
Fig. 2 Phonon band structure and density of states for kesterite CZTS(tetragonal unit cell) with 16 atoms and 48 vibrational modes. All otherdispersion plots are included in ESI.†
Paper Journal of Materials Chemistry A
Ope
n A
cces
s A
rtic
le. P
ublis
hed
on 3
1 M
arch
201
4. D
ownl
oade
d on
07/
05/2
014
08:1
2:43
. T
his
artic
le is
lice
nsed
und
er a
Cre
ativ
e C
omm
ons
Attr
ibut
ion
3.0
Unp
orte
d L
icen
ce.
View Article Online
The free energy of formation is plotted against temperatureand pressure in Fig. 3. The effect of pressure is negligible due toassumed solid incompressibility and absence of a gas phase.
It is clear that CZTS is thermodynamically stable with respectto its solid elemental precursors over all reasonable processingconditions. Considering the equilibrium with sulfur vapours:
2Cu + Zn + Sn + 2S2(g) # Cu2ZnSnS4 (12)
This journal is © The Royal Society of Chemistry 2014
2Cuþ Znþ Snþ 1
2S8ðgÞ#Cu2ZnSnS4 (13)
we see a stronger interaction at high temperatures and lowpressures (Fig. 4). This is driven by entropy, as it is moreentropically favourable for sulfur to enter a low-pressure
from an inert gas or mechanical force.
J. Mater. Chem. A, 2014, 2, 7829–7836 | 7833

Fig. 4 Gibbs free energy of formation of kesterite CZTS frommetals andsulfur gases. Contours represent energies in kJ mol�1. The y-axis repre-sents a partial pressure of gaseous sulfur in the form of (a) S2 and (b) S8.
Fig. 5 Gibbs free energy of formation of kesterite from binaries (eqn(15)). Contours represent energies in kJ mol�1. The y-axis representspressure from an inert gas or mechanical force.
Journal of Materials Chemistry A Paper
Ope
n A
cces
s A
rtic
le. P
ublis
hed
on 3
1 M
arch
201
4. D
ownl
oade
d on
07/
05/2
014
08:1
2:43
. T
his
artic
le is
lice
nsed
und
er a
Cre
ativ
e C
omm
ons
Attr
ibut
ion
3.0
Unp
orte
d L
icen
ce.
View Article Online
environment. The effect is greatest for S2, suggesting an insta-bility at high temperatures over 1300 K at low pressures,whereas if only S8 is to be considered then the formationappears irreversible even under relatively extreme conditions.Given that the actual composition of sulfur vapours is known toshi towards S2 at high temperatures, Fig. 4a is more appro-priate in this regime.48
Fig. 6 Gibbs free energy of formation of kesterite from binaries, tinand sulfur vapour (eqn (16)). Contours represent energies in kJ mol�1.The y-axis represents the partial pressure of S2.
3.3 Stability of CZTS relative to binary suldes
The binary suldes are of interest both in terms of routes toforming CZTS and possible disproportionation reactions. Notethat for a stoichiometric mixture, there is no dependence on thechemical potential of elemental sulfur:
Cu2S + ZnS + SnS2 # Cu2ZnSnS4, (14)
and hence the temperature-pressure dependence is again verymild (Fig. 5). However, the overall free energy change isconsiderably reduced to the order �44 kJ mol�1; this is logical
7834 | J. Mater. Chem. A, 2014, 2, 7829–7836
as the binary phases are themselves stable with respect to theirelemental precursors.
If we instead consider decomposition to Sn metal, due to aninstability of SnS2, then a dependence appears as sulfur isreleased (Fig. 6) following the reaction
Cu2ZnSnS4 # Cu2S + ZnS + Sn + S2(g). (15)
This relationship is even stronger in the event of partial sulfurloss to form the divalent tin monosulde, SnS:
Cu2ZnSnS4#Cu2Sþ ZnSþ SnSðsÞ þ 1
2S2ðgÞ: (16)
Note that eqn (17) appears identical to eqn (2); the onlydifference is that SnS is here dened as being the bulk solid,while it is understood that in the actual mechanism the SnSlikely forms a reactive surface and may even be adsorbed to aCZTS or ZnS bulk phase. Application of the model at high (�1
This journal is © The Royal Society of Chemistry 2014

Fig. 7 Gibbs free energy of formation of kesterite from binarycompounds, with SnS in equilibrium with S2 vapours (eqn (17)).Contours represent energies in kJ mol�1. The y-axis represents thepartial pressure of S2. Hatched area shows predicted transition regionfrom kinetic modelling, figure 5 of ref. 23. Note low pressure andreduced temperature range relative to other figures; this is for ease ofcomparison with ref. 23.
Paper Journal of Materials Chemistry A
Ope
n A
cces
s A
rtic
le. P
ublis
hed
on 3
1 M
arch
201
4. D
ownl
oade
d on
07/
05/2
014
08:1
2:43
. T
his
artic
le is
lice
nsed
und
er a
Cre
ativ
e C
omm
ons
Attr
ibut
ion
3.0
Unp
orte
d L
icen
ce.
View Article Online
bar) partial pressures of sulfur suggests that such decompositionis not expected below temperatures of around 1300 K. Fig. 7shows that CZTS becomes unstable following this process ataround 600 K and above for very low partial pressures of S2. Thestability window is found to be almost identical to that predictedby kinetic modelling of experimental data (see Fig. 5 of ref. 23).
The agreement is especially interesting given that the kineticmodel of Scragg et al. is based on SnS vapours (which wereintroduced as a gas stream in the accompanying experiment),while the result is reproduced here in an ab initio thermody-namic model with no such phase.23 This model does notconsider the evaporation of solid SnS, and as such is equivalentto the two-step model (eqn (2) and (3)) given a saturated SnSvapour phase. It is reasonable to expect that the direct forma-tion of SnS vapour would offer a higher entropy gain, loweringthe free energy further and hence promoting decomposition;this would be equivalent to same two-step model with a very lowpartial pressures of SnS.
Direct comparison to experimental syntheses of CZTS isdifficult as stability curves have not beenmeasured directly, but itis possible to interpret experimental results where the conditionsare reported clearly. At typical formation temperatures of 700–800K we nd that decomposition is only expected where there is asignicant absence of sulfur in the atmosphere. Given that sulfursolids have a vapour pressure of the order 100 kPa in thistemperature range, this would only be expected to occur wheresulfur is limited or vapours are removed by a vacuum pump.25
Ericson et al. successfully produced CZTS lms by reactivesputtering followed by annealing in a static argon atmosphere of35 kPa at 560�; given that they observed a correlation betweensulfur loss and temperature during sputtering, we would assumethat the sulfur was sufficiently mobile to form an equilibriumpressure during annealing.19 Redinger et al. observed decompo-sition at 560 �C under “vacuum”; this is in agreement with our
This journal is © The Royal Society of Chemistry 2014
model provided that their vacuum pump maintained a sulfurpartial pressure of around 0.1 Pa (10�3 mbar) or less.50
4 Conclusions
Based on rst-principles total energy calculations, a thermody-namic model has been developed to describe the formation andstability of CZTS with respect to its elemental constituents andstoichiometric binary suldes, as well as the tin monosuldewhich is known to play an active role. Reactions involving solidand gaseous sulfur have been considered, the latter of whichintroduces a substantial temperature and pressure dependence.Temperature and pressure conditions have been related to thephase equilibrium; they indicate higher decompositiontemperatures than those observed experimentally, but other-wise broadly similar behaviour. These results, which are abinitio except for the reference data for sulfur vapours, closelyreproduce a previous model which was derived from experi-mental results and reference data.23 It is clear that the pressure–temperature interaction is strong in near-vacuum conditions.
This initial model is based on a number of approximationsthat could be removed in future work. These include the effectsof thermal expansion and compressibility on the solid phasesand the non-ideality of the S vapour. There is always acompromise between accuracy and computational cost, espe-cially as future models will be extended to consider competitiveternary and quaternary phases, in addition to metallic alloys.One issue with rigorous validation of the model is the scarcity ofexperimental thermodynamic data so far. We suggest that high-temperature near-vacuum experiments need to control andreport the annealing pressure carefully if they are to be repro-ducible and aid understanding of the phase equilibria of multi-component semiconductors such as Cu2ZnSnS4.
Acknowledgements
We acknowledge L. M. Peter for useful discussions and J. J.Scragg for providing access to his kinetic modelling data. A.W.acknowledges support from the Royal Society for a UniversityResearch Fellowship and A.J.J. is funded by EPSRC (Grant no. EP/G03768X/1) through the Doctoral Training Centre in SustainableChemical Technologies. We acknowledge use of Hartree Centreresources in this work. The STFC Hartree Centre is a researchcollaboratory in association with IBM providing High Perfor-mance Computing platforms funded by the UK's investment in e-Infrastructure. Via our membership of the UK's HPC MaterialsChemistry Consortium, which is funded by EPSRC (EP/L000202),this workmade use of the facilities of HECToR, the UK's nationalhigh-performance computing service, which is provided by UoEHPCx Ltd at the University of Edinburgh, Cray Inc and NAG Ltd,and funded by the Office of Science and Technology throughEPSRC's High End Computing Programme.
References
1 Handbook of Photovoltaic Science and Engineering, ed. A.Luque and S. Hegedus, John Wiley & Sons, Chichester, 2003.
J. Mater. Chem. A, 2014, 2, 7829–7836 | 7835

Journal of Materials Chemistry A Paper
Ope
n A
cces
s A
rtic
le. P
ublis
hed
on 3
1 M
arch
201
4. D
ownl
oade
d on
07/
05/2
014
08:1
2:43
. T
his
artic
le is
lice
nsed
und
er a
Cre
ativ
e C
omm
ons
Attr
ibut
ion
3.0
Unp
orte
d L
icen
ce.
View Article Online
2 J. J. Scragg, P. J. Dale, D. Colombara and L. M. Peter,ChemPhysChem, 2012, 13, 3035–3046.
3 K. Ito and T. Nakazawa, Jpn. J. Appl. Phys., 1988, 27, 2094–2097.
4 S. Chen, X. G. Gong, A. Walsh and S.-H. Wei, Appl. Phys. Lett.,2009, 94, 041903.
5 W. Wang, M. T. Winkler, O. Gunawan, T. Gokmen,T. K. Todorov, Y. Zhu and D. B. Mitzi, Adv. Energy Mater.,2013, DOI: 10.1002/aenm.201301465.
6 B. Shin, O. Gunawan, Y. Zhu, N. A. Bojarczuk, S. J. Chey andS. Guha, Prog. Photovolt: Res. Appl., 2013, 21, 72–76.
7 J. J. Scragg, P. J. Dale, L. M. Peter, G. Zoppi and I. Forbes,Phys. Status Solidi B, 2008, 245, 1772–1778.
8 H. Katagiri, K. Jimbo, W. S. Maw, K. Oishi, M. Yamazaki,H. Araki and A. Takeuchi, Thin Solid Films, 2009, 517, 2455.
9 C. Wadia, A. P. Alivisatos and D. M. Kammen, Environ. Sci.Technol., 2009, 43, 2072–2077.
10 D. J. C. Mackay, Philos. Trans. R. Soc., A, 2013, 371, 20110431.11 X. Fontane, L. Calvo-Barrio, V. Izquierdo-Roca, E. Saucedo,
A. Perez-Rodriguez, J. R. Morante, D. M. Berg, P. J. Daleand S. Siebentritt, Appl. Phys. Lett., 2011, 98, 181905.
12 S. Chen, J.-H. Yang, X. G. Gong, A. Walsh and S.-H. Wei, Phys.Rev. B: Condens. Matter Mater. Phys., 2010, 81, 254204.
13 A. Walsh, S. Chen, S.-H. Wei and X.-G. Gong, Adv. EnergyMater., 2012, 2, 400–409.
14 M. Mousel, T. Schwarz, R. Djemour, T. P. Weiss, J. Sendler,J. C. Malaquias, A. Redinger, O. Cojocaru-Miredin, P.-P. Choiand S. Siebentritt, Adv. Energy Mater., 2013, 4(2), 1300543.
15 S. Ahmed, K. B. Reuter, O. Gunawan, L. Guo, L. T. Romankiwand H. Deligianni, Adv. Energy Mater., 2012, 2, 253–259.
16 A. Weber, R. Mainz, H. W. Schock and I. I. Experimental, J.Appl. Phys., 2010, 107, 013516.
17 Q. Guo, G. M. Ford, W.-C. Yang, B. C. Walker, E. a. Stach,H. W. Hillhouse and R. Agrawal, J. Am. Chem. Soc., 2010,17384–17386.
18 H. Katagiri, N. Sasaguchi, S. Hando, S. Hoshino, J. Ohashiand T. Yokota, Sol. Energy Mater. Sol. Cells, 1997, 49, 407–414.
19 T. Ericson, J. J. Scragg, T. Kubart, T. Torndahl and C. Platzer-Bjorkman, Thin Solid Films, 2013, 535, 22–26.
20 A. Fairbrother, X. Fontane, V. Izquierdo-Roca, M. Placidi,D. Sylla, M. Espindola-Rodriguez, S. Lopez-Marino,F. A. Pulgarın, O. Vigil-Galan, A. Perez-Rodrıguez andE. Saucedo, Prog. Photovolt: Res. Appl., 2014, 479–487.
21 L. A. Burton and A. Walsh, Appl. Phys. Lett., 2013, 102,132111–132111.
22 P. Sinsermsuksakul, K. Hartman, S. Bok Kim, J. Heo, L. Sun,H. Hejin Park, R. Chakraborty, T. Buonassisi andR. G. Gordon, Appl. Phys. Lett., 2013, 102, 053901.
23 J. J. Scragg, T. Ericson, T. Kubart, M. Edoff and C. Platzer-Bjorkman, Chem. Mater., 2011, 23, 4625–4633.
24 J. J. Scragg, T. Kubart, J. T. Watjen, T. Ericson,M. K. Linnarsson and C. Platzer-Bjorkman, Chem. Mater.,2013, 25, 3162–3171.
25 D. R. Lide,CRCHandbook, CRC Press, London, 83rd edn, 2002.
7836 | J. Mater. Chem. A, 2014, 2, 7829–7836
26 M. J. Chase, J. Phys. Chem. Ref. Data, Monogr., 1998, 9, 1–1951.
27 B. G. Mendis, M. D. Shannon, M. C. Goodman, J. D. Major,R. Claridge, D. P. Halliday and K. Durose, Prog. Photovolt:Res. Appl., 2014, 22, 24–34.
28 T. Schwarz, O. Cojocaru-Miredin, P. Choi, M. Mousel,A. Redinger, S. Siebentritt and D. Raabe, Appl. Phys. Lett.,2013, 102, 042101.
29 J. J. S. Scragg, L. Choubrac, A. Lafond, T. Ericson andC. Platzer-Bjorkman, Appl. Phys. Lett., 2014, 104, 041911.
30 R. P. Stoffel, C. Wessel, M.-W. Lumey and R. Dronskowski,Angew. Chem., Int. Ed., 2010, 49, 5242–5266.
31 K. Reuter, C. Stamp andM. Scheffler,Handbook of MaterialsModeling, Part A. Methods, Springer, Berlin, 2005, pp. 149–234.
32 K. Reuter and M. Scheffler, Phys. Rev. B: Condens. MatterMater. Phys., 2001, 65, 035406.
33 A. Soon, M. Todorova, B. Delley and C. Stamp, Phys. Rev. B:Condens. Matter Mater. Phys., 2007, 75, 125420.
34 A. J. Jackson and A. Walsh, Phys. Rev. B: Condens. MatterMater. Phys., 2013, 88, 165201.
35 V. Blum, R. Gehrke, F. Hanke, P. Havu, V. Havu, X. Ren,K. Reuter and M. Scheffler, Comput. Phys. Commun., 2009,180, 2175–2196.
36 V. Havu, V. Blum, P. Havu and M. Scheffler, J. Comput. Phys.,2009, 228, 8367–8379.
37 J. Perdew, A. Ruzsinszky, G. Csonka, O. Vydrov, G. Scuseria,L. Constantin, X. Zhou and K. Burke, Phys. Rev. Lett., 2008,100, 136406.
38 J. Moreno and J. Soler, Phys. Rev. B: Condens. Matter Mater.Phys., 1992, 45, 13891–13898.
39 K. Parlinski, Z. Q. Li and Y. Kawazoe, Phys. Rev. Lett., 1997,78, 4063–4066.
40 A. Togo, F. Oba and I. Tanaka, Phys. Rev. B: Condens. MatterMater. Phys., 2008, 78, 134106.
41 S. Chen, X. G. Gong, A. Walsh and S.-H. Wei, Appl. Phys. Lett.,2010, 96, 021902.
42 D. Fletcher, R. McMeeking and D. Parkin, J. Chem. Inf.Model., 1996, 36, 746–749.
43 L. A. Burton and A. Walsh, J. Phys. Chem. C, 2012, 116,24262–24267.
44 Q. Xu, B. Huang, Y. Zhao, Y. Yan, R. Nou and S.-H. Wei,Appl. Phys. Lett., 2012, 100, 061906.
45 O. Madelung, Semiconductors: Data Handbook, Springer-Verlag, Berlin, 3rd edn, 2004.
46 J. R. West, Ind. Eng. Chem., 1950, 209, 713–718.47 J. Berkowitz and J. Marquart, J. Chem. Phys., 1963, 39, 275–
283.48 H. Rau, T. Kutty and J. Guedes De Carvalho, J. Chem.
Thermodyn., 1973, 5, 833–844.49 A. Khare, B. Himmetoglu, M. Johnson, D. J. Norris,
M. Cococcioni and E. S. Aydil, J. Appl. Phys., 2012, 111,083707.
50 A. Redinger, D. M. Berg, P. J. Dale and S. Siebentritt, J. Am.Chem. Soc., 2011, 133, 3320–3323.
This journal is © The Royal Society of Chemistry 2014