journal of ornamental horticulture
TRANSCRIPT

Print : ISSN 0972-0499Online : ISSN 2249-880X
JOURNAL OFORNAMENTAL
HORTICULTUREVOLUME 20 (1&2), January-June 2017
Official Publication of :
Division of Floriculture and LandscapingICAR–Indian Agricultural Research InstituteNew Delhi-110 012, INDIA
INDIAN SOCIETY OF ORNAMENTAL HORTICULTURE
Journal is also available online at : www.indianjournals.com
AMN ER NO T AF LO HY OT REI TC ICO US L
N TUAI RD ENI


JOURNAL OF ORNAMENTAL HORTICULTURE
Vol. 20 No. 1&2, 2017
CONTENTS
Advances in integrated nutrient management of bulbous flower crops 1— A reviewKishan Swaroop, Kanwar Pal Singh, Sapna Panwar, Namita and Sunita Dhakar
Improvement in post harvest quality of cut flowers of Rosa hybrida cv. 21'First Red' using biologically synthesized silver nanoparticlesShisarenla Aier, P.K. Borthakur, R.C. Boro, H. Boruah, G. Goswami and Lallan Ram
Effect of pinching, urea and GA3 on growth, flowering and seed attributes 34in African marigold (Tagetes erecta L.)Anil K. Singh, Pavan Kumar, Anjana Sisodia, A.K. Pal, H.V. Singh and Minakshi Padhi
Studies on the storage methods of bulbs in Lilium var. Brindisi 40Imchalemla and Pauline Alila
Cluster analysis of chrysanthemum (Chrysanthemum × morifolium Ramat.) 46genotypes on the basis of anthocyanin and carotenoid pigmentsShisa Ullas P., Namita, Kanwar Pal Singh and Sapna Panwar
Evaluation and variability studies in carnation genotypes 54Pratibha Chauhan, S.R. Dhiman, Y.C. Gupta, Bharti Kashyap, R.K. Guptaand R.K. Dogra
Assessment of integrated weed management practices on weed flora, 61flowering, corm yield and net returns in gladiolus cv. Pusa Srijana underDelhi conditionsKishan Swaroop, D.V.S. Raju, T.K. Das, V.K. Sharma and Sunita Dhaker
Evaluation of tuberose (Polianthes tuberosa L.) cultivars under the foothill 69conditions of NagalandAndrew Lalthawmliana, Rokolhu Keditsu, Y. Angngoi Buchem and Lokam Bagang
Effect of growing media and primary nutrients on postharvest life of cut 75flowers of anthurium var. TropicalTatte Sumathi, S.L. Chawla, Sudha Patil and Neelima Palagani
Determination of total phenolics and antioxidant content in lily bulb extracts 80M.R. Dhiman, Chander Parkash, S.S. Sindhu, Raj Kumar and Chandresh Chandel

Assessment of the horticultural significance of lesser 60known Jasmine (Jasminum spp.) wealthM. Ganga, P. Madhumalar, M. Jawaharlal and P. Ranchana

1
Advances in integrated nutrient management of bulbous flower crops — A reviewJournal of Ornamental Horticulture. 20 (1&2): 1-20, 2017
Advances in integrated nutrient managementof bulbous flower crops — A review
KISHAN SWAROOP, KANWAR PAL SINGH, SAPNA PANWAR, NAMITA and SUNITA DHAKAR
Division of Floriculture and LandscapingICAR–Indian Agricultural Research Institute, New Delhi-110012
E-mail: [email protected]
ABSTRACT
Now-a-days, conservation of soil health and environment is a major issue during neutrientmanagement for crop plants as imbalance use of inorganic fertilizers caused gradual decline inproductivity of crop plants in recent past. Integrated nutrient management (INM) is an approachwhich involves judicious combined use of chemical fertilizers, organic manures including cropresidues, vermicompost, green manures and biofertlizers in specific farming system to attainparticular yield targets in crop plants. Cultivation of bulbous flower crops like Lilium, Gladiolus,Tuberose, Tulips, Dahlia, etc. forms major source of income for the farmers due to high demandfor their cut flowers and flower bulbs in domestic as well as export market. INM in bulbous cropsneeds due attention to get quality flowers, high yield, quality planting material and to managemacro and micronutrient disorders. The main agenda of INM in bulbous crops involves balancedapplication of appropriate fertilizers at right time using right method to achieve target yield. INMtechniques like fertigation through drip irrigation, use of controlled release fertilizers and specialityfertilizers, vermicompost and biofertlizers are very helpful to conserve soil health and environment.Nutrient conservation in the soil can be done through organic mulches, cover crops, intercroppingand biological nitrogen fixation which act as physical barriers to wind and water erosion. Nutrientrecommendation for bulbous crops through soil and plant analysis is very essential to maintainsoil health and productivity of flower crops. In this regard, new approaches like Site SpecificNutrient Management (SSNM), Soil Test Crop Response (STCR), 4R stewardship concept givenby International Plant Nutrition Institute (IPNI's) would help in minimizing nutrient loss, increasingnutrient use efficiency, enhancing yield and promoting environmental sustainability.
Keywords: INM, bulbous crops, nutrient use efficiency.
INTRODUCTION
Cultivation of cut flowers is a fast emergingenterprise and potential money spinner in thefloriculture industry as they provide higherreturns per unit area of production. The exportof floricultural products from India has been onan increase in the past five years due to highdemand for floriculture products in importingcountries. The total area under floriculture in
India is 248.51 thousand hactare with productionof 1685 thousand tonnes loose flowers and 472thousand tonnes of cut flowers during 2014-15(www.apeda.gov.in). Total export of floricultureproducts during the year 2015-16 is 22,518 MTwith value of 479 crores (www.apeda.gov.in).Among flower crops, bulbous crops such asLilium, Freesia, Gladiolus, Tulip, Iris are highlyvaluable as cut flowers in both international and

2
Kishan Swaroop, Kanwar Pal Singh, Sapna Panwar, Namita and Sunita Dhakar
domestic market. They are used for gardendisplay as well as flower decoration purposes.Tuberose is used in south India for makinggarlands, wreath and veni making. Zantedeschiaand Zephryanthes are used as potted plants,interior plants as well as outdoor gardening.Dahlias are widely used as garden plants andpotted plant purpose. Likewise, bulbous cropshighly sought by the people for variouspurposes. Integrated Nutrient Management(INM) in bulbous crops is very important toaddress the issues like poor quality of cutflowers, poor quality planting material,inappropriate planting methods and fertilizationpractices which result in low yield andproduction. One of the factors affecting theproductivity of most of the floricultural cropsis improper use of nutrients. To improve theproductivity, adequate amount of fertilizers inbalanced proportion should be used which hasbeen given less attention by the flower growersor floriculturists.
Table 1 : Area and Production of major bulbous crops.
Crops Area ('000ha) Production ('000 MT)
Gladiolus 10.44 154.67Tuberose 14.92 196.32Tulip 0.02 0.10
Source: Agriculture Statistics at a Glance, 2016
Fertilizer use scenario in India
India is the third largest producer and consumer
of fertilizers in the world, after China and USA.It accounts for 12.2% of the world's productionof nitrogenous (N) and phosphatic (P) nutrientsand 12.6% of the world's consumption of NP &K (Potash) nutrients. Per hectare consumptionof NPK in India is 126 kg per ha (AgricultureStatistics at a Glance, 2016). Production hasbeen ranging between 174 MT to 216 MT,during the last 7 years and the rate of growth offood production has shown a declining trend,inspite of increase in fertilizer consumptionduring recent times, due to the adverse impactof imbalanced use of fertilizers on food grainproduction and productivity.
Problems due to imbalance use of chemicalfertilizers
Nutritional stress in plants results from nutrientimbalances in the soil. Balanced plant nutrientsupply ensures high yields and quality flowers.It refers to application of different nutrientelements in the proportion required for optimumgrowth of plants. Fertilizers are meant to correctnutrient deficiencies and improve soil fertilityso that higher productivity is sustained. In early1960s, when fertilizer responsive varieties wereintroduced in India, optimum yield could beobtained with the application of nitrogenousfertilizers alone. However, the bumper harvestsdepleted the soils by excessive mining of othernutrients and their deficiencies started appearingrapidly. The inadequate and imbalanced fertilizer
Table 2 : Nutrient deficiencies in bulbous flower crops
Nutrient disorders Deficiency or toxicity of nutrients Genera
Topple Calcium TulipsLeaf cracking Boron Tulips, TuberoseLeaf scorch Fluoride Lilium, Gladiolus, FreesiaChlorosis Manganese / Magnesium Almost all generaSpike cracking Calcium Tuberose, GladiolusInterveinal yellowing Iron Gladiolus
Source : (Hertogh and Lenard, 1993)

3
Advances in integrated nutrient management of bulbous flower crops — A review
use has induced widespread multinutrientdeficiencies and consequently deteriorating soilhealth in many parts of India. The mining ofnutrients by increased production over the yearshave far exceeded the amount of nutrientsreplenished through fertilizers. Excess nitrogenuse leads to groundwater and environmentalpollution apart from destroying the ozone layerthrough N2O production. Due to intensivecultivation and imbalance of nutrients use in lastfour decades the deficiency of secondary andmicronutrients have developed in addition to N,P and K. Apart from these, there is decline inwater table and its quality of water and soilorganic carbon content leads to overalldeterioration in soil health. Soil analysis datahas shown that at the country level, and out of500 districts surveyed, the soils of districts werelow in available N (93%), P (91%) and K (51%),respectively. Among the secondary andmicronutrients, 41% of soils have been founddeficient in S, 44% in Zn, 15% in Fe, 8% inCu, 6% in Mn, 33% in B and 13% in Mo.
Why INM is needed in bulbous crops?
INM is very essential to address the followingissues,
• Declining productivity due to poor qualityplanting material
• Appearance of deficiency in secondary andmicronutrients.
• The physical condition of the soil isdeteriorated as a result of long-term use ofchemical fertilizers
• The recent energy crisis, high fertilizer costand low purchasing power of the farmingcommunity have made it necessary torethink alternatives.
• Unlike chemical fertilizer, organic manureand biofertilizer are available locally atcheaper rates.
• 20-25% plant nutrients can be met byrecycling farm and industrial wastes and bythe use of biofertlizers (Prasad et al. 2014)
Integrated nutrient management -Panaceafor soil health and productivity
INM maintains soils as store houses of plantnutrients essential for overall growth of plants.Integrated nutrient management (INM) is anapproach to soil fertility management thatcombines organic and mineral methods of soilfertilization with physical and biologicalmeasures for soil and water conservation. INM'sgoal is to integrate the use of all natural andman-made sources of plant nutrients, so thatcrop productivity increases in an efficient andenvironmentally benevolent manner, withoutsacrificing soil productivity for future genera-tions. Integrated Nutrient Management (INM orIPNM) is an approach, which adapts plantnutrition to a specific farming system andparticular yield targets, the resource base, theavailable plant source and socio-economicbackground (Dudal and Roy, 1995). For a trueINM programme, monitoring of all incomingnutrients (including those in irrigation water)and outgoing nutrients from a farm has to bedone.
Components of integrated nutrient manage-ment
It is well known fact that balanced nutrition isessential for the growth, development andflowering of crops. All the elements playimportant role both in the vegetative andreproductive growth and are indispensable forproduction of foliage and flowers. As nitrogen,phosphorus and potassium are required in largequantities and hence, affect plant growth moreas compared to other mineral nutrients. Inaddition to these, secondary nutrients likecalcium, sulphur and magnesium are alsoneeded in fairly large quantities than the other

4
Kishan Swaroop, Kanwar Pal Singh, Sapna Panwar, Namita and Sunita Dhakar
essential elements such as iron, manganese,zinc, copper, boron, molybdenum and chlorine.Some of them viz., nitrogen, phosphorous andsulphur are consumed in building up the plantarchitecture while calcium, potassium andmagnesium have both tissue building andmetabolic functions. However, other essentialelements such as boron, iron, manganese,copper, zinc and molybdenum have metabolicfunctions in the plant life. Chelated compoundsare used to increase the availability ofmicronutrients and make them available to theplants. Recommended manures and fertilizersare conventionally applied to the soil either asbasal dose or top dressing. However, foliarnutrition is an effective method of applyingnutrients for better production in crops likebulbous crops (Lilium, Zantedeschia), Orchidsand potted foliage plants.
NUTRITIONAL MANAGEMENT INBULBOUS FLOWER CROPS USINGINORGANIC FERTILIZERS
Gladiolus
Gladiolus corms are store houses forcarbohydrates which are sufficient to sustainplant growth for initial plant growth like leafemergence. The cormels, however, require fairlygood amount of fertilizers because of limitedamount of stored food due to their small size.Gladiolus requires both macro as well as micronutrients for good growth and flower production.Healthy gladiolus plants should contain 2.5 to3.0 per cent N on dry weight basis. Applicationof nitrogen varies with the agro-climaticconditions, under which the crop is grown.Nitrogen deficient plants remain weak, showpale green leaves, and produce shorter spikeswith small-sized florets whereas excess nitrogenmakes them lanky. Nitrate form of nitrogen isthe safest and most suitable source of nitrogenas compared to ammonical form. The use of
excessive ammonical nitrogen is detrimental tothe crop as it causes high incidence of diseases.Nitrogen should be applied in two equal splitdoses; first, when the plant reaches 3rd leafstage, and second when it reaches 6th leaf stage.In addition, as and when the plants showsymptoms of nitrogen deficiency, an additionalapplication may be given immediately. Cormelsmay be given nitrogen in 4-5 applications atabout 3 week intervals, starting the firstapplication at one month of the crop age.Nitrogen application should be stopped atleastsix weeks before the harvesting of corms.
Phosphorus is an essential nutrient required forthe development of good root system. For bettergrowth in general, the leaves of gladiolus shouldcontain 0.3-0.4 per cent phosphorus on dryweight basis. Full dose of phosphorus shouldbe applied as a basal dose. The roots of gladiolusare highly sensitive to high salt concentrationsin the soil. Therefore, in heavy soils, thephosphorus application may be delayed till theplant reaches 2-3 leaf stage and develops goodroot system. Potassium is known to increaseresistance to diseases and photosyntheticefficacy of leaves. Potassium deficiency causesreduction in spike length, number of florets andcorm size. Healthy plants of gladiolus shouldcontain 3-4 per cent potassium in the leaves ondry weight basis. Potassium may be applied atthe time of planting of corms or when the plantreaches 1-2 leaf stage.
Important macro and micronutrients forgladiolus are magnesium (Mg), Calcium (Ca),iron (Fe), boron (B), Manganese (Mn), Zinc (Zn)and Copper (Cu). Iron deficiency is, however,most prevalent in gladiolus especially in NorthWestern plains of India. Iron deficiency causesinterveinal yellowing of new leaves and insevere deficiency, the emerging spikes turn lightgreen to yellow. The deficiency is morepronounced in alkaline soils or in the soil where

5
Advances in integrated nutrient management of bulbous flower crops — A review
levels of copper, manganese, zinc or phosphorusare very high. Always apply freshly preparedsolution because the ferrous is oxidized to ferricand become unavailable to the plant.
Kosugi and Sano (1961) recorded greater plantheight, weight of the tops and percentage offlowering using N (100 ppm) twice a week thanthose grown without nitrogen, in gladiolus cv.Spotlight. The findings of Skalska (1968)revealed that gladiolus responded to higher ratesof nitrogen fertilization and regardless of theratio with other nutrients, increased corm andcormel weight and produced a higher proportionof flowering grade corms in gladiolus cv. Luna.Bhattacharjee (1981) reported that increasinglevel of nitrogen delayed flowering and greatlyincreased flower spike length, corm weight, sizeand number of cormels per plant. 20 g N/m2
was suggested to be the optimum dose ofnitrogen under Delhi conditions, producing themaximum number of florets/spike and thelargest flowers in gladiolus. Anserwadekar andPatil (1986) observed that the lowest level of N(100 kg ha–1) produced the greatest number ofopen florets (2.4), while the treatmentcombination 100 kg N + 150 kg P2O5 ha–1
showed maximum water absorption (21.0 mlduring 8 days) in gladiolus. Post harvest studiesconducted by Dey (1995) at IARI, New Delhi,revealed that gladiolus cv. Dhanvantari whichreceived 20 g/m2 of N, P and K produced 1.65unopened, 0.60 partially opened and 10.90opened florets, out of 13.15 florets per spike.The diameter of first and third florets measured8.65 cm and 7.60 cm respectively. Fresh weightof spike increased on the third day in vase waterand decreased to a minimum at senescence.Singh (1997) studied the response of single andsplit doses of nitrogen application in gladiolus,cultivar Pink Friendship under Bangaloreconditions. Basal application of the entireamount of nitrogen significantly increased spike
and rachis length, while application of nitrogenin two split doses, i.e., 30 and 60 days afterplanting (DAP) caused flowering to be inducedearlier by 12 day. Among all the differentelements, nitrogen is required in the highestconcentration for gladiolus. It is necessary forthe synthesis of amino acids, amines, proteins,nucleic acids, nucleotides, purines, pyrimidines,and co-enzyme is a constituent of thechlorophyll molecule (Salisbury and Ross,1995). Pandey et al. (2000) carried out a fieldtrial at Agra on gladiolus cv. Psittacinus hybridand reported that maximum value of growth andflower characters were found at the applicationof 200 kg N and 400 kg P/ha as compared toother treatment combinations. Sharma and Singh(2001) conducted an experiment at AllahabadAgricultural Institute Deemed University,Allahabad in gladiolus and observed number,weight and diameter of corms were highestunder 7.5 g/m2 and lowest under highest dosei.e. 25 g/m2 through calcium ammonium nitrate(CAN) application.
Tuberose
Tuberose requires heavy nutrition, thereforefertilizer application is essential for itscultivation. In tuberose, nitrogen is much morevital element than phosphorous and potassiumwhich influences yield and quality of flowersand bulb production. Nitrogen deficiencyreduces number of spikes and flowers as wellas turning of foliage to pale green. However,excess nitrogen makes the flower spikes quitetall and soft further making them vulnerable towind and pests. Application of 325 kg N and125 kg each P2O5 and K2O per hectare resultedin high uptake both at 50% flowering andharvesting stage. Kadu and Sable (2003)reported maximum spike length (105.54 cm),maximum number of spike per hectare with theapplication of 300 kg N and 150 kg P intuberose. The application of 200 kg N and 150

6
Kishan Swaroop, Kanwar Pal Singh, Sapna Panwar, Namita and Sunita Dhakar
kg P per ha was found economically beneficialfor flower production of tuberose. Nagaraju etal. (2003) conducted an experiment in tuberoseand reported that the highest level, 150: 75: 75kg NPK/ha recorded the highest number offlorets per spike (54.7) and maximum vase lifeperiod (18.0 days) was noticed in the plantsupplied with NPK of 150: 50: 50 kg ha–1. Paland Biswas (2003) carried out an experiment atBidhan Chandra Krishi Viswavidyalaya,Mohanpur, West Bengal to study the effect ofNPK on growth and flowering in tuberose. Theapplication of 20g/m2 each of N, P2O5 and K2Orecorded the highest plant height, number ofleaves and spikes. However, N and P2O5 eachat the rate of 15g/m2 and K2O, 20g/m2 improvedspike length, weight and number of spike/m2.Treatment combination of N3 P2 K2 (200: 150:200 kg/ha) was found significantly superior inrespect of plant height (76.00 cm), flower stalkper plant (11.70), number of bulbs per plant(43.70) in tuberose as observed by Gurav et al.(2006). Lekhi and Sharma (2006) reported intuberose that the increasing levels of nitrogenincreased the number of leaves per plant, plantheight, length of spike, length of rachis, yieldof spike, and number of bulbs. Dhar et al. (2008)conducted an experiment at Punjab AgricultureUniversity, Ludhiana in tuberose and found thatthe vegetative growth and flowering wereinfluenced by application of N. At the same timeP increased the number of spikes, rachis lengthand longevity of flower. There was significantincrease in height of plant, number of leavesand leaf area per plant. It was found that 20gN/m2 was optimum for vigorous growth of theplant.
Lilium
In Lilium, due to high nutrient reserve in bulbsfertilization is not required during forcing.Fertilization programme should be commencedat shoot emergence using calcium nitrate and
potassium nitrate at 2:1 ratio on weekly basisand medium should be amended withphosphorous. Constant fertilization throughoutthe growing period should be done with nitrogenat 200-500 ppm. The tissue nutrient level inLilium (Janakiram et al., 2013) Table 3 & 4.
Table 3 : Tissue nutrient level in lilium.
Nutrient Range Nutrient Range
Nitrogen 2.4-4.0 % Iron 100-250 ppmPhosphorous 0.1-0.7 % Zinc 30-70 ppmPotassium 2.0-5.0 % Copper 5-25 ppmCalcium 0.2-0.4 % Boron 20-25 ppmMagnesium 0.3-2.0 % Manganese 50-250 ppm
Table 4 : Fertigation schedule for lilium cultivationrecomminded by Tamil Nadu AgriculturalUniversity, Coimbatore.
Nutrients Quantity (g/m2/week)
Asiatic Oriental
Calcium nitrate 2.5 2.519:19:19 0.5 0.5Potassium nitrate 2.2 2.3Micronutrient mixture 1.2 1.2
Prakash et al. (2006) conducted studies onLilium. Maximum number of buds (3.34) wasrecorded in treatment receiving combinedapplication of 120 mg N and 20 mg P/kg soil.The maximum flower size was recorded withthe application of 160 mg N and 30 mg P/kgsoil.
Dahlia
Dahlia shows better growth, quality flowers andyield of tubers when nitrogen and phosphorouswere applied in optimum doses. Application of40 Kg N, 50 Kg P2O5 and 40 Kg K2O per acrewere optimum for flower yield, while omissionof nitrogen markedly reduced the plant growthand flowering (Bose et al. 2003). It is suggestedto apply full dose of phosphorous and potashand half dose of nitrogen before planting and

7
Advances in integrated nutrient management of bulbous flower crops — A review
(i) Maximum fertilizer use efficiency by thecrops
(ii) Harnessing best possible positive andsynergistic interactions amongst thevarious factors of production (plantingmaterial, water, agrochemicals etc.)
(iii) Least adverse effect on environment byminimizing nutrient losses
(iv) Maintaining soil productivity and soilhealth
(v) Sustaining high yields commensuratewith the biological potential of the cropvariety under the unique soil, climateand agro-ecological set-up.Balance has to be maintained in the soil- crop system and it has also to take careof all other factors of production and
Table 5 : Major nutritional deficiencies in bulbous crops and their management practices.
Crops Nutritional deficiency Symptoms Management
Gladiolus Boron deficiency • Youngest emerging leaves • Apply acid forming fertilizers whichexhibit Interveinal chlorosis. solubilise soil iron for the plant and
• Spike size is reduced increases iron availability.• Flowers do not open fully • Foliar spray of 0.5 % FeSO4 at pH
4-5 a surfactant and 0.2% urea.
Manganese deficiency • Interveinal chlorosis of young and • Foliar spray of 0.5% MnSO4 orphysiologically mature leaves. The 0.3% MnCl2 immediately afterleaves do not turn yellowish in foliar symptoms appear.severe conditions as in iron • Apply NPK fertilizers in band neardeficiency the cormels to correct the disorder
Magnesium deficiency • The older or lower leaves are • Applying MgSO4 to soil at 500chlorotic with the base of the leaf Kg/haremaining green while the tip • If the pH is 7 or above andis chlorotic applying dolomite at same rate as
basal dose if soil is acidic.• Foliar spray of 0.5 to 1.0% MgSO4
Tuberose Calcium deficiency • Spike cracking, but in acute • Apply 100-120 mg/liter Calciumcases to bud rot. sulphate
Magnesium deficiency • Interveinal chlorosis of older leaves • Foliar spray of 0.5 to 1.0% MgSO4
Boron deficiency • Cracking of leaf margin, deformed • Spray 0.2% Boric acidleaves. and stunted inflorescence
Tulip Calcium defeciency • Toppling of stem • Apply calcium sulphate@ 200 mg/litre
the remaining half of nitrogen, forty days afterplanting.
Amaryllis
Proper nutrition is very important for normalgrowth and development of plants. High levelof nitrogen favours maximum plant growth andnumber of flower stalks and flowers.Application of 200 kg N and 400 kg each P2O5and 200 Kg K2O per hectare give maximumyield of bulbs, bulblets and flowers.
Importance of balanced fertilization inbulbous flower Crops
Balanced fertilization in bulbous flower cropsis the rational use of fertilizers and organicmanures for supply of nutrients for productionin such a manner that would ensure

8
Kishan Swaroop, Kanwar Pal Singh, Sapna Panwar, Namita and Sunita Dhakar
make allowances for residual effects ofpast fertilizer applications, N fixation etc.,and to ensure that there is no toxicity/deficiency of any element (Table 5).
Low nutrient efficiency in flower crops
Nutrient use efficiency represents betterassimilation of nutrients by the plants hencebetter nutrient management (Table 6). Withcareful agronomic practices it is possible to raisethe average N use efficiency by at least 25 -30% during the next two generations (Smil,2001). In the field level at least 50% of theapplied nitrogen is lost from agriculture systemsand most of the loss occur during fertilizerapplication. Adapting fertilizer best managementpractices in flower bulbous crops is veryimportant to increase nutrient use efficiency.
Technologies to improve nutrient useefficiency in flower crops by use of controlledrelease fertilizers
Commonly available urea from market wasmodified to improve its use efficiency bymaking it slowly soluble through physicaltransformation (e.g. Urea super granules (USG),coated with lac etc.,) and chemical/biologicalmodifications (sulphur-coated, neem oil/extract-coated, guar- gum-blended, tar-coated etc.). Ureais also useful for foliar application andfertigation. Ammonium sulphate is notrecommended in high rainfall areas due to itshigh residual acidity. Calcium ammonium nitrateis useful where supplement with calcium is
necessary. Single superphosphate (SSP) andDiammonium phosphate (DAP) are the mostcommon phosphatic fertilizers used. Muriate ofpotash (MOP) is widely used potassic fertilizer.In bulbous crops chlorides interfere with quality,sulphate of potash is recommended. Severalcompound/complex fertilizers are available thatcontain more than one major nutrient but needto supplement with straight fertilizers to meetthe exact needs of the crops.
Time and method of application
The key to enhance fertilizer use efficiency isto synchronize the time of fertilizer applicationwith the growth need of the crop and period ofhigh root activity. It is useful to increase thenumber of split applications provided the costof application is not prohibitive. It is best toapply fertilizers prior to vegetative flushing,usually as pre- and post monsoon applications.It is best to apply fertilizers as a band close tothe zone of high root activity followed by properincorporation into soil.
Foliar fertilization
An appropriate time to consider foliarfertilization would be when a shortage of anutrient is evident as indicated by tissue analysisor visual symptoms. In these situations, foliarfertilization provides the quickest means tocorrect the problem (Table 7). Certain soilconditions, such as high pH, excess moisture,or cool temperatures, may render a nutrient ornutrients unavailable to the plant root. If these
Table 6 : Low nutrient use efficiency in crop plants and their causes (Prasad et al. 2014).
Nutrient Efficiency (%) Cause of low efficiency
Nitrogen 30-50 Immobilization, volatilization, denitrification, leaching
Phosphorus 15-20 Fixation in soils Al - P, Fe - P, Ca - P
Potassium 70-80 Fixation in clay - lattices
Sulphur 8-10 Immobilization, leaching with water
Micro nutrients (Zn, Fe, Cu, Mn, B) 1-2 Fixation in soils

9
Advances in integrated nutrient management of bulbous flower crops — A review
conditions exist, the problem may be moreeffectively corrected by foliar applicationscompared with soil applications. Two to threesprays of micronutrients are needed to meet cropdemands. Nutrients applied to the leaves canbe absorbed and utilized by the plant. However,for nitrogen, phosphorus, and potassium thequantity absorbed at any one time is smallrelative to the larger levels required for growthby the plant. Foliar application of these threenutrients cannot be expected to supply the totalamount required for crop production.
Drip irrigation and fertigation
Drip irrigation is seriously recommended inprotected cultivation of flower crops to timeysupply of irrigation water under low pressuresdirectly to or near the plant's root zone. Dripirrigation is often used in combination withplastic mulch. Advantages of using dripirrigation include better control of foliar diseasesand more efficient water and fertilizer use. Watersavings with drip irrigation can amount to as
much as 50% compared with overhead sprinklersystem. Fertigation refers to the application ofwater soluble fertilizer through the irrigationwater. Providing nutrients through the irrigationsystem enables more flexibility in a fertilizerprogramme. The type of system selected willdepend on the crop being grown and resourcesavailable. Nitrogen is the primary nutrientapplied through the system. Urea is the mosteconomical source of nitrogen to apply;potassium nitrate and ammonium sulphate aresoluble and can also be used. Calcium nitrate isalso water-soluble but may precipitate if injectedin high pH water. Drip irrigation, in combinationwith plastic mulch, allows for precise timing(spoon feeding) of nitrogen. Small amounts canbe applied daily (0.5-1.0 kg N/a) or weekly (2.5-5.0 kg N/a) to meet the growth demands of thecrop. Potassium can also be injected withoutany precipitation problems, although in mostsoils, a broadcast and starter application canmeet plant requirements. Phosphorus mayprecipitate with micronutrients or with calcium
Table 7 : Effect of foliar fertilization on bulbous flower crops.
Crop Fertilizers Findings Authors
Gladiolus Salicylic acid and Foliar sprays of SA 150 ppm and Ca(NO3)2 1% Padmalatha et al. (2014)calcium nitrate recorded maximum vegetative growth and were
significantly effective in induction of earlyflowering in the plants raised from cormels.These treatments also recorded significantlyhighest flowering percentage
Zinc sulphate In gladiolus cv. Friendship, foliar spray of zinc Sharma et al. (2004)sulphate at 0.6 per cent increased the plantheight, spike length, number of florets per spike,number of corms and cormels per plant.
Dahlia NPK (17:17:17) Foliar application significantly promoted the Fahad et al. (2014)number of flower per plant, number of leaves perplant, diameter of bud, diameter of flower, freshweight of flower and dry weight of flower of thedahlia
Lilium Zinc and copper Foliar application of zinc and copper was found Asmita and Singh (2015)beneficial for growth and post-harvest life of cv.Albedo. Maximum solution uptake and vase lifewas observed with Zn 0.4% + Cu 0.2%

10
Kishan Swaroop, Kanwar Pal Singh, Sapna Panwar, Namita and Sunita Dhakar
and magnesium in the irrigation water resultingin clogging problems. Some micronutrients suchas copper, iron, manganese, and zinc may alsoprecipitate in high pH water. For most situations,P and micro nutrients, if needed, should beapplied to soil before planting. These elementscan be injected alone in the drip system withoutprecipitation problems. For P applicationthrough drip system phosphoric acid should beused. For micronutrients, chelated forms shouldbe applied to soils. Clogging problems in driplines can be corrected by injecting acids intothe line to dissolve precipitates. If bacteria oralgal growth causes clogging, then chlorineshould be mixed with water.
Visible identification of nutrient disorders(Ganeshmurthy et al. 2016)
• If it is a nutritional problem, all the plantswithin a small area are affected and within aplant all parts of the same physiological age
are affected.
• Observe whether the symptoms are inyounger or older leaves.
• If the symptoms are on the older leaves onemay suspect for N, P, K or Mg deficiency:
a. Chlorosis if uniform - N or P deficiency
b. Symptoms on the margins - K deficiency
c. Interveinal (inverted V shape) - Mgdeficiency
• If the symptoms are on younger leaves thenthere is a possibility of Ca, S or micronutrientdeficiency
a. Symptoms similar to N but appear onyounger leaf-S deficiency
b. Symptoms on terminal or growing tips -Ca, B or Cu deficiency
c. Intervein alchlorosis and short internodes- Zn, Fe, Mn deficiency
Table 8 : Effect of organic manures on growth and development of bulbous crops.
Crop Organic manure /s Results Authors
Lilium Vermicompost Plants of cv. Novona treated with 30% Moghadam et al. (2012)Vermicompost has higher number no. ofleaves, stem height and diameter, increasedGA3 content in roots
Vermicompost + Increased proline, soluble carbohydrate, K, and Mousavi and Ordebilisugarcane bagasse Ca contents were observed in leaf and root (2014)sewage-sludge tissues in plantsbased compost
Tuberose 75% recommended The maximum spike yield (205030.71 spikes/ha), Tripathi et al. (2012)dose of (240:160: shoots clump–1 (18.95) and number of leaves100 kg NPK ha–1)+ shoot–1 (19.44) were recorded in cv. Suvasini500q ha–1 FYM +250q ha–1
vermicompost
Freesia Straw mulch + Black plastic mulch triggers plant growth and Younis et al. (2012)plastic mulch development (vegetative growth) while straw(black and white) mulch encourages flower production both
qualitatively and quantitatively in freesia plants.
Gladiolus Vermicompost 8 t/ha Enhanced quallity of florets and maximum yield Dongardive et al. (2007)+ azotobacter 5 kg/ of spikes compared to other treatments in cv.ha+ PSB 5 kg/ha White Prosperity

11
Advances in integrated nutrient management of bulbous flower crops — A review
Organic manures
Organic manures are valuable by-products offarming and allied industries, derived from plantand animal sources. These manures have theadvantage of supplying secondary and micronutrient along with NPK, which is importantfor sustained production (Table 8). Increase thebiological activity in soil by providing supportfor earthworms, micro-organisms, fungi andbacteria and helps in nutrient cycling.
They also stabilize soils against erosion andfloods, detoxify ecosystems and may even helpcounteract climatic change by restoring soil'scapacity to carbon sequestration.
a. Bulky organic manures - supply plantnutrients in small quantities and organicmatter in larger quantities. Examples,farmyard manure (FYM), biogas slurry,composts, green manure, poultry manure, etc.
b. Concentrated organic manures - containhigher percentages of major plant nutrients(NPK) as compared to bulky organic manures.Examples, oilcakes, fish manure, etc.
Description of some organic sources
Farmyard manure (FYM)
FYM is a decomposed mixture of dung andurine of farm animals along with the litter(bedding material) and left-over material from
roughages or fodder fed to the cattle. On anaverage, it contains 0.5% N, 0.2% P2O5 and0.5% K2O.
Biogas slurry
Biogas (Gobar gas) plant produces methane andbiogas slurry, which could be used as a valuablemanure in bulbous flower crops. Biogas slurryis quite rich in nitrogen than the originalingredients due to addition of living and deadmicro-organisms. Biogas slurry also containsphosphates, potash, sulphur and a number ofmicro-nutrients like zinc and iron. Biogas slurryis extremely cheap and is made by locallyavailable material. It can be directly used in riceafter mixing with irrigation water.
Poultry manure
It is rich organic manure, since liquid and solidexcreta are excreted together resulting in nourine loss.It is a rich organic manure, sinceliquid and solid excreta are excreted togetherresulting in no urine loss. It is rich organicmanure, since liquid and solid excreta areexcreted together resulting in no urine loss.
Green manuring
Green manure crops are grown usually forrestoring or enhancing soil organic mattercontent, properties of soil and nitrogen content
Table 9: Potential N contributions of N- fixing legumes to succeeding crops in Indian soils.
Name Botanical name Sowing Average yield N Nseason of green (% on green added
matter (t/ha) weight basis) (kg/ha)
Sannhemp Crotalaria juncea Kharif 15.2 0.43 84.0Dhaincha Sesbania aculeata Kharif 14.4 0.42 77.1Mungbean Vigna radiata Kharif 5.7 0.53 38.6Cowpea Vigna ungiculata Kharif 10.8 0.49 56.3Guar Cyamopsis tetragonoloba Kharif 14.4 0.34 62.3Senji Melilotus alba Rabi 20.6 0.51 134.4Khesari Lathyrus sativus Rabi 8.8 0.54 61.4Berseem Trifolium alexandrinum Rabi 11.1 0.43 60.7
12
Kishan Swaroop, Kanwar Pal Singh, Sapna Panwar, Namita and Sunita Dhakar
in the soil and their use in cropping system iscalled green manuring. Legumes are generallyused as green manure crops due to their abilityto fix atmospheric nitrogen in the root nodulesthrough symbiotic association with a bacterium(Table 9). They can add 60-120 kg N /ha andcan meet entire demand of the crop in manycases (Prasad et al. 2014). The application ofgreen manures like Gliricidia trilobus,Phaseolus trilobous and Oxalis corniculata atthe rate of 10 ton/ha promoted early spikeemergence in tuberose (De and Dhiman, 2001).
Characterstics of green manure crops are
Pants are of multipurpose, short duration, fastgrowing and high nutrition accumulation ability.Tolerant to shade, flood and drought, water useefficient, photoperiod insensitivity, long seedvaibility.
Green manuring can be done in two ways asgiven below :
1. Green-leaf manuring : Green leaves andtender green twigs collected from shrubs andtrees grown on bunds, wastelands and nearbyforest areas. The common shrubs and treesused are Glyricidia (Glyricidia maculata),Sesbania (Sesbania speciosa), Karanj(Pongamia pinnata), etc. This system iscommon in eastern, southern and centralIndia.
2. Green manuring in situ : Green manuresare grown and incorporated in the same fieldwhich is to be green-manured, either as a purecrop or as an intercrop with the main crop.
Green manure as a cover crop
Green manure crops are grown with objectiveof covering the soil surface with vegetativecover especially in hill slopes during rainyseason to avoid soil erosion, run off and to checkwind erosion.
Oil cakes
Many kinds of oilcakes can be used as a sourceof nutrients in crops (Table 10). Many kinds ofoilcakes can be used as a source of nutrients incrops. Before application to rice or any othercrop, oilcakes should be well-powdered tofacilitate their application and decomposition bysoil microorganisms. Depending on crop,oilcakes are applied broadcast, drilled or placednear the root zone.
Table 10: List of oil cakes and their composition
Oilcake N (%) P2O5 (%) K2O (%)
Castor cake 4.3 1.8 1.3
Cottonseed cake 3.9 1.8 1.6undecorticated
Neem cake 5.2 1.0 1.4
Karanj cake 3.9 0.9 1.2
Safflower cake 4.9 1.4 1.2undecorticated
Groundnut cake 7.3 1.5 1.3
Linseed cake 4.9 1.4 1.3
Vermicompost
Compost made from the biological activity ofearthworms. The general analysis is 1.9% N,2.0% P and 0.8% K, 100 mg/Kg Cu and 500mg/kg Mn. Earthworms effectively harness thebeneficial soil micro flora, destroy soilpathogens and convert organic wastes intovaluable products known as cast which containsbiofertilizers, vitamins, enzymes, antibiotics,growth hormones and proteinaceous wormbiomass. Hence, earthworms are called as'artificial fertilizer factories'. The exotic speciesused for making vermicompost are Eiseniafoetida, Eudrillus euginiae and Perionyxexcavatus, while indeginous species includeLampito mauriti, Perionyx sansibaricus (Table11).

13
Advances in integrated nutrient management of bulbous flower crops — A review
Table 11: A model of vermicompost pit.
7. Paddy straw /sugarcane trash
6. Black soil
5. Green leaves
4. Dung biogas slurry
3. Crop residue
2. Dung / biogas slurry
1. Coconut coir or any material which is having higher WHC
Table 12 : Classification of biofertilizers.
S. No. Groups Examples
N2 fixing Biofertilizers1. Free-living Azotobacter, Beijerinkia, Clostridium, Klebsiella, Anabaena, Nostoc,2. Symbiotic Rhizobium, Frankia, Anabaena azollae3. Associative symbiotic AzospirillumP Solubilizing Biofertilizers1. Bacteria Bacillus megaterium var. phosphaticum, Bacillus subtilis, Bacillus
circulans, Pseudomonas striata2. Fungi Penicillium sp., Aspergillus awamoriP Mobilizing Biofertilizers1. Arbuscularmycorrhiza Glomussp.,Gigaspora sp.,Acaulospora sp.2. Ectomycorrhiza Laccaria sp., Pisolithus sp., Boletus sp.3. Ericoid mycorrhizae Pezizellaericae4. Orchid mycorrhiza Rhizoctonia solaniBiofertilizers for Micro nutrients1. Silicate and zinc solubilizers Bacillus sp.Plant Growth Promoting Rhizobacteria1. Pseudomonas Pseudomonas fluorescens
Biofertilizers
Cultures of microorganisms that are capable offixing atmospheric N or solubilizing rockphosphate P and mobilizing native soil P orsolubilizing native soil K (Tewatia et al. 2007).Biofertilizers (BF) (microbial nutrients) are theproducts containing living cells of differenttypes of microorganisms which have an abilityto mobilize nutritionally important elementsfrom non-usable to usable form throughbiological process (Table 12).
Utilities of biofertilisers
• Inoculating seed or planting materialsEx: Rhizobium, azotobacter, andPhosphobacterial inoculants (150-200g/acre).
• Accelerating decomposition of organicmaterials.
• Enrichment of Compost (500 g/1 tonne).Ex: Trichoderma viride, Aspergillusawamori, Trichurus spiralis.

14
Kishan Swaroop, Kanwar Pal Singh, Sapna Panwar, Namita and Sunita Dhakar
Liquid biofertilizers
• These have long term survival of theorganisms unlike carrier based biofertlizerswhich have life up to 3 months only.
• Withstand high temperature up to 45 degreecelcius.
• Moisture retaining capacity is high.
• Useful for farmers growing high value cropswith commercial value and export potential(cut flowers, vegetables).
NUTRITIONAL MANAGEMENT INBULBOUS FLOWER CROPS USINGORGANIC SOURCES
Gladiolus
The success of gladiolus cultivation dependsupon many factors like soil fertility, irrigation,planting time, planting density, plant protectionmeasures, plant growth regulators andsomechemicals etc., these may play major roletowards increasing production and quality ofgladiolus. But, bio-fertilizers hold good promiseas these are microorganisms, which are capableof mobilizing nutritive elements from non-usable form to usable form through biologicalprocesses. They are cost effective, inexpensiveand eco friendly source of nutrient, do notrequire non-renewable source of energy duringtheir production. Biofertilizers can also play avery significant role in improving soil fertilityby fixing atmospheric nitrogen, both inassociation with plant root and solubilising fixedsoil-phosphate. They also improve crop growthand quality of products by producing phyto-hormones, enhancing the uptake of plantnutrients by plant roots and thus help insustainable crop production throughmaintenance of soil productivity. They are alsouseful as bio-control agents. Though they mayprovide synergistic effect when used with
chemical fertilizers but have seldom been usedin ornamentals, although emphasis onsustainable agriculture is being given, wherebio-fertilizers hold good promise. Although bio-fertilizers are not an alternative to inorganicfertilizers, they may be useful in increasing theyield and quality of flowers when they arecombined with organic manures and inorganicfertilizers in balanced proportion. Pandey et al.(2000) carried out a field trial at Agra ongladiolus cv. Psittacinus Hybrid and reportedthat maximum value of growth and flowercharacters were found with the application of200 kg N and 400 kg P/ha as compared to othertreatment combinations. Srivastava and Govil(2006) worked on gladiolus and reported thatvase life was enhanced most effectively by PSBtreatment and corm production was found to bemaximum under Azotobacter treatment. Dubeyet al. (2009) reported that combined applicationof Azotobacter +PSB was found best for allgrowth and flowering characters on gladiolus.Dalve et al. (2009) reported that use ofbiofertilizer with reduced doses of nitrogensignificantly influenced the growth, floweringand yield of gladiolus. Plant height, daysrequired for emergence of spikes, days requiredfor 50% flowering, number of florets per spike,number of spike per plant, corms and cormelsper plant was maximum under 75% N + 100%PK (375:200:200 kg NPK ha–1) + Azotobacter+ Azospirillum. Singh et al. (2013) reported thatmaximum number of spike per plant, diameterof flower, diameter of spike, vase life of cutflower at room temperature and longevity ofspike in gladiolus were recorded highest withthe application of 75% recommended dose ofNPK (225:150:150) + 2 tonnes of vermicompost+ 2.5 kg Azotobactor + 2.5 kg PSB ha–1
followed by, 50% recommended dose of NPK(150:100:100) + 2 ton vermicompost + 2.5 kgAzotobactor + 2.5 kg PSB ha–1 (21.53). Basoli

15
Advances in integrated nutrient management of bulbous flower crops — A review
et al. (2014) reported that maximum number offlorets opened per spike, available P content insoil were recorded with application of 1/2 N, Pand K + Azotobacter + PSB + KSB. However,maximum fresh and dry weight of spike wasfound with application of 3/4th N, P and K +Azotobacter + KSB. Treatment 3/4th N, P andK + PSB + KSB resulted in maximum vase life.Whereas, 3/4th N, P and K + Azotobacter + PSBresulted in to maximum number of corms andcormels/plant in gladiolus. Karthikeshan andVenkatesh (2002) reported that maximum plantheight, number of leaves and leaf area in cv.White Prosperity with the application ofAzospirillum along with recommended dose and25% (75:45:60 kg/ha) reduced dose of NPK.Choudhary et al. (2013) reported that thetreatment with 75% RDF (Recommended Doseof Fertilizer)) + FYM (1 kg / m2/y)+Vermicompost (300 g/ m2) + Azospirillum (2 g/pl/y) + PSB (2 g/pl) in gladiolus cv. IIHR-22-1resulted significant increase in the plant height(58.5 cm), stalk length (72.7 cm), plant yield(1.021 kg spikes/m2) and vase life (7.17 days)compared to other treatments
Tuberose
An experiment was conducted in tuberose cv.Hyderabad Double comprising of treatmentsincluding combination of organic fertilizers andbio inoculants along with different levels ofNPK (100%, 75% and 50% RecommendedDose of Fertilizers (RDF). Compared to 100 %RDF with FYM alone, application of 75% RDFin integration with farm yard manure (FYM),vermicompost (VC), Azospirillum (AZO) andphosphate solubilizing bacteria (PSB) hassignificantly yielded maximum number of spikesper plant (2.33) with increased spike length,rachis length, number of florets per spike andalso maximum number of bulbs per plant(32.60). B:C ratio ranged between 2.09 - 2.60
with its maximum exhibited by 75% RDF withFYM, VC, AZO and PSB. Hadwani et al. (2013)reported that application of FYM @ 30 t/ha +PSB @ 2 g/m2 + Azotobacter @ 2 g/m2 tookminimum days to sprouting (18.47 days),maximum plant height (61.67 cm) and plantspread at E-W and N-S (37.93 cm and 37.07cm, respectively) in tuberose. With respect toflowering, significantly maximum length ofspike (78.00 cm), number of florets per spike(44.07), number of spikes per plant (4.26),number of spikes per net plot (127.67), numberof spikes per hectare (4.73 lacks), longest vaselife (12.33 days) and in situ longevity of spike(20.80 days) were recorded in treatment ½ RDF+ NC @ 1 t/ha + PSB @ 1 g/m² + Azotobacter@ 1 g/m². Priti et al. (2015) reported thatflowering parameters of tuberose, like daysrequired for initiation of first flower stalk, daysfor 50 per cent flowering and days required forharvesting from initiation of first flower stalkwere found minimum in the treatment receiving50 per cent N through vermicompost + 50 percent N through urea + P and K (RDF). In respectof yield parameters, the maximum number ofspikes per plant, per plot and per hectare werefound maximum under the treatment withapplication of 50 per cent N throughvermicompost + 50 per cent N through urea +P and K (RDF). Flower quality parameters, likelength of spike, length of rachis, length of floret,diameter of floret, diameter of spike, numberof florets per rachis, vase life of cut flowersand oil content were also recorded maximumunder the treatment with application of 50 percent N through vermicompost + 50 per cent Nthrough urea + P and K (RDF). Application of50 per cent N through vermicompost + 50 percent N through urea + P and K (RDF) improvedthe yield and quality of tuberose. Haque et al.(2010) conducted an experiment in tuberose andfound maximum plant height with application

16
Kishan Swaroop, Kanwar Pal Singh, Sapna Panwar, Namita and Sunita Dhakar
of NPK (0: 8: 10) + PSB and maximum numberof leaves with NPK (10: 0: 10) + PSB whereasweight of ten florets was obtained maximumwith NPK (10: 4: 10) + Azospirillum. Sharmaet al. (2008) conducted an experiment at Hissarand found maximum plant height, spike lengthand number of floret per spike with theapplication of 200 kg N per hectare in tuberose.Basil and Singh (2010) conducted an experimentto find out the effect of bio-fertilizers andvermicompost in tuberose. Treatmentscomprised two bio-fertilizers (Azotobacter andAzospirillum), two levels of vermicompost (10t ha–1 and 20 t ha–1), four combinations of bio-fertilizers and vermi-compost and a control.Among the different treatments, the treatmentsof Azospirillum + vermicompost (10 t ha–1)recorded maximum value for the parametersnamely number of leaves on 90 days afterplanting, length of spike, length of rachis ,number of florets per spike, number of spikeper plant and yield of spike/ha.
Lilium
Bulblets inoculated with indigenous mixedVAM promoted maximum shoot length, bulbletsize, and weight at 13.6 ppm P. The bulbletsalso flowered earlier, nearly a month before theuninoculated control ones in cv. Grand Paradiso(Varshney et al. 2002). Mousavi and Ardebili(2014) reported that application of Boot StrapCompost (BSC) and especially vermicomposthad an improving impact on the blossomingtime, qualities of flowers, and the postharvestlife of cut flowers. In comparison with fishcompost and BSC, vermicompost was the mosteffective fertilizer to promote growth anddevelopment of Lillium longiflorum.
Dahlia
Plants receiving vermicompost 500 g with PSB25 g/pot found superior in plant height, number
of leaves per plant, plant spread and maximumflower yield (Warade et al. 2007).
Soil test and crop response based integratednutrient management
We can overcome imbalance in fertilizerapplication and its utilization by the cropsthrough managing the site specific variabilityin nutrient supply with crop nutrient demand."Balanced fertilization" should ensure adequatequantities of soil nutrients in available form andin right proportions as per the requirement ofthe crop and cropping system. Most soils arenot able to supply required amount of all theessential nutrients for the crops in balancedproportion which is supplemented by additionof fertilizer and manures. The fertilizer needsof a crop is greatly influenced by the inherentcapacity of a soil to supply nutrients, nature ofpreceding crop(s), the amount of fertilizer andmanures applied to the preceding crop, croppingsequence and nutrient required by the crop tobe grown for a targeted yield level (±5 to ±10%of potential yield of the variety). To overcomethese problems, the fertilizer recommendationsshould be based on soil testing. Theory ofoptimum fertilizer recommendation for targetedyield was first formulated by Troug which wasfurther modified by Ramamoorthy as 'Inductive-cum targeted yield model' popularly known asSoil Test Crop Response (STCR) correlationstudies. Linear relationship between yield/biomass of crops and total nutrient uptake bythe crops forms the basis of fertilizer prescrip-tion in this concept. Other assumption of theconcept is that for given yield target, definitequantity of nutrients is absorbed by the crops.Contradictory to the agronomic trials in whichvariability in soil fertility is obtained by selectingthe soils at different locations, in the inductiveapproach of STCR field experimentation,required variability in soil fertility levels

17
Advances in integrated nutrient management of bulbous flower crops — A review
(generally three viz., low, medium and high) isdeliberately created in the same field in orderto reduce heterogeneity in the soil population(types), management practices and climaticconditions. After obtaining desirableheterogeneity, main experiment was laid out infractional factorial randomized block design inwhich each gradient strip was given differentcombinations of 24 treatments (21 treatments +3 controls). The essential basic informationderived from soil test crop response correlationfield experiment is used for formulating fertilizerrecommendation for targeted yield of crops fora given soil type-crop-agro-climatic conditionsare (i) nutrient requirement in kgq–1 of biomass production, (ii) per centcontribution from soil available nutrients (%CS),(iii) per cent contribution from fertilizernutrients (% CF) and (iv) per cent contributionfrom organic manure (% COM).
4R STEWARDSHIP PROGRAMME
International Plant Nutrition Institute (IPNI) 4Rplant nutrition stewardship (apply the rightsource of nutrient, at the right rate, at the righttime, and in the right place) is essential for thesustainable management of plant nutrition andincreasing productivity in flower crops.Inadequate plant nutrition causes seriousdisorders in flowercrops and may eventuallylead to decline of plant vigour and ultimatelyreduction of yield. Adapting Site SpecificNutrient Management (SSNM) in flower cropshelps in minimizing nutrient loss, increasingnutrient use efficiency, enhancing yield andpromoting environmental sustainability.
CONCLUSION
• Widespread nutrient deficiencies anddeteriorating soil health are cause of lownutrient use efficiency, productivity &profitability.
• Balanced fertilization of bulbous crops byusing 4R nutrient stewardship programmehelps in attaining targeted yield.
• Nutrient use efficiency can be improved inbulbous crops using slow release fertilizers,fertigation, crop residues as mulch, liquidbiofertilizers and VAM.
• Utilizing all indigenously available nutrientsources to reduce dependence on imports.
• Effective soil and plant analysis service toback up precise fertilizer use.
FUTURE PROSPECTS
• Promoting soil test crop response basednutrient recommendations in bulbous crops
• Dynamics of nutrient uptake by the crop,nutrient removal of bulbous crops should bestudied thoroughly to fill gap of nutrientdemand
• Leaf tissue analysis in bulbous crops todecide fertigation schedules
• Creating awareness amongst farmers onbenefits of balanced fertilization.
REFERENCES
Anserwadekar, K.W. and Patil, V.K. 1986. Vase lifestudies of gladiolus (G. grandiflora) cv. H.B. Pitt-(i) Effect of NPK and spacing on vase life; (ii) Effectof different chemicals. Acta Hort., 181: 279-283.
Adnan, Y., Bhatti, M.Z.M., Riaz, A., Tariq, U., Arfan, M.,Nadeem, M. and Ahsan, M. 2012. Effect of differenttypes of mulching on growth and flowering offreesia alba cv. Aurora. Pak. J. Agri. Sci., 49(4):429-433;
Asmita and Singh, A.K. 2015. Effect of foliar applicationof zinc and copper on growth and post-harvestlife of lilium (Asiatic hybrid) cv. Albedo. InternationalJournal of Agriculture, Environment andBiotechnology, 8(4): 977-980.
Basil, L. and Singh, V.C. 2010. Effect of bio-fertilizersand vermicompost on growth, flowering and yieldof tuberose (Polianthus tuberosa) cv. Single. 4th
Indian Horticulture Congress, 129: 256-257.

18
Kishan Swaroop, Kanwar Pal Singh, Sapna Panwar, Namita and Sunita Dhakar
Basoli, M., Kumar, P. and Kumar, S. 2014. Impact ofintegrated nutrient management on post-harvestand corm characters of gladiolus cv. Novalux.Annals of Horticulture, 7(2): 109-114.
Bhattacharjee, S.K. 1981. Influence of nitrogen,phosphorus and potassium fertilization onflowering and corm production in gladiolus.Singapore J. Primary Industries., 9(1): 23-27.
Bose, T.K., Yadav, L.P., Pal, P., Parthasarathy, V.A. andDas, P. 2003. Commercial Flowers. Naya Udyog,Kolkata, India. 2: 327-362.
Chaudhary, N., Swaroop, K., Janakiram, T., Biswas, D.R.and Geeta S. 2013. Effect of integrated nutrientmanagement on vegetative growth and floweringcharacters of gladiolus. Indian J. Hort. 70(1): 156-159.
Dhar, L.N., Dubey, R.K., Kumar, R. and Kaur, P. 2008.Effect of nitrogen and phosphorus onplant growth, flowering and bulb production oftuberose (Polianthus tuberosa L). J. Orna. Hort.,11(4): 302-305.
Dey, L.C. 1995. Studies on post harvest life of cut rosesand gladioli. Ph.D. Thesis submitted to Division ofFloriculture and Landscaping, IARI, New Delhi.
De, L.C. and Dhiman, K.R. 2001. Effect of leaf manures,potassium and GA3 on growth, flowering andlongevity of tuberose. Journal of OrnamentalHorticulture (New Series) 4(1): 50-52.
De Hertogh, A.A. and Nard M. 1993. Physiologicaldisorders. In: De Hertogh AA, Le Nard M, (eds).The physiology of flower bulbs. Amsterdam:Elsevier, 155-160.
Department of Agriculture Cooperation and FarmerWelfare, 2016. Agriculture statistics at a glance(1st advanced estimates), Government of India,New Delhi.
Dongardive, S.B., Golliwar, V.J. and Bhongle, S.A. 2007.Effect of organic manure and biofertilizers ongrowth and flowering in Gladiolus cv. whiteprosperity. Plant Archives, 7(2): 657-658.
Dalve, P.D., Mane, S.V. and Nimbalkar, R.R. 2009. Effectof biofertilizers on growth, flowering and yield ofgladiolus. The Asian Journal of Horticulture, 4(1):227-229.
Dubey, R.K., Mishra, R.L. and Singh, S.K. 2009. Studiesof bio- and chemical fertilizers on certain floralqualities of gladiolus. Paper presented in the"National Conference on Floriculture for Livelihoodand Profitability", held on 16-19 March, 2009 atIARI, New Delhi, organized by ISOH, New Delhi:87.
Dudal, R. and Roy, R.N. 1995. Integrated Plant NutrientSystems.FAO - Fertilizer and Plant NutritionBulletin 12: 181-98.
Fahad, S., Masood Ahmad, Kh., Akbar Anjum, M. andHussain, S. 2014. The effect of micronutrients (B,Zn and Fe) foliar application on the growth,flowering and corm production of gladiolus(Gladiolus grandiflorus L.) in calcareous soils. J.Agr. Sci. Tech., 16: 1671-1682.
Ganeshamurthy, A.N., Rupa, T.R., Kalaivanan, D.,Raghupathi, H.B., Satisha, G.C., Rao, G.S. andKumar, M. 2016. Fertiliser Management Practicesfor Horticultural Crops. Indian J. Fert., 12(11): 66-81.
Gurav, S.B., Singh, B.R., Katwate, S.M., Chaudhary,S.M., Kakade, D.S., Patil, M.T. and Dhane, A.V.2006. Standardization of NPK levels in tuberose."National Symposium on Ornamental BulbousCrops". Held on 5-6 December, 2006 at S.V.B.P.U.of Ag. & T., Modipuram, Meerut (U.P.): 65-66.
Hadwani, M.K., Varu, D.K., Panjiar, N. and Babariya, V.J.2013. Effect of integrated nutrient management ongrowth, yield and quality of ratoon tuberose(Polianthus tuberose L.) cv. Double. The AsianJournal of Horticulture, 8(2): 448-451.
Haque, S., Mondal, S. and Biswas, J. 2010. Effect ofbio-fertilizers on growth attributes and floweringof tuberose (Polianthus tuberosa) cv. Prajwal asratoon crop. 4th Indian Horticulture Congress., iii-128: 256.
http://apeda.gov.in/apedawebsite/six_head_product/floriculture.htm
Jankiram, T., Namita, Pavan Kumar, P., Jain, R. andNarkar, N.D. 2013. Fertilizer based managementpractices in floriculture. Indian Journal of fertilizers,9: 160-175.
Kadu, A.P. and Sable, A.S. 2003. Commercial flowerproduction of tuberose cv. Single as influenced byvarious level of nitrogen and phosphorus. NationalSymposium on Recent Advances in IndianFloriculture: 1.
Kathiresan, C. and Venkatesha, J. 2002. Effect ofbiofertilizers with levels of N and P on gladiolus.Floriculture research trend in India. Proceeding ofthe national symposium on Indian Horticulture inthe New Millennium. Lal Bagh. Bangalore. 25-27February 2002 pp. 216-128.
Kukde, S., Pillewan,S., Meshram, N., Khobragade, H.and Khobragade, Y.R. 2006. Effect of organicmanure and biofertilizer on growth, flowering andyield of tuberose cv. Single. J. Soils and Crops,16: 414-416.

19
Advances in integrated nutrient management of bulbous flower crops — A review
Kosugi, K. and Sano, Y. 1961. Studies on blindness ingladiolus IX.Effect of nitrogen applications on thegladiolus flower buds. J. Jap. Soc. Hort. Sci., 30:259-262.
Lekhi, R. and Sharma, C. K. 2006. Response of differentlevels of nitrogen and phosphorus for lucrativecultivation of tuberose (Polianthus tuberosa L.) cv.Suvasini. "National Symposium on OrnamentalBulbous Crops". Held on 5-6 December, 2006 atS.V.B.P.U. of Ag. & T., Modipuram, Meerut (U.P.):68.
Moghadam, A.R.L., Ardebili, Z.O. and Fateme, S. 2012.Vermicompost induced changes in growth anddevelopment of Lilium Asiatic hybrid var. Navona.African Journal of Agricultural Research, 7(17):2609-2621
Mousavi, S.M. and Ardebili, Z.O. 2014. Growth andblossoming of lilium under various organicfertilizers. Iranian Journal of Plant Physiology, 5(1):1235-1242.
Nagaraju, H.T., Narayanagowda, J.V., Rajanna, M.P. andVenkatesha, J. 2003. Influence of different levelsof N, P and K on growth, flowering and shelf lifeof tuberose (Polianthus tuberosa L.) (cv. Double).National Symposium on Recent Advances in IndianFloriculture: 18.
Pal, A. K. and Biswas, B. 2003. Effect of fertilizer ongrowth and yield of tuberose (Polianthus tuberosaL.) cv. Single in the plains of West Bengal. NationalSymposium on Recent Advances in IndianFloriculture: 20.
Pandey, R.K., Rathore, Puneet and Singh, M.K. 2000.Effect of different levels of nitrogen andphosphorus on gladiolus under Agra conditions.J. Orna. Hort., New series, 3(1): 60-61.
Priti, R., S., Kuchanwar, O.D., Ingle, S.N., Zalte, S. andAbgad, N.P. 2015. Effect of integrated nutrientmanagement on yield and quality of tuberosegrown on Vertisol. An Asian Journal of SoilScience, 10(2): 210-214.
Prasad, R., Kumar, D., Shivay, Y.S. and Raj, R. 2014.Integrated nutrient management .In: Prasad, R.,Kumar, D., Rana, D.S., Shivay, Y.S. and Raj, R(eds.). Textbook of Plant Nutrient Management.Indian Society of Agronomy, New Delhi. pp. 348-60.
Prakash, R., Dahiya, S.S., Beniwal, B.S. and Singh, S.2006. Effect of nitrogen and phosphorus on floralcharacters of lilium cv. Chianti. Haryana J. Hort.Sci., 35(1&2): 76-78.
Salisbury, S.B. and Ross, C.W. 1995. Plant Physiology,Wadsworth Publishing Co., U.S.A.
Singh, K.P. 1997. Improved agro-techniques forgladiolus-a review. Agric. Rev., 18(4): 212-238.
Sharma, S. and Singh, D.B. 2001. Response of nitrogenfertilization on gladiolus. J. Orna. Hort., 4(2): 128.
Sharma, J., Gupta, A.K., Kumar, C. and Gautam, R.K.S.,2012. Influence of zinc, calcium and boron onvegetative and flowering parameters of gladioluscv. Aldebran. The Bio Scan, 8(4): 1153-1158.
Shukla, A.K., Behera, S.K., Subba Rao, A. and Singh,A.K. 2012. State-wise micro and secondarynutrients recommendations for different crops andcropping systems. Research Bulletin No. 1/2012,IISS, Bhopal.
Singh, R., Kumar, M., Raj, S. and Kumar, S. 2013.Flowering and corm production in gladiolus(Gladiolus grandiflorus L.) cv. "White Prosperity"as influenced by integrated nutrient management.Annals of Horticulture, 7(1): 36-42.
Srivastava, R. and Govil, M. 2006. Effect of Bio-fertilizerson vase life and corm production in gladiolus cv.American Beauty."National Symposium onOrnamental Bulbous Crops". Held on 5-6December, 2006 at S.V.B.P.U. of Ag. & T.,Modipuram, Meerut (U.P.): 139.
Skalska, E. 1968. Some facts of the nutrition in gladioli.Acta Pruhon., 17: 29-47.
Smil, V., 2001. Feeding the world: A challenge for thetwenty-first century. MIT press. Cambridge, MA.
Padmalatha, T., Satyanarayana Reddy, G.,Chandrasekhar, R., Siva Shankar, A. andChaturvedi, A. 2014. Effect of foliar sprays ofbioregulators on growth and flowering in gladiolusplants raised from cormels. ProgressiveHorticulture, 46(2): 288-294.
Tewatia, R.K., Kalwe, S.P. and Chaudhary, R.S. 2007.Role of biofertilizers in Indian Agriculture, Indian.J. Fert., 3(1): 11-118.
Tripathi, S.K., Malik Sunil, Singh, I.P., Dhyani, B.P.,Kumar Vipin, Dhaka, S.S. and Singh, J.P. 2012.Effect of integrated nutrient management on cutflower production of tuberose (Polianthes tuberosaL.) var. Suvasini. Annuals of Horticulture, 5(1): 108-15.
Varshney, A., Sharma, M.P., Adholeya, A., Dhawan, V.,and Srivastava, P.S. 2002. Enhanced growth ofmicro propagated bulblets of Lilium sp. inoculatedwith arbuscularmycorrhizal fungi at different Pfertility levels in an alfisol. J. Hortic. Sci.Biotechnol., 77: 258-263.
Warade, A.P., Golliwar, V.J., Chopde, N., Lanje, P.W.and Thakre, S.A. 2007. Effect of organic manures

20
Kishan Swaroop, Kanwar Pal Singh, Sapna Panwar, Namita and Sunita Dhakar
and bio-fertilizers on growth, flowering and yieldof dahlia. J. Soils and Crops, 17(2): 354-357.
Younis, A., Bhati, M.Z.M., Riaz, A., Turiq, U., Arfan, M.
Nadeem, M. and Ashan, M. 2012. Effect of differenttypes of mulching or growth & flowering of freesiaalba cv. Aurora. Pak. J. Agri. Sci., 49(4): 429-433.

21
Improvement in post harvest quality of cut flowers of Rosa hybridaJournal of Ornamental Horticulture. 20 (1&2): 21-33, 2017
Improvement in post harvest quality of cutflowers of Rosa hybrida cv. 'First Red' usingbiologically synthesized silver nanoparticles
SHISARENLA AIER1, P.K. BORTHAKUR², R.C. BORO3,H. BORUAH3, G. GOSWAMI3 and LALLAN RAM1
1Central Institute of Horticulture, Medziphema-797106, Nagaland2Department of Horticulture, Assam Agricultural University, Jorhat-785013, Assam
3Department of Agricultural Biotechnology, Assam Agricultural University, Jorhat-785013, AssamE-mail: [email protected]
ABSTRACT
The recent development and implementation of new technologies have led to new era. The nano-revolution which unfolds role of plants in biological and green synthesis of nanoparticles seemto have drawn quite an unequivocal attention with a view of synthesizing stable nanoparticles. Inthis experiment, a cost effective and environment friendly technique for green synthesis of silvernanoparticles from 1mM AgNO3 solution through the extract of Lasia spinosa (L.) Thwaites asreducing as well as capping agent is described. Nanoparticles were characterized using UV-Visabsorption spectroscopy, FTIR, XRD, DLS and TEM. DLS and TEM analysis showed the averageparticle size range from 10 to 30 nm. Further, the efficacy of biologically synthesized Silvernanoparticles (AgNPs) were evaluated for their potential to increase the postharvest quality ofrose cut flower cv.'First Red'. AgNPs were applied as vase treatments at 25, 50 and 75 ppm alongwith 4% sucrose and distilled water as control. All the levels of AgNPs significantly improvedthe vase life compared to control. The microbial growth was suppressed in vase solution, whilethe relative fresh weight (RFW), relative water content (RWC) and total soluble solid (TSS) aswell as membrane stability index (MSI) were maintained as a result of using AgNPs. AmongAgNPs treatments, the most effective level was 50 ppm + 4% sucrose. The results suggest thatthe biologically synthesized AgNPs could be used for improving the postharvest quality of rosecut flower as a promising eco-friendly, non-toxic and novel alternative source to chemical andphysical AgNPs sources or common chemicals used as preservative solutions for cut flowers ofrose.
Keywords: Silver nanoparticles, UV-VIS spectroscopy, FTIR, XRD, DLS and TEM.
INTRODUCTION
Postharvest performance is a key factor in thecommercial value of cut flowers. Althoughexternal quality criteria such as appearance,colour and uniformity are the major variablesthat influence the consumer's decision topurchase cut flowers, their longevity is
fundamental to convince the consumer to re-purchase them (Reid and Jiang, 2012). Rose(Rosa hybrida L.), belongs to family Rosaceae,is the major cut flower crop for exporting allover the world. However, it has a limitedcommercial value due to early dehydration (vanDoorn, 1997). First Red is one of the mostimportant cut rose cultivar, exhibited a

22
Shisarenla Aier, P.K. Borthakur, R.C. Boro, H. Boruah, G. Goswami and Lallan Ram
climacteric peak of ethylene production(Chamani et al. 2005) and short postharvest vaselife is the main problem. In addition todevelopmental senescence, cut flowers are alsosubjected to leaf discolouration, prematurewilting, and disease from moulds and fungalpathogens. An integrated approach is therefore,needed to maintain quality throughout thedistribution chain to reduce postharvest losses.The most important aim of advancing in post-harvest science is to provide information for thehorticultural industry to enable them to supplyconsumers with attractive and long-lived flowers(Scariot et al. 2014). It is well known thatblockage of xylem vessels is the main reasonof vase life reduction (van Meetern et al. 2001).Occlusion of cut flower stems may occur as aresult of vase solution microorganisms(Loubaud and van Doorn, 2004; He et al. 2006),air embolism (van Ieperen, 2007) and thephysiological wound healing (Williamson et al.2002). It has been established that waterrelations are a very important factor affectingpostharvest quality and longevity of cut flowers(Lu et al. 2010a) and the main reason of shortvase life after harvest is water stress (vanDoorn,1997). The microorganism proliferationin the vase solution also causes water relationinterruption as a result of occlusion in the basalend of cut flower stem (Bleeksma and vanDoorn, 2003; Liu et al. 2009a). Controlling andreducing microbial proliferation andconsequently its negative effect is a criticalfactor for improving quality and longevity ofcut flowers. Chemicals which are widely usedas biocides like 8-Hydroxy-quinoline sulphate(HQS), Silver thiosulphate (STS), Silver nitrate,Aluminium sulphate etc., been found to be toxicto the environment. Recently, environmentallyand health-friendly production methods havebecome crucial for reaching the goal of moresustainable plant production. A suitableapproach for vase life extension, which is easy
to use, natural, safe and inexpensive compound,is always crucial in this respect for large scaleapplications. Therefore, nanotechnology can bethe next generation approach for post harvestimprovement of cut flowers.
The cut flowers of Rosa hybrida cv. 'First Red'was used in this experiment. The biosynthesisof AgNPs was carried out using Lasia spinosa(L.) Thwaites leaf extract. The objective was toinvestigate the possible effects of biologicallysynthesized AgNPs as a novel material inimproving the postharvest quality of rose cutflowers cv. 'First Red'.
MATERIALS AND METHODS
Plant materials
The flowers of rose cv. First Red were obtainedfrom experimental farm, Department ofHorticulture, Assam Agricultural Universityduring 2014 to 2016 season. Flower stems werere-cut under distilled water to 30 cm length andthe cut flowers were surface sterilized with 0.3%Mercury Chloride before placing it in the vasesolution. Experiments were done in a completelyrandomized design.
Biosynthesis of AgNPs
Biosynthesis of AgNPs was carried out by usinga medicinal plant Lasia spinosa (L.) Thwaiteswhich was collected from Northeastern India.The photograph of the plant is shown in Figure1. The extract was used as reducing as well ascapping agent. Silver nitrate (AgNO3, 99.9%pure) was purchased from Sigma Aldrich,Germany.
Preparation of plant extract
The extract was made using 20 g of the plantpart. Prior to extract preparation, the plant partswere cleaned thoroughly using sterile distilledwater and cut into small pieces. The plant extract

23
Improvement in post harvest quality of cut flowers of Rosa hybrida
sample was added into 100 ml of sterile distilledwater, and left to boil for 3 min. The solutionwas then removed from the heat source and leftto cool to ambient temperature (approximately25°C). The extract was then filtered throughWhatman filter paper no. 1 and centrifuged at5000 rpm and the supernatant was collected andstored at 4°C for future use. Finally, the extractwas used for the synthesis of AgNPs (Mason,2012).
Preparation of 1mM AgNPs solutions
Accurate concentration of 1mM silver nitrate(Sigma Aldrich, Germany) was prepared bydissolving 0.017 gm AgNO3 in 100 ml of milliQ water and stored in amber coloured bottle toprevent auto oxidation of silver.
Synthesis of AgNPs using plant extracts
The silver nitrate (AgNO3) in this experimentwas obtained from Sigma Aldrich. 100 mlsolution of 1mM AgNO3 was kept for heatingat 80°C under constant stirring. 3 ml plantextract was added drop by drop to the silvernitrate solution. The change of colour of reactionmixture from transparent to yellow and finallybrown colour was observed after 60 minutes ofreaction. The change in color indicates thecompletion of silver nanoparticles synthesis.
Centrifugation
Silver nanoparticles from the reaction mixturewas isolated by centrifuging the mixture at10,000 rpm for 10 minutes. The collected pelletswere then purified using ethanol (Mitra, 2012).The purified pallets were then dried and thepowder was taken and used for furthercharacterization.
AgNP treatments
Vase solutions were freshly prepared at thebeginning of the experiment. The solutions
contains the following treatments.
T1 - 25 ppm AgNP + 4 % sucrose
T2 - 50 ppm AgNP + 4 % sucrose
T3 - 75 ppm AgNP + 4 % sucrose
T0- Control (Distilled water)
Flowers were kept in conical glasswarescontaining 250 ml of prepared holding solutionsof different concentration of AgNPs and 4%sucrose. Mouths of the glasswares were thencovered with non-absorbant cotton to minimizeevaporation loss and prevent contamination.AgNPs solutions were prepared at the beginningof the experiment and were not renewed duringthe experiment. Four treatments with fivereplicates were applied and each replicateconsists of three flowers.
Characterization of Lasia spinosa (L.)Thwaites silver nanoparticles
Bio reduction of Ag+ ions in solutions wasmonitored by measuring a spectrum of thereaction medium. The UV-VIS spectral analysisof the sample was done by using ELICO SL-159 UV-VIS spectrophotometer at roomtemperature operated at a resolution of 1nmbetween 200 and 800 nm ranges. The reducingagents were used as reference blank. Thechemical composition of the synthesized silvernanoparticles was studied by using FTIRspectrometer (Perkin-Elmer LS-55-Lumine-scence spectrometer). The solution were driedat 90°C and the dried powders werecharacterized in the range 4000-400 cm–1 usingKBr pellet method. The crystalline metallicsilver nanoparticles were examined by X-raydiffractometer (Shimadzu XRD-6000) equippedwith Cu K radiation source using Ni as filterand at a setting of 30 kV/30 mA. All XRD datawere collected under the same experimentalconditions, in the angular range. Dynamic light

24
Shisarenla Aier, P.K. Borthakur, R.C. Boro, H. Boruah, G. Goswami and Lallan Ram
scattering (DLS) was employed to study theaverage particle size of silver nanoparticles. Theprepared sample was dispersed in deionisedwater followed by ultrasonication. Then solutionwas filtered and centrifuged for 15 mins at 25°Cin 5000 rpm and the supernatant was collected.The supernatant was diluted for 4 to 5 timesand then the particle distribution in liquid wasstudied in a computer controlled particle sizeanalyzer (ZETA sizer Nanoseries, Malverninstrument Nano Zs).Transmission electronmicroscope (TEM) was performed forcharacterizing size and shape of bio synthesizedsilver nanoparticles. The sample was firstsonicated (Vibronics VS 80) for 10 min. A dropof this solution was loaded on carbon-coatedcopper grids, and solvents was allowed toevaporate under Infrared light for 30 min. TEMmeasurements were performed on JOEL modelJEM 2100 instrument operated at an acceleratingvoltage at 200 kV.
Vase life evaluation
Vase life of cut flowers were evaluated bychecking daily the fluctuating room temperatureand relative humidity at different periods ofthe year and a 12 h photoperiod with 10-12 µmol m–2 s–1 irradiance from cool whitefluorescence lamps were maintained.
Relative fresh weight (RFW %)
The change in fresh weight of cut flowers wasdetermined. The cut flowers were initiallyweight at the beginning of the experiment andwas repeated again daily until the end of vaselife of control flowers.
Relative fresh weight (RFW) of stem wasmeasured as: RFW (%) = (Wt/Wt – 0) × 100;
Where, Wt is the weight of stem (g) at t = days(3, 5, 10, 15 etc.) and Wt – 0 is weight of thesame stem at t = day 0 (He et al. 2006).
Vase solution uptake (in ml)
The difference between consecutive measure-ments of the container and the vase solution(without flower) were recorded at an intervalof 5 days to measure the water uptake withinthe particular duration of vase period andpresented as g per stem per day (He et al. 2006).
Vase solution uptake rate (g stem–1 day–1) = (St-
1 – St)
Where,
St-1 = Weight of vase solution (g) on theprevious day
St = Weight of vase solution (g) at t= day 3,5, 10 etc.
Bacterial count in the vase solution (Log10CFU ml–L)
Aliquots from three replicates vases for alltreatments were taken to determine vase solutionbacterial population. Samples were taken everyalternate day till the end of the vase life. Normalsaline at 0.9% was used for sample dilution toobtain 30-300 bacterial clones in each agar plate(Liu et al. 2009). Aliquots of 0.1 ml were spreadover each plate to count agar and incubated at37°C for 24 h (Bleeksma and van Doorn, 2003)before enumeration of bacteria. Bacterialpopulation counts were expressed as colonyforming units per ml (CFU ml–1).
Total soluble solid of floret (TSS %)
Total soluble solid was recorded in fresh sampleof florets at 3rd, 5th, 10th and 15th day of vaselife study, using Pocket Refractometer Pal-I andexpressed in percentage. A known volume ofsample was taken and macerated properly. Aftermaceration juice was extracted from the sample.The extracted juice was taken in refractometerfor reading the TSS of the sample.

25
Improvement in post harvest quality of cut flowers of Rosa hybrida
Membrane stability index (MSI %)
Flower samples from each treatment were takenon day 3, 5, 10 and 15 for determining ionsleakage by using the method described bySairam et al. (1997).
Determination of vase life of florets (days)
The end of vase life was defined as the timeduring which more than 50% of florets werewilted (Dole et al. 2005).
RESULTS AND DISCUSSION
Biological reduction of Ag+ into AgNPs duringexposure to extract solutions of Lasia spinosa(L.) Thwaites was followed by the colourchange. The fresh supernatant of Lasia spinosa(L.) Thwaites was yellowish-green in colour andAgNO3 solution was transparent in nature[Figure 1(A) and inserts (a), (b) & (c)]. Howeverthe addition of plant extracts into AgNO3solution under constant stirring at 80°C for 3hour turned the reaction solution brown incolour. Various phytochemicals present in plantextracts were responsible for bioreduction ofdissolved Ag+ ions in AgNO3 solution andresults in formation of Silver nanoparticles. Thecolour changes in aqueous solutions were dueto the surface plasmon resonance phenomenon(Jha et al. 2010).
UV-Vis spectra are a qualitative indicator of theamount, size and shape of silver nanoparticlesin aqueous suspensions. After adding the extractto the solution of silver nitrate, there was achange in colour of the aqueous solution, fromgreen to yellowish brown, which deepened overtime [Figure 1(A) and (B) and inserts (a), (b) &(c)]. This colour change was due to theexcitation of surface plasmon vibrations(Rajasekharreddy, 2010) of the AgNPs, whichis considered to be the primary signature forthe formation of nanoparticles (Kalpana, 2013).
The absorption spectrum of the silvernanoparticles produced was 433 nm in Lasiaspinosa (L.) Thwaites. Similar work wasreported by Carrillo-Lopez et al. (2016) whoobserved the absorption spectrum of thenanoparticles produced with 5 ml ofChenopodium ambrosiodes extract and 10 mMAgNO3 obtaining maximum absorbance at 438nm.
The FTIR spectrum of silver nanoparticles isshown in Fig. 1(C). The results of FTIR spectraof biologically synthesized AgNPs samplesindicate the absorption bands of Lasia spinosa(L.) Thwaites at 3334, 2909, 1635, 1406, 1106and 615 respectively. The band between 3330-3500 cm–1 corresponds to O-H stretching H-bonded alcohols and phenols. The peak wasfound around 2900-2950 cm–1 showed a stretchfor C-H bond, peak around 1600-1650 cm–1
showed the bond stretch for N-H, peak around1500-1550 showed the bond stretch for -NO,1350-1450 showed the bond stretch for S=O and1000-1150 showed the bond stretch for -CN.Whereas, the stretch for AgNPs were foundaround 600-650 cm–1. The correspondingbiomolecules related to obtain functional groupsmay be the primary factor for reduction of Silverion. The results suggest that the biologicalmolecules could possibly perform dual functionsof formation and stabilization of silver nano-particles in the aqueous medium which is inconfirmation with the result of Kaviya et al.2011.
AgNPs synthesized biologically was furtherconfirmed by the characteristic peaks observedin the XRD diffractrogram. The spectra of XRDclearly indicated that the synthesized AgNPsusing the plant extract are crystalline in nature[Fig. 1(D)]. The characteristic XRD peaks at2θ = 38.06°, 44.19°, 69.44° and 77.35°correspond to the lattice planes (111), (200),
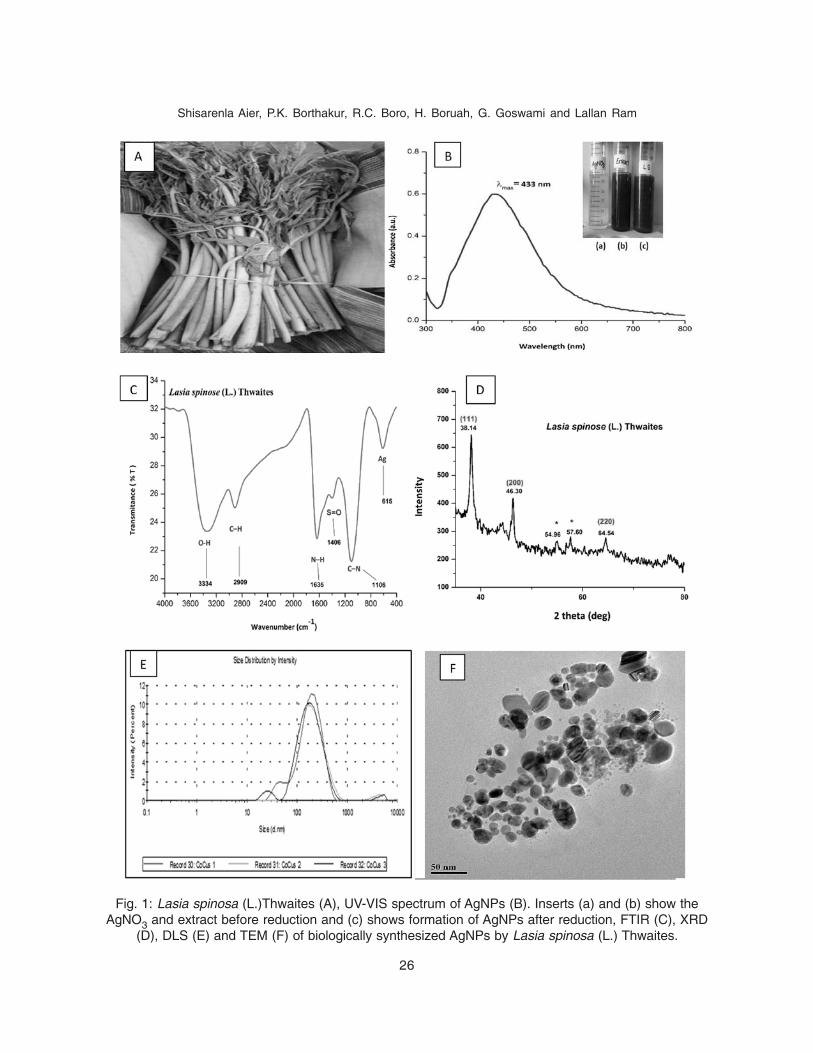
26
Shisarenla Aier, P.K. Borthakur, R.C. Boro, H. Boruah, G. Goswami and Lallan Ram
Fig. 1: Lasia spinosa (L.)Thwaites (A), UV-VIS spectrum of AgNPs (B). Inserts (a) and (b) show theAgNO3 and extract before reduction and (c) shows formation of AgNPs after reduction, FTIR (C), XRD
(D), DLS (E) and TEM (F) of biologically synthesized AgNPs by Lasia spinosa (L.) Thwaites.

27
Improvement in post harvest quality of cut flowers of Rosa hybrida
(220) and (311) which were indexed for face-centred cubic (fcc) of silver. The averagecrystallite size of the AgNP synthesized by theextract of Lasia spinosa (L.) Thwaites is 24. Itis in confirmation with the report of Solgi(2014), who stated that biosynthesized SNPs bysaffron petals extr act were further confirmedby the characteristic peaks observed in the XRDimage. The control did not show thecharacteristic peaks. After the reaction of saffronpetals with the silver nitrate (1:20), the XRDspectra that were obtained are 2θ = 38.06°,44.19°, 69.44° and 77.35° [assigned to the (111),(200), (220) and (311) planes of a faced centrecubic (fcc) lattice of silver].
DLS result of the storage study for synthesizedsilver nanoparticles was carried out at roomtemperature after 45 days as shown in Figure1(E). The particle size distribution (PSD) ofsynthesized silver nanoparticles after 45 daysof storage for the plant extract of Lasia spinosa(L.) Thwaites is shown in the Fig. 1(E). Fromthe figure, it is observed that the particlesobtained are polydispersed mixtures in the range50 to 300 nm which is in confirmation with thefindings of Kaviya et al. (2011). This showsthat silver nanoparticles synthesized biologicallyhave the ability to retain the size and shape evenafter storage due to the positive effect ofbiomolecules which acts as capping agent. Sizesand shapes of metal nanoparticles are influencedby a number of factors including pH, precursorconcentration, reductant concentration, time ofincubation, temperature as well as method ofpreparation. Nandibewoor et al. (2012) reportedthat the AgNPs could be well dispersed in water,and be stable for at least three months.
The result in Fig. 1(F) shows representativemicrographs of transmission electronmicroscopy (TEM). TEM analysis shows themorphology and size of biologically synthesized
silver nanoparticles. In general the particles werenano sized and well dispersed. The synthesizedAgNPs formed generally appeared spherical inshape. TEM images gave an average sizedimension of 50 nm. This result confirms thatdue to the presence of biomolecules in the plantextract, it has the ability to cap the nanoparticlesto produce smaller size and it preventsagglomeration and thereby stabilize the medium.The biological molecules could possiblyperform dual functions of formation andstabilization of silver nanoparticles in theaqueous medium which is in confirmation withthe result of Kaviya et al. (2011). Carrillo-Lopezet al. (2014) concluded that the lower thevolume of extract (1 ml), polydispersity, andconcentration of silver nitrate (1 mM), thesmaller the particles obtained.
Evaluation of vase life
All silver nanoparticles treatments significantlyincreased the vase life of rose cut flowers cv.'First Red'. The treatment T2 (50 ppm AgNP +4% sucrose) showed the longest vase life amongall the treatments.
It has been clearly observed that all the AgNPsexhibited significant variation for different vaselife parameters in both the years.
Relative fresh weight (RFW) and vase solutionuptake (VSU) are important parameters forextending the vase life of rose. Results revealedthat typically, cut flowers exhibited initialincrease and subsequently decrease in RFW andVSU. The data pooled over years revealed thatthe treatment T2 (50 ppm AgNP + 4% sucrose)was found to be the highest from day 3 to day15 under study and the least was found incontrol. On 15th day of measurement, the pooledRFW of controlled flowers decreased by 34.66per cent, however, T2 (50 ppm AgNP + 4%Sucrose) treatment increased RFW by 89.25 per

28
Shisarenla Aier, P.K. Borthakur, R.C. Boro, H. Boruah, G. Goswami and Lallan Ram
cent in rose on the same day in both the years(2014-15, 2015-16) and in case of VSU, on 15th
day, the pooled VSU of controlled flowersdecreased by 3.03 ml, whereas the treatment T2(50 ppm AgNP + 4% Sucrose) showed thehighest VSU (16.42 ml on the same day in boththe years (2014-15, 2015-16). Long vase life oftreated flowers was accompanied by good waterrelations, in terms of increased RFW and VSUrelative to control. The role of maintained waterrelation in the vase life of flowers is based onthe finding that cut flowers are sensitive to waterstress resulted from disturbed water balanceafter harvest (Rafi and Ramezanian, 2013).Significant differences in vase life betweenAgNP-treated and control flowers wereobserved. Seyyed et al. (2011) reported that thehighest relative fresh weight of cut rose flowerswas observed in vase solutions which showedthe greatest water uptake. The short vase life ofcut flowers was caused by poor water relationsin association with a lower water uptake(probably due to growth of microbes andvascular blockage), high rate of transpiration andwater loss. The effect of nano silver lead toreduced bacterial growth and vascular blockage,which maintained a more favourable wateruptake, suppressed water loss (Mori et al. 2001),inhibiting ethylene action (Zamani et al. 2011)and decreased transpiration rate (Mei-hua et al.2008).
The bacterial population in the vase solution ofcut roses was gradually increased throughoutthe vase life days. The pooled over dataindicated that the control had significantlyhigher number of bacteria than AgNPstreatments at any day during the vase life period.A rapid increase in the bacterial population wasobserved in untreated flowers, however, allconcentrations of AgNPs significantly inhibitedthe growth of bacteria relative to control. Onday 15, the lowest bacterial population (8.52
Log10 CFU ml–1) was detected when thetreatment combination T2 (50 ppm AgNP + 4%sucrose) was applied in rose cut flower cultivar.The AgNPs showed efficient antimicrobialproperty compared to other salts due to theirextremely large surface area, which providedbetter contact with microorganisms (Rai et al.2009). The greater number of bacteria in vasesolution in control flowers probably caused stemblockage (Van Doorn, 1997). Stem blockage ofcut flower may be principally due to livingbacteria, their decay products and secretions(Loubaud and Van Doorn, 2004). AgNPs in mostresearches are considered to be non-toxic, buthigher concentrations of AgNPs have toxiceffect (Liu et al. 2009). The exact mechanismby which silver nanoparticles cause antimicro-bial effect is not clearly known and is a debatedtopic (Rai et al. 2009). There are however,various theories on the action of silvernanoparticles on microbes to cause themicrobicidal effect. Silver nanoparticles have theability to anchor to the bacterial cell wall andsubsequently penetrate it, thereby causingstructural changes in the cell membrane like thepermeability of the cell membrane and death ofthe cell. There is formation of "pits" on the cellsurface, and there is accumulation of thenanoparticles on the cell surface (Sondi, 2004).The formation of free radicals by the silvernanoparticles may be considered to be anothermechanism by which the cells die. There havebeen electron spin resonance spectroscopystudies that suggested that there is formation offree radicals by the silver nanoparticles whenin contact with the bacteria, and these freeradicals have the ability to damage the cellmembrane and make it porous which canultimately lead to cell death (Kim et al. 2007).Another fact is that the DNA has sulfur andphosphorus as its major components; thenanoparticles can act on these soft bases and

29
Improvement in post harvest quality of cut flowers of Rosa hybrida
Fig. 2: Relative fresh weight (A), Vase solution uptake (B), Bacterial count in vase solution(C), Total soluble solid (D) and Membrane stability index (E) of rose cut flowers cv. 'First Red'
treated with biologically synthesized AgNP at 0, 25, 50 and 75 ppm with4% sucrose over vase life period.

30
Shisarenla Aier, P.K. Borthakur, R.C. Boro, H. Boruah, G. Goswami and Lallan Ram
destroy the DNA which would definitely leadto cell death (Moroness et al. 2005).
There was an increasing trend of total solublesolid (TSS) and membrane stability index (MSI)content from 3rd day to 5th day and then declineon 10th day and 15th day. The data indicatedthat the TSS and MSI of florets of all AgNPstreatments were higher than control. TSS of rosein control (11.45%) had decreased rapidly at day5, while TSS% in all AgNPs treatmentsdecreased slightly. The results showed theAgNPs treatments were significantly highercompared with control in rose cultivar in all thedays under study. On day 15, the maximum TSS(11.83%) was recorded in the treatmentcombination T2 (50 ppm AgNP + 4% sucrose)while the minimum TSS (5.56%) was recordedin control in rose cultivar under study. It maybe due to the combination effect of AgNPs andsucrose on petal total soluble solid.(Bahrehmand et al. 2014) reported thatapplication of 4% or 8% sucrose increased theTSS of cut tuberose flowers while NSapplication reduced evaluations for this trait. Incontrast, Moradi et al. (2012) stated thatapplication of 4 mg L–1 nanosilver with 3%sucrose resulted in the highest amount of TSSin cut carnation 'Cream Viana' which is inconfirmation with the findings of theexperiment. The high respiration of flowers andthe energy required for flower growth, budopening, and floral display requires substantialenergy reserves in harvested cut flowers whichcan be supplemented with carbohydrates oraddition of sucrose in vase solution.
The membrane stability index of all AgNPstreatments significantly retained the MSIcompared to control which lost their MSI uponthe progression of flower senescence during thevase life period. At day 10, the MSI in rose(62.17%) cultivar of control flowers decreased
rapidly, while in AgNPs treatments the MSI%decreased slightly in all the days of vase lifestudy. On day 15, the maximum MSI i.e., 73.12per cent was recorded in the treatment T2 (50ppm AgNP + 4% sucrose) in rose . Our resultsare in confirmation with the findings of Hassanet al. (2014), who reported that the highest MSIwas recorded by 50 mg L–1 AgNP s followedby 100 mg L–1 treatment. In view of our resultsAgNPs may alleviate lipid peroxidation andhence maintained membrane stability.Maintenance of membrane stability in responseto AgNPs application is most likely due toinduced reduction of lipid peroxidation. This issupported by a lower level of Malondialdehydecontent (MDA) after AgNPs treatment. MDAis a biomarker of lipid peroxidation (Bailly etal. 1996). Reduced lipid peroxidation probablymitigates rose flower senescence in response toAgNPs treatment, which is consistent with thefinding of Kazemi and Ameri (2012) andHatami et al. (2013) who indicated AgNPs rolein reduced lipid peroxidation. It is important tomention that reduced lipid peroxidation andretained membrane stability have beendemonstrated to be inversely proportional withflower senescence (Hatamzadeh et al. 2012).
The treatment T2 (50 ppm AgNP + 4% sucrose)recorded significantly higher vase life of rose(19.50 days) compared to all the other treatmentcombinations. However, the minimum vase lifewas recorded in control i.e., 7.68 days in rose.The increase in vase life may be due to thephytochemicals and concentration ofsynthesized AgNP (Lasia spinosa L. Thwaites)which increased the vase life of rose. It wasreported that the leaves of Lasia spinosacontains alkaloids, carbohydrates, saponins,glycosides, tannins, flavonoids, gum, lignins,proteins, tannins and phenolic compounds etc.(Kumar et al. 2013). Hassan et al. (2014) also

31
Improvement in post harvest quality of cut flowers of Rosa hybrida
showed that increasing AgNPs level from 50 to100 mg L–1 decreased the physiologicalparameters investigated and hence, the vase lifeof cut roses, however, the differences were notsignificant. It was speculated that high AgNPconcentration increases stress on cut roses andhence decrease the vase life. Therefore, higherconcentrations of AgNPs in vase solution leadto toxic effect. Nano-silver as pulse and vasesolution treatment is relatively new (Solgi et al.2009). Ohkawa et al. (1999) reported that silver-containing compounds extended the vase lifeof cut roses. Although using AgNPs as a biocidehas been reported, more informations are stillrequired on the possible physiologicalmechanisms of AgNPs in improving postharvestquality of cut flowers. Many workers havefocused on the effects of chemical and physicalsources of AgNPs on the postharvest quality ofcut flowers. However, increasing concentrationof nanosilver with varied physical and surfaceproperties, could pose a threat to human andenvironmental health (Panyala et al. 2008).Hence, extracellular biological synthesis ofAgNPs using medicinal plants provides apromising eco-friendly, non toxic and simplealternative source to chemical and physicalsources for increasing shelf life of flowers.
REFERENCES
Bahrehmand, S., Razmjoo, J. and Farahmand, H. 2014.Effects of Nano-Silver and Sucrose applicationson Cut Flower Longevity and Quality of Tuberose(Polianthus tuberosa) International Journal ofHorticultural Science and Technology, 1(1): 67-77.
Bailly, C., Benamar, A., Corbineau, F. and Dome, D. 1996.Changes in malondialdehyde content and insuperoxide dismutase, catalase and glutathionereductase activities in sunflower seed as relatedto deterioration during accelerated aging.Physiology Planta, 97: 104-110.
Bleeksma, H.C. and Van Doorn, W.G. 2003. Embolismin rose stems as a result of vascular occlusion bybacteria. Post harvest Biology and Technology, 29:334-340.
Carrillo-lópez, L.M., Morgado-gonzález, A. and Morgado-gonzález, A. 2016. Biosynthesized silvernanoparticles used in preservative Solutions forChrysanthemum cv. Puma. Journal of Nano-materials, 1: 1-10
Carrillo-Lopez, L.M., Zavaleta-Mancera, H.A. and Vilchis-Nestor, A. 2014. Biosynthesis of silvernanoparticles using Chenopodium ambrosioides.Journal of Nanomaterials, 4: 9.
Chamani, E., Khalighi, A., Joyce, D.C., Irving, D.E.,Zamani, Z.A., Mostofi, Y. and Kafi, M. 2005.Ethylene and anti-ethylene treatment effects on cut'First Red' rose. Journal of applied Horticultre, 7:3-7.
Dole, M.J., Wilkins, H.F. and Harold, P.F. 2005.Floriculture: Principles and Species. Sec. Ed. Prin.,USA, pp. 750-759.
Hassan, F.A.S., Ali, E.F. and El-deeb, B. 2014. ScientiaHorticulturae Improvement of postharvest qualityof cut rose cv. "First Red" by biologicallysynthesized silver nanoparticles. ScientiaHorticultural 179: 340-348.
Hatami, M., Hatamzadeh, A., Ghasemnezhad, M., andGhorbanpour, M. 2013. The comparison ofantimicrobial effects of silver nanoparticles (SNP)and silver nitrate (AgNO3) to extend the vase lifeof "red ribbon" cut rose flowers. Trakia Journal ofScience, 11(2): 144-151.
Hatamzadeh, A., Hatami, M. and Ghasemnezhad, M.2012. Efficiency of salicylic acid delay petalsenescence and extended quality of cut spikes ofGladiolus grandiflora cv. 'wing's sensation'. AfricanJournal of Agricultural Research, 7: 540-545.
He, S., Joyce, D.C., Irving, D.E. and Faragher, J.D. 2006.Stem end blockage in cut Grevillea 'Crimson Yul-lo' inflorescences. Post harvest Biology andTechnology, 41: 78-84.
Jha, A.K. and Prasad, K. 2010. Green Synthesis of SilverNanoparticles Using Cycas Leaf. InternationalJournal of Green Nanotechnology: Physics andChemistry, 1: 110-117.
Kalpana, D. and Lee, Y.S. 2013. Synthesis andcharacterization of bactericidal silver nanoparticlesusing cultural filtrate of simulated microgravitygrown Klebsiella pneumonia. Enzyme Microbiologyand Technology, 52(3): 151-156.
Kaviya S., Santhanalakshmi J., Viswanathan B.,Muthumary J. and Srinivasan K. 2011. Biosynthesisof silver nanoparticles using citrus sinensis peelextract and its antibacterial activity. SpectrochimActa A, 79: 594-598.
Kazemi, M. and Ameri, A. 2012. Postharvest life of cut

32
Shisarenla Aier, P.K. Borthakur, R.C. Boro, H. Boruah, G. Goswami and Lallan Ram
gerbera floers as affected by nano-silver andacetylsalicylic acid. Asian Journal Biochemistry 7:106-111.
Kim, J.S., Kuk, E., Yu, K.N., Kim, J.H., Park, S.J., Lee,H.J., Kim, S.H., Park, Y.K., Park, Y.H., Hwang, C.Y.,Kim, Y.K., Lee, Y.S., Jeong D.H. and Cho, M.H.2007 Research topic and Nanomed.Nanotechnology Biology Med., 3: 95-101.
Kumar, M., Mondal P., Borah S., Mahato K. 2013. Physio-chemical evaluation, preliminary phytochemicalinvestigation, fluorescence and TLC analysis ofleaves of the plant Lasia spinosa leaves. Int JPharm Pharm Sci, Acad. Sci. 5(2): 306-310.
Liu, J.P., He, S.G., Zhang, Z.Q., Cao, J.P., Lv, P.T., He,S.D., Cheng, G.P. and Joyce, D.C. 2009.Nanosilver pulse treatments inhibit stem-endbacteria on cut gerbera cv. Ruikou flowers.Postharvest Biology and Technology, 54: 59-62.
Loubaud, M. and van Doorn, W.G. 2004. Wound-inducedand bacteria-induced xylem blockage in rose,Astilbe, and Viburnum. Postharvest Biology andTechnology, 32: 281-288.
Lu, P., Cao, J., He, S., Liu, J.H., Cheng, G., Ding, Y. andJoyce, D.C. 2010a. Nano-silver pulse treatmentsimprove water relations of gut rose cv. Movie Starflowers. Postharvest Biology and Technology, 57:196-202.
Mason, C., Vivekanandhan, S., Misra M. and Mohanty,A.K. 2012. Switchgrass (Panicium vigratum) extractmediated green synthesis of silver nanoparticlesWorld Journal Nano Science and Engineering, 2:47-52.
Mei-hua, F., Jian-xin, W., Shi, L., Shi, G. and Fan, L.2008. Salicylic acid and 6-BA effects in shelf-lifeimprovements of Gerbera Jamesonii cut flowers.Anhui Agricultural Science Bulletin. http://e n . c n k i . c o m . c n / A r t i c l e - e n / C J F D TOTA L -BFYY200808060.htm.
Mitra, M., Ng, S. and Mellis, A. 2012. The TLA1 proteinfamily members contain a variant of the plainMOV34/MPN domain. American Journal ofBiochemistry and Molecular Biology, 2: 1-8.
Moradi, P., Afshari, H. and Ebadi, A.G. 2012. The effectof benzyl adenine, nanosilver, 8-hydroxyquinolinesulfate, and sucrose on longevity improvement andsome other quality characteristics of Dianthus cv.Cream Viana cut flower. Indian Journal of Scienceand Technology, 5(53): 2459-2463.
Mori, Y., Okastu, Y. and Tsujimoto, Y. 2001. TitaniumDioxide Naboparticles Produced in Water-in-oilEmulsion. Journal of Nanoparticle Research, 3:219-225.
Moroness, J.R., Elechiguerra, J.L., Camacho, A., Holt,K., Kouri, J.B., Ramirez, T.J. and Yaca-Man, M.J.2005. The bactericidal effect of silvernanoparticles.Nanotechnology, 16: 2346-2353.
Nandibewoor, S.T. and Sataraddi, S.R. 2012.Biosynthesis, characterization and activity studiesof silver nanoparticles by (Costus igneus) insulinplant extract. Der Pharmacia Lettre. 4:152-158.
Ohkawa, K., Kasahara, Y. and Suh, J. 1999. Mobilityand effects on the vase life of silver containingcompounds in cut rose flowers. Hort. Science, 34:112-113.
Panyala, N.R., Peña-méndez, E.M. and Havel, J. 2008.Silver or silver nanoparticles?: a hazardous threatto the environment and human health. pp. 117-129.
Rafi, Z.N. and Ramezanian, A. 2013. Vase life of cutrose cultivars 'Avalanche' and 'Fiesta' as affectedby Nano-Silver and S-carvone treatments. SouthAfrican Journal of Botaney, 86: 68-72.
Rai, M., Yadav, A. and Gade, A. 2009. Silver nano-particles as a new generation of antimicrobials.Biotechnological Advances, 27(1): 76-83.
Rajasekharreddy, P., Rani, P.U. and Sreedhar, B. 2010.Qualitative assessment of silver and goldnanoparticle synthesis in various plants: aphotobiological approach. Journal of NanoparticleResearch, 12(5): 1711-1721.
Reid, M.S. and Jiang, C. 2012. Postharvest Biology andTechnology of Cut Flowers and Potted Plants 40:1-54.
Sairam, R.K., Deshmukh, P.S. and Shukla, D.S. 1997.Tolerance of drought and temperature stress inrelation to increased antioxidant enzyme activityin wheat. Journal of Agronomy and Crop Science178: 171-177.
Scariot, V., Paradiso, R., Rogers, H., and De Pascale,S. 2014. Ethylene control in cut flowers: classicaland innovative approaches. Post harvest Biologyand Technology, 97: 83-92.
Seyyed N.M., Mahmoud M. and Yavar S. 2011. Effectsof nanosilver and sucrose on vase life of cut roseflower (Rosa hybrida cv. 'Royal'). Journal ofMedicinal Plants Research, 5(28): 6455-6459.
Solgi, M. 2014. Evaluation of plant-mediated Silvernanoparticles synthesis and its application inpostharvest Physiology of cut Flowers. Physiologyand Molecular Biology of Plants, 20(3): 279-285.
Solgi, M., Kafi, M., Taghavi, T.S. and Naderi, R. 2009.Essential oils and nanoparticles (SNP) asnovelagents to extend vase-life of gerbera (Gerberajamesonii cv., Dune,) flowers. Post harvest Biology

33
Improvement in post harvest quality of cut flowers of Rosa hybrida
and Technology, 53: 155-158.
Sondi, I. and Salopek-Sondi, B. 2004. Silver nanoparticles as anti-microbial agent: A case study onE. Coli as a model for Gram-negative bacteria.Journal Colloid Interface Science, 275: 177-182.
Van Meetern, U., van Iberen, W., Nijsse, J. and Keijzer,K. 2001. Processes and xylem antimicrobialproperties involved in dehydration dynamics of cutflowers. Acta Horticulturae, 543: 207-211.
VanDoorn, W.G. 1997. Water relations of cut flowers.Horticultural Reviews, 18: 1-85.
VanIeperen, W. 2007. Ion-mediated changes of xylemhydraulic resistance in plant: a fact or fiction.Trends in Plant Science, 12: 137-142.
Williamson, V.G., Faragher, J.D., Parsons, S. and Franz,P. 2002. Inhibiting the postharvest wound responsein wild flowers. Rural Industry and ResearchDevelopment Corporation, 2/114: 23-29.
Zamani, S., Hadavi, E., Kazemi, M. and Hekmati, J. 2011.Effect of some chemical treatments on keepingquality of vase life of chrysanthemum cut flowers.World Applied Science Journal, 12: 1962-1966.

34
Anil K. Singh, Pavan Kumar, Anjana Sisodia, A.K. Pal, H.V. Singh and Minakshi PadhiJournal of Ornamental Horticulture. 20 (1&2): 34-39, 2017
Effect of pinching, urea and GA3 on growth, flowering andseed attributes in African marigold (Tagetes erecta L.)
ANIL K. SINGH, PAVAN KUMAR, ANJANA SISODIA, A.K. PAL,H.V. SINGH and MINAKSHI PADHI
Department of Horticulture, Institute of Agricultural Sciences,Banaras Hindu University, Varanasi-221005, Uttar Pradesh
E-mail: [email protected]
ABSTRACT
The present study was carried out to investigate the effect of pinching (single and double) andapplication of GA3 (100 ppm) and urea (2%) alone or in combination on plant growth, floweringand seed attributes of African marigold cv. Pusa Narangi Gainda. Foliar application of urea andGA3 was done to run-off stage. The experiment was laid out in a Randomized Block Design withthree replications. Results revealed that the maximum number of primary branches per plant,flower yield per plant and stem diameter were obtained with double pinching + urea 2% treatment,whereas minimum flower yield per plant was recorded with no pinching treatment. Maximumnumber of secondary branches per plant was recorded with double pinching + GA3 100 ppmtreatment. The maximum diameter of flower was recorded with single pinching + GA3 100 ppmwhile, maximum number of flowers per plant was recorded with double pinching treatment andminimum with no pinching treatment. Treatment double pinching + urea 2% was registeredmaximum number of seeds/flower, weight of seeds/flower and also seed yield. Treatment doublepinching + GA3 100 ppm resulted in maximum 100 seed weight.
Keywords: Marigold, GA3, urea, pinching, flowers, seed.
INTRODUCTION
Marigold (Tagetes spp.) is one of thecommercially exploited flower crops grown inIndia which belongs to the family Compositae.It is native of Mexico and South America fromwhere it spread to different parts of the worldduring early 16th century. Marigold is cultivatedas bedding plants and flowers are mainly usedas loose flower for making garland, wreath,religious offering, insect and nematodesrepellants, nutrient supplement for poultry feedetc. Now-a-days, marigold flowers are alsobeing used for extraction of carotenoid pigmentcalled lutein which offers several health benefits
like reducing age-related macular degeneration,coronary heart disease, cancer etc. Its leaves andflowers are also equally important for medicinalvalue. Flower extract is a good blood purifier, acure for blood piles, ulcer and eye diseases. Inmarigold, the production of flowers dependsupon the number of flower bearing branchespresent in the plant. The profuse flowering habitof marigold can be fully exploited by suppress-ing the vertical growth and encourageing theside branches to develop. Pinching of terminalportion of shoots at an early stage is a techniqueby which side branches are produced leading tohigher production of uniform sized flowers withsuperior quality. Likewise, growth regulator such

35
Effect of pinching, urea and GA3 on growth, flowering and seed attributes in African marigold
as GA3 is also commercially used to increasegrowth, suppress apical dominance, inducelateral buds and produce more number offlowers in various crops for easy cultivation andhigher flower yield (Khandelwal et al. 2003).Considering the importance of the flower, thepresent investigation was carried out to studythe effect of pinching, GA3 and urea on plantgrowth and flowering of African marigold(Tagetes erecta L.)
MATERIALS AND METHODS
The field experiment was conducted atHorticulture Research Farm, Banaras HinduUniversity, Varanasi. The raised seed beds about15cm height was prepared by digging the soiland mixing well rotten farmyard manure at 5kg/m2 in it and raising the level of beds to about15 cm. Seeds of African marigold cv. PusaNarangi Gainda were sown in the seed beds of3.6 × 1 m size. After raising seedling in nursery,plants were transplanted at four true leaf stageduring evening hours in first week of Decemberand immediately after transplanting, a lightirrigation was given applied. During the courseof investigation three levels of pinching i.e. nopinching, single pinching and double pinchingwere done. The single pinching was done 30days after transplanting (DAT) whereas, doublepinching was done twice at 30 and 60 days aftertransplanting. One level of urea (2% as foliarapplication), one level of GA3 (100 ppm asfoliar application) and their all combinationswere used for experimentation. GA3 and ureawere sprayed to run-off stage and distilled waterwas applied in control plants in the samemanner.The experiment was laid out inRandomized Block Design (RBD) with threereplications. Sixteen plants were planted in thefield under each treatment for the study in atspacing of 45 cm row to row and 45 cm plantto plant. All standard cultural practices were
followed to grow the crop. Observations ongrowth, flowering and seed attributes wererecorded. Results thus obtained were analyzedstatistically
RESULTS AND DISCUSSION
It is evident from Table 1 that no pinchingresulted in minimum number of primarybranches per plant (9.56) while, double pinching+ urea 2% treatment resulted in production ofmaximum number of primary branches per plant(15.53). Similarly, profuse development ofaxillary branches due to pinching along withapplication of urea has also been reported byJat et al. (2007) and Singh et al. (2015) inAfrican marigold. The length of primary branchwas minimum (23.36 cm) in plants in whichdouble pinching was done while, it wasmaximum (40.73 cm) in plants which weresprayed with GA3 (100 ppm) without pinching.The maximum number of secondary branchesper plant (43.90) was produced with doublepinching + GA3 100 ppm treatment, whereasthe minimum number of secondary branches perplant (22.83) was obtained with no pinching +GA3 100 ppm treatment. Similar findings werealso reported by Srivastava et al. (2002) inmarigold. In this study, maximum stem diameterof (1.71) cm was recorded under doublepinching + urea 2% treatment while, it wasnoted minimum (1.53 cm) in no pinching + GA3100 ppm treated plants. Present findings are inagreement with observation made by Tyagi andKumar (2006) in African marigold cv. Cupidand Singh et al. (2015) in cv. Pusa NarangiGainda. Maximum plant height (69.50 cm) wasrecorded under no pinching + urea 2% treatmentwhereas, minimum plant height (42.03 cm) wasfound in double pinching treatment. No pinchingtreatment leads to apical growth, which wasaccelerated by application of nitrogenousfertilizers, whereas in pinching treatments

36
Anil K. Singh, Pavan Kumar, Anjana Sisodia, A.K. Pal, H.V. Singh and Minakshi Padhi
growth of auxillary branches accelerated whennitrogen or GA3 applied. Similar results werealso reported by Bhati and Chitkara (1987) inAfrican marigold cultivar African Giant Yellowand French Dwarf Red and Sehrawat et al.(2003) in African marigold.
Similar to growth characters, various treatmentsof pinching and application of urea and GA3
exerted significant influence on differentflowering parameters (Table 2). The maximumdays taken to initiate flower bud (79.46 days)was recorded under double pinching + urea 2%treatment however, the minimum days requiredfor initiation of flower bud (38.86 days) wasobserved with no pinching + GA3 100 ppmtreatment. The result of present investigationwas in close agreement with the findings of
Table 1: Effect of pinching, urea and GA3 on various growth characters.
Treatment No. of No. of Length of Stem Plantprimary secondary primary diameter height
branches/ branches/ branch (cm) (cm)plant plant (cm)
No pinching 9.56 23.60 39.80 1.54 63.86
Single pinching 13.10 30.93 30.96 1.63 50.33
Double pinching 10.50 42.03 23.36 1.70 42.03
No pinching + urea 2% 9.80 23.00 39.16 1.56 69.50
No pinching + GA3 100 ppm 13.56 22.83 40.73 1.53 67.86
Single pinching + urea 2% 15.06 32.30 29.66 1.65 51.33
Single pinching + GA3 100 ppm 14.76 37.83 31.76 1.61 52.33
Double pinching + urea 2% 15.53 41.96 25.50 1.71 43.86
Double pinching + GA3 100 ppm 12.86 43.90 28.16 1.61 45.70
C.D. (5%) 1.80 4.10 4.20 0.21 5.65
Table 2: Influence of pinching, urea and GA3 on flower and flowering parameters
Treatment Duration of Number Average Flower Days Days Diameterflowering of flowers/ weight of yield/ to bud to of flower
(days) plant flower (g) plant (g) initiation flowering (cm)
No pinching 83.70 33.50 4.25 144.45 42.13 57.16 4.76
Single pinching 70.10 47.16 4.51 214.60 56.26 68.93 5.33
Double pinching 51.46 61.03 5.35 347.75 75.90 87.73 5.09
No pinching + urea 2% 80.66 38.50 5.74 216.94 46.73 60.96 4.84
No pinching + GA3 87.03 34.93 5.27 180.32 38.86 50.90 4.34100 ppm
Single pinching + urea 2% 67.40 51.90 5.79 296.03 60.46 73.00 5.47
Single pinching + GA3 76.83 37.73 6.32 239.95 51.06 63.13 5.65100 ppm
Double pinching + urea 2% 48.46 57.23 5.79 350.62 79.46 90.50 5.37
Double pinching + GA3 54.96 54.46 5.74 315.98 73.00 84.26 5.28100 ppm
C.D. (5%) 3.22 6.62 0.66 34.05 2.40 2.39 0.47

37
Effect of pinching, urea and GA3 on growth, flowering and seed attributes in African marigold
Jangra (1993) in African marigold. Themaximum days to 50% flowering (90.50 days)was observed with double pinching + urea 2%treatment, while the minimum days to 50%flowering (50.90 days) was noted under nopinching + GA3 100 ppm treatment.Themaximum diameter of flower (5.65 cm) wasrecorded under single pinching + GA3 100 ppmtreatment while, the minimum diameter offlower (4.34 cm) was recorded with no pinching+ GA3 100 ppm treatment. These results are inclose conformity with the findings of Jangra(1993)in marigold and Singh (1999) in tuberose.The minimum duration of flowering (48.46days) was recorded in double pinching + urea2% treatment however, the maximum durationof flowering (87.03 days) was observed withno pinching + GA3 100 ppm treatment. Theseresults are in close conformity with the findingsof Jangra (1993) in marigold. Double pinchingresulted in maximum number of flowers perplant (61.03) whereas, the lowest number offlowers per plant (33.50) was reported with nopinching treatment. Increase in number offlowers with pinching has also been reported inAfrican marigold by Khandelwal et al. (2003)and Srivastava et al. (2002). The maximumweight of flower (6.32 g) was obtained from
plants of single pinching + GA3 100 ppmtreatment whereas, it was minimum (4.25 g) inplants with no pinching. The present results arealso supported by Jangra (1993) in marigold andSingh and Bijimol (2001) in tuberose. Themaximum flower yield per plant (350.62 g) wasrecorded in plants of double pinching + urea2% treatment while, the lowest flower yield perplant (144.45 g) was recorded under plants ofno pinching treatment. The present results arein close agreement with the findings of Jangra(1993), Sehrawat et al. (2003) in Africanmarigold cultivar African Giant Double Orangeand Bijimol and Singh (2001) in gladiolus.
In this study, various treatments exhibitedsignificant effect on different seed attributes(Table 3). Plants under treatment of no pinching+GA3 100 ppm took maximum days to ripenseeds (103.33 days) whereas, treatment ofdouble pinching + urea 2% exhibited earliestseed ripening (67.13 days). Among differenttreatments the number of seeds/flower rangedfrom 210.84 to 316.45. Treatment doublepinching + urea 2% registered maximumnumber of seeds/flower (316.45) followed bysingle pinching + GA3 100 ppm (311.52),whereas minimum number of seeds of about
Table 3: Effect of pinching, urea and GA3 on seed and seed attributes
Treatment Days to seed Number of Weight of 100-seed Seed yield/ ripening seeds/flower seeds/flower (g) weight (g) plant (g)
No pinching 100.70 210.96 0.31 0.15 10.49
Single pinching 85.76 269.20 0.44 0.16 21.02
Double pinching 68.46 280.65 0.43 0.15 26.52
No pinching + urea 2% 101.66 256.41 0.34 0.13 13.15
No pinching + GA3 100 ppm 103.33 210.84 0.34 0.16 11.98
Single pinching + urea 2% 82.40 307.67 0.46 0.15 24.16
Single pinching + GA3 100 ppm 92.16 311.52 0.52 0.16 19.58
Double pinching + urea 2% 67.13 316.45 0.53 0.16 30.15
Double pinching + GA3 100 ppm 71.63 278.72 0.48 0.1 26.32
C.D. (5%) 4.81 23.12 0.07 0.02 5.38

38
Anil K. Singh, Pavan Kumar, Anjana Sisodia, A.K. Pal, H.V. Singh and Minakshi Padhi
210.84 and 210.96 per flower was noticed withtreatments no pinching + GA3 100 ppm and nopinching respectively. Present finding isexperimentally substantiated by Tomar et al.(2004) in marigold. Maximum weight of seeds/flower (0.53 g) was recorded with treatmentdouble pinching + urea 2% whereas, minimumweight of seeds/flower (0.31) was registeredwith treatment no pinching. Double pinchingand urea treatment leads to increase in morenumber of secondary branches and leaves whichresulted into production of more photosynthatesand ultimately enhanced seed production. Thepresent findings are also corroborated with theobservations made by Natarajan and Kumar(2002) and Swaroop et al. (2007). The treatmentdouble pinching + GA3 100 ppm gavemaximum 100 seed weight (0.17 g), whereas,it was found minimum (0.13 g) with treatmentno pinching + urea 2%. This increase in 100seed weight was mainly due to GA3 applicationwhich brought metabolic change that affectedboth quality and quantity of the desired product.Similar results were reported by Shivaprasandand Shetty (1995), Doddagoudar et al. (2002)in China aster and Singh (2004). Maximum seedyield/plant (30.15 g) was recorded with treat-ment double pinching + urea 2%, which wasstatistically at par with treatment doublepinching. However, plants without pinchingproduced minimum seed yield/plant (10.49 g).Similar results were reported by Tomar et al.(2004) in African marigold.
REFERENCES
Bhati, R.S. and Chitkara, S.D. 1987. Effect of pinchingand planting distance on growth and yield ofmarigold (Tagetes erecta L.). Research andDevelopment Reporter, 4: 159-164.
Bijimol, G. and Singh, A.K. 2001. Effect of spacing andnitrogen on flowering, flower quality and postharvest life of gladiolus. Journal of AppliedHorticulture, 3(1): 48-50.
Doddagoudar, S.R., Vyakaranahal, B.S, Shekhargouda,M., Naliniprabhakar A.S. and V.S. Patil, 2002.Effect of mother plant nutrition and chemical sprayon growth and seed yield of China aster cv. Kamini.Seed Research, 30(2): 269-274.
Jangra, R.K. 1993. Effect of nitrogen and pinching ongrowth and flowering behaviours of marigold(Tagetes erecta L.) cv. African Giant DoubleOrange. M.Sc. (Ag.) Thesis, CCS, HaryanaAgricultural University, Hissar.
Jat, R.N., Khandelwal, S.K. and Gupta, K.N. 2007. Effectof foliar application of urea and zinc sulphate ongrowth and flowering parameters in Africanmarigold (Tagetes erecta Linn.). Journal ofOrnamental Horticulture, 10(4): 271-273.
Khandelwal, S.K., Jain, N.K. and Singh, P. 2003. Effectof growth retardants and pinching on growth andyield of African marigold (Tagetes erecta L.).Journal of Ornamental Horticulture, 6: 271-273.
Natarajan, K. and Kumar, V. 2002. Effect of fertilizer andspacing on seed yield and quality in marigold cv.African Giant. Advances in Plant Sciences, 15(2):525-532.
Raskauskas, V., Knyviene, A. and Zalatoriute, G. 1983.Effect of pinching back of Sim carnation. Biologia,21: 16-22.
Sehrawat, S.K., Dahiya, D.S., Singh, S. and Rana, G.S.2003. Effect of nitrogen and pinching on thegrowth, flowering and yield of marigold (Tageteserecta L.) cv. African Giant Double Orange.Haryana Journal of Horticulture Science, 32: 59-61.
Shivaprasad, K. and Shetty, B. 1995. Effect of GA3 andcycocel on maturity, seed yield and quality in Chinaaster (Callistephus chinensis L. Nees). M.Sc. (Ag.)Thesis, University of Agricultural Sciences,Bangalore.
Singh, A.K. 1999. Response of tuberose growth,flowering and bulb production to plant bioregulatorsspraying. Progressive Horticulture, 31(3&4): 181-83.
Singh, A.K. 2004. Influence of plant bio-regulators ongrowth and seed yield in French marigold (Tagetespatula Linn.). Journal of Ornamental Horticulture,7(2): 192-195.
Singh, A.K. and Bijimol, G. 2001. Influence of growthregulating chemicals on growth, flowering and bulbproduction in tuberose (Polianthes tuberosa L.).Indian Perfumer, 45(1): 31-34.
Singh, A.K., Singh, S.V., Anjana, Sisodia, A., Asmita andHembrom, R. 2015. Effect of pinching and nitrogenon growth, flowering and seed yield in African

39
Effect of pinching, urea and GA3 on growth, flowering and seed attributes in African marigold
marigold cv. Pusa Narangi Gainda. Environmentand Ecology, 33(4B): 1876-1879.
Srivastava, S.K., Singh, H.K. and Srivastava, A.K. 2002.Effect of spacing and pinching on growth andflowering of African marigold (Tagetes erecta L.)cv. Pusa Narangi Gainda. Indian Journal ofAgricultural Sciences, 72: 611-612.
Swaroop, K., Raju, D.V.S. and Singh, K.P. 2007. Effectof nitrogen and phosphorus on growth, floweringand seed yield of African marigold, variety Pusa
Narangi Gainda (Tagetes erecta L.). Orissa Journalof Horticulture, 35(2): 15-20.
Tomar, B.S., Singh, B., Negi, H.C.S. and Singh, K.K.2004. Effect of pinching on seed yield and qualitytraits in African marigold. Journal of OrnamentalHorticulture, 7(1): 124-126.
Tyagi, A.K. and Kumar, V. 2006. Effect of gibberellic acidand vermicompost on vegetative growth andflowering in African marigold (Tagetes erecta Linn.).Journal of Ornamental Horticulture, 9(2): 150-151.

40
Imchalemla and Pauline AlilaJournal of Ornamental Horticulture. 20 (1&2): 40-45, 2017
Studies on the storage methods of bulbs inLilium var. Brindisi
IMCHALEMLA and PAULINE ALILA
Department of HorticultureSchool of Agricultural Sciences and Rural Development
Nagaland University, Medziphema-797106, NagalandE-mail: [email protected]
ABSTRACT
The present study was undertaken where in Lilium bulbs were stored under different conditions toobserve the viability and performance of the bulbs. The experiment was laid out in CompletelyRandomized Design with 5 replications and 6 treatments viz. bulbs stored after harvest in the soilafter flowering, in plastic storage container with cocopeat, in wooden storage container withcocopeat, at 4±1°C for 6 weeks, at –1±1°C for 6 weeks and in perforated baskets in ventilatedroom. From the findings, it was observed that storing bulbs at 4±1 °C for 6 weeks was favourablefor inducing flower initiation in Lilium. The bulbs can also be successfully stored in plastic storagecontainer with cocopeat which exhibited flowering characteristics similar to those commerciallycultivated.
Keywords: Lilium, storage methods, bulbs, Brindisi.
INTRODUCTION
Lilium genus comprise of about 300 to 400species belonging to the family Liliaceae. Thedemand for Lilium as cut flower is rapidlyincreasing day by day in the national andinternational market. Lilium is highly soughtafter by the flower growers of Nagaland stateas they have good demand in the local marketbecause of their beauty, good vase life,compatibility to different styles of flowerarrangement and brings good fetching price. Oneof the main difficulties faced by the Liliumgrowers is the storage of bulbs. The lily bulbshave a specific cold requirement for breakingthe dormancy which may be a factor for farmersinability to grow standard crop in the nextseason. Various studies show showed that
growth and development in plants aretemporarily suspended during the dormantperiod (Lang et al. 1985; Junttila, 1988). Liliumlongiflorum requires a 6 week cool-moist periodat 1.5-7.0°C for rapid flowering (Miller, 1993;Rees, 1992). Asiatic and Oriental hybrids arestored at 1.0-2.0°C for 6-9 weeks to breakdormancy (Beck, 1984; Beattie and White,1993). Maximum weight of bulbs was foundwhen bulbs were stored in peat moss comparedto other storage mediums (Kumar et al. 1999).Bulbs used for greenhouse forcing must receive6 weeks (LA lilies), 6 to 9 weeks (Asiatic), and9 weeks (Oriental) of cold moist treatment (Roh,1999). Langens-Gerrits et al. (2001) reportedthat dormancy in all genotypes of lily wasbroken by cold incubation for several weeks.Merel et al. (2003) reported that dormancy in
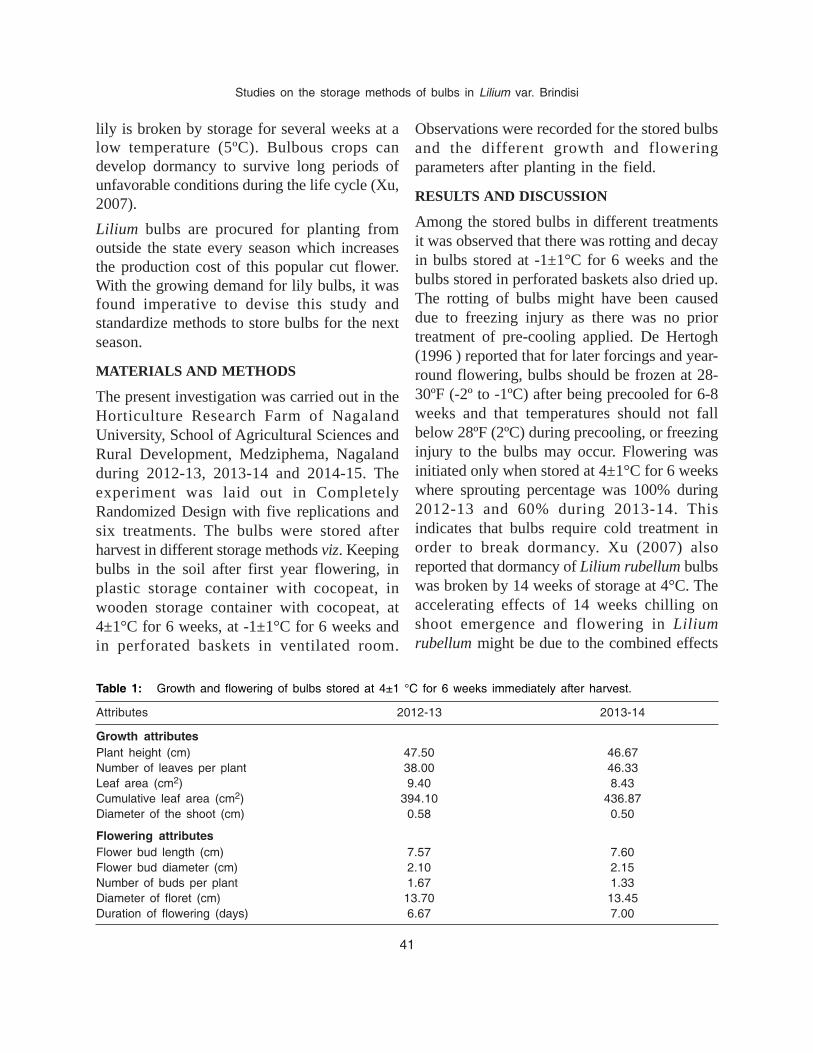
41
Studies on the storage methods of bulbs in Lilium var. Brindisi
lily is broken by storage for several weeks at alow temperature (5ºC). Bulbous crops candevelop dormancy to survive long periods ofunfavorable conditions during the life cycle (Xu,2007).
Lilium bulbs are procured for planting fromoutside the state every season which increasesthe production cost of this popular cut flower.With the growing demand for lily bulbs, it wasfound imperative to devise this study andstandardize methods to store bulbs for the nextseason.
MATERIALS AND METHODS
The present investigation was carried out in theHorticulture Research Farm of NagalandUniversity, School of Agricultural Sciences andRural Development, Medziphema, Nagalandduring 2012-13, 2013-14 and 2014-15. Theexperiment was laid out in CompletelyRandomized Design with five replications andsix treatments. The bulbs were stored afterharvest in different storage methods viz. Keepingbulbs in the soil after first year flowering, inplastic storage container with cocopeat, inwooden storage container with cocopeat, at4±1°C for 6 weeks, at -1±1°C for 6 weeks andin perforated baskets in ventilated room.
Observations were recorded for the stored bulbsand the different growth and floweringparameters after planting in the field.
RESULTS AND DISCUSSION
Among the stored bulbs in different treatmentsit was observed that there was rotting and decayin bulbs stored at -1±1°C for 6 weeks and thebulbs stored in perforated baskets also dried up.The rotting of bulbs might have been causeddue to freezing injury as there was no priortreatment of pre-cooling applied. De Hertogh(1996 ) reported that for later forcings and year-round flowering, bulbs should be frozen at 28-30ºF (-2º to -1ºC) after being precooled for 6-8weeks and that temperatures should not fallbelow 28ºF (2ºC) during precooling, or freezinginjury to the bulbs may occur. Flowering wasinitiated only when stored at 4±1°C for 6 weekswhere sprouting percentage was 100% during2012-13 and 60% during 2013-14. Thisindicates that bulbs require cold treatment inorder to break dormancy. Xu (2007) alsoreported that dormancy of Lilium rubellum bulbswas broken by 14 weeks of storage at 4°C. Theaccelerating effects of 14 weeks chilling onshoot emergence and flowering in Liliumrubellum might be due to the combined effects
Table 1: Growth and flowering of bulbs stored at 4±1 °C for 6 weeks immediately after harvest.
Attributes 2012-13 2013-14
Growth attributesPlant height (cm) 47.50 46.67Number of leaves per plant 38.00 46.33Leaf area (cm2) 9.40 8.43Cumulative leaf area (cm2) 394.10 436.87Diameter of the shoot (cm) 0.58 0.50
Flowering attributesFlower bud length (cm) 7.57 7.60Flower bud diameter (cm) 2.10 2.15Number of buds per plant 1.67 1.33Diameter of floret (cm) 13.70 13.45Duration of flowering (days) 6.67 7.00

42
Imchalemla and Pauline Alila
of the decline in the level of free ABA,accumulation of soluble sugars and a decline orincrease of some unknown factors in bulbs.Table 1 shows the various attributes of growthand flowering of bulbs sprouted immediatelyafter harvest without undergoing any dormancy.The plants did not show much robust growthand although the size of flowers werecomparable with the standard size and thenumber of buds were less. This could be due toimmediate sprouting of buds without allowingdormancy to set in the bulbs. In bulbs, starchcontent (Sun et al., 2004a), endogenous abscisicacid (ABA) level (Sun et al., 2006a), nitrogen,phosphorus and potassium content (Sun et al.2004b) all reached maximum levels half-waythrough the withering stage of the plant, but thefresh and dry weights peaked only followingcomplete withering. This suggests the bulbsundergo certain physiological processes after theplant reach senescence and enter into dormancy.In the present study, these bulbs after floweringwere left in the field which again sprouted alongwith the other treated bulbs during fall seasonwhen atmospheric tempera-ture decreased.There was 100% sprouting of bulbs in all fourtreatments in both the years of study.
Growth attributes
The maximum plant height during 2012-14 wasobserved in bulbs stored in wooden containerwith cocopeat (57.90 cm) while the minimumplant height (48.00 cm) was observed in bulbsstored at 4±1°C for 6 weeks (Table 2). Howeverin 2013-15 and pooled analysis showed that themaximum plant height (60.36 cm and 57.05 cm)were noted in bulbs stored in plastic containerwith cocopeat.
The shoot thickness did not differ significantlyin both years of study. In general, storing bulbsin the soil and in plastic storage container withcocopeat resulted in maximum thickness of
shoot (0.6 cm) during 2012-14 and 2013-15respectively. The minimum diameter of shoot(0.52 cm) during 2012-14 was produced bybulbs stored at 4±1°C for 6 weeks and left inthe soil after flowering (Table 2). The pooleddata analysis showed significant variationsamong the treatments where maximum shootdiameter (0.59 cm) was exhibited by keepingbulbs in the soil and plastic storage containerwith cocopeat.
The maximum number of leaves (48.20) during2012-14 was observed in wooden container withcocopeat. However, during 2013-15, the leafproduction trend per plant was different wherethe maximum number of leaves per plant(58.00) was produced by bulbs stored in plasticcontainer with cocopeat. In the pooled data, themaximum number of leaves per plant wasproduced by bulbs stored in wooden storagecontainer with cocopeat (51.80).
Bulbs stored during 2012-14 in wooden storagecontainer with cocopeat produced the maximumcumulative leaf area (509.94 cm2) However,during 2013-15, the maximum cumulative leafarea (614.38 cm2) was observed in plasticcontainer with cocopeat. In pooled analysis themaximum cumulative leaf area (544.21 cm2)was observed in wooden container withcocopeat (Table 2).
Flowering attributes
The flowering attributes are indicative of thequality of the flowers. By studying the floweringattributes, the response of different bulb storagemethods can be further confirmed. Bulb storageat 4±1°C for 6 weeks (31.8 days from budemergence (BE)) proved to be the best inenhancing reaching colour break stage during2012-14, and in 2013-15, bulbs stored inwooden container with cocopeat was foundearlier (32 days from BE) while keeping bulbs

43
Studies on the storage methods of bulbs in Lilium var. Brindisi
in the soil after first year flowering took thelongest time (34.6 and 34.4 days from BE) toreach colour break stage although they did notdiffer significantly with the treatments in boththe years (Table 3). However, pooled dataanalysis showed significant response in daystaken to reach colour break stage.
The findings of the experiment indicated thatwooden storage container and 4±1°C for 6weeks were better first floret opening (Table 3).Pooled data analysis portrayed superiority ofwooden storage container in terms of first floretopening was 34.2 days from bud emergence(BE).
Maximum length of flowering shoot (9.9 and9.98 cm) during 2012-14 and 2013-15 wasobserved in plants whose bulbs were stored inplastic container with cocopeat (Table 3). Pooleddata analysis further confirmed the aboveobservations with plastic storage containerdisplaying the maximum length of floweringshoot (9.94 cm) and superiority over othertreatments. Imchalemla (2016) reportedmaximum length of flowering shoot (9.35 cm)in plants treated with NPK 50% + AMF 50% +FYM 10 t/ha . The present findings showed thatthe stored bulbs produce standard stem lengthas commercially grown in the state of Nagaland.Storing bulbs in plastic container with cocopeatshowed beneficial effect with regard toflowering attributing characters of Lilium likenumber of buds per plant, bud length, buddiameter per plant. This explains that cocopeatprovides a suitable environment and properaeration for the storage of Lilium bulbs. Liliumbulbs should not be allowed to dry out in orderto produce quality flowers. In Zantedeschiarehmannii, tuber storage at a temperature of10°C was found suitable for flower budinitiation (Goto et al. 2005).Ta
ble
2:
Veg
etat
ive
grow
th c
hara
cter
istic
s of
lili
um c
v. B
rindi
si
as i
nflu
ence
d by
sto
rage
met
hods
of
bulb
s.
Tre
atm
ents
Pla
nt h
eigh
t (c
m)
Dia
met
er o
f sh
oot
(cm
)N
umbe
r of
lea
ves
per
plan
tC
umul
ativ
e le
af a
rea
(cm
2 )
2012
-14
2013
-15
Poo
led
2012
-14
2013
-15
Poo
led
2012
-14
2013
-15
Poo
led
2012
-14
2013
-15
Poo
led
In s
oil
56.0
054
.04
55.0
20.
600.
580.
5946
.00
41.0
043
.50
479.
7442
2.34
451.
04P
last
ic c
onta
iner
53.7
460
.36
57.0
50.
580.
600.
5942
.60
58.0
050
.30
451.
4061
4.38
532.
89w
ith c
ocop
eat
Woo
den
cont
aine
r57
.90
56.1
257
.01
0.56
0.54
0.55
48.2
055
.40
51.8
050
9.94
578.
4854
4.21
with
coc
opea
t4±
1°C
for
48.0
056
.80
52.4
0.52
0.54
0.53
43.2
55.8
049
.50
417.
0455
5.72
486.
386
wee
ksS
Em
±1
1.05
1.11
0.73
0.02
0.03
0.02
1.00
2.93
1.24
9.67
30.5
112
.41
CD
at
5%3.
143.
322.
48N
SN
S0.
053.
018.
794.
1828
.37
91.4
741
.95

44
Imchalemla and Pauline Alila
The maximum floret diameter (13.9 and 13.84cm) was observed with 4±1°C for 6 weeksduring 2012-14 and 2013-15 respectively.Pooled data analysis also showed maximumfloret diameter of 13.87 cm with 4±1°C for 6weeks. The minimum floret diameter of 13.34cm was observed with wooden container withcocopeat (Table 3).
The maximum duration of flowering (10 days)during 2012-14 was found in bulbs stored inplastic container with cocopeat which exhibitedits superiority over the other treatmentsstatistically (Table 3). The data on duration offlowering during 2013-15 was found to besignificant displaying similar trend of responsewith plastic container with cocopeat exhibitingthe maximum duration of flowering (9.2 days)which was significantly higher than the othertreatments. Pooled data analysis furtherconfirmed the results where the maximumduration of flowering (9.6 days) was displayedby plastic container with cocopeat exhibitingsigni-ficantly better response than the othertreatments and the minimum duration offlowering (7.4 days) was observed in bulb keptin the soil. However, the standard duration offlowering in Lilium under Nagaland conditionwas recorded to be 11 to 12 days (Imchalemla,2016).
Storing bulbs at 4±1°C for 6 weeks provedeffective for breaking dormancy in Lilium bulbsand inducing flower initiation and sproutingimmediately after the storage period. From theflower initiation of the stored bulbs, it may beconcluded that bulbs can be stored in plasticstorage container with cocopeat which exhibitedbetter growth and flowering characteristics ascompared to the others. However, more studieson Lilium bulb storage may be conducted tostandardise time and type of storage in order toproduce flowers of standard cut flower quality.Ta
ble
3:
Flo
wer
ing
char
acte
ristic
s of
lili
um c
v. B
rindi
si a
s af
fect
ed b
y st
orag
e m
etho
ds o
f bu
lb.
Tre
atm
ents
Leng
th o
f flo
wer
ing
Day
s fr
om b
ud e
mer
genc
e (B
E)
toD
iam
eter
of
Dur
atio
n of
shoo
t (c
m)
flore
t (c
m)
flow
erin
g (d
ays)
Col
our
brea
k st
age
Firs
t flo
ret
open
ing
2012
2013
Poo
led
2012
2013
Poo
led
2012
2013
Poo
led
2012
2013
Poo
led
2012
2013
Poo
led
-14
-15
-14
-15
-14
-15
-14
-15
-14
-15
In s
oil
8.78
8.80
8.79
34.6
034
.40
34.5
037
.40
37.0
037
.20
13.8
613
.62
13.7
47.
407.
407.
40P
last
ic c
onta
iner
9.90
9.98
9.94
34.0
033
.40
33.7
036
.40
35.4
035
.90
13.5
813
.72
13.6
510
.00
9.20
9.60
with
coc
opea
tW
oode
n co
ntai
ner9
.70
9.46
9.58
32.2
032
.00
32.1
034
.20
34.2
034
.20
13.4
013
.28
13.3
48.
007.
607.
80w
ith c
ocop
eat
4±1°
C f
or9.
309.
549.
4231
.80
32.4
032
.10
34.0
034
.60
34.3
013
.90
13.8
413
.87
8.60
8.20
8.40
6 w
eeks
SE
m±
10.
090.
060.
060.
800.
750.
600.
750.
640.
540.
070.
060.
040.
360.
320.
19C
D a
t 5%
0.27
0.17
0.19
NS
NS
2.03
2.25
1.93
1.84
0.21
0.18
0.15
1.08
0.95
0.64

45
Studies on the storage methods of bulbs in Lilium var. Brindisi
REFERENCES
Beattie, D.J. and White, J.W. 1993. Lilium-hybrids andspecies. Chapter 28. In: De Hertogh, A., Le Nard,M. (Eds.), The physiology of flower bulbs. Elsevier,Amsterdam. pp. 423-454.
Beck, R. 1984. The 'hows' and 'whys' of hybrid lilies;establishing a multicolored lily program for cuts orpots. Florist's Review, 175: 22, 24, 27.
De Hertogh, A.A. 1996. Holland Bulb Forcer's Guide.5th ed. International Flower Bulb Center, Hillegom,The Netherlands.
Goto, T., Kawajiri, K. and Konishi, K. 2005. Flowering ofZantedeschia rehmannii Engl. as affected bycombination of tuber storage temperature andduration. Acta Horticulturae, 673(1): 273-277.
Imchalemla, 2016. Studies on Integrated nutrientmanagement and storage of bulbs in Lilium cv.Brindisi. Ph.D. Thesis, Nagaland University, Schoolof Agricultural Sciences and Rural Development,Medziphema Campus, India.
Junttila, O. 1988. To be or not to be dormant: somecomments on the new dormancy nomenclature.Hort Science, 23(5): 805-806.
Kumar, R., Arora, J.S. and Singh, S. 1999. Studies onthe bulb production, storage medium and vase lifeof Asiatic hybrids of lilium cultivars. Journal ofOrnamental Horticulture, 2(2): 133-134.
Lang, G.A., Early, J.D., Arroyave, N.J., Darnell, R.L.,Martin, G.C. and Stutte, G.W. 1985. Dormancy:toward a reduced, universal terminology. HortScience, 20: 809-812.
Langens-Gerrits, M.M., Nashimoto, S., Croes, A.F. andKlerk, G.J. De. 2001. Development of dormancyin different lily genotypes regenerated in vitro. PlantGrowth Regulation, 34(2): 215-222.
Merel, L.M., Miller, W.B.M., Croes, A.F. and Klerk, G.J.2003. Effect of low temperature on dormancybreaking and growth after planting in lily bulbletsregenerated in vitro. Plant Growth Regulation,40(3): 267-275.
Miller, W.B. 1993. Lilium longiflorum. Chapter 27. In: DeHertogh, A. and LeNard, M. (Eds.), The physiologyof flower bulbs. Elsevier, Amsterdam, pp. 391-422.
Rees, A.R. 1992. Ornamental bulbs, corms and tubers.Chapter 5: Physiology. C.A.B InternationalWallingford, Oxon OX10 8DE UK. pp. 61-92.
Roh, M. 1999. Physiology and management of liliumbulbs. Acta Horticulturae, 482: 30-45.
Sun H.M., Li, T.L. and Li Y.F., 2004a. Relations betweenstarch metabolism and germination of Lilium davidiivar. unicolor bulbs at different cold temperature.Acta Horticulturae Scinica, 31: 337-342
Sun H.M., Li, T.L. and Li Y.F., 2004b. Absorption anddistribution of nitrogen, phosphorus and potassiumduring Lilium davidii var. unicolor development.Chinese Agricultural Science Bulletin, 20: 206-208
Xu, R.Y. 2007. Effect of low temperature on changes inendogenous hormone level and plant developmentin Lilium and Tulipa. Doctoral program inEnvironmental Management Science. Graduateschool of Science and Technology, NiigataUniversity.

46
Shisa Ullas P., Namita, Kanwar Pal Singh and Sapna PanwarJournal of Ornamental Horticulture. 20 (1&2): 46-53, 2017
Cluster analysis of chrysanthemum(Chrysanthemum × morifolium Ramat.) genotypes
on the basis of anthocyanin and carotenoid pigmentsSHISA ULLAS P., NAMITA, KANWAR PAL SINGH and SAPNA PANWAR
Division of Floriculture and LandscapingICAR-Indian Agricultural Research Institute, New Delhi-110012
E-mail: [email protected]
ABSTRACT
In the present investigation, 50 cultivars of chrysanthemum (Chrysanthemum × morifolium Ramat.)were evaluated to assess the genetic diversity on the basis of total anthocyanin and carotenoidcontent using cluster analysis by average linkage method. Cluster analysis produced two majorclusters of genotypes. Among the genotypes studied for total anthocyanin content, Cluster Irepresents genotype (Red Gold) with highest anthocyanin content. Cluster IIA contained varietieshigh in anthocyanin whereas cluster IIB had genotypes with less anthocyanin content. Similarly,among the genotypes screened for total carotenoid content, highest carotenoid content was observedin genotypes under cluster II (sub-clusters: IIAa- Star yellow & Jubilee and IIAb- Haldighati,Liliput & Little Orange). Cluster I and sub-cluster IIB had genotypes with less total carotenoidcontent. Extensive range of genetic variability was observed among all the genotypes ofchrysanthemum. The genotypes under widely divergent clusters can be utilized in hybrid breedingprogramme for flower colour and pigments.
Keywords: Anthocyanin, carotenoid, chrysanthemum, cluster analysis.
INTRODUCTION
Chrysanthemum (Chrysanthemum × morifoliumRamat.) is one of the most economicallyimportant flower crops cultivated all over theworld. It belongs to family Asteraceae and isnative to Asia and North Eastern Europe. It ismainly used as a cut flower, loose flower andalso highly suitable for beds, pots and for floralarrangements due to wide range of shapes,forms, colours in its flowers, uniform flowering,their excellent keeping quality and availabilitythroughout the year. Chrysanthemum is famedfor their beautiful colours including red, pink,orange, orange-red, magenta, scarlet colours arecontributed by anthocyanins (Ogata et al. 2005),
however, carotenoids present in some of thevarieties contribute yellow to brown colourationin chrysanthemum. Flower colour is animportant quality determinant that not onlyaffects the ornamental merit of a plant but alsodirectly influences its commercial value. Thesepigments are recognized as safe chemicals fornutraceutical purpose because of theirconcentrated colour and antioxidant activity inhuman being. Due to increased awareness aboutill effects of synthetic pigments on human healthand environment, Now-a-days, research isoriented more towards identification andisolation of pigments from natural sources andbreeding varieties rich in pigments.

47
Cluster analysis of chrysanthemum (Chrysanthemum × morifolium Ramat.)
The characterization and grouping of germplasmhelps the breeder to avoid duplication insampling populations. The variation occurred inpigments provides an opportunity to identifysuitable inbred lines for pigment rich varietaldevelopment. Cluster analysis is frequently usedto classify genotypes and further, used bybreeders and geneticists to identify subsets ofgenotypes which have potential for specificbreeding programme (Rincon et al. 1996). Theobjective of cluster analysis is to assign geno-types to homogeneous groups/clusters so thatgenotypes within each group are similar to oneanother with respect to variables or attributesof interest having similar response pattern acrossthe locations and the groups themselves standapart from one another. Classifying genotypesbased on carotenoid and anthocyanin couldreduce the time period and expenditure for cropimprovement. There are very few publishedreports and scanty information on clusteranalysis of chrysanthemum genotypes based oncarotenoid and anthocyanin pigments in India.Therefore, this study was carried out with theobjectives to group various genotypes ofchrysanthemum according to pigment content.
MATERIALS AND METHODS
Plant materials
The plant material utilized for conducting theexperiment consisted of 25 genotypes ofchrysanthemum (Chrysanthemum × morifoliumRamat.) namely Classic, Geetanjali, LittleOrange, Mayur-5, Punjab Anmol, Aparajita,Sadwin Yellow, Yellow Gold, Vijay Kiran, AjayOrange, Pusa Aditya, Mallika Yellow, Ram LalDada, Yellow Reflex, Haldighati, Pusa Sona,Jubilee, Jayanti, Pusa Centenary, Liliput, StarYellow, Teri, Kundan and Texas Gold forcarotenoids estimation and other 25 varietiessuch as Ajay, Pusa Anmol, Red Gold, TataCentury, Lalpari, Red Stone, Neelima, Kanchil,
Sadhbhavana, Taichen Pink, Pusa Kesari,Taichen Queen, Pink Star, Atom Jaya, CorconSmall, Little Pink, Karnal Pink, Pink Cloud, RedSpoon, Pusa Chitraksha, Syamal, Jaya, GardenBeauty, Daitymed and Ravi Kiran foranthocyanin estimation. These were grown andmaintained at research farm of the Division ofFloriculture and Landscaping, ICAR-IndianAgricultural Research Institute, New Delhiduring 2014-16. Fresh ray florets were harvestedat full bloom stage for determination ofpigments.
Estimation of pigments
The total carotenoids were extracted andestimated using method given by Ranganna(1995) and the total monomeric anthocyanincontent was determined on a UV-visible doublebeam spectrophotometer by the pH-differentialmethod (Wrolstad et al.2005)
Cluster analysis
Cluster analysis was used to classify distinctgenotypes based on the carotenoid andanthocyanin contents. The analysis was carriedout according to average linkage method bymeans of the statistical package SAS software.
RESULTS AND DISCUSSION
Estimation of total anthocyanin andcarotenoid content of ray florets
The data presented in Table 1 showed that therewere significant differences at 5% level amongthe genotypes for anthocyanin content studied.Among the chrysanthemum genotypes studied,the total anthocyanin content ranged from 8.11mg/100g (Pink Star) to 212.15 mg/100g (RedGold) mg/100g based on fresh weight of rayflorets. Red Gold showed highest totalanthocyanin (212.15 mg/100g) followed byLalpari (112.52 mg/100g), Red Stone (95.27 mg/

48
Shisa Ullas P., Namita, Kanwar Pal Singh and Sapna Panwar
100g), Red Spoon (86.33 mg/100g) and Jaya(69.19 mg/100g), respectively. However, lowesttotal anthocyanin was obtained by from PinkStar (8.11 mg/100g) followed by Pink Cloud(10.13 mg/100g) and Ajay (26.06 mg/100g) infresh weight of ray florets (Table 1). Our thestudies undertaken are in line with the researchwork of Gantait et al. (2010) who observedsimilar trend of total anthocyanin content indifferent genotypes of chrysanthemum.However, total anthocyanin content in ourgenotypes under studies showed a remarkabledeviation with earlier research work from their
studies. Kishimoto et al. (2007) also reportedthe anthocyanin content in different genotypesof chrysanthemum morifolium and DarkDramatic variety showed an anthocyanin contentof 72.9 mg/100g of fresh ray florets.
The data presented in Table 2 showed that therewere significant differences at 5% level amongthe genotypes for carotenoid content studied.Among the chrysanthemum genotypes studied,the total carotenoid content ranged from 1.06mg/100g (Ram Lal Dada) to 32.82 mg/100g(Jubilee) mg/100 g on fresh weight of ray florets.
Table 1: Screening of 25 chrysanthemum genotypes for total anthocyanin content.
Sl. No. Genotype Colour Total anthocyanincontent (mg/100g)
1. Ajay Pink 12.292. Pusa Anmol Dark Pink 18.343. Red Gold Dark Red 212.154. Tata Century Dark Pink 48.985. Lalpari Red 112.526. Red Stone Red 42.557. Neelima Dark Pink 95.278. Kanchil Dark pink 36.379. Sadbhavana Red 64.6810. Taichen Pink Pink 59.1211. Pusa Kesari Light Red 45.5712. Taichen Queen Light Red 53.2713. Pink Star Pink 8.1114. Atom Joya Red 34.2815. Corcon Small Red 23.6216. Little Pink Pink 20.1717. Karnal Pink Pink 26.8118. Pink Cloud Light Pink 10.1319. Red Spoon Dark Red 86.3320. Pusa Chitraksha Red 61.4521. Syamal Dark Pink 43.6822. Jaya Red 69.1923. Garden Beauty Red 27.7524. Daitymed Dark Pink 31.1325. Ravi Kiran Red 14.63SE±m 0.01LSD at 5% 0.18

49
Cluster analysis of chrysanthemum (Chrysanthemum × morifolium Ramat.)
Jubilee showed highest total carotenoid (32.82mg/100 g fresh weight of ray florets) followedby Haldighati (26.71 mg/100 g fresh weight ofpetals), Little Orange (22.25 mg/100 g freshweight of ray florets), Lilliput (20.77 mg/100 gfresh weight of ray florets), Star Yellow (19.21)in fresh ray florets. However, lowest totalcarotenoid was observed in Ram Lal Dada,Gheetanjali and Kundan (1.06, 1.94, 2.19 mg/100 g) fresh weight of petals, respectively (Table2). Similar to our studies findings were observedby, Tinoi et al. (2006) who determined thehighest amount of total carotenoids in the family
compositae. Sausserde and Kanpuss (2014) alsoreported the carotenoids content in calendulawhich ranged from 200 mg/100 g to 3510 mg/100g.
Cluster analysis of chrysanthemum genotypesbased on total anthocyanin content
Twenty five red coloured genotypes weregrouped into two major clusters based on theanthocyanin content using average-linkagemethod of cluster analysis (Figure 1; Table 3).The cluster I composed of only one cultivar RedGold, which is was highest in anthocyanin.
Table 2: Screening of 25 chrysanthemum genotypes for total carotenoid content.
Sl. No. Genotype Colour Total carotenoid content(mg/100g)
1. Classic Orange 9.672. Gheetanjali Yellow 1.943. Haldighati Dark Orange 22.254. Mayur-5 Light Yellow 4.45. Punjab Anmol Yellow 2.456. Aparajita Yellow 5.457. Sadwin Yellow Yellow 10.268. Yellow Gold Yellow 7.709. Vijay Kiran Dark Yellow 6.7910. Ajay Orange Orange 6.4611. Pusa Aaditya Dark Yellow 12.6612. Mallika Yellow Yellow 3.2313. Ram Lal Dada Yellow 1.0614. Yellow Reflex Yellow 8.1615. Star Yellow Yellow 26.7116. Pusa Sona Yellow 6.0517. Jubilee Dark Orange 32.8218. Jayanti Yellow 5.8119. Basanti Yellow 4.7220. Pusa Centenary Yellow 14.8421. Little Orange Orange 20.7722. Liliput Yellow 19.2123. Teri Yellow 3.5124. Kundan Yellow 2.1925. Texas Gold Yellow 2.05SE±m 0.01LSD at 5% 0.56

50
Shisa Ullas P., Namita, Kanwar Pal Singh and Sapna Panwar
Table 3: Grouping of chrysanthemum genotypes into different clusters on the basis of total anthocyanin content
Cluster Sub- Sub-sub Genotype No. of Name of genotypecluster cluster code genotypes
I 3 1 Red Gold
II II A 5,7,19 3 Lalpari, Neelima, Red Spoon
II B II Ba 4,6,11,8,14,21, 11 Tata Century, Red Stone, Pusa Kesari, Kanchil,9,10,12,20,22 Atom Joya, Syamal, Sadhbhavana, Taichen
Pink, Taichen Queen, Pusa Chitraksha, Jaya
II Bb 1,2,13,18,25,15, 10 Ajay, Pusa Anmol, Pink Star, Pink Cloud, Ravi16,17,23,24 Kiran, Corcon Small, Little Pink, Karnal Pink,
Garden Beauty, Daitymed
Fig. 1: Cluster analysis of 25 chrysanthemum genotypes on the basis of totalanthocyanin content using average linkage method
Cluster II was further divided into two sub-clusters IIA and IIB. Cluster IIA contained threecultivars namely Lalpari, Neelima and RedSpoon. Cluster II B is again sub-clustered into
two sub-sub-clusters i.e. IIBa and IIBb. Sub-cluster IIBa comprised of 11 cultivars viz., TataCentury, Red Stone, Pusa Kesari, Kanchil, AtomJoya, Syamal, Sadhbhavana, Taichen Pink,

51
Cluster analysis of chrysanthemum (Chrysanthemum × morifolium Ramat.)
Fig. 2: Cluster analysis of 25 chrysanthemum genotypes on the basis of totalcarotenoid content using average linkage method
Taichen Queen, Pusa Chitraksha and Jaya.Cluster IIA and IIB (IIBa) contained othervarieties which are high in anthocyan in contentnext to Red Gold. Sub-cluster IIBb consists of10 cultivars namely Ajay, Pusa Anmol, PinkStar, Pink Cloud, Ravi Kiran, Corcon Small,Little Pink, Karnal Pink, Garden Beauty andDaitymed.Cluster IIB (IIBb) had varieties withless anthocyanin content.
Cluster analysis of chrysanthemum genotypesbased on total carotenoid content
Cluster analysis using the average-linkagemethod, grouped 25 yellow to orange colouredchrysanthemum genotypes into two mainclusters based on the total carotenoid content(Figure 2; Table 4). The cluster I composed of
eight cultivars and sub-clustered in to IA andIB. Cluster IA consists of four cultivars namelyMayur-5, Punjab Anmol, Mallika Yellow andKundan. Cluster IB comprised of four cultivarsviz., Gheetanjali, Ram Lal Dada, Basanti andTexas Gold. Cluster II divided into two sub-clusters IIA and IIB. IIA is again sub-clusteredin to IIAa and IIAb and IIB in to IIBa and IIBb.Cluster IIA (IIAa and IIAb) consists of fivecultivars namely Star Yellow, Jubilee,Haldighati, Liliput and Little Orange which arehighest in carotenoid content. Flowers of thesegenotypes had a deep yellow to orange colour.Cluster IIA represents genotypes of highcarotenoid content. Cluster IIB (IIBa and IIBb)consisted of 12 cultivars containing lesscarotenoid namely Aparijita, Yellow Gold, Pusa

52
Shisa Ullas P., Namita, Kanwar Pal Singh and Sapna Panwar
Table 4: Grouping of chrysanthemum genotypes into different clusters on the basis of total carotenoid content
Cluster Sub- Sub-sub Genotype No. of Name of genotypecluster cluster Code genotypes
I I A 4,5,12,24 4 Mayur-5, Punjab Anmol, Mallika Yellow,Kundan
I B 2,13,19,25 4 Gheetanjali, Ram Lal Dada, Basanti,Texas Gold
II II A II Aa 15,17 2 Star Yellow, Jubilee
II Ab 3,22,21 3 Haldighati, Liliput, Little Orange
II B II Ba 6,8,16,20,7 5 Aparajita, Yellow Gold, Pusa Sona, PusaCentenary, Sadwin Yellow
II Bb 1,11,8,14,9,10,23 7 Classic, Pusa Aditya, Yellow Gold, YellowReflex, Vijay Kiran, Ajay Orange, Teri
Sona, Pusa Centenary, Sadwin Yellow, Classic,Pusa Aditya, Yellow Gold, Yellow Reflex, VijayKiran, Ajay Orange and Teri. Cluster IA, IB andcluster IIB consists genotypes of less carotenoidcontent.
Bhattarai et al. (2016) also studied the geneticdiversity of tomato based on its horticulturaltraits using average-linkage method and analysisproduced six distinct clusters. Similar studieson cluster analysis using average-linkagemethod were also done by Shankar et al. (2009)for the diversity analysis in momordicacharantia. Similar studies of cluster analysiswere done in R. damascena by Karami et al.(2012) based on 24 oil components whichrevealed five clusters.
The presence of high level of diversity foranthocyanin and carotenoid content among thesegenotypes under study grouped into divergentclusters indicated their suitability for the use inbreeding strategies for flower colour andpigments.
REFERENCES
Bhattarai, K., Louws, F., Williamson, J. and Panthee,D. 2016. Diversity analysis of tomato genotypesbased on morphological traits with commercial
breeding significance for fresh market productionin eastern USA. Australian Journal of CropScience, 10(8): 1098-1103.
Gantait, S.S. and Pal, P. 2010. Anthocyanin content ofspray Chrysanthemum cultivars under polyhouseand open field conditions. Indian Journal of NaturalProduct Resource, 1: 236-242.
Karami, A., Zandi, P., Khosh-Khui, M., Salehi, H. andSaharkhiz, J. 2012. Analysis of essential oil fromnine distinct genotypes of Iranian Damask rose(Rosa damascena Mill). Journal of Medicinal PlantsResearch, 6(42): 5495-5498.
Kishimoto, S., Sumitomo, K., Yagi, M., Nakayama, M.and Ohmiya, A. 2007. Three routes to orange petalcolorvia carotenoid components in 9 CompositaeSpecies. Journal of Japan Society of HorticultureSciences, 76(3): 250-257.
Ogata, J., Kanno, Y., Itoh, Y., Tsugava, H. and Suzuki,M. 2005. Plant biochemistry, anthocyaninbiosynthesis in roses. Nature, 435: 757-758.
Ranganna, S. 1995. Handbook of analysis and qualitycontrol for fruit and vegetable products. 2. NewDelhi: Tata McGraw-Hill Publishing CompanyLimited; pp. 977-979.
Rincon, F.B., Jhonson, J. and Tabba, S. 1996. Clusteranalysis, an approach to sampling variability inmaize accessions. Maydica, 41: 307-316.
Sausserde, R and Kampuss, K. 2014. Composition ofcarotenoids in calendula (Calendula officinalis L.)flowers. Review Footbalt, 13-18.
Shankar, R., Govindrao, B. And Annappa, T. 2009.Diversity analysis of bitter gourd (Momordicacharantia L.) germplasm from tribal belts of India.

53
Cluster analysis of chrysanthemum (Chrysanthemum × morifolium Ramat.)
The Asian and Australian Journal of Plant Scienceand Biotechnology, 3(1):21-25.
Shrestha, J. 2016. Cluster Analysis of Maize InbredLines. Journal of Nepal Agricultural ResearchCouncil, 2: 33-36.
Tinoi, J., Rakariyatham, N. and Deming, R.L. 2006.Determination of major carotenoid constituents in
petal extracts of eight selected flowering plants inthe North of Thailand. Chiang Mai Journal ofScience, 33(2): 327-334.
Wrolstad, R.E., Durst, R.W. and Lee, J. 2005. Trackingcolour and pigment changes in anthocyaninproducts. Trends in Food and Science Technology,16: 423-428.

54
Pratibha Chauhan, S.R. Dhiman, Bharti Kashyap, Y.C. Gupta, R.K. Gupta and R.K. DograJournal of Ornamental Horticulture. 20 (1&2): 54-60, 2017
Evaluation and variability studies in carnation genotypesPRATIBHA CHAUHAN, S.R. DHIMAN, Y.C. GUPTA, BHARTI KASHYAP,
R.K. GUPTA and R.K. DOGRA
Department of Floriculture and Landscape ArchitectureDr. Y. S. Parmar University of Horticulture and Forestry
Nauni, Solan-173230, Himachal PradeshE-mail: [email protected]
ABSTRACT
An experiment was carried out to study the genetic variability, heritability, genetic advance andgenetic gain among fifty carnation (Dianthus caryophyllus L.) genotypes. The widest range ofvariation was recorded by plant height (68.15 to 99.85 cm), followed by stem length (46.38 to67.07 cm), number of days to bud formation (131.92 to 148.00), number of days to first flowering(156.54 to 174.20), flower size (5.81 to 7.78 cm), duration of flowering (11.84 to 15.71 days) andvase life (8.84 to 11.79 days). Whereas, narrowest range was observed for number of flowerstems per plant (4.76 to 7.72). The magnitude of phenotypic coefficient of variation (PCV) washigher than genotypic coefficient of variation (GCV) for all the characters studied, indicating highdegree of environment influence. A moderate value of PCV along with GCV was observed forplant height, number of flowers per plant and stem length. High values for heritability was recordedfor plant height followed by stem length and flower size. High heritability associated with highvalues of genetic advance was observed in characters like plant height and stem length. Theselection on the basis of plant height, stem length, flower yield and vase life will be more effectivefor further breeding programme.
Keywords: Carnation, coefficient of variation, variability, heritability, genetic advance
INTRODUCTION
Carnation (Dianthus caryophyllus L.) belongingto the family Caryophyllaceae is one of the mostimportant commercial cut flowers in the globalflorist trade and ranks within the top ten cutflowers of the world. The performance ofcarnation genotypes varies with region, seasonand growing environment. Carnation is beingcommercially grown in Solan, Shimla, Mandi,Kullu, Chamba and Bilaspur districts ofHimachal Pradesh. Considering the importanceand popularity of cultivating this crop, there isprime need for improvement and to developvarieties suitable for cultivation under Indian
conditions. Testing of the available varieties forsuitability and adaptability with respect toflowering, flower quality, and yield parametersare of prime importance. Due to diverse eco-geographical regions and varied climaticconditions in India, the occurrence of genotype-environmental interaction has long provided amajor challenge for obtaining completeunderstanding of the genetic control ofvariability. The existence of genetic variabilityin any crop is a pre-requisite for an effectivebreeding programme, therefore, the magnitudeof variability present in the gene pool of crop isof utmost importance to a breeder for planninga systematic breeding programme.

55
Variability studies in carnation
For a sound breeding programme, criticalassessment of the nature and the extent ofgenetic variability available in the germplasm,heritability and genetic advance of the importantcharacters in a crop are essential. Thus, thepresent study was conducted to study the relativeperformance of 50 genotypes of carnation fortheir vegetative growth and floral parametersunder mid hill conditions of Himachal Pradeshto assess the extent of variability, heritability,genetic advance and genetic gain for differenttraits.
MATERIALS AND METHODS
The investigations were carried out to studythe performance of carnation (Dianthuscaryophyllus L.) genotypes under naturallyventilated polyhouse at the experimental farmof Department of Floriculture and LandscapeArchitecture, Dr. Yashwant Singh ParmarUniversity of Horticulture and Forestry, Nauni,Solan, Himachal Pradesh during 2012-13 and2013-14. The experimental farm is located 1,276m above mean sea level at the latitude of 32°51202 2 N and longitude of 77°112 302 2 E. Theexperiment included 50 standard carnationgenotypes evaluated for their yield and qualityattributes. The experiment was laid out inrandomized block design (RBD) replicatedthrice. The rooted cuttings were planted on theraised beds of 1 m width with spacing of 20 ×15 cm. Uniform package of practices wasfollowed throughout the cropping season togrow a successful crop. The data were collectedon vegetative and flowering parameters for thethree flushes.
The data were recorded for flower yieldattributes like plant height (cm), stem length(cm), number of days for bud formation, numberof days for first flowering and flower qualityattributes like flower diameter (cm), flower yield(number of cut stems per plant), duration of
flowering (days) and vase life (days) using thestandard method. The mean value of the dataobserved was taken to represent a particulargenotype with respect to character. Thegenotypic and phenotypic coefficients ofvariability were calculated as per formulae givenby Burton and De-Vane (1953). Heritability andgenetic advance was calculated by the formulaas suggested by Allard (1960). Genetic gainexpressed as per cent ratio of genetic advanceand population mean was calculated by themethod given by Johanson et al. (1955).
RESULTS AND DISCUSSION
Evaluation for quality traits
The perusal of data presented in the Table 1revealed the significant differences among thedifferent genotypes for plant height. GenotypeSnow Storm recorded the maximum plant height(99.85 cm) followed by cultivar Don Pedro(96.34 cm) whereas minimum plant height(68.15 cm) was recorded in genotype EC-5. Thevariation in plant height among variousgenotypes of carnation might be attributed todifferent genetic make up of the plants and thevarietal characters. Similar observations havebeen reported by Gharge et al. (2011), andRoychowdhury and Tah (2011) while workingwith various carnation cultivars.
Stem length is a very important character forthe standard carnation cultivars. It is one of thecharacters which decide the quality of cutflowers. Significantly higher cut flower stemlength (67.07 cm) was recorded in genotypeSnow Storm followed by genotypes Hermes(64.36 cm) and EC-4 (64.27 cm). The differencein stem length among the different cultivars maybe attributed to the inherent genetic charactersassociated with the genotypes and also due tothe growing environmental conditions asreported by Tarannum and Naik (2014).
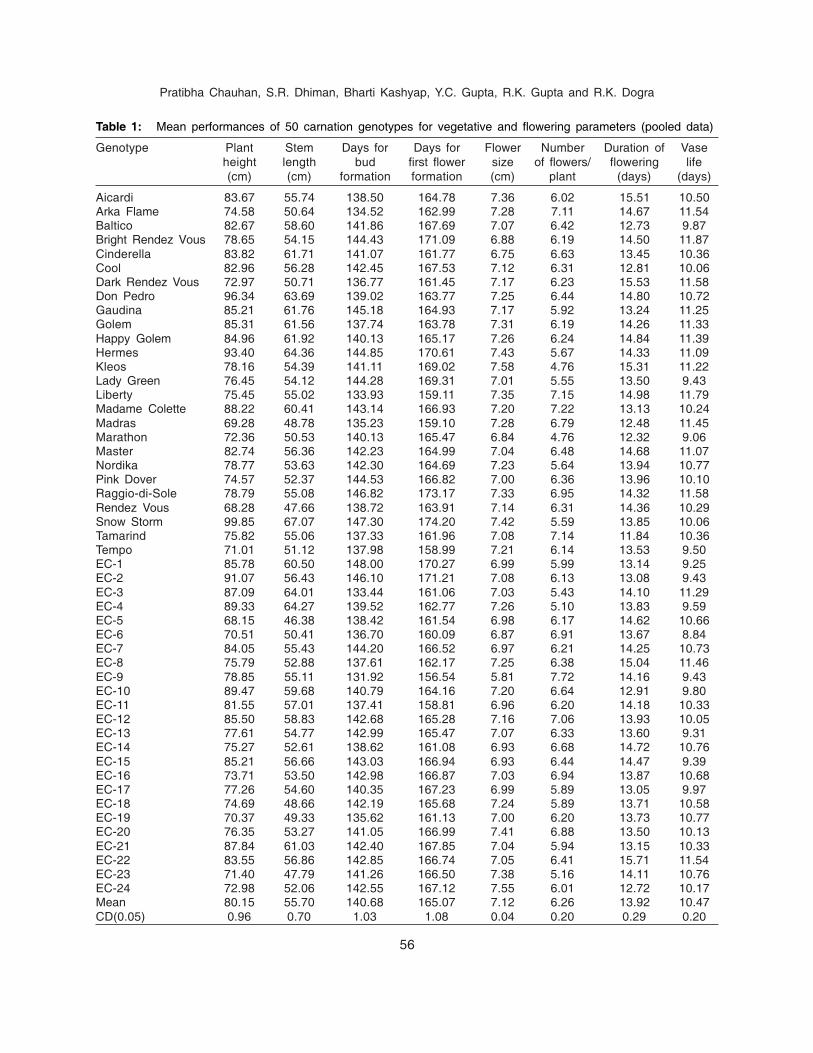
56
Pratibha Chauhan, S.R. Dhiman, Bharti Kashyap, Y.C. Gupta, R.K. Gupta and R.K. Dogra
Table 1: Mean performances of 50 carnation genotypes for vegetative and flowering parameters (pooled data)
Genotype Plant Stem Days for Days for Flower Number Duration of Vaseheight length bud first flower size of flowers/ flowering life(cm) (cm) formation formation (cm) plant (days) (days)
Aicardi 83.67 55.74 138.50 164.78 7.36 6.02 15.51 10.50Arka Flame 74.58 50.64 134.52 162.99 7.28 7.11 14.67 11.54Baltico 82.67 58.60 141.86 167.69 7.07 6.42 12.73 9.87Bright Rendez Vous 78.65 54.15 144.43 171.09 6.88 6.19 14.50 11.87Cinderella 83.82 61.71 141.07 161.77 6.75 6.63 13.45 10.36Cool 82.96 56.28 142.45 167.53 7.12 6.31 12.81 10.06Dark Rendez Vous 72.97 50.71 136.77 161.45 7.17 6.23 15.53 11.58Don Pedro 96.34 63.69 139.02 163.77 7.25 6.44 14.80 10.72Gaudina 85.21 61.76 145.18 164.93 7.17 5.92 13.24 11.25Golem 85.31 61.56 137.74 163.78 7.31 6.19 14.26 11.33Happy Golem 84.96 61.92 140.13 165.17 7.26 6.24 14.84 11.39Hermes 93.40 64.36 144.85 170.61 7.43 5.67 14.33 11.09Kleos 78.16 54.39 141.11 169.02 7.58 4.76 15.31 11.22Lady Green 76.45 54.12 144.28 169.31 7.01 5.55 13.50 9.43Liberty 75.45 55.02 133.93 159.11 7.35 7.15 14.98 11.79Madame Colette 88.22 60.41 143.14 166.93 7.20 7.22 13.13 10.24Madras 69.28 48.78 135.23 159.10 7.28 6.79 12.48 11.45Marathon 72.36 50.53 140.13 165.47 6.84 4.76 12.32 9.06Master 82.74 56.36 142.23 164.99 7.04 6.48 14.68 11.07Nordika 78.77 53.63 142.30 164.69 7.23 5.64 13.94 10.77Pink Dover 74.57 52.37 144.53 166.82 7.00 6.36 13.96 10.10Raggio-di-Sole 78.79 55.08 146.82 173.17 7.33 6.95 14.32 11.58Rendez Vous 68.28 47.66 138.72 163.91 7.14 6.31 14.36 10.29Snow Storm 99.85 67.07 147.30 174.20 7.42 5.59 13.85 10.06Tamarind 75.82 55.06 137.33 161.96 7.08 7.14 11.84 10.36Tempo 71.01 51.12 137.98 158.99 7.21 6.14 13.53 9.50EC-1 85.78 60.50 148.00 170.27 6.99 5.99 13.14 9.25EC-2 91.07 56.43 146.10 171.21 7.08 6.13 13.08 9.43EC-3 87.09 64.01 133.44 161.06 7.03 5.43 14.10 11.29EC-4 89.33 64.27 139.52 162.77 7.26 5.10 13.83 9.59EC-5 68.15 46.38 138.42 161.54 6.98 6.17 14.62 10.66EC-6 70.51 50.41 136.70 160.09 6.87 6.91 13.67 8.84EC-7 84.05 55.43 144.20 166.52 6.97 6.21 14.25 10.73EC-8 75.79 52.88 137.61 162.17 7.25 6.38 15.04 11.46EC-9 78.85 55.11 131.92 156.54 5.81 7.72 14.16 9.43EC-10 89.47 59.68 140.79 164.16 7.20 6.64 12.91 9.80EC-11 81.55 57.01 137.41 158.81 6.96 6.20 14.18 10.33EC-12 85.50 58.83 142.68 165.28 7.16 7.06 13.93 10.05EC-13 77.61 54.77 142.99 165.47 7.07 6.33 13.60 9.31EC-14 75.27 52.61 138.62 161.08 6.93 6.68 14.72 10.76EC-15 85.21 56.66 143.03 166.94 6.93 6.44 14.47 9.39EC-16 73.71 53.50 142.98 166.87 7.03 6.94 13.87 10.68EC-17 77.26 54.60 140.35 167.23 6.99 5.89 13.05 9.97EC-18 74.69 48.66 142.19 165.68 7.24 5.89 13.71 10.58EC-19 70.37 49.33 135.62 161.13 7.00 6.20 13.73 10.77EC-20 76.35 53.27 141.05 166.99 7.41 6.88 13.50 10.13EC-21 87.84 61.03 142.40 167.85 7.04 5.94 13.15 10.33EC-22 83.55 56.86 142.85 166.74 7.05 6.41 15.71 11.54EC-23 71.40 47.79 141.26 166.50 7.38 5.16 14.11 10.76EC-24 72.98 52.06 142.55 167.12 7.55 6.01 12.72 10.17Mean 80.15 55.70 140.68 165.07 7.12 6.26 13.92 10.47CD(0.05) 0.96 0.70 1.03 1.08 0.04 0.20 0.29 0.20
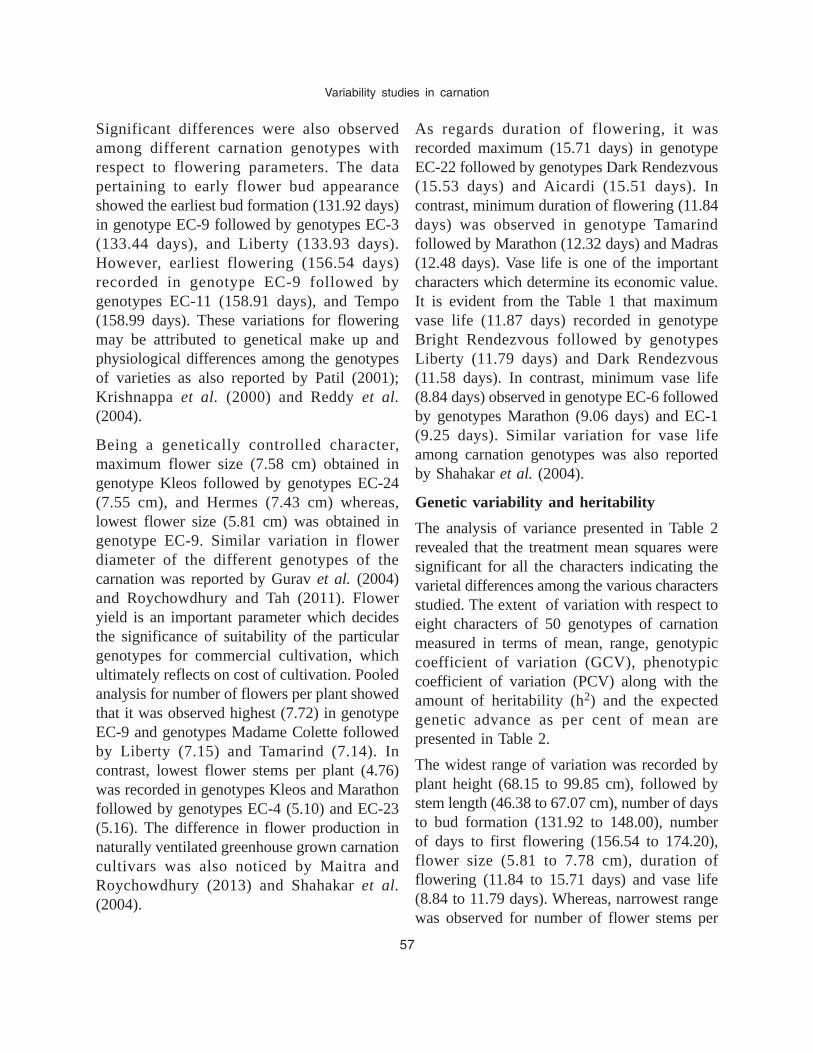
57
Variability studies in carnation
Significant differences were also observedamong different carnation genotypes withrespect to flowering parameters. The datapertaining to early flower bud appearanceshowed the earliest bud formation (131.92 days)in genotype EC-9 followed by genotypes EC-3(133.44 days), and Liberty (133.93 days).However, earliest flowering (156.54 days)recorded in genotype EC-9 followed bygenotypes EC-11 (158.91 days), and Tempo(158.99 days). These variations for floweringmay be attributed to genetical make up andphysiological differences among the genotypesof varieties as also reported by Patil (2001);Krishnappa et al. (2000) and Reddy et al.(2004).
Being a genetically controlled character,maximum flower size (7.58 cm) obtained ingenotype Kleos followed by genotypes EC-24(7.55 cm), and Hermes (7.43 cm) whereas,lowest flower size (5.81 cm) was obtained ingenotype EC-9. Similar variation in flowerdiameter of the different genotypes of thecarnation was reported by Gurav et al. (2004)and Roychowdhury and Tah (2011). Floweryield is an important parameter which decidesthe significance of suitability of the particulargenotypes for commercial cultivation, whichultimately reflects on cost of cultivation. Pooledanalysis for number of flowers per plant showedthat it was observed highest (7.72) in genotypeEC-9 and genotypes Madame Colette followedby Liberty (7.15) and Tamarind (7.14). Incontrast, lowest flower stems per plant (4.76)was recorded in genotypes Kleos and Marathonfollowed by genotypes EC-4 (5.10) and EC-23(5.16). The difference in flower production innaturally ventilated greenhouse grown carnationcultivars was also noticed by Maitra andRoychowdhury (2013) and Shahakar et al.(2004).
As regards duration of flowering, it wasrecorded maximum (15.71 days) in genotypeEC-22 followed by genotypes Dark Rendezvous(15.53 days) and Aicardi (15.51 days). Incontrast, minimum duration of flowering (11.84days) was observed in genotype Tamarindfollowed by Marathon (12.32 days) and Madras(12.48 days). Vase life is one of the importantcharacters which determine its economic value.It is evident from the Table 1 that maximumvase life (11.87 days) recorded in genotypeBright Rendezvous followed by genotypesLiberty (11.79 days) and Dark Rendezvous(11.58 days). In contrast, minimum vase life(8.84 days) observed in genotype EC-6 followedby genotypes Marathon (9.06 days) and EC-1(9.25 days). Similar variation for vase lifeamong carnation genotypes was also reportedby Shahakar et al. (2004).
Genetic variability and heritability
The analysis of variance presented in Table 2revealed that the treatment mean squares weresignificant for all the characters indicating thevarietal differences among the various charactersstudied. The extent of variation with respect toeight characters of 50 genotypes of carnationmeasured in terms of mean, range, genotypiccoefficient of variation (GCV), phenotypiccoefficient of variation (PCV) along with theamount of heritability (h2) and the expectedgenetic advance as per cent of mean arepresented in Table 2.
The widest range of variation was recorded byplant height (68.15 to 99.85 cm), followed bystem length (46.38 to 67.07 cm), number of daysto bud formation (131.92 to 148.00), numberof days to first flowering (156.54 to 174.20),flower size (5.81 to 7.78 cm), duration offlowering (11.84 to 15.71 days) and vase life(8.84 to 11.79 days). Whereas, narrowest rangewas observed for number of flower stems per

58
Pratibha Chauhan, S.R. Dhiman, Bharti Kashyap, Y.C. Gupta, R.K. Gupta and R.K. Dogra
plant (4.76 to 7.72).
The perusal of data present in Table 2 clearlyshowed that the estimates of phenotypiccoefficient of variation (PCV) were higher thangenotypic coefficient of variation (GCV) for allthe characters under consideration whichindicated the high degree of environmentalinfluence in the expression of genotype. Similarresults were reported by Misra and Gupta (2003)in carnation. Nazir et al. (2004) and Pratap andRao (2006) also reported higher PCV than GCVfor most of the characters in gladiolus. Pooledanalysis over all the three flushes revealedmoderate values for PCV for number of flowerper plant (20.50), plant height (16.64) and stemlength (16.12). Low values were recorded forcharacters like number of days for first flowering(4.69), days for bud formation (5.28), flowersize (6.83), duration of flowering (13.08) andvase life (14.76). The GCV was recordedmoderate for plant height (15.79), number offlowers per plant (15.21) and stem length(15.16), whereas, it was recorded low forcharacters like number of days for first flowering(3.69), days for bud formation (4.19), flowersize (6.23), duration of flowering (9.49) and vaselife (12.22).
Narrow difference between PCV and GCV wasnoticed for flower size, plant height, stem length,
days for first flowering and days for budformation revealed greater stability of thecharacter against environmental fluctuationwhich indicated that the phenotypic expressionof all the genotypes is under genetic control andenvironment has less influence on theirexpression (Balaram and Janakiram 2009). De(1992) also reported narrow difference betweenPCV and GCV for characters like plant height,days for flowering, floret length etc. in gladiolus,thereby, suggesting major contribution of geneticvariability towards the total variance. Themarked differences between PCV and GCVwere observed for number of flower stems perplant, duration of flowering and vase life,confirming the predominance of genotype ×environment interaction for these traits (Misraand Gupta, 2003).
The estimates of heritability in broad sense givea measure of transmission of characters fromone generation to another, thus giving an ideaof heritable portion of variability and enablingthe plant breeder in isolating the elite selectionin the crop. In the present study, heritabilityranged from 52.25% to 90.07%. Highheritability estimates were observed for plantheight (90.07%), stem length (88.42%) andflower size (84.23%) which indicates goodscope for the improvement of traits (Pratap and
Table 2: Estimates of mean, genotypic and phenotypic coefficient of variation, heritability, genetic advance andgenetic gain in 50 genotypes of carnation (pooled data).
Character Range GCV PCV Heritability Genetic Genetic(%) advance gain (%)
Plant height (cm) 68.15 - 99.85 15.79 16.64 90.07 24.74 30.87Stem length (cm) 46.38 - 67.07 15.16 16.12 88.42 16.35 29.36Days to bud formation 131.92 - 148.00 4.19 5.28 62.95 9.61 6.84Days to first flowering 156.54 - 174.20 3.69 4.69 62.01 9.88 5.99Number of flowers per plant 4.76 - 7.72 15.21 20.50 55.06 1.46 23.25Flower size (cm) 5.81 - 7.78 6.23 6.83 84.23 0.83 11.70Duration of flowering (days) 11.84 - 15.71 9.46 13.08 52.25 1.96 14.09Vase life (days) 8.84 - 11.79 12.22 14.76 68.56 2.18 20.84

59
Variability studies in carnation
Rao, 2006). High heritability estimates for thesetraits indicated less influence of environmentin their expression and more scope for theimprovement through direct selection. Highheritability estimates coupled with high geneticadvance could be helped in establishing closerelationship between genotypic and phenotypiccharacters. High heritability along with highgenetic advance was recorded for plant heightand stem length, whereas, high heritabilityassociated with low values of genetic advancewas observed in characters like flower size,number of flower per plant, vase life andduration of flowering which indicate the non-additive genetic control in these characters. Asimilar trend was reported by Kumar et al.(2015) in gladiolus and Sheikh and John (2005)in iris. Higher heritability with high geneticadvance exhibited by the above characterindicated additive gene effect suggesting thatselection in the desired directions based onphenotypic observations might be effective tobring about improvement in carnation.
A relative comparison of heritability estimatesand genetic gain (genetic advance as per centof mean) will give an idea of nature of geneaction governing a particular character. Highheritability estimates along with high geneticadvance as per cent of mean will be more usefulthan heritability alone to know the ultimateeffect of selection. In the present study, moderategenetic gain coupled with high variability wasobserved for the characters like plant height(30.87%) and stem length (29.36%), whereas,low for number of flowers per plant (23.25%)and vase life (20.84%), appeared to becontrolled by additive gene action and selectionfor such characters will be very effective (Panse,1957). Such variability assessment also studiedby Pratap and Rao, 2006, Kadam et al. 2014and Kumar, 2015, Senapati et al. 2013.
From the present study, it could be concludedthat genotypes such as Snow Storm, Hermes,Kleos, Bright Rendezvous, EC-9 and EC-24performed well under mid-hill conditions ofHimachal Pradesh. In addition, heritablevariability exists in the breeding materials forcharacters like plant height, stem length, numberof flowers per plant and vase life may beemphasized during selection for breedingprogrammes.
REFERENCES
Allard R.W. 1960. Principles of Plant Breeding. JohnWiley and Sons, New York. p. 485.
Balaram, M.V. and Janakiram, T. 2009. Geneticvariability in gladiolus genotypes for cormcharacters. Journal of Ornamental Horticulture,12(2): 123-126.
Burton, G.W. and De-Vane, E.H. 1953. Estimatingheritability in tall fescue (Festuca arundinacea)from replicated clonal material. Agronomy Journal,45: 478-481.
De, L.C. 1992. Variability studies in gladiolus. M.Sc.Thesis, ICAR–Indian Agricultural ResearchInstitute, New Delhi.
Gharge, C.P., Angadi, S.G., Basavaraj, N., Patil, A.A.,Biradar, M.S. and Mummigatti, U.V. 2011.Performance of standard carnation genotypesunder naturally, ventilated poly house. KarnatakaJournal of Agricultural Science, 24(4): 487-489.
Gurav, S.B., Nagare, P.K., Katwate, S.M., Sable, R.N.,Singh, B.R. and Dhane, A.V. 2004. Standardizationof package of practices for carnation under partiallymodified greenhouse conditions. Journal ofOrnamental Horticulture, 7(3-4): 221-225.
Johanson, H.W., Robinson, H.F. and Comstock, R.E.1955. Estimates of genetic and environmentalvariability in soybean. Agronomy Journal, 47: 314-318
Kadam, G.B., Kumar, G., Saha, T.N., Tiwari, A.K. andKumar, R. 2014. Varietal evaluation and geneticvariability studies on gladiolus. Indian Journal ofHorticulture, 71(3): 379-384.
Krishnappa, K.S., Shivreddy, N. and Anjanappa. 2000.Effect of floral preservatives on the vase life ofcarnation cut flower cultivars. Karnataka Journalof Agricultural Sciences, 13(2): 395-400.
Kumar, P.S., Kumar, R., Choudhary, V.K. and Kanwat,

60
Pratibha Chauhan, S.R. Dhiman, Bharti Kashyap, Y.C. Gupta, R.K. Gupta and R.K. Dogra
M. 2015. Genetic variability and characterassociation in gladiolus (Gladiolus hybrida). IndianJournal of Agricultural Sciences, 85(6): 845-849.
Kumar, R. 2015. Genetic variability and characterassociation among quantitative traits in gerbera.Indian Journal of Horticulture, 72(1): 88-91.
Maitra, S. and Roychowdhury, N. 2013. Performance ofdifferent standard carnation (Dianthus caryophyllusL.) cultivars in the plains of West Bengal, India.International Journal of Bioresource and StressManagement, 4(3): 395-359.
Misra, S. and Gupta, Y.C. 2003. Genetic variability incarnation. Journal of Ornamental Horticulture, 6(1):20-23.
Nazir, M., Dwivedi, V.K. and Bhat, K.L. 2004. Geneticvariability in gladiolus. Journal of OrnamentalHorticulture, 7(3-4): 75-80.
Panse, V.G. 1957. Genetics of quantitative charactersin relation to plant breeding. Indian Journal ofGenetics, 17: 318-328.
Patil, R.T. 2001. Evaluation of standard carnation(Dianthus caryophyllus L.) cultivars underprotected cultivation. M.Sc. (Agric.) Thesis,University of Agricultural Sciences, Dharwad,Karnataka.
Pratap, M. and Rao, A.M. 2006. Assessment andvariability studies in gladiolus. Journal ofOrnamental Horticulture, 9(2): 145-147.
Reddy, B.S., Patil, R.T., Jholgiker, P. and Kulkarni, B.S.2004. Studies on vegetative growth, flower yieldand quality of standard carnation (Dianthuscaryophyllus L.) under low cost polyhousecondition. Journal of Ornamental Horticulture, 7(3-4): 217-220.
Roychowdhury, R. and Tah, J. 2011. Evaluation of geneticparameters for agro-metrical characters incarnation genotypes. African Crop ScienceJournal, 19(3): 183-188.
Senapati, A.K., Prajapati, P. and Singh, A. 2013. Geneticvariability and heritability studies in gerbera(Gerbera jamesonii Bolus.). African Journal ofAgricultural Research, 8(44): 5090-5092.
Shahakar, A.W., Golliwar, V.J., Bhuyar, A.R., Dharmik,Y.B., Kadu, R.B. and Gondane, S.U. 2004. Growth,flowering quality and yield of carnation cultivarsunder polyhouse condition. Journal of Soils andCrops, 14(2): 305-307.
Sheikh, M.Q. and John, A.Q. 2005. Genetic variability iniris (Iris japonica Thumb.). Journal of OrnamentalHorticulture, 8(1): 75-76.
Tarannum, M.S. and Naik, B.H. 2014. Performance ofcarnation (Dianthus caryophyllus L.) genotypes forqualitative and quantitative parameters to assessgenetic variability among genotypes. AmericanInternational Journal of Research in Formal,Applied and Natural Sciences, 5(1): 96-101.

61
Assessment of integrated weed management practices in gladiolusJournal of Ornamental Horticulture. 20 (1&2): 61-68, 2017
Assessment of integrated weed management practices onweed flora, flowering, corm yield and net returns in
gladiolus cv. Pusa Srijana under Delhi conditionsKISHAN SWAROOP1, D.V.S. RAJU1, T.K. DAS2, V.K. SHARMA3 and SUNITA DHAKER1
1Division of Floriculture and Landscaping2Division of Agronomy
3Division of Soil Science and Agricultural ChemistryICAR-Indian Agricultural Research Institute, New Delhi-110012
E-mail: [email protected]
ABSTRACT
Field experiments were conducted for two years (2014-15 and 2015-16) during winter season, atthe Research Farm of the Division of Floriculture and Landscaping, Indian Agricultural ResearchInstitute, New Delhi to study the weed flora, plant growth and corm yield and net returns ofgladiolus cv. Pusa Srijana as influenced by integrated weed management practices. All the weedcidetreatments resulted in lower weed density, number of monocot as well as dicot weeds and twoyear's study indicated that treatment atrazine @ .75 kg/ha pre-emergence + carfentrazone @ 0.03kg/ha post-mergence at 40 DAS (T3) recorded minimum number of dicot weeds (9.83) and wasthe best herbicide, whereas, minimum monocot weeds were recorded under the treatment ofpendimethalin 1.0 kg/ha pre-emergence + dry grass residue 5.0 tonnes/ha (T7) followed bypendimethalin 0.75 kg/ha + metribuzin 0.3 kg/ha (tank-mix) pre-emergence (T9) which recorded(3.99) number of monocot weeds/m2. The plant height, spike length, number of corms/ha andestimated net returns was received maximum with treatment i.e. pendimethalin 0.75 kg/ha +metribuzin 0.3 kg/ha (tank-mix) pre-emergence (T9). The marketable spikes were receivedmaximum with the application of metribuzin 0.4 kg/ha pre-emergence + dry grass residue 5.0tonnes/ha (T5), whereas, it was minimum under control (T11). Thus, it is concluded that herbicidechemicals combined with IWM practices together are more effective than alone. The number ofcorms per hectare (1.20 lakh/ha) and net return (Rs. 2.63 lakh/ha) was recorded under treatmentT9 i.e. application of pendimethalin 0.75 kg/ha + metribuzin 0.30 kg/ha (tank-mix) followed bytreatment T10 i.e. weed free check (four hand weeding) which produced 1.19 lakh/ha corms andnet return of 2.61 lakh/ha; besides obtaining broad spectrum weed control throughout the cropgrowth period.
Keywords: Gladiolus, flower and corms traits, IWM practices, pre and post emergence herbicides.
INTRODUCTION
Gladiolus (Gladiolus hybridus Hort.) is one ofthe most important ornamental for cut flowertrade in India and abroad. It is also ideal forgarden display, floral arrangements for table and
interior decoration as well as making highquality bouquet (Lepcha et al. 2007). It ispopular for its attractive spikes having floretsof huge form, dazzling colours varying sizes andlong keeping quality. Gladiolus as cut flower is

62
Kishan Swaroop, D.V.S. Raju, T.K. Das, V.K. Sharma and Sunita Dhaker
increasing day by day in domestic as well asinternational markets. In recent years, severalnew cultivars of gladiolus with wide range ofcolours have been developed for marketing.Weed competition is one of the major bioticconstraints in realizing higher productivity andsixty weed species belonging to 24 angiospermfamilies have been found growing in the fieldsof gladiolus (Riaz et al. 2009). Control of weedsis important to reduce the weed competition aswell as to maximize the efficient utilization ofresources to raise the productivity of the crop,because emergence and rapid growth of weedleads to severe weed-crop competition for light,moisture, space and nutrients, at the same time,its yield is reduced up to 50-100 percent (Mehtaet al. 2010 and Rao et al. 2007). Weed is animportant factor responsible for loss in cropproduction (Meena et al. 2013). Pre-emergenceherbicides may be viable option to control theweeds right from the sowing to harvesting ofany crop (Sankar and Subramaniam, 2011).Herbicides are considered to be an economicalalternative to manage weeds against age oldpractice of hand weeding, which is more costlyand also becomes impracticable due to nonavailability of labourers during peak period ofweeding and it makes gladiolus production lessremunerative. Precise information on weedmanagement in gladiolus is essential andinevitable for getting growth of plants.Therefore, the present experiments wereundertaken to evaluate the comparativeperformance of integrated weed managementpractices alone and in combination on growth,flowering, yield and weed control of gladioluscv. Pusa Srijana.
MATERIALS AND METHODS
Field experiments were conducted for twoyears (2014-15 & 2015-16) during winter seasonat the Research Farm of the Division of
Floriculture and Landscaping, IndianAgricultural Research Institute, New Delhi. Thesoil was sandy clay loam with pH 7.0-7.5. Itwas moderately fertile, being low in availableorganic carbon (0.48%), available N (138.00 kg/ha), P (30.50 kg/ha) and K (187.90 kg/ha).During the first year, the experiment was plantedon 29th October, 2014 and during second yearon 30th October, 2015 which laid out inrandomized complete block design with eleventreatments and replicated three times. Row torow distance 50 cm and plant to plant 20 cmwas maintained in a plot size of 2.5 m × 2.0 m.The weed control treatments imposed are: T1,Atrazine 1.0 kg/ha pre-emergence, T2, Atrazine0.75 kg/ha pre-emergence + Metsulfuron-methyl@ 0.005kg/ha post-emergence at 40 DAS, T3,Atrazine 0.75 kg/ha pre-emergence +Carfentrazone @ 0.03kg/ha post-emergence at40 DAS, T4, Atrazine 0.75 kg/ha pre-emergence+ dry grass residue (5 tonnes/ha), T5,Metribuzin 0.4 kg/ha pre emergence + dry grassresidue (5 tonnes/ha), T6, Metribuzin 0.4 kg/ha pre-emergence + Metsulfuron-methyl @0.005 kg/ha post-emergence at 40 DAS, T7,Pendimethalin 1.0 kg/ha pre-emergence + drygrass residue (5 tonnes/ha), T8, Pendimethalin0.75 kg/ha pre- emergence + Carfentrazone @0.030kg/ha post-emergence at 40 DAS, T9,Pendimethalin 0.75 kg/ha pre-emergence +Metribuzin @ 0.30kg/ha (tank-mix) pre-emegence, T10,Weed-free check (four handweeding) and T11, Weedy check (control). Handweeding and weedy check treatments were keptfor comparison with weedicides treatments. Auniform dose of 120 kg N, 80 kg P2O5, and 80kg K2O/ha was applied. Half dose of N andwhole of P and K were applied as basal beforeplanting. Remaining half dose of N was top-dressed at 45 days after planting. Thesefertilizers were applied in the form of urea,single super phosphate and muriate of potash.

63
Assessment of integrated weed management practices in gladiolus
Uniform size of gladiolus corms (4.0 - 5.0 cm),cv. Pusa Srijana were planted. The pre-emergence (just after planting) herbicides wereapplied with the help of a hand operatedknapsack sprayer fitted with flat-fan nozzle. Thedata for weed density, weed counting werecollected at 40 and 90 days after planting, whileother growth, flowering, yield and cormsattributes were collected at their appropriatetime. Weed observations were recorded fromone place in each plot using 50 cm × 50 cmquadrate. Weeds were pulled out, washed withtap water, counted and weighed for fresh weightand then sun-dried and again weighed. Thecollected data were analyzed using the analysisof variance (ANOVA) technique outline byGomez and Gomez (1994) and treatments werecompared by using tabulated 'F' value at 5%level of significance.
RESULTS AND DISCUSSION
The dominant weed species present in theexperimental field were dicot and monocotsuch as Convolvulus arvensis, Coronopusdidymus, Parthenium hystophorus, Chenopo-dium murale, Trianthema portulaca, Cyperusrotundus and Cynodon dactylon, respectively.Mean of two years data presented in Table 1indicate that all integrated weed managementpractices including pre- and post emergenceherbicidal treatments resulted in significantlylower density of monocot and dicot weeds ascompared to weedy check. The treatment, T7(Pendimethalin 1.0 kg/ha pre-emegence + drygrass residue 5 tonnes/ha) recorded minimumnumber of monocot weeds (2.50/m2) followedb T9 (3.99/m2) and T8 (5.66/m2) i.e.Pendimethalin 0.75 kg/ha pre-emergence +Carfentrazone 0.03kg/ha post emergence (40DAS), whereas, in control treatment, it was(118.33 number of monocot weeds per m2. But,the minimum number of dicot weeds (9.83,
10.16 and 12.50/m2) were recorded in treatmentT3, T1 and T5 respectively. But, in controltreatment it was (118.33) weeds per m2. Kumaret al. (2012) conducted a field experimentduring Rabi season from 2007-2010 at Chatha,Jammu to find out relative efficiency of weedmanagement practices in gladiolus. Theyreported that spike yield with 2 hand weedingsat 20 and 40 days after planting was (6.05 t/ha)and pendimethalin 2 kg/ha + 1 hand weeding(5.79 t/ha), both of which were superior toweedy check (3.25t/ha). Application ofpendimethalin along with hand weeding provedto be economical. Two years mean data alsoindicate that plant height and spike length(85.33 cm and 75.16 cm) was recordedmaximum in treatment T9 (Pendimethalin 0.75kg/ha + metribuzin 0.3 kg/ha (tank mix) pre-emergence as compared to control treatment.But, these values was recorded minimum intreatment T2 i.e. (Atrazine 0.75 kg/ha pre-emergence + metsulfuron-methyl @ 0.005 kg/ha post emergence at 40 DAS). Kadam et al.(2014) reported that pre-emergence applicationof pendimethalin (1.0 and 0.75 kg/ha) hadsuperior effect on the plant height, spike length,rachis length and number of florets in gladiolus.Number of corms per hectare (1.20 lakh/ha) andnet return (Rs. 2.63 lakh/ha) was recorded undertreatment T9, i.e. application of pendimethalin0.75 kg/ha + metribuzin 0.30 kg/ha (tank-mix)followed by treatment T10 i.e. weed free check(four hand weeding) which produced 1.19 lakh/ha corms and net return rupees 2.61 lakh/ha.The minimum number of corms (0.61 lakh/ha)and net return rupees 0.060 lakh/ha wasobserved under control treatment. Themarketable spikes of two year mean (0.97 lakh/ha) and yield of corms (52.09 q/ha) was receivedunder treatment T5 and T10 i.e. application ofmetribuzin 0.4 kg/ha pre-emergence + dry grassresidue (5.0 tonnes/ha) and weed free check(four

64
Kishan Swaroop, D.V.S. Raju, T.K. Das, V.K. Sharma and Sunita Dhaker
Table 1: Assessment of different integrated weed management practices on weed population and number ofmarketable spikes in gladiolus cv. Pusa Srijana.
Treatment Number of monocot Number of dicot Number of marketableweeds/M2 weeds/M2 spikes (lakh/ha)
2014-15 2015-16 Mean 2014-15 2015-16 Mean 2014-15 2015-16 Mean
T1, Atrazine @ 1.0 kg/ha 22.66 29.00 25.83 10.00 10.33 10.16 0.90 0.89 0.89pre-emergence
T2, Atrazine @ 0.75 kg/ha 40.66 45.00 42.83 13.66 13.00 13.33 0.79 0.73 0.76pre-emergence + Metsulfuron-methyl @ 0.005kg/ha post-emergence at 40 DAS
T3, Atrazine @ 0.75 kg/ha pre- 25.66 32.00 28.83 8.66 11.00 9.83 0.84 0.79 0.81emergence + Carfentrazone@ 0.03kg/ha post-emergenceat 40 DAS
T4, Atrazine @ 0.75 kg/ha pre- 56.00 67.00 61.50 30.66 28.00 29.33 0.94 0.86 0.88emergence +dry grass residue(5 tonnes/ha)
T5, Metribuzin @ 0.4 kg/ha pre 14.00 17.66 15.83 13.00 12.00 12.50 1.00 0.94 0.97emergence + dry grass residue(5 tonnes/ha)
T6, Metribuzin @ 0.4 kg/ha pre- 17.33 17.33 17.33 12.00 13.33 12.66 0.77 0.72 0.74emergence + Metsulfuron-methyl@ 0.005 kg/ha post-emergenceat 40 DAS
T7, Pendimethalin @ 1.0 kg/ha pre- 3.00 2.00 2.50 19.66 22.00 20.83 0.98 0.94 0.96emergence + dry grass residue(5 tonnes/ha)
T8, Pendimethalin @ 0.75 kg/ha 7.33 4.00 5.66 20.66 22.00 21.33 0.99 0.94 0.96pre-emergence + Carfentrazone@ 0.030kg/ha post-emergenceat 40 DAS
T9, Pendimethalin @ 0.75 kg/ha 4.33 3.66 3.99 43.00 47.66 45.33 0.98 0.93 0.95pre-emergence + Metribuzin@ 0.30 kg/ha (tank-mix)pre-emegence
T10, Weed- free check ------- -------- ------ ------- -------- --------- 0.95 0.88 0.91(4 hand weeding)
T11, Weedy check (control) 119.00 117.66 118.33 128.66 89.00 118.83 0.18 0.30 0.24
C.D. at 5% 1.105 2.485 2.055 109.00 0.221 0.156
hand weeding), whereas, values of thesecharacters were minimum under controltreatment. Further, study also revealed that theweed free treatment (T10) had producedmaximum yield of cormels (307.33 kg/ha) andsingle corm weight (35.58g) followed by
treatment T9 which produced 220.50 kg/hacormels and 30.61 g single corm weight ascompared to other treatments. The minimumvalue of cormels (13.66 kg/ha) and single cormweight (18.43 g) was recorded under controltreatment.The results of above investigation are

65
Assessment of integrated weed management practices in gladiolus
Table 2: Assessment of different integrated weed management practices on plant height, spike length and numberof corms per hectare in gladiolus cv. Pusa Srijana.
Treatment Plant height Spike length Number of corms(cm) (cm) (lakh/ha)
2014-15 2015-16 Mean 2014-15 2015-16 Mean 2014-15 2015-16 Mean
T1, Atrazine @ 1.0 kg/ha 71.33 70.00 70.66 55.00 59.66 57.33 1.10 1.18 1.14pre-emergence
T2, Atrazine @ 0.75 kg/ha pre- 52.00 52.33 52.16 38.33 44.66 41.49 1.00 0.93 0.96emergence + Metsulfuron-methyl @ 0.005kg/ha post-emergence at 40 DAS
T3, Atrazine @ 0.75 kg/ha pre- 79.66 76.66 78.16 68.66 68.66 68.66 1.23 1.03 1.13emergence + Carfentrazone@ 0.03kg/ha post-emergenceat 40 DAS
T4, Atrazine @ 0.75 kg/ha pre- 67.00 79.00 73.00 63.00 64.33 63.66 1.20 1.12 1.16emergence +dry grass residue(5 tonnes/ha)
T5, Metribuzin @ 0.4 kg/ha pre- 75.00 76.66 75.83 65.00 64.66 64.83 1.34 1.04 1.19emergence + dry grassresidue (5 tonnes/ha)
T6, Metribuzin @ 0.4 kg/ha pre- 49.00 51.33 50.16 43.00 43.33 43.16 1.12 0.96 1.04emergence + Metsulfuron-methyl @ 0.005 kg/ha post-emergence at 40 DAS
T7, Pendimethalin @ 1.0 kg/ha 71.00 73.00 72.00 59.00 63.66 61.33 1.31 1.00 1.15pre-emergence + dry grassresidue (5 tonnes/ha)
T8, Pendimethalin @ 0.75 kg/ha 81.00 80.33 80.16 69.66 70.33 69.99 1.34 1.01 1.17pre-emergence + Carfentrazone@ 0.030kg/ha post-emegenceat 40 DAS
T9, Pendimethalin @ 0.75 kg/ha 88.00 82.66 85.33 76.33 74.00 75.16 1.34 1.06 1.20pre-emergence + Metribuzin@ 0.30 kg/ha (tank-mix)pre-emegence
T10, Weed- free check 75.00 76.00 75.50 65.66 67.66 66.66 1.31 1.08 1.19(4 hand weeding)
T11, Weedy check (control) 79.66 77.33 78.49 68.66 67.33 67.99 0.61 0.62 0.61
C.D. at 5% 1.877 4.520 1.402 3.187 0.120 0.151
in agreement with findings of Singh and Singh(2010). Bhat et al. (2013) observed thattreatments, weed free and pendimethalin 1.5 kga.i. ha–1 showed better results with vegetative,reproductive and yield parameters in gladiolus.Better control of weeds by pre-emergence
weedicides in early stages was also observed inalmost all treatments except weedy check.Higher weed population results in morecompetition for growth resources causingstunted growth of crop.
It is very clear to note that all the weedicides

66
Kishan Swaroop, D.V.S. Raju, T.K. Das, V.K. Sharma and Sunita Dhaker
Table 3: Assessment of different integrated weed management practices on quantitative characters of corms ingladiolus cv. Pusa Srijana
Treatment Weight of single Yield of Yield ofcorm (g) corms (q/ha) cormels (kg/ha)
2014-15 2015-16 Mean 2014-15 2015-16 Mean 2014-15 2015-16 Mean
T1, Atrazine @ 1.0 kg/ha 27.66 26.28 26.97 32.56 32.13 32.34 22.00 20.00 21.00pre-emergence
T2, Atrazine @ 0.75 kg/ha pre- 23.00 20.11 21.55 24.99 22.40 23.59 20.00 16.00 18.00emergence + Metsulfuron-methyl @ 0.005kg/hapost-emergence at 40 DAS
T3, Atrazine @ 0.75 kg/ha pre- 27.33 26.62 26.97 31.70 29.93 30.81 42.00 40.66 41.33emergence + Carfentrazone@ 0.03kg/ha post-emergenceat 40 DAS
T4, Atrazine @ 0.75 kg/ha pre- 25.00 24.08 24.54 43.91 43.80 43.85 16.00 13.33 14.66emergence+dry grass residue(5 tonnes/ha)
T5, Metribuzin @ 0.4 kg/ha pre 28.66 25.20 26.93 51.52 47.80 49.66 31.00 30.00 30.50emergence+dry grass residue(5 tonnes/ha)
T6, Metribuzin @ 0.4 kg/ha pre- 23.66 21.81 22.73 33.80 34.20 34.00 19.00 18.00 18.50emergence+Metsulfuron-methyl@ 0.005 kg/ha post-emergenceat 40 DAS
T7, Pendimethalin @ 1.0 kg/ha pre-29.00 29.53 29.26 47.65 44.53 46.09 60.00 54.66 57.33emergence+dry grass residue(5 tonnes/ha)
T8, Pendimethalin @ 0.75 kg/ha pre-29.33 30.41 29.87 49.11 46.40 47.75 61.00 60.00 60.50emergence+Carfentrazone@ 0.030kg/ha post-emegenceat 40 DAS
T9, Pendimethalin @ 0.75 kg/ha 31.33 29.90 30.61 49.20 47.40 48.30 221.00 220.00 220.00pre-emergence+Metribuzin@ 0.30 kg/ha (tank-mix)pre-emegence
T10, Weed-free check 36.66 34.51 35.58 54.13 50.06 52.09 300.00 314.00 307.33(4 hand weeding)
T11, Weedy check (control) 19.66 17.20 18.43 20.62 17.53 19.07 16.00 11.33 13.66
C.D. at 5% 1.495 4.739 5.760 3.884 8.102 4.222
have improved the spike and corm yield andthe maximum yield loss was when the weedswere totally left uncontrolled. There was noharmful effect of herbicides on growth,flowering yield characters of gladiolus. Thesefindings are in accordance with those of Singh(1993). These herbicides showed greater effect
in increasing the weed control efficiency. Theresults can be attributed due to markedimprovement for minimizing crop-weedcompetition and better weed control efficiency.The minimum value of growth and floweringcharacters was recorded under weedy checkwhich was attributed due to more weed growth

67
Assessment of integrated weed management practices in gladiolus
and poor corm yield. These results are inagreement with the findings of Chinnaswamyet al. (2005) and Mohan et al. (2005). The besttreatment of herbicides under (T7 and T3) mightbe due to emergence weeds in short span inwhich most of the weeds were affected byherbicides. This fact is well documented byVaishya and Tomar (2000). The poor effect ofherbicides under weedy check was owing toextended period of weed emergence as itprovided better environment for emergence ofweeds. The economic analysis revealed highestmonetary advantage in terms of net returns withtreatment (T9) i.e. Pendimethalin 0.75 kg/ha +Metribuzin 0.3 kg/ha.
Thus, it is inferred from the investigation andconcluded that integrated weed managementpractices including pre- and post emergenceapplication of weedicides are more effectivethan alone. The highest plant height, spikelength, number of corms and maximum net
returns in gladiolus cv. Pusa Srijana wereobtained with pre- emergence application ofPendimethalin @ 0.75 kg/ha + Metribuzin @0.3 kg/ha (tank-mix) pre-emergence.
REFERENCES
Bhat, Z.A., Sheiakh, M.Q. and Siddique, M.A.A. 2013.Effect of chemicals on weed control on vegetative,reproductive and yield parameters in gladiolus(Gladiolus hybridus L.) cv. Buff Beauty. IndianHorticulture Journal, 3(3/4): 107-108.
Chinnaswamy, C., Prabhakaran, M.K. andShamughansundaram R. 2006. Sequentialherbicidal weed management in transplanted rice(Oryza sativa L.) Extended Summaries, GoldenJubilee National Symposium on ConservationAgriculture and Environment, held during 26-28October, 2006 at Banaras Hindu University,Varanasi, Indian Society of Agronomy, Abstract:pp. 317-8
Gomez, K.A. and Gomez, A.A. 1994. StatisticalProcedures For Agricultural Research. (2nd Ed).John Wiley and Sons, New York. pp. 680.
Kadam, G.B., Kumar, G., Saha, T., Kumar, R., Tiwari,A.K. and Kumar, R. 2014. Evaluation of pre-
Table 4: Assessment of different integrated weed management practices on net returns in gladiolus cv. PusaSrijana
Treatment Net returns (Rs. in lakh/ha)
2014-15 2015-16 Mean
T1, Atrazine @ 1.0 kg/ha pre-emergence 1.660 1.184 1.420
T2, Atrazine @ 0.75 kg/ha pre-emergence + Metsulfuron-methyl 0.650 0.670 0.660@ 0.005 kg/ha post-emergence at 40 DAS
T3, Atrazine @ 0.75 kg/ha pre-emergence + Carfentrazone 1.420 1.011 1.210@ 0.03 kg/ha post-emergence at 40 DAS
T4, Atrazine @ 0.75 kg/ha pre-emergence + dry grass residue (5 tonnes/ha) 1.5400 1.980 1.760
T5, Metribuzin @ 0.4 kg/ha pre emergence + dry grass residue (5 tonnes/ha) 2.480 1.995 2.230
T6, Metribuzin @ 0.4 kg/ha pre-emergence + Metsulfuron-methyl 1.110 0.670 0.890@ 0.005 kg/ha post-emergence at 40 DAS
T7, Pendimethalin @ 1.0 kg/ha pre-emergence + dry grass residue (5 tonnes/ha)2.100 2.134 2.110
T8, Pendimethalin @ 0.75 kg/ha pre-emergence + Carfentrazone 2.000 2.441 2.220@ 0.030 kg/ha post-emegence at 40 DAS
T9, Pendimethalin @ 0.75 kg/ha pre-emergence + Metribuzin 2.670 2.598 2.630@ 0.30 kg/ha (tank-mix) pre-emegence
T10, Weed- free check (4 hand weeding) 2.510 2.720 2.610
T11, Weedy check (control) 0.0590 0.0610 0.060

68
Kishan Swaroop, D.V.S. Raju, T.K. Das, V.K. Sharma and Sunita Dhaker
emergence herbicides in gladiolus. Indian Journalof Agricultural Sciences, 84(12): 1546-9.
Kumar, A., Sharma, B.C. and Kumar, J. 2012. Integratedweed management in gladiolus. Indian Journal ofWeed Science, 44(3): 181-182.
Lepcha, B., Nautiyal, M.C. and Rao, V.K. 2007. Variabilitystudies in gladiolus under Hill conditions ofUttarakhand. Journal of Ornamental Horticulture,10(3): 169-172.
Meena, S.S., Mehta, R.S., Lal, G. and Anwer, M.M. 2013.Economic feasibility of weed managementpractices in fenugreek. Indian Journal ofHorticulture, 70(1): 150-153.
Mehta, R.S., Patel, B.S. and Meena, S.S. 2010. Weeddynamics and yield of Fenugreek (Trigonellafoenum-graecum) as influenced with irrigationlevels and weed management practices. IndianJournal Agricultural Sciences, 80(11): 970-974.
Mohan, K.S., Muniyappa, T.V. and Shiva Kumar, H.R.2005. Effect of pre-emergence herbicides ongrowth and yield of direct- seeded puddle rice(Oryza sativa L.). Extended Summaries, NationalBiennial Conference, held during 6-9 April, 2005at PAU, Ludhiana, Indian Society of Weed Science,Abtsract: pp. 28-9
Rao, A.N., Johnson, D.E., Sivaprasad, B., Ladha J.K.and Morfimer, A.M.2007. Weed management indirect-seeded rice. Advances in Agronomy, 93:153-255.
Riaz T., Khan S.N. and Javaid, A. 2009. Weed flora ofgladiolus fields in district Kasur, Pakistan. TheJournal of Animal and Plant Sciences, 19(3): 144-8.
Sankar, Siva, K. and Subramanium, D. 2011. Weed Floraand yield of Sunflower (Helianthus annuus L.) asinfluenced by pre- and post- emergenceapplication of herbicides. Indian Journal of WeedScience, 43(1&2): 105-109.
Singh, M. and Singh, R.P. 2010. Efficacy of herbicidesunder different methods of direct-seeded rice(Oryza sativa L.) establishments. Indian Journalof Agricultural Sciences, 80(9): 815-9.
Singh, R.P. 1993. Role of non-cash inputs in weedmanagement. Proceedings of InternationalSymposium, Indian Society of Weed Science, 1:351-357.
Vaishya, R.D. and Tomar, S.K. 2000. Weed control inpuddle-seeded rice (Oryza sativa L.) withherbicides. Indian Journal of Agronomy, 45(2): 334-7.

69
Evaluation of tuberose (Polianthes tuberosa L.) cultivars under the foothill conditions of NagalandJournal of Ornamental Horticulture. 20 (1&2): 69-74, 2017
Evaluation of tuberose (Polianthes tuberosa L.)cultivars under the foothill conditions of Nagaland
ANDREW LALTHAWMLIANA, ROKOLHU KEDITSU,Y. ANGNGOI BUCHEM and LOKAM BAGANG
Department of HorticultureSchool of Agricultural Sciences and Rural Development
Nagaland University, Medziphema-797106, NagalandE-mail: [email protected]
ABSTRACT
An investigation was conducted to evaluate four double and five single cultivars of tuberose. Theresults revealed that for the vegetative parameters studied among the double cultivars, cultivarSuvasini exhibited maximum plant height (58.13 cm), number of leaves (15.33), leaf area (64.55cm²) and took minimum days for sprouting (5.67 days). Among the single cultivars, cultivar Prajwalshowed earliest sprouting (60.67 days), maximum plant height (48.63 cm) and leaf area (68.75cm²) while cultivar Sikkim Selection had maximum number of leaves (13.33). For all the floralparameters studied, results showed that cultivar Hyderabad Double and cultivar Suvasini weresuperior among the double cultivars. While among the single cultivars, Sikkim Selection andPrajwal were found to be superior in all the floral parameters. With respect to vase life, cultivarPrajwal and cultivar Sikkim Selection exhibited the longest vase life of 12.33 days and 13.00 daysrespectively. Thorough analysis of all the parameters studied revealed that cultivars HyderabadDouble, Suvasini, Sikkim Selection and Prajwal performed better under the foothill conditionsof Nagaland and were found suitable for cut flower production.
Keywords: Cut flower, double, floral and vegetative parameters, single, tuberose.
INTRODUCTION
Tuberose (Polianthes tuberosa L.) is essentiallya florist's flower and a leading commercial cropbecause of its multipurpose use. Tuberose floweris much adorned for its beauty, elegance andfragrance. It has great potential for cut flowertrade and essential oil industry. It is also growncommercially for production of loose flowersand as raw material for perfume industry. Thelingering delightful fragrance and excellentkeeping quality are the prominent characteristicsof this plant. Tuberose flower oil is one of themost valuable and expensive perfume's raw
material.
Tuberose can be grown with success under awide range of environmental conditions rangingfrom tropical to sub-tropical and temperateclimate. Commercial cultivation of tuberose inIndia is mainly confined to areas with warm andhumid areas with average temperature of 20-35ºC. There are three types of tuberose flowersi.e. singles with one row of corolla segment,semi-doubles bearing flowers with two to threerows of corolla segments and doubles havingmore than three rows of corolla segments. Singletype is more fragrant and basically cultivated

70
Andrew Lalthawmliana, Rokolhu Keditsu, Y. Angngoi Buchem and Lokam Bagang
for loose flower production and as raw materialfor perfume industry while double types are lessfragrant and are generally grown for cut spikeproduction.
MATERIALS AND METHODS
The present investigation was carried out in theExperimental Farm, Department of Horticulture,Nagaland University, School of AgriculturalSciences and Rural Development, MedziphemaCampus, Nagaland in the year 2013. It issituated at an altitude of 310 meters above sealevel, with the geographical location of 25º45"N latitude and 93º53" E longitude.
The germplasm of nine tuberose cultivars wasobtained from Banaras Hindu University,Varanasi. The germplasm consisted of fivesingle type cultivars - Mexican Single, SikkimSelection, Shringar, Phule Rajani and Prajwal;and four double type cultivars - Pearl Double,Hyderabad Double, Suvasini and Phule RajaniDouble. The experiment was laid out in arandomized block design (RBD) with threereplications. Healthy and uniform sized bulbswere planted with a spacing of 25 × 25 cm.Various vegetative and flowering characterswere periodically recorded and analyzedstatistically. A standardized vase solutionconsisting of Aluminium sulphate (300 ppm) +Sucrose (4%) was used for vase life study ofall the treatments. The statistical analysis wasdone as per methods suggested by Panse andSukhatme (1989).
RESULTS AND DISCUSSION
The data presented in Table 1 revealed thatsingle varieties of tuberose varied significantlywith regard to all vegetative and floralparameters. The variation among the growthparameters may be due to their diversified originand also evolution of the particular genotype as
a morphotype in their specific geographicallocation (Ranchana et al. 2013). This offersscope for selecting genotypes with betterperformance under foothill conditions ofNagaland.
For vegetative characters, among the singlecultivars, Prajwal took significantly lessernumber of days for sprouting of bulbs (6.67days) followed by Sikkim Selection (7.33 days)while Phule Rajani Single took the maximumnumber of days (9.67 days) for sprouting. Thetallest plant (48.63 cm) was observed in Prajwalfollowed by Phule Rajani Single (46.40 cm).The minimum plant height was observed inSikkim Selection (35.83 cm). The difference invarious growth characters might be attributedto inherent genetic characters of the cultivarsas reported by Hemalata et al. (1992) andSwaroop et al. (2008) in Chrysanthemum.Sikkim Selection produced maximum numberof leaves per plant (13.33) followed by PhuleRajani Single (13.00), while minimum numberof leaves was recorded in Mexican Single(11.33). The maximum leaf area (68.75 cm²)was exhibited by Prajwal while the minimum(21.79 cm²) was observed in Sikkim Selection.The superiority of Prajwal may be due to itslong and wide leaves and higher relative growthwhich is controlled by cell division and cellelongation (Vijayalaxmi et al, 2010). Thedifferences among the cultivars for vegetativecharacters are attributed to their variation in theirgenetic makeup (Swaroop, 2010).
With respect to floral characters, the days takento emergence of spike was minimum (65.00days) in Sikkim Selection, the maximum daystaken was recorded in Mexican Single (75.33days). Arora and Khana (1985) reported thattime taken for spike emergence variedsignificantly among various cultivars ofgladiolus. These findings closely confirmed with

71
Evaluation of tuberose (Polianthes tuberosa L.) cultivars under the foothill conditions of Nagaland
the present results. The minimum days foropening of first pair of floret were recorded inSikkim Selection (81.00 days) which wasclosely followed by Phule Rajani Single (81.33days) while the maximum was recorded inShringar (84.00 days). The data regarding daysfor opening of first pair of floret variedsignificantly and are in conformity with thefindings of Biswas et al. (2002) and Bist (2005)in tuberose. The number of florets per spike wasmaximum in Prajwal (42.00) closely followedby Phule Rajani Single (41.33) while theminimum of florets per spike was recorded inMexican Single (26.33). The results reported inthe present study is also in accordance withSrinivas et al. (1995) in tuberose andRamachandrudu and Thangam (2008) ingladiolus. The wide variations were attributedto genetic characters of the cultivars (Martoliaand Srivastava, 2012). Longest spike length(105.20 cm) was recorded in Sikkim Selectionfollowed by Prajwal (83.00 cm) while theshortest spike length was recorded in MexicanSingle (65.33 cm). A similar finding was alsoreported by Vijayalaxmi et al. (2010). The rachislength was significantly higher in Prajwal (38.67cm) while Shringar recorded minimum rachislength (28.67 cm). The variation in spike lengthand rachis length might be due to variation intheir intrinsic factor as reported by Vijayalaxmiet al. (2010). The space between florets variedsignificantly among the cultivars studied. It isthe deciding factor for the number of florets perspike rather than length of spike (Vijayalaxmiet al., 2013). Prajwal recorded maximum length(5.25 cm) between 2 nodes on the rachis whilethe minimum was recorded in Mexican Single(1.60 cm). The variation in length between 2nodes on the rachis among the cultivars wasalso reported by Ramachandrudu and Thangam(2008). The data pertaining to flower diameterrevealed that Prajwal recorded maximum flowerTa
ble
1:
Veg
etat
ive
and
flora
l pa
ram
eter
s of
Sin
gle
culti
vars
in
tube
rose
.
Cul
tivar
sD
ays
Pla
ntN
o.Le
afD
ays
Day
s to
Num
ber
Spi
keLe
ngth
Leng
thF
lore
tD
urat
ion
Fre
shLo
ose
Vas
eto
heig
htof
area
to e
mer
-op
enin
gof
leng
thof
betw
een
dia-
ofw
eigh
tflo
wer
life
spro
utin
g(c
m)
leav
espe
rge
nce
of f
irst
flore
ts(c
m)
rach
istw
om
eter
flow
erin
gof
yiel
d(d
ays)
per
plan
tof
pair
ofpe
r(c
m)
node
s on
(cm
)(d
ays)
spik
epe
rpl
ant
(cm
2 )sp
ike
flore
tsp
ike
the
rach
is(g
)pl
ant
(cm
)(g
)
Mex
ican
Sin
gle
8.33
43.2
311
.33
34.1
675
.33
83.6
726
.33
65.3
330
.33
1.60
2.24
7.33
80.0
024
.09
10.0
0S
ikki
m S
elec
tion
7.33
35.8
313
.33
21.7
965
.00
81.0
031
.67
105.
2030
.60
3.32
3.17
10.6
712
2.17
29.5
413
.00
Phu
le R
ajan
i9.
6746
.40
13.0
037
.55
74.3
381
.33
41.3
372
.60
31.6
73.
503.
2010
.00
109.
3357
.49
11.3
3S
ingl
eP
rajw
al6.
6748
.63
11.6
768
.75
73.0
082
.00
42.0
083
.00
38.6
75.
253.
2510
.33
148.
5089
.80
12.3
3S
hrin
gar
8.33
43.3
012
.33
41.0
271
.33
84.0
027
.00
74.9
328
.67
2.29
2.28
12.0
075
.50
35.3
612
.00
SE
m0.
382.
310.
424.
111.
300.
771.
070.
510.
720.
290.
080.
452.
373.
270.
34C
D 5
%1.
126.
871.
2512
.20
3.87
2.27
3.18
1.51
2.13
0.86
0.23
1.35
7.05
9.71
1.01
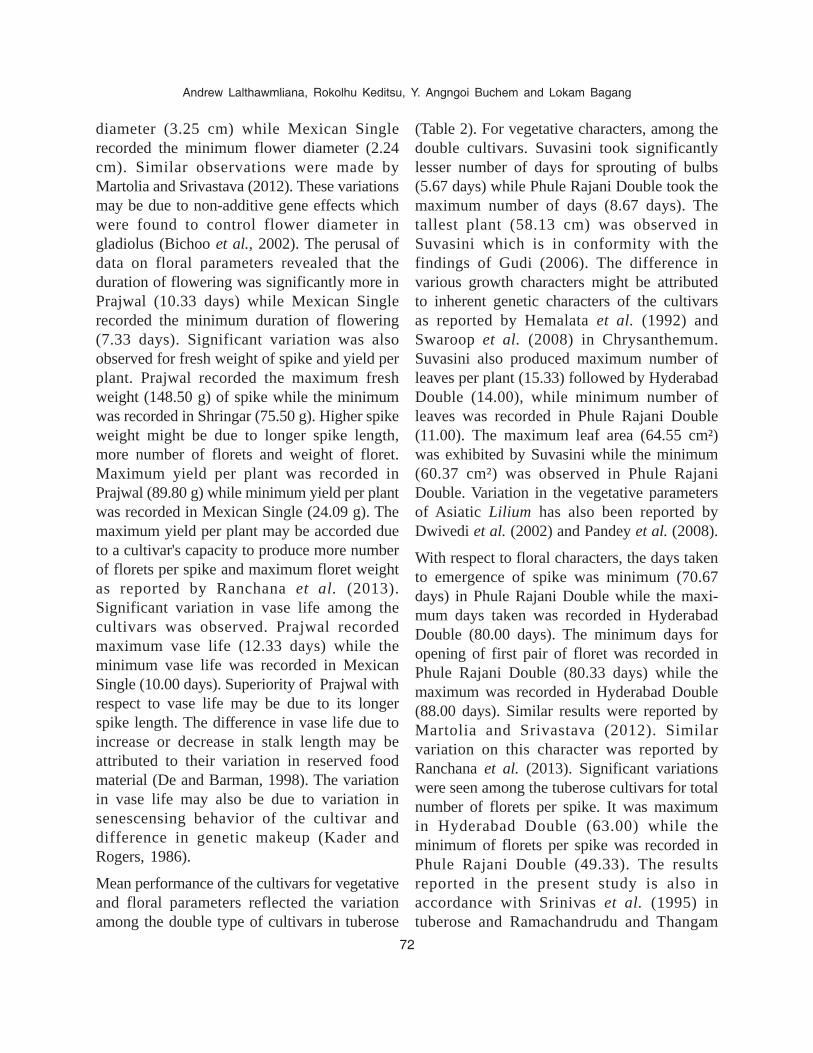
72
Andrew Lalthawmliana, Rokolhu Keditsu, Y. Angngoi Buchem and Lokam Bagang
diameter (3.25 cm) while Mexican Singlerecorded the minimum flower diameter (2.24cm). Similar observations were made byMartolia and Srivastava (2012). These variationsmay be due to non-additive gene effects whichwere found to control flower diameter ingladiolus (Bichoo et al., 2002). The perusal ofdata on floral parameters revealed that theduration of flowering was significantly more inPrajwal (10.33 days) while Mexican Singlerecorded the minimum duration of flowering(7.33 days). Significant variation was alsoobserved for fresh weight of spike and yield perplant. Prajwal recorded the maximum freshweight (148.50 g) of spike while the minimumwas recorded in Shringar (75.50 g). Higher spikeweight might be due to longer spike length,more number of florets and weight of floret.Maximum yield per plant was recorded inPrajwal (89.80 g) while minimum yield per plantwas recorded in Mexican Single (24.09 g). Themaximum yield per plant may be accorded dueto a cultivar's capacity to produce more numberof florets per spike and maximum floret weightas reported by Ranchana et al. (2013).Significant variation in vase life among thecultivars was observed. Prajwal recordedmaximum vase life (12.33 days) while theminimum vase life was recorded in MexicanSingle (10.00 days). Superiority of Prajwal withrespect to vase life may be due to its longerspike length. The difference in vase life due toincrease or decrease in stalk length may beattributed to their variation in reserved foodmaterial (De and Barman, 1998). The variationin vase life may also be due to variation insenescensing behavior of the cultivar anddifference in genetic makeup (Kader andRogers, 1986).
Mean performance of the cultivars for vegetativeand floral parameters reflected the variationamong the double type of cultivars in tuberose
(Table 2). For vegetative characters, among thedouble cultivars. Suvasini took significantlylesser number of days for sprouting of bulbs(5.67 days) while Phule Rajani Double took themaximum number of days (8.67 days). Thetallest plant (58.13 cm) was observed inSuvasini which is in conformity with thefindings of Gudi (2006). The difference invarious growth characters might be attributedto inherent genetic characters of the cultivarsas reported by Hemalata et al. (1992) andSwaroop et al. (2008) in Chrysanthemum.Suvasini also produced maximum number ofleaves per plant (15.33) followed by HyderabadDouble (14.00), while minimum number ofleaves was recorded in Phule Rajani Double(11.00). The maximum leaf area (64.55 cm²)was exhibited by Suvasini while the minimum(60.37 cm²) was observed in Phule RajaniDouble. Variation in the vegetative parametersof Asiatic Lilium has also been reported byDwivedi et al. (2002) and Pandey et al. (2008).
With respect to floral characters, the days takento emergence of spike was minimum (70.67days) in Phule Rajani Double while the maxi-mum days taken was recorded in HyderabadDouble (80.00 days). The minimum days foropening of first pair of floret was recorded inPhule Rajani Double (80.33 days) while themaximum was recorded in Hyderabad Double(88.00 days). Similar results were reported byMartolia and Srivastava (2012). Similarvariation on this character was reported byRanchana et al. (2013). Significant variationswere seen among the tuberose cultivars for totalnumber of florets per spike. It was maximumin Hyderabad Double (63.00) while theminimum of florets per spike was recorded inPhule Rajani Double (49.33). The resultsreported in the present study is also inaccordance with Srinivas et al. (1995) intuberose and Ramachandrudu and Thangam

73
Evaluation of tuberose (Polianthes tuberosa L.) cultivars under the foothill conditions of Nagaland
(2008) in gladiolus. Longest spike length(101.00 cm) was recorded in Hyderabad Doublewhile the shortest spike length was recorded inPhule Rajani Double (72.57 cm). A similarfinding was also reported by Vijayalaxmi et al.(2010). The rachis length was significantlyhigher in Suvasini (77.17 cm) while PearlDouble recorded minimum rachis length (55.50cm). The variation in spike length and rachislength might be due to variation in their intrinsicfactor as reported by Ranchana et al. (2013).Suvasini recorded maximum length (6.08 cm)between 2 nodes on the rachis followed byHyderabad Double (5.50 cm) while theminimum was recorded in Pearl Double (5.25cm). The data pertaining to flower diameterrevealed that Suvasini recorded maximumflower diameter (4.80 cm) while Phule RajaniDouble recorded the minimum flower diameter(4.21 cm). It was revealed that the duration offlowering was significantly more in HyderabadDouble (14.00 days) while Suvasini recordedthe minimum duration of flowering (11.67 days).The availability of flowers for longer period incase of Hyderabad Double might be due to itshigher number of florets per spike (Vijayalaxmiet al., 2010). The differences are probably dueto the results of interaction of the environmentalfactors as well as due to varietal difference. Itwas also observed that duration of flowering indouble petal cultivars were generally more thanthe single petal cultivars. The wide variationswere attributed to genetic characters of tuberose(Martolia and Srivastava, 2012). Significantvariation was also observed for fresh weight ofspike and yield per plant. Hyderabad Doublerecorded the maximum fresh weight (259.67 g)of spike, followed by Suvasini (241.33 g) whilethe minimum was recorded in Phule RajaniDouble (167.17 g). Higher spike weight mightbe due to longer spike length, more number offlorets and weight of floret. Maximum yield perTa
ble
2:
Veg
etat
ive
and
flora
l pa
ram
eter
s of
Dou
ble
culti
vars
in
tube
rose
.
Cul
tivar
sD
ays
Pla
ntN
o.Le
afD
ays
Day
s to
Num
ber
Spi
keLe
ngth
Leng
thF
lore
tD
urat
ion
Fre
shLo
ose
Vas
eto
heig
htof
area
to e
mer
-op
enin
gof
leng
thof
betw
een
dia-
ofw
eigh
tflo
wer
life
spro
utin
g(c
m)
leav
espe
rge
nce
of f
irst
flore
ts(c
m)
rach
istw
om
eter
flow
erin
gof
yiel
d(d
ays)
per
plan
tof
pair
ofpe
r(c
m)
node
s on
(cm
)(d
ays)
spik
epe
rpl
ant
(cm
2 )sp
ike
flore
tsp
ike
the
rach
is(g
)pl
ant
(cm
)(g
)
Phu
le R
ajan
i8.
6746
.90
11.0
060
.37
70.6
780
.33
49.3
372
.57
67.6
75.
394.
2112
.33
167.
1714
3.73
10.3
3D
oubl
eP
earl
Dou
ble
7.33
46.6
713
.67
61.0
072
.00
82.0
050
.33
93.1
755
.50
5.25
4.34
13.3
317
1.83
147.
9510
.67
Hyd
erab
ad7.
3346
.93
14.0
061
.42
80.0
088
.00
63.0
010
1.00
72.5
75.
504.
4014
.00
259.
6720
4.78
12.0
0D
oubl
eS
uvas
ini
5.67
58.1
315
.33
64.5
571
.33
82.6
760
.67
98.3
377
.17
6.08
4.80
11.6
724
1.33
201.
3511
.67
SE
m0.
330.
860.
950.
731.
331.
091.
232.
193.
050.
180.
120.
504.
352.
930.
28C
D a
t 5%
0.97
2.54
2.80
2.17
3.96
3.25
3.66
6.52
9.06
0.55
0.34
1.48
12.9
48.
710.
84

74
Andrew Lalthawmliana, Rokolhu Keditsu, Y. Angngoi Buchem and Lokam Bagang
plant was recorded in Hyderabad Double(204.78 g) followed by Suvasini (201.35 g). Theminimum yield per plant was recorded in PhuleRajani Double (143.73 g). The maximum yieldper plant may be accorded due to a cultivar'scapacity to produce more number of florets perspike and maximum floret weight as reportedby Vijayalaxmi et al. (2010). Significantvariation in vase life among the cultivars wasobserved. Hyderabad Double recordedmaximum vase life (12.00 days) while theminimum vase life was recorded in Phule RajaniDouble (10.33 days). The variation in vase lifemay also be due to variation in senescensingbehavior of the cultivar and difference in geneticmakeup (Kader and Rogers, 1986).
From the above results, it can be concluded thatthe cultivars Suvasini and Hyderabad Doublefrom among the double cultivars studied andcultivars Sikkim Selection and Prajwal fromamong the single cultivars can be recommendedfor cut spike production.
REFERENCES
Arora, J.S. and Khana, K. 1985. Evaluation of gladioluscultivars. Journal of Research-Punjab AgriculturalUniversity, 22(4): 635-662.
Bichoo, G.A., Jhon, A.Q. and Wani, S.A. 2002. Geneticvariability in some quantitative characters inGladiolus. Journal of Ornamental Horticulture,15(1): 22-4.
Biswas, B., Naveen, K. and Bhattacharya, S.K. 2002.All India Coordinated Research Project onFloriculture. Technical Bulletin no. 21, ICARPublications, New Delhi pp 25.
Bist, D. 2005. Screening of tuberose (Polianthestuberose L.) varieties for suitability under taraiconditions, MSc. Ag. Thesis, GBPUAT., Pantnagar.
De, L.C. and Barman, D. 1998. Vase life of cut Tuberosespikes as affected by stage of harvest, stalk lengthand sucrose. Orissa Journal of Horticulture, 26(1):66-69.
Dwivedi, S.K., Attrey, D.P., Eli, P. and Abdul, K. 2002.Introduction and evaluation of Asiatic Lilium in coldarid conditions of Ladakh. Floriculture Researchin the new millennium, Lal-Bagh, Bangalore, 25-27 February, pp. 293-294.
Gudi, G. 2006. Evaluation of tuberose varieties. Thesissubmitted to University of Agriculture Sciences,Dharwad, Karnataka, India.
Hemalata, B.A., Patil, A. and Nalwaadi, U.G. 1992.Variability studies in Chrysanthemum. ProgressiveHorticulture, 24(1): 55-59.
Kader, H. and Rogers, M.N. 1986. Post-harvesttreatments of Gerbera jamesonii, ActaHorticulturae, 181: 169-176.
Martolia, K. and Srivastava, R. 2012. Evaluation ofdifferent Tuberose (Polianthes tuberosa) varietiesfor flowering attributes concrete and absolutecontent. Indian Journal of Agricultural Sciences,82(2): 85-88.
Pandey, R. K., Sheetal, D., Sharma, J. P. and Jamwal,S. 2008. Evaluation of Asiatic hybrid lily cultivarsunder subtropical conditions of Jammu region.Journal of Plant Science Research, 24(2): 213-214.
Ramachandrudu, K. and Thangam, M. 2008.Performance of gladiolus varieties under agro-climatic conditions of Goa. Journal of OrnamentalHorticulture, 11(2): 91-97.
Ranchana, P., Kannan, M. and Jawaharlal, M. 2013.Genetic and correlation studies in double type ofTuberose (Polianthes tuberose) for accessing thegenetic variability. Advances in Crop Science andTechnology, 1(3): 1-5.
Srinivas, M., Murthy, N. and Kalihallo, J.L. 1995.Tuberose hybrids-Shringar and Suvasini. IndianHorticulture, 40(3): 5-7.
Swaroop, K. 2010. Morphological variation andevaluation of gladiolus germplasm. Indian Journalof Agricultural Sciences, 80: 742-745.
Swaroop, K.K., Prasad, V. and Raju, D.V. 2008.Evaluation of Chrysanthemum (Dendranthemagrandiflora Tzvelev.) germplasm in winter seasonunder Delhi condition. Journal of OrnamentalHorticulture, 11(1): 58-61.
Vijayalaxmi, M., Rao, A.M., Padmavatamma, A.S. andShanker, A.S. 2010. Evaluation and variabilitystudies in tuberose (Polianthes tuberose) singlecultivars. Journal of Ornamental Horticulture, 13(4):251-256.

75
Effect of growing media and primary nutrients on postharvest life of anthurium flowersJournal of Ornamental Horticulture. 20 (1&2): 75-79, 2017
Effect of growing media and primary nutrients on postharvestlife of cut flowers of anthurium var. Tropical
TATTE SUMATHI, S.L. CHAWLA, SUDHA PATIL and NEELIMA PALAGANI
Department of Floriculture and Landscape ArchitectureASPEE College of Horticulture and Forestry
Navsari Agricultural University, Navsari-396450, GujaratE-mail: [email protected]
ABSTRACT
Flowers of anthurium var. Tropical grown in media containing coconut husk + charcoal (3:1)showed maximum total water uptake, fresh weight retention, total soluble sugar, per cent absoluteintegrity on 4th, 8th and 12th day and vase life. Similarly flowers produced from plants sprayedwith 12:61:40 N:P:K @ 0.2% weekly once showed maximum total water uptake, fresh weightretention, total soluble sugars, per cent absolute integrity on 4th, 8th and 12th day of post harvestlife and also increased vase life. In case of interaction, flowers produced from plants cultivated incoconut husk+ charcoal as growing media along with foliar spray of 12:61:40 N:P:K @ 0.2%showed maximum water uptake, fresh weight retention, total soluble sugars, per cent absoluteintegrity as respectively on 4th, 8th and 12th day of post harvest life and also increased vase lifecompared to other treatments.
Keywords: Anthurium, cocopeat, coconut husk, charcoal and coconut fiber.
INTRODUCTION
Anthurium (Anthurium andreanum Lind.) is anelegant cut flower of immense value in themodern world and also has important place inIndian floriculture industry today. It is anepiphytic plant, therefore media and nutrientmanagement play an important role and thesecret of success for commercial cultivation ofanthurium and both important practicesultimately affect the post harvest quality and lifeof anthurium flowers. It requires a well aeratedmedium with good water retention capacity.Nutrient need of anthurium can be met throughdifferent sources, among which, major sourceof plant nutrient are chemical fertilizers.Application of fertilizers in little quantity atfrequent intervals has been found beneficial to
improve growth and flower production as wellas postharvest life of flowers. Foliar applicationsof nutrients are easy and quick approach toprovide nutrients. The quality and quantity ofapplied fertilizers are key factors affecting thegrowth, yield and quality of the cut flowers ofanthurium (Bik, 1976; Higaki and Imamura,1985). Keeping in view the present demand andpaucity of research work on this crop, thepresent experiment was carried out to study oneffect of different growing media and primarynutrients on postharvest quality and life offlowers of anthurium var. Tropical.
MATERIALS AND METHODS
The present investigation was carried out at theGreenhouse Complex, ASPEE College of
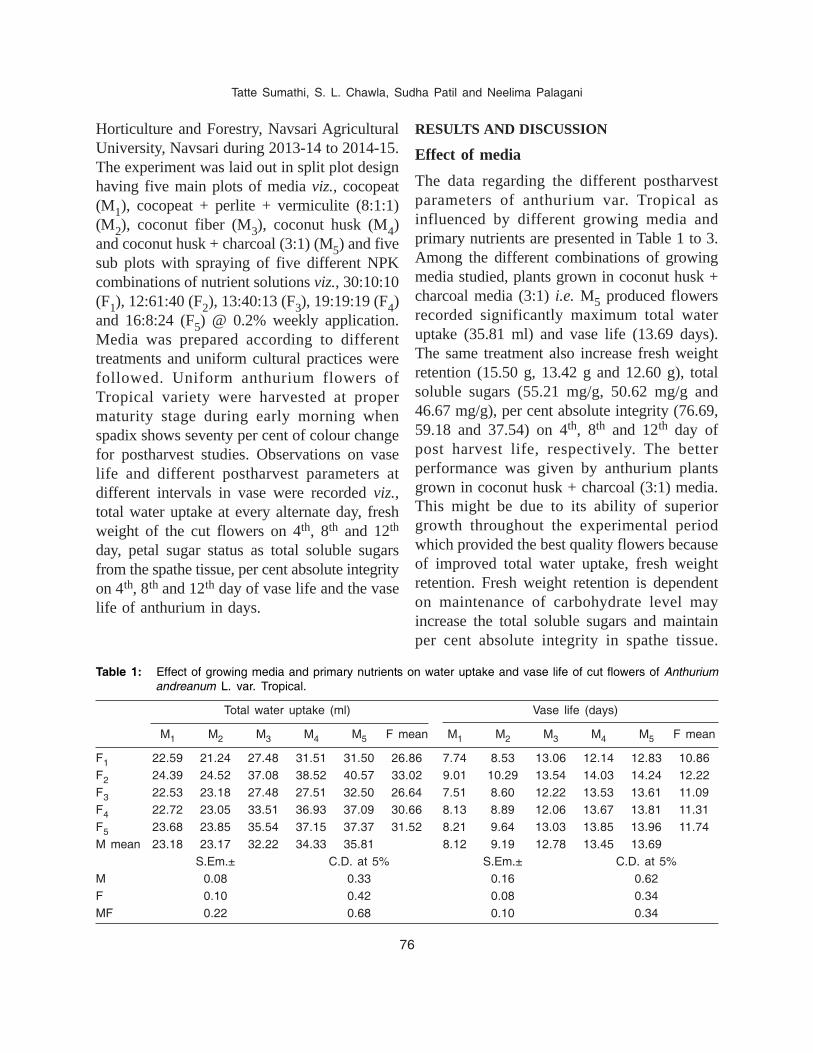
76
Tatte Sumathi, S. L. Chawla, Sudha Patil and Neelima Palagani
Horticulture and Forestry, Navsari AgriculturalUniversity, Navsari during 2013-14 to 2014-15.The experiment was laid out in split plot designhaving five main plots of media viz., cocopeat(M1), cocopeat + perlite + vermiculite (8:1:1)(M2), coconut fiber (M3), coconut husk (M4)and coconut husk + charcoal (3:1) (M5) and fivesub plots with spraying of five different NPKcombinations of nutrient solutions viz., 30:10:10(F1), 12:61:40 (F2), 13:40:13 (F3), 19:19:19 (F4)and 16:8:24 (F5) @ 0.2% weekly application.Media was prepared according to differenttreatments and uniform cultural practices werefollowed. Uniform anthurium flowers ofTropical variety were harvested at propermaturity stage during early morning whenspadix shows seventy per cent of colour changefor postharvest studies. Observations on vaselife and different postharvest parameters atdifferent intervals in vase were recorded viz.,total water uptake at every alternate day, freshweight of the cut flowers on 4th, 8th and 12th
day, petal sugar status as total soluble sugarsfrom the spathe tissue, per cent absolute integrityon 4th, 8th and 12th day of vase life and the vaselife of anthurium in days.
RESULTS AND DISCUSSION
Effect of media
The data regarding the different postharvestparameters of anthurium var. Tropical asinfluenced by different growing media andprimary nutrients are presented in Table 1 to 3.Among the different combinations of growingmedia studied, plants grown in coconut husk +charcoal media (3:1) i.e. M5 produced flowersrecorded significantly maximum total wateruptake (35.81 ml) and vase life (13.69 days).The same treatment also increase fresh weightretention (15.50 g, 13.42 g and 12.60 g), totalsoluble sugars (55.21 mg/g, 50.62 mg/g and46.67 mg/g), per cent absolute integrity (76.69,59.18 and 37.54) on 4th, 8th and 12th day ofpost harvest life, respectively. The betterperformance was given by anthurium plantsgrown in coconut husk + charcoal (3:1) media.This might be due to its ability of superiorgrowth throughout the experimental periodwhich provided the best quality flowers becauseof improved total water uptake, fresh weightretention. Fresh weight retention is dependenton maintenance of carbohydrate level mayincrease the total soluble sugars and maintainper cent absolute integrity in spathe tissue.
Table 1: Effect of growing media and primary nutrients on water uptake and vase life of cut flowers of Anthuriumandreanum L. var. Tropical.
Total water uptake (ml) Vase life (days)
M1 M2 M3 M4 M5 F mean M1 M2 M3 M4 M5 F mean
F1 22.59 21.24 27.48 31.51 31.50 26.86 7.74 8.53 13.06 12.14 12.83 10.86F2 24.39 24.52 37.08 38.52 40.57 33.02 9.01 10.29 13.54 14.03 14.24 12.22F3 22.53 23.18 27.48 27.51 32.50 26.64 7.51 8.60 12.22 13.53 13.61 11.09F4 22.72 23.05 33.51 36.93 37.09 30.66 8.13 8.89 12.06 13.67 13.81 11.31F5 23.68 23.85 35.54 37.15 37.37 31.52 8.21 9.64 13.03 13.85 13.96 11.74M mean 23.18 23.17 32.22 34.33 35.81 8.12 9.19 12.78 13.45 13.69
S.Em.± C.D. at 5% S.Em.± C.D. at 5%M 0.08 0.33 0.16 0.62F 0.10 0.42 0.08 0.34MF 0.22 0.68 0.10 0.34

77
Effect of growing media and primary nutrients on postharvest life of anthurium flowersTa
ble
2:
Effe
ct o
f gr
owin
g m
edia
and
prim
ary
nutr
ient
s on
fre
sh w
eigh
t re
tent
ion
of c
ut f
low
ers
of A
nthu
rium
and
rean
um L
. va
r. Tr
opic
al
Fre
sh w
eigh
t re
tent
ion
(g)
4th
day
8th d
ay12
th d
ay
M1
M2
M3
M4
M5
F m
ean
M1
M2
M3
M4
M5
F m
ean
M3
M4
M5
F m
ean
F1
10.5
311
.84
13.7
314
.69
14.8
713
.13
4.59
6.93
13.2
712
.02
12.9
09.
9410
.97
10.8
811
.78
11.2
1F
212
.59
13.5
916
.08
15.7
316
.40
14.8
85.
837.
8013
.77
14.0
514
.30
11.1
512
.98
12.8
613
.34
13.0
6F
311
.73
12.0
413
.86
13.9
314
.73
13.2
64.
926.
7712
.96
13.3
712
.41
10.0
910
.75
12.0
512
.08
11.6
3F
412
.18
13.0
314
.34
14.0
515
.46
13.8
15.
617.
1511
.72
13.5
413
.51
10.3
111
.67
12.7
012
.78
12.3
8F
512
.21
13.1
715
.11
15.2
516
.07
14.3
65.
717.
5613
.60
13.6
713
.98
10.9
012
.80
12.8
813
.02
12.9
0M
mea
n11
.85
12.7
314
.62
14.7
315
.50
5.33
7.25
13.0
613
.33
13.4
211
.83
12.2
712
.60
S.E
m.±
C.D
. at
5%
S.E
m.±
C.D
. at
5%
S.E
m.±
C.D
. at
5%
M0.
080.
340.
040.
180.
100.
33F
0.14
0.58
0.02
0.09
0.10
0.31
MF
0.21
0.64
0.09
0.27
0.18
0.53
Tab
le 3
:E
ffect
of
grow
ing
med
ia a
nd p
rimar
y nu
trie
nts
on p
er c
ent
abso
lute
int
egrit
y of
cut
flo
wer
s of
Ant
huriu
m a
ndre
anum
L.
var.
Tro
pica
l.
Per
cen
t ab
solu
te i
nteg
rity
4th
day
8th d
ay12
th d
ay
M1
M2
M3
M4
M5
F m
ean
M1
M2
M3
M4
M5
F m
ean
M3
M4
M5
F m
ean
F1
18.3
823
.31
52.5
067
.93
69.7
546
.38
39.1
542
.76
30.5
247
.56
53.2
342
.64
17.2
628
.45
35.1
126
.94
F2
27.4
330
.16
78.7
482
.82
84.7
860
.79
50.3
053
.83
57.4
560
.50
65.0
157
.42
38.9
840
.80
41.8
840
.55
F3
20.2
424
.93
71.1
159
.73
71.6
349
.53
45.1
746
.63
49.8
846
.55
55.8
448
.81
29.3
632
.98
36.2
032
.84
F4
24.9
725
.86
62.6
277
.52
77.7
053
.74
45.6
947
.86
52.4
457
.66
59.9
452
.72
36.0
236
.14
36.4
936
.22
F5
25.7
227
.73
76.0
178
.19
79.5
757
.44
47.9
451
.61
54.8
457
.32
61.8
854
.72
37.5
537
.24
37.9
937
.59
M m
ean
23.3
526
.40
68.2
073
.24
76.6
945
.65
48.5
449
.02
53.9
259
.18
31.8
335
.12
37.5
4S
.Em
.±C
.D.
at 5
%S
.Em
.±C
.D.
at 5
%S
.Em
.±C
.D.
at 5
%M
1.20
4.74
0.93
3.06
0.39
1.00
F0.
512.
000.
732.
100.
732.
90M
F1.
354.
051.
654.
711.
153.
77

78
Tatte Sumathi, S. L. Chawla, Sudha Patil and Neelima Palagani
Similarly, this might be due to the internalcarbohydrate content of the flowers, which isresponsible for the vase life of flowers.
Effect of nutrients
Foliar application of 12:61:40 N:P:K @ 0.2%showed maximum total water uptake (33.02 ml)and vase life by 12.22 days. This treatment alsoincreased the fresh weight retention (14.88 g,11.15 g and 13.06 g), total soluble sugars (48.73mg/g, 42.93 mg/g and 49.00 mg/g), per centabsolute integrity (60.79, 57.42 and 40.55) on4th, 8th and 12th day of post harvest life,respectively. In general, maximum vase life wasobtained with the application of higher ratio ofpotassium. These results are in parallel line withresults obtained by the lower level of N andhigher level of K was found significantly betterthan the other treatments (Valsalakumari et al.2001 and Paull et al. 1992). Increasing thepotassium fertilization may improve the sugartransport in to flowers. Potassium enhances thetranslocation of sugars and starch, increasesprotein content of spathe tissue. Enhanced vaselife in these treatments can be attributed tohigher retention of fresh weight and sugars inspathe tissue. Higher nitrogen doses delayed theaccumulation of sugars decreases the vase life(Martin et al. 2004).
Interaction effect of media and nutrients
Combined application of coconut husk +charcoal media (3:1) and 12:61:40 NPK @ 0.2%nutrients significantly improved all post harvestparameters viz., maximum total water uptake(40.57 ml) and fresh weight retention (16.40 g,14.30 g and 13.34 g), total soluble sugars (60.54mg/g, 56.10 mg/g and 52.04 mg/g), per centabsolute integrity (84.78, 65.01 and 41.88) on4th, 8th and 12th day, respectively and vase life(14.24 days). Good flower quality from ofcoconut husk + charcoal media (3:1) and Ta
ble
4:
Effe
ct o
f gr
owin
g m
edia
and
prim
ary
nutr
ient
s on
tot
al s
olub
le s
ugar
s (m
g/g)
of
cut
flow
ers
in A
nthu
rium
and
rean
um L
. va
r. Tr
opic
al.
Tota
l so
lubl
e su
gars
(m
g/g)
4th
day
8th d
ay12
th d
ay
M1
M2
M3
M4
M5
F m
ean
M1
M2
M3
M4
M5
F m
ean
M3
M4
M5
F m
ean
F1
26.9
928
.56
43.5
347
.26
51.1
939
.51
18.5
522
.68
39.9
143
.25
45.9
434
.07
33.0
939
.33
42.2
238
.21
F2
32.6
238
.43
53.9
858
.09
60.5
448
.73
23.2
130
.96
49.3
355
.07
56.1
042
.93
43.7
951
.18
52.0
449
.00
F3
25.8
230
.78
44.1
047
.61
52.1
940
.10
19.8
922
.78
39.7
343
.74
47.7
934
.78
35.7
440
.39
43.1
839
.77
F4
26.6
032
.87
46.7
152
.67
54.2
042
.61
22.1
126
.17
43.3
050
.21
49.2
438
.21
38.4
446
.22
44.9
243
.19
F5
29.1
535
.82
49.4
054
.72
57.9
445
.40
23.9
125
.60
45.9
651
.79
54.0
040
.25
41.3
847
.66
50.0
246
.35
M m
ean
28.2
333
.29
47.5
452
.07
55.2
121
.53
25.6
443
.65
48.8
150
.62
38.4
944
.95
46.4
7S
.Em
.±C
.D.
at 5
%S
.Em
.±C
.D.
at 5
%S
.Em
.±C
.D.
at 5
%M
0.28
1.10
0.72
2.84
0.92
5.62
F0.
150.
580.
371.
.48
0.37
1.05
MF
0.29
0.87
0.62
1.87
0.67
1.89

79
Effect of growing media and primary nutrients on postharvest life of anthurium flowers
12:61:40 NPK @ 0.2% nutrients simultaneouslyincrease the water uptake as well as maximumretention of fresh weight and maintained percent absolute integrity obviously increases thetotal sugar content in spathe tissue. Maximumaccumulation of food material might be increasethe vase life of anthurium.
These conditions contributed to optimumcontinuation of the cell metabolism thatfacilitated cell growth and development,formation of cellular constituents and theliberation of energy for other cellular functions.Correlation of retained fresh weight and higherTSS with vase life was well established in cutflowers (Mayak and Halevy, 1974; Ho andNichols, 1975; Marousky, 1982).
ACKNOWLEDGEMENT
Authors are also thankful to Department ofScience and Technology for their financialsupport during the educational period to Ph.D.student Tatte Sumathi.
REFERENCES
Bik, R.A. 1976. Quality in Anthurium andreanum and
Aechmea fasciata grown in peat substrates asaffected by nitrogen and potassium nutrition. ActaHorticulturae, 64: 83-91.
Higaki, T. and Imamura, J.S. 1985. Volcanic black cinderas a medium for growing Anthurium. Hort Science,20: 298-300.
Ho, L.C. and Nichols, R. 1975. The role of phloemtransport in the translocation of sucrose along thestem of carnation cut flowers. Annals of Botany,(London), 39: 439-446.
Martin, P., Relgado, R., Gonzalez, M.R. and Gallegos,J.I. 2004. Colour of Tempranillo grapes as affectedby different nitrogen and potassium fertilizationrates. Proc. 1st International Symposium onGrapevine growing, commerce and research,Lisbon, Portugal. Acta Horticulturae, 652: 153-159.
Marousky, F.J. 1972. Water relations, effects of floralpreservatives on bud opening and keeping qualityof cut flowers. Hort Science, 7: 114-116.
Mayak, S. and Halevy, A.S. 1974. The action of kinetinin improving water balance and delayingsenescence process of cut rose flowers. PlantPhysiology, 50: 341-346
Paull, R.E., Higaki, T. and Imamura, J.S. 1992. Seasonand fertilization affect the post harvest flower lifeof anthurium. Scientia Horticulturae, 49:125-134.
Valsalakumari, P.K., Abdussamed K.P., Rajeevan, P.K.and Geeta C.K. 2001. Shade and nutrientmanagement in Anthurium andreanum. SouthIndian Horticulture, 49: 326-331.

80
M.R. Dhiman, Chander Parkash, S.S. Sindhu, Raj Kumar and Chandresh ChandelJournal of Ornamental Horticulture. 20 (1&2): 80-85, 2017
Determination of total phenolics and antioxidantcontent in lily bulb extracts
M.R. DHIMAN1, CHANDER PARKASH1, S.S. SINDHU2, RAJ KUMAR1 and CHANDRESH CHANDEL1
1ICAR-IARI, Regional Station, Katrain-175129, Himachal Pradesh2Division of Floriculture and Landscaping
ICAR-Indian Agricultural Research Institute, New Delhi-110012E-mail: [email protected]
ABSTRACT
Lilies are among the most economically important and widely cultivated floricultural cropsworldwide have great ornamental, medicinal and edible value. Bulbs of four Lilium species(L. regale, L. lancifolium, L. longiflorum, Lilium sp.), and five cultivars of different hybrid groups(namely Avocado, Tiara, Navona and Brunello were investigated with a view to their exploitationas a potential source of natural antioxidants due to their phenolic composition and dietary antioxidantpotential. Significant differences exists in the antioxidant capacity as well as in the total phenoliccontent of bulb extracts assayed via the FRAP (µ mol/g) and CUPRAC (µ mol/g) methods. Liliumregale had the highest phenolic content and the strongest antioxidant capacity followed by cultivarMother Choice, while Lilium lancifolium and cultivar Navona had the lowest phenolic contentsand the weakest antioxidant activity among the tested species and cultivars. The analysis revealeda significant positive correlation of total phenols with FRAP (0.957**), CUPRAC (0.923**) andFRAP with CUPRAC (0.930**). Hierarchical cluster analysis showed that L. regale belonged tothe group with high phenolic content and strong antioxidant power. The results indicate that lilybulbs are the good candidates for further development as nutraceutical supplements or antioxidantsremedies. Further studies should focus on the assessments of these extracts before their commercialexploitation.
Keywords: Lilium, bulb, phenolics content, ant-ioxidant capacity.
INTRODUCTION
The adverse effects of oxidative stress on humanhealth have become a serious issue. Oxidativestress has been implicated in over one hundredhuman disease conditions, such as cancer,cardiovascular disease, aging and neurode-generative diseases (Bagchi et al. 2000). Theantioxidant activety, plant phenols andpolyphenols content are very beneficial and playimportant roles in long term health and reductionin the risk of chronic and degenerative diseases.Recently, there is a growing interest in
substances from natural sources exhibitingantioxidant properties that can be used to protecthuman beings from oxidative stress damage(Kris-Etherton et al. 2002).
The role of antioxidant and polyphenols inhuman diet is well established (Deng et al.2013). About 5% or more oxygen is convertedto reactive oxygen species (ROS) such as O2-,H2O2 and OH by univalent reduction of O2. Freeradicals can cause oxidative damage to allbiomolecules and initiate a chain reactionwhich results in physiological damage. This

81
Determination of total phenolics and antioxidant content in lily bulb extracts
physiological damage can be repaired but mayalso accumulate over a period of time and causemany degenerative diseases (Ames et al. 1993).In humans, if not neutralized the free radicalsdamage various body cells (cell membrane,lipids, proteins, DNA and other cell structures)causing many degenerative diseases like ageing,heart disease, cancer, arthritis, loss of memory,paralysis etc. The role of antioxidants is toprotect all bio-molecules from the oxidativedamage of free radicals; therefore antioxidantscan delay the progress of degenerative diseases.Human body can produce few antioxidantsespecially many enzymatic systems (superoxidedismutase, catalase and glutathione peroxidase)and can obtain some low molecular weightantioxidants from foods, in particular vegetablesand fruits (vitamin C, vitamin E, carotenoidsand phenolic compounds), which can scavengesome reactive species (superoxide anion andhydrogen peroxide) and inhibit a chain reaction.
Phenolic compounds naturally occur in all plantmaterial, and are prominently ubiquitous infruits, vegetables, seeds, and herbs, but also inplant products, such as beverages, wine, cocoa(Bravo, 1998). These compounds are potentantioxidants and play an important role inhuman nutrition as preventative agents againstseveral diseases, protecting the body tissuesagainst oxidative stress (Ares et al. 2009). Asan important group of secondary metabolitespresenting in Lilium, phenolic compounds playan important role in the quality and nutritionvalue of lily species (Luo et al. 2012).
Lilies are among the most economicallyimportant and widely cultivated floriculturalcrops worldwide have great ornamental,medicinal and edible value. Lily bulbs have beenextensively used as both a food and a traditionalChinese medicine for many centuries in China,due to their health promoting properties to treatbronchitis, pneumonia and provide nourishment
(You et al. 2010). The knowledge of antioxidantcapacity in the plant is of significance, in termsof its usefulness in human health. However, littleinformation about the antioxidant activity ofphenolic compounds obtained from Liliumspecies/cultivars is available. Therefore, theobjective of this study was to evaluate thephenolic content and antioxidant capacity ofLilium species and hybrids which will providesufficient experimental evidence of antioxidantactivity and potential to develop elite edibleindigenous lily cultivars.
MATERIALS AND METHODS
Basic experimental material
All bulbs of Lilium species and cultivars werecollected from Sarasi Farm, IARI RegionalStation, Katrain, Kullu, HP, India. The bulbswere carries to the lab within a maximum of 6hours for experimentation and washed with coldwater. These were chopped, homogenized anda fresh sample of 5 g of each was storedimmediately under refrigerated conditions(-20°C) until assay. The 5 g sample was furtherhomogenized in 15 ml absolute ethanol toprepare the ethanol extract, which was furthercentrifuged at 10,000 rpm for 15 mins at 4degree to obtain the supernatant, which is thenstored at -20°C.
Antioxidant capacities and total phenolicassay
Measuring the antioxidant activity/capacity levelof plants is carried out for the meaningfulcomparison of the antioxidant content of severalplants. The parent CUPRAC (Cupric ReducingAntioxidant Capacity) method of antioxidantmeasurement, is based on the absorbancemeasurement of the Cu (I) - neucoproine (Nc)chelate formed as a result of the redox reactionof chain breaking antioxidants with theCUPRAC reagent, Cu (II) Nc where absorbance

82
M.R. Dhiman, Chander Parkash, S.S. Sindhu, Raj Kumar and Chandresh Chandel
is recorded at the maximal light absorptionwavelength of 450 nm; thus this is an electrontransfer (ET) based method. The methoddescribed by Apak et al. (2006) was followedwith minor modifications. For CUPRACanalysis, 100 µl samples were mixed with 4mlof CUPRAC reagent (1 ml of neucoproine; 1ml ammonium acetate; 1 ml copper chloride and1 ml distilled water; pH 7.4). Then theabsorbance was recorded at 450 nm inspectrophotometer.
Similarly, FRAP (Ferric Reducing Ability ofPlasma) was performed based on the proceduredescribed by Benzie and Strain (1999) withslight modifications. For this, 100 µl of thedistilled sample was added to 3 ml of the FRAPreagent and the reaction was monitored after 4mins at 593 nm. The results were expressed asµmol Fe (II)/g fresh weight of the sample.
Total phenolic contents were determined withFolin-Cicalteau method (Singleton and Rossi,1965). Modifications were done accordingly forthe amount of sample present. Briefly, 0.50 mlextract was mixed with 2.5 ml of 1:10 dilutedFolin-Cicalteau reagent. After 4 min, 2 ml ofsaturated sodium carbonate solution was added.The mixture was incubated in dark for 2 hoursat room temperature. The resulting complex wasmeasured at 760 nm at the spectrophotometerfor absorbance. Gallic acid was used as astandard for the calibration, and the results wereexpressed as mg of Gallic acid equivalents (mgGAE) per 100 g fresh weight (FW) of sample.
Statistical Analysis
All analyses were carried out using SPSSversion 16.0 for Windows. One-way analysis ofvariance (ANOVA) and Duncan's multiple rangetests were used to determine the significance ofthe difference among samples, with a signi-ficance level of 0.05. A two-tailed Pearson's
correlation test was processed to determine thecorrelations among means. Hierarchical clusteranalysis was used to group Lilium species.
RESULTS AND DISCUSSION
Phenolic compounds are widely distributed infruits, vegetables and cereals. Plants vary widelyboth in their phenolic composition and contentwhich are controlled both genetically andenvironmentally (Awika and Rooney, 2004). TheTPC of all samples tested in this study rangedfrom 193.69 to 1330.20 µg Gallic acid / gfw.The Lilium regale had the highest amount ofTPC followed by Lilium longiflorum andOriental hybrid lily cv. Mother Choice, whereasAsiatic hybrid lily cv. Navona had the lowestTPC (Fig. 1). Jin et al. (2012) also reportedhigher amount of TPC in Lilium regale bulbs.Compared with other species of the same family(Liliaceae) with lily, the TPC measured in thelily bulbs was greater than that in the onion andshallot, which were reported recently (Lu et al.2011). The difference of phenolic compositionmight explain the different antioxidant abilitiesof lily bulb extracts observed above. It can bealso speculated that phenolic compounds presentin the extracts may exert their antioxidantcapacity individually as well as synergistically.
The reducing power property indicates that theantioxidant compounds are electron donors andcan reduce the oxidized intermediates of thelipid peroxidation process. These methods focuson detecting the reducing ability of theantioxidant, mainly the reducing ability of ironand copper ions. Lilium regale bulbs exhibitedhighest antioxidant capacity viz. CUPRAC(20.8434 µmol trolox/g) followed by orientallily cv. Mother Choice (10.6599 µmol trolox/g)while, least was observed in Asiatic lily cv.Navona (1.311 µmol) while its counterpartFRAP was also highest in Lilium regale highest(1.49 µmol /g) as well as in cv. Mother Choice

83
Determination of total phenolics and antioxidant content in lily bulb extracts
(0.8425) (Fig. 1). These findings are inagreement with the findings of Jin et al. (2012).They reported that L. regale had possessed thestrongest (1,438.01 µmol TE/100 g dw) reducingactivity. Several researchers confirmed thatCUPRAC is coupled with gallic and chlorogenicacid content. Therefore, these phenolic acidswould make a certain contribution in the processof cupric reduction (Mustafa et al. 2008). Theresults in this study indicate that lily bulb couldbe a possible source of natural antioxidant foodsand also supply data to health professionals andfood policy makers in India for encouraging thepopulation to eat edible lily bulbs as well as,promoting the preservation of such Liliumspecies.
Correlation analysis was used to explore therelationships amongst the different antioxidantvariables measured for all bulb extracts of fourLilium species and five cultivars (Table 1). Theanalysis revealed a significant positivecorrelation of total phenols with FRAP(0.957**), CUPRAC (0.923**) and FRAP withCUPRAC (0.930**). These findings are in closeconformity with the findings of Jin et al. (2012).
Data on phenolic contents and antioxidantcapacity were used to carry out a cluster analysisof the Lilium species and cultivars. Ahierarchical cluster analysis has been shown inthe dendrogram constructed in Figure 2. Thevariations observed in the cluster means alsopoints out to the degree of variability and
Fig. 1: Contents of total phenols, CUPRAC and FRAP in bulb extractsfrom four Lilium species and five cultivars.
Table 1: Estimates of correlation coefficient for antioxidant activities among four lilium species and five cultivars.
Traits Total phenolics FRAP CUPRAC
Total phenolics 1.000 0.957** 0.923**FRAP 1.00 0.930**CUPRAC 1.000

84
M.R. Dhiman, Chander Parkash, S.S. Sindhu, Raj Kumar and Chandresh Chandel
divided the 4 species and 5 cultivars into threemajor groups A, B and C. The group Acomprised of one species i.e. Lilium regale,while group B accommodated three cultivars i.e.6, 9 and 8 (Tiara, Navona and Brunello). Themeanwhile group C was comprised of 3 speciesand 2 cultivars viz. 4, 5, 1, 3 and 7 (Lilium sp.,Avocado, Lilium lancifolium, Lilium longiflorumand Mother Choice), respectively.
The antioxidant activities and total andindividual phenolic contents of bulb extractsfrom four Lilium species and five cultivars werestudied. Significant difference exists in theantioxidant capacity as well as in the totalphenolic content of bulb extracts of Lilium.Overall, lily bulbs are good candidates forfurther development as nutraceuticalsupplements or antioxidant remedies. Futurestudies should focus on the assessments ofeconomic benefits and in vivo activities of theseextracts before their commercial exploitation.
REFERENCES
Ames, B.N., Shigenaga, M.K. and Hagen, T.M. 1993.Oxidants, Antioxidants, and the Degenerative
Fig. 2: Dendrogram showing clustering pattern of four Lilium species and five cultivars based on threequality traits constructed using complete linkage Euclidean distance method
Diseases of Aging. Proceedings of NationalAcademy of Science USA, 90: 7915-7922.
Apak, R., Güçlü, K., Özyürek, M., Esin Karademir, S.and Erça, E. 2006. The cupric ion reducingantioxidant capacity and polyphenolic content ofsome herbal teas. International Journal of FoodSciences and Nutrition, 57(5-6): 292-304.
Ares, G., Barreiro, C., Deliza, R. and Gámbaro, A. 2009Alternatives to reduce the bitterness, astringencyand characteristic flavour of antioxidant extracts.Food Research International, 42: 871-878.
Awika, J.M. and Rooney, L.W. 2004. Sorghumphytochemicals and their potential impact onhuman health. Phytochemistry, 65: 1199-1221.
Bagchi, D., Bagchi, M., Stohs, S.J., Das, D.K., Ray, S.D.,Kuszynski, C.A., Joshi, S.S. and Pruess, H.G.2000. Free radicals and grape seedproanthocyanidin extract: Importance in humanhealth and disease prevention. Toxicology, 148:187-197.
Benzie, I.F, and Strain, J.J. 1999. Ferric reducing/antioxidant power assay: Direct measure of totalantioxidant activity of biological fluids and modifiedversion for simultaneous measurement of totalantioxidant power and ascorbic acid concentration,Method Enzymology, 299: 15-27.
Bravo, L.1998. Polyphenols: Chemistry, dietary sources,metabolism, and nutritional significance. NutritionalReviews, 56: 317-333.
Deng, G.F., Lin, X., Xu, X.R., Gao, L.L., Xie, J.F. andLi, H.B. 2013. Antioxidant capacities and totalphenolic contents of 56 vegetables. Journal of

85
Determination of total phenolics and antioxidant content in lily bulb extracts
Functional Foods. 5: 260-266.
Jin, Lei ., Zhang , Yanlong., Yan Linmao., Guo,Yulong.and Niu, Lixin. 2012. Phenolic Compounds andAntioxidant Activity of Bulb Extracts of Six LiliumSpecies Native to China. Molecules, 17: 9361-9378
Kris-Etherton, PM., Hecker, K.D., Bonanome, A., Coval,S.M., Binkoski, A.E., Hilpert, K.F., Griel, A.E. andEtherton, T.D. 2002. Bioactive compounds in foods:their role in the prevention of cardiovasculardisease and cancer. American Journal of Medicine,113:71-88.
Lu, X.N., Wang, J., Al-Qadiri, H.M., Hamzah, M.A.Q.,Ross, C.F., Powers, J.R., Tang, J.M.and Rasco,B.A. 2011. Determination of total phenolic contentand antioxidant capacity of onion (Alliumcepa) andshallot (Allium oschaninii) using infraredspectroscopy. Food Chemistry, 129: 637-644.
Luo, J.G., Li, L. and Kong, L.Y. 2012. Preparativeseparation of phenylpropenoid glycerides from the
bulbs of Lilium lancifolium by high-speed counter-current chromatography and evaluation of theirantioxidant activities. Food Chemistry, 131: 1056-1062.
Mustafa, O., Burcu, B., Cubilay, G.and Resat, A.2008.Hydroxyl radical scavenging assay of phenolicsand flavonoids with a modifiedcupric reducingantioxidant capacity (CUPRAC) method usingcatalase for hydrogen peroxide degradation.Analytica Chimica Acta, 616: 196-206.
Singleton, V.L. and Rossi, J.A. 1965. Colorimetry of totalphenolics with phosphomolybdic-phosphotungsticacid reagents. American Journal of Enology andViticulture, 16(3): 144-158.
You, X., Xie, C., Liu, K. and Gu, Z. 2010. Isolation ofnon-starch polysaccharides from bulb of tiger lily(Lilium lancifolium Thunb) with fermentation ofSaccharomyces cerevisiae. CarbohydratePolymers, 81: 35-40.


Published in July, 2017Published by Secretary on behalf of Indian Society of Ornamental Horticulture,Division of Floriculture and Landscaping, Indian Agricultural Research Institute,
New Delhi-110012, Indiaand printed by Alpha Printers, WZ-35/C, Naraina Ring Road, New Delhi-110028, India
Mobile : 9810804196, E-mail : [email protected]