journal of pharmaceutical and biomedical...
TRANSCRIPT

Cg
NMa
b
a
ARAA
KBVRUAME
1
lbdmaioraa
2
(
h0
Journal of Pharmaceutical and Biomedical Analysis 126 (2016) 83–97
Contents lists available at ScienceDirect
Journal of Pharmaceutical and Biomedical Analysis
j o ur na l ho mepage: www.elsev ier .com/ locate / jpba
omparative assessment of bioanalytical method validationuidelines for pharmaceutical industry�
aveen Kadiana,1, Kanumuri Siva Rama Rajua,b,1, Mamunur Rashida,ohd Yaseen Malika, Isha Tanejaa,b, Muhammad Wahajuddina,b,∗
Department of Pharmacokinetics and Metabolism, CSIR-Central Drug Research Institute, Lucknow, IndiaAcademy of Scientific and Industrial Research, New Delhi, India
r t i c l e i n f o
rticle history:eceived 15 March 2016ccepted 24 March 2016vailable online 25 March 2016
eywords:ioanalysisalidationegulatory guidanceSFDANVISA
a b s t r a c t
The concepts, importance, and application of bioanalytical method validation have been discussed fora long time and validation of bioanalytical methods is widely accepted as pivotal before they are takeninto routine use. United States Food and Drug Administration (USFDA) guidelines issued in 2001 havebeen referred for every guideline released ever since; may it be European Medical Agency (EMA) Europe,National Health Surveillance Agency (ANVISA) Brazil, Ministry of Health and Labour Welfare (MHLW)Japan or any other guideline in reference to bioanalytical method validation. After 12 years, USFDAreleased its new draft guideline for comments in 2013, which covers the latest parameters or topicsencountered in bioanalytical method validation and approached towards the harmonization of bioana-lytical method validation across the globe. Even though the regulatory agencies have general agreement,significant variations exist in acceptance criteria and methodology. The present review highlights the
HLWMA
variations, similarities and comparison between bioanalytical method validation guidelines issued bymajor regulatory authorities worldwide. Additionally, other evaluation parameters such as matrix effect,incurred sample reanalysis including other stability aspects have been discussed to provide an easeof access for designing a bioanalytical method and its validation complying with the majority of drugauthority guidelines.
© 2016 Published by Elsevier B.V.
. Introduction
The word “Bioanalytics” refers to the analysis of the desired ana-yte in biological fluids. In the present pharmaceutical industry, theioanalytical methods are playing a crucial role in the quantitativeetermination of low molecular weight drug molecules and macro-olecules. The quantitative determination leads to the evaluation
nd interpretation of pharmacokinetic, bioavailability, drug–drugnteraction, bioequivalence and compatibility studies. Validationf any analytical method ensures that the developed method is
eproducible, stable, sensitive, robust, suitable and reliable for itspplication in blood, plasma, urine, serum and faeces analysis. Bio-nalytical validation ensures the high-quality data for regulatory� CDRI communication No. 9211.∗ Corresponding author at: CSIR-Central Drug Research Institute, Lucknow26031, Uttar Pradesh, India.
E-mail addresses: [email protected], [email protected]. Wahajuddin).
1 These authors contributed equally to this work.
ttp://dx.doi.org/10.1016/j.jpba.2016.03.052731-7085/© 2016 Published by Elsevier B.V.
submission as well as for the drug discovery and development.The history of bioanalytical method validation was identified glob-ally in 1990, in a workshop sponsored by United States Food andDrug Administration (USFDA) and American Association of Phar-maceutical Sciences (AAPS) with an objective to harmonize themethod validation principles. USFDA released the first guideline forthe bioanalytical method validation in May 2001. National HealthSurveillance Agency (ANVISA), Brazil released its first bioanalyticalguidelines in May 2003 in combination with analytical validationguidelines, which were further amended in May 2012. EuropeanMedicines Agency (EMA, European authority) issued its guidelineswhich became effective since February 2012. Ministry of Health,Labour and Welfare (MHLW), Japan in 2013 issued its draft guid-ance for low molecular weight drugs and bioanalytical method(ligand binding assay) validation in pharmaceutical development.Although there is a general understanding between regulatoryauthorities worldwide on the evaluation of validation parameters,
still there are some differences in the methodology and acceptancecriteria employed for bioanalytical method validation. These varia-tions in the guidelines are important for the regulatory submissionin the specific region or country. The present review discusses the
8 cal and
mt
1
vAAibapsmaactepigamtpotttwcaLGdellfawa[ttwtftwaatmoetvamgfbs
4 N. Kadian et al. / Journal of Pharmaceuti
ost widely followed guidelines for bioanalytical method valida-ion along with their acceptance criteria on different parameters.
.1. Introduction to the guidelines
USFDA (2001) bioanalytical method validation guidelines pro-ide assistance to sponsors for Investigational New Drug (IND)pplication, New Drug Application (NDA), Abbreviated New Drugpplication (ANDAs) and supplements for development and val-
dation of bioanalytical methods used in clinical pharmacology,ioavailability and bioequivalence studies. The guideline is alsopplicable to the bioanalytical methods used for non-clinicalharmacology/toxicology studies and preclinical studies in blood,erum, plasma, urine, tissues and skin samples by using gas chro-atography (GC), high-pressure liquid chromatography (HPLC),
nd combination of GC and LC with mass spectroscopy (MS) suchs GC–MS, GC–MS/MS, LC–MS and LC–MS/MS. However, in thease of veterinary drug approval, the guidance is applicable onlyo blood and urine samples. The draft guidance issued in 2013xtended its scope for Biological Licence Application (BLAs) androvided assistance for developing bioanalytical method validation
nformation for biomarker concentration evaluation [1]. The EMAuidance applies to bioanalysis in animal toxicological studies andll phases of clinical trials, along with providing validation recom-endation for ligand binding assay. EMA kept the methods used for
he quantitative determination of biomarkers in the assessment ofharmacodynamic endpoints out of its scope [2]. However, if any-ne looks closely at the guidelines, then one can easily understandhat the guidelines are basically based on the Good Laboratory Prac-ices (GLP), but still USFDA guidance lacks the recommendation forhe performance of bioanalytical method validation in complianceith GLP, whereas EMA has recommended performing bioanalyti-
al methods used in non-clinical pharmaco-toxicological studies ingreement with the principles of GLP, but not mandatorily [1–3].ikewise, ANVISA is also limited to the bioanalytical methods usingC, HPLC and their combination with MS used for the quantitativeetermination of drugs in blood, serum, plasma and urine. ANVISAxtended its applicability to other matrices also which has beenacking in the other guidelines [4]. Its amendment has been pub-ished in 2012, which extended its scope and provided new criteriaor validation of analytical procedure [5]. Japan’s MHLW provided
draft for two separate guidelines for small and large moleculareight drugs, respectively and the guidelines are not restricted to
specific detector or analytical technique unlike earlier guidelines6]. Full validation is recommended by all the regulatory authori-ies for the new chemical entity and when the method is applied forhe first time whether or not mentioned in the literature and alsohen the metabolites are added to an existing assay for quantifica-
ion [1–5]. Additionally, EMA and MHLW guidelines recommend forull validation for each species and matrix which is seen lacking inhe USFDA guidance [2,6]. Partial validation is generally conductedith an aim to demonstrate the maintenance of the performance
nd reliability of the method when minor changes are made to validated bioanalytical method which includes but not limitedo transferring of method to another laboratory; change in equip-
ent, calibration range, limited sample volume, another matrixr species; change in anticoagulant, sample processing proceduretc. The changes should be notified, and also, the partial valida-ion should be justified [1,7,8]. Cross-validation is required for thealidation parameters when two or more bioanalytical methodsre used to generate data within the same study from differentethods or different laboratories and across different studies. EMA
uides the accuracy to be within ±15% and may be wider, if justifiedor QC samples and the difference between the two values shoulde within ±20% of the mean for at least 67% of the repeats for studyamples [2]. MHLW too kept the same criteria with additional con-
Biomedical Analysis 126 (2016) 83–97
sideration to intra-and inter-laboratory precision [6]. USFDA andANVISA lack detailed information or acceptance criteria for cross-validation [1,3–5].
2. Chromatographic methods
2.1. Reference standards
USFDA draft guidance (2013) in addition to USFDA (2001) guid-ance recommends the characterization of Internal Standard (IS) andanalyte including the certificate of analysis and in case of expira-tion of IS or reference standard (RS), the stock solution made fromthe expired lot should not be used unless purity is re-established[1,3]. EMA does not recommend the requirement of a certificate ofanalysis for IS-certified standard, as long as it’s suitability for use isdemonstrated [2]. MHLW recommends the demonstration of lackof analytical interference with the analyte before the use of IS [6].ANVISA recommends the use of IS and RS which is made officialby Pharmacopeia or any other code and in the absence of refer-ence standard, studies using secondary standard will be admittedprovided with certification is proved [4].
2.2. Bioanalytical method validation
2.2.1. SelectivitySpecificity and selectivity are two interchangeable terms used
in validation. In spite of both terms having same literal meaning,it is important to understand the difference. Specificity describesthe ability of the bioanalytical method to produce a signal onlyfor the analyte of interest and not for other interfering compo-nents. Whereas, selectivity describes the ability of a method todifferentiate analyte of interest from other analytes or endogenousimpurities present in samples [9,10]. While LC–MS/MS bioanalyt-ical methods are considered to be specific and HPLC with otherdetection methods are considered selective [10]. Generally, the pro-cedure followed for the evaluation of selectivity is to compare theresponse of an analyte in the biological sample at the lower limitof quantification (LLOQ) with blank matrix sample. It is recom-mended to take blank matrix from at least six different sourcesand compare it with the spiked LLOQ in the matrix. ANVISA ini-tially added the requirement of proving specificity in four normal,one haemolysed and one lipemic biological matrix which was fur-ther limited to matrices other than whole blood, for which fivestandard and a lipemic sample are recommended [4,5]. There is alack of acceptance criteria in USFDA guidance, but other guidelineshave provided their acceptance criteria which have been stated inTable 1. Additionally, ANVISA also suggested that if one or moresamples show interference above the limits, new samples of at leastsix other different sources should be tested and if one or more sam-ples of the second group show interference above the limits, themethod should be changed in order to eliminate it [4,5]. EMA addi-tionally suggested investigating the extent of interference causedby the metabolites of the drugs, interferences from degradationproducts and interferences from possible co-administered med-ications. Also, the possibility of back-conversion of a metaboliteinto parent during the successive steps of analysis should be eval-uated when relevant and in the case when it is difficult to obtainthe metabolites of interest, the back-conversion can be checked byapplying incurred sample reanalysis [2].
2.2.2. Accuracy, precision and recoveryAccuracy of any bioanalytical method depends on the close-
ness between observed and true value of concentration, expressedeither as % bias or % nominal, determined using quality control sam-ples prepared at concentration levels covering the dynamic rangeof the method i.e. lower limit of quantification (LLOQ), low quality

N. Kadian et al. / Journal of Pharmaceutical and Biomedical Analysis 126 (2016) 83–97 85
Table 1Comparison of validation parameter “Selectivity/Specificity” [1–6].
Selectivity USFDA guidelines forBMV (2001)
USFDA draft guidelinesfor BMV (2013)
ANVISA guidelines forBMV (2003, 2012)
MHLW guidelines forBMV (2013)
EMA guidelines forBMV (2011)
Definition Ability of an analyticalmethod to differentiateand quantify theanalyte in the presenceof other components inthe sample
Ability of an analyticalmethod to differentiateand quantify theanalyte in the presenceof other components inthe sample
Ability of the methodto distinguish andquantify the analyteand IS in the presenceof other samplecomponents
Ability of an analyticalmethod to measureand differentiate theanalyte and the IS inthe presence of othercomponents in samples
Ability of thebioanalytical methodto measure anddifferentiate theanalyte(s) of interestand IS in the presenceof components whichmay be expected to bepresent in the sample
Method Analysis of blanksamples of appropriatebiological matrix(plasma, urine or othermatrix) obtained fromat least six sources
Analysis of blanksamples of appropriatebiological matrix(plasma, urine or othermatrix) obtained fromat least six sources
Samples of thebiological matrixobtained from sixindividual must beanalyzed, includingfour normal samples, alipemic sample and ahaemolysed sample.In case of whole blood,five standards and alipemic sample isrecommended
Evaluated using blankmatrix samplesobtained from at least6 individual sources,the absence of eachanalyte and IS shouldbe confirmed
Selectivity should beprovided using at least6 individual sources ofmatrix, use of fewersources is acceptable incase of rare matrices
Acceptance criteria Not Specified Not Specified Response of interferingpeak at the retentiontime should be lowerthan 20% of theresponse of LLOQstr
Response of interferingcomponents shouldnot be higher than 20%of the response of LLOQfor analyte and not
Response of interferingcomponent should beless than 20% responseof the LLOQ for theanalyte and 5% of the IS
ctLpLlood(omofiw
%
sirwmauriteptoams
ontrol (LQC), middle quality control (MQC), and high quality con-rol (HQC). LLOQ is prepared at the lower limit of quantification;QC is above LLOQ but not more than 3 times of LLOQ. MQC is pre-ared in the midway of dynamic range, ideally should be mean ofQC and HQC. The HQC samples are prepared closer to the upperimit of quantification (ULOQ) and should not be more than 80–85%f ULOQ. Each accuracy batch usually contains one blank sample,ne zero sample and calibration standards i.e. LLOQ and ULOQ inuplicates followed by five or six sets of quality control samplesLLOQ, LQC, MQC and HQC). The accuracy should be determinedn a single day and multiple days. Precision of any bioanalyticalethod is its ability to produce reproducible results between series
f measurements from homogenous samples, expressed as % coef-cient of variation (%CV) or % relative standard deviation (%RSD)hich can be calculated using following formula:
RSD = SDMean concentration
× 100
The guidelines define accuracy and precision in their words astated in Table 2. While USFDA lacks in elaborating the exper-mental conduct of between-run accuracy and precision, otheregulatory agencies have clearly mentioned the use of at least 3 runshich are compared in Table 2. Recovery of a bioanalytical methodeasures the efficiency of the extraction procedure within a vari-
tion limit. 100% recovery is desirable, but acceptability dependspon guidelines issued by various drug regulatory agencies. Higherecovery indicates efficient extraction procedure, higher sensitiv-ty and accuracy of the bioanalytical method. Higher recovery orhe extraction efficiency can be achieved by optimization of pH,xtraction procedures and combination of extraction solvents. TheH is used by the nature of drug and its binding efficiency withhe matrix or plasma proteins and also the chemical properties
f the drug. Based on the chemical properties of the moleculend the matrix, different extraction procedures are applied whichainly include protein precipitation, liquid–liquid extraction andolid phase extraction. Recovery can be classified into absolute and
amples and lowerhan 5% of the ISesponse
higher than 5% for theIS
response
relative recoveries [11]. Relative recovery is determined by thecomparison of analyte response obtained from extracted biologicalsamples to that of spiked analyte in the extracted blank matrix atthe same concentration. Absolute recovery is determined by com-paring analyte response obtained in extracted samples with analyteresponse in neat aqueous solutions prepared at the same concen-tration. The relative recovery represents the ‘matrix effects’ andits importance during method development will be highlighted inthe upcoming subsections [10]. The absolute recovery of the ana-lyte during method validation should be determined at least atthree concentration levels viz., LQC, MQC and HQC, respectivelyusing, at least, five replicates of each. Once the absolute recover-ies have been determined, overall recovery and %CV of all absoluterecoveries should be calculated and the overall %CV less than 20%indicate the consistency and reproducibility of recoveries over thedynamic range. The recovery for IS should be determined at itsworking concentration. While EMA does not define or provideany recommendation regarding recovery, other guidelines suggestdetermining the recovery in study samples or assay of the analyte.USFDA defines recovery as the detector response obtained froman amount of the analyte added to and extracted from the biolog-ical matrix, compared to the detector response obtained for thetrue concentration of the pure authentic standard. In contrast tothe earlier USFDA guidance document, the draft guideline also rec-ommends that the recovery experiments should be performed incomparison with unextracted standards that represent 100% recov-ery [1,3]. EMA does not consider recovery at all [2]. The comparisonin methodology and acceptance criteria is mentioned in Table 2.
2.2.3. Calibration/linearity curveThe linearity or concentration–response of an analytical method
refers to the ability of the method to produce a signal, which is
either directly or by mathematical transformation, proportionalto the concentration of the analyte present in the sample. It isgenerally recommended to analyse a minimum of six calibrationconcentration levels, a blank sample (matrix sample processed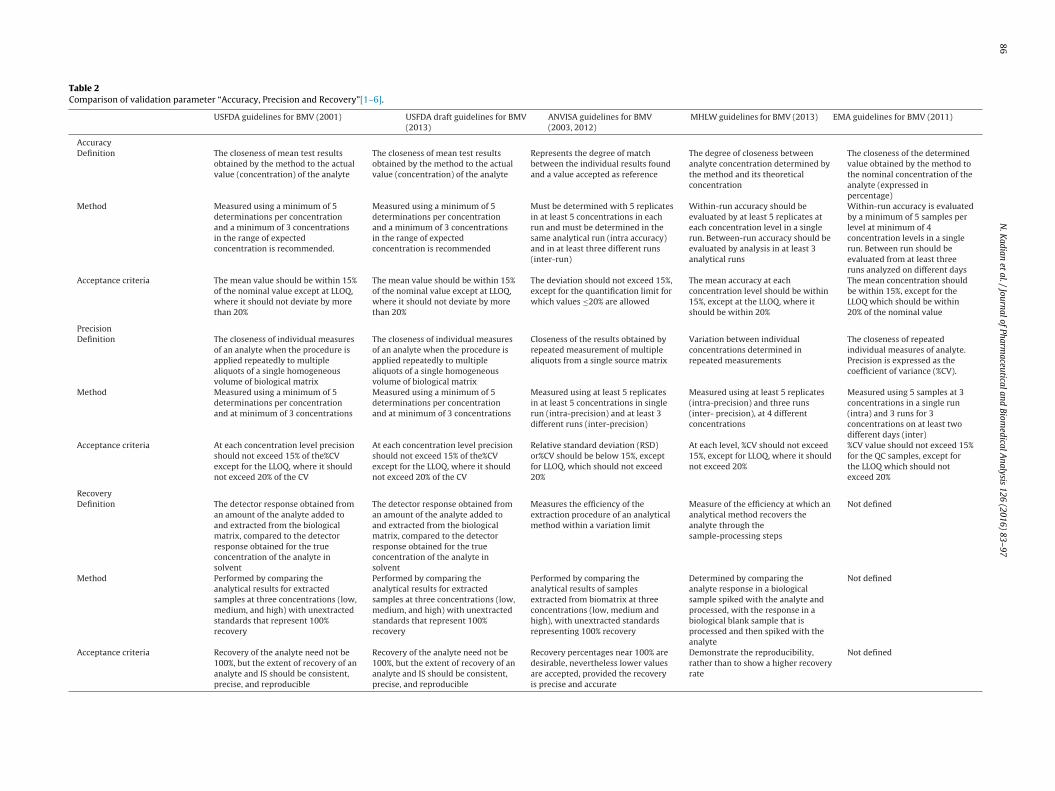
86
N.
Kadian
et al.
/ Journal
of Pharm
aceutical and
Biomedical
Analysis
126 (2016)
83–97
Table 2Comparison of validation parameter “Accuracy, Precision and Recovery”[1–6].
USFDA guidelines for BMV (2001) USFDA draft guidelines for BMV(2013)
ANVISA guidelines for BMV(2003, 2012)
MHLW guidelines for BMV (2013) EMA guidelines for BMV (2011)
AccuracyDefinition The closeness of mean test results
obtained by the method to the actualvalue (concentration) of the analyte
The closeness of mean test resultsobtained by the method to the actualvalue (concentration) of the analyte
Represents the degree of matchbetween the individual results foundand a value accepted as reference
The degree of closeness betweenanalyte concentration determined bythe method and its theoreticalconcentration
The closeness of the determinedvalue obtained by the method tothe nominal concentration of theanalyte (expressed inpercentage)
Method Measured using a minimum of 5determinations per concentrationand a minimum of 3 concentrationsin the range of expectedconcentration is recommended.
Measured using a minimum of 5determinations per concentrationand a minimum of 3 concentrationsin the range of expectedconcentration is recommended
Must be determined with 5 replicatesin at least 5 concentrations in eachrun and must be determined in thesame analytical run (intra accuracy)and in at least three different runs(inter-run)
Within-run accuracy should beevaluated by at least 5 replicates ateach concentration level in a singlerun. Between-run accuracy should beevaluated by analysis in at least 3analytical runs
Within-run accuracy is evaluatedby a minimum of 5 samples perlevel at minimum of 4concentration levels in a singlerun. Between run should beevaluated from at least threeruns analyzed on different days
Acceptance criteria The mean value should be within 15%of the nominal value except at LLOQ,where it should not deviate by morethan 20%
The mean value should be within 15%of the nominal value except at LLOQ,where it should not deviate by morethan 20%
The deviation should not exceed 15%,except for the quantification limit forwhich values ≤20% are allowed
The mean accuracy at eachconcentration level should be within15%, except at the LLOQ, where itshould be within 20%
The mean concentration shouldbe within 15%, except for theLLOQ which should be within20% of the nominal value
PrecisionDefinition The closeness of individual measures
of an analyte when the procedure isapplied repeatedly to multiplealiquots of a single homogeneousvolume of biological matrix
The closeness of individual measuresof an analyte when the procedure isapplied repeatedly to multiplealiquots of a single homogeneousvolume of biological matrix
Closeness of the results obtained byrepeated measurement of multiplealiquots from a single source matrix
Variation between individualconcentrations determined inrepeated measurements
The closeness of repeatedindividual measures of analyte.Precision is expressed as thecoefficient of variance (%CV).
Method Measured using a minimum of 5determinations per concentrationand at minimum of 3 concentrations
Measured using a minimum of 5determinations per concentrationand at minimum of 3 concentrations
Measured using at least 5 replicatesin at least 5 concentrations in singlerun (intra-precision) and at least 3different runs (inter-precision)
Measured using at least 5 replicates(intra-precision) and three runs(inter- precision), at 4 differentconcentrations
Measured using 5 samples at 3concentrations in a single run(intra) and 3 runs for 3concentrations on at least twodifferent days (inter)
Acceptance criteria At each concentration level precisionshould not exceed 15% of the%CVexcept for the LLOQ, where it shouldnot exceed 20% of the CV
At each concentration level precisionshould not exceed 15% of the%CVexcept for the LLOQ, where it shouldnot exceed 20% of the CV
Relative standard deviation (RSD)or%CV should be below 15%, exceptfor LLOQ, which should not exceed20%
At each level, %CV should not exceed15%, except for LLOQ, where it shouldnot exceed 20%
%CV value should not exceed 15%for the QC samples, except forthe LLOQ which should notexceed 20%
RecoveryDefinition The detector response obtained from
an amount of the analyte added toand extracted from the biologicalmatrix, compared to the detectorresponse obtained for the trueconcentration of the analyte insolvent
The detector response obtained froman amount of the analyte added toand extracted from the biologicalmatrix, compared to the detectorresponse obtained for the trueconcentration of the analyte insolvent
Measures the efficiency of theextraction procedure of an analyticalmethod within a variation limit
Measure of the efficiency at which ananalytical method recovers theanalyte through thesample-processing steps
Not defined
Method Performed by comparing theanalytical results for extractedsamples at three concentrations (low,medium, and high) with unextractedstandards that represent 100%recovery
Performed by comparing theanalytical results for extractedsamples at three concentrations (low,medium, and high) with unextractedstandards that represent 100%recovery
Performed by comparing theanalytical results of samplesextracted from biomatrix at threeconcentrations (low, medium andhigh), with unextracted standardsrepresenting 100% recovery
Determined by comparing theanalyte response in a biologicalsample spiked with the analyte andprocessed, with the response in abiological blank sample that isprocessed and then spiked with theanalyte
Not defined
Acceptance criteria Recovery of the analyte need not be100%, but the extent of recovery of ananalyte and IS should be consistent,precise, and reproducible
Recovery of the analyte need not be100%, but the extent of recovery of ananalyte and IS should be consistent,precise, and reproducible
Recovery percentages near 100% aredesirable, nevertheless lower valuesare accepted, provided the recoveryis precise and accurate
Demonstrate the reproducibility,rather than to show a higher recoveryrate
Not defined

N. Kadian et al. / Journal of Pharmaceutical and Biomedical Analysis 126 (2016) 83–97 87
Table 3Comparison of validation parameter “Calibration Curve/Linearity Standard”[1–6].
Linearity USFDA guidelines forBMV (2001)
USFDA draft guidelinesfor BMV (2013)
ANVISA guidelines forBMV (2003, 2012)
MHLW guidelines forBMV (2013)
EMA guidelines forBMV (2011)
Definition Relationship betweeninstrument responseand knownconcentrations of theanalyte
Relationship betweeninstrument responseand knownconcentrations of theanalyte
Represents therelationship betweenthe response of theinstrument and theknown concentrationof the analyte
A calibration curvedemonstrates therelationship between atheoreticalconcentration and aresponse of an analyte
Relationship which cansimply and adequatelydescribe the responseof the instrument withregard to theconcentration ofanalyte
Method Should consist of ablank sample, a zerosample, and 6–8non-zero samplescovering the expectedrange, including LLOQ
Should consist of ablank sample, a zerosample and at least 6non-zero covering theexpected range,including LLOQ
Should include theanalysis of a blanksample, zero sampleand at least 6 non-zerosamples includingLLOQ, containing drugstandard and IS
Should contain a blanksample, a zero sample,and at least 6concentration levels ofcalibration standards,including an LLOQsample
A minimum of 6concentration levels,along with a blanksample and a zerosample in replicate
Acceptance criteria LLOQ: 5 times theresponse compared toblank response andwith a precision of 20%and accuracy of80–120%Calibration curve: 20%deviation of the LLOQfrom nominalconcentration and 15%deviation of standardsother than LLOQ fromnominal concentration
LLOQ response shouldbe ≥5 times theresponse to blankresponse and precisionshould be below 20% ofthe CV and accuracywithin ±20%, ULOQshould have precisionbelow 15% of CV andaccuracy within ±15%of the nominalconcentration. Forcalibration curve, thestandard should bebelow 15% of nominalconcentration, exceptfor LLOQ wherecalibrator should notdeviate by 20% and 75%
Deviation less than orequal to 20% and 15% inrelation to the nominalconcentration of LLOQand otherconcentrations,respectively. At least 4of the 6 concentrationsmust comply includingLLOQ and ULOQ, the R2
must be equal to orhigher than 0.98.
The accuracy of backcalculatedconcentrations of eachcalibration standardshould be within ±20%deviation of thetheoreticalconcentration at theLLOQ, or ±15%deviation at all theother levels.At least 75% of thecalibration standards,with a minimum of 6levels, including theLLOQ and the highestlevels, should meet theabove criteria
The back calculatedconcentrations of thecalibration standardsshould be within ±15%of the nominal value,except for the LLOQ forwhich it should bewithin ±20%. At least75% of the calibrationstandards, with aminimum of sixcalibration standardlevels, must fulfil thiscriterion.In case replicates areused, the criteriashould also be fulfilledfor at least 50% of thecalibration standards
w(lwasalcArootatacbmplqloteslm
of non-zero includingLLOQ should be withinlimit
ithout drug standard and internal standard) and a zero samplematrix sample processed with internal standard) in the same bio-ogical matrix as the samples in the study by spiking the matrix
ith known amount of analyte. Once the response (Y) is obtainedt various concentration levels (X) of calibration standards, a leastquare regression analysis is performed assuming the errors in Yre normally distributed around a mean value of zero. Once theeast regression equation is obtained, statistical tests such as t-testan be used as an indicative of the accuracy of the method [10,12].n increase or decrease in error variance with concentration rep-esents heteroscedasticity and a weighted linear regression basedn the relative error (%RE) at all concentration levels is preferredver ordinary regression [10,13]. ANVISA recommends the use ofhe simple mathematical model i.e. linear model for the evaluationnd in case any non-linear model is proposed, and then it musto show mathematically that the linear model is not appropriate,nd the model should include at least 8 samples of different con-entrations on the calibration curve (CC) [5]. The assay range inioanalytical methods is higher in comparison to other analyticalethods. Hence, accuracy at lower points is either over or under the
redicted [10,13]. Even though the bioanalytical methods exhibit ainear relationship between concentration and response, complexuadratic equations can be chosen when the range of the bioana-
ytical method is extremely high. The LLOQ should be at least 10%f the expected maximum concentration point in the concentra-ion time profile (Cmax), and ULOQ should be at least 2 times thexpected C value. Regression coefficient (R2) > 0.98 is generally
maxufficient, but it has been highlighted that statistical tests such asack-of-fit may enhance confidence in the selected mathematical
odels as R2 is a poor indicator of linearity [14]. The procedure for
tested perconcentration level
rejection of calibration standard is only highlighted in EMA guide-lines; the comparison of methodology and acceptance criteria ismentioned in Table 3.
2.2.4. Sensitivity/detection limitSensitivity or detection limit of a bioanalytical method is the
lowest concentration of analyte which can be determined withacceptable accuracy and precision [10]. In contrast to the earlierguidance, USFDA provided a definition of sensitivity in its draftguidance. The sensitivity of a bioanalytical method is expressed atthe LLOQ, which is defined as the lowest concentration of an analyteat which the analyte can be quantified with reliable accuracy andprecision. In case of instrumental method, the detection limit canbe estimated based on the ratio of 3 times the noise of the baselineusing the following equation:
Detection Limit = SD × 3Slope of calibration curve
where, SD is the standard deviation of the intercept with the Y axisof at least 3 calibration curves containing concentrations of the drugclose to the presumed quantification limit.
The quantitation limit is expressed as concentration of analytein sample which can be represented by the following equation:
SD × 10
Quantitation Limit =Slope of calibration curve
The comparison in definition, methodology and acceptance criteriafrom different regulatory agencies is discussed in Table 4.

88 N. Kadian et al. / Journal of Pharmaceutical and Biomedical Analysis 126 (2016) 83–97
Table 4Comparison of validation parameter “Sensitivity/Detection Limit/Lower limit of quantification”[1–6].
Sensitivity/DetectionLimit/LLOQ
USFDA guidelines forBMV (2001)
USFDA draft guidelinesfor BMV (2013)
ANVISA guidelines forBMV (2012)
MHLW guidelines forBMV (2013)
EMA guidelines forBMV (2011)
Definition The lowest amount ofan analyte in a samplethat can bequantativelydetermined withsuitable precision andaccuracy
Lowest analyteconcentration that canbe measured withacceptable accuracyand precision
Lowest concentrationof an analyte that thebioanalyticalprocedure candistinguish reliablyfrom the background
Lowest concentrationof an analyte at whichthe analyte can bequantified with reliableaccuracy and precision
Lowest concentrationof analyte in a samplewhich can bequantified reliably,with an acceptableaccuracy and precision
Method Establish LLOQ using atleast five samplesindependent ofstandards anddetermine%CV orconfidence interval
Establish LLOQ using atleast five samplesindependent ofstandards anddetermine%CV orconfidence interval
At least fivedeterminations shouldbe carried out at LLOQ.Establish detectionlimit by analysingsolutions of known anddecreasingconcentrations of thedrug up to detectablelevel
LLOQ should beadapted to expectedconcentration in thestudy
LLOQ should beadapted to expectedconcentration in thestudy and LLOQ shouldbe established using aminimum of fivedeterminations
Acceptance criteria Should be at least 5times the responsecompared to blankresponse. LLOQ analytepeak (response) shouldbe identifiable, discreteand reproducible witha precision of 20% and
Should be at least 5times the responsecompared to blankresponse. LLOQ analytepeak (response) shouldbe identifiable, discreteand reproducible witha precision of 20% and
Ratio of 5:1 betweensignal to noise shouldbe obtained andresponse to LLOQshould be at least 5times greater than theinterference in blanksamples. Peak shouldbpa
Analyte response at theLLOQ should be at least5 times the response ofthat in a blank sample.Mean accuracy andprecision at LLOQshould be within ± 20%deviation of the
Analyte signal shouldbe at least 5 times thesignal of a blanksample and theaccuracy at LLOQshould be within80–120% withprecision ≤20%
2
tstaattyouioehgooapabdciessfibnspb
accuracy of 80–120% accuracy of 80–120%
.2.5. StabilityStability has always been considered as an important parame-
er during analysis both chemically and biologically (the chemicaltability of a drug is a function of its physicochemical properties),he stability in method validation should reflect situations whichre likely to be encountered during study sample handling andnalysis. The main aim of evaluating stability in method valida-ion is to detect any degradation of the analyte of interest duringhe entire period of sample collection, storage, extraction and anal-sis. It is recommended to confirm stability at each and every stepf sample preparation and analysis, as well as in the conditionssed for the long term storage. It should be noted that stability
n a particular matrix and container should not be extrapolated tother matrices and container systems. Stability procedures shouldvaluate the stability of the analytes during sample collection andandling, after short-term storage, long-term storage, and afteroing through freeze and thaw cycles. Regulatory authorities rec-mmend freeze-thaw stability, short-term temperature stabilityr bench top stability, long-term stability, stock solution stabilitynd post-operative stability to be performed using a set of samplesrepared from a freshly made stock solution of the analyte in theppropriate analyte-free biological matrix. Stability samples shoulde compared with freshly made calibrators and freshly made stan-ard solutions, at least three replicates of each of the low and highoncentrations of analyte should be assessed. In the case of work-ng solutions of the analyte and IS the stability of stock should bevaluated at room temperature over a short period and intendedtorage conditions for long periods. Stability of stock of workingtandard should be assessed by comparing with dilutions preparedreshly. In spite of the requirement of stability studies in bioanalyt-cal method validation, EMA guidelines lack any specific procedure,ut USFDA and ANVISA have provided a specific methodology. Also,o specifications are provided for acceptance of stock or working
olution stability, 85–115% accuracy in comparison to freshly pre-ared solutions is deemed to be acceptable by all the regulatoryodies.e identifiable withrecision of 20% andccuracy of 80–120%
nominal concentrationand not more than 20%,respectively
2.2.5.1. Freeze-thaw stability. Freeze-thaw stability studies areconducted to investigate the influence of repeated freezing andthawing on the stability of the analyte of interest and to ensure theintegrity of the drug. In some cases, it has been seen that freezingof samples can cause loss of analyte due to various reasons such asadsorption of an analyte to precipitated plasma proteins, crystalli-sation from urine or other reasons [15]. From practical standpointalso, it is often necessary to subject samples to multiple freeze-thawcycles as it may include failed analytical runs or the use of incor-rect dilution factors [16]. The comparison between the freeze-thawstability among different guidelines is discussed in Table 5.
2.2.5.2. Bench-top or short-term stability. Short-term stability,which is also referred to as a process or bench-top stability, is eval-uated to confirm whether there is any degradation or instabilityof samples during the preparation/extraction steps prior to anal-ysis [16]. It is advisable to cover the entire time taken for samplework-up and evaluation, upto 6 h is considered to be sufficient formost of the sample preparation procedure, but some guidelinesrecommend covering 2–24 h stability [10,16]. All the guidelines rec-ommend covering, at least three samples at room temperature orthe same condition which are used for the sample preparation dur-ing analysis. The detailed comparison between these guidelines ismentioned in Table 5.
2.2.5.3. Long-term stability. Long-term stability assessment isdesigned to confirm the stability of analyte in the test systemmatrix covering the length of time from sample collection to sampleanalysis [16]. The main objective of performing long-term stabil-ity is to examine whether the analyte is stable in the biologicalmatrix and whether any matrix degradation occurs which mayinterfere with the analytical method performance [15,17]. It is crit-ical that quantitation of stability samples should be made against
freshly spiked calibration standards. It is recommended that thematrix standards against which frozen and then thawed samplesare quantitated should not have been previously frozen unless sta-bility under those storage conditions has been demonstrated. The
N.
Kadian
et al.
/ Journal
of Pharm
aceutical and
Biomedical
Analysis
126 (2016)
83–97
89
Table 5Comparison of validation parameter “Stability”[1–6].
Stability USFDA guidelines for BMV(2001)
USFDA draft guidelines forBMV (2013)
ANVISA guidelines for BMV(2012)
MHLW guidelines for BMV(2013)
EMA guidelines for BMV (2011)
MethodFreeze-Thaw stability Performed using 3 aliquots at
HQC and LQC at intendedtemperature for 24 h after 3freeze-thaw cycles
Stability should be assessed fora minimum of threefreeze-thaw cycles
Stability should be assessedafter 3 freeze-thaw cyclesusing a minimum of 3 samplesof HQC and LQC after storagefor 12 h
Performed using 3 replicatesper concentration i.e. HQC andLQC in the same condition asused for the study sample afterfreeze-thaw cycles
Performed after freeze-thawcycles which should be equalto or greater than thefreeze/thaw cycles intendedfor the study samples
Short-Term temperaturestability (Bench Top stability)
Three aliquots of each of theHQC and LQC should be thawedat room temperature and keptfor 4–24 h before analysis
Should be designed andconducted to cover thelaboratory handling conditionsthat are expected for studysamples
At least three replicate samplesof HQC and LQC at roomtemperature for 4–24 h shouldbe analyzed
Stability is evaluated using 3replicates per concentration ofHQC and LQC samples with QCsamples before and afterstorage
Evaluate the stability using atleast triplicates of LQC and HQC
Long Term stability Determined by storing threealiquots each of HQC and LQCunder the same conditionsintended for study samples,concentration of stabilitysamples to be compared withthe mean of back-calculatedvalues of the standards from1st day of long-term stabilitytesting
Storage time in a long-termstability evaluation should beequal or exceed the timebetween the date of first anddate of last sample analysis
At least three samples of HQCand LQC are used after thestorage of sample that exceedsthe time interval betweencollection of first sample andanalysis of last sample
Should be performed on thesamples that have been storedfor a time that is longer thanthe actual storage period
QC samples should be storedunder the same conditions asthe study samples andanalyzed
Stock solution stability Stability of stock solution ofdrug and IS should beevaluated at room temperaturefor at least 6 h after thecompletion of storage time andcompared with the instrumentresponse of freshly preparedsolutions
Stability of the stock solutionand IS should be evaluated andin case when stock solution isin different state or in differentbuffer composition from thecertified RS, the stability datashould be generated to justifythe duration of stock solutionstorage stability
Stability of the drug and ISshould be performed at roomtemperature after at least 6 h ofpreparation and results arecompared with recentlyprepared solutions
Evaluation is performed by atleast 3 replicates at eachconcentration levels of HQCand LQC
Bracketing approach can beused for the study of stabilityof stock and working solution
Acceptance criteriaPost-preparative stability Stability of the drug and IS
should be assessed over theanticipated run time for thebatch size in validationsamples by determiningconcentrations on the basis oforiginal calibration standardswhich includes the stability ofsamples for the resident timein the Autosampler
The stability of processedsamples, including the residenttime in the Autosampler,should be determined
Drug stability must beevaluated in the processedsample including IS at thesame conditions and for aperiod of time longer than theduration of the analytical runusing at least 3 samples of HQCand LQC. Results are to becompared with recentlyanalyzed samples
Stability is evaluated by at least3 replicates per concentrationlevels of QC samples beforeand after storage
Stability of the processedsample at room temperature orunder the storage conditions tobe used during the study.On-Instrument/Autosamplerstability of the processedsample at injector orAutosampler temperature
Acceptance criteria Not specified Stability sample results shouldbe within 15% of nominalconcentrations
Samples are considered to bestable when there is nodeviation higher than 15% ofthe average concentrationobtained from nominal valuewith the exception of the LLOQ,for which a deviation of up to20% is acceptable
The mean accuracy in themeasurement at each levelshould be within ±15%deviation of the theoreticalconcentration.If any other criteria are moreappropriate then that can alsobe used
The mean accuracy in themeasurement at each levelshould be within ±15%deviation of the theoreticalconcentration

9 cal and
taaaooccdpbbbniltgqtIg
2qbaostosstipsapbimtotnttmsfw
2psr
rsifwssa
0 N. Kadian et al. / Journal of Pharmaceuti
ime period allowed to elapse between assessments may be vari-ble. Usually the first few assessments are made on a daily basisnd once the stability is demonstrated, the time period betweenssessments may be extended to weekly, and then monthly basisr even less frequently [16]. It is recommended to keep the durationf long-term stability more than the time between the first sampleollection and last sample analysis [10]. However, there is no spe-ific recommendation in the guidelines regarding the experimentalesign and the time points at which evaluation of stability is to beerformed, but it has been advised to perform the long-term sta-ility on three different occasions to ensure enough stability dataefore performing the study [10,18]. As per EMA guidelines, theracketing technique is acceptable for small molecules i.e. it is notecessary to investigate the stability of small molecule in between
f the stability is proven for any molecule at −70 and −20 ◦C, but forarge molecules such as peptides and proteins, the stability at eachemperature should be studied [2]. ANVISA and USFDA have similaruidance providing the information regarding the storage time, theuantity of samples and comparison of samples to the average ofhe values previously calculated on the first day of the test [1,3,4].n spite of similar methodology, there are some variations in theuidelines, which have been detailed in Table 5.
.2.5.4. Stock solution stability. The study samples are typicallyuantitated against matrix standard samples which are preparedy spiking stock solutions of the analyte in the biological matrixnd these stock solutions are commonly made in aqueous buffers,rganic solvents or mixtures, so it becomes important to study thetability of stock solution as a part of assay validation. It is impor-ant to generate the stock solution stability data to justify the periodver which the solutions will be used as the stability of the stockolutions is independent of the stability of RS from which the stockolution is prepared and thus, it is not advisable to assign an expira-ion date that is matching with the RS [16]. Stock solution stabilitys performed by preparing a fresh solution from the RS and com-aring the absolute response of the fresh results with that of thetored solution and the stability of the standard solutions of thenalyte and IS should be evaluated to cover the time interval fromreparation until use and the stability testing conditions shoulde same such as light or dark, temperature, solvent and container
n which the study is to be performed [15,16]. In the case of largeolecules such as peptides, it is advisable and recommended that
he stock solution stability should be performed from the same lotf reference standard that was used to prepare the aged stock solu-ion [15,16]. In the case when a stable isotope is used as IS, it isot necessary to study the solution stability if it is demonstratedhat no isotope exchange reactions occur under the same condi-ions [2,4,5]. While EMA lacks in providing any specific procedure or
ethodology to be followed for the evaluation of stock or internaltandard solution stability but recommends bracketing approachor the stability at each concentration levels [2], the comparisonithin different guidelines has been mentioned in Table 5.
.2.5.5. Post-preparative stability. Also referred as processed sam-le stability, is the stability of analyte and IS after completion ofample preparation. It is further classified into; (i) sample extracteanalysis (ii) on-instrument stability and (iii) extract stability.
2.2.5.5.1. Sample extract reanalysis. It can also be referred to aseinjection reproducibility and is performed to determine the pos-ibility of reinjection/reanalysing processed samples in the event ofnterruption of initial analysis due to any reason such as instrumentailure. It can be performed by keeping a set of matrix standards
hich have been kept for the initial analysis or the processedamples for the time period that assess sample extract reanalysistability (typically 24–72 h) and reanalysed; the obtained resultsre calculated using both the standard curve derived from the initial
Biomedical Analysis 126 (2016) 83–97
analysis of the standards as well as that derived from the reanalysedstandards.
2.2.5.5.2. On-instrument stability. The main aim of performingon-instrument stability is due to the reason that the standards areanalyzed at different time points when compared to the study sam-ples as the matrix standard, QC samples, and the study samples areanalyzed in either a serial or in a parallel manner. Assuming thatthe study samples are bracketed by QC samples during their analy-sis, data are generated with each batch of samples to demonstrateon-instrument stability [16].
2.2.5.5.3. Extract stability. In extract stability, the stability ofstored sample extracts is assessed by their analysis against freshlyprepared matrix standard extracts. Generally, the processed samplestability analysis should cover at least the maximum time requiredfor the completion of the sample workup until completion of themeasurements, allowing extra time to cover possible delay and theconditions of light and temperature at which the investigation isconducted. The extract stability study should be conducted undersimilar conditions as those of the conditions anticipated during thesample analysis [17,19]. It has been suggested in the various liter-atures to demonstrate stability after 24, 36 and 48 h so that in thecase of incomplete assay due to any instrumental error, the reanal-ysis can be performed on the next day [17,19]. In the guidelines, themain focus has been kept on the stability of reconstituted sampleand the stability of the reconstituted sample under autosamplerconditions, also considering the resident time in the autosampler.There have been variations in the acceptance criteria for stabilitystudies from different regulatory authorities worldwide, and thislack of harmonization has raised confusion among bioanalytical sci-entists for evaluation of post-preparative stability during methodvalidation. In order to generate a consensus, this post-preparativestability has been discussed extensively in various conferences,meetings, and workshops [10].
2.2.6. Carryover effectCarryover is seen as a major problem that influences the accu-
racy and precision of any bioanalytical method and is also of greatimportance in LC–MS/MS based bioanalytical methods, where thedynamic range is very high. Generally, it is caused due to residualanalyte from the high concentration sample analyzed previously inthe run which may also affect the subsequent samples dependingon the concentration of previous samples. The carryover effect canalso be seen randomly, in the case when the eluting residue fromcolumn affects the samples coming later during analysis, so theextent of carryover should be investigated during method devel-opment and should be eliminated or minimised. Carryover can bereduced by optimizing the composition of washing solvent andautosampler needle flushing volume in such a way to remove tracesof the residual drug that may stick in the needle. In the case ofremoval of the basic analyte, the addition of formic acid to washingsolvent is recommended along with an increase in the percentageof organic solvent in flushing solvent.
If the carryover is due to the column, then a change in mobilephase is recommended, by increasing the ratio of strong solvent orby altering the pH, altering the flow rate which will have an effecton the solubility of the analyte. Along with measures mentionedabove, it should be ensured that the samples that are known tohave high concentrations are never analyzed directly before thesamples with very low concentrations. Carryover effect can alsobe counteracted by using an extra blank sample or by dilutingthe samples into a limited calibration range. All these approachesare being used in various laboratories and industries worldwide
to counteract carryover effect in HPLC and LC–MS/MS analysis. Inspite of having high importance, it is a surprise that USFDA ini-tial guidelines and ANVISA guidelines do not provide any guidanceregarding carry-over effect while the new draft USFDA guidance,
cal and
itsspgmohptowitc
2
mopUtomssAtiawAi[bwcs±tvap
2
roblotnocaeetbsamc
N. Kadian et al. / Journal of Pharmaceuti
ncludes some information but still lacks methodology and limi-ations. New draft USFDA guidance states that the carryover effecthould be assessed and monitored during analysis and if it occurs, ithould be mitigated or reduced [1,3–5]. In contrast EMA and MHLWrovide detailed information regarding the carryover effect. Bothuidelines specify that the carryover effect should be addressed andinimised during method development, and validation. The carry-
ver effect should be assessed by injecting blank samples after aigh concentration sample or calibration standard at the ULOQ. Aser EMA and MHWL, the carryover in the blank samples followinghe high concentration standard should not be greater than 20%f the LLOQ and 5% for the IS. Both guidelines suggest putting upith appropriate measures to tackle the carryover issues so that
t does not affect the accuracy and precision, which could includehe injection of blank samples after samples with an expected highoncentration, before the analysis of the next study samples [2,6].
.2.7. Dilution integrityDilution integrity is performed to evaluate the capability of the
ethod to reliably quantify concentrations above ULOQ or in casef partial sample volume. It is performed by diluting the QC sam-les (with higher analyte concentrations, at least two times theLOQ) with blank matrix depending on the expected concentra-
ion levels during the study. USFDA recommends the evaluationf dilution integrity during method validation and ANVISA recom-ends extending the calibration curve (CC) range or diluting the
amples when concentration above ULOQ are encountered duringample analysis. However, the USFDA initial, draft guidance andNVISA failed to provide the experimental procedure and accep-
ance criteria [1,3–5]. EMA specifies that if applicable, the dilutionntegrity should be demonstrated by spiking the matrix with annalyte concentration above the ULOQ and diluting this sampleith blank matrix (at least five determinations per dilution factor).ccuracy and precision should be within the set criteria. Dilution
ntegrity should cover the dilution applied to the study samples2]. MHLW states that the dilution integrity should be evaluatedy at least 5 replicates per dilution factor after diluting a sampleith a blank matrix to bring the analyte concentration within the
alibration range. The dilution factors should be selected by con-idering in the measurements of diluted samples should be within15% deviation of the theoretical concentration. EMA suggest that
he evaluation of the dilution integrity should be covered by partialalidation and the use of another matrix may be acceptable, as longs it has been demonstrated that this does not affect accuracy andrecision.
.2.8. Matrix effectIt is defined as the direct or indirect alteration or interference in
esponse which may be due to the presence of unintended analytesr other interfering substances in the sample. Generally, it is causedy the matrix components, concomitant medications and metabo-
ites eluting along with analyte, thereby influencing the abundancef analyte in MS source by affecting the ability of analyte in solu-ion phase to get transferred into gas phase as charged ions andeutralizing the charged gas phase analyte ions by charge transferr charge stripping mechanism [10,20]. Matrix effect can also beaused when molecules co-eluting with the compounds of interestlter the ionization efficiency of the electrospray interface. Matrixffects are unseen in the chromatograms but have a deleteriousffect on accuracy, precision and sensitivity of the method dueo which it is necessary to critically evaluate matrix effect duringioanalytical method development. A minimal matrix effect can
ignificantly affect the performance of the method during samplenalysis due to the subject to subject variation of the biologicalatrix and might be different from the blank lots used for spikingalibration curve and QC samples during method validation. Usu-
Biomedical Analysis 126 (2016) 83–97 91
ally, the matrix effect is assessed either by post extraction additionmethod or the post-column infusion method. Various articles arepresent over the past describing the procedures for evaluation andelimination of matrix effect in method development and validation[21].
In the post-column infusion method, simultaneous injection ofan extracted blank matrix sample is made onto a constantly infusedhigh concentration analyte solution and the changes in the instru-ment response for the analyte are continuously monitored over aperiod of time. It is a qualitative approach and does not providea quantitative understanding of the extent of matrix effects as itcan only identify chromatographic regions which are susceptible tomatrix effects. This will allow the analyst to modify the retentiontime of the analyte so that it does not elute in susceptible zones dueto which this approach is considered time-consuming and needssignificant chromatographic parameter optimization particularlyif multiple analytes have to be monitored.
In post extraction spiking method, the matrix effect is assessedby comparing the analyte response in the neat aqueous sampleversus analyte spiked in extracted blank matrix sample at the sameconcentration. This method is found useful and allows quantitativeassessment of matrix effects for all analytes including the IS and iswidely accepted.
Matrix effect can be evaluated by spiking analyte at two concen-tration levels (low and high QC) in six different lots of blank matrixand reading against freshly prepared CC [10]. The matrix effect iscalculated by matrix factor (MF). Matrix factor can be calculated bythe following formula:
Matrix Effect = Analyte(or IS)response in spiked blank extractAnalyte(or IS)response in neat solution
If the value of matrix factor equals to 1, then it denotes thatthere is no matrix effect, if it is less than one then it indicates sup-pression, and if more than 1 then it indicates enhancement of theanalyte response [10]. If the matrix factor indicates enhancement orsuppression, then the method should be modified to nullify it. Also,the IS normalized MF can be calculated using following formula:
Internal Standard normalized Matrix Effect
= Matrix effect for analyteMatrix effect for Internal Standard
If the value of IS normalized MF is equal to 1, then it shows theacceptability of the method with the same extent of matrix effectfor the analyte and IS. During method development, the analyteis spiked at two concentrations and IS at working concentrationin six different lots of blank matrix. The %CV of the IS normalizedMF should not be more than 15% for demonstrating the absenceof matrix effect. There is no specification for IS normalized MF foracceptance of a method, but literature and data from various labsshow 0.80–1.20 as the acceptable limit.
Along with the approaches mentioned above, there are otherapproaches which also have been employed. One of these meth-ods includes the calculation of %CV of slopes of the calibrationcurves obtained using six different lots of blank matrix. This methodmay be easy, but there are controversies over the evaluation in sixbatches as it may not be indicative of testing samples from hun-dreds of subjects. Moreover, the variability of extraction and matrixeffects might contribute to the total variability of assay results.But this approach is found highly efficient in detecting the matrixeffects for LC–MS/MS based bioanalytical methods. There are vari-ous approaches which have been suggested by Matuszewski et al.
and Kollipara et al. to overcome the matrix effects by appropriatedesign of the bioanalytical method which include: development ofmethod under efficient chromatographic conditions to ensure ana-lyte peak is well separated from impurities; improving the sample
9 cal and
eelmil[ethgUgbatsTldaEmtbaavaoictfibgawtstodntnaeaQsgi
2
aprottepat
2 N. Kadian et al. / Journal of Pharmaceuti
xtraction method, and use of pure, stable isotope labelled IS tonsure the same extent of ionization efficiency and recovery of ana-yte [10,22]. It is also highlighted that the stable isotope labelled IS
ay not always account for matrix effect of analyte particularlyf the difference in average molecular weight between the ana-yte and IS is more than 5, resulting in a change in retention time23]. It should be noted that any change in the ionization mode,xtraction method and chromatographic conditions at any stage ofhe methods’ life cycle, might alter the extent of matrix effect andence should be always evaluated. ANVISA does not present anyuidelines for the evaluation of matrix effects in its guidance, whileSFDA guidelines suggest that the matrix effect should be investi-ated to ensure that precision, selectivity and sensitivity will note compromised [1]. The USFDA draft guidance recommends takingppropriate steps to ensure the lack of matrix effects throughouthe application of the method and the matrix effect on ion suppres-ion or enhancement or extraction efficiency should be addressed.he draft guidelines also included that the calibration curve in bio-ogical fluids should be compared with calibrators in the buffer toetect matrix effects using at least ten sources of the blank matrixlong with other examples mentioned in the earlier guidelines.MA suggests that for each analyte and IS, the MF and the IS nor-alized MF should be calculated for each lot of matrix. The %CV of
he IS normalized MF calculated from the 6 lots of matrix should note greater than 15%, and the determination should be performedt a low and a high level of concentration. EMA also provides anlternative approach in the case of on-line sample preparation, theariability of the response from lot to lot should be assessed bynalysing at least 6 lots of matrix, spiked at a low and a high levelf concentration. EMA suggests that the validation report shouldnclude the peak areas of the analyte and IS, and the calculatedoncentration for each individual sample and the overall %CV forhe concentration should not be greater than 15%. In case it is dif-cult to obtain matrix, then less than 6 different lots of matrix cane used with justification, but matrix effect should be still investi-ated. In case when the excipients are known to have matrix effectre used in the formulations then matrix effect should be studiedith matrix containing the excipient, in addition to blank matrix,
he matrix used for this kind of evaluation should be obtained fromubjects receiving excipients, unless it has been demonstrated thathe excipient is not metabolised or transformed in vivo. The effectf the excipients can be studied by the determination of MF or by ailution of a high concentration study sample with a blank matrixot containing the excipient. EMA also focused and recommendedo investigate the matrix effect on other samples in addition to theormal matrix. Also, if the samples from any special populationre to be analyzed, then it has been recommended to study matrixffect using a matrix of the same population. MHLW like EMAlso provides an alternative method for evaluation, by analysingC samples, each prepared using matrix from at least 6 different
ources and the precision determined concentration should not bereater than 15%. MHLW also suggests the use of less than 6 sourcesn case of limited availability of matrix [1–6].
.2.9. Analysis of study samplesIt is recommended that the samples should be analyzed only
fter the validation of the bioanalytical method and should be com-leted within the time period for which the stability data has beeneported. It may also be important to evaluate the performancef the method depending on the time lag between actual valida-ion and study sample analysis. It is also recommended to evaluatehe validity of the bioanalytical method during study sample in
ach analytical run by using the calibration standards and QC sam-les. As per EMA, an analytical run consists of the blank sample,zero sample, calibration standards at a minimum of 6 concen-ration levels, at least 3 levels of QC samples in duplicate and
Biomedical Analysis 126 (2016) 83–97
study samples to be analyzed. All samples should be processed andextracted as one single batch of samples in an order in which theyare intended to be submitted or analyzed. Analysing samples whichhave been prepared separately as several batches should be avoidedin a single run. The acceptance criteria should be pre-establishedin a standard operating procedure (SOP) or in a study plan whichshould be defined for the complete analytical run or for the separatebatches in the run. MHLW recommends the use of biological sam-ples obtained from the pharmacokinetic studies and clinical trialsto be analyzed using conditions that have been validated along witha blank sample, a zero sample, calibration standards at a minimumof 6 concentration levels and QC samples. MHLW also recommendsevaluating the validity of the bioanalytical method using the CC andQC samples, while in studies that serve pharmacokinetic data asa primary endpoint, reproducibility should be confirmed for eachstudy per matrix by performing incurred sample reanalysis. USFDAguidelines issued in 2001, state the same criteria as mentioned inother guidelines, also mentions that the biological samples can beanalyzed with a single determination without duplicate or replicateanalysis if the assay method has acceptable variability as definedby validation data [1–6].
2.2.9.1. Calibration curve. If the analyte concentrations in the studysamples are anticipated to be in a narrow range, then EMA recom-mends to either narrow the CC range and adapt the concentrationof QC samples or add new QC samples at different concentrationlevels as appropriate, in order to reflect the concentrations of thestudy samples. Similarly, if the sample concentrations are aboveULOQ, then the CC range should be extended to cover the antici-pated concentrations, and at least 2 QC samples should be in therange of the study sample concentrations. In both the above sit-uations the method should be revalidated partially to verify theresponse function and to ensure accuracy and precision [2]. As perMHLW, the accuracy of back-calculated concentrations of calibra-tion standards at each level should be within ± 20% deviation of thetheoretical concentration at the LLOQ or ±15% deviation at all otherlevels. At least 75% of the calibration standards with a minimum of6 levels should meet the above criteria. In case the calibration stan-dard at LLOQ and ULOQ does not meet the criteria in study sampleanalysis, the next lowest/highest level calibration standard may beused as the LLOQ and ULOQ, but the modified calibration rangeshould still cover at least 3 different QC sample levels [6]. On theother hand, USFDA guidelines recommend the inclusion of QC sam-ples, calibration standards and the processed unknown samples ina single analytical run. All the processed samples should be ana-lyzed as a single batch or a batch comprised of processed unknownsamples of one or more volunteers in a study, and the CC shouldcover the expected unknown sample concentration range in addi-tion to a calibrator sample at LLOQ. USFDA does not recommendestimating the concentration in the unknown sample by extrapola-tion of standard curves below LLOQ or above the highest standard;instead, the standard curve should be redefined. When the bioana-lytical method necessitates separation of the overall analytical runinto distinct processing batches, new USFDA draft guidance rec-ommends processing, at least, duplicate QCs at all QC levels in eachdistinct processing batch along with study samples [1].
2.2.9.2. Accuracy and precision. The accuracy values of the QC sam-ples should be within ±15% of the nominal values, and at least67% of the QC samples and at least 50% at each concentration levelshould comply with this criterion, and if the criterion is not ful-filled then the analytical run should be rejected, and the study
samples should be re-extracted and analyzed. In case the over-all mean accuracy and precision exceed 15%, this should lead toadditional investigations justifying this deviation [2,6]. As per theUSFDA guidance, a number of QC samples separately prepared
cal and
sotftb
2
pfmpptrtia[
2
iScs
2
rbvtErnwsp(nl(c
2
oacrioonesiitd
N. Kadian et al. / Journal of Pharmaceuti
hould be analyzed with processed test samples at intervals basedn the total number of samples and the QC samples in duplicate athree concentrations should be incorporated in each run. At leastour out of every six QC samples should be within 15% of the respec-ive nominal value; two of the six may be outside the 15%, but nototh at the same concentration [1,3].
.3. Reanalysis of study samples
All the guidelines suggest performing a reanalysis of study sam-les in cases where the rejection is due to failure of the run toulfil the criteria of accuracy, improper sample injection, poor chro-
atography, etc. EMA and MHLW also consider reanalysis due toharmacokinetic reasons, and if the reanalysis is due to positivere-dose samples, the reanalysed samples should be identified, andhe initial value, the reason of reanalysis, the values obtained in theeanalysis, the finally accepted value and justification for the accep-ance should be provided. Reinjection of sample can be made onlyn the case of instrument failure and if reinjection reproducibilitynd on-injector stability have been demonstrated during validation1–4,6].
.4. Chromatogram integration
All the guidelines recommend the procedure for chromatogramntegration and re-integration to be predefined in the protocol orOP. The reasons for re-integration should be recorded, and thehromatograms obtained both before and after the re-integrationhould be kept for future reference [1–4,6].
.5. System suitability
It is advised to confirm the system suitability prior to eachun to ensure optimum performance of the instrument used forioanalysis. MHLW do not mandate the system suitability as thealidity of analysis is routinely checked by evaluation of calibra-ion curves and QC sample in each analytical run, while USFDA andMA lack to provide any guidance regarding system suitability. Theecent USFDA draft guideline includes system suitability but didot make any compulsion and suggests to follow a specific SOPhile the apparatus conditions should be determined using spiked
amples independent of the study calibrators, QCs, and study sam-les. According to ANVISA guidelines, the number of QC samplesin multiple of three) incorporated in each analytical run shouldot be lower than 5% of the number of unknown samples. For ana-
ytical runs consisting of up to 120 samples, at least 6 QC samplesduplicate of each concentration) should be used. The acceptanceriteria were similar to that of USFDA guidance [1–4,6].
.6. Incurred sample reanalysis
Incurred sample reanalysis (ISR) has become an integral partf the bioanalytical process to access the quality of bioanalyticalssay which has been widely accepted within the pharmaceuti-al and bioanalytical community. ISR has a significant contributionegarding building confidence in well planned and executed val-dation studies as it reaffirms the reproducibility and reliabilityf a validated bioanalytical method. It is also required as the usef calibration standards and QC samples during validation mayot fully mimic the actual study samples. It is recommended tovaluate the accuracy of incurred samples by reanalysis of studyamples in separate runs on different days as the differences for
nstance in protein binding, back-conversion of metabolites dur-ng storage, sample inhomogeneity or co-medication may affecthe accurate quantification. The major principle behind ISR is toemonstrate the validity and reproducibility of the method duringBiomedical Analysis 126 (2016) 83–97 93
study sample analysis and in the case of the failed ISR, the underly-ing reasons should be investigated, and remedial measures for theanalytical method should be taken. The reasons for the failure of ISRmay be attributed to pipetting errors, sample inhomogeneity dueto improper vortexing, inadequate thawing, contamination, otheroperational errors, interference of biological components uniqueto the study samples or of unknown metabolites and wrong label-ing. EMA and MHLW highlight the reasons mentioned above forevaluating the accuracy of incurred samples by reanalysis of studysamples in separate runs at different days and recommends 10%of the samples to be reanalysed in the case when the samples areless than 1000 and 5% of the number of samples in case the sam-ples are exceeding 1000. USFDA draft guidelines suggest that thetotal number of ISR samples should be 7% of the study sample size.EMA and MHLW also advises to take the sample around Cmax andin the elimination phase and should be done at least in: toxicoki-netic studies once per species; for all pivotal bioequivalence trials;first clinical trial in subjects; first patient trial; and the first trials inpatients with impaired hepatic and/or renal function. MHLW addi-tionally suggests that the ISR should be performed with samplesfrom as many subjects or animals as possible. In the case of animalstudies, the ISR can be done in early phase studies, and the samplesshould not be pooled, as pooling may limit anomalous findings. Inaddition, MHLW also suggests the ISR for non-clinical studies withsamples obtained in an independent non-GLP study, if the studyis similar to the relevant toxicokinetic study. The results of ISR areevaluated as assay variability. Assay variability can be calculatedas the difference between the concentration obtained by ISR andthat in the original analysis divided by their mean and multipliedby 100.
%difference or Assay Variability =(Repeat value - Initial value)
Mean value× 100
As per EMA and MHLW the % difference during repeat analy-sis should not be greater than 20% of their mean for at least 67%of the repeats, while USDA draft guidelines state that two-third(67%) of the repeated sample results should be within 20% for smallmolecules and 30% for large molecules. If the ISR data fails to com-ply with the above criteria, the cause should be investigated, andnecessary measures should be taken by considering the potentialimpact on study sample analysis [1–4,6,10,11,22,24].
3. Ligand binding assays
These are the immunoassays that use a specific antigen or anti-body capable of binding to the analyte to identify and quantifysubstances and are mainly used for macromolecules such as pep-tides and proteins [25]. USFDA and EMA provide a single guidelinefor both small and large drug molecules while MHLW has pro-vided a separate guidance for the LBA validation in 2014 [1,13,26].Regulatory guidelines are issued for the validation of LBA as theanalytical methods for the measurement of drugs in biological sam-ples obtained in toxicokinetic studies and clinical trials, as well asapplicable to the analyses of study samples using such methods.These guidelines are generally applicable to the quantification ofpeptides and proteins as well as low molecular weight drugs thatare analyzed by LBAs. The validation principles and the considera-tions about the analysis of study samples are similar to those of the
small molecules. These assays are often run without prior separa-tion of the analyte of interest due to their inherent characteristicsand complex structure of the macromolecules which makes theextraction process problematic. These assays do not measure the
9 cal and
mt
3
utepsmdttbttptattr
3
3
swsoaeUgib
3
iebwlpgoetTsfboT
tdtwtt
4 N. Kadian et al. / Journal of Pharmaceuti
acromolecule directly but indirectly measure the binding reac-ion with reagents employed in the assay.
.1. Reference standard
The reference standards should be well characterized and doc-mented as their potency and immunoreactivity may vary due toheir heterogeneous nature. As per the MHLW guidance, the refer-nce standard should accompany the certificate of analysis whichrovides the information regarding the standard, and the materialhould be procured from an authenticated source. EMA recom-ends using the same batch of reference standard used for the
osing in the non-clinical subjects, for the preparation of calibra-ion standards and QC samples. If there is a change in the batch thenhe analytical characterisation and bioanalytical evaluation shoulde carried out prior to its use to ensure that the performance charac-eristics of the method are not altered [2,26]. As per the guidelines,he minimum required dilution for full validation should be definedrior to diluting samples with buffer solution. In the case whenhe plate-based assay is used, the analysis should be performed int least 2 wells per sample and the sample concentration shouldhen be determined either by calculating a mean of responses fromhe wells or by averaging the concentration calculated from eachesponse [26].
.2. Ligand binding assay method validation
.2.1. SpecificityIn the case of LBAs, it is important that the binding reagents
hould specifically bind to the target analyte, but do not cross-reactith the coexisting related substances. If the presence of the related
ubstance is anticipated in the biological samples, then the extentf their impact should be evaluated. Specificity of any method is itsbility to detect and differentiate the analyte of interest in the pres-nce of other substances, including its related substances. Earlier,SFDA guidance has not mentioned LBA and later in the new draftuidance LBA method validation was included, still specificity is notncluded. The comparison in methodology and acceptance criteriaetween different guidances is detailed in Table 6.
.2.2. SelectivityIt is the ability of the method to measure the analyte of interest
n the presence of unrelated compounds in the matrix. There is noxtraction due to the inherent characteristic of macromolecules,ut the unrelated compounds present in the matrix may interfereith the analyte of interest in the LBA. The USFDA draft guide-
ines have subdivided selectivity into interference from substanceshysicochemically similar to analyte and matrix effect. As per thisuidance, the evaluation of interference from substances physic-chemically similar to analyte should be done by individuallyvaluating cross-reactivity of metabolites, concomitant medica-ion, and their significant metabolites or endogenous compounds.he CC in biological matrices should be compared with calibrationtandards in the buffer to detect matrix effect using blank matrixrom at least ten sources and the non-specific binding should alsoe determined. EMA and MHLW have provided a common method-logy and acceptance criteria for selectivity which is discussed inable 7.
Specificity and selectivity in the case of LBA are dependent onhe ligand reagent and the species biology. If the macromolecularrug is a monoclonal antibody against any targeted protein, then
he presence of a soluble form of the protein may cause interferenceith LBA, especially when the target protein is used as a ligand inhe binding reaction. It is a challenge to the analyst to recognizehe particular reaction between analyte and reagent along with
Biomedical Analysis 126 (2016) 83–97
the type of experiment to be employed for proving specificity andselectivity of LBA method [27].
3.2.3. Accuracy, precision and recoveryAs per EMA, for the estimation of precision and accuracy QC
samples should not be freshly prepared, but should be frozen andtreated the same way as for the analysis of study sample. Recov-ery has not been considered in the EMA and MHLW guidelines butUSFDA draft guidelines have provided recovery studies for the LBAs,which employed sample extraction. Comparison of methodologyand acceptance criteria has been included in Table 8.
3.2.4. Calibration curveMost LBA calibration curves are generally nonlinear and often
sigmoidal. In general, more concentration points may be recom-mended to define the fit over the standard curve range thanthe chromatographic assays. The response-error relationship forimmunoassay standard curves is a variable function of the meanresponse, due to which the standard curve should consist of aminimum of six non-zero calibrator concentrations in duplicatecovering the entire range including LLOQ and excluding blanks. A4–5-parameter logistic model is generally preferred for the regres-sion equation of a calibration curve, the validation report shouldinclude the regression equation and weighting conditions used[1,3]. As per EMA and MHLW guidance, a minimum of 6 concen-tration levels of calibration standards including LLOQ and ULOQ,and a blank sample should be evaluated during the validation andshould be used for the generation of CC which is to be reported ina Table to establish the overall robustness of the regression modelof the CC. Along with the calibrators, anchor points lying outsidethe calibration range can be used to facilitate better curve fitting.The accuracy of back-calculated concentration of each calibrationstandard should be within 20% (25% at LLOQ and ULOQ) of nominalconcentration for at least 75% of calibration standards excludinganchor points, and minimum of 6 levels of calibration standards,including the LLOQ and ULOQ, should meet this criterion [2,26].On the other hand, USFDA draft guidelines suggest that the stan-dard curve should consist of a minimum of six non-zero calibratorconcentrations in duplicate covering the entire range includingLLOQ and excluding blanks. LLOQ is established using, at least fivesamples and the analyte peak should have the back-calculated con-centration whose precision should not exceed 25% CV and accuracywithin 25% of the nominal concentration and within 20% of thenominal concentration at all other concentrations and 75% of non-zero standards should meet the above criteria, including LLOQ andthe total error should not exceed 30%. Along with the acceptancecriteria and discussed methodology, the draft guidelines also rec-ommend to incorporate three concentrations in duplicate in eachrun i.e. LLOQ, MQC and HQC and the results of the QC samples pro-vide the basis for acceptance and rejection; also at least 67% or twothird of the QC concentration results should be within 20% of theirrespective nominal values and at least 50% of QC at each level shouldbe within 20% of their nominal concentrations. Also, the minimumnumber of QCs should be at least 5% of the number of unknownsamples or six total QC, whichever is greater [1].
3.2.5. StabilityValidation studies should determine the analyte stability after
the freeze-thaw cycles, short-term and long-term storage. The sta-bility of the analyte should be evaluated in the stock and workingsolutions using solutions at or near the highest and lowest concen-tration levels under the actual solution storage conditions. EMA,
MHLW and USFDA draft guidelines recommend evaluating the sta-bility of at least 3 replicates per QC concentration level before andafter the stability storage. EMA and MHLW acceptance criteria sug-gest that the mean accuracy of the measurements at each level
N. Kadian et al. / Journal of Pharmaceutical and Biomedical Analysis 126 (2016) 83–97 95
Table 6Comparison of “Specificity” for Ligand Binding Assay validation[1–5,26].
Specificity USFDA draft guidelines for BMV (2013) MHLW draft guideline for BMV(LBA)(2014)
EMA guidelines for BMV (2011)
Definition Not specified The ability of analytical method todetect and differentiate the analytefrom other substances, including itsrelated substances
Specificity of the binding reagent refersto its ability to bind solely to theanalyte of interest
Method Not specified Evaluated by using blanks samples,blank samples spiked with the relatedsubstance at concentrationsanticipated in the study samples andQC samples with the analyteconcentration near to LLOQ and ULOQ
Should be tested with QC samples byadding increasing concentration ofavailable “related molecules” or drugsexpected to be concomitantlyadministered and measuring theaccuracy of the macromolecule ofinterest at both LLOQ and ULOQ
Acceptance criteria Not specified Assay results for the blank samples andblank samples spiked with the relatedsubstance should be below LLOQ.Accuracy in the measurements of theQC samples spiked with relatedsubstance should demonstrate anaccuracy of within ±20% of thetheoretical concentration or within±25% of the theoretical concentrationat the LLOQ and ULOQ
Assay acceptance criteria of the QCsamples should be within 25% of thenominal values
Table 7Comparison of Selectivity for Ligand Binding Assay validation[1–5,26].
Selectivity USFDA draft guidelines for BMV (2013) MHLW draft guideline for BMV(LBA)(2014)
EMA guidelines for BMV (2011)
Definition Ability of an analytical method todifferentiate and quantify the analytein the presence of other components inthe sample
Ability of an analytical method todetect and differentiate the analyte inpresence of other components in thesample.
Ability to measure the analyte ofinterest in the presence of unrelatedcompounds in the matrix.
Method By individually evaluatingcross-reactivity of metabolites,concomitant medication and theirsignificant metabolites or endogenouscompounds and when possible, theLBA should be compared with thevalidated reference method usingincurred samples.
Evaluated by using blank samplesobtained from 10 individual sourcesand at or near LLOQ prepared fromindividual blank samples
Tested by spiking at least 10 sourcesincluding lipemic and haemolysedsample matrix at or near LLOQ
Matrix Effect should be evaluated bycomparing CC in biological fluids withcalibrators in buffer using at least tensources of blank matrix andparallelism of diluted study samplesshould be evaluated with dilutedstandards to detect matrix effect
Less than 10 sources are acceptablewhen matrix is limitedly available
When interference is concentrationdependent, it is essential to determinethe minimum concentration whereinterference occurs
Acceptance criteria Not defined At least 80% of the blank samplesshould be below LLOQ and at least 80%of the near-LLOQ QC samples shouldd±o
Accuracy should be within 20% (25% atthe LLOQ) of the nominal spikedconcentration in at least 80% of the
s[st
3
psp(3vcgs
hould be within ±20% deviation of the theoretical concentrations2,26] while USFDA draft guidelines suggest that the stability studyample results should be within ±15% of the nominal concentra-ions [1].
.2.6. Analysis of study samplesAn analytical run in case of LBA comprises several individual
lates, but each plate should contain an individual set of calibrationtandards and QC samples to compensate for the difference in plateerformance. As per EMA, it is recommended to assay in replicatesuse at least 2 wells instead of 1). Each plate should contain at least
levels of QC samples at least in duplicate during and within study
alidation; the QCs should mimic the analysis of the study sampleoncerning the number of wells used per study sample. USFDA draftuidelines suggest that the runs should be rejected if the calibrationtandards or QCs fall outside the acceptance criteria and the mini-emonstrate an accuracy of within20% of the theoretical concentrationr within ±25% at the LLOQ
matrices evaluated
mum number of QCs to ensure proper control of the assay should beat least 5% of the number of unknown samples or a total of six QC,whichever is greater. USFDA draft guidelines and EMA do not pro-vide a detailed methodology and acceptance criteria for the studysample analysis while MHLW has provided guidelines for each andevery parameter. The accuracy of back-calculated concentrations ofcalibration standards at each level should be within ±25% deviationof the theoretical concentration at the LLOQ and ULOQ, and ±20%deviation at all other levels and at least 75% of the calibration stan-dards excluding anchor points, with a minimum of 6 levels shouldmeet the criteria. In case the calibration standard at the LLOQ andULOQ does not meet the criteria, the next lowest/highest-level cali-
bration standard may be used as the LLOQ or ULOQ of the calibrationcurve, even though, the modified calibration curve should still coverat least 3 different QC levels. MHLW guidelines state that QC sam-ples with a minimum of 3 different concentration levels within the
96 N. Kadian et al. / Journal of Pharmaceutical and Biomedical Analysis 126 (2016) 83–97
Table 8Comparison of “Accuracy, Precision and Recovery” for Ligand Binding Assay validation[1–5,26].
USFDA draft guidelines for BMV (2013) MHLW draft guideline for BMV(LBA)(2014)
EMA guidelines for BMV (2011)
Method Accuracy and Precision is determinedby replicate analysis of samplescontaining known amount of analyteusing minimum of 5 determinationsper concentration and a minimum of 3concentrations in range of expectedstudy sample concentration.
Accuracy and Precision is assessed byQC samples with a minimum of 5different concentrations (LLOQ,low-mid- high QCs, ULOQ) within thecalibration range.
At least five QC samples andmeasurement should be made acrossat least 6 independent assay runs overseveral days
Recovery is applicable for the LBA thatemploy sample extraction, and it is themeasured concentration relative to theknown amount added to the matrix atthree concentrations
Accuracy and precision should beevaluated by repeating the analysis inat least 6 analytical runs
The mean concentration should bewithin 20% of the nominal value ateach concentration level forwithin-run and between-run accuracy
Acceptance criteria For accuracy and precision, the meanvalue should be within 20% of theactual value except at LLOQ, where itshould not deviate by more than 25%.
Mean within-run and between-runaccuracy at each concentration levelshould be within 20% deviation of thetheoretical concentration, except at theLLOQ and ULOQ, where it should bebelow 25%
With-in run and between-runprecision should not exceed 20% (25%at LLOQ and ULOQ)
AexU
cQsac5
3
rfatbtacobttdba
4
gpswirtanastiT
For recovery, no specific criteria areprovided but generally 100% recoveryis required
alibration range should be analyzed, and the analysis requires 2C sample at each QC level or at least 5% of the total number of
tudy samples in the analytical run, whichever is greater and theccuracy should be within ±20% deviation of the theoretical con-entrations and, at least, two-third of the QC samples and at least0% at each concentration level should meet the criteria.
.2.7. Incurred sample reanalysisAs described earlier, the incurred sample reanalysis refers to a
eanalysis of incurred samples in separate analytical runs on dif-erent days to check the reproducibility of the originality of thenalytical results. As per MHLW guidelines, approximately 10% ofhe samples should be reanalysed in cases where the total num-er of study samples is less than 1000 and approximately 5% ofhe number of samples exceeding 1000. USFDA draft guidelinesnd EMA consider the same methodology as mentioned for thehromatographic assays. As per EMA and MHLW, the concentrationbtained from the initial analysis and the concentration obtainedy reanalysis should be within 30% of their mean for at least 67% ofhe repeats. Additionally, MHLW suggests that if the ISR data failedo meet the above criteria, root cause investigation should be con-ucted for the analytical method, and necessary measures shoulde taken by considering the potential impact on the study samplenalysis.
. Conclusion
In spite of several modifications and improvements in neweruidelines regarding bioanalytical method validation, in theresent authors’ opinion we still lack an efficient, scientificallyound and harmonized bioanalytical method validation guidancehich expedites the generation of quality and reliable data dur-
ng preclinical and clinical phases of drug development for smoothegistration of the product worldwide and acceptance by all regula-ory agencies. To date USFDA, ANVISA, EMA and MHLW guidelinesre referred for the bioanalytical method validation, recently theew draft guidelines of USFDA have also been launched whichre under evaluation and may be finalized for their enactment
oon. Even though the scientific basis for evaluation of parame-ers is same across these guidelines, but still there are differencesn the acceptance criteria and methodology for few parameters.ill date USFDA (2001) and EMA are the most widely referredtotal error at each level should notceed 30%, except at the LLOQ and
LOQ, where it should not exceed 40%
The total error should not exceed 30%(40% at LLOQ and ULOQ)
guidelines for the bioanalytical method validation, USFDA guide-lines were lacking in some parameters which have been addedin the draft guidelines issued in September 2013. But still, USFDAdraft guidance lacks in providing acceptance criteria for variousparameters, making the guidelines nonbinding and allowing otherapproaches. The draft guidance provides freedom and responsibil-ity to the skilled and experienced bioanalyst to design and conductappropriate protocols for all aspects of method validation. In com-parison to EMA guidelines and USFDA 2001 guideline, USFDA draftguideline provides guidance on additional issues such as endoge-nous compounds, biomarkers, diagnostic kits and also encouragesthe development and use of newer bioanalytical technologies. EMAlacks in discussing important parameters such as recovery in itsguidelines. These divergences among the guidelines have lead tomany debates, conferences on these topics and unlimited discus-sion between the industrial personnel and FDA but still did not leadto a common conclusion. Hence, it can be considered to maintaina common In-House SOP for these topics as suggested by variousindustrial professionals in several meetings, conferences, and sem-inars worldwide. Also, a common strategy should be planned outbefore the start of any bioanalytical method development and val-idation which would cover the minimum and maximum of theacceptance criteria present in the guidelines for each parame-ter of bioanalytical method validation. As none of the guidelinesappear to be restricting to their particular parameters which makeit open that additional parameters which are not present in spe-cific guidelines can be performed. Also, the regulatory agenciesshould consider for implementing a common guidance for the bio-analytical method validation which will lead to harmonization ofthe method development and validation of bioanalytical validationworldwide.
References
[1] F.D.A. U.S. Department of Health and Human Services, Center for DrugEvaluation and Research (CDER), Center of Veterinary Medicine (CVM),Guidance for Industry: Bioanalytical Method Validation [Draft Guidance](2013).
[2] EMA, Comittee for Medicinal Product for Human Use Guideline onbioanalytical method validation (2011).
[3] F.D.A. U.S. Department of Health and Human Services, Center for DrugEvaluation and Research (CDER), Center of Veterinary Medicine (CVM)Guidance for Industry: Bioanalytical Method Validation (2001).
[4] ANVISA, Agencia Nacional de Vigilancia Sanitaria, Guide for validation ofanalytical and bioanalytical methods Resolution-RE n. 899 (2003).

cal and
[
[
[
[
[
[
[
[
[
[
[
[
[
[
[
[
[26] MHLW, Guidance on Bioanalytical Method (Ligand Binding Assay) Validationin Pharmaceutical Development, 2014.
N. Kadian et al. / Journal of Pharmaceuti
[5] ANVISA, Ministry of Health, National Health Surveillance Agency, Resolution-RDC NO. 27 OF 17 MAY 2012, (2012).
[6] MHLW, Guideline on Bioanalytcal Method Validation in PharmaceuticalDevelopment (2013).
[7] C.J. Sennbro, M. Knutsson, P. van Amsterdam, P. Timmerman, Anticoagulantcounter ion impact on bioanalytical LC–MS/MS assays: results fromdiscussions and experiments within the European bioanalysis forum,Bioanalysis 3 (2011) 2393–2399.
[8] A. Bergeron, M. Bergeron, F. Garofolo, Confirmation of no impact fromdifferent anticoagulant counter ions on bioanalytical method, Bioanalysis 4(2012) 897–908.
[9] H.Y. Aboul-Enein, Selectivity versus specificity in chromatographic analyticalmethods, Accredit. Qual. Assur. 5 (2000) 180–181.
10] S. Kollipara, G. Bende, N. Agarwal, B. Varshney, J. Paliwal, Internationalguidelines for bioanalytical method validation: a comparison and discussionon current scenario, Chromatographia 73 (2011) 201–217.
11] H.T. Karnes, G. Shiu, V.P. Shah, Validation of bioanalytical methods, Pharm.Res. 8 (1991) 421–426.
12] S. Bolton, C. Bon, Pharmaceutical Statistics: Practical and Clinical Applications,fourth ed., CRC Press, New York, Basel, 2009.
13] A.M. Almeida, M.M. Castel-Branco, A.C. Falcão, Linear regression forcalibration lines revisited: weighting schemes for bioanalytical methods, J.Chromatogr. B 774 (2002) 215–222.
14] J. Wieling, G. Hendriks, W.J. Tamminga, J. Hempenius, C.K. Mensink, B.Oosterhuis, J.H.G. Jonkman, Rational experimental design for bioanalyticalmethods validation illustration using an assay method for total captopril inplasma, J. Chromatogr. A 730 (1996) 381–394.
15] H. Rosing, W. Man, E. Doyle, A. Bult, J. Beijnen, Bioanalytical liquidchromatographic method validation. A review of current practices and
procedures, J. Liq. Chromatogr. Related Technol. 23 (2000) 329–354.16] W. Nowatzke, E. Woolf, Best practices during bioanalytical method validationfor the characterization of assay reagents and the evaluation of analytestability in assay standards, quality controls, and study samples, AAPS J. 9(2007) E117–122.
[
Biomedical Analysis 126 (2016) 83–97 97
17] D. Dadgar, P.E. Burnett, Issues in evaluation of bioanalytical methodselectivity and drug stability, J. Pharm. Biomed. Anal. 14 (1995) 23–31.
18] D. Hoffman, R. Kringle, J. Singer, S. McDougall, Statistical methods forassessing long-term analyte stability in biological matrices, J. Chromatogr. B877 (2009) 2262–2269.
19] D. Dadgar, P.E. Burnett, M.G. Choc, K. Gallicano, J.W. Hooper, Applicationissues in bioanalytical method validation, sample analysis and data reporting,J. Pharm. Biomed. Anal. 13 (1995) 89–97.
20] R. King, R. Bonfiglio, C. Fernandez-Metzler, C. Miller-Stein, T. Olah,Mechanistic investigation of ionization suppression in electrosprayionization, J. Am. Soc. Mass Spectrom. 11 (2000) 942–950.
21] E. Chambers, D.M. Wagrowski-Diehl, Z. Lu, J.R. Mazzeo, Systematic andcomprehensive strategy for reducing matrix effects in LC/MS/MS analyses, J.Chromatogr. B 852 (2007) 22–34.
22] B.K. Matuszewski, M.L. Constanzer, C.M. Chavez-Eng, Strategies for theassessment of matrix effect in quantitative bioanalytical methods based onHPLC-MS/MS, Anal. Chem. 75 (2003) 3019–3030.
23] S. Wang, M. Cyronak, E. Yang, Does a stable isotopically labeled internalstandard always correct analyte response?: a matrix effect study on aLC/MS/MS method for the determination of carvedilol enantiomers in humanplasma, J. Pharm. Biomed. Anal. 43 (2007) 701–707.
24] J.W. Findlay, M.M. Kelley, ISR: background, evolution and implementation,with specific consideration for ligand-binding assays, Bioanalysis 6 (2014)393–402.
25] P.G. Swann, M.A. Shapiro, Regulatory considerations for development ofbioanalytical assays for biotechnology products, Bioanalysis 3 (2011)597–603.
27] J. Lee, H. Ma, Specificity and selectivity evaluations of ligand binding assay ofprotein therapeutics against concomitant drugs and related endogenousproteins, AAPS J. 9 (2007) E164–E170.