journal of pipeline engineering - pipes & pipelines international
TRANSCRIPT

June, 2011 Vol.10, No.2
Great Southern Press Clarion Technical Publishers
Journal of Pipeline Engineering
incorporating The Journal of Pipeline Integrity
Sample
copy
not fo
r dist
ributi
on

Journal of Pipeline Engineering
Editorial Board - 2011
Obiechina Akpachiogu, Cost Engineering Coordinator, Addax Petroleum Development Nigeria, Lagos, Nigeria
Dr Husain Al-Muslim, Pipeline Engineer, Consulting Services Department, Saudi Aramco, Dhahran, Saudi Arabia
Mohd Nazmi Ali Napiah, Pipeline Engineer, Petronas Gas, Segamat, MalaysiaDr Michael Beller, NDT Systems & Services AG, Stutensee, Germany
Jorge Bonnetto, Operations Director TGS (retired), TGS, Buenos Aires, ArgentinaDr Andrew Cosham, Atkins Boreas, Newcastle upon Tyne, UK
Dr Sreekanta Das, Associate Professor, Department of Civil and Environmental Engineering, University of Windsor, ON, Canada
Prof. Rudi Denys, Universiteit Gent – Laboratory Soete, Gent, BelgiumLeigh Fletcher, Welding and Pipeline Integrity, Bright, Australia
Roger Gomez Boland, Sub-Gerente Control, Transierra SA, Santa Cruz de la Sierra, Bolivia
Daniel Hamburger, Pipeline Maintenance Manager, El Paso Eastern Pipelines, Birmingham, AL, USAProf. Phil Hopkins, Executive Director, Penspen Ltd, Newcastle upon Tyne, UK
Michael Istre, Engineering Supervisor, Project Consulting Services, Houston, TX, USA
Dr Shawn Kenny, Memorial University of Newfoundland – Faculty of Engineering and Applied Science, St John’s, Canada
Dr Gerhard Knauf, Salzgitter Mannesmann Forschung GmbH, Duisburg, GermanyProf. Andrew Palmer, Dept of Civil Engineering – National University of Singapore, Singapore
Prof. Dimitri Pavlou, Professor of Mechanical Engineering, Technological Institute of Halkida , Halkida, Greece
Dr Julia Race, School of Marine Sciences – University of Newcastle, Newcastle upon Tyne, UK
Dr John Smart, John Smart & Associates, Houston, TX, USAJan Spiekhout, Kema Gas Consulting & Services, Groningen, Netherlands
Dr Nobuhisa Suzuki, JFE R&D Corporation, Kawasaki, JapanProf. Sviatoslav Timashev, Russian Academy of Sciences – Science
& Engineering Centre, Ekaterinburg, RussiaPatrick Vieth, Senior Pipeline Engineer - Pipelines & Civil Engineering, BP America, Houston, TX,
USADr Joe Zhou, Technology Leader, TransCanada PipeLines Ltd, Calgary, Canada
Dr Xian-Kui Zhu, Senior Research Scientist, Battelle Pipeline Technology Center, Columbus, OH, USA
❖ ❖ ❖
Sample
copy
not fo
r dist
ributi
on

2nd Quarter, 2011 69
The Journal of Pipeline Engineeringincorporating
The Journal of Pipeline Integrity
Volume 10, No 2 • Second Quarter, 2011
Contents
Guest editorial: Arctic pipelines and the future, by Professor Andrew Palmer ......................................................71 George W Tenley, Jr ................................................................................................................................................. 75 Aperspectiveonthefuture
Madeline Chua, Professor Andrew Palmer, and Hendrik Tjiawi ...........................................................................81 ProtectingArcticmarinepipelinesagainstsubgougedeformation
Ken Been, Abdelfettah Fredj, and George Comfort ............................................................................................... 87 Pipelinestrainsinsoftclaybackfillsubjecttoicegouging
Damien L Humby, Jonathan V M Caines, Michael J Paulin, and Glenn A Lanan ................................................ 97 Probabilisticmethodsfordeterminingextremeicegougedepthsforpipelineprotectiveburialassessment
Kabir Hossain, Ranil Banneyake, Basel Abdalla, Guy Bell, Ayman Eltaher, and Paul Jukes ............................. 103 Icekeel-seabed-pipelineinteractionsimulation:IcePipeJIPextracts
Tony King ...................................................................................................................................................................113 Protectionofpipelinesfromicegouging
Jon Machin ................................................................................................................................................................119 TheArcticregionfromatrenchingperspective
❖ ❖ ❖
OUR COVER PICTURE shows an artist’s impression of a typical ice-keel gouging event that can occur when an iceberg crosses a buried pipeline in the Arctic. The illustration is taken from the paper by Humby etal. on pages 99-104 of this
special Arctic pipelines issue of the Journal of Pipeline Engineering.
Sample
copy
not fo
r dist
ributi
on

The Journal of Pipeline Engineering70
1. Disclaimer: While every effort is made to check the accuracy of the contributions published in The Journal of Pipeline Engineering, Great Southern Press Ltd and Clarion Technical Publishers do not accept responsibility for the views expressed which, although made in good faith, are those of the authors alone.
2. Copyright and photocopying: © 2011 Great Southern Press Ltd and Clarion Technical Publishers. All rights reserved. No part of this publication may be reproduced, stored or transmitted in any form or by any means without the prior permission in writing from the copyright holder. Authorization to photocopy items for internal and personal use is granted by the copyright holder for libraries and other users registered with their local reproduction rights organization. This consent does not extend to other kinds of copying such as copying for general distribution, for advertising and promotional purposes, for creating new collective works, or for resale. Special requests should be addressed to Great Southern Press Ltd, PO Box 21, Beaconsfield HP9 1NS, UK, or to the editor.
3. Information for subscribers: The Journal of Pipeline Engineering (incorporating the Journal of Pipeline Integrity) is published four times each year. The subscription price for 2011 is US$350 per year (inc. airmail postage). Members of the Professional Institute of Pipeline Engineers can subscribe for the special rate of US$175/year (inc. airmail postage). Subscribers receive free on-line access to all issues of the Journal during the period of their subscription.
4. Back issues: Single issues from current and past volumes are available for US$87.50 per copy.
5. Publisher: The Journal of Pipeline Engineering is published by Great Southern Press Ltd (UK and Australia) and Clarion Technical Publishers (USA):
Great Southern Press, PO Box 21, Beaconsfield HP9 1NS, UKtel: +44 (0)1494 675139fax: +44 (0)1494 670155email: [email protected]: www.j-pipe-eng.com www.pipelinesinternational.com
Editor: John Tiratsooemail: [email protected]
Clarion Technical Publishers, 3401 Louisiana, Suite 255, Houston TX 77002, USAtel: +1 713 521 5929fax: +1 713 521 9255web: www.clarion.org
Associate publisher: BJ Loweemail: [email protected]
6. ISSN 1753 2116
THE Journal of Pipeline Engineering (incorporating the Journal of Pipeline Integrity) is an independent, international, quarterly journal, devoted to the subject of promoting the science of pipeline engineering – and maintaining and
improving pipeline integrity – for oil, gas, and products pipelines. The editorial content is original papers on all aspects of the subject. Papers sent to the Journal should not be submitted elsewhere while under editorial consideration.
Authors wishing to submit papers should do so online at www.j-pipeng.com. The Journal of Pipeline Engineering now uses the ScholarOne manuscript management system for accepting and processing manuscripts, peer-reviewing, and informing authors of comments and manuscript acceptance. Please follow the link shown on the Journal’s site to submit your paper into this system: the necessary instructions can be found on the User Tutorials page where there is an Author's Quick Start Guide. Manuscript files can be uploaded in text or PDF format, with graphics either embedded or separate. Please contact the editor (seebelow) if you require any assistance.
The Journal of Pipeline Engineering aims to publish papers of quality within six months of manuscript acceptance.
Notes
v v v
www.j-pipe-eng.comis available for subscribers
Sample
copy
not fo
r dist
ributi
on

2nd Quarter, 2011 71
THE DEVELOPMENT OF ARCTIC petroleum pipelines has always suffered from huge mood swings.
In North America, the earliest Arctic line was the 100-mm Canol pipeline from Norman Wells to a refinery at Whitehorse, completed in 1944 and required in order to support the war effort in Alaska. There was much development in the 1960s and 1970s, starting with the marine pipelines in the Cook Inlet of Alaska, not by any means a straightforward project and the subject of a remarkable film. The presence of oil close to the Canning River in northern Alaska had been known since the early 1900s, but already in 1925 geologists had recognised that it would be difficult to export oil by tanker.
In the late 1960s, it turned out that the Prudhoe Bay field close to the Arctic Ocean shore of Alaska was very large indeed. Tanker transport was a possibility, either eastward to the Atlantic through the North-West Passage or to westward around Point Barrow and through the Chukchi Sea and the Bering Strait to the Pacific and California. The tanker options had grave difficulties. The North-West Passage had been dreamed about for three centuries, but only a handful of ships have ever actually traversed it, and that only in summer. It is some 3500km from Prudhoe Bay to relatively open water in Davis Strait, all of it is covered with thick ice in winter, and some difficult sections ¬¬– such as M’Clure – have heavy ice all the year round. Going westward instead, the distance to Bering Strait is less than half at 1500km, but the area around Point Barrow is a notorious choke point, so that that area may be blocked by ice when the sea further east is open. However, that option was pursued as a demonstration project. The tanker Manhattan was ice-strengthened and reconstructed at a cost of $50 million, and in 1969 it was taken through the North-West Passage from Philadelphia to Prudhoe Bay and back. It brought out one symbolic barrel of oil, but it was concluded that year-round transportation of 2Bb of oil a day would require a pipeline. Reportedly, that decision had already been taken before the tanker demonstration had been completed.
Other options were looked at. The Russians had for many years moved large amounts of oil to the Russian Far East by rail, and some railroad enthusiasts proposed that Alaska Railroad be extended to the Arctic shore, or alternatively that a railroad might be built to join the existing Canadian railroad at Great Slave Lake. Those concepts were considered seriously at the time, though it was pointed out that so many tankcars would be needed that it might be simpler just to park them and weld them end-to-end to make a pipeline.
A pipeline to an ice-free port on the southern coast of Alaska was the obvious and more sensible choice. The Alaska pipeline
was conceived, survived huge controversy, and constructed in the late 1970s. The controversy was extreme: conservationists argued that the pipeline would ‘ruin Alaska’, but even the people most hostile to the petroleum industry do not advance that argument today. Coates [1] has written an instructive history of the lengthy argument, thought-provoking to anyone involved in pipelines, and there are many other books.
Meanwhile, there was lots of gas, both in the Mackenzie Delta area and close to the oil at Prudhoe Bay. The Canadian Arctic Gas pipeline, an earlier version of the current Mackenzie Gas pipeline project, was planned and went to lengthy public hearings. The Berger Inquiry recommended a 10-year moratorium on construction, essentially not for technical reasons but on socio-political grounds and because First Nations’ land claims were not settled. Equally ambitious competing projects were put forward, founded on the notion that hydrocarbon prices would rise inexorably and that $10 gas was only a year or two away. One of them was the Polar Gas pipeline to bring gas from Melville Island [2] through the Arctic Archipelago, perhaps south to the west of Hudson Bay, or south-east to join up with a Mackenzie Valley line, or even east across the mouth of Hudson Bay and down through Quebec. There were several competing Alaskan gas pipeline projects, the most attractive following the Alaska Highway to Alberta.
Hardly anything more was done on the ground, except for a few short lines tied-in to the Alyeska system, and one experimental subsea flowline bundle in the Arctic Islands [3]. In retrospect, it can be seen as providential that the big projects did not go ahead in the early 1980s: the investors would still be waiting to get their money back.
At the same time, and on the other side of the world, the Russians were developing the mammoth gas province of the Yamal peninsula, and building large-diameter pipelines, first to their sphere of influence in Eastern Europe and later both further westward to the EU and eastward towards China. They bought western pipe, but otherwise worked largely alone, and in the process developed new technologies such as flash-butt welding that remain largely unknown in the west [4, 5]. They did almost nothing under water.
In 1986 the mood collapsed with the oil price. Oil companies stopped design projects, eliminated most of their specialists, and lost their expertise. Much knowledge was lost, and some of it will have to be expensively rediscovered. Later, confidence slowly crept back. Prices recovered, political change made projects in the former Soviet Union practicable, and of course the hydrocarbons are still there. The northern Caspian is only 46°N but shares many of the problems of the Arctic, such as ice-
Guest Editorial
Arctic pipelines and the future
Sample
copy
not fo
r dist
ributi
on
The Journal of Pipeline Engineering72
covered sea, extreme low winter temperatures, and ice gouging. The reserves in that region are enormous: the oil-in-place in the Kashagan field is estimated at between 30 and 50B barrels, and one estimate of the development cost puts it at $136 billion. Two comparatively small Arctic offshore pipeline projects were carried out at Northstar (once called Seal Island, a name abandoned for reasons of environmental tact) and at Ooogaruk [6, 7], both in shallow water.
Movingon
In 2011 we are facing another collapse of confidence in ambitious Arctic projects, particularly under water. That has been brought about by two factors: the Macondo catastrophe in April 2010, and the unexpected development of alternative gas reserves in the north-eastern and western USA. It is hard to overestimate the impact of Macondo, comparable with the impact of Chernobyl on the nuclear power industry, as the writer has argued elsewhere. On 19 April, 2010, almost anyone in the offshore industry would have argued that the industry was on top of its game, and that though there might be occasional mishaps, competence had reached a level at which major pollution events were unlikely. Ongoing disasters like Lusi in Indonesia could be explained away. A week later, that argument would have been met with hollow laughter, and the inept response of the industry made matters worse. That catastrophe took place in early summer and as close as imaginable to the technical and commercial stronghold of the industry. Nonetheless it led to a five million barrel spill, took BP four months to fix, discredited the whole industry, and will lead to litigation that may well last for decades. In the Arctic context, it was pointed out that the situation would be far, far, worse if there should be a similar mishap in the Beaufort Sea, most of all if it were to happen when the sea ice was too thick to be easily broken by ships but too thin for vehicles. Some technology for Arctic oil clean-up exists, but experience is extremely limited.
Many of the technical difficulties remain. Progress has been disappointingly slow, and many of the issues identified 40 years ago have not been solved satisfactorily. On land, one issue is frozen ground and differential settlement: the amount of ice contained in frozen ground varies enormously, and there can be big variations within a few metres, both horizontally and vertically. It is difficult to follow the first principle of construction on permafrost – Tsytovich’s injunction [8] – to change the thermal regime as little as possible, and therefore to make the pipeline temperature coincide with the ground temperature. If the pipeline is warmer than the ground, the permafrost under and around the pipeline thaws, and the pipeline settles further where the ground had been ice-rich, and less far where there had been less ice. The pipeline bends in response, and the bending can overstress the pipe wall and cause it to buckle. If, on the other hand, the pipeline is colder than the ground, the soil beneath the pipe freezes progressively, and migration of water towards the freezing front causes the soil to heave, and again the pipeline is compelled to bend and may buckle locally. That bending can damagingly interact with other forms of buckling such as lateral and upheaval buckling. Much
remains to be learned about how to carry out the enormous amount of geotechnical survey work required in permafrost areas, particularly in discontinuous permafrost. Yet another complication is the effect of climate change.
An alternative is to support the pipeline above the ground surface. The supports can be simple piles, or they can more sophisticated thermopiles that actively keep the ground frozen around the bases. Thermopiles can be subject to internal corrosion, and thermal surveys have suggested that they do not invariably operate satisfactorily. Over several hundred kilometres of the Alaska oil pipeline, those options were selected conservatively whenever it was uncertain if a buried line would be safe. They are expensive, they are visually intrusive, there have to be crossings for wildlife (though caribou turn out to be rather intelligent), an above-ground system may be adversely affected by earthquakes, and the pipeline remains vulnerable to malicious damage and to fools armed with rifles. Much remains to be learned about how to design and construct an above-ground system and to be sure that it functions correctly.
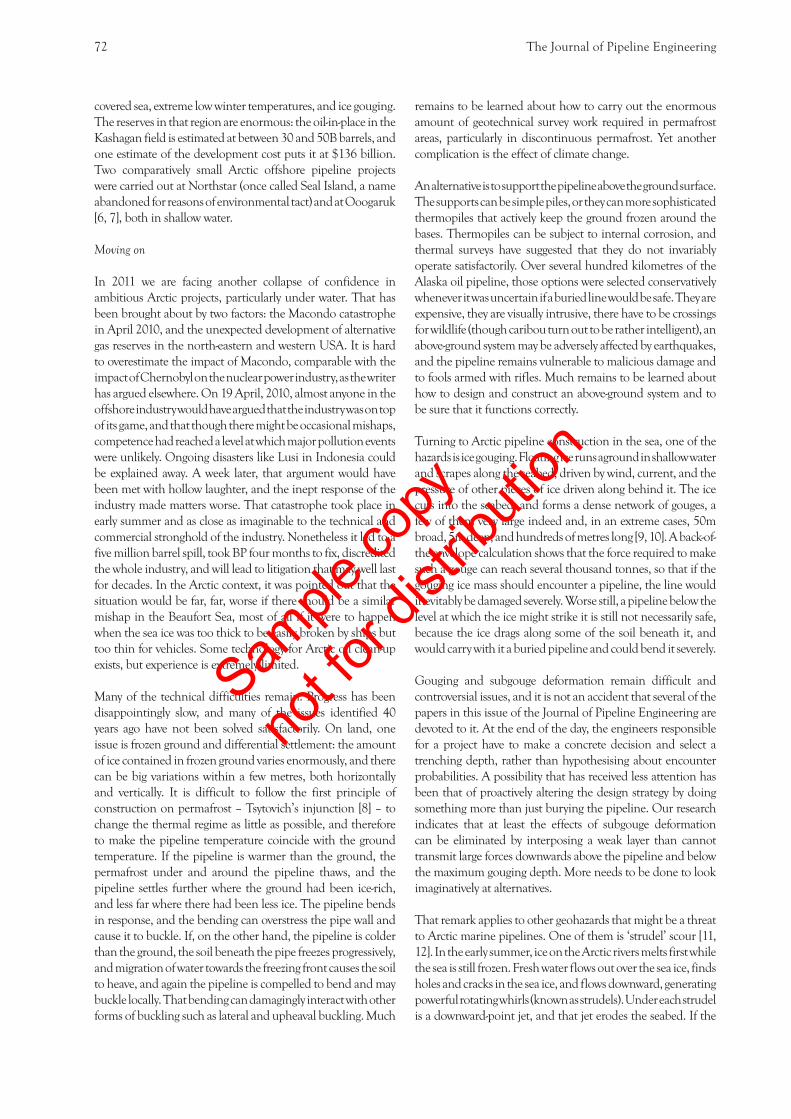
Turning to Arctic pipeline construction in the sea, one of the hazards is ice gouging. Floating ice runs aground in shallow water and scrapes along the seabed, driven by wind, current, and the pressure of other pieces of ice driven along behind it. The ice cuts into the seabed, and forms a dense network of gouges, a few of them very large indeed and, in an extreme cases, 50m broad, 5m deep, and hundreds of metres long [9, 10]. A back-of-the-envelope calculation shows that the force required to make such a gouge can reach several thousand tonnes, so that if the gouging ice mass should encounter a pipeline, the line would inevitably be damaged severely. Worse still, a pipeline below the level at which the ice might strike it is still not necessarily safe, because the ice drags along some of the soil beneath it, and would carry with it a buried pipeline and could bend it severely.
Gouging and subgouge deformation remain difficult and controversial issues, and it is not an accident that several of the papers in this issue of the Journal of Pipeline Engineering are devoted to it. At the end of the day, the engineers responsible for a project have to make a concrete decision and select a trenching depth, rather than hypothesising about encounter probabilities. A possibility that has received less attention has been that of proactively altering the design strategy by doing something more than just burying the pipeline. Our research indicates that at least the effects of subgouge deformation can be eliminated by interposing a weak layer than cannot transmit large forces downwards above the pipeline and below the maximum gouging depth. More needs to be done to look imaginatively at alternatives.
That remark applies to other geohazards that might be a threat to Arctic marine pipelines. One of them is ‘strudel’ scour [11, 12]. In the early summer, ice on the Arctic rivers melts first while the sea is still frozen. Fresh water flows out over the sea ice, finds holes and cracks in the sea ice, and flows downward, generating powerful rotating whirls (known as strudels). Under each strudel is a downward-point jet, and that jet erodes the seabed. If the
Sample
copy
not fo
r dist
ributi
on

2nd Quarter, 2011 73
Technology Conference, Houston, 2, 765-772.4. Flash butt welding video, McDermott, Inc, 1990.5. G.O.Andersson and M.Weidemann, 1985. Flash butt
welding for S-lay barges. Proc. 17th Annual Offshore Technology Conference, Houston, 261-273, OTC 4869.
6. G.A.Lanan, J.O.Ennis, P.S.Egger, and K.E.Yockey, 2001. Northstar offshore Arctic pipeline design and construction. Proc. Offshore Technology Conference, Houston, OTC13133.
7. G.A.Lanan, T.G.Cowin, B.Hazen, D.H.McGuire, J.D.Hall, and C.Perry, 2008. Oooguruk offshore Arctic flowline design and construction. Proc. Offshore Technology Conference, Houston, OTC19353.
8. N.A.Tstyovich, 1975. Mekhanika merzlykh gruntov (The mechanics of frozen ground) English translation: Scripta Book Co, Washington.
9. A.C.Palmer, I.Konuk, G.Comfort, and K.Been, 1990. Ice gouging and the safety of marine pipelines. Proc. 22nd Offshore Technology Conference, Houston, 3, 235-244, OTC6371.
10. C.M.L.Woodworth-Lynas, J.D.Nixon, R.Phillips, and A.C.Palmer, 1996. Subgouge deformations and the security of Arctic marine pipelines. Proc. 28th Annual Offshore Technology Conference, Houston, 4, 657-664, OTC8222.
11. A.C.Palmer, 2000. Are we ready to construct submarine pipelines in the Arctic? Proc. 32nd Annual Offshore Technology Conference, Houston, OTC12183.
12. W.F.Weeks, 2010. On sea ice. University of Alaska Press, Fairbanks.
scour hole it creates intersects a pipeline, the pipeline might be damaged by vortex-induced oscillation, the line might be overloaded, and the strudel might interact with other forms of sediment transport, such as the formation of sandwaves. Some research suggests that the probability of damage from that source is relatively low, but on the other hand it has been suggested that the presence of a pipeline might encourage the formation of a strudel immediately above, because heat from the pipeline would be convected upwards and thin the ice.
These and other technical issues will rightly be scrutinised with great care, before any decisions to build Arctic pipelines are reached, whether offshore or onshore. Handwaving and appeals to industry experience and competence will not be enough. The unfortunate experience of the past year will heighten awareness. There is much to do!
References
1. P.A.Coates, 1993. The Trans-Alaska Pipeline controversy: technology, conservation, and the frontier. University of Alaska Press, Fairbanks.
2. A.C.Palmer, R.J.Brown, J.P.Kenny, and O.M.Kaustinen, 1977. Construction of pipelines between the Canadian Arctic Islands. Proc. 4th International Conference on Port and Ocean Engineering under Arctic Conditions, St John’s, Newfoundland, 1, 395-404.
3. A.C.Palmer, D.J.Baudais, and D.M.Masterson, 1979. Design and installation of an offshore flowline for the Canadian Arctic Islands. Proc. 11th Annual Offshore
Sample
copy
not fo
r dist
ributi
on

Prague, 10–13 October, 2011
The international gathering of the global pigging industry!
Courses
Conference
Exhibition
The PPIM Conference is recognized as the foremost international forum for sharing and learning about best practices in lifetime maintenance and condition-monitoring technology for natural gas, crude oil and product pipelines.
Plan to be there: www.clarion.org or call us at +1 713 521 5929
The Radisson Blu Hotel, Prague, Czech Republic
Conference Organizers
PPIM_FP.indd 1 3/06/11 8:29 AM
Sample
copy
not fo
r dist
ributi
on

2nd Quarter, 2011 75
This is the opening plenary address presented at the recent Pipeline Workshop on Managing Pipeline Integrity held in Banff, Canada, in April, and organized by Canmet.
IT IS A GREAT privilege to be given the opportunity to speak to you this morning on a topic that is rapidly
becoming the focal point of every decision and discussion about pipeline operations, from the board room to the control room. I greatly appreciate the workshop planning committee allowing me to share with you some thoughts I have developed over my 21 years of involvement with pipelines working first as the US government’s chief pipeline safety regulator and continuing through my 12-year career in PRCI.
Those of you who know me, know that I am not an engineer, scientist, or technocrat; rather I am that most universally mistrusted sort – a lawyer. So, I will not be speaking today about eddy currents, or Charpy tests, guided wave ultrasonics, geophysical stresses, or the dynamics of the microstructure in the heat affected zone. Fortunately, those topics and many more will be considered in this world-class event over the next two days. Rather, I would like to note some of the challenges facing the pipeline industry, challenges that I believe must be faced in far more aggressive and creative ways than have been common over the last several decades. Due to my background, the history of pipeline development, and location of this workshop, my remarks will necessarily be based on the North American experience, with an emphasis on the US. However, the North American perspective remains, for the time being, the best surrogate for general impressions about this industry. And certainly, given its core role in pipeline safety, reliability, and productivity, integrity is an appropriate platform for considering where we are and where we are headed.
Anyone working in the field of pipeline operations, no matter their field of expertise, quickly learns the critical importance of pipelines in the economic and societal well-being of a nation, a region, and the world. Because they are so important – meshed with vital interests – they also are subject to the forces of change and challenge that are underway across every dimension of life. For example, in the realm of economics and finance, pipelines are that essential, but too often obscured, component of the investment portfolio – the actual thing in being – the physical asset – upon which enormous financial stakes are created and morphed into products ever more removed from that physical asset. We
now have ample proof, established over the last decade from Enron to the global financial melt-down, that the further one gets from the physical asset, the more tenuous the financial asset becomes. Despite going from a heavily rate-regulated industry to one that is less regulated but perhaps not more clearly so, pipelines have continued to produce solid returns on investment to a point where today we have pipelines owned by insurance companies and investment funds and led by MBAs in finance. The function of the pipeline becomes, in the first instance, simply a source for a pool of funds – the focus is on generating the revenue necessary for developing other opportunities offering perhaps higher risk, but also higher returns. This type of speculation – and the risks it generates – is anathema to all of us who have a deep commitment to pipeline integrity and the science and commitment that underpin it.
The changes we are already seeing, and the ones to come, align for the purposes of this discussion under three distinct, but interrelated drivers that define the role and value of pipelines: the business drivers, the operations drivers, and the external drivers. From the perspective of this workshop, the idea of system integrity, and its assurance and management, runs through each of these drivers and is critical to the pipeline industry’s ability to meet the demands they impose. I would like to discuss each one in turn.
Business driversI am using the term “drivers” to address both motivation at one end of a spectrum and constraints at the other: often these two are the same depending on one’s perspective and function. Taken together, they include all that has brought us to this point and all that must be done to take us into the future. Here are five key business drivers that I believe set the table for the influences on, and the role of, pipeline integrity:
• First, preserving, enhancing, and extending the pipeline asset so that it can continue to play its increasing role of providing revenue to support collateral applications and business opportunities. In this way, pipeline owners can maximize the value of pipelines and the returns they yield to shareholders.
A perspective on the futureby George W Tenley, Jr
Immediate Past President, Pipeline Research Council International, Inc. Falls Church, VA, USA
Sample
copy
not fo
r dist
ributi
on

The Journal of Pipeline Engineering76
You will recall I noted this as a key business driver as well. But as a business driver, the focus is on the asset and what it can produce in terms of return on investment. Here, I am referring to the care and feeding of a system.
• Second, obtaining sound, pertinent data, that can be converted into actionable information in a responsive, cost-effective way. I have spoken with many people over the last few years – both in the industry and among key stakeholders – who believe that we are being overwhelmed by a flood of data that makes the generation, management, and application of usable information difficult and wasteful.
• Third, better, safer, more cost-effective tools to determine the state of the infrastructure, and to do so to the greatest extent practicable in real time. This is increasingly important as new systems are developed that will be tied into existing lines. This driver is moving away from a focus predominantly on defect and damage assessment and management, to include a sharper focus on protecting the right-of-way from intrusion.
• Fourth, developing projects for installation in harsh environments from which much of the new energy supplies are emanating. I am hopeful that this direction will become a key influence for increased research funding, which I will speak to later.
• Fifth, shrinking the environmental footprint in the development of new systems and in the maintenance of existing lines. This driver has a strong link to the external drivers, because increasingly, government regulators are imposing mandates that bring the environmental fully within system integrity. Unfortunately, this has the effect of increasing the number of overseers to whom the industry must be responsive and to whom they are vulnerable. It also broadens the impact of pipeline safety laws and regulations.
• Sixth, and although listed last, perhaps the most significant one – the accelerating and deep decline of the industry’s knowledge base due to corporate realignments and retirement. This driver has three distinct elements: » The loss of key personnel whose knowledge of the
system is more than the sum of the provisions of the operations and maintenance manual.
» The urgency to capture what those people know and to do so in a form that can be transferred to a new workforce.
» And, the decline in the pool of new talent to take the place of those who we are losing.
External driversThose drivers that I term “external” refer primarily to laws, policies, and regulations that impact the industry and that the industry has a relatively limited ability to affect. However, before listing those, I believe there is an overarching influence
• Second, transporting new energy supplies through a reliable, secure infrastructure. This is perhaps the largest opportunity for many pipeline systems because it introduces flexibility and options in the use of the infrastructure and thereby offers an important hedge in the midst of changes in the energy mix. Critical to these two related drivers is the need to build and reconfigure pipelines to link emerging new supplies with growing and changing market centres.
• Third, maximizing value by minimizing liabilities. While this driver is seemingly obvious and should be a key basis on which to make decisions for system enhancements, in all too many cases the reality is that the notion of “avoided costs”, so integral to financial risk management, seems ignored in regard to integrity management by too many operators who have not suffered that one big incident that undermines their credibility.
• Fourth, translating demands into opportunities such as the growth of alternative fuels and the environmental mandates for carbon capture and sequestration. As I will mention in a moment, this business driver is perhaps most influenced by the external drivers because operators may run into often inconsistent regulatory regimes – for example, economics vs safety, or the environment vs safety.
• And finally, the accelerating globalism has created a voracious demand for equipment, tools, and talent and with it the steep increase in costs for those resources. This is a stressor on budgets that places constraints on some of the more aggressive inspection, repair, and remediation strategies otherwise available to operators. This is not to say that our systems are necessarily declining due to this driver, but it does suggest that choices for where to place available resources are much more difficult.
Operations driversAs all of you know, far better than I, operating a pipeline system is a complex choreography of art and science, and in that sense, it is not unlike medicine. I will always remember a presentation given by Sridhar Narashi several years ago in which he likened the pipeline system to the human body – it is a very effective metaphor. To draw on it here, like the care of the human body, the care of a pipeline system involves a mix of wellness techniques, internal and external diagnostics, adjustment and correction, and, where necessary, intervention.
But, back to pipelines – here are the key operations drivers that I believe most directly influence pipeline operations:
• First, life extension of the pipe and all equipment and facilities associated with it. By far, this driver has garnered most of the attention and expenditure in the pipeline systems of North America – and, I believe, most of the attention in this workshop.
Sample
copy
not fo
r dist
ributi
on

2nd Quarter, 2011 77
on every perception or decision of non-industry stakeholders, and it emanates from an underlying societal deficiency, namely a grossly inadequate understanding of risk.
At best, the understanding of risk is solely a function of whether one accepts the risk regardless of whether the risk is truly understood. At this end of the spectrum, are those who fly on airplanes, those who drive over the speed limit, those who take medicines well beyond their discard date, and parents who discuss sex with their teenage children. At worst, and of greatest relevance to us, risk is seen as a function primarily of consequence, with too little attention to probability.
So, in the realm of pipelines for example, far too many resources are dedicated to preventing that which is perceived as truly horrific at the expense of investment in overall integrity and productivity. It is this failure of society at large, and its government representatives, that the pipeline industry must effectively address if it is to achieve the requisite level of discretion to enable the best that you have to offer to optimize integrity management.
In considering the drivers that emanate from government policy and decision making, it is important to acknowledge the fact that, in most cases, pipelines were in place before the current level of government oversight was imposed. Consequently, there has been a reconciliation underway for several decades that seeks to balance the growing thirst for energy and the safety of those who use the energy and those who abut the pipeline infrastructure. This reconciliation has been, and continues to be, very unstable because it is done largely in a political environment where focus is constantly shifting – waxing and waning as ruling parties decide just what should be imposed on the industry.
As many of you know, those pipelines that were built more than 50 years ago represent the best of the-then current engineering, not the science which we have available to us today. With specific relevance to the matter of pipeline integrity, this has played out in the realm of just how much discretion should be granted to the pipeline operator; or, conversely, just how strong and how specific should government mandates be.
These are what I consider the key external drivers:
• First, the government’s need to ensure that the ageing infrastructure is being properly maintained and strengthened where needed. As you know, the government’s focus began to really sharpen in the mid-1990s in the wake of several significant accidents and the industry’s response – which I have strongly supported – of a broad commitment to risk management. The ebb and flow of legislative and regulatory mandates is directly tied to accidents, with the regulatory tide becoming ever higher when the accidents come in groups, as they did in 1994 and
1995, 2000 and 2001, and most recently, last year.• Second, the interaction of safety regulation and
economic regulation, in which the latter can conflict with the former in a way that can build inefficiencies and kill opportunities in how pipelines are operated. In the US for example, there are actually disincentives to research funding created by requirements of the Federal Energy Regulatory Commission that largely undermine an available research credit by requiring the operator to obtain it by opening itself up to a full rate case and the constraints that can impose.
• Third, the interplay between political agendas not directly related to pipelines, but which in their execution directly implicate pipelines and impose upon them mandates that lead to expenditures that perhaps could be applied more productively elsewhere. An example of this is the US political agenda for ethanol. Despite its implications for adding to the worldwide shortage of grain, and the questionable role ehtanol plays in adding to the mix of alternative fuels, the pipeline industry must make decisions and take actions that enable the transportation of this fuel, in all of its various forms and compositions, and dedicate the funding necessary to assure the fuel chain is safe and reliable.
• And finally, the reality that the evolution of safety regulation in North America has moved to a new focus; namely, the total corporate responsibility for every facet of the operation, including the integrity management plan and the actions taken under it. This strong focus on the “management” side of “integrity management” has occurred over a relatively short timeframe, and has been made operational in the wake of serious industry sins of omission at the highest levels of corporate leadership. Of all the drivers that influence integrity management, this may be the most important because it gives a new lens through which to observe the most important expenditures the company can make to perform in the face of all of its drivers.
Going forwardMy purpose this morning is to provide you with a perspective on the pipeline landscape upon which all the matters you will discuss this week need to be considered. To sustain the remarkable record this industry has achieved in terms of integrity, reliability, and productivity, I believe the industry will have to adopt a more aggressive posture and commitment if it is to meet the reasonable goal of assuring the lowest practicable risk in its operations.
Here is my short list of what I believe we need to do to reach that goal, coloured by my strong belief in the essential role of research:
• We need to adopt as a reasonable goal the reconciliation of the industry’s and government’s
Sample
copy
not fo
r dist
ributi
on
The Journal of Pipeline Engineering78
view of the data that best reflects technical and practicable operating feasibility and the relevance of the data to safe operations. I believe the first step in this effort needs to be a summit of all relevant players in pipeline integrity; that would be the people in this room and your colleagues, meeting with government regulators and other stakeholders whose roles influence pipeline operations. While it is true that there have been initiatives to achieve this, they have lacked the united, contemporaneous commitment of all relevant players. And, once a reconciliation has been achieved, the government will have to assure that the data the industry generates is protected from inappropriate release and misuse.
• From that base, we need to agree on the core databases that will be necessary to inform research, standards, and regulations – both going forward and for assessing the merit of current risk assessment models and risk management plans. A byproduct of this effort would be a strong, relevant basis for strengthening the current, formal and informal efforts of leading organizations such as PRCI, EPRG, and NYSEARCH to collaborate in capturing and refining the data they have generated over decades. To do this effectively will require a substantial investment, but without it we will continue to have duplication, critical gaps, and we will be condemned to undertake first-phase, one-off data gathering exercises that serve to delay research results in an environment in which the demand is growing for faster delivery and application of those results.
• We need to agree that the growing crisis in the loss of our knowledge base is a strategic issue for the industry, and not just a human resources problem for pipeline owners and operators. Again, the perspectives, knowledge, and experience in this room need to be shared broadly and collaboratively across the industry, and the industry needs to craft initiatives and programmes, in partnership with leading universities and other learning centres, to capture the current knowledge base and to incorporate it into the formal education programs that have traditionally provided our workforce as well as within specific company programmes.
Finally, a few points specifically in regard to pipeline research:
We need to move away from continuing many, small-investment, incremental research efforts and instead undertake larger impact efforts that either conclude the more important incremental efforts underway, or take the industry in new directions. In this regard, PRCI, under the leadership of Jerry Rau, has begun to seek out longer-term, higher-impact research programmes with a focus on cross-over technologies and applications. Included here would be the synthesis of proven technologies in the realms of medical imagining, automotive sensors, and the embedding
of nanotechnologies in many phases of pipeline operations from product flow to real-time integrity monitoring,
I noted earlier that one of the key operations drivers is asset life extension, and it has been that driver that has led the industry to pursue incremental projects that have diluted the available research funds at the expense of a true vision for the future. We are stuck in this reality for good reasons, principal among them the fact that through your efforts we have advanced the science of pipeline integrity and we have built the safest of all transportation systems. And, of course, being stuck in one’s own success is not the worst situation in which to be stuck.
From my 12 years at PRCI it is very clear that this industry invests too little in research, and I stress the word “invest”. At its height in the early 1990s, pipeline research garnered more than $25 million through the GRI programme and the PRCI contributions. Today, there is no GRI, and PRCI, using an aggressive co-funding model, primarily with government, garners about $13 million. At the same time, the number of pipeline companies with meaningful in-house research programmes has dwindled to a handful (although in other countries the in-house efforts make up a larger percentage of the overall pipeline research investment).
To turn around the current underfunded research effort, the research organizations, in concert with the researchers on whom they rely, need to craft a clear and definitive research roadmap or agenda that identifies those efforts that will produce the greatest impact and value, from the near to long-term horizon. This needs to be accompanied by a reasoned cost estimate that the industry can stand behind. This is essential to overcome the suspicion – and, in some cases, the reality – that there is duplication and waste in the current, multi-party research endeavour.
There is another adverse impact imposed by the decline in research funding for pipelines, namely the strain that is imposed on research providers in their ability to continually grow their skill sets, keep abreast of, and set, the state of the art, and invest in vital laboratory assets. If pipelines lose the talents of many of you in this room, or the ability to gain timely access to needed research facilities, then the ability to be on – and stay on – the cutting edge may be, in the best case, constrained, or in the worst case, lost.
I would also note that the largely successful cooperative research effort between industry and government – by which I am speaking of the Pipeline and Hazardous Materials Safety Administration – needs to incorporate as a core element the stimulus for creating “first adopters” to lead the application in the industry of the most important technology advances produced by the collaboration. In the absence of a strong, clear, and timely incorporation of new knowledge and technology in regulations there is no strong incentive for operators to take a chance on something new, let alone game-changing.
Sample
copy
not fo
r dist
ributi
on

2nd Quarter, 2011 79
Finally, it is time for the research conducted by this industry to serve as a featured element of the industry’s efforts to educate the public and increase the public’s awareness of the ongoing programmes of the industry by which it assures both system integrity and system reliability and productivity. This message has been relegated to a supporting role in the industry’s story, when in fact it should be the lead story because it is first and foremost a message of continuous improvement and scientific advancement. It speaks to the future, and it illuminates the best of the industry – its role, its relevance, its value, and its people.
As to its people, we are very fortunate that funding is not the only resource upon which the industry relies for conducting a relevant and responsive research programme. The other resources of knowledge, commitment, and passion are strongly represented by you. It has been my great honour and pleasure to know and work with many of you, and I know that all that has been achieved in establishing the sound technical foundation we have built for the pipeline
industry is due in large measure to you and those who preceded you in this vital work.
For the next two days you will explore the key issues that define pipeline integrity as well as the means and methods for assuring its success. These means and methods, and your commitment to their ongoing enhancement and application, are essential to the continuing success, growth, and productivity of the energy pipeline infrastructure. But, whether you are scientist, researcher, manager, technician, or engineer how you do your job, how you expand your knowledge, and how you realize the opportunities that await you, will be strongly influenced by forces that are growing in their breadth, their intensity, and their impact. Each of these will illuminate and implicate the need for sound integrity programmes under comprehensive, dynamic, corporate-wide management plans. Knowing many of you as I do, I think this industry can not only meet the challenges that it faces, but also prosper as never before.
Sample
copy
not fo
r dist
ributi
on

Pipelines International Premium is the international oil and gas pipeline industry’s foremost in-depth source of information, comprising a digest ofhigh-quality papers covering the latest technologyand reviews of the pipeline industry worldwide, anda comprehensive project database. It is comprised of:Pipelines International Digest which provides a month-ly update of papers covering all areas of theindustry – from key projects, and engineering andconstruction issues, to environmental, regulatory,legal and fi nancial issues.
Pipelines International Projects which allows subscribers to access a searchable database of completed andcurrent projects.
Subscribe or get a free 14 day trial now atwww.pipelinesinternational.com/premium
The new online information servicethat unlocks the secrets of the global pipeline industry
PIN_Premium_FP.indd 1 15/06/10 3:23 PM
Sample
copy
not fo
r dist
ributi
on

2nd Quarter, 2011 81
Gouging ice masses are a threat to underwater pipelines in the Arctic. The problem is made more severe by the fact that the soil under an ice mass is dragged forward as it gouges, so that a pipeline
might not be safe even if it is trenched deep enough for the ice itself to clear it. Subgouge deformation is incompletely understood, and predictions are uncertain.
The scheme describe here makes it possible to eliminate subgouge deformation, by placing a weak layer above the pipeline and below the gouging ice mass. The layer is not strong enough to transmit downwards the shear forces that induce the deformation. The authors describe an improved version that lends itself to straightforward installation.
ICE RUNS AGROUND IN shallow water in the Arctic seas, and cuts into the seabed as it is pushed further by wind,
current, and the pressure of other ice. Dramatic patterns of seabed gouges are revealed by sidescan sonar. Often the gouges are several metres deep. Repetitive gouge mapping confirms that gouging is a contemporary process, rather than a relic from earlier periods in which the water level and the ice climate were different. Weeks [1] summarises research on this phenomenon.
Gouging has been recognized as a potential problem for Arctic offshore pipelines since they were first thought about in the 1960s. An elementary calculation shows that the ice force necessary to cut the deepest gouges that are observed can easily reach several thousand tonnes [2]. If a gouging ice mass was to reach a pipeline, much of the gouging force would be transferred to the pipe, and severe damage would be almost inevitable: the forces present are orders of magnitude larger than the forces applied by ships’ anchors, which are a recognized threat and often damage pipelines. A pipeline might still be at risk even it were trenched deep enough into the seabed for the ice not to contact it directly, because the ice drags with it the soil beneath the ice. That subgouge deformation would carry the pipeline with the soil, and the pipeline would be severely bent, possibly so far that a bending buckle would develop and the pipeline would rupture and begin to leak.
Subgouge deformation has been investigated from various directions, among them small-scale centrifuge model tests [3], excavation of relic gouges [3], finite-element analysis [4], and larger-scale tests [5, 6]. Some recent tests [6] reach
depths that approach those found in sub-Arctic areas where ice conditions are not particularly severe. Tentative conclusions from some recent work are that:
• the displacement at the gouge base is about 1.5 times the gouge depth, in contrast to a previous formula for horizontal displacement at the gouge base [3];
• significant horizontal movements extend at least two gouge depths below the gouge base;
• the vertical distribution of horizontal movement is strongly influenced by the keel face angle: low-angle keels at 15° induce a different mechanism of subgouge deformation than high-angle 45° keels do, and the movements induced by low-angle keels die off less rapidly with increasing depth;
• the results are broadly comparable with the earlier centrifuge model [3] study, which suggested that the horizontal movement at depth z is proportional to exp(-(2/3)z/D), where z is gouge depth, but that relationship does not account for keel angle, and the agreement is a long way from exact.
All the analyses are open to criticism, and it is not yet understood how the extent of subgouge deformation depends on the geotechnical parameters of the seabed. It is doubtful that these questions will be resolved rapidly, particularly because a marked slowing in the pace of Arctic offshore exploration and development seems likely to restrict further research in the next few years. The objective of the research described here is to find a way of isolating a pipeline from subgouge deformation, so that it becomes less important to be able to predict its extent. It is then possible much to reduce the trenching depth required to safeguard a pipeline.
Corresponding author’s contact details:tel: +65 6516 4601email: [email protected]
Protecting Arctic marine pipelines against subgouge deformation
by Madeline Chua, Professor Andrew Palmer*, and Hendrik Tjiawi
Centre for Offshore Research and Engineering, National University of Singapore, Singapore
Sample
copy
not fo
r dist
ributi
on

The Journal of Pipeline Engineering82
Weak layer Run Maximum bending strain (µs)
(none) 1 787
(none) 2 861
(none) 3 649
clay 1 172
clay 2 172
geotextile/clay sandwich 1 115
geotextile/clay sandwich 2 133
geotextile/clay sandwich 3 147
Table 1. Test results.
Fig.1. Isolation scheme.
Fig.2. Experiment scheme (not to scale).
20
steel keel
geotextile/clay sandwich layer 60 410
170
150
pipe
marker beads
water
sand
600 Gouge direction 600
Sample
copy
not fo
r dist
ributi
on

2nd Quarter, 2011 83
IsolationThe idea is to place above the pipeline a weak layer that cannot transmit downward the shear stresses that drag the soil in the gouge direction. The weak layer is installed below the maximum depth the ice itself will gouge to, and the pipeline is placed below the layer. The required trenching depth is then the sum of the maximum gouging depth, the weak layer thickness, and the pipe diameter. The scheme is illustrated in Fig.1.
Model tests on the first version of this scheme were reported in POAC-2009 [7]. They were encouraging enough to suggest further research on an improved version. The recent results on the improved version are summarised here and in greater detail by Chua [8].
The sequence of construction will be:
• 1 excavate the pipeline trench; • 2 lower or pull the pipeline into position on the
bottom of the trench;• 3 backfill the trench up to the level of the top of the
pipe; • 4 install the weak layer;• 5 backfill the trench up to the level of the original
mudline.
Step 5 might be omitted and the trench left open, although this point has been the subject of much discussion. If the trench is backfilled and ice gouges through the backfill, the vertical reaction from the backfill lifts the ice, so that it gouges less deeply than it would if it were floating freely. Moreover, the backfill gives the pipeline some level of thermal insulation, provides weight over the pipe to stabilize it against upheaval buckling, and protects it from other kinds of disturbance, such as high seabed currents and strudel scour, and from anchor dragging if ships are ever present. On the other hand, if the trench is left open one construction step is saved, the pipe can be monitored more easily, and if a repair were necessary it could be carried out straightforwardly.
The first scheme investigated had a layer of weak clay tremied into the trench. That might be difficult to accomplish neatly, because the upper surface of the clay might be uneven, and the clay might be moved by currents and waves in the interval between steps 4 and 5. An alternative that might be more convenient is to contain the one or more weak and slippery layers between sheets of geotextile.
ExperimentsIt was impractical to carry out the tests in a geotechnical centrifuge, and so they were carried out at 1g. That raises questions about scaling and similarity, which other research has taken into account by working at nearly full scale. Our opinion is that if the weak layer concept works with somewhat distorted scaling, it ought still to work at full scale. That judgement is supported by earlier research on pipeline trenching ploughs [9, 10], where it was not feasible to test the models in a geotechnical centrifuge, in part because cutting experiments use up such a large quantity of soil. Small-scale models were extensively tested at 1g and used to design geometrically-similar full-scale ploughs. Even though the similarity conditions were not satisfied, those tests proved useful and the ploughs were afterwards found to operate correctly. A further argument follows from the observation that when soil is cut by a blunt object, the stresses induced by the cutting process are large by comparison with those induced by gravity.
Figure 2 illustrates the experimental scheme, in the version with a weak clay layer sandwiched between two layers of geotextile. The test tank was rectangular, 4m long and 600mm broad, and contained fine sand (D50 0.6mm), 580mm deep and initially with a level upper surface. Figure 3 is a photograph after a test, when the water had been drained so that the pipe could be excavated. The water level was 170mm above the sand. The ice keel was modelled by a truncated block of steel, driven by a lead screw and prevented from moving upwards by rails on either side of the tank. The advancing face of the model keel was at 31° to the horizontal. The gouging depth was 150mm, the gouging distance was 1200mm, and gouging
Fig.3.Experimental set-up.
motor
steel keel
tank
Sample
copy
not fo
r dist
ributi
on

The Journal of Pipeline Engineering84
to the model pipe; in addition, the soil deformation was observed by placing lines of marker balls above and below the clay layer, and excavating the soil to find their displaced positions.
The weak layer was 20mm thick, and consisted of a layer of marine clay sandwiched between thin sheets of polyethylene, of the kind commonly used for garbage bags, two sheets above the clay and two below. The clay had a 47.5% water content. A vane shear test determined its strength to be between 4 and 5kPa, though at this low strength level the clay continues to deform under stress and behaves as a viscoplastic solid rather than as a material with a defined yield strength.
TestsThe objective of the test programme was to compare a weak layer that combined geotextile and clay with a layer of clay alone, and to compare both with a base case without a weak layer.
Table 1 lists the maximum bending strain in the model pipe for three cases: no weak layer (three tests), a clay weak layer (two tests), and a geotextile/clay sandwich (three tests). Bending strain is defined here as the difference between the measured maximum tensile strain on one side of the pipe and the maximum compressive strain on the other side of the pipe. The only change between the tests was in the weak layer: the pipeline, the sand, the keel, and the gouging speed were not changed. The responses are reasonably consistent between tests. Figure 4 plots the bending strain averaged for each of the three cases as a function of keep position.
It can be see that the sandwich geotextile/clay weak layer reduces the maximum bending strain by between 80 and 85%, and that that is a significant improvement over the clay alone. Figure 5a shows the position of the beads in the sandwiched clay layer above the pipe after gouging, marked by white paper flags, and allows them to be compared with the original positions in line with the marker rod. Figure 5b shows that the beads below the lowest geotextile lay did not move. Figure6
was stopped 500mm before the end of the tank. The force on the keel was determined approximately by installing a soil pressure cell in the advancing face, and calibrating the cell by applying loads when the keel was stationary
The model pipe was a 530-mm long, 6-mm outside diameter, copper tube with 1mm wall thickness, annealed at for 1hr at 400°C to reduce its yield strength. The ends were supported so that they could not move in the gouging direction but were free to rotate and to move axially. Strain gauges were glued
Fig.4. Comparison of bending strains.
Fig.5. (a - top) Movement of beads in geotextile/clay layer; (b - bottom) beads below weak layer.
Sample
copy
not fo
r dist
ributi
on
2nd Quarter, 2011 85
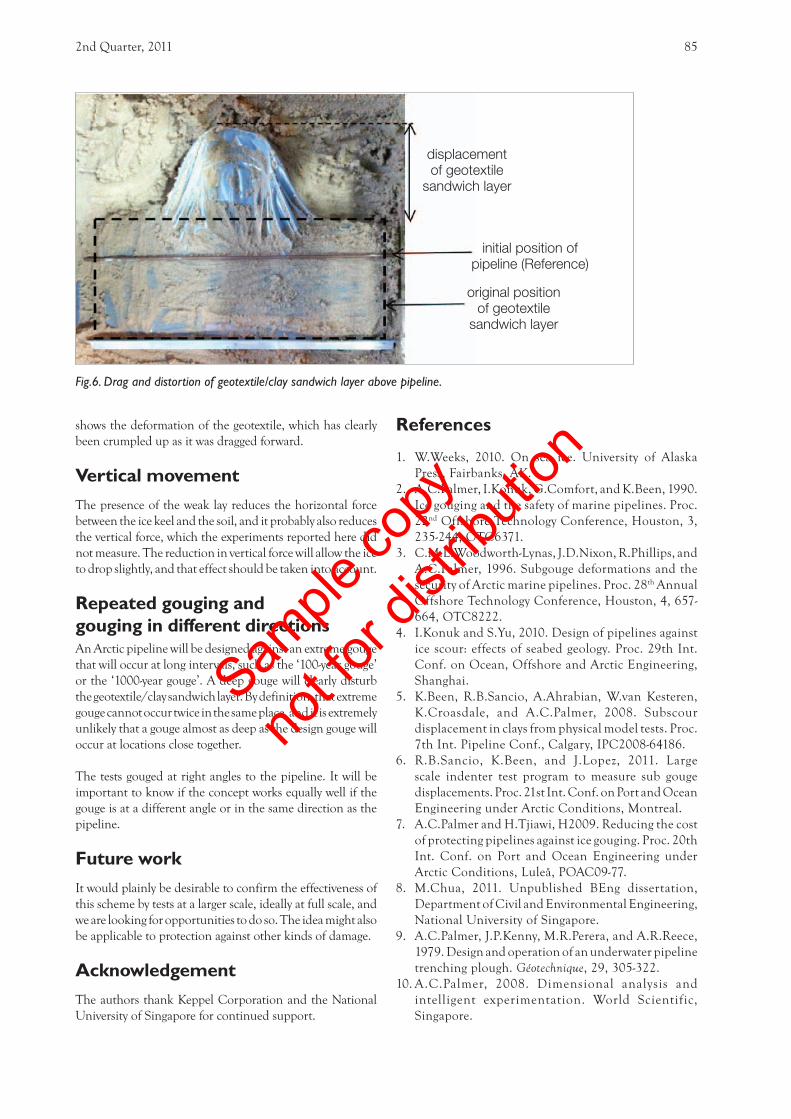
shows the deformation of the geotextile, which has clearly been crumpled up as it was dragged forward.
Vertical movementThe presence of the weak lay reduces the horizontal force between the ice keel and the soil, and it probably also reduces the vertical force, which the experiments reported here did not measure. The reduction in vertical force will allow the ice to drop slightly, and that effect should be taken into account.
Repeated gouging and gouging in different directionsAn Arctic pipeline will be designed against an extreme gouge that will occur at long intervals, such as the ‘100-year gouge’ or the ‘1000-year gouge’. A deep gouge will clearly disturb the geotextile/clay sandwich layer. By definition, that extreme gouge cannot occur twice in the same place, and it is extremely unlikely that a gouge almost as deep as the design gouge will occur at locations close together.
The tests gouged at right angles to the pipeline. It will be important to know if the concept works equally well if the gouge is at a different angle or in the same direction as the pipeline.
Future workIt would plainly be desirable to confirm the effectiveness of this scheme by tests at a larger scale, ideally at full scale, and we are looking for opportunities to do so. The idea might also be applicable to protection against other kinds of damage.
AcknowledgementThe authors thank Keppel Corporation and the National University of Singapore for continued support.
References
1. W.Weeks, 2010. On sea ice. University of Alaska Press, Fairbanks, AK.
2. A.C.Palmer, I.Konuk, G.Comfort, and K.Been, 1990. Ice gouging and the safety of marine pipelines. Proc. 22nd Offshore Technology Conference, Houston, 3, 235-244, OTC6371.
3. C.M.L.Woodworth-Lynas, J.D.Nixon, R.Phillips, and A.C.Palmer, 1996. Subgouge deformations and the security of Arctic marine pipelines. Proc. 28th Annual Offshore Technology Conference, Houston, 4, 657-664, OTC8222.
4. I.Konuk and S.Yu, 2010. Design of pipelines against ice scour: effects of seabed geology. Proc. 29th Int. Conf. on Ocean, Offshore and Arctic Engineering, Shanghai.
5. K.Been, R.B.Sancio, A.Ahrabian, W.van Kesteren, K.Croasdale, and A.C.Palmer, 2008. Subscour displacement in clays from physical model tests. Proc. 7th Int. Pipeline Conf., Calgary, IPC2008-64186.
6. R.B.Sancio, K.Been, and J.Lopez, 2011. Large scale indenter test program to measure sub gouge displacements. Proc. 21st Int. Conf. on Port and Ocean Engineering under Arctic Conditions, Montreal.
7. A.C.Palmer and H.Tjiawi, H2009. Reducing the cost of protecting pipelines against ice gouging. Proc. 20th Int. Conf. on Port and Ocean Engineering under Arctic Conditions, Luleå, POAC09-77.
8. M.Chua, 2011. Unpublished BEng dissertation, Department of Civil and Environmental Engineering, National University of Singapore.
9. A.C.Palmer, J.P.Kenny, M.R.Perera, and A.R.Reece, 1979. Design and operation of an underwater pipeline trenching plough. Géotechnique, 29, 305-322.
10. A.C.Palmer, 2008. Dimensional analysis and intelligent experimentation. World Scientific, Singapore.
Fig.6. Drag and distortion of geotextile/clay sandwich layer above pipeline.
displacement of geotextile
sandwich layer
initial position of pipeline (Reference)
original position of geotextile
sandwich layer
Sample
copy
not fo
r dist
ributi
on

Sample
copy
not fo
r dist
ributi
on

2nd Quarter, 2011 87
Pipeline strains in soft clay backfill subject to ice gouging
by Ken Been1, Abdelfettah Fredj2, and George Comfort2
1 Golder Associates Inc, Houston, TX, USA2 BMT Fleet Technology, Kanata, ON, Canada
Buried offshore pipelines in Arctic environments have to be designed to ensure their integrity under the imposed loads and soil displacements caused by ice gouging of the seafloor. The minimum burial depth
below an ice gouge is usually determined for which the pipeline stresses or strains are within acceptable limits. A key uncertainty in the burial depth calculation is the magnitude of the subgouge soil displacements that are applied to calculate the stresses and strains in the pipeline Conservative assumptions regarding subgouge displacements are typically made, leading to potentially excessive burial depths. However, pipelines are relatively robust structures, and the trench backfill is often a disturbed, soft clay. This paper shows, by example, that under a reasonable set of ice gouge, soil, and pipeline parameters, the calculated pipeline strains due to ice gouging in a soft backfill are less than 1% regardless of the magnitude of subgouge displacements. This result suggests a robust, less-conservative, design approach may be developed in many seabed conditions if pipeline strains within the plastic range can be tolerated.
THE CHARACTERISTICS OF SEA ice and the formation of ice ridges due to compression of the ice sheet are well
documented [1-7]. These same ridges, when driven by wind or ocean currents into shallower water, may come into contact with the seabed and cause an ice scour (frequently also called an ice gouge). Ice scours also occur when icebergs come into contact with the seafloor. Ice scours have been mapped on the seabed in the Beaufort Sea (offshore Canada and Alaska), on the Grand Banks near Newfoundland, near Sakhalin Island, and in the North Caspian Sea as illustrated in Figs 1 and 2. All of these are areas of oil and gas exploration and production in which pipelines form an integral part of the existing production systems or proposed production concepts. Ice scours create hazards for offshore pipelines. It is relatively easy to show [8] that the forces associated with ice scouring can be in the order of 1-10MN, and anchor-dragging forces in the range of 1MN have been known to severely damage pipelines. The obvious solution to this problem is to bury the pipelines below the deepest scours. However, ice scouring also causes soil displacements below the level of the ice, so-called subscour displacements, which in turn cause loads on pipelines buried below the keel depth. It is less obvious how much deeper pipelines need to be buried to avoid excessive strains as a result of subscour displacements.
Current practice is to determine the subgouge displacements and then apply these displacements to calculate the pipe behaviour in a soil-pipe structural model [9, 10]. More
recently, with the advent of coupled Eulerian and Lagrangian finite-element codes, full 3-D models of the ice-soil-pipe interaction system have been developed [11-15]. In general, the finite-element models suggest that the uncoupled soil-pipe structural models are conservative [16, 17]. Design pipeline burial depths are typically a metre or more below the scour depth.
Figure 3 illustrates the ice-scour problem for pipeline design and shows typical subscour displacements that might be applied for an ice keel cutting a 10-m wide by 1.5-m deep scour in a clay seabed. A pipeline buried at a depth of 2.5m would be subject to soil displacements of more than 1m. (In this paper, we will focus on the ice-scour problem in clays only. Ice scours in sands are not as deep as in clays, and therefore required burial depths tend to be greater in clays.)
Soil displacements as illustrated in Fig.3 would, in most cases, load the pipeline beyond its yield stress and into the plastic range. However, we note that a typical oil or gas pipeline is a relatively robust structure and plastic strains can be tolerated. Indeed many pipelines undergo some level of plastic strains during the installation process by lay-barges [18]. A second important observation is that the pipeline trench is backfilled with disturbed, and therefore soft, clay soils. The soil force on the pipeline due to subscour displacements has an upper limit determined by the soil strength. If the soil force on the pipeline is thus limited by the backfill strength, then the magnitude of the subscour displacement is no longer an important factor in the determination of a safe burial depth for the pipeline, at least if the displacement is larger than that required to mobilize the full strength of the soil.
* Author’s contact details:tel: +1 281 821 6868email: [email protected]
Sample
copy
not fo
r dist
ributi
on

SIGN UP TODAY FOR A FEE LISTING AT WWW.PIPELOOP.COM
Pipeloop is the global directory of pipeline professionals. Getting into the Pipeloop is the quickest and most effective way of promoting your presence, your skills, your product, your service in the pipeline sector.
Like other networking sites, users create an account and build a profi le outlining their skills as well as their experience. They can also search for other users using over 160 combinations of specialties and materials. The chief benefi t of Pipeloop is its unique focus on the pipeline sector.
Launched on Valentine’s Day this year, Pipeloop will bring the pipeline community together like never before.
So, if you’re looking for expert welding in Wyoming, want to sell inspection tools in India, need a recruiter in Rio, or might be hiring graduates in Gabon – it’s time you got in the Pipeloop, the global directory of pipeline professionals.
Pipeloop, brought to you by
Isn’t it time you were in the
FP_pipe_ad.indd 1 25/03/11 9:41 AM
Sample
copy
not fo
r dist
ributi
on

2nd Quarter, 2011 89
Subscour displacements are a source of great uncertainty in pipeline burial depth design for ice scours. If the conditions under which subscour displacements are no longer a key input, as illustrated in Fig.4 and discussed above for plastic flow of backfill clay around a pipe, can be identified then the pipeline design would be more robust and potentially also a shallower burial depth. This paper explores whether this is a reasonable thesis, given typical pipe dimensions, operating conditions and clay backfill conditions.
Analysis methodWe used a Winkler-type soil-pipe interaction model as illustrated in Fig.5. The pipeline can be modelled either as shell or pipe elements (discussed later); the soil is modelled as two series of springs connected to the pipeline. The first set of springs simulates axial forces on the pipeline as a result of relative displacement between the soil and pipeline in the axial direction while the second set of soil springs is perpendicular to the pipeline axis, and provides lateral force to the pipe due to lateral relative displacements between the pipe and the soil. The subscour displacements are applied through this second set of springs, which also provides the soil force resisting lateral pipe displacements.
While the ice scour may be only tens of metres wide, a
much greater length of pipeline is modelled to provide the appropriate axial stiffness and bending of the pipeline under the lateral subscour soil displacements. In this case, a 2-km segment of pipeline was analysed, with the far end of the pipeline pinned (no axial or lateral displacement) and the scour centreline considered as an axis of symmetry.
For each pipeline considered, we first determined the critical width of scour. This is the keel scour width that, for a given set of parameters, results in the highest strains in the pipeline. Figure 6 shows how the tensile and compressive strains vary as a function of scour width for the 10-in (254-mm) and 30-in (762-mm) pipelines studied in this paper. The critical width for the 10-in pipeline is 8.5m, and for the 30-in pipeline the critical width is 18.5m.
Once we had identified the critical width for each pipeline, we applied subscour displacements to the pipeline corresponding to this critical width. However, we applied the displacements in increments, to determine how the pipeline strains changed as the displacements increased.
We used two finite-element codes and pipe element types for the soil-pipe interaction. To determine the critical scour width, we used the pipe elements as implemented in ANSYS [19]. However, to provide greater accuracy when applying the
Parameter Small pipe Medium pipe
Nominal diameter (inch) 10 30
Outside diameter (mm) 273 762
Wall thickness (mm) 6.35 15.90
D/t 43.0 47.9
Steel grade X60 X60
SMYS (MPa) 414 414
Operating pressure (MPa) 9.6 8.6
Temperature change (°C) 30 30
Sands Stiff clays and silts Soft clays and silts
Scour depths Lowest Moderate Highest
Subscour displacementsLeast for dense sands, increase somewhat for
loose sands
Generally strain softening and a shear zone forms
under the keel. Subscour displacements below depth
of shear localization are moderate
Greatest for soft cohesive soils
Loads on pipeHighest for dense sands, reduced somewhat for
loose sandsIntermediate
Soil force on pipe is limited, and large subscour
displacements may be accommodated
Table 1. Pipeline properties used in analyses.
Table 2. Ice scour design loads for different soil categories.
Sample
copy
not fo
r dist
ributi
on

platinum sponsor
organizers
silver sponsor gold sponsors
19–21 March 2012, Bahrain
Held under the Patronage of His Excellency Dr. Abdul Hussain bin Ali Mirza, Chairman of the National Oil & Gas Authority and Minister of Energy, Kingdom of Bahrain
Gulf Convention Centre, Bahrain
www.pipelineconf.com
ConferenCeSeven technical streams covering a wide range of subjects will run over the two and a half day event (and be presented by industry leaders).
Join leaders in the international pipeline industry as they converge for the Best Practice in Pipeline operations and integrity Management Conference and exhibition in Bahrain.
exhiBitionA comprehensive exhibition will be part of the event, allowing companies from around the world to showcase their products and services. Contact us today to book your space.
registrations are now open – make sure you attend this landmark event.
networkinGThroughout the event there will be ample opportunities to network with participants to further your business relationships. Meet with industry leaders from around the world.
WGlobalWebb
bahrain_conf. announcement_ad.indd 1 6/06/11 9:54 AM
Sample
copy
not fo
r dist
ributi
on

2nd Quarter, 2011 91
incremental soil displacements, the pipe was modelled using shell elements within the LS-DYNA software [20].
Pipe parametersWe analysed two pipelines, intended to be representative of small- and medium-diameter pipelines for oil- and gasfield development. Table 1 shows the pipe diameter (D), wall thickness (t), and D/t ratio. The assumed steel stress strain curve for X60 steel is shown in Fig.7. For our analyses we also considered an operating pressure in the pipeline that resulted in a hoop stress of 50% of the specified minimum yield stress (SMYS), and that the operating temperature was 30°C higher than the pipe lay temperature. Less than half the elastic capacity of the pipe was therefore available to resist the ice scour loading.
Soil springsFor the soil, we considered that clay backfill will be remoulded during the trench excavation and backfilling process. The clay that is placed as backfill can therefore be considered to be normally consolidated. A normally consolidated, remoulded clay will typically have an undrained shear strength, su, given by su = 0.22 × σν’ where σν’ is the vertical effective stress. This means that the undrained shear strength increases by about 1.5kPa/m below seabed. However, at the seabed the undrained shear strength is usually greater than zero some time after backfilling as a result of thixotropy and aging of the clay. Considering the seabed undrained shear strength at 4kPa, and a pipeline burial depth of about 2.5m, a good estimate
of the undrained shear strength of the clay backfill around a typical pipeline is about 8kPa.
A soil spring for lateral displacement of the soil relative to the pipeline can be estimated [21] from:
Pu = Nch × su × D
where Pu is the maximum, or ultimate, soil force per unit length of pipeline, D is the pipe diameter, su is the undrained strength of the clay, and Nch is a horizontal bearing capacity factor ranging from about 2.8 for shallow burial (top of pipe at seabed) to 9 for very deep burial (where the influence of the seabed on plastic flow of soil around the pipe is negligible). A value of Nch = 7.7 was used for the small (10-in) pipe, and Nch = 6.9 was used for the medium (30-in) pipe.
Fig.1. Occurrence of ice scouring and offshore oil and gas activities (1 - Chukchi and Beaufort Sea, 2 - Grand Banks and Labrador Shelf, 3 - Caspian Sea, 4 - Sakhalin Island). (Base map of offshore hydrocarbon area from Dean [24]).
Fig.2. Scour marks seen through shallow water in the North Caspian Sea.
Sample
copy
not fo
r dist
ributi
on

The Journal of Pipeline Engineering92
Fig.4. Pipeline burial depth and influence of subscour displacements.
Fig. 3. Ice scour problem and soil displacements.
Sample
copy
not fo
r dist
ributi
on

2nd Quarter, 2011 93
Fig.5. Winkler spring model for soil – pipeline structural analysis.
This maximum value of soil reaction can be considered to occur at a relative soil-pipe displacement Δy of:
where H is the depth to pipe centreline. We used Δy = 41mm for the 10-in pipe and 114mm for the 30-in pipe to give lateral soil springs (P-y curves) as shown in Fig.8.
The maximum axial soil force Tu estimated by ASCE 2001 is given by:
Tu = πDαsu
where α is the adhesion factor applied to the undrained shear strength su to give a maximum soil-pipe interface shear stress of αsu. The maximum soil force occurs at a relative displacement of about 10mm in soft clay.
The axial (T-x) springs used in this study are shown on Fig.8 with the P-y curves.
Subscour displacementsThe subscour soil displacement at the centreline of the ice scour was a variable in our analyses, but the distribution and attenuation of the displacement away from the centreline was a fixed proportion of the centreline displacement as illustrated in Fig.9 and defined by the equation:
where u is the lateral subscour soil displacement, W is the scour width, and ν is the offset from the scour centreline along the pipeline axis.
Calculated strains in pipelinesAxial strains in the 10-in pipeline are shown in Fig.10 as a function of the centreline (maximum) subscour soil displacement. The strains increase relatively quickly with soil displacements up to about 0.7m, but then flatten out with negligible strain increase for soil displacements greater than about 1m. The axial strains for this set of conditions are less than 0.8%. The corresponding stresses are about 440MPa, which is greater than the yield stress (414MPa).
The behaviour for the larger-diameter, 30-in, pipeline is somewhat different, as illustrated in Fig.11. Although the strains increase rapidly up to a soil displacement of about 0.8m, there is still a significant increase in strain as the subscour displacement increases from 0.8m to about 5m. However, the strains appear to be asymptotic to values of about 0.4% in tension and 0.47% in compression.
The difference in behaviour between the 10-in and 30-in pipelines arises from the difference in relative stiffness between the soil (soft clay backfill) and the pipeline: the 30-in pipeline is stiffer, with a greater critical scour width. As a result, the transition from large pipe displacements to zero displacements at the edge of the scour is spread over a greater length of pipe.
DiscussionThe results presented above illustrate two potentially useful pieces of information for a given pipe and soil combination.
The first observation is that for soil displacements above a certain amount the pipe strains no longer increase. For the small-diameter (10-in) pipe, that displacement was about 1m and for the medium-diameter (30-in) pipe it was about 4m, although strain increase was small beyond a soil displacement of around 2m.
Sample
copy
not fo
r dist
ributi
on

The Journal of Pipeline Engineering94
Fig.6. Critical scour width for 10-in (top) and 30-in (bottom) pipelines.
Fig.7. Stress-strain curve assumed for X60 steel.
Sample
copy
not fo
r dist
ributi
on

2nd Quarter, 2011 95
Fig.9. Subscour soil displacements in clays.
Fig.8. Soil springs for pipe structural analyses: (top) lateral springs (P-y curves), (bottom) axial springs (T-x curves).
Sample
copy
not fo
r dist
ributi
on

The Journal of Pipeline Engineering96
stiffness, pipeline stiffness, and operating conditions vary.
A key parameter is the soil stiffness, or more correctly the undrained shear strength, of the clay backfill. The limiting loads on a pipeline are directly proportional to the undrained shear strength of the clay. An apparently simple solution to the ice scouring problem is therefore to ensure that trench backfill is soft. In this case we used clay parameters that are representative of a soft normally consolidated clay backfill, and it should not be difficult achieve such a backfill. The problem, however, is that the scour depth needs to be adjusted, i.e. increased, in soft clays compared to stiff clays or sands.
The second and more important observation is that, if the allowable pipeline strain is sufficiently large, then the magnitude of soil displacement does not matter. The pipeline need only be buried below the maximum scour depth. An additional depth allowance for subscour displacements is not required, although some allowance for construction tolerances would be prudent.
This second observation has the potential to simplify burial depth assessment of pipelines in ice-scoured environments and to reduce the burial depths. The trends illustrated in this limited set of analyses are considered to apply more generally, but clearly the magnitude of strains will vary widely as soil
Fig.11. Calculated axial strains in 30-in pipeline due to subscour displacements (for scour width of 18.5m).
Fig.10. Calculated axial strains in 10-in pipeline due to subscour displacements (for scour width of 8.5m).
Sample
copy
not fo
r dist
ributi
on
2nd Quarter, 2011 97
ConclusionsThe analyses of two pipelines, represented by small and medium diameters, under conditions that may be typical for clay soils, has shown that there is a robust engineering approach, with a relatively low uncertainty, for pipeline design for ice scouring provided that the allowable pipeline strains are in the plastic range. In our examples the strains were less than 1%, but realistically the approach is more promising if strains up to 2% or 3% are tolerable. Higher tolerable strains would allow for higher backfill strengths, higher operating pressures and temperatures, reduced pipe wall thicknesses, or combinations of these.
Perhaps unsurprisingly, the soil properties are likely to be the primary factor (since wall thickness, operating conditions, etc., are within the control of engineers). But the picture is not as bleak as it may appear. Current practice does not generally differentiate scour depth and subscour displacement as functions of soil strength, and therefore engineers consider combinations of deep scours and stiff soils to load the pipeline. Reality is likely to be very different in that extreme scour depths will be inversely proportional to soil strengths and so will subscour displacements. Only limited work has been published to date that considers the effects of soil strengths on scour depths [22] or on subscour displacements [23]. A more efficient design approach might be to start with the soil properties, and consider the scour depths, subscour displacements, and pipeline response separately for each soil category, and Table 2 attempts to summarize our perspective on this approach. In many cases, one of the soil groups could be excluded from consideration (for example, if sands do not exist). Where mixed soils exist, it may be possible to show that scour depths in soft clays are so much greater than in sands or stiff clays that the pipeline burial depth is determined by the clays and the sand case need not be considered. In addition, the stiff clay and soft clay cases should be considered separately to avoid over-conservative analyses, for example considering soft clay scour depths and displacements applied to the pipeline as a stiff clay loading.
This paper has addressed, by example, the design in soft clays typified by a clay backfill trench. It showed that provided tolerable pipeline strains were greater than about 1%, then it may be feasible to bury the pipeline below the scour depth without an additional allowance for subscour displacements.
References 1. A.Kovacs, 1983. Characteristics of multi-year pressure
ridges. Proc. 7th Int. Conf. on Port and Ocean Engineering under Arctic Conditions, Helsinki, Finland, 3, pp73-182.
2. G.W.Timco and R.P.Burden, 1997. An analysis of the shapes of sea ice ridges, ColdRegionsScienceandTechnology, 25, 1, pp65-77.
3. K.-U.Evers and P.Jochmann, 1998. Determination of the topography of ice pressure ridges in the Laptev Sea. Proc.
14th Int. IAHR Ice Symposium, Ice in Surface Waters, Ed. H.T. Shen, Clarkson University, Potsdam, New York.
4. G.W.Timco, K.Croasdale, and B.Wright, 2000. An overview of first-year sea ice ridges. Technical Report HYD-TR-047, PERD/CHC Report 5-112, Canadian Hydraulics Centre.
5. B.Veitch, M.Lensu, K.Riska, P.Koslof, P.Keiley, and P.Kujala, 1991. Field observations of ridges in the northern Baltic Sea. Proc. 11th Int. Conf. on Port and Ocean Engineering under Arctic Conditions, St Johns, Canada, pp381-438.
6. N.Yashima and H.Tabuchi, 1999. Field survey of pressure ridges in offshore Sakhalin. Proc. of the Int. Workshop on Rational Evaluation of Ice Forces on Structures, Mombetsu, Japan, pp11-20.
7. B.Bonnemaire, K.V.Høyland, P.Liferov, and P.O.Moslet, 2003. An ice ridge in the Barents Sea, Part I: Morphology and physical parameters in-situ. Proc. 17th Int. Conf. on Port and Ocean Engineering under Arctic Conditions. Trondheim, Norway, 2, pp559-568.
8. A.C.Palmer, I.Konuk, G.Comfort, and K.Been, 1990. Ice gouging and the safety of marine pipelines. Proc. Offshore Technology Conf., Houston, 3, 235-244, OTC6371.
9. J.F.Nixon, A.C.Palmer, and R.Phillips, 1996. Simulations for buried pipeline deformations beneath ice scour. Proc. Int. Conf. on Offshore Mechanics and Arctic Engineering, OMAE, 5, pp383-392.
10. C.M.L.Woodworth-Lynas, J.D.Nixon, R.Phillips, and A.C.Palmer, 1996. Subgouge deformations and the security of Arctic marine pipelines. Proc. Offshore Technology Conf., Houston, 4, 657-664, OTC8222.
11. I.Konuk and R.Gracie, 2004. A 3-dimensional Eulerian finite element model for ice scour. Proc. Int. Pipelines Conf., Calgary, Canada, IPC 04-0075.
12. I.Konuk, S.Yu, and R.Gracie, 2005. An ALE FEM model of ice scour. Proc. 11th Int. Conf. of the Int. Assoc. of Computer Methods and Advances in Geomechanics, Turin, Italy.
13. A.Fredj, G.Comfort, and A.Dinovitzer, 2008. A case study of high pressure/high temperature pipeline for ice scour design using 3D continuum modeling. Proc. 27th Int. Conf. on Offshore Mechanics and Arctic Engineering, June 15-20, Estoril, Portugal, OMAE2008-57702.
14. R.Phillips, J.A.Barrett, and A.Al-Showaiter, 2010. Ice keel-seabed interaction: numerical modelling validation. Proc. Offshore Technology Conf., Houston, OTC20696.
15. S.P.Lele, J.M.Hamilton, M.Panico, H.Arslan, and K.Minnaar, 2011. 3-D continuum simulations to determine pipeline strain demand due to ice-gouge hazards. Arctic Technology Conf., Houston, USA, 7–9 February 2011, OTC 22109.
16. I.Konuk, S.Yu, and A.Fredj, 2006. Do Winkler models work: a case study for ice scour problem. Proc. 25th Int. Conf. on Offshore Mechanics and Arctic Engineering, Hamburg, Germany, OMAE2006-92335.
17. A.Nobahar, S.Kenny, and R.Phillips, 2007. Buried pipelines subject to subgouge deformations. Int.JournalofGeomechanics, 7, 3, 206-216.
Sample
copy
not fo
r dist
ributi
on

18. A.C.Palmer and R.A.King, 2004. Subsea pipeline engineering. Pennwell, Tulsa, OK, USA, 2nd Edn, 2008.
19. ANSYS, 2009. ANSYS 11.0 Reference Manual, ANSYS Inc.
20. LS-DYNA, 2010. Keywords user’s manual, version 971/Rev 5, Livermore Software and Technology Corp., Livermore, CA, USA.
21. ASCE, 2001. Guidelines for the design of buried steel pipe. American Lifelines Alliance.
22. K.R.Croasdale, G.Comfort, and K.Been, 2005. Investigation of ice limits to ice gouging. Proc. 18th Int. Conf. on Port and Ocean Engineering under Arctic Conditions, POAC 05, 1, pp23-32.
23. K.Been, R.B.Sancio, D.Ahrabian, W.van Kesteren, K.R.Croasdale, and A.C.Palmer, 2008. Subscour displacement in clays from physical model tests. Proc. Int. Pipelines Conf., Calgary, Canada, IPC2008-64186.
24. E.T.R.Dean, 2010. Offshore geotechnical engineering: principles and practice. Thomas Telford, UK.
Sample
copy
not fo
r dist
ributi
on

2nd Quarter, 2011 99
surveys and evaluated to predict design ice-gouge parameters such as gouge frequency, depth, width, and orientation with respect to the pipeline route. These data are typically collected over multiple years and at varying locations and must be applied for a specific pipeline route. The extreme event design ice-gouge depth prediction methods used are therefore important to the overall pipeline engineering.
Statistical methods and application to ice-gouge depth data
Probabilistic assessment of ice-gouge depth statistics may be utilized to predict extreme ice gouge depths. Early investigators [1-4] proposed the exponential distribution to be effective, but conservative, in predicting design gouge depths. More recent studies, as discussed below, investigated other statistical distributions to model publicly available ice-gouge data in efforts to more accurately predict extreme gouge depths for use in pipeline design.
Work by Caines [5], and also reported in Caines etal. [6], assessed the most applicable statistical distribution for probabilistic modelling of combined new and unknown age ice gouge depth data from the Alaskan Beaufort, Canadian Beaufort, and US Chukchi Sea regions. The Alaskan Beaufort Sea results are addressed in this paper. The
THE IMPACT AND GROUNDING of an ice keel upon the seabed typically produces ‘pock mark’ indentations
upon the seafloor. If the grounded ice possesses enough momentum or driving force to facilitate further movement, the ice keel may scrape along the seabed and create a furrow on the seafloor, which is defined as an ice gouge or ice scour.
As an ice keel passes over any point in the seabed, vertical and lateral stresses are applied to the soil at the keel base, resulting in some distribution of vertical and lateral soil displacements with depth beneath the ice keel. The movement of the soil can also load and move a trenched pipeline, even if it is below the maximum ice keel gouge depth. The configuration of the pipeline after gouging, and hence the strain in the pipeline, depends on the pipeline properties, the soil characteristics, and the depth of the pipeline below the mudline. Design for ice-gouge protection typically involves burying the pipe sufficiently below the ice keel depth, so that bending strains resulting from subgouge displacements are below acceptable limits. A typical ice keel gouging event is presented in Fig.1.
The cost, schedule requirements, and environmental effects of trenching and backfilling subsea pipelines in the Arctic are major considerations for field development projects. Data on historical ice gouges are collected from seabed geophysical
Probabilistic methods for determining extreme ice gouge depths for pipeline protective burial assessment
by Damien L Humby*1, Jonathan V M Caines1, Michael J Paulin1, and Glenn A Lanan2
1 INTECSEA Canada, St John’s, Newfoundland and Labrador, Canada2 INTECSEA Inc., Houston, Texas, USA
2 Trendsetter Engineering, Inc., Spring, TX, USA3 Microalloying International, Inc., Houston, TX, USAThere are many challenges associated with the design and installation of Arctic subsea pipelines. Unique
offshore Arctic environmental loading conditions influence each pipeline design differently. Pipelines located in ice environments must be designed for protection against the risk of seabed ice gouging (also known as ice scouring) in order to ensure asset integrity and design operability throughout the installation’s lifespan. Statistical distributions and probabilistic assessments of ice gouge records can be applied to predict design extreme ice gouge depths which can then be used to determine required pipeline burial depths for protection against ice keels.
*Author’s contact details:tel: +1 709 733 7088email: [email protected]
Sample
copy
not fo
r dist
ributi
on

The Journal of Pipeline Engineering100
gouge depth measurements are limited by the available survey technology (i.e. minimum equipment resolution), which can consequently influence the available gouge-depth distribution through non-detection of (shallow) gouges.
The goodness-of-fit of each statistical distribution was visually assessed through comparison of the ice-gouge depth data distribution histograms and the fitted distributions (Fig.2). In addition, empirical cumulative distribution functions (CDFs) were superimposed on the ice-gouge data cumulative distributions for visual assessment (Fig.3). Visual assessment was used since the available ice gouge depth data populations were too large for use of probability plots and formal (quantitative) goodness-of-fit tests.
The three-parameter Weibull distribution was found to provide the better fit to ice-gouge depth data in the upper distribution tail of the Alaskan Beaufort Sea data collection. Based on the findings of the study by Caines etal. [6], a mixed distribution using the Weibull distribution was recommended for probabilistic modelling of ice-gouge depth data collected across the full range of regional water-depth records. This is consistent with previous work by Nessim and Hong [8] who analysed Canadian Beaufort Sea data only; however, these authors treated the analysed data distribution as continuous (rather than mixed, as discussed in this paper). Cainesetal. [6] exhibited comparable results when analysing Canadian Beaufort Sea gouge depth data as a continuous distribution.
United States’ Geological Survey collected a significant amount of ice-gouge data through numerous seabed survey programmes conducted in the Alaskan Beaufort and Chukchi Seas in the 1970s and 1980s; however, limited data has been collected since then. The interpreted data are available in the public domain as numerous open-file report publications, which were compiled for use by Caines [5]. The investigated probability density functions (PDFs) included the gamma, Weibull, and exponential forms (refer to Ref.7 for definition of these PDFs).
Regional ice-gouge depth distributions were analysed for combined new and unknown age data collections. Minitabstatistical software was used to fit the investigated statistical distributions to ice-gouge depth data observations across the full range of available water depths. Thresholds were used to shift the PDFs away from zero to account for the large amount of shallow gouge-depth data. Therefore, gouge-depth data distributions were treated as mixed distributions with continuous PDFs fit to some portion of the data distribution tail, above the continuity limit. In this manner, the distribution is considered to exhibit a discrete probability below the gouge-depth continuity limit. Data discontinuities were visually assessed using histograms and do not imply any influence or importance of ice-gouge driving forces/mechanisms, but are simply characteristics of the available survey data used for analysis. These limits may be influenced by available ice-gouge driving forces, water depths, ice-feature types, gouge infilling, seabed sediments, etc; however, any associated data trends were not established in this work. Shallow
Fig.1. Example of a typical ice keel gouging event.
Sample
copy
not fo
r dist
ributi
on

2nd Quarter, 2011 101
Approximately 45% of the Alaskan Beaufort Sea gouge depth data used by Caines et al. [6] were less than or equal to 0.1m. Approximately 82% of all gouge depth records less than 0.1m were located nearshore in 0 to 15m water depths (which represents the zone of dynamic ice gouge infilling and associated gouge-depth measurement record uncertainty). The 15m bathymetric contour also represents the approximate limit of seabed gouging by multiyear ice features and the zone of grounded ridges/stamukhi (see Ref.9 for further discussion). Therefore, the 0.1-m gouge depth continuity limit was recommended for probability distribution fitting to Alaskan Beaufort Sea gouge depth data (i.e. the x-axes of Figs 2 and 3). Alternate continuity limits were also investigated but provided poorer distribution fits.
The statistical analysis method derived by Lanan etal. [4] was used during the BP Northstar pipeline project. This method was applied to publicly available data collected prior to the pipeline installation in 2000 to predict the design extreme ice-gouge depths. Along the pipeline route, new ice-gouge data have been collected by BP Alaska each year since the pipeline installation (see, for example, Ref.10). The new gouges were recorded in water depths ranging from 2.5 to 11m, all of which were seaward of the barrier islands. The original Northstar data in the 5 to 14m water depth range and the new survey data outside the barrier islands were combined to form the data set used for assessment in the present paper. The analysis presented here focused on generating a distribution which could be applied to ice-gouge depth data seaward of the barrier islands. The
Fig.2. Ice gouge depth histogram: Alaskan Beaufort Sea, 0-65m water depth, three-parameter Weibull distribution fit [6].
Fig.3. Empirical cumulative distribution fit: American Beaufort Sea, 0-65m water depth, three-parameter Weibull [6].
Sample
copy
not fo
r dist
ributi
on

The Journal of Pipeline Engineering102
landward portion of the pipeline route (i.e. landfast ice) located inside the barrier islands was not considered. The investigated PDFs included the exponential, normal, lognormal, gamma, and Weibull forms [7]. Both the work by Caines etal. [6] and the analysis of the Northstar data set analysed the full (available) population of recorded gouge depths, rather than the annual maximum gouge depth in each single year. Using the full range of data potentially improves the predicted gouge depths, as opposed to analysis using a limited amount of annual maximum site-specific observations.
Similar to Nessim and Hong [8], the analysed data distributions were treated as continuous. The majority of
the original Northstar data did not allow for a detailed assessment of the shallow gouge depths vs water depths. In the combined data set, shallow gouges of approximately 0.1m or less were randomly distributed across the full 2.5 to 14m water depth range. Therefore, using a continuity limit did not appear to be warranted.
The statistical distributions were visually assessed for goodness-of-fit through comparison of the ice gouge depth data distribution histograms and the fitted distributions (Fig.4). Empirical CDFs were also superimposed on the ice gouge data cumulative distributions for assessment (Fig.5). Probability plots and formal (quantitative) goodness-of-fit tests were not used.
Fig.4. Sample ice-gouge depth histogram: lognormal distribution fit.
Fig.5. Empirical cumulative distribution function: lognormal distribution fit.
Sample
copy
not fo
r dist
ributi
on

2nd Quarter, 2011 103
The lognormal distribution was found to provide the better fit to the ice-gouge depth data set from the BP Northstar region and is recommended for probabilistic modelling of extreme gouge depths for sites similar to the Northstar pipeline route outside the barrier islands.
Probabilistic ice-gouge depth analysis for each statistical distribution could be performed to assess the implications of using alternate PDFs to predict extreme ice-gouge design depths at specified levels of risk. The design extreme gouge depths could then be used to establish the required pipeline burial depth associated with the selected level of risk. For more details on probabilistic ice gouge depth analysis, refer to Ref.5.
ConclusionsWork by Caines etal. [6], as well as by Nessim and Hong [8], found the Weibull distribution to more accurately model ice-gouge depth data in the Alaskan Beaufort and Canadian Beaufort Seas, respectively. The present analysis has shown that the lognormal distribution more accurately models the BP Northstar data set and is suggested to provide a good fit to gouge-depth data within the pipeline region outside the barrier islands. The significance of these findings is that they can reduce uncertainty in statistical modelling of ice-gouge depth distributions and prediction of extreme gouge depths using probabilistic methods. Reducing uncertainty and potentially excessive design conservatism in probabilistic ice-gouge depth estimates can decrease Arctic pipeline trenching and burial costs, thereby increasing technical and economic feasibility.
Dynamic (natural) ice-gouge infilling was not considered by Caines etal. [6] or in analysis of the BP Northstar data set presented in this paper. Infilling can significantly influence the amount of surveyed shallow gouge depth data and could potentially shift gouge-depth predictions towards deeper values (through removal/infilling of shallow gouge records). Gouge infilling effects might also affect the selection of appropriate gouge depth continuity limits, where applicable. There is also potential that duplicate ice-gouge records exist within the data sets. For cases where only the maximum gouge depths have been recorded for each gouge surveyed, identical ice-keel gouge characteristics from parallel survey track lines should not be used more than once in the data set as these are not statistically independent events. Similar consideration should be given to the use of multiple gouge-depth measurements collected along the length of an ice gouge when using modern multibeam survey equipment. The minimum resolution of the survey equipment can influence the number of shallow gouges recorded; this could cause the data to be skewed towards deeper gouge events because a significant number of shallow gouge events could be missed.
Although the Weibull and lognormal distributions have been shown to best model ice-gouge data from the Alaskan
Beaufort and for the BP Northstar pipeline data set, respectively, new statistical analyses should be performed as additional data are collected. New statistical assessments could be performed using updated data sets, ideally considering the influence of gouge infilling, equipment resolution, and mitigating duplicate ice-gouge records to address potential changes in the recommended distributions presented to date.
This paper considered the full (available) population of ice gouges as this improves upon predictions based on only a few years of site-specific observations of the maximum gouge depth in each single year. As there are data for only a limited number of survey years, all ice-gouge depth records obtained in each survey year were analysed. In the case of modern multibeam surveys, many gouge measurements can be obtained along a single gouge trackline. As a result, there are potentially hundreds of data points for a single gouge, rather than a single (maximum) measurement. Numerous gouge-profile measurements collected along the (gouge) trackline provide additional data for analysis and allow detailed characterization of the gouge along its length. Further statistical assessments can be performed using multibeam survey data to determine the differences in results from using only the maximum gouge measurement for each survey year compared to a single measurement from each gouge, and/or all measurements for each gouge (i.e. the full population of multibeam data). Probabilistic assessment of only annual extreme values might lead to lesser or greater predicted design gouge depth(s), compared to single measurements or all measurements for each gouge. Using multibeam survey data to analyse the ice gouging problem may warrant additional (future) subgouge deformation modelling that considers the progressive along track development of the gouge and associated subgouge deformations.
Projects such as the BP Northstar, Pioneer Oooguruk, and Eni Nikaitchuq pipelines can provide a significant experience base for the design of future offshore Arctic pipelines. Pipeline route-monitoring programmes, such as that being performed for the BP Northstar pipeline, can provide comprehensive ice-gouge data that can be used to continuously evaluate the trends in ice-gouge depths. The experience from past Beaufort Sea pipeline projects can be applied on future international Arctic and sub-Arctic projects having first-year sea ice, multi-year ice, or iceberg load conditions [11]. This will provide additional confidence in the design ice-gouge depths and associated pipeline burial depths determined for future projects.
References1. C.F.M.Lewis, 1977. The frequency and magnitude of
drift-ice groundings from ice-scour tracks in the Canadian Beaufort Sea. 4th POAC.
2. idem, 1977. Bottom scour by sea ice in the Southern Beaufort Sea. Beaufort Sea Project, Department of
Sample
copy
not fo
r dist
ributi
on

The Journal of Pipeline Engineering104
Fisheries and the Environment. Technical Report No. 23, APOA Project No.72.
3. W.F.Weeks, P.W.Barnes, D.M.Rearic, et al., 1983. Statistical aspects of ice gouging on the Alaskan Shelf of the Beaufort Sea. CRREL Report 83-21.
4. G.A.Lanan, A.W.Niedoroda, and W.F.Weeks, 1986. Ice gouge hazard analysis. Offshore Technology Conference, OTC 5298, pp57-62.
5. J.V.M.Caines, 2009. Engineering assessment of ice gouge statistics from the Canadian and American Arctic Oceans. MEng Thesis, Memorial University of Newfoundland, 267p.
6. J.V.M.Caines, M.J.Paulin, and S.Kenny, 2011. An engineering assessment of ice gouge statistics and recommended statistical distributions for extreme ice gouge parameter estimation. Proc. POAC 11, Montreal, Canada, July.
7. J.L.Devore, 2004. Probability and statistics for engineering and the sciences. 6th Edition, Brooks / Cole – Thomson Learning, CA.
8. M.Nessim and H.Hong, 1992. Statistical data analysis of new scour characteristics in the Beaufort Sea. C-FER Technologies Draft Report, May, Project 92-03.
9. MMS, 1996. Final environmental impact statement: Beaufort Sea planning area oil and gas lease sale 144. Minerals Management Service, Alaska OCS Region, OCS EIS/EA MMS 1996-0012.
10. Coastal Frontiers Corporation, 2009. Northstar Development 2009 pipeline route monitoring program. Prepared for BP Exploration (Alaska) Inc., Dec.
11. G.A.Lanan, T.G.Cowin, and D.K.Johnston, 2011. Alaskan Beaufort Sea pipeline design, installation and operation. Arctic Technology Conference, OTC 22110, Houston, TX, USA, February.
Sample
copy
not fo
r dist
ributi
on

2nd Quarter, 2011 105
Ice gougingMost of the hydrocarbon reserves in the Arctic are in the offshore [3]. Ice gouging or ice scouring refers to seabed indentations caused by moving ice ridges or icebergs in many of these offshore areas, usually in shallower waters. The ice features usually have angles between 10o and 25o inclined to the horizontal [4, 5]. Most scour features are uniform in cross section over long distances on often almost horizontal seabed [6]. Almost all ice keels have sufficiently large structural strengths to cut through the much softer
surficial seabed sediments [7]. An illustration of ice scours on seabed is shown in Fig.1 [8].
Previously it was believed that if direct contact between the ice mass and the pipeline can be avoided by laying the pipeline below the expected maximum gouge depth, sufficient pipeline protection would be ensured. Later, the PRISE (Pressure Ridge Ice Scour Experiment JIP) study [9] in the 1990s revealed that even without any direct contact with the ice mass, just the surrounding subgouge soil deformations can affect the buried pipeline severely.
However, to lay a pipeline deep in the zone that experiences only minimal soil displacement involves much deeper
Ice gouging or iceberg grounding is a major subsea pipeline safety concern in the Arctic regions. Iceberg (keel) grounding can cause large soil movements around a buried pipeline inducing high stresses and strains
from excessive deformation and severely affecting pipeline integrity. Current industry knowledge of the ice-seabed-pipeline interactions during gouging is limited. Primary reason for this lack is the modelling difficulty of the severe soil deformation associated with any ice-gouging event by conventional numerical techniques.
While the Arctic subsea pipelines are buried in the seabed to avoid direct contact with the gouging ice, insufficient burial depth can cause unacceptable levels of deformation transfer to the pipeline from the surrounding subgouge soil movements while, on the other hand, the burial depth can be over-conservatively deep. Therefore, an accurate simulation of subgouge soil displacements below the mudline is critical for appropriate burial design that is safe and also economic. Coupled Eulerian-Lagrangian (CEL) finite-element analysis (FEA) demonstrates great potential for realistic ice-gouging simulations with its ability to model severe material deformations without the routine convergence issues resulting from mesh distortions in the more traditional Lagrange-based numerical techniques.
This article presents extracts from a study performed by J P Kenny and MCS Kenny within a subtask of the recently completed Ice Pipe joint-industry project steered by the DNV (and also presented in the first Arctic international conference [1]). The goal of the study was to investigate and verify the capabilities of the CEL technique in ABAQUS / Explicit [2] in simulating ice-gouging events vis-à-vis other available numerical techniques, such as AEL (Adaptive Eulerian-Lagrangian, used by other JIP participants). A number of ice-gouging events with preselected values for the various governing gouging parameters were simulated using ABAQUS CEL-FEA.
*Author’s contact details:tel: +1 281 646 4159, email: [email protected]
Ice keel-seabed-pipeline interaction simulation: Ice Pipe JIP extractsCoupled Eulerian-Lagrangian (CEL) FEA handles severe soil deformation modelling smoothly and hence is a robust tool for offshore Arctic pipe-ice-gouging analysis.
by Kabir Hossain*1, Ranil Banneyake1, Basel Abdalla1, Guy Bell1, Ayman Eltaher2, and Paul Jukes2
1 JP Kenny, Houston, TX, USA2 MCS Kenny, Houston, TX, USA
Sample
copy
not fo
r dist
ributi
on

The Journal of Pipeline Engineering106
technique is an improvement and is a good alternative for problems with moderate mesh distortions, it is not capable of coping with sustained severe displacements and deformations of the modelled material. Moreover, it also introduces approximation errors during re-mesh mapping in subsequent solution increments. Performance challenges of the various conventional numerical tools are discussed, for example, in Ref.11.
A combined approach, tapping into the strengths of both (Lagrange and Euler) techniques, the coupled Eulerian-Lagrangian (CEL) technique presented here, overcomes the mesh distortions of a Lagrangian method and the imprecise interface definitions of a purely Eulerian method. In the CEL, a Lagrangian reference frame is used to discretize the stiffer objects (for example, the ice keel) while the Eulerian frame is used to discretize the softer material that may deform severely (such as the seabed soil).
The boundary of the Lagrangian domain forms the interface between the two materials. The velocities of the Lagrangian boundaries are used as kinematic constraints in the calculations of the stresses within the Eulerian cells and the resulting surface forces on the Lagrangian domains. The unique and most useful feature of the CEL method is that the material (Eulerian)
trenching and backfilling, with significantly higher costs. Alternatively, an increased understanding of soil-pipeline interaction response during an ice-gouging event can be highly beneficial. Determination of the optimal burial zone that is both shallower and safer will help avoid over conservatism, and yield great cost savings. A schematic of the ice-seabed-pipeline interaction is illustrated in Fig.2 [10].
CEL-FEA ice-gouge modellingNumerical simulation of an ice-gouging process is extremely challenging due to the associated characteristic severe soil deformation. The most commonly used purely-Lagrangian technique – where material deformation is tied to element nodal displacements – is clearly not appropriate for ice-gouging simulations, as it entails severe mesh distortion, forcing solutions to abort prematurely after advancing only through a fraction of the process. While a re-meshing
Fig.1. Ice scours on seabed [8].
Fig.3. Ice-seabed-pipeline model components in CEL-FEA.
Fig.4. Half-symmetry 3-D CEL-FEA model of ice-seabed-pipeline.
Fig.2. Schematic of ice-soil-pipe interaction and the subgouge zones [10].
Sample
copy
not fo
r dist
ributi
on

2nd Quarter, 2011 107
can deform limitlessly, forming, deforming, and reforming new interface boundaries (by shredding and tearing apart) or eliminating it altogether (by pasting two masses together).
The Eulerian space and ice-gouging model componentsFigure 3 shows an illustration of the major model components of a CEL-FEA model setup for ice-gouging simulation. The ice keel and the pipeline buried in the seabed are at their initial positions. The seabed is a deformable Eulerian body, and the ice keel and the pipeline are rigid and deformable Lagrangian bodies, respectively. All of the components are enclosed in an Eulerian space (not visible). The model components remain within the predefined Eulerian space throughout the entire simulation. The Lagrangian body can move through the fixed Eulerian mesh and interact with the Eulerian body. The Lagrangian and Eulerian meshes can overlap where necessary but the materials cannot occupy the same space at any given instance. The Eulerian space initially not occupied by any material is considered ‘void.’
A half-symmetry equivalent of the ice-seabed-pipeline model (in Fig.3) is illustrated in Fig.4. In the model, the seabed is 40m deep, 70m wide in the gouge direction, and extends 90m in the pipeline direction on either side. The boundary distances were established through trial simulations and by optimized trade-off between the far-field response achieved and the model size (degree-of-freedom) or run-time reduction.
The Eulerian mesh, containing the seabed, is of reduced-integration eight-node linear brick elements. The pipeline, buried within the Eulerian seabed at its initial location, is of eight-node brick elements forming a cylindrical solid bar, instead of shell elements forming a thin-walled hollow cylinder. This alternative pipe modelling was adopted only to complete the study within the project schedule and cost, as use of shell elements required longer analysis run times. The Young’s modulus for steel for the solid-bar pipe was set to an equivalent value to produce the right bending response consistent with the true pipe cross section. However, with this alternative definition, the pipe deformation consistency was ensured, but the developed pipe stresses lost any meaning.
The outside faces – the symmetric and the bottom planes – were specified as a zero-displacement boundary condition. The pipeline end on the symmetric plane was specified as zero rotation, and the far end was left free of constraints.
Because the mesh is fixed, the deformation of Eulerian materials cannot be tracked by nodal displacement variables. Therefore, sets of ‘tracer particles’ consisting of point-mass elements floating within the Eulerian seabed were used to extract the sub-gouge soil displacements. These tracers were placed on vertical planes at selected locations in equally spaced grids as shown in Fig.5. Multiple tracer planes were placed at specific locations along the gouge path.
Material parameters and constitutive modelsTwo seabed soil types were modelled: normally consolidated marine clay and medium-dense sand, the material properties for which are shown in Fig.6. These soil properties were established by DNV based on soil information from representative offshore sites and laboratory test results.
Ice gouging is a considerably rapid process, and for all practical purposes the seabed clay (saturated) can be considered in an undrained condition during the gouging process. Accordingly, a total-stress-based constitutive model (for example, a pressure-independent von Mises’, Tresca, or Mohr-Coulomb plastic model with appropriate hardening) is adequate. A total-stress-based von Mises’ yield criterion with hardening, the most common one-parameter yield criterion, applicable to isotropic materials, was adopted. The criterion states that yield occurs at the distortion energy when the stress state reaches a critical level σy, expressed in tensor components:
Fig.5. Tracer particles in Eulerian mesh.
Fig.6. Material properties of seabed soil.
Sample
copy
not fo
r dist
ributi
on

The Journal of Pipeline Engineering108
study did not offer any of the more appropriate material models for large deformation problems such as CamClay, which is now available in its later versions.
Model calibrationThe material model response and the overall behaviour of the CEL-FEA model were calibrated by analytically regenerating specified laboratory soil test and simulating specified ice-gouging model tests, respectively. The soil test included a set of laboratory triaxial tests on marine clay and sand samples, and an in situ T-bar test in clay from representative offshore locations. The analytical tests from the FEA successfully matched the actual results. The ice-gouging model tests were selected from the PRISE centrifuge tests, one for clay and one for sand. The 3-D FEA simulations of the clay PRISE test produced comparable subgouge horizontal displacements with some disagreement in the vertical subgouge displacements. For the sand case, the disagreement was much greater, the reasons for which were not apparent. One reason could be the limitation of the use of Drucker-Prager without a ‘cap’ due to a lack of hydrostatic compression test data. Another reason could be presence of some inconsistencies in the PRISE data, which lacked in details.
Ice-gouging simulationsA series of ice-gouging events were simulated where its impacts on the subgouge soil and on the buried pipeline
(σij) as (σ11–σ22)2+(σ22–σ33)2+(σ11–σ33)2+6(σ232+σ31
2+σ12
2)=2σy2.
This defines von Mises as a circular cylinder-shaped yield curve in principal stress space implying that the yield condition is independent of hydrostatic stress. The intersection with the principal stress (or π) plane is a circle. In a pure shear condition (σ12 = σ21 ≠ 0, σij = 0), the von Mises’ criterion reduces to σy = √3σ12 = √3τ. In ABAQUS, this is achieved by setting σy = √3Su.
Due to high permeability, the seabed sand can be considered in a drained condition during the gouging process. The pressure-dependent two-parameter, Drucker-Prager yield criterion with non-associated flow rule (with dilation angle of 12°) was employed for sand. This yield criterion can be expressed in principal stresses as:
[1/6{( σ1 – σ2)2 + (σ2 – σ3)2 + (σ1 – σ3)2}]½ + α(σ1 + σ2 + σ3) = M
where α and M are material constants. The criterion traces a regular cone in principal stress space implying dependency on intermediate principal stress. A modified linear Drucker-Prager implementation in ABAQUS that traces a straight line with slope β and cohesion intercept d, in a ‘p-t’ stress space where t=ptanβ+d, and p is the mean pressure was used. The two parameters β and d are obtained from c and φ (Mohr-Coulomb parameters) through matching. Unfortunately, the ABAQUS / Explicit version used in the
Fig.7. Ice Pipe JIP compiled simulation matrix.
Sample
copy
not fo
r dist
ributi
on

2nd Quarter, 2011 109
gouging process was initiated and completed by applying the keel scouring motion at specified gouge depth. An illustration of a gouging simulation is shown in Fig.8. The analysis runtimes varied between 10 and 36 hours, on 3.2-GHz 3- to 5-CPU machines. The runtimes increased by factors of approximately two or three when shell elements were used to construct the pipeline.
Simulation resultsSome general observations on the subgouge soil displacement, pipeline response, and their interactions with the parameters are presented first, followed by some selected detailed results, based on the simulation results.
General observationsThe general soil deformation behaviour determined by the simulations showed good agreement with previously published similar results, such as Ref.12. Some results of the seabed surficial displacements from the simulations are illustrated as ice-keel scours and footprints in Fig.9: the surficial scour displacements are shown for varying gouge depths in Figs 9(a) and 9(b), the attack angles in 9(a) and 9(c), the keel widths in 9(a) and 9(d), and the soil types in 9(b) and 9(e). The frontal mound and the side berm features are generally similar in all the cases, with only some difference in how far or tall the mounds and the berms spread or rise. This is notwithstanding the substantial differences in the subgouge soil displacements discussed later.
The seabed soil responds to the advancing ice keel by generally forming a mound at the keel front and then creating side berms by continuously shifting soil to the sides from the moving mound. Shallower keel angles produce shorter mounds, while the side berms appear to be of similar height. Wider keels produce comparatively taller frontal mounds and side berms.
were investigated for a range of specified governing parameters. The governing parameters were precompiled into a matrix by the JIP. The values were carefully selected to gain maximum understanding with minimum number of simulations. The governing parameters included the ice-gouge depth, keel width, attack angle, depth of pipe below mudline, pipe diameter, and the seabed soil type. A total of 12 combinations as illustrated in Fig.7 were specified for the simulations. The base simulation case constituted of gouge depth 2.0m, pipe cover 1.0m, pipe diameter 32in, keel angle15° and width 10m, and clayey seabed. The seabed was considered flat and horizontal, and the ice keel deformation was ignored. Using the results of these simulations, it was possible to compare the influences of the various governing parameters on the subgouge soil and pipeline displacements.
The simulations were performed by running the analyses on multi-core high performance workstations using the dynamic solver Explicit from the FE software program ABAQUS. For each simulation, the analysis completed in a stable and robust fashion, almost in an automatic manner, without having to tumble on any large strain-related convergence issues. In each case, the simulation was completed using two dynamic analysis steps following a problem initialization. The initialization defined the initial seabed continua and the empty space above (where the deforming materials can move in or out during the gouging process) in the Eulerian domain. It also defined the initial positions of the Lagrangian keel and the as-laid buried pipeline in the Eulerian seabed. The general contact behaviours between the keel and the seabed, the material properties, and the in-situ geostatic stress conditions were also specified in the initialization.
In the first dynamic step following the initialization, all appropriate boundary conditions were applied. Then in the second and last dynamic step, the simulation of the
Fig.8. Example of ice gouging simulation using three-dimensional half-symmetry CEL-FEA model in ABAQUS showing plastic strain contours in the seabed soil around the scouring keel and the subgouge soil displacements around the buried pipeline observed with the aid of tracer planes.
Sample
copy
not fo
r dist
ributi
on

The Journal of Pipeline Engineering110
Fig.9. Seabed soil displacement behaviour for varying keel size, angle, and scour depth and soil type – gouge depth: 3.5m (a) vs 2.0m (b); keel angle: 15° (a) vs 30° (c); keel width: 10m (a) vs 30m (d); soil type: clay (b) vs sand (e).
Fig.10. Scoured trench behaviour behind a passing ice gouge.
Sample
copy
not fo
r dist
ributi
on

2nd Quarter, 2011 111
for clarity). The results show that in general the subgouge displacement at a point reaches its maximum when the keel is on the location of the point. A closer look at the deformed shapes of the pipeline between the tracer planes in
The seabed soil type impacts the shape of the gouge cross section as well as the size of the side berms. In sandy seabeds, frontal mounds appear to get twice as high compared to those in clayey seabeds; the side berms appear to attain similar heights but extend farther out in clayey than in sandy seabeds.
The seabed behaviour behind a passing ice keel is illustrated in Fig.10. The side berms appear to arch over, fail, and fold inward into the scoured trench behind the passing keel in a clayey seabed, while failing and forming slopes inward into the scoured trench in sandy seabeds.
The subgouge soil behaviour and displaced shape of the buried pipeline are graphically illustrated in Fig.11. Multiple vertical tracer planes placed at, near, and away from the pipeline tracked the subgouge soil deformations where the ice keel was at various distances from the pipeline. The tracer planes or the subgouge soil deformations for when the keel head is at 16 pipe diameters away, at four pipe diameters away, and when right on the top, and when the tail has just passed over the pipeline, are shown from top to bottom. The corresponding horizontal pipeline displacements are presented on the right hand side (magnified five times
Fig.11. Subgouge soil and pipeline displacements.
Fig.12. Keel positions in reference to pipeline when results are extracted.
Fig.13. Subgouge soil and pipeline displacements for gouge depths: 2.0m (above) and 3.5m (below).
Sample
copy
not fo
r dist
ributi
on

The Journal of Pipeline Engineering112
displacement contours at a vertical tracer plane placed at 1m from the pipeline in the direction of the advancing keel are plotted from the two simulations when the keel head is over the pipeline and when the heel is passing the pipeline (positions ‘c’ and ‘d’, respectively, in Fig.12). Also plotted are the pipeline horizontal (U1) and vertical (U2) displacements for keel at ‘a’, ‘b’, ‘c’ and ‘d’).
The plots indicate that the subgouge soils and the pipeline begin to ‘feel’ the approaching keel from as far as 16 or more diameters distance away (the pipeline deformation plot curves ‘a’). The subgouge and pipeline displacements then continue to increase as the keel closes in. The subgouge pipeline plots indicate that the horizontal deformation ceases to increase somewhat after the keel nears within about four diameter distance (U1 curves ‘b’ and ‘c’), and then tends to rebound as the keel crosses over (U1 curve ‘d’).
The tendency to rebound is also evident in the pipeline’s vertical movement (U2 curves ‘c’ and ‘d’). After the initial upwardly movements of the pipeline (U2 curves ‘a’ and ‘b’) together with the surrounding soil, the section directly beneath and close to the keel undergoes downward movement (U2 curve ‘c’) when the keel reaches a point above the pipeline. Then the rebounding produces a net vertical upward displacement from its original position as the keel passes over.
In its final deformed shape the pipeline assumes a single-inflection profile in the horizontal plane and a double- inflection profile in the vertical plane. Larger gouge depths appear to result in greater forward and downward pipeline movements (lower plots); however the net subgouge upward lift of the pipeline appears to stay about the same.
Effects of attack angle and keel width With the seabed considered horizontal, the attack angle is same as the keel angle in the FEA model. The subgouge and pipeline displacement resulting from two simulations with 15° and 30° attack angles, and a third simulation with 30-m keel width, all for a gouge depth of 3.5m, are plotted in Fig.14.
successive plots in Fig.11 shows that with the keel moving closer, the subgouge soil around the pipeline experiences greater displacements, and in turn significant pipeline deformations in the horizontal (forward) and vertical (downward) movements begin to occur. When the keel front edge is over the pipeline, the upward movement appears to end and a downward movement appears to begin. With the keel just passing over, the subgouge soil and the pipeline tend to rebound in a dynamic response due to downward pressure relief. A similar rebounding phenomenon is also observed in the numerical results of Ref. 11. The results in Fig.11 also show that the presence of the pipeline alters the subgouge soil displacements in its vicinity, producing relatively much smaller displacements than at locations away from the pipeline.
Most of the pipeline’s lateral displacements occur closer to the centre of the gouging width. Also, the gouging effect extends over a greater pipeline length in a clayey seabed than in a sandy seabed.
More detailed results describing the influence of selected parameters are presented below. As a demonstration, partial results for few selected governing parameters are presented. The results are shown in terms of subgouge soil displacements and pipeline deformations along its length. For all simulations, the subgouge soil displacements were recorded at the tracer plane locations (illustrated in Fig.11) when the keel was at the positions shown in Fig.12.
Effect of gouge depth The gouge depth is the penetration of the keel in the seabed, which represents the scour depth or the soil layer that gets displaced along the gouge path. The scour depth left behind by the keel is likely shallower than the gouge depth, as some re-bounding of the subgouge soil may occur after the keel has passed. The gouge depth and the depth of soil cover over the pipeline together affect the pipeline’s response.
The results from two simulations with 2.0-m and 3.5-m gouge depths and with a soil cover of 0.5m, in a clayey seabed, are illustrated in Fig.13. The subgouge soil
Fig.14. Subgouge soil and pipeline displacements for attack angle: 15° and 30°, and keel width: 10m and 30m.
Sample
copy
not fo
r dist
ributi
on

2nd Quarter, 2011 113
SummaryJP Kenny and MCS Kenny performed numerical simulations of ice gouging as a part of an Ice Pipe JIP task. The tool of choice for the simulation was the CEL-FEA, in ABAQUS / Explicit. The simulations attempted to shed light on the complex interactions among the various parameters influencing the subgouge soil and pipeline behaviour in response to ice gouging in a rigorous manner. In the process the goal was to determine the effectiveness of CEL-FEA as a numerical tool for analysis of boundary value problems with characteristic severs material deformation.
In this article, only some of the results from the simulations have been presented based on approval from the JIP committee. Also presented a brief discussion on the modelling and operational aspects unique to the CEL-FEA. The primary conclusions from the study are:
• It is demonstrably proven that CEL-FEA is a stable and robust numerical tool for modelling and simulating complex stress-deformation interaction problems exhibiting severe material deformations.
• The simulation results verified that subgouge soil and pipeline displacements are indeed influenced in varied degrees by the parameters: ice keel gouge depth, attack angle, base width, pipe diameter, pipe burial depth, seabed soil type.
• Detailed insight can be gained into the interactions between the ice-gouging parameters and the subgouge displacement and resulting pipeline deformation for
The tracer plane displacement contours indicate that steeper attack angles displace soils much further in the forward direction compared to shallower attack angles. Shallower angles transmit subgouge displacements deeper and wider by pushing the contacting soils in greater proportion down and below rather than scraping it at the front and to the sides. As a result, steeper attack angles produce comparatively smaller subgouge pipeline movements (the top row plots in Fig.14).
A wider keel produces larger frontal mounds and side berms (as observed from the tracer plane displacement contour plots on the left in Fig.14). The subgouge pipeline deformation gets affected to a much greater degree by an increase in keel width; however, the deformation appears to stay concentrated within the same distance. The comparison of the pipeline displacements (U2 curves ‘b’ and ‘c’ for 10-m and 30-m wide keels) also suggest a threshold keel width for the net downward vertical displacement to occur (in the central section of the pipeline).
Pipe diameter Diameter with thickness provides bending stiffness to a pipeline, and therefore has direct effects on its subgouge response. The subgouge soil displacements and pipeline deformation results from a simulation with a smaller pipe diameter (16-in) are plotted in Fig.15. As expected, with a smaller diameter, increased subgouge pipeline deformation occurs for approximately the same magnitude of the subgouge soil displacements (when compared to results in Fig.14 for the 32-in pipeline). Also, the results indicate that a smaller diameter pipeline suffers greater net vertical displacement, consistent with reduced rebounding energy as a result of reduced bending stiffness.
Fig.15. Subgouge soil and pipeline displacements for a 16-in diameter pipeline.
Sample
copy
not fo
r dist
ributi
on

The Journal of Pipeline Engineering114
4. A.C.Palmer, 2000. Are we ready to construct submarine pipelines in the Arctic? Offshore Technology Conference, Houston.
5. A.C.Palmer, I.Konuk, G.Comfort, and K.Been, 1990. Ice-gouging and the safety of marine pipelines. 22nd Annual Offshore Technology Conference, Houston.
6. A.C.Palmer, I.Konuk, J.Love, K.Been, and G.Comfort, 1989. Ice scour mechanics. Research paper prepared for Canada Oil and Gas Lands Administration and Gulf Canada Resources Ltd.
7. A.Kovacs and M.Mellor, 1974. Sea ice morphology and ice as a geologic agent in the southern Beaufort Sea: the coast and shelf of the Beaufort Sea. The Arctic Institute of North America, Arlington.
8. I.Konuk, 2006. New developments in soil-pipe interaction modelling. Geological Survey of Canada, Ottawa, Ontario, September.
9. C.Woodworth-Lynas, D.Nixon, R.Phillips, and A.C.Palmer, 1996. Subgouge deformations and the security of Arctic marine pipelines. Offshore Technology Conference, Houston.
10. Tecnomare S.p.A., 2004. Arctic offshore pipelines design and installation challenges. Presentation at ARCOP workshop No 4, Brussels, June.
11. I.Konuk, S.Yu, and R.Garcia, 2005. An ALE FEM model of ice scour. 11th Int. Conf. of the Int. Assoc. of Computer Models and Advances in Geomechanics, Turin, Italy, June.
12. B.Abdalla, K.Pike, A.Eltaher, P.Jukes, and B.Duron, 2009. Development and validation of a coupled Eulerian Lagrangian (CEL) finite element ice-gouge model. Offshore Mechanics and Arctic Engineering Conference (OMAE), Honolulu, Hawaii, 31st May – 5th June.
13. H.Shi, J.Sun, M.K.Hossain, A.Eltaher, and K.Jukes, 2011. Offshore pipeline embedment in cohesive soil – a comparison between existing and CEL solutions. OMAE2011-50230, Netherlands (tobepublished).
14. M.K.Hossain, A.Eltaher, P.Jukes, and K.Pike, 2009. The Simulation of pipe soil interaction using coupled Eulerian Lagrangian (CEL) method. IOPF 2009-1001, Houston.
project specific arctic pipelines and site conditions by similar analyses.
• The simplifications that were adopted – cylindrical bar pipe instead of true hollow pipe using shell elements – were not from limitations of the technique, and are easily avoidable and should be avoided in real project simulations.
Ice-gouging modelling by ABAQUS / CEL proved rational and absent of any significant approximation or uncertainty. However, a major part of any CEL-FEA modelling and analysis success is the level of awareness of its unique numerical and procedural implementation nuances, which depends on experience through a process of ‘lessons learned.’ For an example, the correct balance among the number of degrees of freedom, element size, step time increment, and the hardware parameters such as the number of processors, CPU core capacities, etc., is a matter of great importance in expediting an analysis.
The CEL-FEA is rapidly gaining industry acceptance as the emerging tool for modelling extreme deformation problems. Examples of recent uses in other areas are in Refs 13 and 14.
AcknowledgmentThe authors thank the Ice Pipe JIP for the support in this study and also for the approval to publish. They also thank the SIMULIA software support team for technical help.
References1. R.Banneyake, M.K.Hossain, A.Eltaher, T.Nguyen, and
P.Jukes, 2011. Ice-soil-pipeline interactions using coupled Eulerian-Lagrangian (CEL) ice gauge simulations – extracts from Ice Pipe JIP. OTC 22047, ATC OTC, Houston.
2. ABAQUS Version 6.9.1 Documentation.3. United States Geological Survey, 2008. 90 billion barrels
of oil and 1,670 trillion cubic feet of natural gas assessed in the Arctic. Press Release, 23 June.
Sample
copy
not fo
r dist
ributi
on

2nd Quarter, 2011 115
Since a substantial portion of the world’s remaining petroleum reserves are in Arctic offshore regions and other offshore ice-frequented environments, oil and gas development activities in these locations will
increase to satisfy increasing energy demands. Consequently, more subsea pipelines (flowlines, subsea tiebacks, and export pipelines) will be constructed in environments where the seabed is subjected to gouging by ice, requiring the evaluation of the magnitude of the risk and requirements for protection of pipelines from ice gouging. The terms ice gouge and ice scour are synonymous, but gouge will be used here for consistency. The only proven technique for the protection of pipelines from ice gouging is trenching. However, the trenching process itself will not be addressed here; the development of trenching technologies capable of operating in hostile environments and attaining the trench depths required for adequate protection is the subject of on-going research programmes such as the Trenching Joint-Industry Project currently being conducted by Petroleum Research Atlantic Canada (PRAC). Rather, the assessment of required pipeline burial depths will be the primary focus.
ICE GOUGING OF THE seabed can be caused by glacial ice (icebergs) or pack ice. Ice gouging occurs when
the keel of an ice mass contacts the seabed and there are sufficient environmental forces to push the keel along the seabed, displacing sediment and forming a linear feature. Iceberg gouging (or scouring) of the seabed (Fig.1) occurs in a number of regions, but the primary areas of interest are offshore Greenland, the Labrador Shelf, and the Grand Banks of Newfoundland. Significant iceberg scour data have been collected on the Grand Banks to support existing developments (Hibernia, Terra Nova, and White Rose). The best iceberg scour dataset is on the Makkovik Bank on the Labrador Shelf, where over 7,300sqkm of high-resolution multibeam sonar data have been collected since 2003. Very little work has been done off Greenland to date. Figure 2 shows iceberg gouges in multibeam data collected on the southern flank of the Makkovik Bank. Pack-ice gouging (see Fig.3) of the seabed occurs in numerous regions, but in terms of pipeline risk, the primary areas of interest are the Beaufort Sea, Chukchi Sea, offshore Sakhalin Island, and the Caspian Sea. The best available pack-ice gouge dataset has been collected in the Canadian Beaufort Sea, where repetitive seabed mapping began in 1978. Figure 4 shows pack-ice gouges in multibeam data collected in the Canadian Beaufort Sea.
A very simplistic (and incorrect) approach to estimating pipeline burial depth is to identify the deepest gouge in
the vicinity of the pipeline and place the pipeline crown below that depth. A pipeline burial analysis requires the gouge-formation rate and gouge geometry (width and depth distributions) to be defined for the site of interest, as well as the geotechnical conditions, pipeline characteristics and operating conditions, pipeline strain or stress limits (or other metrics used to define acceptable pipeline performance), pipeline length and target reliability (see Fig.5). A series of finite-element analyses is used to assess pipeline response (i.e. compressive and tensile strains) during a gouge-crossing event for a range of gouge widths, depths, and pipeline/ice keel clearances (the distance between bottom of the ice keel and the pipeline crown) for given pipeline characteristics, operating, and geotechnical conditions. The burial analysis incrementally increases the pipeline cover depth, generating the distribution of pipeline strains (or other relevant response parameter) produced for each burial depth (using the gouge width/depth distributions and the results from the finite-element analyses) and calculates the probability of exceeding the defined pipeline performance limits for each burial depth. The result of this process is a pipeline burial curve giving the probability of ‘failure’ as a function of burial depth, given a pipeline gouge-crossing event occurs, from which the required burial depth is interpolated based on the pipeline length, target reliability level (mean return period between failure events), and pipeline gouge-crossing rates.
Accurate definition of the gouge regime (the gouge-formation rate and geometry) at the site of interest is a critical aspect of the analysis. The gouge-formation rate cannot be derived
Author’s contact details:tel: +1 709 864 2655email: [email protected]
Protection of pipelines from ice gouging
by Tony King
C-CORE, St John’s, Newfoundland and Labrador, Canada
Sample
copy
not fo
r dist
ributi
on

The Journal of Pipeline Engineering116
Fig.1. Iceberg gouging the seabed [1].
Fig.2. Multibeam sample from southern Makkovik Bank, Labrador Shelf, covering 255sqkm and a water depth range of 119-263m.
Fig.3. Pack-ice gouging the seabed (courtesy of Vladimir Ryabinin, Hydrometcentre of Russia).
Sample
copy
not fo
r dist
ributi
on

2nd Quarter, 2011 117
from the density of gouges on the seabed (the time period since the ice gouging process began is not known), and in many cases the seabed is saturated with gouge features. The only direct measurement of the gouge-formation rate is through repetitive mapping, whereby portions of the seabed are resurveyed, allowing the gouge-formation rate to be calculated from the number of new gouges, the elapsed time since the baseline survey, and the area resurveyed. Repetitive mapping in the Canadian Beaufort has identified thousands of new gouges (appearing since earlier baseline surveys) formed by first year and multi-year pack ice, allowing gouge-crossing rates to be established with a reasonable degree of accuracy, although considerable spatial variations due to local bathymetric sheltering effects (i.e. channels) are observed. While some repetitive mapping has been performed in other Arctic regions to establish pack-ice gouging rates, none have approached the level of detail achieved in the Canadian Beaufort Sea. Icebergs are relatively rare in the Beaufort, but are a significant consideration in Baffin Bay, Labrador Shelf, and the Grand Banks of Newfoundland. A number of repetitive mapping surveys have been performed on the Grand Banks and Labrador Shelf, although the number of new gouges observed has been relatively low, due to the low iceberg scour formation rate (compared to pack-ice gouges in shallower water), leading to a higher level of uncertainty associated with the inferred iceberg gouge-formation rates.
Ideally, gouge geometry (particularly depth) should be based on new gouges identified through repetitive mapping in order to minimize the influence of sediment infill, which decreases gouge depth and can lead to underestimation of pipeline burial depth. In many regions, relict gouges are present. Relict gouges date back thousands of years (potentially back to previous Ice Ages), and are therefore not representative of the modern gouge regime. Even with infill, relict gouges are often deeper than modern gouges, and can be difficult to discriminate from modern gouges without guidance from repetitive mapping. The large number of new gouges identified in the Canadian Beaufort using repetitive mapping gives a relatively higher degree of confidence in the depth and width distributions obtained, although data regarding length are not as good since most data are from swaths rather than mosaics and many gouges are truncated. Also, most
data in the Canadian Beaufort Sea are in soft sediments, and cannot be generalized to other regions where sands or harder sediments occur. Substantial multibeam mosaics have been collected on the Labrador Shelf (and to a lesser extent the Grand Banks) yielding large datasets but more uncertainty, due to infill effects and the presence of relict scours. It is interesting to note that, while gouge depths have generally been characterized using the exponential distribution (a simple, easily applied, single-parameter distribution), gouge depths may follow lognormal (iceberg gouges), gamma, or Weibull (pack-ice gouges) distributions (and occasionally do not fit any of the classical distributions), with actual parameters varying substantially with water depth, sediment type, and environmental driving conditions.
Substantial work has been done characterizing pipeline response to a gouge-crossing event. Direct ice-keel contact with a pipeline is not permitted in pipeline design, and allowances must be made for the displacement of soil that occurs under a gouging ice keel. Soil displacement during ice-keel gouging is a 3-D process involving downward and outward (away from the centreline) displacements, as well as along the direction of ice-keel gouging, all decreasing with depth below the gouging keel. Most of the experimental work characterizing this process has been performed in geotechnical centrifuges, such as the facility at the C-CORE in St John’s, Newfoundland and Labrador, Canada (Fig.6). Centrifuge modelling allows processes governed by self-weight (slope stability, foundation performance) to be modelled at reduced scales. Centrifuge modelling of the
Fig.4. Multibeam sample from Canadian Beaufort Sea (courtesy of Steve Blasco, Geological Survey of Canada).
Fig.5. Procedure used for pipeline burial analysis.
Sample
copy
not fo
r dist
ributi
on

The Journal of Pipeline Engineering118
ice-gouging process was initially conducted the C-CORE centrifuge during the 1990s as part of the PRISE (Pressure Ridge Ice Scour Experiment) programme, and more recently during the PIRAM (Pipeline Ice Risk Assessment and Mitigation) programme. These tests typically involved moving a steel indenter representing an ice keel through soil test beds (using various soil types, keel geometries, gouge depths, etc.) and measuring sub-gouge soil displacements using various methods such as marker particles and deformable grids (Fig.7).
A gouge-crossing event over a pipeline will induce sub-gouge soil deformations that induce a mechanical response in the pipeline, the magnitude of which depends on the size of the gouge, pipeline burial depth, soil properties, pipeline mechanical properties and operating conditions
(i.e. internal pressure). While some physical modelling of iceberg gouging has included model pipelines, pipeline burial depth analysis is primarily based on finite-element analysis of gouge-crossing events using the soil-deformation fields derived from centrifuge testing. Initially, finite-element analyses of pipeline response to gouge-crossing events used relatively simple models where soil behaviour was idealized using discrete spring systems and the pipeline was idealized using specialized beam elements (Fig.8). This progressed to ALE (arbitrary Lagrangian-Eulerian) FE analyses where the mesh representing the soil continuum adapts to deformation caused by the gouging process. For example, Fig.9 shows an 8-m wide, 2-m deep gouge over a 21.5-in (0.546-m) diameter pipe, buried 2.5m deep (with 0.5m clearance from the ice keel to the pipeline crown). The most recent research is focused on CEL (coupled Eulerian Lagrangian)
Fig.6. Geotechnical centrifuge facility at C-CORE, St John’s, Newfoundland and Labrador.
Fig.7. Centrifuge model test of ice-gouging process in clay.
Sample
copy
not fo
r dist
ributi
on

2nd Quarter, 2011 119
FEA techniques where the deformed soil flows through a non-deformable mesh. Finite-element modelling of the effects of sub-gouge soil deformations on pipelines, and the physical modelling required for model validation, remains an active area of research.
Combining the FE analyses and gouge geometry (depth and width distribution) gives the distribution of pipeline response (i.e. strains) possible during a gouge-crossing event at a specified pipeline cover depth. Comparing the distribution of pipe response with a specified performance limit gives the probability of exceeding the limit at a specified cover depth. Typically, pipeline performance limits for ice gouging are strain-based, such as those specified by DNV OS-F101, and usually compressive strain governs. It should be noted that these strain limits incorporate factors of safety, and thus using these limits in the pipeline-burial analysis incorporates a certain level of conservatism. Repeating the analysis process for a range of pipeline cover depths and plotting the probability of exceeding the specified pipeline performance criteria, as a function of pipeline cover depth, gives a pipeline burial curve.
The required pipeline cover depth is interpolated from the pipeline-burial curve using the pipeline length, the annual ice
gouge crossing rate per unit length, and the target reliability (Fig.10). The length of the pipeline used in the interpolation process is the length exposed to ice gouging, and excludes portions on land, in water too deep for ice gouging (based on seabed surveys or maximum drafts of ice features), or portions of the pipeline shielded from ice gouging (i.e. placed in trenches blasted or cut into bedrock, placed under rock berms too massive to be affected by gouging, etc.). Ideally, the ice-gouge crossing rate is based on repetitive mapping of the seabed along the route, but when lacking these data the gouge-crossing rate can be inferred from data from similar sites or based on numerical ice grounding/gouging models. A typical reliability target used in pipeline burial analyses is 1000 years, or 10-3 per year. This reliability target is the mean return period between gouge events that induce a mechanical response that exceeds pipeline performance criteria (which does not necessarily imply pipeline rupture or loss of hydrocarbons). The total trench depth is the pipeline cover depth plus the pipeline diameter. For pipelines with uniform conditions and gouge geometry along the route, a single pipeline-burial curve suffices, and any change in gouge-crossing rates means interpolating a different point along the burial curve. Variations in gouge geometry (width/depth distributions) requires regenerating the burial curve, which is a relatively easy process. Changes in soil parameters,
Fig.8. Pipeline-gouge response modelled using beam and springs [2].
Sample
copy
not fo
r dist
ributi
on

The Journal of Pipeline Engineering120
pipeline characteristics, or operating conditions requires re-running the FE analysis and then regenerating the pipeline burial curve.
The pipeline-burial analysis procedure presented here has been used for proposed pipelines in a number of regions, including offshore Sakhalin Island, the American and Canadian Beaufort Sea, the Grand Banks, and the Caspian Sea. It has recently been implemented in a GIS-environment as part of the PIRAM programme. Further development of various aspects of the pipeline burial analysis will continue at C-CORE under a variety of initiatives. These include:
• the collection of additional field data to improve the characterization of ice-gouge geometry and formation rate;
• further development of ice-grounding models to predict spatial variations in ice-gouge rates;
• advances in physical and numerical modelling of the ice-gouge process, iceberg-trajectory monitoring, and post-grounding seabed surveys to correlate the gouge feature and relevant parameters (iceberg size, drift speed, driving forces, and seabed sediment properties);
• the refinement in the pipeline burial algorithm to characterize the uncertainty (i.e. distribution) in a pipeline’s mechanical response to a gouge-crossing event;
• the incorporation of pipeline performance limits that are distributions that reflect the variability due to factors such as fabrication, installation, and corrosion.
References1. C.M.T.Woodworth-Lynas, 1992. The geology of ice
scour. PhD Thesis, University of Wales, 269.2. PERD, 2000. Study of iceberg scour and risk in the
Grand Banks Region. Prepared by K.R. Croasdale & Associates, C-CORE, Canadian Seabed Research, Ballicater Consulting, and Ian Jordaan and Associates for the National Research Council of Canada. PERD/CHC Report 31-26.
Fig.9. Pipeline-gouge response modelled using continuum approach.
Fig.10. Example showing interpolation of pipeline burial depth from curve.
Sample
copy
not fo
r dist
ributi
on

2nd Quarter, 2011 121
Available trenching solutions for subsea pipelines are mainly determined by the prevailing regional seabed soils and topographical conditions. In the Arctic region production pipelines and flowlines
have recently begun to move offshore and particularly severe seabed conditions are being encountered. We are regularly seeing data which shows seabed clays so strong that they are probably more accurately described as rock. In this environment gravels, cobbles and boulder fields can also be frequent. Extremely rough seabed terrains are common-place.
On the face of it such conditions probably suggest a need for the heaviest, strongest, trenching equipment. However Arctic seabed conditions can also be highly variable. For example a layer of very soft clay often overlies the hard material and paradoxically this would imply the use of the lightest equipment in order to ensure stability and avoid settlement problems. Careful engineering and choice of equipment will be the key to successful offshore trenching the Arctic region.
Why trench?Based on the conditions described above it could be asked why the pipeline industry should be planning to trench here at all. There are a number of important design drivers. The primary reason is often to mitigate against the high loading that may be imposed by ice gouging or scour, permafrost thaw settlement, and strudel scour. Trenching the pipeline down to an engineered depth grade can remove that threat. An additional influence on the trenching decision, particularly trench backfilling, may result from pipeline upheaval buckling and thermal insulation design requirements. Trenching may also be part of the solution for reducing excessive stresses in pipelines laid over uneven seabed features.
In fact the industry is preparing for unusually deep trenching requirements for pipelines in the Arctic region. To completely protect a subsea pipeline from the ice-gouging or scouring threat the minimum burial depth needs to deeper than the maximum gouge depth expected over the pipeline’s design life. Furthermore, recent research finds that some soil even below the scouring keel of the ice will deform, potentially imposing high shear and bending loads on the buried line, and deepening the trenching requirement yet further. The resulting burial depth requirement, often 5m or greater, is significantly beyond the 1 to 2m burial depth requirement which is normal in the North Sea.
Does this mean a fundamentally new approach to pipeline trenching is going to be needed? This article reviews the state-of-the-art technology currently available and contemplates how the trenching industry may eventually solve the challenge presented by Arctic offshore development projects.
Post lay trenching technologyAt present the centre of gravity of the post-lay pipeline-trenching industry unquestionably resides in the North Sea region. The technology used here is centred around the use of remotely operated trenching machines. These mount themselves on top of a pipelines previously laid onto the seabed, and then traverse along the pipe while trenching it down to a controlled depth. This is the background to the term ‘post-lay’ trenching. Most of the post-lay trenching machines have evolved from the heavy duty ROV technology successfully pioneered in the North Sea oilfield.
There are three main categories of post-lay trenching machines:
• ploughs• jet trenchers (both towed sledges and ROV-type
vehicles)• mechanical trenchers
Equipment choice is always determined by the properties of the seabed soil expected along the pipeline route. Such properties can vary tremendously. For example clay soils possess a cohesive shear strength which can vary from about
Author’s contact details:tel: +44 (0) 191 453 7900email: [email protected]
The Arctic region from a trenching perspective
by Jon Machin
Geomarine Ltd, Newcastle upon Tyne, UK
Sample
copy
not fo
r dist
ributi
on

Visit www.piperehabconf.com for more information‹‹‹‹‹‹‹‹‹‹‹‹‹‹‹‹‹‹‹ Exhibition and sponsorship opportunities still available ‹‹‹‹‹‹‹‹‹‹‹‹‹‹‹‹‹‹‹‹
Organized by
Now in its 4th year – make sure you are part of this rapidly growing event
2–3 November
HOUSTON2011
Houston Marriott West Loop Houston, TX, USA
Training 31 October – 1 November
Courses Pipeline rehabilitation Pipeline repair and in-service welding
Conference 2–3 November
Houston_FP.indd 2 24/05/11 5:14 PM
Sample
copy
not fo
r dist
ributi
on

2nd Quarter, 2011 123
Fig.1. Suitability of post-lay trenching machines in different conditions.
Fig.2. Plough trench-cutting geometry.
Fig.3. Technip’s MPP plough.
Sample
copy
not fo
r dist
ributi
on

The Journal of Pipeline Engineering124
1kPa to greater that 1,000kPa (which is a variation factor of one thousand times). Silts, sands, and gravels are granular and non-cohesive. However during trenching they can exhibit a significant strength which although transitory, varies rather unpredictably with load rate. These factors dramatically impact trenching-machine design and performance.
Figure 1 charts the suitability of the different categories of post-lay trenching machines within a simplified framework of seabed strength and water depth. Of course such a highly simplified model ignores other equally important equipment specifications which must be considered such as maximum pipeline diameter of pipeline, minimum depth of trenching, etc.
Pipeline ploughs have performed the majority of North Sea pipeline burial since the 1980s when they displaced the incumbent towed jet-sledge technology. The jet sledges had originally been imported from the coastal Gulf of Mexico. However in the North Sea pipeline burial contractors found that they were encountering stronger soils, and greater water depths, and these were beyond the efficient capability of the jet sledges.
In recent years further technology shifts have been observed in the North Sea trenching market. The use of self-propelled trenching machines based on ROV vehicle technology is becoming increasingly popular. This trend seems to be attributed to recent advances in ROV capabilities in conjunction with improved soils’-cutting technology. It is now possible to efficiently transmit enormous quantities of electrical power to subsea motors and pumps. Improved soils’-jetting system designs can take advantage of this and allow stronger clays to be reliably jetted. New designs of mechanical cutting tools, more compact and efficient than before, have also been developed.
PloughsPipeline ploughs have minimal moving parts and are essentially passive tools, which cut through the seabed forming a V-shaped trench with a 35° side slope, ensuring that the trench is relatively stable in a wide range of soil conditions, including very soft clays. Excavated spoil is placed at either side of the trench, readily available for backfilling by a separate backfill plough. The basic plough-cutting geometry is shown in Fig.2. Ploughs are typically capable of excavating a nominal trench depth of about 1.8m to 2.0m in a single pass along the pipeline. Several ploughs are capable of making multiple additional passes along the trench to increase the trench depth to a maximum of about 2.5m.
The principal advantages of pipeline ploughs include suitability for a wide range of soils, diameter of rigid pipelines from 8in to 60in, good out-of-straightness achieved, the well-defined nature of the trench, and good volume of soil available for backfill. Disadvantages include the requirement for a support vessel with a large A-frame and enormous bollard pull capability in order to deploy and tow the plough.
Plough performance is of great interest to the pipeline industry and over the years several trenchability models have been refined and published [1-3]. These models allow predictions to be made of maximum trench depth under a given tow force for different seabed soil conditions. The models typically suggest that tow force (T) is proportional to an exponential power function of trench depth (D): T ∝ Dn
where the authors consistently find that n = 2 for cohesive clay soils, and n > 2 for non-cohesive soils such as silt, fine sand, etc.
Fig.4 Far Samson plough-support vessel.
Sample
copy
not fo
r dist
ributi
on

2nd Quarter, 2011 125
and a refurbished early generation plough, the APP. The AMP500 was manufactured by Soil Machine Dynamics (SMD) in 2004: it weighs 207 tonnes in air, but with buoyancy tanks weighs 100 tonnes submerged. The VMP was manufactured in 2008 and weighs about 180 tonnes. TheAPP was originally built in the 1990s, and was among the first large pipeline ploughs in the North Sea and has a long track record. It weighs 140 tonnes in air. The CTC Marine ploughs can accommodate maximum tow forces in the range 250 to 350 tonnes. Technip operate one plough, the MPP (Fig.3). It has notched-up a lengthy track record since it was built by SMD in 1995. It is the lightest North Sea plough weighing of the order of 110 tonnes and has a tow force capability of 250 tonnes. It can accommodate pipelines up to 28in diameter and can cut a 1.8m deep trench in single or multiple passes.
The practical implication of this relationship is that the tow force required to form a ploughed trench will rapidly increase as trench depth increases. In fact for a maximum plough tow force capability, given by the lower of the plough’s structural yield capacity or the ‘bollard pull’ capacity of the towing vessel, there will be a physical limitation on the maximum trench depth that can be achieved in a single pass of the plough in any given soil conditions. It has long been recognized that in order to create very deep trenches using the ploughing method, recourse will need to be made to multiple-passing techniques [4].
Plough fleetThere are currently six large pipeline ploughs available in the North Sea, operated by three contractors, namely CTC Marine, Saipem, and Technip. CTC Marine operates two ‘third generation’ pipeline ploughs, the AMP500 and VMP,
Fig.5. Ecosse Subsea Systems’ SCAR plough.
Fig.6. SCAR plough multi-pass technique.
Sample
copy
not fo
r dist
ributi
on
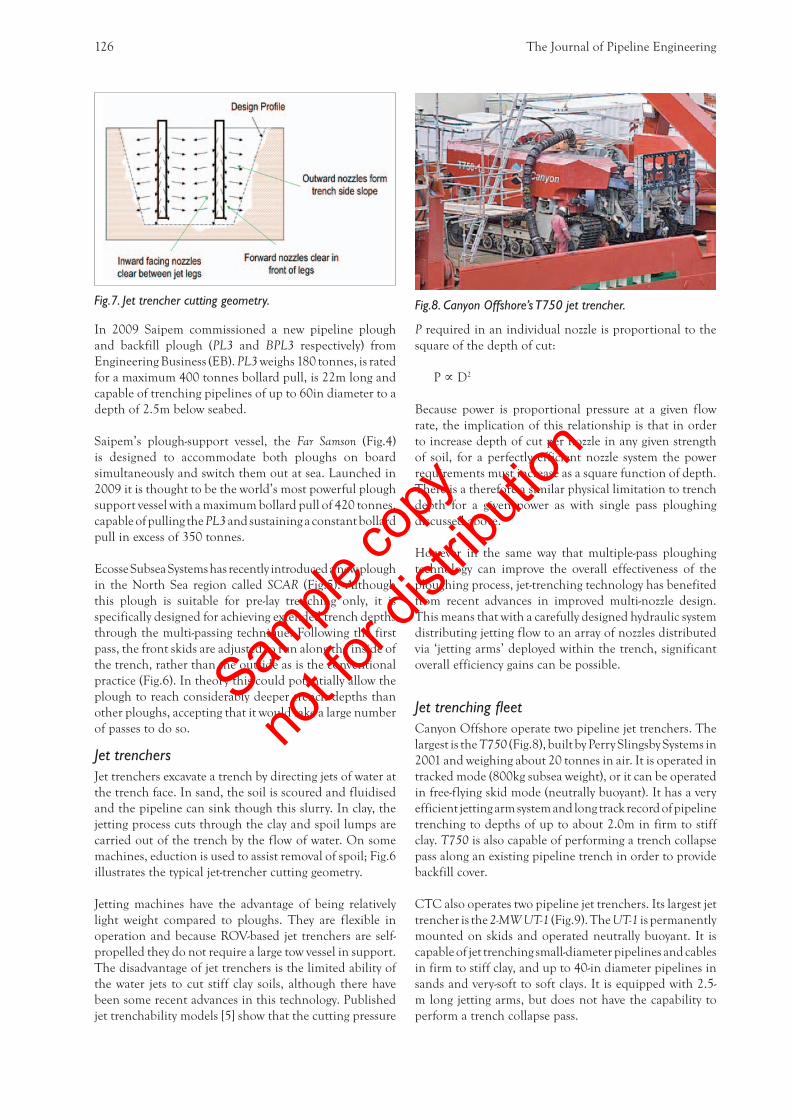
The Journal of Pipeline Engineering126
P required in an individual nozzle is proportional to the square of the depth of cut:
P ∝ D2
Because power is proportional pressure at a given flow rate, the implication of this relationship is that in order to increase depth of cut per nozzle in any given strength of soil, for a perfectly efficient nozzle system the power requirements must increase as a square function of depth. There is a therefore a similar physical limitation to trench depth for a given power as with single pass ploughing discussed above.
However in the same way that multiple-pass ploughing technology can improve the overall effectiveness of the ploughing process, jet-trenching technology has benefited from recent advances in improved multi-nozzle design. This means that with a carefully designed hydraulic system distributing jetting flow to an array of nozzles distributed via ‘jetting arms’ deployed within the trench, significant overall efficiency gains can be possible.
Jet trenching fleetCanyon Offshore operate two pipeline jet trenchers. The largest is the T750 (Fig.8), built by Perry Slingsby Systems in 2001 and weighing about 20 tonnes in air. It is operated in tracked mode (800kg subsea weight), or it can be operated in free-flying skid mode (neutrally buoyant). It has a very efficient jetting arm system and long track record of pipeline trenching to depths of up to about 2.0m in firm to stiff clay. T750 is also capable of performing a trench collapse pass along an existing pipeline trench in order to provide backfill cover.
CTC also operates two pipeline jet trenchers. Its largest jet trencher is the 2-MWUT-1 (Fig.9). The UT-1 is permanently mounted on skids and operated neutrally buoyant. It is capable of jet trenching small-diameter pipelines and cables in firm to stiff clay, and up to 40-in diameter pipelines in sands and very-soft to soft clays. It is equipped with 2.5-m long jetting arms, but does not have the capability to perform a trench collapse pass.
In 2009 Saipem commissioned a new pipeline plough and backfill plough (PL3 and BPL3 respectively) from Engineering Business (EB). PL3 weighs 180 tonnes, is rated for a maximum 400 tonnes bollard pull, is 22m long and capable of trenching pipelines of up to 60in diameter to a depth of 2.5m below seabed.
Saipem’s plough-support vessel, the Far Samson (Fig.4) is designed to accommodate both ploughs on board simultaneously and switch them out at sea. Launched in 2009 it is thought to be the world’s most powerful plough support vessel with a maximum bollard pull of 420 tonnes, capable of pulling the PL3 and sustaining a constant bollard pull in excess of 350 tonnes.
Ecosse Subsea Systems has recently introduced a new plough in the North Sea region called SCAR (Fig.5). Although this plough is suitable for pre-lay trenching only, it is specifically designed for achieving extended trench depths through the multi-passing technique. Following the first pass, the front skids are adjusted to run along the inside of the trench, rather than the outside as is the conventional practice (Fig.6). In theory this could potentially allow the plough to reach considerably deeper trench depths than other ploughs, accepting that it would take a large number of passes to do so.
Jet trenchersJet trenchers excavate a trench by directing jets of water at the trench face. In sand, the soil is scoured and fluidised and the pipeline can sink though this slurry. In clay, the jetting process cuts through the clay and spoil lumps are carried out of the trench by the flow of water. On some machines, eduction is used to assist removal of spoil; Fig.6 illustrates the typical jet-trencher cutting geometry.
Jetting machines have the advantage of being relatively light weight compared to ploughs. They are flexible in operation and because ROV-based jet trenchers are self-propelled they do not require a large tow vessel in support. The disadvantage of jet trenchers is the limited ability of the water jets to cut stiff clay soils, although there have been some recent advances in this technology. Published jet trenchability models [5] show that the cutting pressure
Fig.8. Canyon Offshore’s T750 jet trencher.Fig.7. Jet trencher cutting geometry.
Sample
copy
not fo
r dist
ributi
on

2nd Quarter, 2011 127
Canyon Offshore’s i-Trencher is shown in Fig.11. The i-Trencher is a self-propelled tracked vehicle that has been designed with low ground pressure to enable traction in 10-kPa soils. The trencher has three main modes of operation: cutting using digger chains, open V-cut trenching, and backfilling. Similar to the RT-1, all of these operations are performed using digger chain assemblies. The i-Trencher can trench pipelines with diameters of up to 18in, and it weighs about 85 tonnes.
Allseas’ DiggingDonald is the third North Sea mechanical trencher. It is capable of trenching pipelines with an outer diameter of up to 48in, achieving a maximum trench depth of about 2.1m by means of its hybrid mechanical digging and jetting arms. The trench can be backfilled with adjustable backfilling blades, which can be mounted on the trencher. DiggingDonald weighs about 145 tonnes.
Mechanical trenchersMechanical cutting represents an alternative less widely used technique to ploughing and water jetting. It is the only method that offers a degree of certainty that a trench can be cut through the entirety of the hardest areas of seabed, even those very hard or rocky areas where a plough would tended to ride out.
However the machines with this capability are mechanically complex and there are really only three which are actively available and capable of handling a rigid pipelines. One is CTC Marine’s RT1 rock trencher which is shown in Fig.10. This trencher is self-propelled using tracks and it uses a triple arrangement of overlapping mechanical cutting chains to cut a V-shaped trench with 45° side slopes. It is a very large machine indeed and weighs over 200 tonnes.
Fig.9. CTC Marine’s UT-1 jet trencher.
Fig.11. Canyon Offshore’s i-Trencher.Fig.10. CTC Marine’s RT1.
Sample
copy
not fo
r dist
ributi
on

The Journal of Pipeline Engineering128
There are three main types of pre-lay dredging techniques:
• trailer suction dredging• cutter suction dredging• jet dredgers (mass flow and clay cutters)
It has been described by Allan [6] that trailer-suction dredging technology was used to excavate 10-m deep ‘glory holes’ on the Grand Banks offshore Newfoundland for the purposes of protecting seabed structures from ice gouging. Figures 12 and 13 illustrate the trailer-suction dredging method and show a typical excavation tool. Allan points out that this technology is capable of excavation in a wide range of tough soil conditions and is now available for use in water depths of greater than 100m (with the maximum limit of
Pre-lay dredge equipment
While the North Sea pipeline industry has concentrated on developing a range of post-lay trenching machines, the marine dredging industry has long possessed a vast arsenal of dredging vessels and excavation tools suitable for pre-lay dredging a pipeline trench. However the dredging industry has arguably been slower to adopt the remote ROV vehicle technology used in the oilfields, and as a consequence excavation tools are usually suspended and operated by means of winches and riser pipes from surface vessels which also contain the power and pumping stations. As a result of this, the tools are mainly restricted to shallower water works. However, for work in the coastal Arctic this may not be a particular disadvantage.
Fig.12. Trailer-suction dredging method.
Fig.13. Trailer-suction dredging tool.
Sample
copy
not fo
r dist
ributi
on

Finally better seabed engineering and survey, including new geotechnical data gathering technologies integrated with improved risk-based design solutions, are likely to provide the key to more robust and cost-effective longer term pipeline security. Here, monitoring and sur-veillance of the trenched pipeline performance is likely to play an important role.
References1. A.R.Reece and T.W.Grinsted, 1986. Soil mechanics
of submarine ploughs. OTC 5341, May.2. D.N.Cathie and J.-F.Wintgens, 2001. Pipeline
trenching using plows: performance and geotechnical hazards. OTC 13145, May.
3. A.C.Palmer, 1999. Speed effects in cutting and ploughing. Géotchnique, June, 49, 3, pp285-294.
4. R.J.Brown and A.C.Palmer, 1985. Submarine pipe-line trenching by multipass ploughs. Proc.17th An-nual Offshore Technology Conference, Houston, 2, 283-291.
5. J.B.Machin and P.Allan, 2010. State-of-the-art jet trenching analysis in stiff clays. ISFOG 2010, Perth, WA, November.
6. S.Allan, 2000. Global analysis of wellhead protec-tion glory holes for Terra Nova. Offshore Technology Conference OTC11919, May, Houston, Texas.
available equipment currently thought to be approaching 150m water depth). It is also noteworthy that pre-lay jet dredging technology is known to have been deployed in up to 1,000m water depth on the Ormen Lange project, offshore Norway
Future Arctic trenching solutionsThis article has reviewed the trenching technology
available for both post-lay and pre-lay trenching in the offshore Arctic. It has raised the question whether a funda-mentally new approach is needed for deep trenching in the environmental conditions that will likely be encountered. For example, will the development of a new generation of super-sized equipment be needed? The author concludes that there are some important physical limitations to contend with in the design of trenching equipment, and it is expected that an incremental rather than revolutionary approach to the challenges presented is most likely to best deliver the solutions required.
In particular it is suggested that there will be greater use of pre-lay and multi-pass pipeline-trenching techniques. Here the dredging industry has much technology to offer. Also recent developments in the optimization of ROV-based soils’ jetting and mechanical-excavation tooling currently seem to offer much promise.
Sample
copy
not fo
r dist
ributi
on

Sample
copy
not fo
r dist
ributi
on