journal of plant development sciencesjpds.co.in/wp-content/uploads/2014/03/vol.-910.pdf · journal...
TRANSCRIPT

Journal of Plant Development Sciences (An International Monthly Refereed Research Journal)
Volume 9 Number 10 October 2017
Contents
REVIEW ARTICLE
Phytoremediation of heavy metals contaminated soils
—Ankush Sheoran and Sunita Sheoran ---------------------------------------------------------------------------- 905-915
RESEARCH ARTICLE
The spectral modelling of above ground forest biomass in Jhajra forest range of Dehradun forest division using
microwave data
—Yogesh Kumar, Sarnam Singh and R.S. Chatterjee ---------------------------------------------------------- 917-923
Isolation and characterization of various fungal strains as primary coloniser from wheat straw at varying
nitrogen concentrations
—Shahnaaz Khatoon S.C. Jain and M.U. Charaya -------------------------------------------------------------- 925-931
Community structure of Dandachali forest of Tehri forest divison, North-West Himalaya
—Pankaj Lal, J.S. Butola and V.P. Khanduri --------------------------------------------------------------------- 933-939
Agri-business management behavior of the onion growers of Rewa district (M.P.)
—Krishn Kumar Verma and Sanjay Singh ------------------------------------------------------------------------ 941-945
Effect of botanicals and bio-agents on Fusarium oxysporum F. sp. Ciceri causes Fusarium wilts of chickpea
(Cicer arietinum L.)
—Anmol Singh Yadav, Supriya Yadav and Ramesh Singh ---------------------------------------------------- 947-950
People perception on the use of household coping strategies against shocks: a case study of forest resources use
in Garhwal Himalaya
—Sushma Rawat, Munesh Kumar, Rajiv Pandey and Bhuvnesh Nagar ----------------------------------- 951-954
Impact of participatory seed village programme on adoption level of wheat seed producers in Rewa district
(M.P.)
—R.P. Joshi, Sanjay Singh and Nirmala Singh ------------------------------------------------------------------- 955-958
Enhancement of production and productivity of Soybean through the cluster front line demonstration of oilseed
—V.K. Jain, H.K. Trivedi and B.S. Gupta ------------------------------------------------------------------------- 959-961
SHORT COMMUNICATION
Performance of strawberry (Fragaria x ananassa Duch.) genotypes for growth and yield characters in Hill zone
of Karnataka
—Maheshgowda B.M., Madaiah D., Dinesh Kumar M., Sivkumar B.S. and Ganapathi M. ----------- 963-965

*Corresponding Author
________________________________________________ Journal of Plant Development Sciences Vol. 9 (10) : 905-915. 2017
PHYTOREMEDIATION OF HEAVY METALS CONTAMINATED SOILS
Ankush Sheoran1* and Sunita Sheoran
2
1Department of Chemistry, Panjab University, Chandigarh
2Department of Soil Science, College of Agriculture, CCS Haryana Agricultural University, Hisar
Email: [email protected]
Received-06.10.2017, Revised-22.10.2017
Abstract: Soils may be contaminated by the accumulation of heavy metals and metalloids through the emissions from rapidly expanding industrial areas, mine tailings, disposal of high metal wastes, leaded gasoline and paints, application of fertilizers, animal manures, sewage sludge, pesticides, wastewater irrigation etc. Excessive accumulation of heavy metals can have deleterious effects on soil fertility and productivity, disrupts ecosystem functioning and can lead to serious health
risks to animals and human beings. Many methods of preventing or removing these pollutants from soils are identified, however, most of these conventional remedial processes are expensive and adversely affect the soil fertility and productivity. Therefore, phytoremediation which uses higher plants to reduce contaminant levels in soil is an eco-friendly and cost effective technology. The objective of this review is to discuss the different mechanisms of phytoremediation, their potentials, limitations, and techniques to enhance the phytoremediation efficiency.
Keywords: Phytoextraction, Hyperaccumulator, Ecofriendly, Cost effective, Chelates, Microbes
INTRODUCTION
eavy metal is defined as d-block element of
periodic table which may be transition metal,
metalloid, lanthanoids or actinoids, having metallic
properties, atomic weight more than calcium, density
>5 Mg/m3, have great capacity to form complexes
with organic matter and often associated with
contamination and potential toxicity (Duffus, 2002). As per the role of heavy metals in living
systems, these are classified into two groups:
essential and non-essential. Some metals like Mn,
Fe, Ni, Cu and Zn are essential for plant growth,
development and physiological functions at low
concentration that is why known as essential heavy
metals (Gohre and Paszkowski, 2006). Most of heavy
metals are cofactors of enzymes. Some of them are
involved in important processes such as
photosynthesis (Mn, Cu), DNA transcription (Zn),
hydrolysis of urea into carbon dioxide and ammonia
(Ni), legume nodulation and nitrogen fixation (Co, Zn, Co), flowering and seed production (Cu, Zn),
especially when their availability is very low. Second
groups i.e. non-essential heavy metals includes
elements like Cd, Pb, Hg and As which are not
required by living organisms or plants for any
physiological functions (Peng et al., 2009). Heavy
metals are highly carcinogenic, teratogenic and
mutagenic even at low or trace concentration.
Phytotoxicity is mainly associated with accumulation
of non-essential heavy metals which generally have
very low toxicity thresholds (Clemens, 2006). The major hazardous heavy metals concerned with
environmental and health issues are As, Cd, Cr, Cu,
Pb, Hg, Ni, Se, Mo, Zn, Tl, Sb (Basta et al., 2005,
Wright, 2007 and Gosh, 2010). Among these, Cd
and Pb are the most dangerous metals for human
health (Sekara et al., 2005). Heavy metals at higher
concentrations may disturb the normal physiology
and biochemistry of living systems, can block the
essential functional groups, displace other metal ions,
or modify the active configuration of biological
molecules. Threshold toxic limits of heavy metals in
soil and plants and their associated health risk to
humans are given in table 1.
Heavy metals may exist in colloidal, ionic,
particulate and dissolved phase. They also have high affinity for humic substances, organo-clays and
oxides coated with organic matter (MacCarthy, 2001
and DeVolder et al., 2003). The soluble forms of
heavy metals may be ions or organo-metallic chelates
or complexes and their solubility or retention is
controlled by pH (Ross et al., 2003), amount of metal
, cation exchange capacity, organic carbon content
(DeVolder et al., 2003), oxidation state of metals and
the redox potential of the system. Among these
factors, soil pH is predominant and solubility of
heavy metals is increased with decrease in pH.
Sources of heavy metals in soil Heavy metal can be introduced into any system from
natural or anthropogenic sources. Naturally heavy
metals are released into the soil, sediments or
aqueous system through chemical as well as physical
weathering of igneous, metamorphic rocks and soil.
They are also generated from volcanic activities,
wind erosion, forest smoke fire and fossil fuels.
These metals may also be derived from
remobilization from natural soils due to the changes
in local redox conditions and the corrosion of
subsurface engineering structures due to prolonged submergence under acidic groundwater. Whereas on
other hand, anthropogenic sources such as mines,
foundries, smelting of ores, electroplating, gas
exhaust, coal burning power plants etc. also releases
heavy metals and imposes a harmful threat to
humans as well as environment. Among these
H
REVIEW ARTICLE

906 ANKUSH SHEORAN AND SUNITA SHEORAN
factors, mining contribute the maximum in
contamination of soil followed by agriculture and
wastewater. The most hazardous trace-elements such
as As, Cd, Co, Cu, Mn, Pb and Zn were found,
mainly around industry and mining areas and poses
risk to human and ecological health. The materials generated from various industries such as textile,
tanning, petrochemicals from accidental oil spills or
utilization of petroleum-based products, and
pharmaceutical facilities are highly variable in
composition (Sumner, 2000 and DeVolder et al.,
2003). Industrial activity has led to very high heavy
metal concentrations on the environment, which are
in general 100–1000 fold higher than those in the
Earth‘s crust, and in turn, living organisms can be
exposed to even higher levels. Second major source
of heavy metal contamination is related to
agricultural issues that include (i) uses of agrochemicals such as fertilizers, pesticides,
fungicides, (ii) application of manures and bio-solids
(iii) utilization of waste water for crop production.
The fertilizers which are used to supply
micronutrients contain trace amounts of heavy metals
(e.g., Cd and Pb) as impurities and continued
application of these fertilizers may significantly
increase the content of heavy metals in the soil.
Other than micronutrient fertilizers, certain
phosphatic fertilizers also supply Cd, Pb and other
potentially toxic elements such as F, Hg and As to the soil (Raven et al., 1998). Besides fertilizers,
commonly used pesticides or fungicides for insect-
pest or disease control of field crops also contain
heavy metals like Cu, Hg, Mn,Pb, Zn etc. (Jones and
Jarvis, 1981). Bordeaux mixture, a Cu-containing
fungicide, is most widely used for field crops while
for fruit orchard, lead arsenate is fairly extensively
used to control parasitic insects. Arsenic containing
compounds are also used to control cattle ticks and
pests in banana. The application of various bio-solids
(e.g. livestock manures, composts, and municipal
sewage sludge) in the fields to maintain soil fertility and productivity inadvertently lead to the
accumulation of heavy metals such as As, Cd, Cr,
Cu, Pb, Hg, Ni, Se, Mo, Zn, Tl, Sb etc. in the soil
(Basta et al., 2005). In the pig and poultry industry,
Cu and Zn are added to diets as growth promoters
and As is a part of poultry health products, so
manures produced from animals on such diets
contain high concentrations of As, Cu, and Zn and
repeated application of such manures cause
considerable buildup of these metals in the soil and
may have the potential to cause contamination of the soil (Sumner, 2000). Most commonly found heavy
metals in bio-solids include Pb, Ni, Cd, Cr, Cu, and
Zn. Heavy metal concentrations in bio-solids are
determined by the nature and intensity of industrial
activity and type of process employed during the bio-
solids treatment and production. Several studies
suggest that agriculture based on waste water
irrigation accounts for 50 percent of vegetables
supply to the urban areas (Bjuhr, 2007). Although, it
is considered that waste water contains relatively low
concentrations of heavy metals, however, long-term
utilization of such waste water for irrigation purpose
may lead to accumulation of heavy metals in the soil.
Remedial measures of heavy metals contaminated
soils
Remediation refers to any process or technique with
the help of which concentrations of contaminants are
reduced below the threshold levels so that associated
health hazardous can be eliminated (Martin and
Ruby, 2004). Due to immutable nature of heavy
metals, metal-contaminated soils are notoriously hard
to remediate. For remediation of heavy metal-
contaminated soils, selection of appropriate remedial
process depends on physical and chemical form of
the contaminants of concern, soil properties and site
conditions. Among the best demonstrated available technologies for remediation of heavy metals
contaminated soils, immobilization, soil washing and
phytoremediation are most frequently used. Each of
these remediation technologies has its specific
benefits and limitations.
1. Immobilization: Immobilization refers to the
process in which heavy metals remains in the soil
itself but reduce the toxicity by decreasing its
bioavailability through in situ immobilisation
processes (Diels et al., 2002). Immobilization uses
organic and inorganic amendments to reduce the bioavailability and toxicity of heavy metals. These
immobilizing amendments alter the physicochemical
states of metal and transform them into more
geochemically stable forms via sorption, ion
exchange, precipitation, redox reactions and
complexation phenomena (Hashimoto et al., 2009
and Wang et al., 2009). The mostly commonly used
inorganic amendments include clay, cement, fly ash,
blast furnace slag, calcium carbonate, Fe/Mn oxides,
charcoal, zeolites, minerals, phosphates (Ling et al.,
2007 and Fawzy, 2008) whereas organic
amendments include bitumen, organic composts, manures and microbes (Farrell, 2010) or a
combination of organic-inorganic amendments may
be used. Immobilization mainly includes stabilization
or vitrification process. Vitrification is defined as
high-temperature treatment of contaminated soil that
volatilize/destroy volatile metals. However, because
of very complexed nature of soil, immobilization is
not so successful.
2. Soil Washing: It is defined as a volume reduction
process in which contaminants are washed off from
the soil with the help of aqueous solutions or chemicals. Washing solution may be water or
aqueous solution of acids, alkali, solvents or
surfactants (Chen and Hong, 1995 and Wuana et al.,
2008). Organic acids such as oxalic, citric, formic,
acetic, malic, succinic, lactic and fumaric acids also
dissolve the metal and make it available to biota
(Labanowski et al., 2008). Soil washing can be
performed in situ or ex situ depending on nature of

JOURNAL OF PLANT DEVELOPMENT SCIENCES VOL. 9 (10) 907
soil and contaminant to be removed and extent of
contamination. Soil washing is an efficient remedial
process and eliminates the contaminants for longer
time period. However, the most important problem is
associated with disposal of hazardous waste solution.
Secondly, it is high cost process that is economically infeasible. Also, the hazardous acids if persist in soil
for longer time, they may cause adverse effects on
plant growth and soil fertility and subsequently
causes negative impacts on the ecosystem.
3. Phytoremediation The term phytoremediation
was coined by Ilya Raskin in 1994, it consists of
Greek word ―phyto‖ means ‗‗plant‘‘, and the Latin
suffix ―remedium‖ means ‗‗able to cure‘‘ or
‗‗restore‘‘ (Cunningham et al., 1996). So,
phytoremediation is defined as an in situ remedial
process that uses plants to remove, transfer, stabilize,
and destroy contaminants in soil, sediments or aqueous system. It is also termed as green
remediation, botanoremediation, agroremediation, or
vegetative remediation. Efficiency of
phytoremediation depends on the nature of
contaminant to be removed, its bioavailability and
soil properties (Cunningham and Ow, 1996).
Phytoremediation is an emerging non-destructive,
aesthetically pleasing and cost effective strategy to
clean up the contaminated soil. Additionally, it is
socially acceptable technology. In contrast to its
many positive aspects, limitations of phytoremediation includes: (i) all type of plants are
not suitable for removal of all type of contaminants,
in tern, its success is limited by growing habit of
plants in specific environmental and soil conditions it
is dependent on the growing conditions required by
the plant, (ii) it is a slow process and takes longer
time than other technologies (iii) success is dependent on the tolerance of the plant to the
pollutant. Most of the conventional remedial
technologies are expensive and inhibit the soil
fertility, hence, in order to deal with these
contaminants in an eco-friendly manner,
phytoremediation is most suitable option.
Different mechanisms of phytoremediation Phytoremediation is a broad term that has been used
since 90‘s to describe the use of plants to remediate
the contaminated media (USEPA, 2000).
Phytoremediation includes six main mechanisms
namely Phytostablisation, Phytoextraction, Rizofiltration, Phytodegradation, Rizodegradation
and Phytovolatilisation (Figure 1). Use of the
mechanism depends on the nature of the contaminant
to be dealt with and soil conditions. Out of these six
mechanisms of phytoremediation, for remediation of
heavy metal contaminated soils, potentially used
technologies are phytoextraction
(phytoaccumulation), phytostabilization, and
phytofiltration (Garbisu and Alkorta, 2001). Further
among these three, phytoextraction is most primarily
used (USEPA, 2000).
Figure 1: Different mechanisms of phytoremediation
Phytoextraction: It is defined as the process in
which plants uptake the metal contaminants by roots
from soil and then accumulate the contaminant into
the above ground parts such as shoots, leaves etc.
That is why it is also termed as phytoaccumulation. The discovery of hyperaccumulator plants lead to the
idea of using plants for remediation of metal
contaminated soils (Raskin and Ensley, 2000). A
hyperaccumulator is defined as the plant species that
have potential to accumulate high concentrations of
metals in their foliage and often it is endemic (Raskin
et al., 1997 and Brooks, 1998). Generally, it is
believed that hyperaccumulator is capable of
accumulating the metal about 100 times higher as compared to non-accumulating plants (McGrath et
al., 2002). About 400 plants species have been
discovered and identified as hyperaccumulators and
these plant species differ widely in their potential of

908 ANKUSH SHEORAN AND SUNITA SHEORAN
phytoextraction for different heavy metals (Table 2).
Majority of hyperaccumulator plants reported belong
to the families like Asteraceae, Brassicaceae,
Caryophyllaceae, Cyperaceae, Cunouniaceae,
Fabaceae, Flacourtiaceae, Lamiaceae, Poaceae,
Violaceae and Euphobiaceae. Among these reported families, Brassicaceae had the largest number of taxa
viz. 11 genera and 87 species. Metals such as Ni, Zn,
Cu are best studied for phytoextraction because these
metals are preferred by majority of plants for uptake
and accumulation. Hyperaccumulator plants used for
phytoextraction purpose should have the following
characteristics: (i) should extract high concentration
of heavy metals from contaminated soil (ii) have
capacity to translocate the extracted metals to the
above ground biomass (iii) should have fast growing
habit and produce large quantity of plant biomass
and (iv) have capacity to tolerate high levels of metal (Brennan and Shelley, 1999 and Garbisu et al.,
2002). Plants suitable for phytoextraction also have
been are characterized by shoot-to-root metal
concentration ratio (also termed as Translocation
factor) of >1 (McGrath et al., 2002, Yoon et al.,
2006). Ali et al., 2012 observed that root
bioconcentration factor of Trifolium alexandrinum
for Zn, Pb, Cu and Cd were 4.242, 1.544, 1.071 and
0.604, respectively. The phytoextraction is fairly
inexpensive technology as compared to conventional
methods. Major limitation associated with phytoextraction is disposal of harvested above
ground biomass. Volume reduction of contaminated
material can be achieved by ashing or composting
(Garbisu et al., 2002). Harvested biomass can also be
used for land filling or may be used for metal
recovery (Salt et al., 1998 and Koppolu and
Clements, 2003).
Phytovolatilization: Phytovolatilization process uses
the naturally occurring or genetically modified plants
to absorb metals from the soil/sediments/water,
transforming them into less toxic, volatile gaseous
into plants and releasing them into atmosphere (USEPA, 2000). This process is applicable only for
those heavy metals which can exist as gaseous forms
in environment such as As, Hg, and Se may exist as
gaseous species in environment. Remediation of
heavy metals contaminated soils through
phytovolatilization has been observed in several
studies. Unlike phytoextraction, problem of disposal
of harvested biomass is not associated with
phytovolatilization. However, it is a promising
technology for remediation of volatile heavy metals,
but it is likely to be recycled through precipitation and re-deposited back into lakes and oceans
(USEPA, 2000).
Phytostabilization: This mechanism of
phytoremediation uses plant species to stabilize the
heavy metals in soil through absorption and
accumulation by plant roots (Vamerali et al., 2009).
It is also termed as in-place inactivation.
Phytostabilization may also occur through
precipitation or complexation of heavy metals within
rhizosphere by exudates secreted by plant roots. The
most important task is to find out suitable plant
species (Rizzi et al., 2004 and Mendez and Maier,
2008). This technique is useful for the remedial of
Pb, As, Cd, Cr, Cu and Zn contaminated soils. However, this technology reduces the entry of toxic
metals by decreasing their uptake by plants, but its
drawback is that contaminants still remain in soil.
Phytodegradation: Phytodegradation is defined as
breakdown of toxic compounds into simpler
molecules by plant metabolism after the toxic metals
has been uptaken by the plants and translocated to
above ground tissues (Trap et al., 2005). This is also
termed as phytotransformation.
Rhizofiltration: Rhizofiltration is defined as
adsorption and precipitation of toxic metals onto
plant roots and roots are harvested after they become saturated with contaminants. Plants utilized may be
terrestrial or aquatic in nature, however, because of
having fibrous and longer roots, terrestrial plants are
preferred (Raskin and Ensley, 2000). It is applicable
for aqueous system where toxic elements are present
in groundwater, irrigation water or wastewater.
Metals suitable for rhizofiltration include Pb, Cd, Cu,
Ni, Zn, and Cr etc. (USEPA, 2000). Potential of
several plant species such as sunflower, Indian
mustard, tobacco, rye, spinach, and corn have been
studied for removal of lead from water. Rhizodegradation: Rhizodegradation is defined as
the breakdown of toxic metals/contaminants into less
toxic forms within the rhizosphere. This degradation
or break down can be carried out by microbes present
in rhizosphere or by exudates (includes sugars,
amino acids or amino sugars etc.) secreted by plant
roots. This process is also known as
phytostimulation.
Ways to improve efficiency of phytoremediation
Most of metals are immobile in nature so
phytoremediation rate and efficiency are limited by
solubility and diffusion of metals to root surface. There are a number of ways to enhance the efficiency
of phytoremediation which includes uses of
microbes, chelates, organic manures and compost,
other chemicals like fertilizers, fungicides, genetic
modified plants etc.
Chelating agents: Chelating agents increase metal
bioavailability and plant uptake and increases
efficiency of phytoextraction. Chelating agents may
be organic and inorganic although inorganic are most
commonly used (Quartacci et al., 2006). Various
inorganic chelates used are ethylene diamine tetraacetate (EDTA), ethylene diamine disuccinate
(EDDS), nitrilo triacetate (NTA), di ethylene
triamine pentaacetic acid (DTPA) and cyclohexane
diamino tetraacetic acid (CDTA) (Ramprakash et al.,
2009). Among these, EDTA is most frequently used
to enhance the uptake of several heavy metals
(Huang et al., 1997). Other than these inorganic
chemicals, low molecular weight organic acids like

JOURNAL OF PLANT DEVELOPMENT SCIENCES VOL. 9 (10) 909
acetic, citric, oxalic, fumaric and succinic acids may
also be used to improve efficiency of
phytoremediation (Chen et al., 2003 and Wenger et
al., 2003). Singh et al., 2013 reported that all the
chelating agents increased Ni desorption from Ni
spiked soil, however, order of effectiveness of chelating agents for desorption in Ni was followed as
: NTA>CDTA>DTPA>CA. They also reported that
desorption was highest in first extraction followed by
second, third and fourth successive extraction. The
increased uptake might have been due to increased
availability of Ni in soils due to addition of chelating
agents resulting in its higher accumulation in roots
and shoots and higher dry matter yields of both the
components of B. juncea (Ishikawa et al., 2006).
Amongst the commercial crops grown in this region
B. juncea has been reported to produce high biomass
and accumulate significant amount of heavy metals. Ramprakash et al., 2013 reported that mean uptake
of Cr by shoot increased from 303.25 µg pot-1 in
control to 389.57, 696.17, 868.19 and 427.43 µg pot-1
due to application of CDTA, CA, NTA, FYM,
respectively (Table 3). EDDS is structural isomer to
EDTA, however, its efficiency to improve is mainly
associated with Cu or Zn or Pb (Tandy et al., 2004).
Application of microbial inoculants in combination
with chelating agents further improves the efficiency
of phytoextraction as reported by Panwar et al.,
2011. They conducted an experiment with Brassica juncea grown on a spiked soil with EDTA, farmyard
manure, vermicompost and microbial inoculants
(Azotobacter and Pseudomonas) and it was observed
that application of microbial inoculants, EDTA,
FYM and vermicompost significantly increased Cd
uptake and highest uptake was recorded with
vermicompost treatment (Table 4).
Genetic engineering/ modified plants: With the
help of genetic engineering technique, transgenic
plants are developed which have manipulated
capacity to uptake, accumulate and can tolerate high
concentration of pollutant. Genes which are involved in metabolism and detoxification of pollutants are
identified and manipulated thus enhanced
phytoextraction is achieved in several studies (Meda
et al., 2007 and Reisinger et al., 2008). Genetic
engineering also improved phytovolatilization
potential of Indian mustard as reported by Banuelos
et al., 2005. They tested three transgenic lines of
Indian mustard, over expressing the genes encoding
enzymes adenosine triphosphate sulfurylase (APS),
γ-glutamyl cysteine synthetase (ECS) and glutathione
synthetase (GS), for their potential to remove Se from contaminated sediment. The APS, ECS and GS
transgenic plants accumulated 4.3, 2.8 and 2.3 fold
more Se in their leaves than wild type, respectively
(Figure 2). Improved ability of APS Indian mustard
may be due to the reason that APS plants over
express ATP sulfurylase, a rate-limiting step in the
conversion of selenate to selenite. This enables APS
plants to rapidly convert selenate via selenite to
organic-Se forms, while wild type plants accumulate
mostly selenate. Secondly, APS plants may
accumulate high concentrations of Se in shoots by
accumulating more Se in nontoxic organic Se forms
such as non protein amino acid methyl seleno
cysteine (Met-SeCys). ECS and GS would have increased Se uptake and assimilation through
increased activity of sulfate permease and ATP
sulfurylase.
Humic Acids: Best part of organic matter which has
significance importance in agriculture is humus,
which is well decomposed part by action of
microbes. Humic substances (humic acid+fulvic
acid+humin) maintain soil fertility and productivity
by improving soil chemical, physical and biological
properties such as retention capacity, porosity,
aggregate stability, cation exchange capacity etc.
Other than these functions, humic acid typically contains of heterocyclic compounds with carboxylic,
phenolic, alcoholic and carbonyl functional groups
and this characteristic play a vital role in enhancing
nutrient uptake and also heavy metals by plants. This
is attributed to the reason that humic acids being
acidic in nature increases solubility and
bioavailability of heavy metals (Bianchi et al., 2008).
That is why humic acids can be used to improve
phytoremediation as alternatives to inorganic
chelating agents. In contrast to this, humic acids can
also decreases the mobility of some toxic metals and results in phytoaccumulation (Halim et al., 2003).
Therefore, contradictory results have been reported
related to mechanism of humic acids in improving
phytoremediation.
Mycorrhizae Fungi: Role of mycorrhizae is well
known in increasing nutrient uptake by exploiting
more volume of soil. This positive effect is also
applicable for improving phytoextraction by
increasing uptake of heavy metals also (Giasson et
al., 2005). However, high concentration of toxic
metals can also adversely affect the growth of
mycorrhizae fungi. Bacteria: Addition of bacteria significantly improves
the microbial biomass in the rhizosphere and might
help to increase As uptake and accumulation (Table
5). The possible explanation was that the application
of arsenate reducing bacteria improved the
rhizosphere microbial environment, and increased
the number and the mycelium of microbes as well as
enhanced the biomass of the plant root systems,
which might help to take up As, hold soil As, and
prevent As losing (Yang et al., 2012).
Chemical fertilizers: Chemical fertilizers can improve phytoextraction process by improving plant
growth. Mandal et al., 2012 phytoextracted the soil
with Pteris vittata grown for two cycles and
fertilized with di-ammonium phosphate (DAP) and
SSP. However, DAP was found more effective over
SSP in stripping more arsenic by Pteris vittata
resulting in lesser arsenic accumulation in rice crop
(Figure 3). Phosphate may compete with arsenic for

910 ANKUSH SHEORAN AND SUNITA SHEORAN
plant uptake (Cao et al., 2003). On the other hand,
phosphate addition as an essential fertilizer for plant
development, would enhance arsenic release from
soil through competitive exchange (Smith et al.,
2002).
Possible utilization of biomass after phytoextraction: A serious challenge for the
commercialization of phytoextraction has been the
disposal of contaminated plant biomass especially in
the case of repeated cropping where large tonnages
of biomass may be produced. The biomass has to be
stored, disposed of or utilized in an appropriate
manner so as not to pose any environmental risk
(Blaylock and Huang, 2000). The major constituents
of biomass material are lignin, hemicellulose,
cellulose, minerals, and ash. It possesses high
moisture and volatile matter, low bulk density, and
calorific value (Ghosh and Singh, 2005). Controlled
combustion and gasification of biomass can yield a
mixture of producer gas and/or pyro-gas which leads
to the generation of thermal and electrical energy.
Composting and compacting can be employed as
volume reduction approaches to biomass reuse (Raskin et al., 1997 and Garbisu and Alkorta, 2001).
Ashing of biomass can produce bio-ores especially
after the phytomining of precious metals. Heavy
metals such as Co, Cu, Fe, Mn, Mo, Ni, and Zn are
plant essential metals, and most plants have the
ability to accumulate them (Jadia and Fulekar, 2009).
The high concentrations of these metals in the
harvested biomass can be ―diluted‖ to acceptable
concentrations by combining the biomass with clean
biomass in formulations of fertilizer and fodder.
Table 1. Toxic limits of heavy metals in soil and plant and their toxic responses to humans
Heavy
metal
Toxic limit in plant
(mg kg-1)
Toxic limit in soil
(mg kg-1)
Toxic response in human
Pb 30-300 600 Irreversible neurological damage, renal
disease, reproductive toxicity
Cd 5-30 100 Stomach irritations, lung damage, cancer,
bone defects
As >2.6 20 Cancer, Cardiovascular, gastrointestinal,
hepatic and renal disease, DNA damage
Cr 3-30 100 Genotoxic carcinogens, lung cancer, muscle
cramps
Hg 0.1-10 270 Brain damage, birth defects, sensory
impairment, hearing loss
Cu 100-200 600 Inhibition of dihydrophilhydratase,
accumulation in liver and kidney
Zn 100-400 1500 Inhibition of copper absorption, nausea, loss
of appetite, abdominal cramps
Source: Salt et al., 1995
Table 2. Concentrations of heavy metals in field crops obtained from field experiments
Species Metal concentrations (mg/kg)
AAss CCdd CCoo CCrr CCuu NNii PPbb ZZnn
Brassica carinata 12 12 - 9.8 37 7.6 50 1650
Brassica juncea 30 10 - 5.2 71 - 55 2029
Brassica napus 5.8 11 - 9 40 7 39 1400
Festuca spp. - - - - 106 - - 90
Glycine max 230 2.4 - - 440 - 72 430
Helianthus annus 20 0.64 0.71 - 70 - 5 150
Hordeumvulgare 20 0.44 - - 16 - 27 334
Medicago sativa 85 53 - - 77 - 2177 -
Oryza sativa - - - - 34 - 6 90
Phaseolus vulgaris - 53 - - 2230 - 1000 1440
Pisumsatium - - - - - - 1390 -
Raphanussativus - 9.4 - 5 34 6.5 28 1450
Sorghum bicolor 240 3.7 1.8 - 540 - 100 580
Triticumsecalotriticum 21 1.9 - - 27.5 - 37 588
Zea mays 30 20 - - 1220 - 257 1200
Source :Vamerali et al., 2010

JOURNAL OF PLANT DEVELOPMENT SCIENCES VOL. 9 (10) 911
Table 3. Effect of chelating agents and sewage sludge on Cr uptake (µg pot-1) by roots and shoots of subsequent
Brassica juncea crop in Cr contaminated soil
Treatment 50DAS 80DAS
Without SS With SS Without SS With SS Mean
Root
Cr20 34.31 53.91 128.52 154.43 92.79
Cr20 + CDTA 41.17 56.26 108.92 136.69 85.76
Cr20 + CA 98.68 133.81 201.84 232.73 166.77
Cr20 + DTPA 34.46 48.28 82.14 100.06 66.23
Cr20 + NTA 125.72 151.55 288.49 318.95 221.18
Cr20 + FYM 72.87 92.99 161.19 194.57 130.41
Mean 67.87 89.47 161.85 189.57
CD (0.05) Soil=6.96, Time=6.96, Chelating agent= NS, S×T=9.84, S×CA=17.05, T×CA=NS,
S×T×CA=NS
Shoot
Cr20 51.59 124.61 469.35 567.46 303.25
Cr20 + CDTA 85.40 154.07 560.01 758.78 389.57
Cr20 + CA 335.41 530.77 881.29 1039.33 696.17
Cr20 + DTPA 59.36 99.43 453.53 581.73 298.51
Cr20 + NTA 411.44 646.53 1125.69 1289.10 868.19
Cr20 + FYM 194.26 273.84 547.09 694.54 427.43
Mean 189.57 304.88 672.83 821.82
CD (0.05) Soil=38.7, Time=38.7, Chelating agent= NS, S×T=54.73, S×CA=94.8, T×CA=NS,
S×T×CA=NS
Source : Ramprakash et al., 2013
Table 4. Cadmium uptake (µg pot-1) of shoots and roots of Indian mustard as influenced by different chelating
agents and bio-inoculants in Cd-enriched soil
Treatments Control Cd100 Cd100+FYM Cd100+VC Cd100+EDTA Mean
Shoots
(-) Microbial
inoculants
126.6 871.6 1381.6 2238.6 2139.0 1351.5
(+)Microbial
inoculants
132.0 993.1 1485.7 2265.7 2251.2 1425.6
Mean 129.3 932.4 1433.6 2252.2 2195.1
CD (5%) Microbial inoculants (M)=11.99, Cd=18.95, Interaction of M×Cd=26.81
Roots
(-) Microbial
inoculants
36.7 233.3 395.3 477.9 417.6 312.2
(+)Microbial
inoculants
47.0 250.6 413.0 499.7 455.0 333.0
Mean 41.8 241.9 404.2 488.8 436.3
CD (5%) Microbial inoculants (M)=4.06, Cd=6.42, Interaction of M×Cd=9.08
Source : Panwar et al., 2011
Table 5. Effectiveness of arsenate reducing bacteria to enhance arsenic removal from polluted soils by Pteris
Vittata
Arsenate reducing bacteria As conc. (mg/kg) As uptake (mg/m 2 )
Control 615.74 c 30.47 c
Ts 1 704.32 b 53.39 b
Ts 33 886.47 a 65.04 a
Ts 37 652.55 bc 48.33 b
Ts 41 835.56 a 48.98 b
PSQ 22 698.47 b 44.04 b
Source : Yang et al., 2012

912 ANKUSH SHEORAN AND SUNITA SHEORAN
Figure 2: Field trials of transgenic Indian mustard for phytoremediation of selenium contaminated sediment
(Source : Banuelos et al., 2005)
Figure 3: Phytoextraction of soil with Pteris vittata grown for two cycles and fertilized with DAP and SSP.
(Source : Yang et al., 2012)
CONCLUSION
As highlighted above, there are several ways in which plants are used to clean up or remediate
contaminated sites. The success of phytoremediation
at a given site cannot always be attributed to just one
of these mechanisms because a combination of
mechanisms may be at work. Phytoremediation is a low cost, solar energy driven and natural cleanup
technique, which are most useful at sites with

JOURNAL OF PLANT DEVELOPMENT SCIENCES VOL. 9 (10) 913
shallow, low levels of contamination. In addition to
this, it is easy to implement and maintain, does not
require the use of expensive equipment or highly
specialized personnel and is environmentally friendly
and aesthetically pleasing to the public. Although it
is an easy and cost effective process yet to become a commercially available technology in many parts of
the world especially the developing countries like
India.
REFRENCES
Ali, H., Naseer, M. and Sajad, M.A. (2012).
Phytoremediation of heavy metals by
Trifoliumalexandrinum. International Journal of
Environmental Sciences, 2(3):1459-1469.
Banuelos, G., Terry, N., Leduc, D. L., Elizabeth,
A.H., Smits, P. and Mackey, B. (2005). Field trials of transgenic Indian mustard plants shows enhanced
phytoremediation of selenium contaminated
sediment. Environ Science and Technology,
39(6):1771-78.
Basta, N. T., Ryan, J. A. and Chaney, R. L. (2005).
Trace element chemistry in residual-treated soil: key
concepts and metal bioavailability. Journal of
Environmental Quality, 34(1):49–63.
Bianchi, M.J., Masciandaro, G., Giraldi, D.,
Ceccanti, B. and Iannelli, R. (2008). Enhanced
heavy metal phytoextraction from marine dredged sediments comparing conventional chelating agents
(citric acid and EDTA) with humic substances.
Water Air Soil Pollution, 193:323-333.
Blaylock, M.J. and Huang, J.W. (2000).
Phytoextraction of metals. In: Raskin, I.,Ensley, B.D.
(Eds.), Phytoremediation of Toxic Metals: Using
Plants to Clean upthe Environment. – John Wiley
and Sons, New York, pp. 53–70.
Brennan, M. A. and Shelley, M. L. (1999). A
model of the uptake, translocation, and accumulation
of lead (Pb) by maize for the purpose of
phytoextraction. Ecological Engineering, 12:271-297.
Brooks, R.R., Chambers, M.F., Nicks, L.J. and
Robinson, B.H. (1998). Phytomining. Trends in
Plant and Science, 1: 359-362.
Cao, X., Ma, L.Q. and Shiralipour, A. (2003).
Effects of compost and phosphate amendments on
arsenic mobility in soils and arsenic uptake by the
hyperaccumulator Pteris vittata L. Environmental
Pollution, 126:157–167.
Chen T. C. and Hong, A. (1995). Chelating
extraction of lead and copper from an authentic contaminated soil using N- (2-
acetamido)iminodiacetic acid and S-carboxymethyl-
Lcysteine. Journal of Hazardous Materials, 41(2-
3):147–160.
Chen, Y.X., Lin, Y.M., He, Y.F., Zhen, S.J., Yu,
Y.L., Tian, G.M. and Wong, M.H. (2003). The role
of citric acid on the phytoremediation of heavy metal
contaminated soil. Chemosphere, 50:807-811.
Clemens, S. (2006). Toxic metal accumulation,
responses to exposure and mechanisms of tolerance
in plants. Biochimie, 88(11):1707–1719.
Cunningham, S. D. and Ow, D. W. (1996).
Promises and prospects of phytoremediation. Plant
Physiology, 110(3):715–719.
Cunningham, S. D., Anderson, T. A, Schwab, P.
A, and Hsu, F. C. (1996). Phytoremediation of
soilscontaminated with organic pollutants. Advances
in Agronomy, 56: 55-114.
DeVolder, P. S., Brown, S. L., Hesterberg, D. and
Pandya, K. (2003). Metal bioavailability and
speciation in a wetland tailings repository amended
with biosolids compost, wood ash, and sulfate.
Journal of Environmental Quality, 32(3):851–864.
Diels, N., van der Lelie, D. and Bastiaens, L. (2002). New developments in treatment of heavy
metal contaminated soils. Reviews in Environmental Science and Biotechnology, 1:75–82.
Duffus, J.H. (2002). Heavy metals—A meaningless
term? Pure and Applied Chemistry, 74:793–807.
Farrell, M., Perkins, W. T., Hobbs, P. J., Griffith,
G. W. and Jones, D. L. (2010). Migration of heavy
metals in soil as influenced by compost amendments.
Environmental Pollution, 158(1): 55–64.
Fawzy, E. M. (2008). Soil remediation using in situ
immobilization techniques. Chemistry and Ecology,
24(2):147-156.
Garbisu, C. and Alkorta, I. (2001). Phytoextraction: a cost-effective plant-based
technology for the removal of metals from the
environment. Bioresource Technology, 77(3):229–
236.
Garbisu, C. and Alkorta, I. (2001).
Phytoextraction: a cost-effective plant-based
technology for the removal of metals from the
environment. Bioresource Technology, 77: 229-236.
Garbisu, C., Hernandez-Allica, J., Barrutia, O.,
Alkorta, I. and Becerril, J.M. (2002)
Phytoremediation: A technology using green plants
to remove contaminants from polluted areas. Reviews on Environmental Health, 17: 75–90.
Ghosh, M. and Singh, S. P. (2005). A review on
phytoremediation of heavy metals and utilization of
its byproducts. Applied Ecology and Environmental
Research, 3(1):1–18.
Giasson, P., Jaouich, A., Gagne, S. and Moutoglis,
P. (2005). Arbuscular mycorrhizal fungi involvement
in zinc and cadmium speciation change and
phytoaccumulation. Remediation Journal, 15:75-81.
Gohre, V. and Paszkowski, U. (2006).
Contribution of the arbuscular mycorrhizal symbiosis to heavy metal phytoremediation. Planta,
223:1115-1122.
Gosh, S. (2010). Wetland macrophytes as toxic
metal accumulators. International Journal of
Environmental Sciences, 1 (4):523-528.
Halim, M., Conte, P. and Piccolo, A. (2003).
Potential availability of heavy metals to
phytoextraction from contaminated soils induced by

914 ANKUSH SHEORAN AND SUNITA SHEORAN
exogenous humic substances. Chemosphere, 52:265-
275.
Hashimoto, Y., Matsufuru, H., Takaoka, M.,
Tanida, H. and Sato, T. (2009). Impacts of
chemical amendment and plant growth on lead
speciation and enzyme activities in a shooting range soil: an X-ray absorption fine structure investigation.
Journal of Environmental Quality, 38(4):1420–1428.
Huang, J.W., Chen, J., Berti, W. R. and
Cunningham, S.D. (1997). Phytoremediation of
lead-contaminated soils: role of synthetic chelates in
lead phytoextraction. Environmental Science and
Technology, 31:800-805.
Ishikawa, S., Noriharu, A.E., Masaharu, M.I. and
Tadao, W. (2006). Is Brassica juncea a suitable
plant for phytoremediation of cadmium in soils with
moderately low cadmium contamination.Possibility
of using other plant species for Cd-phytoextraction. Soil Science and Plant Nutrition, 52:32.
Jadia, C. D. and Fulekar, M. H. (2009).
Phytoremediation of heavy metals: recent techniques.
African Journal of Biotechnology, 8(6):921–928.
Koppolu, L. and Clements, L.D. (2003). Pyrolysis
as a technique for separating heavy metals from
hyperaccumulators. Part I: Preparation of synthetic
hyperaccumulator biomass. Biomass and Bioenergy,
24: 69–79.
Labanowski, J., Monna, F. and Bermond A. (2008). Kinetic extractions to assess mobilization of Zn, Pb, Cu, and Cd in a metal-contaminated soil:
EDTA vs. citrate. Environmental Pollution,
152(3):693–701.
Ling, W., Shen, Q., Gao, Y., Gu, X. and Yang, Z. (2007). Use of bentonite to control the release of
copper from contaminated soils. Australian Journal
of Soil Research, 45(8):618–623.
MacCarthy, P. (2001). The principles of humic
substances. Soil Science, 166:738–751
Mandal, A., Purakayastha, T. J., Patra A. K. and
Sanyal, S. K. (2012). Phytoremediation of Arsenic
Contaminated Soil by Pteris Vittata L. II. Effect on Arsenic Uptake and Rice Yield. International Journal
of Phytoremediation, 14(6):621-628.
Martin, T. A. and Ruby, M. V. (2004). Review of
in situ remediation technologies for lead, zinc and
cadmium in soil. Remediation, 14(3):35–53.
McGrath, S.P., Zhao, F.J. and Lombi, E. (2002).
Phytoremediation of metals, metalloids, and
radionuclides. Advances in Agronomy, 75: 1–56.
Meda, A.R., Scheuermann, E.B., Prechsl, U.E.,
Erenoglu, B., Schaaf, G., Hayen, H., Weber, G.
and von Wiren, N. (2007). Iron acquisition by phytosiderophores contributes to cadmium tolerance.
Plant Physiology, 143:1761-1773.
Mendez, M. O. and Maier, R. M. (2008).
Phytostabilization of mine tailings in arid and
semiarid environments-an emerging remediation
technology. Environmental Health Perspectives,
116:278-283.
Panwar, B.S., Kadar, I., Biro, B., Rajkai-Vegh,
K., Ragayi, P., Rekasi, M. and Marton. L. (2011).
Phytoremediation: enhanced cadmium (cd)
accumulation by organic manuring, EDTA and
microbial inoculants (Azotobactersp., Pseudomonas
sp.) in Indian mustard (Brassica junceaL.). Acta Agronomica Hungarica, 59(2):101–107.
Peng, K.J., Luo, C.L., Chen, Y.H., Wang,
G.P., Li, X.D. and Shen, Z.G. (2009). Cadmium
and other metal uptake by Lobelia chinensis and
Solanum nigrum from contaminated soils. Bulletin
of Environmental Contamination and Toxicology,
83:260-264.
Quartacci, M.F., Argilla, A., Baker, A.J.M. and
Navari-Izzo, F. (2006). Phytoextraction of metals
from a multiply contaminated soil by Indian mustard.
Chemosphere, 63:918-925.
Ramprakash, Kumari, S., Sangwan, A., Rajpaul and Kumar, S. (2013). Phytoextraction of chromium
from contaminated soil by Brassica juncea as
influenced by chelating agents. Asian Journal of
Chemistry, 25(10):5357-5359.
Raskin, I. and Ensley, B. D. (2000). Recent
developments for in situ treatment of metal
contaminatedsoils. In: Phytoremediation of Toxic
Metals: Using Plants to Clean Up the Environment.
JohnWiley & Sons Inc., New York.
Raskin, I., Smith R.D. and Salt, D.E. (1997):
Phytoremediation of metals: Using plants to remove pollutants from the environment. Current Opinion in
Biotechnology, 8(2): 221-226.
Raven, P. H., Berg, L. R. and Johnson, G. B. (1998). Environment, Saunders College Publishing,
2nd edition. New York, NY, USA.
Reisinger, S., Schiavon, M., Terry, N. and Pilon-
Smits, E.A.H. (2008).cHeavy metal tolerance and
accumulation in Indian mustard (Brassica juncea L.)
expressing bacterial gamma-glutamyl cysteine
synthetase or glutathione synthetase. International
Journal of Phytoremediation, 10:440-454.
Rizzi, L., Petruzelli, G., Poggio, G. and VignaGuidi, G. (2004). Soil physical changes and
plant availability of Zn and Pb in a treatability test of
phytostabilization. Chemosphere, 57:1039-1046.
Ross, A., Suther and Filip, M.G. (2003). Tack,
Fractionation of Cu, Pb and Zn in certified reference
soils SRM 2710 and SRM 2711 using the optimized
BCR sequential extraction procedure. Advances in
Environmental Research, 8:37–50.
Rramprakash, Singh, S.K., Singh, A. (2009).
Effect of chelating agents on distribution of lead in
soil after harvest of Brassica juncea. Environment and Ecology, 27 (3):981-984.
Salt, D.E., Blaylock, M., Kumar, P.B.A.N.,
Dushenkov, V., Ensley, B.D., Chet, I. and Raskin,
I. (1995). Phytoremediation: a novelstrategy for the
removal of toxic metals from the environment using
plants. Biotechnology, 13: 468–475.
Salt, D.E., Smith, R.D. and Raskin, I. (1998).
Phytoremediation. Annual Review of Plant

JOURNAL OF PLANT DEVELOPMENT SCIENCES VOL. 9 (10) 915
Physiology and Plant Molecular Biology, 49: 643–
668.
Sekara, A., Poniedzialek, M., Ciura, J. and
Jedrszczyk, E. (2005). Cadmium and lead
accumulation and distribution in the organs of
nine crops: Implications for phytoremediation. Polish Journal of Environmental Studies, 14:509-
516.
Singh, S.K., Ramprakash, Kumari, S. and Duhan,
B.S. (2013). Phytoextraction of Ni from
contaminated soil by Brassica juncea as influenced
by chelating agents. Annals of Biology 29(1):15-18.
Smith, A.H., Lopipero, P.A., Bates, M.N. and
Steinmaus, C.M. (2002). Public health arsenic
epidemiology and drinking water standards. Science,
296:2145–2146.
Sumner, M. E. (2000). Beneficial use of effluents,
wastes, and biosolids, Communications in Soil Science and Plant Analysis, 31(11–14):1701–1715.
Tandy, S., Bossart, K., Mueller, R., Ritschel, J.,
Hauser, L., Schulin, R. and Nowack, B. (2004).
Extraction of heavy metals from soils using
biodegradable chelating agents. Environmental
Science and Technology, 38:937-944.
Trap, S., Kohler, A., Larsen, L. C., Zambrano, K.
C. and Karlson, U. (2005). Phytotoxicity of fresh
and weathered diesel and gasoline to willow and
poplar trees. Journal of Soils and Sediments, 1: 71-
76.
United States Environmental Protection Agency
(USEPA). (2000). Introduction to Phytoremediation.
EPA 600/R-99/107, U.S. Environmental Protection
Agency, Office of Research and Development,
Cincinnati, OH.
Vamerali, T., Bandiera, M., Coletto, L., Zanetti,
F., Dickinson, N.M. and Mosca, G. (2009).
Phytoremediation trials on metal and arsenic-
contaminated pyrite wastes (Torviscosa, Italy). Environmental Pollution, 157:887-894.
Wang, L. Q., Luo, L., Ma, Y. B., Wei, D. P. and
Hua, L. (2009). In situ immobilization remediation
of heavy metals-contaminated soils: a review.
Chinese Journal of Applied Ecology, 20(5):1214–
1222.
Wenger, K., Gupta, S.K., Furrer, G. and Schulin,
R. (2003). The role of nitrilotriacetate in copper
uptake by tobacco. Journal of Environmental
Quality, 32:1669-1676.
Wright, R.T. (2007). Environmental Science:
Toward a Sustainable Future. 9th Ed. Prentice Hall of India, New Delhi.
Wuana, R. A., Okieimen, F. E. and Ikyereve, R. E. (2008). Removal of lead and copper
fromcontaminated kaolin and bulk clay soils using
acids and chelating agents. Journal of Chemical
Societyof Nigeria, 33(1):213–219.
Yang, Q., Tu, S., Wang, G., Liao, X. and Yan, X. (2012). Effectiveness of Applying Arsenate
Reducing Bacteria to Enhance Arsenic Removal
From Polluted Soils by Pteris Vittata L. International
Journal of Phytoremediation, 14(1): 89-99. Yoon, J., Cao, X. and Zhou, O. (2006).
Accumulation of Pb, Cu and Zn in native plants
growing on a contaminated Florida site. Science
Total Environment, 368:456-464.

916 ANKUSH SHEORAN AND SUNITA SHEORAN

*Corresponding Author ________________________________________________ Journal of Plant Development Sciences Vol. 9 (10) : 917-923. 2017
THE SPECTRAL MODELLING OF ABOVE GROUND FOREST BIOMASS IN
JHAJRA FOREST RANGE OF DEHRADUN FOREST DIVISION USING
MICROWAVE DATA
Yogesh Kumar1*, Sarnam Singh
2 and R.S. Chatterjee
3
1Research Scholar, Forestry and Ecology Departmant, Indian Institute of Remote Sensing, Dehradun.
2Scientist G, Indian Institute of Remote Sensing (ISRO), Dehradun
3Scientist SG, Indian Institute of Remote Sensing (ISRO), Dehradun
Email: [email protected]
Received-07.10.2017, Revised-23.10.2017
Abstract: Forests play an important role in the global carbon cycle as a carbon sink. Deforestation and degradation of forests lead to carbon emissions, which should be prevented or minimized by protecting forests. Radar remote sensing has proven to be particularly useful tomonitor forests especially in the tropics due toweather and daytime independence. Radar data fromthe ALOS PALSAR-2 provide a potential opportunity to monitor large areas of tropical forests due to the high resolution.The study describes the development of logarithmic model for the estimation of forest above ground biomass and carbon using ALOS-PALSAR-2 synthetic aperture radar (SAR) data. The backscatter coefficient of the SAR data in different polarization were quantified using field data collected Jhajra forest range. A significant correlation has been
observed between HV backscatter and plot level biomass with a coefficient of determination (R2= 0.8918). The up-scaled biomass ranges from 5.2 tonnes/ha to 397.45 tonnes/ha. The total amount of carbon stored in the Jhajra forest range is 237471.99 tonnes. The carbon sequestration potential of the forest is 871522.20 tonnes.
Keywords: Biomass, Backscatter, Spectral Modelling, ALOS-PALSAR-2, Carbon Sequestration
INTRODUCTION
ccording to The Kyoto Protocol‘s Clean
Development Mechanism (CDM) and reducing
emissions from deforestation and forest degradation
(REDD), countries are allowed to offset a portion of
their greenhouse gas emissions through the carbon sequestration of forestation, so as to reduce
environmental pollution. On that way, the
government schemes and conservation strategies
adopted by India leads to an increase in forest cover.
An increasing forest cover is an important factor to
reduce the rise of atmospheric carbon dioxide
through carbon sequestration. The industrial
revolution and development strategies adopted by the
countries across globe has seriously degraded the
terrestrial ecosystem. It had reduced the actual
carbon stored in the ecosystem than their potential
carbon reserves (Houghton and Hackler, 2003; Lal, 2008). The amount of carbon stored by the forests,
peat swamps, grasslands and other terrestrial
ecosystem is more than it is stored by the atmosphere
(Lal, 2004). The forests stores the carbon in their
wood through the process of photosynthesis
contribute in the climate change mitigation.
Disturbing the forest ecosystems with deforestation,
forest fire, land use land cover change (LULC),
diseases leads to the release of the significant amount
of stored carbon in the atmosphere (Kareiva et al.,
2011). The traditional methods for above ground carbon
stock assessment were based on field inventory data.
The forest inventory data collected from statistically
based surveys and then estimate carbon stocks using
relationships between inventory variables and carbon
stocks augmented with models for pools that are not
sampled (Intergovernmental Panel on Climate
Change (IPCC, 1997). Forest inventory data are a
useful basis for estimating carbon stocks and net
fluxes for the sampled area. However, not all forest
carbon pools are represented well by attributes measured in forest inventories, and so there is a need
to augment survey data with data from intensive
research sites and models (Birdsey & Heath, 1995;
Smith & Heath, 2002, 2004; Heath et al., 2003;
Smith et al., 2003). Although the techniques were
more accurate and reliable but it took ample amount
of resources (Financial and Human resources) and
time (Brown, 2002; Coomes et al., 2002; Gibbs et al.,
2007; Machar et al., 2016). Therefore for larger and
inaccessible area these methods are unusable. The
traditional methods were taken by a new technique
i.e. ―Remote Sensing‖ which are free from the limitations of old techniques, but has its own
limitations. That is why in current scenario numerous
research has been carried out to incorporate remote
sensing technology for quick and reliable estimation
of carbon stock (Goodenough et al., 2005; Mandal
and van Laake, 2005; Vicharnakorn et al., 2014).
Space borne Synthetic Aperture Radar (SAR) remote
sensing systems are active sensors with the
advantage of all weather and daylight independency.
The retrieval of forest parameters depends upon the
wavelength of the sensor, the longer the wavelength the deeper the penetration (Le Toan et al., 2001;
Henderson & Lewis, 1998). The backscatter from the
forest depends upon the sensor parameters like
polarization, incidence angle along with structural
A
RESEARCH ARTICLE

918 YOGESH KUMAR, SARNAM SINGH AND R.S. CHATTERJEE
properties like roughness and dielectric constant
(Imhoff, 1995a; Lu, 2006). A significant relationship
has been established between the backscattering
coefficients and the above ground biomass within
particular types of forest (Baker et., 1994; Le Toan et
al., 1992; Dobson et el.,1992; Imhoff, 1995b). It has already been proved that Longer wavelengths are
more useful because of an increasing backscatter
range with changing biomass (Castro et al., 2003;
Dobson et al., 1992; Lu, 2006; Luckman et al.,
1997). The estimation of AGB are valid up to certain
threshold which depends on the wavelength and the
models used for the estimation. For L-band
backscatter published saturation levels range from 40
t/ha (Luckman et al., 1997; Imhoff, 1995) to 150 t/ha
(Kuplich et al., 2005; Lucas et al., 2007; Mitchard et
al., 2009). Austin et al. (2003) stated that the L band
saturation level is possibly up to 600 t/ha.
Study Area
The study was conducted in the Jhajra range which is
located in the south western part of Dehradun forest
division. The study area lying between latitudes 30°
33‘ N to 30° 43‘ N and longitude 77° 83‘ E to 78°
03‘ E. The annual temperature in the region ranges
from 1.8° C in January to 40° C in June. The area
received an average annual rainfall of 2025.43 mm.
The region receives most of its annual rainfall during
June to September, the maximum rainfall occur in
July and August. In Jhajra forest range comes under
subtropical dry deciduous forests whereShorea
robusta (sal),Terminalia alata are the dominant
overstory species. The middle storey are represented
by Mallotus philippensis, Syzygium
cumuniin, Ehertia laevis tree species. Clerodendron viscosum and Lantana camara are present in the
lowermost tree canopy, and the understory shrub and
herb. Some abundantly found species from this site
were Murraya koinigii L. Spreng., Parthenium
hysterophorus L., Xanthium indicum Koenig.,
Jasminum nudiflorum Lindl., Colebrookea
oppositifolia Smith., Alternanthera sessilis (L.) R.
DC., Phlogacanthus thyrsiflorus (Roxb.) Nees.,
Pogostemon benghalense (Burm. f.) Kuntze.,
Ziziphus mauritiana Lam., Androsace umbellata
(Lour.) Merrill, Anisomeles indica (L.) Kuntze,
Asparagus racemosus Willd.
MATERIAL AND METHOD
Satellite Data
ALOS PALSAR -2 High-Sensitive mode full (Quad)
Polarimetry (HBQ) scene was obtained from Japan
Aerospace Exploration Agency (JAXA). The image
was acquired with an off-nadir angle of 33.2° and
covered an area of 70×70 km2. The image was
acquired in the month of March, 2016. The
description of the data are given below:
Satellite Polarization Frequency
Band
Range
Resolution (m)
Azimuth
Resolution (m)
Incidence
Angle
ALOS
PALSAR-2
Quad
(HH+HV+VH+VV) L 5.1 4.3 33.2°
Figure 1. The location of in-situ field observation.

JOURNAL OF PLANT DEVELOPMENT SCIENCES VOL. 9 (10) 919
Field Inventory Data
A total of 44 sample plots were laid down randomly
in the entire study area. The vegetation was analysed
by the means of random sampling to give most
representative composition of vegetation. A point
one hectare (0.1ha) plots were laid out in the area. The girth at breast height (1.37m) were measured
using measuring tape and height were measured
using hypsometer. The location of the plot were
recorded by using geographic positioning system
(GPS). The locations were shown in the figure 1.
Estimating tree Volume and plant Biomass from
field inventory data
The allometric equations developed by Forest Survey
of India (FSI, 1996) were used for assessment of tree
volume. The girth at breast height were converted
into dbh, and basal area was calculated. The volume
equations for a species were carefully chosen considering the ‗n‘ (total number of sample tree on
which regression equation are based) and ‗R2‘
(Coefficient of determination) for the nearest
geographic region. The volume was multiplied with
wood specific gravity (Forest Research Institute,
1996) and Biomass expansion factor (BEF) to
estimate the biomass (Biomass = Volume × Specific
Gravity× BEF). The plot level biomass was further
scaled to pixel level biomass (per pixel biomass) as
well as tones/ha biomass.
ALOS PALSAR data Processing The data was processed in SNAP software. It was
calibrated to provide imagery in which pixel value
can be directly related to radar backscatter of the
scene. Typical SAR data processing, which produces
level 1 images, does not include radiometric
corrections and significant radiometric bias remains.
Therefore, it is necessary to apply the radiometric
correction to SAR images so that the pixel values of
the SAR images truly represent the radar backscatter
of the reflecting surface. The image was studded with
speckle which is due to coherent interference of the
wave. Multi-looking was performed to reduce the speckle and improves interpretability. The image was
further applied with speckle filtering (Refined Lee).
Due to topographical variations of a scene and the tilt
of the satellite sensor, distances can be distorted in
the SAR images. Image data not directly at the
sensor‘s Nadir location will have some distortion.
Terrain corrections are intended to compensate for
these distortions so that the geometric representation
of the image will be as close as possible to the real
world. The backscatter intensity image was
converted into decibel (Sigma naught, σ°).
Spectral Modelling and Estimation of Carbon
Sequestration
The spectral information were exported with the help
of plot location. The relationship has been established between plot level biomass and
backscatter coefficient of different polarization. The
significant relation was used for the upscaling of
phytomass from pixel to regional level. The biomass
map gives the total amount of forest above ground
biomass. The carbon stock has been calculated by
multiplying the biomass with a factor of 0.47. The
carbon sequestration by forests was calculated by
multiplying the total amount of carbon by 0.36
(Belop, S.V., 1976,1980).
RESULT AND DISCUSSION
The result of this study can be seen in three ways i.e.
the field data statistics, the derivatives of SAR
imagery and the graphical representation of
relationship between backscatter coefficient and
biomass.The plot level forest inventory reveals that
the top height of the plot varies from 12 m to 41 m.
The number of trees varies from 12 in few plots to 53
in some plots. The biomass per plot varies from 8.2
tonnes/ha to 452.51 tonnes/ha. The processing of
SAR image results in the generation of image having different polarization. The plot level biomass were
plotted against the backscatter coefficient. It was
concluded according to figure (2b) that the HV
backscatter gave the highest correlation with a
coefficient of determination (R2) of 0.8918. It was
followed by VV polarisation (R2= 0.869) and HH (R2
= 0.855). The correlation analysis indicates that the
AGB has a logarithmic relationship with the
variables. Based on the correlation analysis, the
backscatter of HV polarisation was selected as the
AGB predictionmodel as it gave the best R2compared
to the other variables.The cross polarized (HV) L-band backscatter appears to respond slightly more to
differences in vegetation than the co-polarized (HH
& VV) polarization. These observations support
other studies of the SAR remote sensing of forests
(Baker et al., 1994; Le Toan et al., 1992; Dobson et
al., 1992) and are in agreement with predictions
made by models of radar backscatter from forest
targets (Richards, 1990).

920 YOGESH KUMAR, SARNAM SINGH AND R.S. CHATTERJEE
1a 1b
2a
2b
3a
3b
Figure 2: The SAR processed images are represented as 1a (HH Pol.), 2a (HV pol.) and 3a (VV pol.) and the
respective backscatter relations are represented in 1b, 2b and 3b.
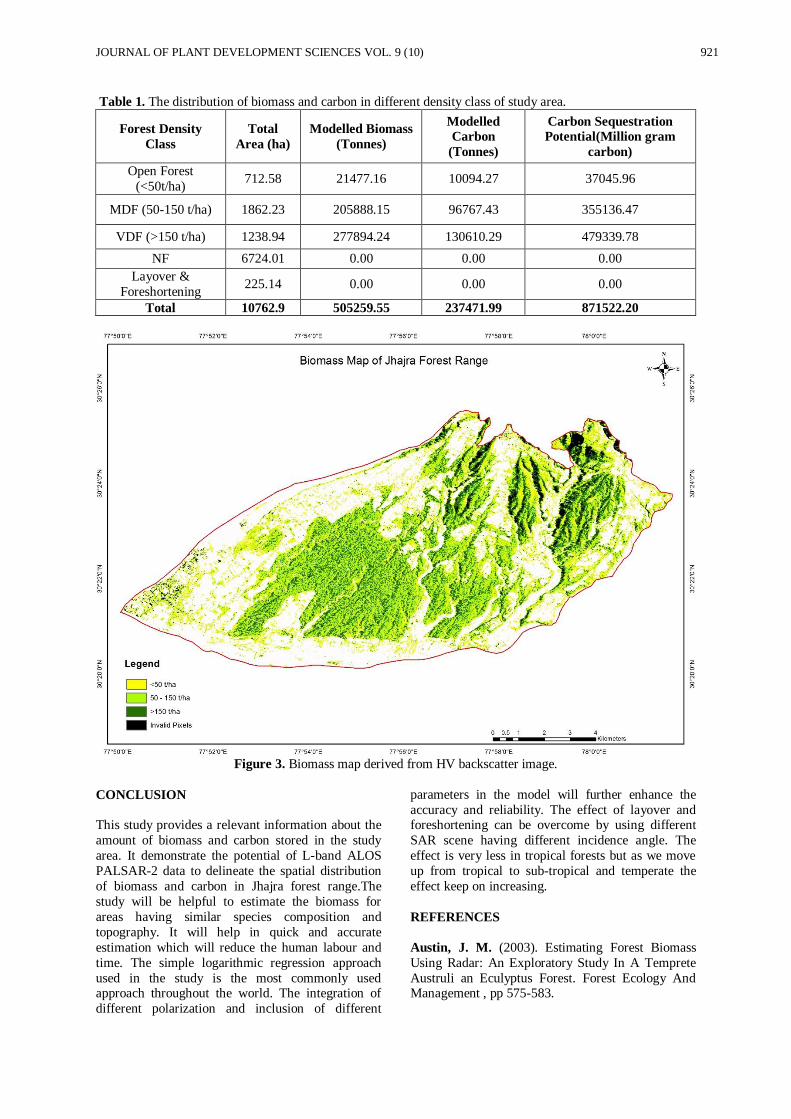
The modelled biomass ranges from 5.2 tonnes/ha to
397.45 tonnes/ha. It shows great relevance with the
in-situ data. The underestimation of biomass through
modelling is due to the saturation of biomass at
higher level. It was observed that the study area is dominated with biomass greater than 150 tonnes/ha.
The table 1 describes the distribution of modelled
biomass and carbon in the study area. A total of 5,
05,259.55 tonnes of biomass is stored in the study
area along with 2, 37,471.99 tonnes of carbon. The
carbon sequestration potential of the study area is 8,
71,522.20 million gram carbon. There is no
information for 225.14 ha of the area because of the
effect of layover and foreshortening. This effect has been eliminated from the scene because it results in
overestimation of biomass because of very high
backscatter.
y = 5.032ln(x) - 35.88R² = 0.855-30
-25-20-15-10
-50
0 100 200 300 400 500Bac
ksca
tter
σ°
(dB
)
Biomass tonnes/ha
Backscatter_HH
y = 5.115ln(x) - 32.18R² = 0.891
-25
-20
-15
-10
-5
0
0 100 200 300 400 500
Bac
ksca
tter
σ°
(dB
)
Biomass tonnes/ha
Backscatter_HV
y = 4.922ln(x) - 33.40R² = 0.869
-30
-20
-10
0
0 100 200 300 400 500
Bac
ksca
tter
σ°
(dB
)
Biomass tonnes/ha
Backscatter_VV
JOURNAL OF PLANT DEVELOPMENT SCIENCES VOL. 9 (10) 921
Table 1. The distribution of biomass and carbon in different density class of study area.
Forest Density
Class
Total
Area (ha)
Modelled Biomass
(Tonnes)
Modelled
Carbon
(Tonnes)
Carbon Sequestration
Potential(Million gram
carbon)
Open Forest
(<50t/ha) 712.58 21477.16 10094.27 37045.96
MDF (50-150 t/ha) 1862.23 205888.15 96767.43 355136.47
VDF (>150 t/ha) 1238.94 277894.24 130610.29 479339.78
NF 6724.01 0.00 0.00 0.00
Layover &
Foreshortening 225.14 0.00 0.00 0.00
Total 10762.9 505259.55 237471.99 871522.20
Figure 3. Biomass map derived from HV backscatter image.
CONCLUSION
This study provides a relevant information about the
amount of biomass and carbon stored in the study
area. It demonstrate the potential of L-band ALOS
PALSAR-2 data to delineate the spatial distribution
of biomass and carbon in Jhajra forest range.The
study will be helpful to estimate the biomass for
areas having similar species composition and
topography. It will help in quick and accurate
estimation which will reduce the human labour and
time. The simple logarithmic regression approach
used in the study is the most commonly used approach throughout the world. The integration of
different polarization and inclusion of different
parameters in the model will further enhance the
accuracy and reliability. The effect of layover and foreshortening can be overcome by using different
SAR scene having different incidence angle. The
effect is very less in tropical forests but as we move
up from tropical to sub-tropical and temperate the
effect keep on increasing.
REFERENCES
Austin, J. M. (2003). Estimating Forest Biomass
Using Radar: An Exploratory Study In A Temprete
Austruli an Eculyptus Forest. Forest Ecology And Management , pp 575-583.

922 YOGESH KUMAR, SARNAM SINGH AND R.S. CHATTERJEE
Baker, J. R., Mitchell, P. L., Cordey, R. A.,
Groom, G. B., Settle, J. J. and Stileman, M. R. (1994). Relationships between physical
characteristics and polarimetric radar backseatter for
corsican pine stands in Thetford Forest, UK. Int. ].
Remote Sens. 15(14):2827-2849. Birdsey, R.A. and Heath, L.S. (1995). Carbon
changes in U.S. forests. In: Joyce, L.A. (Ed.),
Productivity of America‘s Forests and Climate
Change. USDA ForestService, Rocky Mountain
Forest and Range Experiment Station, GTR-RM-
271, Fort Collins, CO., pp. 56–70.
Brown, S. (2002). Measuring carbon in forests:
current status and future challenges. Environ. Pollut.
116 (3), 363–372. http://dx.doi.org/10.1016/S0269-
7491(01) 00212-3.
Castro, K., Sanchez-Azofeifa, G. and Rivard, B. (2003). Monitoring secondary tropical forests using space-borne data: Implications for Central America.
International Journal of Remote Sensing, 24,
1853−1894.
Coomes, D.A., Allen, R.B., Scott, N.A., Goulding,
C. and Beets, P. (2002). Designing systems to
monitor carbon stocks in forests and shrublands. For.
Ecol. Manag. 164 (1–3), 89–108.
http://dx.doi.org/10.1016/S0378-1127(01)00592-8.
Dobson, M. C., Ulaby, F. T., Le Toan, T.,
Beaudoin, A., Kasischke, E. S. and Christensen,
N. (1992). Dependence of radar backscatter on coniferous forest biomass. IEEE Transactions on
Geoscience and Remote Sensing, 30(2), 412–415.
Dobson, M. C., Ulaby, F. T., Le Toan, T.,
Kasische, E.S. and Christensen, N. (1992).
Dependence of radar backscatter on coniferous forest
biomass. IEEE Trans. Geosci. RemoteSens.
30(2):412-415.
FSI (1996). Volume Equations for Forests of India,
Nepal, and Bhutan. Forest Survey of India, Ministry
of Environment & Forests, Government of India.
Gibbs, H.K., Brown, S., Niles, J.O. and Foley, J.A. (2007). Monitoring and estimating tropical forest carbon stocks: making REDD a reality. Environ. Res.
Lett. 2 (4), 045023. http://dx.doi.org/10.1088/1748-
9326/2/4/045023.
Goodenough, D.G., Chen, H., Dyk, A. and Li, J. (2005). Multisensor data fusion for aboveground
carbon estimation. Avalaible from.
https://www.researchgate.net/
publication/228338816.
Heath, L.S., Smith, J.E. and Birdsey, R.A. (2003).
Carbon trends in U.S. forest lands: a context for the
role of soils in forest carbon sequestration. In: Kimble, J.M., Heath, L.S., Birdsey, R.A., Lal, R.
(Eds.), The Potential of U.S. Forest Soils to
Sequester Carbon and Mitigate the Greenhouse
Effect. CRC Press, New York, pp. 35–46.
Henderson, F. M. and Lewis, A. J. (1998).
Principles and applications of imaging radar —
Manual of remote sensing John Wliey & Sons, New
York (Chapter 9)
Houghton, R.A. and Hackler, J.L. (2003). Sources
and sinks of carbon from land-use change in China.
Glob. Biogeochem. Cycle, 17 (2003) 3–1.
Imhoff, M. (1995b). Radar backscatter and biomass
saturation – ramifications for global biomass
inventory. IEEE Transactions on Geoscience and Remote Sensing, 32(2), 511-518.
Imhoff, M. L. (1995a). A theoretical analysis of the
effect of forest structure on synthetic aperture radar
backscatter and the remote sensing of biomass. IEEE
Transactions on Geoscience and Remote Sensing, 33,
341–352.
IPCC, OECD and IEA (1997). Revised 1996 IPCC
Guidelines for National Greenhouse Gas Inventories,
vol. 1–3. IPCC WGI Technical Support Unit, Paris.
Kareiva, P., Tallis, H., Ricketts, T.H., Daily, G.C.
and Polasky, S. (2011). Natural Capital. Theory and
Practice of Mapping Ecosystem Services. University Press, Oxford. http://
dx.doi.org/10.1093/acprof:oso/9780199588992.001.0
001.
Kuplich, T. M., Curran, P. J. and Atkinson, P. M. (2005). Relating SAR image texture to the biomass
of regenerating tropical forests. International Journal
of Remote Sensing, 26, 4829−4854.
Lal, R. (2004). Soil carbon sequestration impacts on
global climate change and food security. Science 304
(5677), 1623–1627.
http://dx.doi.org/10.1126/science.1097396. Lal, R. (2008). Carbon sequestration. Philos. Trans.
R. Soc. Lond. B. Biol. Sci., 363 (2008), pp. 815-830.
Le Toan, T., Beaudoin, A., Riom, J. and Guyon,
D. (1992). Relating forest biomass to SAR data.
IEEE Transactions on Geoscience and Remote
Sensing, 30(2), 403-411.
Le Toan, T., Picard, G., Martinez, J. M., Melon,
P. and Davidson, M. (2001). On the relationship
between radar measurements and forest structure and
biomass. 3rd International Symposium ―Retrieval of
Bio- and Geophysical Parameters from SAR Data for
Land Applications‖, Sheffield, UK. Lu, D. (2006). The potential and challenge of remote
sensing-based biomass estimation. International
Journal of Remote Sensing, 27, 1297–1328.
Lucas, R., Mitchell, A. L., Rosenqvist, A., Proisy,
C., Melius, A. and Ticehurst, C. (2007). The
potential of Lband SAR for quantifying mangrove
characteristics and change: Case studies from the
tropics. Aquatic Conservation: Marine and
Freshwater Ecosystems, 17(3), 245–264.
Luckman, A., Baker, J., Kuplich, T., Yanasse, C.
and Frery, A. (1997). A study of relationship between radar backscatter and regenerating tropical
forest biomass for space-borne SAR instruments.
Remote Sensing of Environment, 60 (1), 1-13.
Machar, I., Simon, J., Rejšek, K., Pechanec, V.,
Brus, J. and Kilianová, H. (2016). Assessment of
forest management in protected areas based on
multidisciplinary research. Forests 7 (11).
http://dx.doi.org/10.3390/f7110285.

JOURNAL OF PLANT DEVELOPMENT SCIENCES VOL. 9 (10) 923
Mandal, R.A. and Van Laake, P. (2005). Carbon
sequestration in community forests: an eligible issue
for CDM (a case study of Nainital, India). Banko
Janakari 15 (2), 53–61. http://
dx.doi.org/10.3126/banko.v15i2.353.
Mitchard, E. T. A., Saatchi, S. S., Woodhouse, I.
H., Nangendo, G., Ribeiro, N. S., Williams, M. et
al. (2009). Using satellite radar backscatter to predict
above-ground woody biomass: A consistent
relationship across four different African landscapes.
Geophysical Research Letters, 36(23), 1–6.
Riehards, J.A. (1990). Radar backscatter modelling
of forests: a review of current trends. Int. J. Remote
Sens. 11(7): Sens. 30(2):403-411.
Smith, J.E., Heath, L.S. and Jenkins, J.C. (2003).
Forest Volume-to-Biomass Models and Estimates of
Mass for Live and Standing Dead Trees of U.S.
Forests.USDA Forest Service, Northeastern Research
Station, NE-GTR-298, Newtown Square, PA.
Smith, J.E. and Heath, L.S. (2004). Carbon stocks and projections on publicforestlands in the United
States, 1952–2040. Environ. Manage. 33, 433–442.
Vicharnakorn, P., Shrestha, R.P., Nagai, M.,
Salam, A.P. and Kiratiprayoon, S. (2014). Carbon
stock assessment using remote sensing and forest
inventory data in Savannakhet, Lao PDR. Remote
Sens. 6, 5452–5479.
http://dx.doi.org/10.3390/rs6065452.

924 YOGESH KUMAR, SARNAM SINGH AND R.S. CHATTERJEE

*Corresponding Author
________________________________________________ Journal of Plant Development Sciences Vol. 9 (10) : 925-931. 2017
ISOLATION AND CHARACTERIZATION OF VARIOUS FUNGAL STRAINS AS
PRIMARY COLONISER FROM WHEAT STRAW AT VARYING NITROGEN
CONCENTRATIONS
Shahnaaz Khatoon1* S.C. Jain
1 and M.U. Charaya
2
1Department of Botany, D. N. (P.G.) College Meerut, Uttar Pradesh 250005
1Microbiology Laboratory,
Department of Botany, Chaudhary Charan Singh University Meerut Uttar
Pradesh 250005
Email: [email protected]
Received-08.10.2017, Revised-25.10.2017
Abstract: The present study was undertaken with an aim to search for the fungal strains, which have the potential to efficiently decompose wheat straw with high C:N ratios. Identification and characterization of these microbial species is important to study their decomposition potential for use in soil fertility management. A total 19 strains of fungal primary
colonizers were isolated from a sample of wheat straw. Out of these, one belonged to Zygomycota while the remaining 18 belonged to Deuteromycota. Alternaria, Aspergillus, Cladosporium, Helminthosporium, Stachybotrys, Fusarium and Penicillium were the most frequently isolated genera at low nitrogen concentration. Isolated strains at low nitrogen concentration seem to be the most probable candidates, as initial primary bio inoculants, for hastening the decomposition of wheat straw. The results of this study suggest the possibility of utilizing fungal inoculants as an integrated component of microbe-based strategies for biotechnological management of wheat straw. Keywords: Wheat Straw, Microorganisms, Isolation, Decomposition, Serial dilution, Fertilizers
INTRODUCTION
heat is grown basically for the grains. But the
utility of the remaining parts of the wheat
plant cannot be ignored. A lot of wheat straw is
produced in wheat-growing belts in the world. A
significant proportion of wheat straw has been in use
as feed for ruminants because of its abundance and
low cost (Viola et al. 2008; Balset al., 2010;
Manriquez et al. 2016). However, it is also used for
the production of pulp and paper (Zhao et al. 2004), strawboards (Deswarteet al., 2007), textiles and
composites (Avella et al., 1995; Reddy et al. 2007),
plastics (Avella et al., 1995) and for the removal of
metals in wastewater industry (Kumar et al., 2000;
Doan et al., 2008) and hybrid composite materials
(Yu et al. 2016).
Incidentally, a major portion of straw is burnt in the
field itself (Gupta et al., 2004). This results, on one
hand, in a waste of organic sources in soil affecting
C:N ratio and biota; and on other hand, leads to
global warming and environmental problems (Badrinath et al. 2006; Sastre et al. 2015). Keeping
in mind the harmful effects of burning straw in the
field as well as the convenience of the farmer,
economical, environment–friendly and low labour
strategies should be adopted for effective utilization
of the straw.
Primary colonizers are the microorganisms which
play an important role in the initiation of
decomposition. These organisms span parasitic as
well as saprophytic phases. They possess cellulolytic
(Sajith et al. 2015) and pectolytic activity at low
nitrogen level, and are able to grow at faster rate on a comparatively drier resource (Charaya et al. 2005,
2006), (Chauhan et al., 2006) and (Rani, 2008) also
found that majority of the primary colonizers of plant
litter possessed weak parasitic tendency.
Organic matter plays a unique role in soil fertility
(Zhao et al. 2016). It acts as a sink as well as a source
for nutrient. It prevents environmental pollution and
the loss of nutrients. Above all, it helps in
maintaining nutrients balance in the soil which is the
basic attribute for sustainability (Raman, 2005). In a
natural ecosystem, entire biomass of the plants is
returned to the soil after the death of the plants through the process of decomposition. However, in
agro-ecosystems, a significant proportion of the
biomass is removed from the soil. Hence, intensive
cultivation of crop requires massive application of
synthetic fertilizers to compensate for the loss of
nutrients from the soil as a result of their removal by
the agricultural crops.
However, the prohibitive cost of chemical fertilizers
as also numerous environmental problems associated
with their production and use have prompted
agricultural scientists to look for better alternatives. It is being gradually realized that organic wastes and
biological sources of nutrients are better alternatives
and these may serve as substitutes for inorganic
fertilizers to a considerable extent, if not absolutely
(Shukla and Mathur, 2000). Wheat straw provides
one such alternative. The application of biodegraded
products of straw into soil has enormous potential to
recycle nutrients and maintain soil fertility (Gaind et
al., 2006; Zhang et al. 2015, Rahman et al. 2016).
Straw contains approximately 0.5% nitrogen and
40% carbon. Straw, when subjected to colonization
by fungi, has only 0.5 units of nitrogen to offer to the fungi which generally require 1.2 to 1.6 units for
W
RESEARCH ARTICLE

926 SHAHNAAZ KHATOON S.C. JAIN AND M.U. CHARAYA
growth; thus, a deficit of 0.7 to 1.1 units of nitrogen
appears in the environment (Alexander, 1977). Many
workers including Park (1976) pointed out that the
fungi which show high degree of cellulolytic ability
under laboratory conditions fail to colonize and
degrade the plant residues in a correspondingly effective manner.
Hence, it is important to take into account the
nitrogen level of resources to be degraded in the
selection of effective decomposers. Since wheat
straw has low nitrogen content, it should be
preferable to use those organisms for the purpose of
decomposition which can grow, reproduce and carry
out polysachharolytic activity at low nitrogen levels.
In other words, those microorganisms which can
operate the process of decomposition with lesser
units of nitrogen would be more suitable as primary
colonizers or primary bioinoculants. However, van Fassen and van Dijk (1979) have
demonstrated that hot composting of straw leads to
considerable losses of nitrogen in the form of
ammonia also, and therefore only relatively small
gains in nitrogen appear to take place during
decomposition. If it is so, the secondary colonizers
also have to face the deficiency of nitrogen. The
addition of nitrogen to crop residues has been
reported to enhance the rate of decomposition of crop
residues but only when a large amount of residues
with low nitrogen was decomposing. Additional supply of nitrogen is believed to enhance the growth
of decomposers (Fan et al., 1981; Yadav, 1987; Mary
et al. 1996; Hu et al. 2015; Wang et al. 2015 and
Maaroufi et al. 2017).
Primary colonizers are the microorganisms which
play an important role in the commencement of
decomposition of crop residues. Identification and
characterization of these microbial species is
important for studying their decomposition potential
vis a vis soil fertility management. In the present
study an attempt has been made towards isolation
and characterization of fungal strains which can survive and flourish at low nitrogen concentrations or
higher C/ N ratios.
MATERIAL AND METHOD
Isolation of Fungi
Freshly harvested wheat straw was collected from
agricultural fields situated at village Khardoni,
Meerut. The samples were collected aseptically in
fresh polythene bags and brought to the laboratory
for further studies. Serial dilution plate method (Waksman, 1927) was used to isolate the fungi from
wheat straw sample. 1 g of the sample was placed in
250 ml of sterile water and stirred for fifteen minutes
using a magnetic stirrer to get the stock solution. 10
ml of this solution were immediately transferred to a
conical flask containing 90 ml of sterile distilled
water to get a suspension of 1:10 dilution. This
suspension was used for the preparation of further
serial dilutions (1:100, 1:1000). From the suspension
of each dilution (1:10, 1:100, 1:1,000), 1 ml aliquots
were transferred to each of a set of three Petri dishes
followed by the addition of approximately 20 ml of
cooled (45°C) and sterilized culture medium.
Czapek'sDox Agar medium (Raper and Thom, 1949) with 30 ppm of rose bengal and 30 mg of
streptomycin was used for this purpose. This medium
served as control and was designated as N. The
media with 2/3 (two third), 1/2 (half) and 1/3 (one
third) concentrations (i.e. 1.5 g/1, 1.0 g/1 and 0.67
g/1 respectively) of nitrogen (sodium nitrate) as
compared to control (2.0 g/1) were also prepared.
The media with 2/3, 1/2 and 1/3 concentrations of
nitrogen were designated as N/1.5, N/2 and N/3
respectively.
Records of the Fungi Isolated
Isolation and identification of the fungi was done in the microbiology laboratory of the Department of
Botany, CCS University, Meerut, India. The Petri
dishes were observed from the third day itself when
fast-growing fungi started appearing in the Petri
dishes. The slow-growing fungi were transferred
onto other Petri dishes just after their appearance to
prevent them from being overrun by the fast growing
fungi. A complete record of the fungal species and
their numbers in cfus (cfus: colony forming units) in
the Petri dishes was maintained. The identification of
the fungal species was done on the basis of their morphology and cultural characteristics following
Gilman (1957), Barnett and Hunter (1972),
Subramanian (1971), Ellis (1971, 1976), Domsch and
Gams (1972), Domsch et al. (1980), Nagmani et al.
(2006), Venkateswarlu et al (2015), Singh et al.
(2015).
Purification and Maintenance of Cultures
The fungal strains were purified by hyphal cut
method and streak plate method. The pure cultures
were maintained on PDA medium (Riker and Riker,
1936) on slants and were stored in a refrigerator.
RESULT AND DISCUSSION
The current practice of using media having low C:N
ratio for the isolation of microflora colonizing the
resources with much higher C:N level in most
biological laboratories is not appropriate as it might
not present a true picture of the colonizer
microorganisms. There are greater chances that the
microbes present on the resource would be favored
by the medium having higher nitrogen levels, thus
distorting the picture completely by tilting the balance against the active microorganisms not
capable of growing fast enough on the medium with
high nitrogen and in favor of those microbes which
are not actually active on the litter but grow better on
the medium employed. Therefore, it would be
worthwhile to use media with the C:N ratio
comparable to that in the resource under study. The
dominance of Deuteromycota observed in the present

JOURNAL OF PLANT DEVELOPMENT SCIENCES VOL. 9 (10) 927
study is in full agreement with the earlier reports
(Hudson, 1968; Dickinson and Pugh, 1974; Hayes
and Lim, 1979; Charaya, 2006; Tiwari and Charaya,
2006; Sen and Charaya, 2010), Guleri et al. (2016).
Only 1 members belonging to the order Mucorales
were isolated in the present study thus supporting the findings of Galloway (1935), Singh and Charaya
(1975), Dube et al. (1980), Singh (2004), Charaya
(2006) and Tiwari (2010) which indicated the paucity
of Mucorales in the tropical regions of India.
A total of 19 strains of fungal primary colonizers
were isolated from the wheat straw through serial
dilution plate method using media containing
different levels of nitrogen. 19 fungal strains were
isolated as: Aspergillus flavus, A. fumigatus , A.
luchuensis, A. oryzae, A. niger, A. sydowi, A. ustus,
A. wenti, Alternaria alternata, Alternaria citri,
Alternaria longipus, Alternaria palandui, Chaetomiumflavum, Dreschleraavenacae,
Cladosporium herbarum, Fusarium sp.,
Helminthosporium microsorum, Penicillium
frequentans, P. funiculosum, P. implicatum, P.
paxilli, P. spinulosum, Rhizopus sp., and
Stachybotrys atra. Out of these, only one belonged to
Zygomycota while the remaining 18 belonged to
Deuteromycota.
Among the Deuteromycota, the Hyphomycetes
constituted the major component. 13 species
belonging to Moniliaceae and 5 species belonging to Dematiaceae were obtained. Among the Moniliaceae,
6 species belonged to the genus Aspergillus while
only 5 belonged to the genus Penicillium. It is widely
believed that Aspergilli are more common in warmer
regions of the world while the Penicillia are more
abundant in the colder regions
Three species were isolated and identified as
Alternaria alternata, Aspergillus niger and
Stachybotrys atra at all concentration of media used in this study. Among these isolated fungal strains, A.
alternate was obtained exclusively. 12 Isolates of
this fungal sp. with 66.66 frequencies were obtained
at N media while at N/1.5, N/2 and N/3 media total
8, 10 and 10 isolates were obtained with 33.33, 55.55
and 44.44 frequency respectively.
Total 33 fungal isolates belonging to 11 species were
identified as A. alternate (12), A. longipes (1), A.
luchuensis (2), A. niger (1), A. ustus (2), Fusarium
sp. (2), C. herbarum (3) and P. funiculosum (1), P.
paxilli (1) Rhizopus sp (3) Stachybotrys atra (5). A.
Citri, A. palandui, A. flavus, A. fumigates, A. oryzae, H. microsorum and P. frequentans were note
obtained at media N. Total 26 fungal isolates
belonging to 6 species were obtained from N/1.5
media and identified as A. alternate (8), A.Citri (1),
A. niger (5), A. oryzae (7), P. spinulasum (1) and
Stachybotrys atra (4). A. longipes, A. palandui,
Aspergillus flavus, A. fumigates, A. luchuensis, A.
ustus, Cladosporium herbarum, Fusarium sp. H.
microsorum, Penicillium frequentans, P.
funiculosum, P. implicatum, P. paxilli and Rhizopus
species were absent at N/1.5 media. Results of this study have been summarized in table 1 and
represented by figure 1.
Table 1. A comparison of the Total Isolate (TI) and Frequency (F), Frequency Class (FC) of fungal species
isolated using media of different nitrogen levels (N, N/1.5, N/2, N/3) from wheat straw.
Fungal Species N N/1.5 N/2
N/3
TI F FC TI F FC TI F FC TI F FC
Alternaria alternata 12 66.66 VI 8 33.33 II 10 55.55 III 10 44.44 III
A. citri − − − 1 11.11 I − − − 1 11.11 I
A. longipes 1 11.11 I − − − − − − 4 22.22 II
A. palandui − − − − − − 1 11.11 I 1 11.11 I
Aspergillus flavus − − − − − − 5 22.22 II 1 11.11 I
A. fumigates − − − − − − 5 22.22 II − − −
A. luchuensis 2 11.11 I − − − − − − − − −
A. Niger 1 11.11 I 5 33.33 II 3 33.33 II 1 11.11 I
A. oryzae − − − 7 11.11 I − − − − − −
A. ustus 2 22.22 II − − 3 22.22 II − − −
Cladosporium herbarum 3 22.22 II − − − 3 22.22 II − − −
Fusarium sp. 2 22.22 II − − − − − − 1 11.11 I
Helminth. microsorum − − − − − − 1 11.11 I 1 11.11 I
Penicillium frequentans − − − − − − − − − 1 11.11 I
P. funiculosum 1 22.22 II − − − − − − − − −
P. implicatum − − − − − − − − − 1 11.11 I
P. paxilli 1 11.11 I − − − − − − − − −

928 SHAHNAAZ KHATOON S.C. JAIN AND M.U. CHARAYA
P. spinulosum − − − 1 11.11 I − − − − − −
Rhizopus sp. 3 22.22 II − − − 1 11.11 I − − −
Stachybotrys atra 5 33.33 II 4 33.33 II 3 22.22 II 1 11.11 I
Total Isolates
33 26 35 23
Total Species
11 6 8 11
Fig 1: A comparison of the Total Isolate at different nitrogen levels

JOURNAL OF PLANT DEVELOPMENT SCIENCES VOL. 9 (10) 929
Total 35 isolates at N/2 media belonging to 8 fungal
species were identified as A. alternate (10), A.
palandui (1), A. flavus (5), A. fumigates (5), A. niger
(3), A. ustus (3), C. herbarum (3) and H. microsorum
(1). A. citri, A. longipes, A. luchuensis, A. oryzae,
Fusarium sp. P. frequentans, P. funiculosum, P. paxilli and P. spinulosum were not obtained at this
nitrogen concentration.
Total 23 fungal isolates belonging to 11 species were
obtained at N/3 media and identified as A. alternata
(10), A. citri (1), A. longipes (4), A. palandui (1),
Aspergillus flavus (1), A. niger (1), Fusarium sp. (1),
H. microsurum (1), Penicillium frequentans (1), P.
implicatum (1) and Stachybotrys atra (1). A.
fumigates, A. luchuensis, A. oryzae, A. ustus, C.
herbarum, P. funiculosum, P. paxilli, P. spinulosum
and Rhizopus sp. were not btained at N/3 media. It
was apparent from the results that Alternaria alternata was abundant at all nitrogen concentrations
used in this study (table 1 and and fig. 1).
CONCLUSION
The present study describes isolation and
identification of fungal colonizers growing actively
at low nitrogen concentrations, having potential
decomposing activity and their enzyme make-up.
Attempt has also been made to identify the fungal
strains which respond favourably to supplementation of the resource with additional nitrogen. The results
suggest the possibility of utilizing fungal inoculants
as an integrated component of microbe based
strategies for biotechnological management of
agricultural wastes. Czapek's media with different
concentrations of nitrogen were prepared to the study
the effect of different nitrogen levels on radial
growth of selected fungal species Eighteen fungal
species viz. Alternaria alternata, A. citri, A. longipes,
A. palandui, Aspergillus flavus, A. fumigatus, A.
luchuensis, A. niger, A. oryzae, A. ustus,
Cladosporium herbarum, Fusarium sp., Helminthosporium microsorum, Penicillium
frequentans, P. funiculosum, P. implicatum, P.
paxilli, P. spinulosum and Stachybotrys atra were
taken for studying effect of nitrogen and results of
this study would be communicated in a subsequent
paper.
ACKNOWLEDGEMENT
Shahnaaz Khatoon expresses her gratitude to Ph.D
supervisors, Dr. M.U. Charaya and Dr. S.C. Jain, who have been a constant source of guidance and
motivation throughout the course of this study.
REFERENCES
Alexander, M. (1977). Introduction to Soil
Microbiology. 2nd Ed. John Wiley and Sons,
Reprinted by Wiley Eastern Limited, New Delhi,
Banglore, Bombay, Callcutta.
Avella, M., Bozzi, C., dell’Erba, R., Focher, B.,
Marzetti, A. and Martuscelli, E. (1995). Steam
exploded wheat straw fibers as reinforcing material
for polypropylene-based composites. Die Angew and teakro molekulare Chemie. 233: 149–166.
Badrinath, K.V.S., Kiranchand, T.R. and Prasad,
Krishna (2006). Agriculture crop burning in the
Indo-Gangetic plains- a study using IRS-P6AWiFS
satellite data. Curr. Sci. 91, 85–89.
Bals, B., Murnen, H., Allen, M. and Dale, B. (2010). Ammonia fiber expansion (AFEX) treatment
of elevendifferent forages: Improvements to fiber
digestibility in vitro. Animal Feed Science
Technology155: 147–155. Mary, B., Recous, Darwis,
D., Robin, D., 1996. Interactions between
decomposition of plant residues and nitrogen cycling in soil. Plant and Soil. 181, 71−82.
Barnett, H.L. and Hunter, B.B. (1972). Illustrated
Genera of Imperfect Fungi. Burgess Publishing
Company, Minneapolia, Minnesota.
Charaya, M.U. (2006). Successive microbial
colonization of wheat straw decomposing under
different situations. Jour. Ind. Bot. Soc. 85,121–134.
Charaya, M.U. and Mehrotra, R.S. (2005). Fungal
decomposition of plant litter: some attributes of
primary colonizers. Proc. Symposium on challenging
problem in Mycology and Plant pathology. May 2-3, 2005, Jammu (J &K); pp. 29–31.
Charaya, M.U. and Mehrotra, R.S. (2005). Fungal
decomposition of plant litter: some attributes of
primary colonizers. Proc. Symposium on challenging
problem in Mycology and Plant pathology. May 2-3,
2005, Jammu (J &K); pp. 29–31.
Chauhan, K. (2006). Studies on potential of fungi to
decompose sugarcane trash in relation to varying
nitrogen levels. Ph.D. Thesis C.C.S. University,
Meerut.
Chauhan, K. (2006). Studies on potential of fungi to
decompose sugarcane trash in relation to varying nitrogen levels. Ph.D. Thesis C.C.S. University,
Meerut.
Deswarte, F.E.I., Clark, J.H., Wilson, A.J., Hardy,
J.J.E., Marriott, R., Chahal, S.P., Jackson, C.,
Heslop, G., Birkett, M., Bruce, T.J. and Whiteley,
G. (2007). Toward an integrated straw-based
biorefinery. Biofuels, Bioproducts and Biorefining,
1, 245–254.
Dickinson, C.H. and Pugh, G.J.F. (1974). Biology
of Plant Litter Decomposition. Vols. I and II.
Academic Press, London and New York.
Doan, M., Ingrid, H., Franke-Whittele, I., Insam,
H., Chen, Y. and Hadar, Y. (2008). Molecular
analysis of bacterial community succession during
prolonged compost curing. FEMS Microbiology
Ecology 65, 133–144.
Domsch, K.H. and Gams, W. (1972). Fungi in
Agricultural Soils. Longman, London.

930 SHAHNAAZ KHATOON S.C. JAIN AND M.U. CHARAYA
Domsch, K.H., Gams, W. and Anderson, T. (1980). Compendium of Soil Fungi. Vol. I & II.
Academic Press, London, New York, Sydney.
Dube, V.P., Charaya, M.U. and Modi, P. (1980).
Ecological and in vitro studies on the soil mycoflora
of mango orchards. Proc. Ind. Acad. Sci. (Plant Sci.) 82, 157–160.
Ellis, M.B. (1971). Dematiaceoushyphomycetes.
Commonwealth Mycological Institute, Kew, Surrey,
England.
Ellis, M.B. (1976). More
Dematiaceoushyphomycetes. Commonwealth
Mycological Institute, Kew, Surrey, England.
Fan, L.T., Lee, Y.H. and Beardmore, D.H. (1981).
The influence of major structural features of
cellulose on rate of enzymatic hydrolysis.
Biotechnol.Bioeng. 23: 419–442.
Gaind, S., Pandey, A.K. and Lata (2005). Biodegradation study of crop residues as affected by
exogenous inorganic nitrogen and fungal inoculants.
J. Basic Microbiol.45, 301–311.
Galloway, L.D. (1935). Indian Soil fungi. Ind. J.
Agric. Sci. 6, 578–585.
Guleri, S., Saxena, S., Sharma, P., Malik, N. and
Thapliyal, M. (2016). Occurrence and Diversity of
Soil Mycoflora in Some Selected Brassica Growing
Agricultural Fields of Dehradun District of
Uttarakhand Himalaya. Int. J. Pure App. Biosci. 4,
253-264.
Gupta, P.K., Sahai, S., Singh, N., Dixit, C.K.,
Singh, D.P., Sharma, C., Tiwari, M.K., Gupta,
R.K. and Garg, S.C. (2004). Residue burning in rice
wheat croppingsystem: causes and implications. Curr
Sci. 87, 13–15.
Hayes, W.A. and Lim, W.G. (1979). Wheat and rice
straw composts and mushroom production. In “Straw
decay and effect of its diposal and utilization” (Ed.
Gronbard, E.); John Willey and sons, Chichester,
New York, Brisbane, Toronto pp. 83–93.
Hudson, H.J. (1968). The ecology of fungi on plant
remains above the soil. New Phytol. 67, 837−874. Jensen, H.L. (1931). The fungus flora of the soil.
Soil Sci. 31, 123–158.
Kumar, A., Rao, N.N. and Kaul, S.N. (2000).
Alkali-treated straw and insoluble straw xanthate as
low costadsorbents for heavy metal removal
preparation, characterization and application. Biores.
Tech.71, 133–142.
Li, H.C., Hu, Y.L., Mao, R., Zhao, Q. and Zeng,
D.H. (2015). Effects of Nitrogen Addition on Litter
Decomposition and CO2 Release: Considering
Changes in Litter Quantity. PLoS ONE 10(12), e0144665.
Maaroufi, N.I., Nordin, A., Palmqvist, K. and
Gundale, M.J. (2017). Nitrogen enrichment impacts
on boreal litter decomposition are driven by changes
in soil microbiota rather than litter quality. Scientific
Reports, 7, 4083.
Manríquez, O. M., Montano, M. F., Calderon, J.
F., Valdez, J. A., Chirino, J. O., Gonzalez, V. M.
and Zinn, R. A. (2016). Influence of Wheat Straw
Pelletizing and Inclusion Rate in Dry Rolled or
Steam-flaked Corn-based Finishing Diets on
Characteristics of Digestion for Feedlot Cattle.
Asian-Australas J. Anim Sci. 29, 823–829.
Nagamani, A., Kunwar, K.I.O. and Manoharachary, C. (2006). Handbook of soil fungi.
I.K. International Pvt. Ltd. New Delhi.
Park, D. (1976). Carbon and nitrogen levels as
factors influencing fungal decomposers. In: The Role
of Terrestrial and Aquatic organismsin
Decomposition process (Eds. Anderson, J.M. and A.
Macfadyen). Blackwell Scientific Publications.
Oxford, London Edinburgh, Melbourne pp. 41–59.
Rahman, F., Rahman, M., Rahman, G.K.M.,
Saleque, M.A., Sakhawat Hossain A.T.M. and Md
Giashuddin Miah. (2016). Effect of organic and
inorganic fertilizers and rice straw on carbon sequestration and soil fertility under a rice–rice
cropping pattern. Carbon Management, 7, 41-53.
Raman, K.V. (2005). Sustaining soil fertility. The
Hindu Survey of Indian Agriculture pp. 165–167.
Rani, P. (2008). Studies on the fungal decomposition
of sugarcane trash. Ph.D. Thesis C.C.S. University,
Meerut.
Raper, K. B. and Thom (1949). A Manual of
Penicillia. Williams Wilkins Co., Baltimore, Md.
Reddy N. and Yang, Y. (2007). Preparation and
characterization of long natural cellulose fibers from wheat straw. J. Agric. Food Chem. 55, 8570–8575.
Riker, A. J. and Riker, R.S. (1936). Introduction to
research on plant diseases. John S. Swift Co., St.
Louis, Mo.
Runzhou Huang, Min Yu., Chunxia He, Qinglin
Wu, and Xueni Zhao (2016). Hybrid Composites
from Wheat Straw, Inorganic Filler, and Recycled
Polypropylene: Morphology and Mechanical and
Thermal Expansion Performance. Int. J. Polym. Sci.
12 pages.
Sajith, S., Priji, P., Sreedevi, S. and Benjamin, S. (2016). An Overview on Fungal Cellulases with an Industrial Perspective. J Nutr Food Sci 6:461.
Sastre, C.M., González-Arechavala, Y. and
Santos, A.M. (2015). Global warming and energy
yield evaluation of Spanish wheat straw electricity
generation - A LCA that takes into account
parameter uncertainty and variability. Appl. Energy.
154, 900–911.
Sen, S. and Charaya, M.U. (2010). Copper-tolerant
microfungi for bioremediation. Prog. Agric. 10, 66–
71.
Sen, S., Charaya, M.U. and Singh, P.B. (2009). Screening of soil for lead toletrant fungi. Indian J.
Plant Genet. Resour. 22, 191–194.
Shukla, L. and Mathur, R.S. (2000). Effect of
biodegradation sugarcane trash on yield of nutrient
uptake by wheat crop. Journal of the Indian Society
of Soil Science, 48, 520−522.

JOURNAL OF PLANT DEVELOPMENT SCIENCES VOL. 9 (10) 931
Singh, P.N. and Charaya, M.U. (1975). Soil fungi
of sugarcane field at Meerut. Distribution of soil
mycoflora. Geobios. 2, 40–43.
Singh, R. (2004). Studies on the fungal
decomposition of above ground residues of wheat
crop. Ph.D. Thesis, C.C.S. University, India.
Singh, R., Charaya, M.U., Shukla, L., G. Shukla.,
Kumar, A. and Rani, A. (2015). Lignocellulolytic
Potentials of Aspergillus terreus for Management of
Wheat Crop Residues. J. Acad and Ind. Res. 3, 453-
455.
Subramanian, C.V. (1971). Hyphomycetes. Indian
Council of Agricultural Research, New Delhi.
Tiwari, A. (2010). Studies on the mitigation of metal
pollution through boisorption by soilfungi. Ph.D.
Thesis, Department of Botany, C.C.S. University,
Meerut.
Tiwari, A. and Charaya, M.U. (2006). Effect of chromium sulphate on soil mycobiota. Bio-Sci. Res.
Bull. 22, 53–56.
Van Fassen, H.G. and Van Dijk, H. (1979).
Nitrogen conversions during the composting of
manure/straw mixtures. In: straw decay and its effect
on disposal and utilization (Ed. Grossbard, E.); John
Willey and Sons, Chichester, N.Y., Brisbane,
Toronto, pp. 113–120.
Venkateswarlu, N., Sireesha, O., Aishwayra, S.,
Vijaya, T. and Sriramulu. A. (2015). Isolation,
screening of rhizosphere fungi antagonistic to rice stem rot disease pathogen sclerotium oryzae catt.
Asian J Pharm Clin Res, 8, 54-57.
Viola, E., Zimbardi, F., Cardinale, M., Cardinale,
G., Braccio, G. and Gambacorta, E. (2008).
Processing cereal straws by steam explosion in a
pilot plant to enhance digestability in ruminants.
Biores. Technol. 99, 681–689.
Waksman, S.A. and Tenney, F.G. (1927). The composition of natural organic materials and their
decomposition in the soil. I methods of quantitative
analysis of plant materials. Soil Sci. 24, 275−283.
Wang, J., Wensheng, Bu., Zhao, Bo., Zhao, X.,
Zhang, C., Juan, Fan. and Gadow, K.V. (2015).
Effects of Nitrogen Addition on Leaf Decomposition
of Single-Species and Litter Mixture in Pinus
tabulaeformis Forest. Forests 6, 4462–4476.
Wei, T., Zhang, P., Wang, K., Ding, R., Yang, B.
and Nie, J. (2015). Effects of Wheat Straw
Incorporation on the Availability of Soil Nutrients
and Enzyme Activities in Semiarid Areas. PLoS ONE 10(4), e0120994.
Yadav, J.S. (1987). Influence of nutritional
supplimetation on solid substrate termination of
wheat straw with an alkalophilic white rot fungus
(Coprinus spp.). App. Microbiol. Technol. 26, 474–
478.
Zhao J., Li X., Qu Y. and Gao, P. (2004). Alkaline
peroxide mechanical pulping of wheat straw with
enzyme treatment. Appl. Biochem. Biotechnol. 112,
12–23. Raper, K. B. and Thom (1949). A Manual of
Penicillia. Williams Wilkins Co., Baltimore, Md.
Zhao, Ya-Nan., Xin-Hua, He., Xing-Cheng,
Huang., Yue-Qiang, Zhang. and Xiao-Jun, Shi. (2016). Increasing Soil Organic Matter Enhances
Inherent Soil Productivity while Offsetting
Fertilization Effect under a Rice Cropping System.
Sustainability, 8, 879.

932 SHAHNAAZ KHATOON S.C. JAIN AND M.U. CHARAYA

*Corresponding Author
________________________________________________ Journal of Plant Development Sciences Vol. 9 (10) : 933-939. 2017
COMMUNITY STRUCTURE OF DANDACHALI FOREST OF TEHRI FOREST
DIVISON, NORTH-WEST HIMALAYA
Pankaj Lal*, J.S. Butola and V.P. Khanduri
College of Forestry, Ranichauri V.C.S.G. Uttarakhand University of Horticulture and Forestry Email. [email protected]/[email protected]
Received-28.09.2017, Revised-19.10.2017
Abstract: The present investigation was conducted in Dandachali forest of Tehri Forest Division, North-Western part of Himalaya. Surveys and sampling of the vegetation were done using standard ecological assessment methods with an aim to study plant species composition and natural regeneration status at community level. Forty seven woody species (17 trees)
belonging to 12 families and 15 genera, and 6 forest communities viz., Pinus roxburghii- Quercus leucotrichophora mixed, Pinus roxburghii, Pinus roxburghii- Rhododendron arboreum mixed, Cedrus deodara- Pinus wallichiana mixed, Cedrus deodara- Rhododendron arboreum mixed and Rhododendron arboreum- Quercus leucotrichophora mixed, have been recorded in 16 sites between 1482- 2200 m asl. Among the communities, total tree density ranged from 263.34-1493.33 Ind ha-1, TBA 260.2- 310.7 m2 ha-1 and total shrub density 488.3- 4250 Ind ha-1. Species diversity (H’) for trees ranged from 0.58-1.89. Concentration of dominance (cd) of trees ranged from 0.20-0.76. Keywords: Survey, Tehri Forest Division, North-West Himalya
INTRODUCTION
he Phytosociological characters express the
quantitative information on analytical characters,
composition and pattern of distribution of the species
(Saxena, 1982; Ralhan et al., 1982; Sharma and
Kumar, 1992). In a forest ecosystem, all plant species
are not equally important but there are only a few
overtopping species which by their bulk and growth
modify the habitat and control the growth of other
species of the community as these species are called
dominants (Gaston, 2000). Therefore, phytosociological studies are essential for protecting
the natural plant communities and biodiversity as
well as understanding the changes experienced in the
past and continuing on into the future.
The plant diversity and regeneration status of
particular forests is baseline information for the
management and conservation of biodiversity.
Regeneration studies are important in view predictin
g structure and composition of the species.
Regenerating forests can be characterized by presenc
e of seedlings, saplings and trees of different age groups, from young to old (Chauhan, 2001, Chauhan
et al., 2001). regeneration status of tree species based
on the age and diameter structure of their population
(Khan et al., 1987; Bhuyan et al., 2003).
Study area
The study was carried out in Dandachali forest of
Tehri Forest Division, Tehri Garhwal (district),
Uttrakhand (State) part of North West Himalaya.
Tehri Forest Division covers 143268.90 ha total
forest areas, situated between latitude N-300-03’05”
and 300-52’077” and longitude E-78
0-56’35” and
790-02’45”. Tehri Range of the division lies between 300-22’077” North latitude and 300-25’599” East
longitude which covers 16144.70 ha area. Lohital
beat of this range covers 1117.30 ha area, comprises
of 14 compartments. Out of 1332 Vanpachayats in
Tehri district, 273 Vanpachayats are included in
Tehri Forest Division.
METHODOLOGY
Selection of Sites and Habitats for Vegetation
Sampling: Sites were selected on each and every
accessible aspect along an altitudinal gradient. The
habitats were identified based on the physical
characters and dominance of the vegetation. Sites
having closed canopy with high percentage of humus and moisture were considered as moist habitats
whereas low percentage of the same as dry habitats.
Assessment of the Forest Vegetation: In each site, a
plot of 50x50m (0.25 ha) was laid. Trees, saplings
and seedlings were sampled by randomly placed 10,
10x10m quadrats and shrubs by 20, 5x5m quadrats.
For the collection of data from these quadrates
standard ecological methods (Curtis and McIntosh,
1950; Grieg-Smith, 1957; Kersaw, 1973; Muller-
Dombois and Ellenberge, 1974; Dhar et al., 1997;
and Samant and Joshi, 2004) were followed. The circumference at breast height (cbh at 1.37m from
ground) for each tree individual was recorded. Based
on cbh, the tree individuals were considered as tree
(cbh 31.5 cm). Data analysis and Formulae used: Data analysis has
been done following standard ecological methods
(Curtis & McIntosh, 1950; Grieg-Smith, 1957;
Kersaw, 1973; Muller-Dombois & Ellenberge, 1974;
Dhar et al., 1997; and Samant and Joshi 2004).
Species diversity: Species diversity (H’) was
determined by Shanon Wiener’s information statistic
(Shanon and Weiner, 1963). Diversity is usually
considered as a function of relative distribution of individuals among the species. Shannon-Weiner
T
RESEARCH ARTICLE

934 PANKAJ LAL, J.S. BUTOLA AND V.P. KHANDURI
information index (Shannon and Wiener, 1963) was
used for estimating the diversity.
H= - Σ (Ni/N) log 2 (Ni/N)
Where, Ni is the total number of individuals of a
species and N is the total number of individuals of all
species in that stand. Concentration of dominance (Cd): Concentration
of dominance (Cd) by Simpson’s Index (Simpson,
1949). The index of dominance (C) of the
community is calculated by Simpson’s index
(Simpson, 1949);
C= (Ni / N)²
Where, Ni is the total number of individuals of
species and N is the total number of individuals of all
species.
RESULT AND DISCUSSION
Total of 16 sites were surveyed in the area. A total of
17 species belonging to 12 families and 15 genera
were recorded in the study area (Table 6). Family
Pinaceae dominated with maximum number of
species (3 spp.) followed by Cornaceae, Ericaceae,
Fagaceae and Symplocaceae, (2 spp., each (2 spp.,
each). All other families had only one species.
Dominant genera were Quercus, Pinus and
Symlplocus (2 spp., each), followed by all other
genera is single were represented in all sites (16
sites) followed by Lyonia ovalifolia (15 sites), Rhododendron arboreum (12 sites) and Pyrus pashia
(10 sites). Dry degraded habitat was the richest in
number of species (15 spp.) followed by dry
degraded (12 spp.) and shady moist (10 spp.). A total
of 6 forest communities were delineated in the study
area. Pinus roxburghii community represented in
maximum sites (#6), followed by Cedrus deodara -
Rhododendron arboreum mixed and Pinus
roxburghii -Rhododendron arboreum mixed (#3,
each), Cedrus deodara- Pinus wallichiana mixed
(#2) and Pinus roxburghii- Quercus
leucotrichophora mixed and Rhododendron arboreum - Quercus leucotrichophora- mixed (#1,
each).
Community composition, Structure and
Regeneration pattern: Community wise total
density, total basal area (TBA) and IVI of tree
species and relative density of shrubs have been
presented in Table 2, 3, 4, and 6, respectively.
Pinus roxburghii- Quercus leucotrichophora mixed The physical characteristics of the community have
been presented in Table 2) 1. This community has
been represented only in 1 site. Community and structure: A total of 17species
(trees: 2) were recorded in the community. Total tree
density and total basal area were 380.00 Ind ha-1 and
296.42 m2 ha-1, respectively (Table 2, 3). P.
roxburghii (Density: 220 Ind ha-1, TBA: 174.28 m2
ha-1 and IVI: 166.69) was the dominant tree species,
associated by Q. leucotrichophora (Density: 160 Ind
ha-1, TBA: 122.14 m2 ha-1 and IVI: 133.31). Similar
study was conducted by Singh et al. (1994) at
Nainital Forest Division where maximum TBA
(70.90 m2 ha-1) was found in pine dominated forest at
1850m and minimum in oak dominated forest at
1650m elevation. Ahmed (2012) conducted a study
in Kumaon Himalaya where Q. leucotricophora was found dominant in terms of density (183.2 trees/ha),
mean basal area (625.3 Ind ha-1) and IVI (99.9).
Pinus roxburghii The physical characteristics of the community have
been presented in Table 1. This community has been
represented in 6 sites.
Community and structure: A total of 17 species
including trees (6 spp.) were recorded in the
community. Total tree density, TBA and IVI were
263.33 Ind ha-1 and 310.74m2 ha-1, respectively
(Table 2, 3). In which P. roxburghii (Density: 228.33
Ind ha-1, TBA: 309.85 m2 ha-1 and IVI: 271.57) was the dominant tree and associated by M. esculenta
(Density: 11.67 Ind ha-1, TBA: 0.62 m2 ha-1 and IVI:
10.60) and Lyonia ovalifolia (Density: 11.67 Ind ha-1,
TBA: 0.21 m2 ha-1 and IVI: 8.95). Similar results
were observed by Singh et al. (2014) at Nainital
Forest Division. He noted maximum TBA (70.90
m2/ha) in pine dominated forest at 1850m elevation
and minimum in oak dominated forest at 1650m
elevation. Gurarni et al. (2010) recorded maximum
total tree density (1000 tree /ha), TBA (14.55 m²/ha)
in mixed pine-oak forest compared to pine dominated forest.
Pinus roxburghii-Rhododendron arboreum mixed
The physical characteristics of the community have
been presented in Table 1. This community has been
represented only in 3 sites.
Community and structure: A total of 17 species
(trees: 09) were recorded in the community. Total
tree density and TBA were 980.1 Ind ha-1 and 264.7
m2 ha-1, respectively (Table 2, 3). P. roxburghii
(Density: 376.7 Ind ha-1, TBA: 192.56 m2 ha-1 and
IVI: 140.9) was the dominant tree and associated by
R. arboreum (Density: 350 Ind ha-1, TBA: 69.24 m2 ha-1 and IVI: 99.24) and Lyonia ovaliofolia (Density:
63.3 Ind ha-1, TBA: 1.14 m2 ha-1 and IVI: 18.88).
Results of the present study showed higher density of
tree and shrubs as compared to other studies like Rai
et al. (2009) in Western Himalayas in case of R.
arboreum and Rawat et al. (2014) in Govind Pashu
Vihar National Park, Uttarkashi.
Cedrus deodara- Pinus wallichiana mixed
The physical characteristics of the community have
been presented in Table 1. This community has been
represented only in 2 sites. Community and structure: A total of 17 species
(trees: 11) were recorded in this community. Total
tree density and TBA were 795.0 Ind ha-1 and 281.9
m2 ha-1, respectively (Table 2, 3). C. deodara
(Density: 270 Ind ha-1, TBA: 147.8 m2 ha-1 and IVI:
127.2) was the dominant tree and associated by Pinus
wallichiana (Density: 190 Ind ha-1, TBA: 55.41 m2
ha-1 and IVI: 60.12) and R. arboreum (Density: 115

JOURNAL OF PLANT DEVELOPMENT SCIENCES VOL. 9 (10) 935
Ind ha-1, TBA” 35.17 m2 ha-1 and IVI: 33.4). These
results are in line with Sharma and Raina (2013) in
Jammu province of north-western Himalayas where
the highest density, TBA and IVI values for C.
deodara (675 Trees/ha, 72.80 m2 /ha and 213.54)
were recorded. Results are very similar to Singh and Samant (2010) in North Western Himalaya where
total shrub density was highest in C. deodara (2611.7
Ind ha-1) community.
Cedrus deodara - Rhododendron arboreum mixed
The physical characteristics of the community have
been presented in Table 1. This community has been
represented only in 3 sites.
Community and structure: A total of 17 species
including 13 species of trees (Table 6) were recorded
in the community. Total tree density and TBA were
1493.33 Ind ha-1 and 260.23 m2 ha-1, respectively
(Table 2, 3). R. arboreum (Density: 516.67 Ind ha-1, TBA: 90.69 m2 ha-1 and IVI: 96.83) was the
dominant tree and associated by C. deodara
(Density: 386.67 Ind ha-1, TBA: 141.04 m2 ha-1 and
IVI: 101.85) and Lyonia ovalifolia (Density: 153.33
Ind ha-1, TBA: 2.00 m2 ha-1 and IVI: 20.45). As far as
tree species are concerned, these results are in
contradiction of Singh and Gupta (2009) in Western
Himachal Himalayas. In this study, the Periodic
Block I indicated that among trees species C.
deodara had maximum and R. arboreum had
minimum average density, TBA, percentage frequency and IVI.
Rhododendron arboreum- Quercus
leucotrichophora mixed
The physical characteristics of the community have
been presented in Table 1. This community has been
represented in only 1 site.
Community and structure: A total of 17 species
(trees: 8;) were recorded in this community. Total
tree density and total basal area were 1060.0 Ind ha-1
and 273.8 m2 ha-1, respectively (Table 2, 3). Q.
leucotrichophora (Density: 390 Ind ha-1, TBA: 81.00
m2 ha-1 and IVI: 91.37) was the dominant tree and associated by R. arboreum (Density: 290 Ind ha-1,
TBA: 110.9 m2 ha-1 and IVI: 92.87) and C. deodara
(Density: 140 Ind ha-1, TBA: 71.19 m2 ha-1 and IVI:
56.7). Similar results were observed by Kumar
(2012) in mixed forest in Garhwal Himalayas where
Lyonia ovalifolia, R. arboreum and Q.
leucotrichophora were the predominant tree species.
However, these results are in contradiction with Giri
et al. (2008) in relation to the tree density and Upreti
(1982) in TBA of Q. leucotrichophora.
Species diversity (HI)
Community wise diversity of trees are shown in
Table 5. Diversity of trees ranged from 0.58-1.89.
The diversity of trees was maximum in C. deodara-
P. wallichiana mixed community (1.89), followed by
C. deodara- R. arboreum- mixed (1.87) and R.
arboreum- Q. leucotrichophora mixed (1.64)
communities. Results are comparable with Pant and
Samant (2007) where species diversity in Mornaula
Reserve Forest in case of trees ranged from 0.99-
2.93. Numerous studies are available on species diversity
in temperate Himalaya (Saxena and Singh, 1982,
Tripathi et al. 1987, Rikhari et al. 1989; Tripathi et
al., 1991, Giri et al., 2008). The increased
disturbance intensity may favor higher natality and
survival of seedling. Particularly, anthropogenic
disturbance first decrease the tree diversity with
increasing intensity of disturbance decreased trees
and sapling diversity and increased seedling
diversity. The diversity of disturbance decreased the
overall richness and diversity of the ecosystem.
Concentration of dominance (cd) Community wise concentration of dominance of
trees are shown in Table 5. Concentration of
dominance of trees ranged from 0.20-0.76.
Concentration of dominance of trees was maximum
in P. roxburghii community (0.76), followed by P.
roxburghii- Q. leucotrichophora mixed community
(0.51) and P. roxburghii- R. arboreum (0.29)
communities. However, it was lowest in C. deodara-
P. wallichiana mixed (0.20) community. In case of
shrubs, maximum cd was observed for R. arboreum-
Q. leucotrichophora mixed (0.43) and minimum in C. deodara- P. wallichiana mixed (0.15) community.
These results are very close with the findings of Pant
and Samant (2007) for Mornaula Reserve Forest. In
their study, cd of trees ranged from 0.06-0.49,
however, cd of trees was highest in Myrica esculenta
community (0.49), followed by Pinus roxburghii
(0.46) where cd of particular species is concerned.
These values were comparable to the previous
records (Sexena and Singh, 1982, Ralhan et al.,
1982).
CONCLUSION
The study provides information on floristic
inventory, compositional and structural diversity at
community level of species, first time in the selected
area. Therefore, there is an immediate need to
develop an adequate strategy and action plan for
augmentation of natural regeneration and to employ
artificial regeneration of the plant species for long
term conservation management of habitats, species,
and communities.
Results of the present study can be used for development of conservation management and micro
planning of this areas and thus, socio-economic
development of the inhabitants, in particular and
biodiversity of the Himalaya, in general.

936 PANKAJ LAL, J.S. BUTOLA AND V.P. KHANDURI
Table 1. Community types, their distribution, habitats and major associated species in study sites Community types SR
AR
(m)
Habitat
Slope
(0)
Aspect
Latitude Longitude Major associated spp.
Pinus roxburghii – Quercus
leucotrichophora mixed
1 1482-
1495
D, Deg 45 NE 300 18.808’N
300 18.900’N
0780 25.154’E
0780 25.204’E
Pinus roxburghii, Quercus
leucotrichophora, Berberis aristata,
Rhus parviflora, Rhus cotinus
Pinus roxburghii
6
1525-
1791
D, Deg 35-50 NW, NE 300 18.080’N
300 18.470’N
0780 25.137’E
0780 25.073’E
Lyonia ovalifolia, Myrica esculenta,
Rhododendron arboreum, Berberis
aristata, Myrsine Africana, Asparagus
adscendens
Pinus roxburghii-
Rhododendron arboreum
mixed
3 1863-
2015
D, SM 30-50 N, NE 300 18.204’N
300 18.242’N
0780 25.059’E
0780 25.995’E
Lyonia ovalifolia, Cornus capitata,
Cedrus deodara, Myrsine africana,
Rubus ellipticus, Indigofra atropurpurea,
Pogostemon plectranthoides
Cedrus deodara
- Pinus wallichiana mixed
2 1873-
2015
M, SM 50-70 N, NW 300 18.204’N
300 18.189’N
0780 25.059’E
0780 25.936’E
Rhododendron arboreum, Pinus
roxburghii, Populus ciliata, Rubus
ellipticus, Pogostemon plectranthoides,
Rubus paniculatus
Cedrus deodara-
Rhododendron arboreum
mixed
3 1928-
2116
SM 60-50 NW,
NW
300 18.101’N
300 17.893’N
0780 25.145’E
0780 25.004’E
Lyonia ovalifolia, Pinus roxburghii,
Populus ciliata, Myrsine africana, Rubus
ellipticus
Rhododendron arboreum-
Quercus leucotrichophora
mixed
1 2116-
2200
SM 55 NE 300 17.893’N
300 17.995’N
0780 25.004’E
0780 25.009’E
Cedrus deodara, Lyonia ovalifolia, Pinus
wallichiana, Myrsine africana, Berberis
aristata
Table 2. Community wise total density of trees (Ind ha-1) in different forest localities in study area
Species Name
Community types
1 2 3 4 5 6
Pinus roxburghii 220.00 228.33 376.70 50.00 140.00 -
Swida macrophylla - 6.67 - - - -
Lyonia ovalifolia - 11.67 63.30 20.00 153.30 90.00
Myrica esculenta - 11.67 46.70 25.00 56.70 10.00
Quercus leucotrichophora 160.00 1.67 - 25.00 60.00 390.00
Rhododendron arboreum - 3.33 350.00 115.00 516.70 290.00
Cedrus deodara - - 56.70 270.00 386.70 140.00
Cornus capitata - - 60.00 25.00 10.00 40.00
Populus ciliata - - - 45.00 80.00 -
Pinus wallichiana - - - 190.00 46.70 80.00
Ilex dipyrena - - - 20.00 16.70 -
Pyrus pashia - - - 10.00 - 20.00
Fraxinus micrantha - - - - 6.70 -
Symplocus paniculata - - - - 10.00 -
Symplocus crataegoides - - 10.00 - 10.00 -
Trema orientalis - - 10.00 - - -
Acacia dealbata - - 6.70 - - -
Total 380.00 263.34 980.10 795.00 1493.30 1060.00
Abbreviations used: 1= Pinus roxburghii- Quercus leucotrichophora mixed; 2= Pinus roxburghii; 3= Pinus
roxburghii- Rhododendron arboreum mixed; 4= Cedrus deodara- Pinus wallichiana mixed; 5= Cedrus
deodara- Rhododendron arboreum mixed; 6= Rhododendron arboreum- Quercus leucotrichophora mixed
Table 3. Community wise total basal area (m2 ha-1) of trees in different forest localities in study area
Species Name
Community type
1 2 3 4 5 6
Pinus roxburghii 174.28 309.85 192.56 11.94 16.32 -
Swida macrophylla - 0.04 - - - -
Lyonia ovalifolia - 0.21 1.14 0.14 2.00 1.13
Myrica esculenta - 0.62 0.76 0.86 0.52 0.01
Quercus leucotrichophora 122.14 0.00 - 0.21 0.14 81.00
Rhododendron arboreum - 0.01 69.24 35.07 90.69 110.93
Cedrus deodara - - 0.81 147.78 141.04 71.19

JOURNAL OF PLANT DEVELOPMENT SCIENCES VOL. 9 (10) 937
Cornus capitata - - 0.14 0.33 0.01 0.86
Populus ciliata - - - 29.34 5.52 -
Pinus wallichiana - - - 55.41 3.47 8.37
Ilex dipyrena - - - 0.84 0.27 -
Pyrus pashia - - - 0.02 - 0.32
Fraxinus micrantha - - - - 0.14 -
Symplocus paniculata - - - - 0.08 -
Symplocus crataegoides - - 0.02 - 0.03 -
Trema orientalis - - 0.01 - - -
Acacia dealbata a - - 0.02 - - -
Total 296.42
310.74 264.71
281.92
260.23 273.80
Abbreviations used: 1= Pinus roxburghii- Quercus leucotrichophora mixed; 2= Pinus roxburghii; 3= Pinus
roxburghii- Rhododendron arboreum mixed; 4= Cedrus deodara- Pinus wallichiana mixed; 5= Cedrus
deodara- Rhododendron arboreum mixed; 6= Rhododendron arboreum- Quercus leucotrichophora mixed
Table 4. Community wise Importance Value Index (IVI) in different forest localities in study area
Species Name
Community types
1 2 3 4 5 6
Pinus roxburghii 166.69 271.57 140.87 18.74 27.76 -
Swida macrophylla - 3.59 - - - -
Lyonia ovalifolia - 8.95 18.88 7.01 20.45 16.40
Myrica esculenta - 10.60 12.83 7.48 9.17 3.45
Quercus leucotrichophora 133.31 1.79 - 12.10 7.51 91.37
Rhododendron arboreum - 3.50 99.24 33.45 96.83 92.87
Cedrus deodara - - 13.42 127.25 101.85 56.71
Cornus capitata - - 7.62 8.10 1.54 11.59
Populus ciliate - - - 14.80 14.89 -
Pinus wallichiana - - - 60.12 8.94 20.60
Ilex dipyrena - - - 8.78 3.63 -
Pyrus pashia - - - 2.18 - 7.00
Fraxinus micrantha - - - - 2.57 -
Symplocus paniculata - - - - 2.90 -
Symplocus crataegoides - - 2.32 - 1.96 -
Trema orientalis - - 2.32 - - -
Acacia dealbata a - - 2.51 - - -
Total 300 300 300 300 300 300
Abbreviations used: 1= Pinus roxburghii- Quercus leucotrichophora mixed; 2= Pinus roxburghii; 3= Pinus roxburghii- Rhododendron arboreum mixed; 4= Cedrus deodara- Pinus wallichiana mixed; 5= Cedrus
deodara- Rhododendron arboreum mixed; 6= Rhododendron arboreum- Quercus leucotrichophora mixed
Table 5. Community wise species diversity (H1) and concentration of dominance (cd) of trees in different forest
localities in study area
Community type Trees Species diversity
(H1)
Trees Concentration of
dominance (cd)
Pinus roxburghii - Quercus leucotrichophora
mixed
0.68 0.51
Pinus roxburghii 0.58 0.76
Pinus roxburghii- Rhododendron arboreum
mixed
1.52 0.29
Cedrus deodara - Pinus wallichiana mixed 1.89 0.20
Cedrus deodara- Rhododendron arboreum
mixed
1.87 0.21
Rhododendron arboreum- Quercus
leucotrichophora mixed
1.64 0.24
Maximum 1.89 0.76
Minimum 0.58 0.20

938 PANKAJ LAL, J.S. BUTOLA AND V.P. KHANDURI
Table 6. Diversity, Distribution S.
No.
Species Alti. Range
(m)
Habitat (s) SR Life Form
1 Auilifoliaceae
Ilex dipyrena Wall.
2116-2116 SM 1 T
2 Cornaceae
Cornus capitata Wall.
1863-2116 D, Deg, SM 5 T
Swida macrophylla (Wallich) 2015-2015 D, Deg 1 T
3 Ericaceae
Lyonia ovalifolia (Wall.) Drude.
1784-2116 D, Deg, SM 11 T
Rhododendron arboreum Sm. 1784-1784 D, Deg, SM 11 T
4 Fagaceae Quercus serrata Murray
1868-1968 D 1 T
Quercus leucotrichophora A. Camus 1482-2200 D, Deg, SM 7 T
5 Mimosaceae Acacia dealbata Link.
1968-1968 SM 1 T
6 Myricaceae Myrica esculenta Hem. Ex Don.
1784-2200 D, Deg 16 T
7 Oleaceae
Fraxinus micrantha Lingelsh
2116-2200 SM 1 T
8 Pinaceae
Pinus roxburghii Sarg.
1482-2915 D, Deg, SM 14 T
Pinus wallichiana Jacks 1871-2116 D, Deg, SM 5 T
Cedrus deodara Roxb. ex D. Don 1863-2200 D, Deg, SM 9 T
9 Rosaceae Pyrus pashia Buch.-Ham. ex D. Don.
1428-2200 D, Deg, SM 6 T
10 Symplocaceae Symplocus crataegoides Buch – Ham. ex
1525-2200 D, Deg, SM 3 T
Symplocus paniculata (thumb.) Miq. 1525-1525 D, Deg 1 T
11 Salicaceae Populus ciliata Wall
1873-2015 D, Deg, SM 2 T
12 Ulmaceae Trema orientalis (L.) Bl.
1863-1863 D 1 T
Abbreviations used: SM=Shady moist; SR=Site Representation; D=Dry; Dgr=Degraded; T=Tree; S=Shrub.
REFERENCES
Bhuyan, P., Khan, M.L. and Tripathi, R.S. (2003).
Tree diversity and population structure in
undisturbed and human- impacted stands of tropical
wet evergreen forests in Arunachal Pradesh, Eastern
Himalaya, India. Biodivers. Conserv. 12: 1753-1773.
Chauhan, P.S., Manhas, R.K. and Negi, J.D.S. (2001). Demographic and diversity analysis of trees
species in Sal (Shorea robusta Gaertn. F.) Forests of
Doon Valley. Ann. For 9 (2):188-198.
Chauhan, P.S. (2001). Sal (Shorea robusta Gaertn.
F.) Mosaic Characterization in Doon Valley, D. Phil,
Thesis, Deemed University, Forest Research
Institute, Dehradun, India.
Curtis, J.T. and Mc, Intosh (1950). The
interrelation of certain analytic and phytosociological
character. Ecology 31: 434-455.
Dhar, U., Rawal, R.S. and Samant, S.S. (1997).
Structural diversity and representativeness of forest vegetation in a protected area of Kumaun Himalaya
India, Implications for conservation. Biodiversity &
Conservation 6: 1045 -1062.
Gaston, K.J. (2000). Global palterns in biodiversity.
Nature 405 : 220-227.
Giri, D., Tewari, L.M., Tamta, S. (2008).
Quantitative analysis of tree species in oak dominant
forest of Uttarakhand, Central Himalaya. Indian
Journal of Botanical Research (2):4 313-318.
Greig-Smith, P. (1957). Quantitative plant ecology,
Academic Press, New York.
Gurarni, D., Arya, N., Yadava, A. and Jee, T.R. (2010). Studies On Plant Biodiversity Of Pure Pinus
roxburghii Sarg. Forest And Mixed Pine-Oak Forest
In Uttarakhand Himalaya. New York Science Journal
3(8): 1-5.
Kersaw, K.A. (1973). Quantitative and dynamic plant ecology, Second edition, Edward Arnold
Limited, London.
Khan, M.L., Rai, J.P.N. and Tripathi, R.S. (1987).
Population structure of some tree species in disturbed
and protected subtropical forest of north east India.
Acta Oecologica 8: 247 – 255.
Kumar, B. (2012). Quantitative analysis of tree
species in mixed forests of mandal catchments,
garhwal himalaya. International Journal Of
Conservation Science (3): 2 107-110.
Mueller-Dombois, D. and Ellenberge, H. (1974).
Aims and methods of vegetation ecology. John Willey and Sons, New York.
Pant, S. and Samant, S.S. (2007). Assessment of
plant diversity and prioritization of communities for
conservation in mornaula reserve forest. Applied
ecology and environmental research 5(2): 123-138.
Rai, I.D. Bharti, R.R. Adhikari, B.S. and Rawat,
G.S. (2009). Structure and functioning of timberline
vegetation in the western himalaya: a case study. 91-
107.

JOURNAL OF PLANT DEVELOPMENT SCIENCES VOL. 9 (10) 939
Ralhan, P.K., Saxena, A.K. and Singh, J.S. (1982).
Analysis of forest vegetation at and around Nainital
in Kumaun Himalaya Proc. Indian Nat. Sci. Acad.
48: 122-138.
Rawat, P.S., Ginwal, H.S., Singh, R.P. and Dubey,
R.C. (2014). Vertical distribution of ecotomycorrhizae in Deodar and Chir pine forests in
Relation to their soil characterstics. India forester
129 (5): 624-630.
Rikhari, H.C., Chandra, R. and Singh, S.P. (1989). Patterns of species distribution and
community along a moisture gradient within and Oak
Zone of Kumaun Himalaya.Proc. Indian Nat. Acad.
B. 55: 431-438.
Samant, S.S. and Joshi, H.C. (2004). Floristic
diversity, community pattern and changes of
vegetation in Nanda Devi National Park In:
Biodiversity Monitoring Expedition, Nanda Devi 2003 (18 June to 8 July, 2003), Uttaranchal Forest
Department Dehradun PP. 39-54.
Saxena, A.K., and Singh, J.S. (1982). A
phytosociological analysis of forest communities of a
part of Kumaun Himalaya. Vegetatio 50: 3-22.
Saxena, A.K. (1982). A phytosociological analysis
of woody species in forest communities of a part of
Kumaun Himalaya. Vegetatio 50: 3-22.
Shannon, C.E. and Wiener, W. (1963). The
Mathematical Theory of Communication, University
of Illinois Press, Urbana.
Sharma, C.M. and Kumar, A. (1992). Community
structure of some natural forest stands is landsdowne
forest range of Garhwal Himalaya. Jour. Tropical
Forest Science 5(1): 8-12.
Simpson, E.H. (1949). Measurement of diversity.
Nature 163-688.
Singh, N., Kamin, T., Ashish, T. and Jeet, R. (2014). Studies on Vegetational Analysis and
Regeneration status of Pinus Roxburghii, Roxb. and
Quercus Leucotrichophora Forests of Nainital Forest
Division. Global Journals Inc. (USA) 14(3).
Singh, A. and Gupta, N.K. (2009). Assessment of
floristic diversity and regeneration status of Cedrus
deodara (ROXB.) loud. Stands under forest
management systems in western Himachal
Himalayas : A case study of Shimla District. Indian
Journal of Forestry 32(1): 45-54.
Singh, A. and Samant, S.S. (2010). Conservation prioritization of habitats and forest communities in
the lahaul valley of proposed cold desert biosphere
reserve, north western himalaya, india. Applied
Ecology And Environmental Research 8(2): 101-117.
Tripathi, B.C., Rikhari, H.C., Bargali, S.S. and
Rawat, Y.S. (1991). Species composition and
regeneration in disturbed forest sites in oak zone in
and around Nainital.Proc. Indian Nation.Cei. Acad.
PP. 381-390.
Upreti, N. (1982). A study on phytosociology and
state of regeneration of oak forest of Nainital. Ph. D. Thesis, Kumaun University, India PP. 481.

940 PANKAJ LAL, J.S. BUTOLA AND V.P. KHANDURI

*Corresponding Author
________________________________________________ Journal of Plant Development Sciences Vol. 9 (10) : 941-945. 2017
AGRI-BUSINESS MANAGEMENT BEHAVIOR OF THE ONION GROWERS OF
REWA DISTRICT (M.P.)
Krishn Kumar Verma* and Sanjay Singh1
Research Scholar, College of Agriculture Rewa (M.P.) 1Krishi Vigyan Kendra Rewa (M.P.)
Received-07.10.2017, Revised-20.10.2017
Abstract: The present study was an attempt to assess the agri-business management behavior of the onion growers. The study was carried out in Rewa block of Rewa District of M.P. with a sample of 120 onion growers. An interview schedule was designed for collecting the relevant information on selected variables. The data were collected personally with the help
of this pre-tested interview schedule. It was found that the respondents were managing the agri-business components such as information seeking management, information evaluation management, information preservation management, input management and technology management in a good manner while they could not manage the components i.e. financial management, storage management, labour management, planning and marketing management to the desired extent .It was also observed that the attributes education, occupation, land holding, annual income, farm assets, farming experience, marketing facilities, training received, mass media use, scientific orientation, economic motivation, risk orientation and decision making were determinants of agribusiness management behaviour of onion growers.
Keywords: Agribusiness management behavior, Onion growers, Determinants
INTRODUCTION
he importance of agri-business in nation‟s
development is being increasingly recognized
and financing for agri-business enterprise has grown
considerably in recent years. Policy makers have
rediscovered that creating a strong agri-business
sector is prerequisite to achieve viable
industrialization. In developing countries, both
agricultural and on-farm/off-farm components
become increasingly significant and preserve the
overall economic contribution of agri-business. Agri-
business management is a purposeful activity indulged in initiating, promoting and maintaining
economic activities regarding farming and allied
sector for the production and distribution of wealth.
Agribusiness management may be defined as the sum
total of all operations.
Agribusiness management may be defined as the sum
total of all operations performed by a farmer/agri-
entrepreneur in the manufacture and distribution of
farm supplies, production operations involved in the
farm, storage, processing and distribution of farm
commodities and items
Onion being an important vegetable crop is produced in the states of Maharashtra, Karnataka, Andhra
Pradesh, Gujarat, Orissa, Tamil Nadu and Madhya
Pradesh. In context with Rewa district of M.P. Onion
being a major vegetable crop of region is grown both
Kharif & Rabi Season with an area of 6863 ha. and
206.42q/ha. productivity.
In spite of lot of efforts have been taken by extension
agencies and scientists to materialize the potential of
onion the profitability of onion was stagnate over a
period of time due to traditional way of cultivation,
dominance of old varieties, lack of supporting facilities like storage and wide fluctuation in market
price of onion which reduce economic gain of the
farmer from onion cultivations. Thus, there is huge scope to boost-up the economic gain of the farmers
through equipping them with business management
skill of onion crop. In the light of these above facts,
the present study was undertaken with the following
objectives.
1. To analyze the agri-business management
behavior of onion growers.
2. To find out the association between personal,
socio – economic, communicational and
psychological characteristics of onion growers and
their agri-business management behavior
METHOD AND MATERIAL
The study was conducted purposively in Rewa
district (M.P.). Rewa district of M.P. was selected
for the study because it has highest production and
productivity in M.P. Rewa block of Rewa district
was selected purposively on the basis of higher
productivity i.e. 251.5 q/ ha. among all the blocks. A
list of villages where onion is grown as commercial
crop was prepared. Five villages on the basis of
higher area under onion crop were selected purposively. The villages were Khajuha, Rithi,
Kanoja, Mahsanw, Rakaria. The onion growers from
these five villages were selected through
proportionate random sampling method to make a
sample of 120 onion growers. Hence, finally the
sample was consisted of 120 respondents. An
interview schedule was designed for collecting the
relevant information on selected variables.
In the present study agri-business management refers
to purposeful activity indulged in initiating,
promoting and maintaining economic activities regarding agriculture production for the production
T
RESEARCH ARTICLE

942 KRISHN KUMAR VERMA AND SANJAY SINGH
and distribution of wealth. The individual as an agri-
business manager is a critical factor in economic
development and an integral part of socio economic
transformation. Therefore, the basic concept of agri-
business management in the present study refers to
activities performed by the farmers for making onion cultivation a business venture. A scale was prepared
to assess the agribusiness management behaviour of
the onion growers. In this scale ten components of
agribusiness management viz. planning, information
seeking management, information evaluation
management, information preservation management,
labour management, input management, technology
management, storage management, marketing
management & financial management were included.
The scale consisted of 50 sub items under all
components. The responses of each respondent were
recorded against each item in three points as completely, partially and not at all with the score 2, 1
and 0 respectively. Total score of each component
was worked out by adding the scores against each
item. Similarly total score of each respondent was
also determined by adding the scores obtained by the
respondent against each item.
The data were collected personally with the help of
this pre-tested interview schedule. The researcher
personally contacted the respondents. They were
assured that the information given by them would be
kept confidential and it would only be used for the
academic purposes. Data collected were qualitative as well as quantitative. The quantitative data were
interpreted in terms of percentage and qualitative
data were tabulated on the basis of approved
categorization method. The following statistical
techniques were used in the study. Co-relation
coefficients („r‟ values) have also been worked out to
assess the relationship between socio personal
attributes and agri-business management behavior of
the respondents
RESULT AND DISCUSSION
A. Agri-business management behavior of onion
growers in relation various components.
(i) The mean score of selected components of agri-
business management behaviour regarding onion
cultivation
Table 1. The mean score of various components of agri-business management behaviour S.
No
Components Extent of management Total
score
Mean
score
Rank
Completely Partial Not of all
1 Planning
a. Time scheduling of operational work 32 62 26 126 1.05 III
b. Plan and analysis of cost & return 25 65 30 115 0.96 IV
c. Planning of water management 22 68 30 112 0.93 V
d. Arrangement of field/nursery. 34 60 26 128 1.06 II
e. Preparation of contingent plan 39 61 20 139 1.16 I
Overall mean score 1.03
2 Information seeking management
a. Individual contact 98 14 8 210 1.75 II
b. Group contact 100 16 4 216 1.80 I
c. Mass media contact 95 18 7 208 1.73 III
Overall mean score 1.76
3 Information evaluation management
a. Discussion with family member 72 16 32 160 1.33 IV
b. Discussion with friend and neighbors 76 18 26 170 1.41 III
c. Discussion with progressive onion
growers
82 21 17 185 1.54 II
d. Discussion with officers of line
departments
86 22 12 194 1.61 I
Overall mean score 1.47
4 Information preservation management
a. Self memory 65 50 5 180 1.50 I
b. Note taking 61 56 3 178 1.48 II
c. Collection of farm literatures 58 50 12 166 1.38 III
d. News paper cutting 55 52 13 162 1.35 IV
e. Use of computer storage devices 48 60 12 156 1.30 V
Overall mean score 1.40
5. Labour management
a. Utilization of family labour 28 68 24 124 1.03 II
b. Labour management as per operational
work
32 62 26 126 1.05 I
c. Evaluation of labour 29 61 30 119 0.99 III
d. Engagement of labour on the basis of their
work efficiency
22 55 43 99 0.82 IV
Overall mean score 0.97
6. Input management
a. Arrangement of seed 59 49 12 167 1.39 I
b. Arrangement of organic manures 42 60 18 144 1.20 V
c. Arrangement of fungicides 48 55 17 151 1.25 IV

JOURNAL OF PLANT DEVELOPMENT SCIENCES VOL. 9 (10) 943
d. Arrangement of insecticides 55 55 10 165 1.37 II
e. Arrangement of herbicides 52 56 12 160 1.33 III
Overall mean score 1.31
7. Technology management
a. Nursery management 48 55 17 151 1.26 I
b. Improved varieties 38 62 20 138 1.15 VII
c. Sowing method 42 56 22 140 1.16 VI
d. Application of bio fertilizers 46 57 17 149 1.24 II
e. INM 39 65 16 143 1.20 IV
f. Weed management 38 70 12 146 1.22 III
g. Plant protection 36 70 14 142 1.18 V
Overall mean score 1.20
8. Storage management
a. Storage at home 55 25 40 135 1.12 I
b. Storage in warehouse 22 56 42 100 0.83 III
c. Bamboo made storage 40 30 50 110 0.91 II
Overall mean score 0.95
9 Marketing management
a. Trends of Mandi selling rate 38 58 24 134 1.12 II
b. Sale at block & district level 40 60 20 140 1.17 I
c. Selling out of state 30 65 35 125 1.04 III
d. Selling by contract with traders 25 68 27 118 0.98 IV
Overall mean score 1.07
10. Financial management
a. Kisan Credit card 30 44 46 104 0.87 II
b. Bank loan 20 40 60 80 0.67 III
c. Own capital 68 10 42 146 1.20 I
Overall mean score 0.91
Over all average mean score of all components 1.20
Table 1 exhibits agribusiness management behaviour
of the respondents in relation to selected components
of agribusiness management. Table reveals that
regarding the planning component mean score was
highest in preparation of contingent plan (1.16)
followed by arrangement field/nursery (1.06), time scheduling of operational work (1.06), plan and
analysis of cost & returns (0.96) and planning of
water management (0.93).
As regards information seeking management mean
score was arranged in descending order as group
contact (1.80) individual contacts (1.75) and mass
media contact (1.73).
As far as information evaluation management was
concerned the mean score was arranged in
descending order as discussion with officers of line
departments (1.61), discussion with progressive onion growers (1.54), friends and neighbors (1.41)
and discussion with family members (1.33).
Regarding preservation management mean score as
was arranged in descending order as self memory
(1.50), note taking (1.48), collection of farm
literatures (1.38), news paper cutting (1.35) and use
of computer storage device (1.30).
In case of labour management mean score was
highest for labour management as per operational
work (1.05), followed by utilization of family labour
(1.03), evaluation of labour (0.96) and engagement
of labours (0.82). In context with input management mean score was
found to be highest in arrangement of seed (1.39),
arrangement of insecticide (1.37), followed by
arrangement of herbicide (1.33), arrangement of
fungicide (1.25), arrangement of organic manures
(1.20).
Among the sub components of technology
management mean score was highest in nursery
management (1.26) followed by application of bio
fertilizers (1.24), weed management (1.22), INM
(1.20), plant protection (1.18) sowing method (1.16)
and improved varieties (1.15). Regarding storage management mean score was
highest for storage at home (1.12) followed by
bamboo made storage (0.91) and storage in
warehouse (0.83).
Out of marketing management components, it was
observed that the mean score was highest in sale at
block & district level (1.16), trends of mandi selling
rate (1.12).selling out of state (1.04) and selling by
contract with traders (0.98).
In case of financial management it was observed that
mean score was highest regarding own capital (1.21) followed by Kisan Credit Card (0.86) and bank loan
(0.66).
It was found that among all the components of
agribusiness management behavior, highest mean
score was observed regarding technology
management followed by information seeking
management (1.76), information evaluation
management (1.47), Information preservation
management (1.40), input management (1.31),
technology management (1.20), marketing
management (1.07), planning (1.00), labour
management (0.96), storage management (0.95) and financial management (0.91). The overall average
mean score of agribusiness management behaviour
was 1.20.
Similar results were reported by Anitha et al. (2004)
and Singh et al (2010).

944 KRISHN KUMAR VERMA AND SANJAY SINGH
(ii) Extent of agri-business management behavior regarding onion cultivation
Table 2. Distribution of the respondents according to their agri-business management behavior regarding onion
cultivation
S. No. Extent of agri-business
management behavior
Number of respondents Percentage
1. Low 23 19.17
2. Medium 53 44.17
3. High 44 36.66
Total 120 100
The Table 4.19 indicates that higher percentage of
the respondents i.e. 44.17 percent belonged to
medium extent of agri-business management
behavior category; while 36.66 percent high agri-
business management behavior and remaining 19.17
percent exhibited low agri-business management
behavior.
B. Relationship between personal socio-personal
attributes of the respondents and their agri-business
management behaviour regarding onion cultivation
Table 3. Relationship between personal socio-personal attributes of the respondents and their agri-business
management behaviour regarding onion cultivation
S.No. Attributes Co-relation coefficient
(‘r’ value)
1. Age -0.10
2. Education 0.21*
3. Size of family 0.12
4. Occupation 0.23*
5. Social participation 0.11
6. Land holding 0.25*
7. Annual income 0.27*
8. Farm assets 0.24*
9. Farming experience 0.23*
10. Marketing facilities 0.23*
11. Training received 0.22*
12. Mass media exposure 0.26*
13. Source of information 0.13
14. Scientific orientation 0.26*
15. Economic Motivation 0.27
16. Risk Orientation 0.29*
17. Decision making 0.28
Significant at 5% level

JOURNAL OF PLANT DEVELOPMENT SCIENCES VOL. 9 (10) 945
On the basis of „r‟ value Table 3 revealed that the
characteristics namely education, occupation, land
holding, annual income, farm assets, farming
experience, marketing facilities, training received,
mass media use, scientific orientation, economic
motivation, risk orientation and decision making exhibited significant relationship with agribusiness
management behaviour at 0.05% level of
significance. The result also depict that the
characteristics such as age, size of family, social
participation, source of information of the
respondents did not establish significant relationship
with their agribusiness management behaviour of
onion growers.
The findings of Shashidhara et.al (2008), Seeralan et
al (2009) and Jaisridhar et. al. (2012) were in line
with the present findings
CONCLUSION
It may be concluded from the results of the study
that the respondents were managing the agri-
business components such as information seeking
management, information evaluation management,
information preservation management, input
management and technology management in a good
manner while they could not manage the
components i.e. financial management, storage
management, labour management, planning and marketing management to the desired extent .It was
also observed that the attributes education,
occupation, land holding, annual income, farm
assets, farming experience, marketing facilities,
training received, mass media use, scientific
orientation, economic motivation, risk orientation
and decision making were determinants of
agribusiness management behaviour of onion
growers.
REFERENCES
Anitha, B. (2004). A study on entrepreneurial
behaviour and market participation of farm women in
Bangalore rural district of Karnataka. M. Sc. (Agri.)
Thesis, University of Agricultural Sciences,
Bangalore.
Jaisridhar, P. Ravichandran, V., Jadoun, Y.S. and
Kumar, R.S. (2012). Study on adoption and
marketing behaviour of maize growers in Coimbtore
District of Tamil Nadu. Indian Journal of
Agricultural Research. 46 (2): 173-177.
Seeralan, S., Singh, Baldeo, Vijayaragavan, K. and Padaria, R.N. (2009). “Analysis of direct and
indirect effects of factors on agri-business
management behaviour of farmer.” Indian Journal of
Ext. Education. Vol. 45, No. 1&2, pp(59-61)
Shashidhara, K.K. and Manjunath, L. (2008).
“Infuence of socio-personal, economic and
psychological characteristics of vegetable growers on
adoption of eco-friendly management practices.
International Journal of Agricultural Sciences. Vol.
4:2, pp (598-600.).
Singh, D.K., Singh, B.K., Yadav, V.P.S. and Singh, Lotan (2010). “Adoption behaviour of
commercial vegetable growers in district Ghaziabad
(U.P.) Indian Research Journal of Extension
Education; Vol. 10:3, pp (66-70).

946 KRISHN KUMAR VERMA AND SANJAY SINGH

*Corresponding Author
________________________________________________ Journal of Plant Development Sciences Vol. 9 (10) : 947-950. 2017
EFFECT OF BOTANICALS AND BIO-AGENTS ON FUSARIUM OXYSPORUM F.
SP. CICERI CAUSES FUSARIUM WILTS OF CHICKPEA (CICER ARIETINUM L.)
Anmol Singh Yadav1*, Supriya Yadav
2 and Ramesh Singh
2
1. Department of mycology and Plant Pathology, Institute of Agricultural Sciences, Banaras Hindu
University, Varanasi.
2. Department of Plant Pathology, C S Azad University of Agriculture and Technology, Kanpur. Email: [email protected]
Received-03.10.2017, Revised-20.10.2017
Abstract: Chickpea (Cicer arietinum L.) an important pulse crop in the world, is a good source of protein and fixes the atmospheric nitrogen in the fields. It is one of the best crops for arid conditions. Fuasrium wilt, a most severe disease and causes huge losses. The potential of anti-fungal activity of different botanicals and bio-agents were tested in laboratory conditions. Among seven botanicals tested, Palmarosa (Cymbopogon martinii var. motia) with minimum growth of pathogen
and 56.36 per cent of inhibition was found most effective against Fusarium oxysporum f. sp. ciceri followed by others to inhibit the fungal growth in comparison to control. Among the bio-agents, Trichoderma viride inhibits the 62.57 per cent and proved to be best in suppressing the growth of the pathogen followed by others. Keywords: Chickpea, Palmarosa, Bio-agent, Trichoderma viride
INTRODUCTION
hick pea (cicer arietinum L.) or Bengal gram is a
leguminous crop with chromosome number 8. It
is major pulse crop, in India chick pea is grown for
various purposes. It is good source of protein, fiber,
calcium. Chickpea also has advantages in the management of soil fertility, particularly in dry lands
and the semiarid tropics (Singh and Saxena, 1996).
Being a leguminous crop it fixes atmospheric
nitrogen to available of nitrogen. Chick pea suffers
from various diseases like Ascochyta blight, Dry root
rot, wet root rot, botrytis grey mould, chick pea stunt,
in which fusarium wilt is most important disease of
the chick pea causes about 60 per cent yield loses
(Singh et al., 2007). Chickpea wilt is a very serious
disease in India and is widely distributed in 32
chickpea growing countries of the 6 continents viz., Asia, Africa, Europe, North America, South America
and Australia (Nene et al., 1996). F. oxysporum f. sp.
ciceri infects chickpea at seedling stage as well as at
flowering and pod forming stage with more
incidence at flowering and podding stage if the crop
is subjected to sudden temperature rise and water
stress. The fungus is a primarily soil borne pathogen,
however, few reports indicated that it can be
transmitted through seeds (Haware et al., 1978).
Fusarium is also affects various plant spieses and
causes severe loss to them. Many plant posses antifungal and antibacterial property by the
antifungal property we can control the growth of the
fungus, various bio agent are available very easily
and they are restricted the growth and reproduction
of the various pathogen. The management of the
disease through chemicals is very costly and harmful
to the environment. Management through botanicals
and boi agent is very cheap and also eco friendly.
MATERIAL AND METHOD
The investigations based on laboratory and wire
house experiments were undertaken at the
Department of Plant Pathology, C. S. A. University
of Agriculture & Technology, Kanpur, during the
year 2014-15 and 2015-16.
Collection of Sample Naturally infected chickpea plants were collected
from the Oil seed Farm of Kalyanpur, Legume
Research Farm of Nawabganj, Student Instructional
Farm of C.S.A. University of Agriculture and
Technology Kanpur, Indian Institute of Pulses
Research, Kalyanpur, Kanpur and other adjoining
areas of farmer’s fields of Kanpur Nagar and Kanpur
Dehat district during the rabi crop season of 2014-15.
Isolation of Pathogen The affected chickpea roots were used for isolation. The infected roots were thoroughly washed with
sterilized water to remove dust and others surface
contaminations These pieces were thoroughly
washed in 3 to 4 times changes of sterilized water
after that dipping into 0.1 percent Mercuric chloride
solution for 20-30 seconds with the help of sterilized
forceps, then thoroughly and repeatedly washed in 3-
4 changes of sterilized water to remove the last traces
of Mercuric chloride solution. The excess moisture
was removed by drying the pieces between the folds
of sterilized blotting papers. These sterilized pieces were then transferred into the
sterilized Petri-dishes containing 2 per cent potato
dextrose agar medium, 2 to 3 pieces were placed at
an equal distance with the help of sterilized forceps
in poured Petri-dishes and then the Petri dishes were
incubated at 28±1°C temperature. After 24 hours of
incubation period, as soon as white mycelial growth
was visible in different Petri-dishes. It was
transferred into sterilized culture tubes already
C
RESEARCH ARTICLE

948 ANMOL SINGH YADAV, SUPRIYA YADAV AND RAMESH SINGH
containing 2 per cent sterilized potato dextrose agar
medium.
Anti-fungal effect of botanicals against the
pathogen in vitro
The presence of naturally occurring substances in
plants with anti- fungal properties has been recognized and tested against the pathogen. In
present investigation, the efficacy of leaf extracts of
seven plants viz., Palmarosa (Cymbopogon martinii
var. motia), Pipal (Ficus sp.), Eucalyptus (Eucalyptus
sp.), Neem (Azadrachta indica), Garlic (Allium
sativum), Datura (Datura fastussa), Onion (Allium
cepa) and Control (untreated) were tested in vitro for
their antifungal efficacy against growth of Fusarium
oxysporum f.sp. ciceri through poisoned food
technique (Carpenter, 1942; Nene and Thapliyal,
1993). 10 per cent dose of leaf extracts were used
against pathogen (in vitro) by food poision technique. The Fresh leaves of plant species were
collected washed in tap water followed by sterilized
water crushed in sterilized distilled water in 1:1 ratio
(W/V) with mortar and pestle and filtered through 2
layers of muslin cloth to obtained extract. The 100
ml sterilized potato dextrose agar medium mixed
with 10 ml of plant leaf extract contained in 150 ml
conical flask then sterilized in an autoclave at 1.1 kg
pressure/square cm for 5 minutes. Then sterilized
media poured in three sterilized Petri plates and after
solidification 5 ml disc of 7 days old culture of pathogen was transferred into the centre of petridish
and incubated at 28±1°C temperature. PDA not
amended with leaf extract served as control.
Observation on radial growth of the test fungus was
recorded after 10 days of incubation and % inhibition
of growth was calculated using the following cited
formula (Vincent, 1947). All plates were replicated
three times in complete randomized deigns.
Evaluation of bio-agents against the pathogen in
vitro
The culture of bio-agents viz., Trichoderma viride, T.
koningii, T. longibrachiatum, T. harzianum, T. virens, Chaetomium globosum were isolated from the
rhizosphere of chickpea plants of wilt sick plot of
Nawabganj farm, C.S.A.U.A&T., Kanpur.
Antagonistic activity of these bio-agents against test
pathogen was determined by dual culture techniques
Denis and Webster, 1971; Dhingra and Sinclair,
1985), five mm disc of pathogen was taken from the
actively growing colonies of the test pathogen and
antagonist with the help of sterilized cork borer. The disc of the pathogen was placed on one side in agar
plates aseptically and the disc of antagonists was
placed opposite side up, the pathogen in same Petri
plates. All plates were replicated with three times and
were incubated at 26±1 C for 7 days. After
incubation radial growth measured and % inhibition
of growth was calculated using the formula (Vincent,
1947). All plates also replicated three times in
complete randomized design.
I = C – T/C x 100
Where,
I= Percent inhibition. C= Radial growth of test fungus in control plate
T= Radial growth of test fungus in treated plate
RESULT
Effect of Plant Extract
The results revealed that the phytoextract
significantly inhibited the growth of F. oxysporum
f.sp. ciceri at all the tested concentrations. Among of
them, Palmarosa (56.36%) was most effective
against Fusarium oxysporum f. sp. ciceri followed by Pipal (37.27%), Eucalyptus (34.90%), Neem
(31.81%), Garlic (26.36%), Datura (20.36%) and
Onion (8.18%) to inhibit the fungal growth in
comparison to control.
Effect of Bio Agent
The results revealed that the antagonists significantly
reduced the growth of F. oxysporum f.sp. ciceri
either by exhibiting inhibition zones. Among of them
the suppression of the growth of pathogen was
maximum with Trichoderma viride (62.57%)
followed by Trichoderma koningii (58.15%),
Trichoderma harzianum (56.80%), Trichoderma longibrachiatum (50.42%) and Trichoderma
hamatum (44.78%). The least effective bio-agent was
Chaetomium globosum (40.61%).
Table 1. Evaluation of plant leaf extracts against the pathogen oxusporum f. sp. ciceri in vitro after 10 days of
incubated at 28±1°C
S. No. Plant leaf extracts Dose % Average diameter of
fungal colony (cm)
Per cent
inhibition
1. Palmarosa (Cymbopogon martinii
var. motia)
10 2.40 56.36
2. Pipal (Ficus sp.) 10 3.45 37.27
3. Eucalyptus (Eucalyptus sp.) 10 3.58 34.90
4. Neem (Azadrachta indica) 10 3.75 31.81
5. Garlic (Allium sativum) 10 4.05 26.36
6. Datura (Datura fastussa) 10 4.34 20.36
7. Onion (Allium cepa) 10 5.05 8.18
8. Control (untreated) 5.50
C.D at 5% 0.1986

JOURNAL OF PLANT DEVELOPMENT SCIENCES VOL. 9 (10) 949
Table 2. Inhibiting effect of different bio-agents on the growth of Fusarium oxusporum f. sp. ciceri in vitro
incubated of 28±10C.
S. No. Bio-agents Average
diameter of
fungal
colony(cm)
Per cent inhibition over
control
1. Trichoderma viride + Fusarium oxysporum f.
sp. Ciceri
3.05 62.57
2. Trichoderma koningii + Fusarium oxysporum f. sp. ciceri
3.41 58.15
3. Trichoderma harzianum + Fusarium oxysporum
f. sp. ciceri
3.52 56.80
4. Trichoderma longibrachiatum + Fusarium
oxysporum f. sp. ciceri
4.04 50.42
5. Trichoderma hamatum + Fusarium oxysporum
f. sp. ciceri
4.50 44.18
6. Chaetomium globosum + Fusarium oxysporum
f. sp. ciceri
4.84 40.61
7. Control 8.15
C.D. at 5% 0.2714
DISCUSSION
Chick pea (Cicer arietinum L.) is major rabi pulse
crop growing in India. Madhya Pradesh, Uttar
Pradesh, Bihar, Maharashtra are major chick pea
growing states. Fusarium wilt causes severe losses to
chick pea crop in Indian sub continents. Management of fusarium wilts through easily available plants
having antifungal property and boi-agents are
economical as well as good for environment.
Leaf extract of seven different plant species were
evaluated in vitro against the pathogen. Among these
leaf extract viz., Palmarosa (56.36%) was most
effective against Fusarium oxysporum f. sp. ciceri
followed by Pipal (37.27%), Eucalyptus (34.90%),
Neem (31.81%), Garlic (26.36%), Datura (20.36%)
and Onion (8.18%) inhibiting the fungal growth.
These results are similar to those as reported by
Kamal Kanha et al. (2001), Devi and Paul (2003, 2005), Surendra and Harichand (2004), Sahani and
Saxena (2009), Patra and Biswas(2017).
Six bio-control agents were evaluated in laboratory
conditions. Among them, Trichoderma viride
(62.57%) gave the best results in checking the
growth of Fusarium oxysporum f. sp. ciceri followed
by Trichoderma koningii (57.75%), Trichoderma
harzianum (56.80%), Trichoderma- longibrachiatum
(50.42%), Trichoderma hamatum (44.78%) and
Chaetomium globosum (40.61%). Similar findings
were also reported by Velikamov et al., (1994), Gaurdar et al., (2000), Prasad et al., (2003), Vaidya
et al., (2004), Nikam et al., (2007), Bouraghda, and
Bouznad, (2009).Patra and Biswas(2017).
Through these findings, famers will be benefitted by
using the above mentioned plants and bio-agents for
the management of Fusarium wilt of chick pea.
REFERENCES
Boureghda, H. and Bouznad, Z. (2009). Biological
control of Fusarium wilt of chickpea using isolates of
Trichoderma atroviride, T. harzianum and T.
longibrachiatum. Acta-Phytopathologica-et-
Entomologica-Hungarica. 44(1): 25-38. Devi, Meena and Paul, Y. S. (2003, 2005).
Management of pea wilt/root knot complex by
integrating plant extracts and biocontrol agents.
Integrated Plant extracts and biocontrol agents.
Integrated Plant Disease Management. Challenging
Problems in Horticultural and Forest Pathology,
Solan, India, pp. 101-105.
Gourdar, S. B., Kulkarni, Srikant and Kulkarni,
S. (2000). Bioassay of antagonists against Fusarium
udum, the causal agent of pigeonpea wilt, Karnataka
J. Agric. Sci., 13(1) : 65.67.
Haware, M. P., Nene, Y. L. and Rajeswari, R. (1978). Eradication of Fusarium oxysporum f. sp.
ciceris transmitted in chickpea seed. Phytopathol.,
68: 1364-1368.
Kamal Kanhan, A., Shanmygam, V., Surendra,
M. and Srinivasan, R. (2001). Evaluation of plant
extracts against Pyricularia oryzae. Ann. Pl. Protect.
Sci., 9 (1): 68-72.
Nene, Y.L., Sheila, V.K. and Sharma, S.B. (1996).
A world list of chickpea and pigeonpea pathogens.
ICRIAT Hyderabad, India.
Nikam, P. S., Jagtap, G.P. and Sontakke, P.L. (2007). Management of chickpea wilt caused by
Fusarium oxysporium f. sp. ciceri. African-Journal-
of- Agricultural-Research. 2(12): 692-697.
Patra, S. and Biswas, M. K. (2017). Eco-Friendly
Management of Fusarium oxysporum f. sp. ciceri the
Causal Agent of Chickpea Wilt Disease under In-

950 ANMOL SINGH YADAV, SUPRIYA YADAV AND RAMESH SINGH
vitro Condition. Int. J. Curr. Microbiol. App.
Sci, 6(3):1852-1858.
Prasad, C. S., Gupta, Vishal, Tyagi, Ashish and
Pathak, Santosh (2003). Biological control of
Sclerotium rolfsii sacc., The incident of cauliflower
collar rot. Ann. Pl. Protect. Sci., 11(1) : 61-63. Sahani, R. K. and Saxena, A. R. (2009). Fugitoxic
properties of medicinal and aromatic plants against
fusarium oxysporum f. sp. pisi. Ann. Pl. Protect. Sci.,
17 : 146-148.
Singh, K.B. and Saxena, M.C. (1996). Winter
chickpea in Mediterranean type environments. A
Technical Bulletin, International Centre for
Agricultural Research in Dry Areas, Aleppo, Syria,
39.
Singh, Y. P. and Sumbali, Gupta (2007). Efficacy
of leaf extract and essential oils of some plant species
against Penicillium expansum rot of apples. Ann. of Pl. Protec. Sci., 15 (1) : 135-139.
Surendra, Singh and Hari, Chand (2004). Effect of
extracts of some medicinal plants on spore
germination of chickpea wilt pathogen (Fusarium
oxysporum f. sp. ciceri (Pad.) Snyd. and Hans.
Indian-Journal-of-Plant- Protection.; 32(1): 162-
163.
Vaidya, Manita, Shamagan, V. and Gutati,
Arvind (2004). Evaluation of bio-control agents
against Fusarium isolates infecting carnation and
gladiolus. Ann. Pl. Protect. Sci., 12 (2): 614-320.
Velikanov, L. L., Cukhonosenko, E. Ya,
Nickolaeva, S. I. and Zavlisko, I. A. (1994).
Comparision of hyper parasite and antibiotic activity
of the genes Trichoderma Per : Fr and Gliocladium
virence Miller Giddena et foster isoloates towards the
pathogen causing root rot of pea. Miklogiya-
Phytopatologiya, 28 : 52-56.

*Corresponding Author
________________________________________________ Journal of Plant Development Sciences Vol. 9 (10) : 951-954. 2017
PEOPLE PERCEPTION ON THE USE OF HOUSEHOLD COPING STRATEGIES
AGAINST SHOCKS: A CASE STUDY OF FOREST RESOURCES USE IN
GARHWAL HIMALAYA
Sushma Rawat1*, Munesh Kumar
1, Rajiv Pandey
2 and Bhuvnesh Nagar
1
1HNB Garhwal University, Srinagar-Garhwal, Uttarakhand 246 174, India
2ICFRE, Dehradun, Uttarakhand 248 006, India
Email: [email protected]
Received-10.10.2017, Revised-24.10.2017
Abstract: The present study investigates the use of forest resources as well as other coping strategies opted by rural households against addressal of shocks in securing and sustaining livelihoods. Multistage random sampling was applied for selection of blocks, villages and households (the primary sampling unit) in Garhwal Himalaya. The primary data on the
forest resource use and coping strategies against the different types of household shocks were collected from 454 households using semi-structured questionnaire followed by discussions with local people during 2014-2016. The primary results of the study revealed that the rural households practice different strategies to minimize the adverse effect of shocks and use of forest resources for addressing household shocks. The result estimates of the study will be helpful in framing policies regarding evaluation of shocks and also development of mechanism to minimize the impact of shocks at household as well as at community level in Himalayan region.
Keywords: Addressal of shocks, Coping strategies, Forest conservation, Sustainability
INTRODUCTION
raditionally, forests are critically important
assets for supporting rural livelihoods (Agrawal
et al., 2013) through supplying variety of products,
services, and benefits for their use (FAO, 2005). The
role of forest resources in household economies and
for mitigating the poverty of rural areas in
developing countries is important and also flagged
as critical assets by the policy-makers around the
globe (Das, 2010; Angelsen et al., 2014). Moreover,
it is pertinent to note that rural households adopt a range of strategies such as adjusting their household
chores and managing natural resources to safeguard
their livelihoods during adversities (Ellis, 2000).
Forest resource use in Garhwal Himalaya has been
examined by many researchers (Pandey, 2009;
Sharma et al., 2009), however, their characterization
within the limits of mix of natural and man-made
resources accessibility and availability has not been
briefly assessed (Pandey et al., 2014; Angelsen et al.,
2014). Moreover, forest resource use by rural
inhabitants against the shocks has not been examined potently and addressed very intermittently and scanty
manner in Asian region (Rahut et al., 2016), though
excellent work has been carried out in other parts of
globe on the issue with acknowledging the mitigation
potential role of forests in minimizing the impact of
household shocks (Debela et al., 2012; Kalaba et al.,
2013).
In this context to understand the use of forest
resources as coping strategies in response to
household shocks, the present study was undertaken
with the hypothesis to evaluate use of various coping
strategies used by households for addressing the household shocks. More briefly to confirm the
hypothesis and to understand the role of forest
resources in rural livelihood, the present study
attempts to analyze the various rural household
shocks and forest resource based coping mechanism
in response to shocks. The findings of the study will
assist policy planners for the formulation of suitable
policy and programmes for forest conservation as
well as sustainable forest resource use strategy with
focus on creating awareness about the diverse role of
forests particularly during household shocks.
MATERIAL AND METHOD
The present study was carried out in two districts of
Garhwal Himalayan region of Uttarakhand i.e.,
Rudraprayag (spread between 30˚19’ to 30˚49’ N
latitude and 78˚49’ to 79˚21’ E longitude in an area
of 2439 km2) and Pauri Garhwal (spread between
29˚45’ to 30˚15’ latitude and 78˚24’ to 79˚23’ E
longitude in an area of 5230 km2). Primary data on
rural household shocks and different coping
strategies used during shocks was collected through
household survey from 454 randomly selected rural households from randomly selected villages located
in the range of 400-2200 m asl altitude of Pauri
Garhwal and Rudraprayag district during the year
2014-2016. All the surveyed villages generally lacks
in basic infrastructure such as road connectivity in
terms of transportation, banking and hospital services
due to remoteness.
A semi-structured questionnaire was developed and
tested in collaboration with 53 households before the
survey to collect data for addressing the various rural
household shocks faced during last five years by
rural households and the corresponding use of forest resources. Further the noted changes were made with
T
RESEARCH ARTICLE

952 SUSHMA RAWAT, MUNESH KUMAR, RAJIV PANDEY AND BHUVNESH NAGAR
respect to the requirement of study. The
questionnaire consists two parts i.e., (i) Various
household shocks (ii) Different coping mechanism to
minimize the effect of shocks and forest resource
use. Shocks can be defined as any situation or
condition that affect human well being as well welfare mechanism (Dercon, 2002; Debela et al.,
2012). In the present study loan, unemployment and
marriage were identified as shock based on pilot
survey as well as available literature. In general loan
can be defined as a situation of borrowing money
from people or from other source which is to be
returned back within a fixed period whereas
unemployment creates shortage of money due to
unavailability of job. During the survey households
identified marriage as a shock due to involvement of
huge amount of expenditure.
The respondents, generally the head of selected households were approached and face to face
interviews were conducted by the first researcher at
the informant’s house, in Hindi or local dialect
(Garhwali), as per the convenience of respondent. All
informants interviewed were informed about the
purpose of the interview and gave their oral consent
for being interviewed. The descriptive statistics was
analyzed using Statistical Product and Service
Solutions (SPSS 21) software.
RESULT AND DISCUSSION
Household shocks
Rural households in the study region face various
types of adversities (economically and socially),
influencing the household welfare mechanism as
pointed out by villagers during survey. Most of the
households reported that they were affected by more
than one type of shock which has long term and short
term disturbances on their livelihood mechanism.
These disturbances were mitigated by various prevailing as well as new and innovative coping
strategies. These strategies facilitate them to
overcome from the situation and also assist to
safeguard their welfare. Based on the study by
Tongruksawattana et al. (2010) the shocks addressed
by rural households were categorized into economic
and social shock. In the present study various shocks
observed were loan and unemployment under the
economic shock whereas marriage under the social
shock.
The study results show that the majority of the
households reported that they were severely affected by marriage activities due to unemployment and
loan. The number of affected households by shocks
was addressed more in lower altitude. Households in
the study region used different strategies to overcome
the situation arising due to unexpected expenditure
and damages or losses. The study results also show
that the households were able to cope up with the
adversities related to studied shocks. Altitude wise
proportion of households using different coping
strategies during shocks is provided in Table 1.
Similar findings regarding the use of various coping strategies to minimize the effect of shocks have also
been reported by various researchers for rural poor
households of different parts of the world (Dercon,
2002; Fafchamps, 2003; Debela et al., 2012).
Table 1. Households using different coping strategies during shocks
Parameter Altitude
Shock type
Economic Social
Loan Unemployment Marriage
Affected households
(in numbers)
Lower 24 38 58
Middle 10 40 52
Higher 6 12 23
Coping strategies (%)
Internal resource use
Lower 16.7 42.1 93.1
Middle 40.0 22.5 82.7
Higher 16.7 25.0 95.5
Labour work
Lower 45.8 76.3 46.6
Middle 70.0 97.5 55.8
Higher 16.7 83.3 27.3
Forest resource use
Lower 16.7 44.7 91.4
Middle 40.0 52.5 86.5
Higher 0.0 41.7 95.5
Lower = 400-1000m, Middle = 1000-1600m, Higher = 1600-2200m
Coping strategies used during various observed
shocks
In the present study results of the analysis reported
that households adapt the situation first by using

JOURNAL OF PLANT DEVELOPMENT SCIENCES VOL. 9 (10) 953
mechanisms such as use of internal resource i.e.,
income saving, livestock for milk and meat, then by
the engaging themselves in labour work as well as by
the use of forest resources for maintaining livelihood
security. Overall results reported that the use of
internal resources and forest resources as coping
strategy was observed maximum during marriage
followed by unemployment and loan while use of
labor work as coping strategy was observed
maximum for unemployment followed by marriage
and loan (Figure 1).
Figure 1. Overall number of households using different coping strategies during shocks
In India various researchers reported that forest are
the base for rural livelihoods through providing
various provisioning services help in subsistence and
income generation (Saxena, 2003; Saha and Sundriyal, 2012; Banerjee and Chowdhury, 2013).
Similar studies have also been reported by Arnold
and Ruiz-Perez (1998) and Arnold et al. (2011) that
agricultural communities worldwide use of forest
resources for consumption purpose particularly
during ecological. Most of the literature on forest
based livelihoods has also highlighted the importance
of forest resources to rural households in minimizing
poverty particularly during lean season (De Beer and
Mcdermott, 1996; Angelsen and Wunder, 2003;
Rahut et al., 2016), or during shocks (Debela et al., 2012; Kalaba et al., 2013; Rahut et al., 2016).
Cavendish (2000) has also reported in a study that
forests helps in providing employment to poor and
contributes significantly to the rural economy
particularly during adverse situations besides income
generation.
CONCLUSION
The findings of the study revealed that rural
households of Garhwal Himalaya use various coping
strategies such as internal resource use, labour work and forest resource use during shocks. Though
different coping strategies contributed to overcome
the situations arising due to shock, but the use of
forest resources as coping mechanisms was observed
maximum to overcome the expenditure due to
marriage activities. Thus the results of the study
conclude that forest contributions are important for
rural people during adversities. The findings of the
study will also be helpful in framing policies regarding shock evaluation and mechanism
development to minimize the impact of shocks at
household as well as at community level in
Himalayan region.
REFERENCES
Agrawal, A.; Cashore, B.; Hardin, R.; Shepherd,
G.; Benson, C. and Miller, D. (2013). Economic
contributions of forests. Background Paper 1. United Nations Forum on Forests.
(http://www.un.org/esa/forests/pdf/session_document
s/unff10/EcoContrFore sts.pdf) (retrieved
10/6/2017).
Angelsen, A.; Jagger, P.; Babigumira, R.; Belcher,
B.; Hogarth, N.J.; Bauch, S.; Borner, J.; Smith-
Hall, C. and Wunder, S. (2014). Environmental
income and rural livelihoods: a global-comparative
analysis. World Development, 64: S12-S28.
Angelsen, A. and Wunder, S. (2003). Exploring the
forest-poverty link: Key concepts, issues and
research implications. CIFOR Occasional Paper 40. Bogor: Center for International Forestry Research.
Arnold, J.E.M. and Ruiz-Perez, M. (1998). The
role of NTFPs in conservation and development. In:
Wollenberg, E., Ingles, A. (Eds.), Incomes from the
Forest. Methods for the Development and
0
20
40
60
80
100
120
140
Loan (n=40) Unemployment
(n=90)
Marriage (n=133)
Economic Social
Nu
mb
er o
f h
ou
seh
old
s
Shocks
Internal resource
Labour work
Forest resource use

954 SUSHMA RAWAT, MUNESH KUMAR, RAJIV PANDEY AND BHUVNESH NAGAR
Conservation of Forest Products for Local
Communities. Centre for International Forestry
Research (CIFOR), Bogor, Indonesia.
Arnold, M.; Powell, B.; Shanley, P. and
Sunderland, T.C.H. (2011). Editorial: Forests,
biodiversity and food security. International Forestry Review, 13(3): 259-264.
Banerjee, A. and Chowdhury, M. (2013). Forest
degradation and livelihood of local communities in
India: A human rights approach. Journal of
Horticulture and Forestry, 5(8): 122-129.
Cavendish, W. (2000). Empirical regularities in the
poverty–environment relationship of rural household:
evidence from Zimbabwe. World Development,
28(11): 1979-2003.
Das, N. (2010). Incidence of forest income on
reduction of inequality: evidence from forest
dependent households in milieu of joint forest management. Ecological Economics, 69: 1617-1625.
De Beer, J. and Mcdermott, M. (1996). The
economic value of non-timber forest products in
Southeast Asia. Amsterdam: IUCN; 197 pp.
Debela, B.; Shively, G.; Angelsen, A. and Wik, M. (2012). Economic shocks, diversification and forest
resource use in Uganda. Land Economics, 88(1):
139-154.
Dercon, S. (2002). Income risk, coping strategies,
and safety nets. World Bank Research Observer,
17(2): 141-166. Ellis, F. (2000). The determinants of rural livelihood
diversification in developing countries. Journal of
Agricultural Economics, 51: 289-302.
Fafchamps, M. (2003). Rural Poverty, Risk and
Development. Cheltenham, UK: Edward Elgar.
FAO (2005). State of the world’s forests 2005.
Rome: Food and Agricultural Organization.
Kalaba, F.K.; Quinn, C.H. and Dougill, A.J. (2013). The role of forest provisioning ecosystem
services in coping with household stresses and
shocks in Miombo woodlands, Zambia. Ecosystem
Services, 5: e143-e148.
Pandey, R. (2009). Forest resource utilization by tribal community of Jaunsar, Uttarakhand. Indian
Forester, 135(5): 655-662.
Pandey, R.; Harrison, S. and Gupta, A.K. (2014).
Resource Availability Versus Resource Extraction in
Forests: Analysis of Forest Fodder System in Forest
Density Classes in Lower Himalayas, India. Small-
scale Forestry, 13(3): 267-279.
Rahut, D.B.; Behera, B. and Ali, A. (2016). Do
forest resources help increase rural household
income and alleviate rural poverty? Empirical
evidence from Bhutan. Forests, Trees and
Livelihoods, 25(3): 187-198 Saha, D. and Sundriyal, R.C. (2012). Utilization of
non-timber forest products in humid tropics:
Implications for management and livelihood. Forest
Policy and Economics, 14:28-40.
Saxena, N.C. (2003). Livelihood Diversification and
Non-timber Forest Products in Orissa: Wider
Lessons on the Scope of Policy Change. London:
Livelihood Strategy Paper, DFID and ODI.
Sharma, C.M.; Gairola, S.; Ghildiyal, S.K. and
Suyal, S. (2009). Forest resource use patterns in
relation to socioeconomic status: A case study in four temperate villages of Garhwal Himalaya, India.
Mountain Research and Development, 29(4): 308-
319.
Tongruksawattana, S.; Waibel, H. and Schmidt,
E. (2010). Shocks and Coping Actions of Rural
Households: Empirical Evidence from Northeast
Thailand. CPRC International conference.

*Corresponding Author
________________________________________________ Journal of Plant Development Sciences Vol. 9 (10) : 955-958. 2017
IMPACT OF PARTICIPATORY SEED VILLAGE PROGRAMME ON ADOPTION
LEVEL OF WHEAT SEED PRODUCERS IN REWA DISTRICT (M.P.)
R.P. Joshi1, Sanjay Singh
2* and Nirmala Singh
2
1College of Agriculture Rewa, JNKVV (M.P.) 2Krishi Vigyan Kendra Rewa JNKVV IM.P.)
Received-03.09.2017, Revised-20.09.2017
Abstract: The word seed or seeds may be defined as all propagating materials used in any kind of cultivation. The seed is considered as most precious input in agriculture. The quality seed availability at desired time determines the sustainable crop productivity growth. It has been observed that presently about 80- 85% of the seeds used by the farmers is their own farm produced seeds and which is managed and conserved by the farmers from his own produce for future use.. Due to
poor quality of seed with low germination capacity of seed the crop growth is affected adversely which eventually reduces the productivity of the crop. Despite implementation of the organized seed program since the mid 60s, the seed replacement rate has touched the level of 15 per cent. only .In view of the above facts it has been realized that the availability of genetically good quality of seed materials are of great importance to improve the quality of farm saved seed. In order to accelerate the seed replacement rate of desired genetic seed materials Krishi Vigyan Kendras through its participatory Seed Village Programme was implemented by Krishi Vigyan Kendras of M.P. in the year 2006-07 and continued till 2011-12. Under this programme about twenty villages were covered. The seeds of high yielding varieties along with recommended seed production technologies were demonstrated at farmers‟ field. Besides this capacity building programmes were also conducted at critical stages of the crops. Since regular follow up and evaluation is a necessary concomitant of
such programme to assess the impact and suggest strategy for further growth and expansion of the programme the present investigation entitled “The impact of participatory seed village Programme on adoption behaviour of wheat seed producers in Rewa district (M.P.)” was under taken to assess the impact of the programme on adoption behaviour of seed producers. The study was based on 120 respondents (60 beneficiaries and 60 non-beneficiaries as control) covering 10 villages of Rewa block of Rewa district for analyzing the impact of Seed Village Programme on adoption behaviour of seed producers.. The ex-post facto research design was adopted in this research work. The responses were obtained by administering a pretested interview schedule .The findings inferred there was significant difference between beneficiaries and non-beneficiaries as regards to extent of adoption of seed production technology. The beneficiaries had greater extent of
adoption than non-beneficiaries. Correlation coefficient between independent variables and extent of adoption as dependent variable elucidated that knowledge, risk orientation, marketing orientation, attitude towards agricultural technology, extension participation, mass media exposure, innovativeness, education, land holding and annual income had positive and significant relationship with adoption behaviour of both the categories i.e. beneficiaries and non beneficiaries. Social participation and family type had negative and significant relationship with extent of adoption. Keywords: Seed Production Technology, Krishi Vigyan Kendras , Adoption behaviour
INTRODUCTION
ndia remains mainly an agrarian economy in spite
of intensive planned efforts to urbanization and
industrialization. In the agrarian economy,
agriculture exports have shown great significance
and foreign trade has depicted dynamic character.
The word seed or seeds may be defined as all
propagating materials used in any kind of cultivation.
The seed is considered as most precious input in agriculture. The quality seed availability at desired
time determines the sustainable crop productivity
growth. It has been observed that presently about
80- 85% of the seeds used by the farmers is their
own farm produced seeds and which is managed
and conserved by the farmers from his own produce
for future use.. Due to poor quality of seed with low
germination capacity of seed the crop growth is
affected adversely which eventually reduces the
productivity of the crop. Despite implementation of
the organized seed program since the mid 60s, the
seed replacement rate has touched the level of 15 per cent only. In view of the above facts it has been
realized that the availability of genetically good
quality of seed materials are of great importance to
improve the quality of farm saved seed.
Government of India initiated various policy
measures which contributed in the growth of seed
industry in India. From a few units there has been a
tremendous rise (more than 200 seed companies in
private sector) in number of seed companies and
corporations. Quality seed production was recorded
346.36 lakh quintals and 353.62 lakh quintals in 2012-13 and 2013-14, respectively .In order to
accelerate the seed replacement rate of desired
genetic seed materials Krishi Vigyan Kendras
through its participatory Seed Village Programme
was implemented by Krishi Vigyan Kendras of M.P.
in the year 2006-07 and continued till 2011-12.
Under this programme about twenty villages were
covered. The seeds of high yielding varieties along
with recommended seed production technologies
were demonstrated at farmers‟ field. Besides this
capacity building programmes were also conducted
at critical stages of the crops. Since regular follow up and evaluation is a necessary concomitant of such
I
RESEARCH ARTICLE

956 R.P. JOSHI, SANJAY SINGH AND NIRMALA SINGH
programme to assess the impact and suggest strategy
for further growth and expansion of the programme
the present investigation entitled “The impact of
participatory seed village Programme on adoption
behaviour of wheat seed producers in Rewa district
(M.P.)” was under taken to assess the impact of the programme on adoption behaviour of seed producers
Review of Literature Singh (1983) studied 300 adopters and 150 non
adopter‟s farmers of Sehore district to find out the
impact of modern technology on production
employment and income in agriculture. His study
revealed that gross income per hectare for the farm
business as a whole was 98% more on adopter farms
than the non adopters, similarly, the intensity of
cropping was higher (164.34%) among adopter
farms than the non-adopter farms(132.59%)
respectively Dhillon and Kumar (2004) reported that maximum
number of respondent (44.17%) were observed to
have medium extent of adoption in terms of area
under the crop, 26.67 per cent and 19.17 per cent
were found to have low and high extent of adoption,
respectively. Level of adoption was medium for
nearly half of the respondents (49.17%) whereas
32.50 per cent and 18.33 per cent farmers had and
high level of adoption, respectively
Manoj and Sharma (2004) stated that majority of
small respondents had medium level of adoption about improved practices of gram cultivation,
whereas majority of the marginal farmers had low
level of adoption as compared to big and small
farmers.
Singh et al. (2005): observed that the adoption of
recommended varieties of wheat viz., Sonalika, K-
65, C-306. Mukta were found to the level of 41.33
per cent of the total sample farmers, followed by
paddy and gram.
METHOD AND MATERIAL Ex-post-facto research design was used in the
present investigation. It is a systematic inquiry in
which researcher does not have direct control of
independent variables because their manifestation
have already occurred and they cannot be
manipulated. The present study was carried out using
ex-post facto research design during 2015-16 in the
purposively selected Rewa district of M.P. as the
participatory Seed Village Programme. was
implemented in this district. The sample population
consisted 120 (60 beneficiaries and 60 non beneficiaries) were selected from 10 villages of
Rewa block of Rewa district. The statistical tools
were used for determining the extent of knowledge
on three points continuum as full, partial, and non-
adoption. The independent variables represented
personal, socio-economic and psychological
characteristics of the respondents and were
empirically measured by procedures evolved by
earlier researchers. A structured and pre-tested
interview schedule was used to collect data from the
respondents by personal interview method.
Co-Efficient of Correlation (‘r’ Value) Co-efficient of correlation was computed to find out
the relationship between the variables. The
correlation coefficient gives two kinds of
information (i) degree of the relationship and (ii)
direction of the relationship (whether positive or
negative) between any two variables.
For computing the correlation coefficient „r‟ the Karl
Pearson method was used
Z Test To test the hypothesis z test was used because of the
large sample size. This test was used to find out if there were any significance difference between
beneficiaries and non-beneficiaries as regarding their
knowledge and adoption of seed production
technology.
RESULT
Extent of adoption regarding seed production
technology of wheat among beneficiaries and non
beneficiaries
Adoption is a decision made by an individual or group to use an innovation in a continuous manner.
Adoption is regarded by Rogers (1995) as a decision
to make full use of an innovation or technology as
the best course of action available. Adoption of
innovation is the decision of an individual or group
to use or apply an innovation. Modern agriculture
requires an innovative technology which
systematically adopts scientific knowledge to
farming. In the present study the adoption refers to
the actual implementation or use of the location
specific seed production technologies of wheat
disseminated to them in training programmes through various activities of seed village programme
conducted by Krishi Vigyan Kendra Rewa (M.P.).
Hence in the present study a scale as in case of was
used consisting the recommended components of
seed production technology of wheat crop. While
administering the final adoption test of respondents
score „3‟ was assigned for a complete adoption
answer “2‟ for partial adoption and score „0‟ (zero)
was assigned for non adoption for each practice. The
summation of scores of all selected components of
seed production technologies of wheat for a respondent was taken as his extent of adoption level.
Based on the extent of adoption scores obtained
(maximum and minimum) on the scale, respondents
were classified into three following categories

JOURNAL OF PLANT DEVELOPMENT SCIENCES VOL. 9 (10) 957
S. No. Level of adoption Score range
1. Low Up to 33
2. Medium 34-60
3. High Above60
Table 1. Overall adoption regarding seed production technology of wheat among beneficiaries and non
beneficiaries
S. No
Categories
of
Level of
adoption
Beneficiaries Non- Beneficiaries
Frequency Percentage Frequency Percentage
1
Low (Up to 33) 10 16.66 28 46.66
2
Medium (34-60) 13 21.67 19 31.67
3
High (above 60) 37 61.66 13 21.67
Total 60 100.00 60
100
Mean adoption score of beneficiaries 57.9 & Mean adoption score of non beneficiaries 44.3
S.d1=12.60 S.d2=9.15
Z test= 2.97 Tabulated value at 5%=1.96
It is clear from the Table 3 that of out of 60
beneficiaries 61.66 per cent had high extent of
adoption followed by 21.67 percent medium and
16.66 percent low adoption. In case of non-
beneficiaries 48.66 per cent respondents were having
low, 31.67 percent medium and 21.67 per cent had
high extent of adoption. Thus, it may be inferred
from the above observation that higher percentage of
beneficiaries were found to have had higher extent of
adoption as compared to non-beneficiaries. In order to find out if there was a significant
difference between beneficiaries and non-
beneficiaries as regards to their overall extent of
adoption, the null hypothesis (ho) i.e. there was no
significant difference between beneficiaries and non-
beneficiaries as regards their extent of adoption of
seed production technology was tested. The
calculated value of Z test was found to be 2.97 which
was greater than the table value of z (1.96) at 5 %
level of significance. Hence, the null hypothesis (Ho)
was rejected and the alternate hypothesis was
accepted.
It may be concluded that there was significant
difference between beneficiaries and non-
beneficiaries as regards to extent of adoption of seed production technology. The beneficiaries had greater
extent of adoption than non-beneficiaries. The
findings are in the conformity of the findings of
Manoj and Sharma (2004), Bussain et al, (2009) and
Burman el al. (2010).
Relationship between independent variables and adoption behavior of seed producers
Table 2. Correlation between independent variables and adoption behavior of seed producers
S.N. Independent Variable Beneficiaries Non- beneficiaries
1 Age 0.076NS -0.028NS
2 Education 0.24* 0.21*
3 Land holding 0.29** 0.28**
4 Social participation -0.28** -0.37**
5 Size of family -0.36** -0.29**
6 Annual income 0.31** 0.31**
7 Marketing orientation 0.36** 0.44*
8 Attitude towards 0.274** 0.315**
9 Risk orientation 0.35** 0.38**
10 Innovativeness 0.46** 0.360**
11 Mass media exposure 0.29** 0.34*

958 R.P. JOSHI, SANJAY SINGH AND NIRMALA SINGH
12 Extension participation 0.33** 0.40**
13 Knowledge 0.39** 0.42**
NS= Non-significant
** = Significant at 1%
*= Significant at 5%
Correlation coefficients between independent
variables and extent of adoption as dependent
variable are presented in Table 2. The table elucidated that knowledge, risk orientation,
marketing orientation, attitude towards agricultural
technology, extension participation, mass media
exposure, innovativeness, education, land holding
and annual income had positive and significant
relationship with adoption behaviour of both the
categories i.e. beneficiaries and non beneficiaries.
Social participation and family type had negative and
significant relationship with extent of adoption,
while age had negative and non-significant
relationship.. These findings of the present
investigation are in the conformity with the findings of Shakya (2008) and Maraddi (2009).
CONCLUSION
It may be concluded from the above findings that the
adoption behavior of beneficiaries about seed
production technology was significantly higher than
non-beneficiaries and the non-beneficiaries were
found to be ignorant about some important aspects of
technological practices. The study has brought into
focus some attributes of the farmers viz. knowledge, risk orientation, marketing orientation, attitude
towards agricultural technology, extension
participation, mass media exposure, innovativeness,
education, land holding and annual income which
influenced positively the adoption of -seed based
technology programme. On the light of the results of
this research work it may be recommended that the
modal farms, demonstrations plots and seed farms
are introduced in the community development blocks to serve the farmers as key centers of technological
information and in the process of diffusion of
innovations.
REFERENCES
Ahmad, shah, Ajaz and Tripathi, Raj bahadur
(2009). Socio-personal characteristics of farmers and
adoption of improved farm practices in saffron. Agri.
Update, 9 (1 & 2): 194-196.
Barodia, A.R. (2005). A study on adoption
behaviour of cereal growers in relation to scientific technology in Phanda block of Bhopal district.
M.Sc. (Ag.) Thesis, JNKVV, Jabalpur.
Kushwaha, R.G. (2003). Behaviour of vegetable
growers towards plant protection measures in
solanacious crops in Ghatigoas block of Gwalkior
district, M.P. M.Sc. (Ag.) thesis (unpublished),
JNKVV, Jabalpur.
Maraddi (2009). Analysis of the determinants of
adoption of seed production programmes ,Trends in
adoption pattern in Bhutan :152-155
Singh, Meenakshi Choudhary and J.P. Lakhera (2009-10). Knowledge and Attitude Farmers
Towards Improved Wheat Production Technology
Indian Res. J. Ext. Edu. 14
Shakya, R.S. (2008). Determinants of decisions:
The case of seed programme in Bangladesh.
Extension Farming Systems Journal 8 (2) :210-219.

*Corresponding Author
________________________________________________ Journal of Plant Development Sciences Vol. 9 (10) : 959-961. 2017
ENHANCEMENT OF PRODUCTION AND PRODUCTIVITY OF SOYBEAN
THROUGH THE CLUSTER FRONT LINE DEMONSTRATION OF OILSEED
V.K. Jain1, H.K. Trivedi
1 and B.S. Gupta*
1Scientists and *Senior Scientist & Head, KVK Ashoknagar (M.P.)
Received-12.10.2017, Revised-25.10.2017 Abstract: Cluster front line demonstrations on soybean were organized in the kharif seasons of year 2015-16 different villages of Ashoknagar district by Krishi Vigyan Kendra, Ashoknagar for creating awareness among the farmers to popularize the high yielding variety of soybean. In this context, centre was conducted demonstration to assess the improved varieties of soybean JS 9560 along with existing varieties used by the farmers as local check in the district. The farmers
followed the full package of practices like proper seed rate, seed treatment with biofertilizer, fertilizer application on soil test value, weed management, IPM practices etc. Result of front line demonstrations indicated that on an average of 25% more yield of soybean was found as compared to farmer’s practices.The number of productive pods per plant of JS 9560 soybean was found 52.7 and non-productive pods per plant 7.9 under package of improved practices. The economic analysis of data over the years revealed that the adoption of improved technology of soybean not only gives the opportunity of higher yield, but also provides higher benefit cost ratio i.e. 1.62 as compared to 1.37 in the farmer’s practices. Keywords: CFLDs, Soybean, Front Line Demonstration, Ashoknagar
INTRODUCTION
oybean (Glycine max Merrill) is a legume that
grows in tropical, subtropical and temperate
climate. It occupies third position among the oilseed
crop in India after groundnut and rapeseed mustard.
Madhya Pradesh has its major share in area (70%)
and production (65%) of soybean in India (Sharma
Saurabh, 2013), but productivity of soybean in M. P.
is very low (10 qt/ha) as compare to genetic potential
(25q/ha).
It has great potential as a kharif oilseed and has emerged as an important commercial oilseed in
Madhya Pradesh. The main aim of Krishi Vigyan
Kendras is to reduce the time lag between generation
of technology at the research institution and its
transfer to the farmers for increasing productivity and
income from the agriculture and allied sectors on
sustained basis.
The FLD is an important tool for transfer of latest
package of practices in totality to farmers and the
main objective of this programme is to demonstrate
newly released crop production and protection technologies and management practices at the
farmers' field under real farming situation. Through
this practice, the newly improved innovative
technology having higher production potential under
the specific cropping system can be popularized and
simultaneously feedback from the farmers may be
generated on the demonstrated technology (Singh et
al., 2012).
To sustain the production system of soybean, the
Department of Agriculture, Cooperation and Farmers
Welfare had sanctioned the project “Cluster Frontline
Demonstrations on oilseed to ICAR-ATARI, Jabalpur through National Mission on Oilseed and
oilpalm (NMOOP). Under these cluster front line
demonstrations (CFLD), introduction of improved
technologies/package of practices is the main
objective with conductance of long-term educational
activity in a systematic manner in farmers‟ fields.
This project was implemented by Krishi Vigyan
Kendra, RVSKVV, Ashoknagar of Zone-IX with
main objective to boost the production and
productivity of Soybean through CFLDs with latest
and specific technologies and varieties. The present
study was carried out by the Krishi Vigyan Kendra,
Ashiknagar with the following objectives:
1. To popularize the improved and high yielding
varieties of soybeean along with their production and plant protection technologies.
2. To study the technological gap, extension gap and
technology index.
3. To work out the difference in input cost and
monetary returns under Cluster Front Line
demonstrations and farmers practice.
MATERIAL AND METHOD
The present study was conducted by the Krishi
Vigyan Kendra, Ashoknagar during Kharif season of year 2015-16 with the objective to identify the yield
gap as well as to work out the difference in input cost
and monetary returns. Improved varieties of soybean
JS 9560 with full package of practice was
demonstrated through cluster demonstration of
soybean in the farmer’s field of different villages of
operational area of Krishi Vigyan Kendra. This
variety was compared with the existing soybean
variety JS - 335 used by the farmers as local check.
Total 75 demonstration were conducted in 30 ha
area. Each demo was conducted on an area of 0.4 ha
and the same area adjacent to the demonstration plots was kept as a local check. Under the demonstrations,
crop was fertilized with recommended dose of
fertilizer @ 20:60:20:20:: N:P2O5:K2O: S kg/ha and
S
RESEARCH ARTICLE

960 V.K. JAIN, H.K. TRIVEDI AND B.S. GUPTA
full dose of fertilizer was added at the time of
sowing. Seed (75 kg /ha ) were sown by the seed
cum ferti drill after treating by Cabendezim @ 2gm
/kg seed + rhizobium @ 5g/kg seed + PSB @ 5 g/kg
of seed. Weed management (imazathyper @ 800
ml/ha at 21 DAS + one hand weeding at 40 DAS) and pest management were adopted as per
requirement. Crop was sown in the first week of july
at sufficient moisture content in the soil.
Under farmers practice existing variety JS 335, was
sown without any seed treatment with fungicides and
bio-fertilizers, using higher seed rate (110-120
kg/ha), broadcasting of DAP at 20 days after sowing
(DAS), and following injudicious use of insecticide
and weedicide.
Soybean seed of JS 9560 was provided by the Krishi
Vigyan Kendra, whereas, the fertilizer, herbicide,
insecticides and other inputs were born by the farmers themselves.
Before conducting the demonstrations, KVK has
collected the soil sample from the demonstrations
field and analyzed the sample and applied the
fertilizer on the basis of soil test values, training to
the farmers of respective villages was imparted with
respect to envisaged technological interventions. Site
selections, farmer’s selection, layout of
demonstration and farmers participation were
considered as suggested by Choudhury (1999). The
observations on productive and non-productive pods
per plant, seed yield per plant and seed yield per ha were recorded. Other parameters like harvest index,
technology gap, extension gap and technology index
(%) were worked out as suggested by Kadian et al.
(1997) using following formulae.
Harvest index (%) = Grain yield/ Biological yield x
100
Technology gap (kg/ha) = Potential yield -
Demonstration yield
Extension gap (kg/ha) = Demonstration yield –
Farmers‟ yield
Technology index = Potential yield- Demonstration
yield/Potential yield x 100 The economic analysis was done by working out cost
of cultivation utilizing the inputs and output prices of
commodities which prevailed during year of
demonstration, gross and net returns, and benefit cost
ratio.
Table 1. Description of Technological intervention and farmers practices under CFLD on Soybean
Particulars Technological intervention (T1) Farmers Practices (T2) Gap
Variety JS 9560 JS 335 Full gap
Seed Rate 75 kg/ha 120 kg/ha Partial Gap
Soil Test Soil Test Before demonstration No soil test Full Gap
Integrated
Nutrient
Management
20:60:20:20:: N:P2O5:K2O: S kg/ha +
rhizobium @ 5g/kg seed + PSB @ 5g/kg of
seed
Only N and P through
DAP
Full Gap
Integrated Pest
Management
Seed treatment with Cabendezim @ 2g/kg seed
+ one spray of proponophosh @ 1.5 lit/ha at
the ETL
Two or three spray of
Insecticide insufficient
amount of water
Partial Gap
Weed
Management
imazathyper @ 800 ml/ha at 21 DAS + one
hand weeding at 40 DAS
imazathyper @ 800 ml/ha
at 21 DAS
Partial Gap
RESULT AND DISCUSSION
While evaluating the demonstrated variety and
comparing with the farmer practice, it was observed
result of front line demonstrations indicated that the cultivation practices comprised under CFLD viz., use
of improved varieties, proper seed rate, seed
inoculation by rhizobium and PSB culture, soil test
based application of fertilizer, integrated pest
management, irrigation and hand weeding produced
on an average of 25% more yield of soybean as
compared to farmer’s practices. The result indicates
that the CFLD has given a good impact over the
farming community of Ashoknagar district as they
were motivated by the improved agricultural
technologies applied in the demonstration plots. The number of productive pods per plant of JS 9560
soybean ranged from 48.6 to 55.1 with a mean of
52.7 and non-productive pods per plant range from
7.2 to 8.8 with a mean of 7.9 under package of
improved practices. In case of farmer’s practice the
respective figures recorded were 40.5 to 46.3 with a
mean of 43.8 and 6.0 to 6.8 with a mean of 6.4,
respectively. The result revealed that the seed yield of soybean
recorded was in the range of 840 to 1250 kg per ha
(average 1075 kg/ha) by adoption of improved
package of practices as compared to farmer’s
practice of 730 to 960 kg per ha (average 860 kg/ha).
In comparison to farmer’s practice, an increase of 15
to 30 per cent (average 25 %) in seed yield was
recorded during 2015-16 due to improved package of
practices. Similarly, higher harvest index was
recorded under improved package of practices
(ranged from 32.3 to 38.1 % with a mean of 35.7 % as) compared to farmers‟ practice (29.1 % to 34.6 %
with a mean of 31.7 %). The higher number of
productive pods and higher harvest index in imparted

JOURNAL OF PLANT DEVELOPMENT SCIENCES VOL. 9 (10) 961
pakage of practices justifies the higher yield achieved
over farmer’s practice. These results are in
agreement with findings of Kumar et al. (2010), Jain
et al. (1998) and Tiwari et al. (2013).
The technology gap is the gap in the demonstration
yield over potential yield was found 9.25 qt/ha while extension gap was recorded 2.15 qt/ha. The
technology gap observed dissimilar due to weather
conditions, soil fertility status. Hence location
specific recommendation appears to be necessary to
bridge the gap between the yields. But to minimize
the extension gap it is need to educate the farmers
through various means for more adoption of
improved high yielding variety and recommended
practices to bridge the wide extension gap. This
extension gap requires urgent attention from
planners, scientists, extension personnel,
development department and NGOs working in the agricultural fields.
The technology index shows the feasibility of the
evolved technology at the farmer’s field. The lower
the value of technology more is the feasibility of the
technology. The technology index was found 46.25%
indicating the performance of this variety in
Ashoknagar region was satisfactory.
The input and output prices of commodities prevailed
during 2015-16 of demonstration were taken for
calculating the cost of cultivation, gross return,
additional net return and benefit cost ratio. The economic analysis of data over the years revealed
that the adoption of improved technology of soybean
not only gives the opportunity of higher yield, but
also provides higher benefit cost ratio i.e. 1.62 as
compared to 1.37 in the farmer’s practices. This may
be due to higher yield obtained under recommended
practices compared to farmer’s practices.
Similar results have earlier been reported on soybean
(Sharma et al., 2013; Tiwari et al., 2013) and on
chickpea (Tomar et al., 1999), Tomar (2010),
Mokidue et. al, (2011) and Singh et al. (2014).It was
also observed from the data of front line demonstration recorded higher gross return and net
return as compared to local check. The gross and net
returns were found Rs 34400 and Rs 13150 in CFLD
while in farmer’s practices these were found Rs
27520 and Rs 7555 respectively.
The result of front line demonstrations on the
package of practices suggested that by its adoption,
the farmers can realize higher yields and net profit in
soybean cultivation.
REFERENCES
Choudhary, B N. (1999). Krishi Vigyan Kendra-A
guide for KVK managers. Publication, Division of
Agricultural Extension, ICAR; 73-78.
Jain, M.P. and Dubey, A.K. (1998). Productivity and economic viability of soybean with respect to
planting system and cultivators in Vertisol. Crop
Research 16: 102-22.
Kadian, K S., Sharma, R. and Sharma, A.K.
(1997). Evaluation of front line demonstration trials
on oilseeds in Kangra Vally of Himanchal Pradesh.
Ann. Agric. Res.18:40.
Kumar, A., Kumar, R. and Yadav, V.P.S. (2010).
Impact assessment of front line demonstrations of
Bajra in Haryana state. Indian Research Journal of
Extension Education 12(3): 121-3.
Mokidue, L., Mohanty, A.K. and Sanjay, K. (2011). Correlating growth, yield and adoption of urd
been technologies. Indian Journal of Extension
Education 11(2): 20-24.
Sharma, Saurabh, Shrivastava, D.K., Kumar,
Surendar and Singh, Bijendra (2013). Impact of
package demonstration on soybean productivity by
Front Line Demonstration. Progressive Agriculture
13(1): 243-246 (2013)
Singh, J., Dhillon, B.S. Astha and Singh, P. (2012).
Front line demonstration – An effective tool for
increasing the productivity of summer Moong in Amritsar district of Punjab. An Asian Journal of Soil
Science, 7(2):315-318.
Singh, D., Patel, A.K., Baghel, M.S., Singh, S.K.,
Singh, Alka and Singh, A.K. (2014). Impact of
front Line Demonstration on the Yield and
Economics of Chickpea (Cicer Arietinum L) in Sidhi
District of Madhya Pradesh. Journal of Agricultural
Search 1(1): 22-25.
Tiwari B K, Sahare K V, Sharma Ashutosh,
Bain R P and Rajak A K. (2013). Impact of front
line demonstration on productivity of soybean
(Glycine max L. Merrill ) in farmer’s field. Search and Research IV(3): 32-7.
Tomar, R.K.S. (2010). Maxmization of productivity
for chick pea (Cicer arietinum L.) through improved
technologies in farmer’s field. Indian Journal of
Natural Products and Resources 1(4): 515-7.
Tomar, R.K.S., Sharma, P. and Yadav, L.N. (1999). Comparison of yield and economics of
irrigated chickpea under improved and local
management practices. International chickpea pigeon
pea News Letter, 6: 22-3.

962 V.K. JAIN, H.K. TRIVEDI AND B.S. GUPTA

*Corresponding Author
________________________________________________ Journal of Plant Development Sciences Vol. 9 (10) : 963-965. 2017
PERFORMANCE OF STRAWBERRY (FRAGARIA X ANANASSA DUCH.)
GENOTYPES FOR GROWTH AND YIELD CHARACTERS IN HILL ZONE OF
KARNATAKA
Maheshgowda B.M.*, Madaiah D., Dinesh Kumar M., Sivkumar B.S. and Ganapathi M.
University of Horticulture Science Bagalkot, Udyangiri, Bagalkot-587 104
Received-11.10.2017, Revised-24.10.2017
Abstract: The study was conducted on performance of seven genotype of strawberry (Fragaria x ananassa Duch.) at College of Horticulture Mudigere, Karnataka in naturally ventilated polly house during 2015-2016 the significant variation was occurred for all vegetative and Yield parameters. The genotype Sabrina accounted maximum plant height (32.30 cm), number of trifoliate leaves (30.40), plant spread (48.47 cm in north and south direction whereas 53.93 cm in east and west direction), leaf area (206.04 cm2), leaf area index (6.95), plant dry weight at harvest (29.04 g), chlorophyll content (2.33 mg/100 g), number of fruits per plant (22.36) and yield per plant (380.29 g). number of runners per plant was maximum
(10.70) in Cristle , weight of fruit was maximum (20.01 g) in Fortuna, maximum (4.43 cm) fruit length was recorded in genotype Cristle followed by Fortuna (4.12 cm), the breadth and volume of fruit was observed maximum in genotype Fortuna that was 3.28 cm and 24.37 cc respectively Among different genotypes evaluated the Sabrina accounted maximum for growth and yield parameters of strawberry..
Keywords: Genotypes, Strawberry, Growth, Yield, Hill zone
INTRODUCTION
trawberry (Fragaria x ananassa Duchesne) is
one of the most delicious, refreshing and
nutritious soft fruits of the world. It belongs to family
Rosaceae and native to America (Galletta et al.,
1990). In India, Strawberries were first introduced by
NBPGR Regional Research Station, Shimla
(Himachal Pradesh) in the early sixties. At present,
the strawberry is being grown in a wide range of
climatic zones extending to temperate,
Mediterranean, Sub-tropical zones. Due to octaploid
nature, considerable variations exist in various
cultivars and these cultivars helped the crop to spread
in cool place of India. It is now being grown in
Shimla, Solan, Bilaspur, Kangra, Kullu, Palampur
(Himachal Pradesh), Deharadun, Saharanpur
(Uttaranchal), Muzaffarnagar, Ghaziabad (Uttar
Pradesh), Hoshiarpur, Ludhiana, Jalandar, Patiala
(Panjab), Gurgaon, Hisar, Karnal (Haryana), the
work on identification of suitable high yielding
variety of strawberry for different agro-climatic
conditions remains scanty in literature. With the
introduction of new cultivars, it was therefore felt
imperative to evaluate for its feasibility and record
pomological descriptions of strawberry cultivars for
their proper identification and highlighting useful
characters, which could be exploited for bringing
about improvement in strawberry production in the
state. Keeping these points in view the present
investigation work entitled “Evaluation of different
genotypes for growth, yield and quality of strawberry
(Fragaria X ananassa Duch.) under naturally
ventilated polyhouse in hill zone of Karnataka” was
conducted in a low cost polyhouse .
MATERIAL AND MATHODE
The present investigation entitled “Evaluation of
different genotypes for growth, yield and quality of
strawberry (Fragaria X ananassa Duch.) under
naturally ventilated polyhouse in hill zone of
Karnataka” was carried out at college of Horticulture
Mudigere, from October 2015 to march 2016, the
experiment was laid out in completely randomized
block design. In the present study seven genotypes of
strawberry and considered each as single treatment
and replicated thrice. The genotypes taken for evaluation are Winter Dawn, Sweet Charlie, Safari,
Fortuna, Cristle, Elyana, Sabrina. The beds of 45 cm
height, 60 cm width was prepared and mulched with
black polyethene. The planting was done at spacing
of 30 cm x30 cm, the morphological observation was
recorded at an interval of 30, 60, 90 and 120 days
after planting.
RESULT AND DISCUSSION
The various vegetative parameters like plant height,
number of trifoliate leaves, plant spread, number of runners per plant, leaf area, leaf area index, plant dry
weight at harvest, chlorophyll content, number of
fruits per plant, yield per plant, weight of fruit, length
of fruit, diameter of fruit and volume of fruit.
The genotype Sabrina accounted maximum plant
height (32.30 cm), number of trifoliate leaves
(30.40), plant spread (48.47 cm in north and south
direction whereas 53.93 cm in east and west
direction), leaf area (206.04 cm2), leaf area index
(6.95), plant dry weight at harvest (29.04 g),
S
SHORT COMMUNICATION

964 MAHESHGOWDA B.M., MADAIAH D., DINESH KUMAR M., SIVKUMAR B.S. AND GANAPATHI M.
chlorophyll content (2.33 mg/100 g), number of
fruits per plant (22.36) and yield per plant (380.29 g).
The genotype Fortuna was on par with Sabrina for all
the above parameters, where as the minimum plant
height was recorded in Winter Dawn that is 21.50
cm, the minimum plant spread (31.87 cm in east and
west direction whereas 32.37 in north and south
direction) was
Table 1. Performance of strawberry genotypes for vegetative characters
Genotypes
Plant
height
(cm)
Number of
leaves
Plant spread (cm)
R/P LA (cm2) LAI
TDMW
(g)
Chlorophyll
content
(mg/100g)
N – S E – W
Winter Dawn 21.50 15.40 31.87
32.37
4.10 115.37 1.97 18.87 1.71
Sweet Charlie 26.27 21.20 43.60
46.37
4.83 165.72 3.90 22.24 1.94
Safari 24.87 15.27 33.63
36.20
4.17 100.59 1.70 18.45 1.62
Fortuna 27.63 22.50 41.20
42.40
8.33 182.69 4.50 25.07 2.06
Cristle 27.30 20.50 40.40
47.37
10.70 162.85 3.70 20.38 1.92
Elyana 26.50 19.43 40.10
37.83
6.70 129.84 2.80 19.28 1.85
Sabrina 32.30 30.40 48.47
53.93
1.67 206.04 6.95 29.04 2.33
S. Em ± 0.34 0.47 0.62
0.64
0.49 9.69 0.13 0.36 0.11
C. D. (P = 0.05) 1.05 1.45 1.90
1.96
1.49 29.87 0.40 1.10 0.33
R/P-Runners/plant, LA- Leaf Area, LAI-Leaf
Area Index, TDMW-Total Dry Matter Weight
recorded in Winter Dawn. the minimum number of
trifoliate leaves (15.27), leaf area (100.59 cm2), leaf area index (1.70), plant dry weight at harvest (18.45
g), chlorophyll content (1.67 mg/100 g of fresh
weight), number of fruits per plant (14.67) and yield
per plant (191.77 g) was recorded minimum in
genotype Safari where as the number of runners per
plant was maximum (10.70) in Cristle where as
minimum (1.67) was reported in genotype Sabrina,
weight of fruit was maximum (20.01 g) in Fortuna
followed by Sabrina (16.01 g) while, minimum
(12.87 g) was observed in genotype Cristle, the
maximum (4.43 cm) fruit length was recorded in genotype Cristle followed by Fortuna (4.12 cm)
where as minimum (3.11 cm) was recorded in
Sabrina, the breadth and volume of fruit was
observed maximum in genotype Fortuna that was
3.28 cm and 24.37 cc respectively where as
minimum was recorded in genotype Safari that was
2.55 cm and 12.12 cc respectively.
Table 2. Performance of strawberry genotypes for yield attributes
Genotypes
Number of
fruits per
plant
Fruit weight
(g)
Length of fruit
(cm)
Diameter of
fruit (cm)
Volume of fruit
(cc)
Yield per plant
(g)
Winter Dawn 14.83 12.94 3.49 3.10 16.39 192.73
Sweet Charlie 19.24 13.45 3.15 3.05 13.50 259.65
Safari 14.67 13.07 3.11 2.55 12.12 191.77

JOURNAL OF PLANT DEVELOPMENT SCIENCES VOL. 9 (10) 965
Fortuna 20.91 20.01 4.12 3.28 24.37 367.24
Cristle 18.09 12.87 4.43 2.56 12.07 237.83
Elyana 15.53 15.03 3.27 2.93 14.07 233.87
Sabrina 22.36 16.01 3.67 3.16 17.72 380.29
S. Em ± 0.35 1.43 0.18 0.12 1.58 25.86
C. D. (P = 0.05) 1.08 4.42 0.56 0.38 4.87 79.70
The above results are in accordance with the findings
of Singh et al. (2012), Hossan et al. (2013), Ankita
Chandel (2014) and Uddin et al. (2016). The
variation in cultivar may be due to genetic and
environmental interaction.
REFERENCE
Ankita, S. and Chandel, J.S. (2014). Studies on the
comparative performance of strawberry cultivars
under mid-hill conditions of north-western
Himalayas. Indian. J. Hort., 71(3): 330-334.
Galletta, G.J., Lawrence, F.J. and Scott, D.H. (1990). Strawberry breeding work of the United
States Department of Agriculture. Hort. Sci., 25:
895–896.
Hossan, M.J., Islam, M. S., Ashan, M.K., Mehraj,
H. and Jamaluddin, A.F.M. (2013). Growth and
yield performance of strawberry germplasm at Sher-
ebangla Agri. Uni. J. Expt. BIosci., 4(1): 89-92.
Singh, S.R., Srivastava, K.K., Sharma, M.K. and
Singh, L. (2012). Screening of strawberry (Fragaria x ananassa) varieties under organic production
system for Kashmir valley. Ind. J. Agri. Sci. 82(6):
538-42.
Uddin, A.F.M.J., Ahsan, M.K., Hussain, M.S.,
Mahmud, M.F. and Mehraj, H. (2016). Evaluation
of Strawberry Germplasm at Sher-E-Bangla
Agricultural University, Bangladesh. World Applied
Sciences Journal, 34(1): 78-83.

966 MAHESHGOWDA B.M., MADAIAH D., DINESH KUMAR M., SIVKUMAR B.S. AND GANAPATHI M.