journal of plant physiology and breeding faculty of
TRANSCRIPT

IN THE NAME OF GOD
Journal of Plant Physiology and Breeding Faculty of Agriculture, University of Tabriz
Liscence Holder: Faculty of Agriculture, University of Tabriz, Iran Editor:
Moghaddam M
Prof., Dept. of Agronomy and Plant Breeding, University of Tabriz, Iran Coordinating Manager:
Najafi N Assistant Prof., Dept. of Soil Science, University of Tabriz, Iran
Scope of Journal Plant Physiology and Breeding
Editorial Board:
Ebadi A Associate Prof., College of Agriculture and Natural Resources, University of
Tehran, Iran Ehdaie B Prof., Dept of Botany and Plant Sciences, University of California, USA Emam Y Prof., Dept. of Agronomy, College of Agricuture, Shiraz University, Iran Ghasemi Golezani K Prof., Dept. of Agronomy and Plant Breeding, University of Tabriz, Iran Mirlohi Falavarjani A Prof., Dept. of Agronomy, College of Agricuture, Isfahan University of
Technology, Iran Mohammadi SA Prof., Dept of Agronomy and Plant Breeding, University of Tabriz, Iran Shakiba MR Prof., Dept. of Agronomy and Plant Breeding, University of Tabriz, Iran Soltani A Prof., Dept. of Agronomy, Gorgan University of Agricuture and Natural
Resources, Iran Toorchi M Prof., Dept. of Agronomy and Plant Breeding, University of Tabriz, Iran Valizadeh M Prof., Dept. of Agronomy and Plant Breeding, University of Tabriz, Iran
Editorial Assistants:
Dokhtbagher A Saadatpour R
Contact information: Journals Office, Faculty of Agriculture
University of Tabriz, Tabriz, 5166616471, Iran Phone: 0098-411-3392037 Fax: 0098-411-3356002
Website: http://breeding.tabrizu.ac.ir Email: [email protected]
Printed by: University of Tabriz Printing Office

Vol. 1 No. 1 2011 ISSN: 2008-5168 Crop Physiology
1
K Ghassemi-Golezani, M Taifeh-Noori, S Oustan, M Moghaddam and S Seyyed Rahmani Physiological Performance of Soybean Cultivars Under Salinity Stress …………………….
9
M Zharfa, A Maghsoudi Moud and VR Saffari Relationships Between Seedling Growth Rate and Yield of Maize Cultivars Under Normal and Water Stress Conditions …………………………………………………………………
25
A Maghsoudi Moud and M Islami Water Stress Effect on Remobilization of Pre-Anthesis Stored Assimilates to Grains in Wheat …………………………………………………………………………………………
39
H Sadeghi and Y Emam Chemical Composition, Yield and Yield Components of Two Wheat Cultivars in Response to Salt Stress ………………………………………………………………………………….
Plant Genetics and Breeding
49 R Paknia and G Karimzadeh Karyotypic Study and Chromosome Evolution in Some Iranian Local Onion Populations…………
63
J Mosa Abadi, S Khavari Khorasani, B Syah Sar, S Movafeg and M Golbashy
Estimation of Combining Ability and Gene Effects in Forage Maize (Zea mays L.) Using Line × Tester Crosses ………………………………………………………………………...
75 A Sanjari Pireivatlou, RT Aliyev and B Sorkhilaleloo Grain Filling Rate and Duration in Bread Wheat Under Irrigated and Drought Stressed Conditions…

Journal of Plant Physiology and Breeding
Instruction to authors
Aims and Scope
Journal of Plant Physiology and Breeding is a publication of The University of Tabriz, Iran, that publishes original papers in the areas of physiology and breeding of field and horticultural crops.
General considerations
1. A paper will be accepted for publication that has not been published either in a journal or as a full paper in a proceedings of a conference or symposium.
2. The acceptance of a paper implies that it has been reviewed and recommended for publication by at least two professional reviewers.
3. Figures, tables and their captions should be prepared on separate pages at the end of the manuscript.
4. Manuscripts should be prepared in A4 sheets, using 1.5-fold line spacing with the maximum of 12 pages. The manuscript will be typed in Microsoft Word document with Times New Roman. The font size will be as follows: -Title of the manuscript: 14 (Bold) -All subtitles: 12 (Bold) -Text: 12 -Titles of figures and tables, author’s names, references, and keywords: 11 -Words and numeric within the figures and tables: 9-11 -Footnotes: 10
5. Scientific names of the species, gene symbols and Greek words should be typed in Italic. 6. No vertical lines are allowed in the tables and minimum horizontal lines are suggested.
Title Page
- Title should be short (maximum of 15 words) and descriptive, indicating the research subject and main objectives of the work.
- Scientific name of an organism is not necessary to be included in the title if it has a common name. Also, abbreviations and chemical formulas are not recommended in the title.
- Name, affiliation, postal address, e-mail and telephone number of the authors (corresponding author marked by an asterisk) should be included in the title page.

Abstract
- Abstract should be prepared in one paragraph not exceeding 300 words. It will include the main objectives, brief description of the methods, results and conclusions.
- No references are to be cited in the abstract.
Keywords
- Maximum of seven keywords, ordered alphabetically, come right after the abstract.
Introduction
- This section includes a brief description of the research subject and literature review. It will end with the statement about the objective (s) of the research program.
Materials and methods
- Materials and methods section should provide enough information about the location of the research work, materials and instruments, methods and types of experiments and statistical methods.
- If a method is routine, no description is needed and its reference should only be cited. However, if the method is new or a modification of an older procedure, a detailed statement is required.
Results
- The results section explains the findings of the study using tables and figures.
- No materials and methods are allowed to be repeated in this section.
- There is no need to illustrate the data in the tables extensively and important features should only be indicated.
- Figures should not be the repetition of the information in the tables.
- Legends of figures and tables should be descriptive and complete.
Discussion
- The discussion section represents the interpretation of the results obtained in the study with special emphasis on the theoretical and practical implications of the findings.
- The results should be discussed in relation to the reports of the other researchers.

- Discussion can be combined with the results section. In case of separation, the discussion should not be the repetition of the results.
- At the end of the discussion, significant conclusions drawn from the results should be stated.
Acknowledgements
- A concise statement acknowledging the people or funding organizations can be included.
References
Citation in the text
- In order to cite references in the text, the date of publication will be presented right after the surnames of the authors: (Hallauer and Miranda 1980) or Hallauer and Miranda (1980). For more than two authors, the surname of the first author will be followed by “et al.”: (Comstock et al. 1952) or Comstock et al. (1952).
- References having the same author and year will be marked by a sequence of letters (i.e. 2009a, b, c …).
Citation in the list of references - References will be presented in alphabetical order without consecutive numbering. - No extra references are allowed if not included in the text. - All authors within a reference are presented with family name, followed by the
abbreviated first name. - In case of citing several references from an author, the references having coauthors will
be sorted alphabetically. - If some references have similar authors, they will be sorted chronologically. - If references have the same author and year they will be indicated by the letters a, b, c, … - Class notes should not be used as references.
Examples of literature citation in the list of references Journals Choat B, Gambetta GA, Shackel KA, and Matthews MA, 2009. Vascular function in grape
berries across development and its relevance to apparent hydraulic isolation. Plant Physiology 151: 1677-1687.
Ellis RH and Pieta Filho C, 1992. Seed development and cereal seed longevity. Seed Science Research 3: 247-257.

Ellis RH and Roberts EH, 1981. The quantification of ageing and survival in orthodox seeds. Seed Science and Technology 9: 373-409.
Komatsu S, Konishi H and Hashimoto M, 2007a.The proteomics of plant cell membrane. Journal of Experimental Botany 58: 103-112.
Komatsu S, Yang G, Khan M, Onodera H, Toki S and Yamaguchi M, 2007b. Over-expression of calcium-dependent protein kinase 13 and calreticulin interacting protein 1 confers cold tolerance on rice plants. Molecular Genetics and Genomics 277: 713–723.
Prasanna BM and Hoisington D, 2003. Molecular breeding for maize improvement. An overview. Indian Journal of Biotechnology 2: 85-98.
Remay A, Lalanne D, Thouroude T, Le Couviour F, Hibrand-Saint Oyant L and Foucher F, 2009. A survey of flowering genes reveals the role of gibberellins in floral control in rose. Theoretical and Applied Genetics 119: 767-781.
Yordanova R and Popova L, 2007. Effects of exogenous treatment with salicylic acid on photosynthetic activity and antioxidant capacity of chilled wheat plants. General and Applied Plant Physiology 33: 155-170.
Books Falconer DS and Mackay TFC, 1996. Introduction to Quantitative Genetics. Fourth edition.
Pearson Education Ltd., Essex, England. Hallauer AR (Ed), 2001. Specialty Corns. Second edition. CRC Press, LLC, Boca Raton, FL.
479 pp. Roberts EH, 1986. Quantifying seed deterioration. In McDonald MB and Nelson CJ (Eds).
Physiology of Seed Deterioration. Pp 101-123. CSSA, Madison, WI, USA. Sharp RE and Davies WJ, 1989. Regulation of Growth and Development of Plants Growing with a Restricted Supply of Water. Cambridge University Press, Cambridge, UK. Varshney A, Mohapatra T and Sharma RP, 2003. Molecular mapping and marker assisted
selection of traits for crop improvement. In: Srivastava PS, Narula A and Srivastava S (Eds). Biotechnology and Molecular Markers. Pp 289-330. Amanya Publishers, India.
Proceedings of conferences, symposiums, etc Karaba A, Dixit S, Trijatmiko KR, Aharoni A, Nataraja KN, Updayakumar M and Pereira A,
2006. Improvement of water-use efficiency in crop plants. Proceedings of the 5th Plant Genomics European Meetings, October 11-14, Venice, Italy. P. 115.
Salamini F, 2003. Geography and genetics of wild cereal domestication in the Near East. In: Mare C, Faccioli and Stanca AM (Eds). From Biodiversity to Genomics: Breeding Strategies for Small Grain Cereals in the Third Millennium. Pp. 3-6. Proceedings of the EUCARPIA Cereal Section Meeting, 21-25 November, 2002, Experimental Institute for Cereal Research, Section of Fiorenzuola ď Arda (PC), Salsomaggiore, Italy.

Journal of Plant Physiology and Breeding ISSN: 2008-5168 2011, 1(1): 1-7
Physiological Performance of Soybean Cultivars Under Salinity Stress K Ghassemi-Golezani1*, M Taifeh-Noori2, S Oustan1, M Moghaddam1, S Seyyed Rahmani3
Received : 18 January 2010 Accepted : 24 August 2010
1Department of Agronomy and Plant Breeding, Faculty of Agriculture, University of Tabriz, Iran 2Islamic Azad University, Maragheh Branch, Iran 3 Agricultural Products Insurance Fund, Iran *Corresponding Author: Email: [email protected] Abstract Two experiments with factorial arrangements on the basis of randomized complete block design in three replications were conducted in 2007 and 2008, to evaluate chlorophyll content index (CCI), fluorescence of chlorophyll, proline content and grain yield of three soybean cultivars (Williams, Zan and L17) under a non-saline (control) and three saline (3, 6 and 9 ds/m NaCl) conditions in the greenhouse. Six seeds were sown in each pot filled with 900 g perlite, using 144 pots in each experiment. After emergence, seedlings were thinned and four plants were kept in each pot. Zan had the highest leaf proline content, but the lowest CCI, chlorophyll fluorescence and grain yield per plant. However, these traits were statistically similar with those of L17 and Williams. The chlorophyll content index and fluorescence of chlorophyll in soybean leaves decreased with increasing salinity. Reduction in chlorophyll fluorescence due to salinity stress was related to the damage of chlorophyll under saline conditions. In contrast, leaf proline content increased as salinity increased. Mean grain yield per plant under salinity stress was much less than that under non-saline conditions. These reductions were closely related with low CCI and PS II activity (fv/fm) and high leaf proline content in soybean cultivars. It was concluded that soybean is a sensitive plant to salinity stress, but the extent of this sensitivity varies among cultivars. Keywords: Chlorophyll content, Fluorescence, Proline, Salinity stress, Soybean Introduction Soybean is an important grain legume. The unique chemical composition of soybean has made it one of the most valuable agronomic crops worldwide (Thomas et al. 2003). Its protein has great potential as a major source of dietary protein. The oil produced from soybean is highly digestible and contains no cholesterol (Essa and Al-Ani 2001). Wide genetic variability exists among different cultivars of soybean (Shereen and Ansari 2001). Nevertheless, soybean production may
be limited by environmental stresses such as soil salinity (Ghassemi-Golezani et al. 2009).
Soil salinity, resulting from natural processes or from crop irrigation with saline water, occurs in many arid and semi-arid regions of the world (Meloni et al. 2004). Most of the salt stresses in nature are due to Na+ salts, particularly NaCl (Demirel 2005). High salinity lowers water potential and induces ionic stress, and results in secondary oxidative stress. Salinity is known to cause

2 Ghassemi et al. 2011, 1(1): 1-7
changes in physiological processes in plants (Ganivea et al. 1998).
Netondo et al. (2004) reported that photosynthetic activity decreases when plants are grown under saline conditions leading to reduced growth and productivity. The reduction in photosynthesis under salinity can be attributed to a decrease in chlorophyll content (Jamil et al. 2007) and activity of photo-system ΙΙ (Ganivea et al. 1998). Salinity can affect chlorophyll content through inhibition of chlorophyll synthesis or an acceleration of its degradation (Reddy and Vora 1986). Fluorescence of chlorophyll reflected the photochemical activities of photo-system ΙΙ (Ganivea et al. 1998). Photochemical efficiency of photo-system ΙΙ (fv/fm) could be reduced by salinity stress (Netondo et al. 2004, Jamil et al. 2007).
Plants have evolved complex mechanisms that contribute to the adaptation to osmotic stress caused by high salinity (Meloni et al. 2004). Osmotic adjustment has undoubtedly gained considerable recognition as a significant and effective mechanism of salinity tolerance in crop plants (Pakniyat and Armion 2007). In salt stressed plants osmotic potential of vacuole decreased by proline accumulation (Yoshiba et al. 1997). Several possible roles have been attributed to supra-optimal level of proline including osmoregulation under salinity, stabilization of proteins and prevention of heat denaturation of enzymes and conservation of nitrogen and energy for a post-stress period (Aloni and Rosenshtein 1984). This research was carried out to evaluate changes in chlorophyll content and fluorescence and proline accumulation in leaves of soybean cultivars in response to salinity stress. The consequences of such changes on crop yield were also investigated.
Materials and Methods Seeds of three soybean cultivars (Williams,
Zan and L17) were obtained from Agricultural Research Institute, Moghan, Iran. Two experiments with factorial arrangements on the basis of randomized complete block design with three replications were conducted in 2007 and 2008 to investigate changes in chlorophyll content index (seven weeks) and fluorescence of chlorophyll (four times) in leaves and to determine proline content and grain yield of three soybean cultivars under a non-saline (control) and three saline (3, 6 and 9 ds/m NaCl) conditions. Six seeds were sown 3 cm deep in each pot, filled with 900 g perlite, using 144 pots in each experiment. Pots were then placed in the greenhouse. The temperature variation in the greenhouse was 17-34ºC and 13-28ºC during the first and second experiments, respectively. Tap water and saline solutions were added to the pots in accordance with the treatments to achieve 100% FC.
After emergence, seedlings were thinned to keep four plants in each pot. During the growth period, the pots were weighed and the losses were made up with Hoagland solution (EC = 1.3 dS/m). Perlites within the pots were washed every 25 days and non-saline and salinity treatments were reapplied in order to prevent further increase in electrical conductivity (EC), due to adding the Hoagland solution. Leaf chlorophyll content index (CCI) was measured by a chlorophyll meter (CCM-200, Opti- Science, USA) in weekly intervals for seven weeks. After seedling establishment, a plant was marked in each pot and CCI of upper, middle and lower leaves was measured at each stage. Subsequently, mean CCI for each treatment and replicate at each developmental stage was calculated.

Physiological performance of soybean cultivars …….. 3
The chlorophyll fluorescence induction parameters were measured in leaves by a chlorophyll fluorometer (OS-30, OPTI-SCIENCES, USA) every 10 days from 30 to 60 days after sowing. Fluorescence emission was monitored from the upper surface of the leaves. Dark-adapted leaves (30 min.) were initially exposed to the weak modulate measuring beam, followed by exposure to saturated white light to estimate the initial (F0) and maximum (Fm) fluorescence values, respectively. Variable fluorescence (Fv) was calculated by subtracting F0 from Fm. The Fv/Fm ratio measures the efficiency of excitation energy capture by open PSII reaction centers, representing the maximum capacity of light-dependent charge separation in PSII (Rizza et al. 2001).
The proline content was determined spectrophotometrically according to Bates et al. (1973). In each experimental unit, 200 mg leaf samples were powdered in liquid nitrogen and were homogenized in 5 ml sulphosalcylic acid. Then, 2 ml acid ninhydrine and 2 ml glacial acetic acid were added to the extract. The samples were heated at 100 °C. The mixture was extracted with toluene and the free toluene was quantified spectrophoto- metrically at 520 nm.
At maturity, plants of each pot were separately harvested and grains were detached from the pods. Finally, grains were weighed and grain yield per plant for each treatment at each replicate was determined.
MSTATC software was used to analyze the data for CCI and chlorophyll fluorescence as factorial split plot and those for proline and grain yield as factorial. Means of the traits were compared at p≤0.05. Figures were drawn using Excel software.
Results The results of analysis of variance showed
highly significant (P ≤ 0.01) effects of year, cultivar, salinity and measuring time on both chlorophyll content index (CCI) and fluorescence of chlorophyll. Means of CCI and fv/fm in 2007 experiment were higher than those in 2008. The CCI and fluorescence of chlorophyll in soybean leaves decreased with increasing salinity. L17 and Zan had the highest and the lowest CCI and fv/fm, respectively.
Mean CCI and chlorophyll fluorescence of soybean cultivars increased with progressing plant growth up to a point where maximum values was a chieved under non-saline and saline conditions (Figures 1 and 2). Maximum CCI of all cultivars under salinity treatments was obtained earlier than that under non-saline treatment (Figure 1), but maximum chlorophyll fluorescence under all treatments was achieved at almost similar stage (Figure 2). Thereafter, due to senescing of leaves, CCI and chlorophyll fluorescence started to decrease. Mean CCI and chlorophyll fluorescence at all developmental stages decreased as the salinity increased. In general, L17 and Williams had more CCI and chlorophyll fluorescence at different stages of growth and development, compared to Zan (Figure 1).
Leaf proline content and grain yield per plant were significantly (P ≤ 0.01) affected by cultivar and salinity, but cultivar × salinity interaction was not significant for these traits (P≤0.05). Leaf proline content of soybean increased with increasing salinity. Proline content of Zan was significantly higher than that of Williams and L17. However, proline content of the latter cultivars was similar (Table 2). Grain yield per plant significantly decreased as salinity increased. Zan had the

4 Ghassemi et al. 2011, 1(1): 1-7
lowest grain yield per plant, but there was no significant difference in grain yield of L17 and Williams (Table 2). Discussion
Decreasing chlorophyll content index (CCI) of soybean leaves with increasing salinity (Table 1, Figure 1) could be related to increasing the activity of chlorophyll degrading enzyme, chlorophyllase (Jamil et al. 2007), and the destruction of the
chloroplast structure and the instability of pigment protein complexes (Singh and Dubey 1995). Similar results were reported for tomato (Lapina and Popov 1970), pea (Hamada and El-Enany 1994), alfalfa (Winicov and Seemann 1990), sunflower (Ashraf 1999), sorghum (Netondo et al. 2004), and wheat (El-Hendawy et al. 2005). Differences in CCI among cultivars (Table 1, Figure 1) indicate that this trait can be also influenced by genetic constitution.
Table 1. Means of chlorophyll content index (CCI) and fluorescence chlorophyll (fv/fm) of three soybean cultivars under salinity stress
Different letters for each factor in each column indicate significant difference at p≤0.05.
Table 2. Means of proline content and grain yield per plant for three soybean cultivars under salinity stress
Different letters in each factor in each column indicate significant difference at p≤0.05.
Treatment CCI fv/fm
Year 1 2
13.66 a 10.50 b
0.779 a 0.728 b
0 14.06 a 0.792 a
3 12.81 b 0.768 b
6 11.50 c 0.742 c Salinity (dS m-1)
9 9.97 d 0.713 d
Cultivar L17 Zan
Williams
12.63 a 11.19 b 12.43 a
0.764 a 0.739 b 0.758 a
Treatment Proline content (mM/g)
Grain yield per plant (g)
0 19.40 d 1.250 a
3 26.12 c 0.892 b
6 39.28 b 0.516 c Salinity (dS m-1)
9 45.89 a 0.274 d
Cultivar L17 Zan
Williams
31.71 b 35.36 a 30.96 b
0.782 a 0.651 b 0.766 a

Physiological performance of soybean cultivars …….. 5
Reduction in fv/fm due to salinity stress
(Table 1, Figure 2) is possibly related to the damage of chlorophyll under saline conditions (Ganieva et al. 1998). Ashraf (2004) found that ionic imbalance can also cause the reduction in fv/fm under high salinity conditions. Nasir khan et al. (2007) reported that the decrease in chlorophyll content and PS II activity have adverse effect on growth and grain yield of treated plants.
Increasing leaf proline content under salinity stress (Table 2) might be caused by the induction or activation of proline synthesis from glutamate or decrease in its utilization in protein synthesis or enhancement in protein turnover. Thus, proline may be the major source of energy and nitrogen during immediate post stress metabolism and accumulated proline apparently supplies energy for growth and survival, thereby inducing salinity tolerance (Gad 2005). Zan had the highest proline content (Table 2) and the lowest CCI and fv/fm (Table 1). Gad (2005) also reported that proline content was much higher in sensitive cultivar of tomato than in salt-tolerant.
Large reductions in grain yield per plant clearly show that soybean is a salt sensitive crop, but the extent of this sensitivity varies among cultivars (Table 2). Salinity can severely limit crop production because high salinity lowers water potential and induces ionic stress and results in a secondary oxidative stress (Shanon 1998). Reductions in grain yield as a result of salt stress have also been reported for some other crop species (Katerji et al. 1992, Ashraf 2004, Sohrabi et al. 2008). These reductions are closely related with low CCI and PS II activity (Table 1) and high leaf proline content (Table 2) in soybean cultivars. Conclusion
Salinity stress can considerably reduce chlorophyll content index and PS II activity and consequently grain yield per plant in soybean cultivars. These reductions enhance with increasing salinity. In contrast, leaf proline content increases due to NaCl salinity. In general, soybean is a sensitive crop to salinity stress, but the extent of this sensitivity varies among cultivars.

6 Ghassemi et al. 2011, 1(1): 1-7
A: Williams B: Zan C: L17, 0 ds/m 3
ds/m 6 ds/m 9 ds/m
Figure 1. Changes in chlorophyll content index (CCI) of soybean cultivars under non-saline (control) and saline conditions (means of two years).
A: Williams B: Zan C: L17, 0 ds/m 3
ds/m 6 ds/m 9 ds/m
Figure 2. Changes in chlorophyll fluorescence (fv/fm) of soybean cultivars under non-saline (control) and Saline conditions (means of two years).
References Aloni B and Rosenshtein G, 1984. Proline accumulation: A parameter for evaluation of sensitivity of tomato
varieties to drought stress. Physiol Plant 61: 231-235. Ashraf M, 1999. Interactive effect of salt (NaCl) and nitrogen form on growth, water relations and
photosynthetic capacity of sunflower (Helianthus annuus L.). Ann Appl Biol 135: 509–513. Ashraf M, 2004. Some important physiological selection criteria for salt tolerance in plants. Flora 199: 361-
376. Bates LS, Waldeen RP and Teare ID, 1973. Rapid determination of free proline for water stress studies. Plant
and Soil 39: 205-207. Demiral M A, 2005. Comparative response of two olive (Olea europaea) cultivars to salinity. Turk J Agric
For 25: 267-274.

Physiological performance of soybean cultivars …….. 7 El-Hendawy SE, Hu Y and Schmidhalter U, 2005. Growth, ion content, gas exchange and water relations of
wheat genotypes differing in salt tolerances. Aust J Agr Res 56: 123–134. Essa TA and Al-Ani DH, 2001. Effect of salt stress on the performance of six soybean genotypes. Pak J Biol
Sci 4: 175-177. Gad N, 2005. Interactive effect of salinity and cobalt on tomato plants. II. Some physiological parameters as
affected by cobalt and salinity. Res J Agr Biol Sci 1: 270-276. Ganivea RA, Allahverdiyev SR, Guseinova NB, Kavakli HI and Nafisi S, 1998. Effect of salt stress and
synthetic hormone polystimuline K on the photosynthetic activity of cotton (Gossypium hirsutum). Tr J Botany 22: 217-221.
Ghassemi-Golezani K, Taifeh-Noori M, Oustan Sh and Moghaddam M, 2009. Response of soybean cultivars to salinity stress. J Food Agr Environ 7: 401-404.
Hamada AM and EL-Enany AE, 1994. Effect of NaCl salinity on growth, pigment and mineral element contents and gas exchange of broad bean and pea plants. Biol Plantarum 36: 75-81.
Jamil M, Rehman S, Lee KJ, Kim JM, Kim HS and Rha ES, 2007. Salinity reduced growth PS II photochemistry and chlorophyll content in radish. Sci Agric 64: 1-10.
Katerji N, Van Hoorn JW, Hamdy A, Bouzid N, El-Sayed Mahrous S and Mastrorilli M, 1992. Effect of salinity on water stress, growth and yield of broadbeans. Agric Water Manage 21: 107-117.
Lapina LP and Popov BA, 1970. Effect of sodium chloride on photosynthetic apparatus of tomatoes. Fiziologiya Rastenii 17: 580-584.
Meloni DA, Gulotta MR, Martinez CA and Oliva MA, 2004. The effects of salt stress on growth, nitrate reduction and proline and glycine-betaine accumulation in Prosopis alba. Braz J Plant Physiol 16: 39-46.
Nasir Khan M, Siddiqui MH, Mohammad F, Masroor M, Khan A and Naeem M, 2007. Salinity induced changes in growth, enzyme activities, photosynthesis, proline accumulation and yield in linseed genotypes. World J Agric Sci 3: 685-695.
Netondo GW, Onyango JC and Beck E, 2004. Sorghum and salinity. II. Gas exchange and chlorophyll fluorescence of sorghum under salt stress. Crop Sci 44: 806-811.
Pakniyat H and Armion M, 2007. Sodium and proline accumulation as osmoregulators in tolerance of sugar beet genotypes to salinity. Pak J Biol Sci 10: 4081-4086.
Reddy MP and Vora AB, 1986. Changes in pigment composition, hill reaction activity and saccharides metabolism in bajra (Pennisetum typhoides S&H) leaves under NaCl salinity. Photosynthetica 20: 50-55.
Rizza F, Pagani D, Stanca AM and Cattivelli L, 2001. Use of chlorophyll fluorescence to evaluate the cold acclimation and freezing tolerance of winter and spring oats. Plant Breed 120: 389-396.
Shanon MC, 1998. Adaptation of plants to salinity. Adv Agron 60: 75-119. Shereen A and Ansari R, 2001. Salt tolerance in soybean (Glycine max L.): Effect on growth and water
relations. Pak J Biol Sci 4: 1212-1214. Singh AK and Dubey RS, 1995. Changes in chlorophyll a and b contents and activities of photosystems 1
and 2 in rice seedling induced by NaCl. Photosynthetica 31: 489-499. Sohrabi Y, Heidari Gh and Esmailpoor B, 2008. Effect of salinity on growth and yield of desi and kabuli
chickpea cultivars. Pak J Biol Sci 11: 664-667. Thomas JMG, Boote KJ, Allen LH, Gallo-Meagher M and Davis JM, 2003. Seed physiology and
metabolism: Elevated temperature and carbon dioxide effects on soybean seed composition and transcript abundance. Crop Sci 43: 1548-1557.
Winicov I and Seemann JR, 1990. Expression of genes for photosynthesis and the relationship to salt tolerance of alfalfa cells. Plant Cell Physiol 31: 1155–1161.
Yoshiba Y, Kiyosue T, Nakashima K, Yamaguchi KY and Shinozaki K, 1997. Regulation of leaves of proline as an osmolyte in plants under water stress. Plant Cell Physiol 38: 1095-1102.

Journal of Plant Physiology and Breeding
ISSN: 2008-5168 2011, 1(1): 9-23
Relationships Between Seedling Growth Rate and Yield of Maize Cultivars Under
Normal and Water Stress Conditions M Zharfa1*, AA Maghsoudi Moud2 and VR Saffari3
Received : 2 February 2010 Accepted : 27 June 2010
1Graduate student, Department of Agronomy and Plant Breeding, Faculty of Agriculture, S.B. University of Kerman, Kerman, Iran
2Assistant Professor, Department of Agronomy and Plant Breeding, Faculty of Agriculture, S.B. University of Kerman, Kerman, Iran
3Assistant Professor, Department of Plant Production, Faculty of Agriculture, S.B. University of Kerman, Kerman, Iran *Corresponding author. Email: [email protected] Abstract Effects of water stress on root and leaf growth rates and their relationships with yield under normal and water stress conditions were examined at the Greenhouse and Research Field of Faculty of Agriculture, Kerman University, Iran, using seven maize cultivars including SC-404, SC-704, BC-666, TC-647, DC-370, Jeta and Kordona. During a period of 14 days, water stress at -0.4 MPa was imposed by application of PEG-6000 to the seedlings. The root and leaf growth were measured every day. Leaf and root growth rates were expressed as the slope of the line fitted to the data of length and time. Results showed that water stress inhibited root and shoot growth in all cultivars. Differences were found among cultivars in terms of root and leaf growth rates. Differences were greater under normal compared with water stress condition. In a field experiment during 2007- 2008 growing season, yield performances of the same cultivars were measured under water stress and normal conditions. Correlation coefficients of yield with root (0.54), (0.10) and leaf (0.79), (0.32), (0.91), (0.63) growth rates were stronger under normal compared with water stress condition. Higher grain yield (mean of 10 plants per plot) of cultivars with higher growth rates under normal condition may be attributed to the higher growth rates at the early stages of growth. It could be also indicated that the higher growth rate ability of cultivars decreases when they are exposed to water stress condition. Keywords: Corn, Growth rate, Water stress, Yield Introduction Water stress adversely affects crop growth and yield in many regions of the world. (Teulat et al. 1997). Maintaining high water status plays an important role in tolerance to water stress and in yield stability of crop plants (Teulat et al. 1997). Different mechanisms such as developed
root systems are involved in maintaining plant water status at high levels and plant normal growth and functioning depends on the amount of water supplied by the root system. Under water stress condition, reduced root and shoot growth in maize (Kolarovic et al. 2006) and also root growth in wheat (Blum et al. 1988, Galle et

10 Zharfa et al. 2011, 1(1): 9-23
al. 2002 and Akmal and Hirasawa 2004) were reported. Water stress was also shown to decrease root and shoot dry weight in wheat (Kerepesi and Galiba 2000), root and stem dry weight in soybean (Michalek and Browski 2005) and root weight in maize (Chammacho and Caraballo 1994, Ogawa et al. 2005, Grzesiak et al. 2007), rice (Cui et al. 2008) and triticale (Grzesiak et al. 2007). Water stress reduced relative growth rate of adventitious roots in maize and millet (Blum 1986) and elongation rate of roots in maize (Ogawa et al. 2006). Root length and number of roots were shown to decrease under water stressed environment in maize (Ogawa et al. 2005) and rice (Cui et al. 2008). Leaf growth rate and number of leaves which are considered as stress tolerance indicators were reduced under water stress condition (Ingram and Bartels 1996, Veselov et al. 2002). As the level of water stress increased, leaf growth rate in barley, maize and rice (Lu and Neumman 1998) and leaf area in maize (Sobrado 1986) were shown to be decreased. Leaf wilting was also reported in maize under severe water stress conditions (Lu et al. 2007). Maize is usually grown in loamy soils in some parts of central region of Iran. Seedlings are, therefore, exposed to short term water stress as these types of soil often can not maintain the soil water content high enough to supply the required amount of water for normal growth of seedlings. Leaf rolling, usually observed by farmers, is, perhaps, the result of water stress as disappears right after irrigation. Maize hybrids with higher growth rates, particularly under water stress condition, may have advantages, because this could help them to stand vigorously at earlier stages of growth. The aims of this study were: i) to compare root
and leaf growth rates of maize cultivars at the seedling growth stage under normal and water stress condition imposed by PEG solutions and ii) to evaluate the yield performance of cultivars under the same stress conditions and iii) to investigate the relationship between seedling growth rate and grain yield. Materials and Methods a) Seedling experiment: In order to compare seedling root and leaf growth rates under water stress and normal conditions, an experiment was carried out under controlled condition in the Faculty of Agriculture, Kerman University, using seven maize cultivars of SC-404, SC-704, BC-666, TC-647, DC-370, Jeta and Kordona (Table 9). After germination, seedlings were grown four days in a hydroponic medium to make possible non-destructive sampling, especially root measurements. PVC tubes (160mm diameter) were divided longitudinally, closed at both ends, and tested for any leakage of water before starting the experiment. To provide oxygen for root respiration, an air pump was connected to a net of pips with porous ceramic heads fixed at the bottom of the half tubes. Uniform seeds in terms of size, weight, and shape were selected for sowing. Selected seeds, however, were weighted up to four decimal digits before sowing. Rootlets of pre-germinated seeds were carefully passed through the holes made on Styrofoam plates (with 10mm thickness) and were fixed so that the growing coleoptile was directed upward and seminal roots downward. The plates were then floated on the surface of full strength Hoagland nutrient solutions with a pH adjusted to 6.5 (Table 10). Seeds were pretreated with a fungicide (Vitawax) before sowing. The half tubes were fixed on greenhouse benches and

Relationships between seedling growth rate and yield ….. 11
Table1. Mean squares for length of root and the first (5 to 10) and second leaves (11 to 14) in maize seedlings grown under normal and water stress conditions
*,**: Significant at 5 and 1% probability level, respectively; ns: Non-significant; RWC: Relative Water Content
Days after sowing
S.V. df 5 6 7 8 9 10 11 12 13 14
Dry matte
r *104
RWC *104
Root 7.61ns 29.92ns 91.88** 179.34**
238.43**
322.32** 405** 491** 631** 740.9
** 30** Stress 1
Leaf 0.81ns 8.07ns 59.01** 119.58**
175.81**
190.19** 455** 628** 886** 1122.
5** 250** 640*
Root 6.87 6.52 7.85 12.1 10.37 10.92 9.6 8.43 9.83 10.13 0. 8 Error 1 3
Leaf 2.77 1.26 5.46 7.7 7.78 4.93 12.16 13.03 14.07 14.09 10 30
Root 4.98** 7.40** 9.11** 12.46** 15.26** 18.93** 21.8** 22.2** 25.4** 28.1** 3** Cultiva
r 6 Leaf 2.29** 2.48** 5.81** 7.14** 7.70** 7.57** 21.3** 23.3** 24.9** 30.48
** 35** 7ns
Root 1.86* 2.27 2.43ns 3.44ns 3.82ns 6.11* 6.8* 7.26* 8.05* 8.91* 0. 7ns Interaction 6
Leaf 0.55ns 1.21ns 2.08** 2.32ns 3.15ns 4.41** 1.60 ns 1.54ns 1.52ns 2.55ns 4ns 3ns
Root 0.75 1.01 1.41 1.85 2.16 2.34 2.46 2.79 3.26 3.73 0. 5 Error 2 36
Leaf 0.55 0.74 0.83 1.29 1.64 1.79 3 2.89 3.23 4.4 3 4

12 Zharfa et al. 2011, 1(1): 9-23
filled with sufficient amount of solution. There were no symptoms of nutrient deficiency in plants during growth. The experimental design was split-plot based on randomized complete blocks with four replications. Water stress and normal conditions were arranged in whole half tubes as main plots and nine plants of each cultivar on Styrofoam plates as sub-plots. Water stress was imposed by application of PEG solution to the related tubes (158g PEG per litter). Seeds were planted in three rows per plate. The rows were spaced three cm apart with three seeds per row. Four days after seedling emergence, PEG-6000 stock solution was applied to the main plots until the solution water potential was reached to -0.4MPa (Michel and Kaufmann 1973). The calculated amount of PEG-6000 solution was applied gradually at one hour intervals so that the solution water potential was decreased by -0.1MPa (Lu and Neumman 1998). Air temperature ranged from 25 to 33˚C during the day and 18 to 23˚C during the night time. Humidity ranged from 40 to 55%. Light intensity was kept constant at 1400molm-1s-1 during the day time. Root and leaf lengths were measured every day during a period of 14 days after sowing using a transparent ruler. Care was taken to avoid any damage to the seedlings during measurements. Seedlings were returned back to their place after each measurement. All measurements in a day were made within one hour. Data were subjected to analysis of covariance taking the initial seed weight as covariate. Since there was no significant effect of seed weight on seedling characteristics, analysis of variance was performed, without considering covariate, and means were compared using Duncan's multiple range tests.
Linear regression analysis was performed on root and leaf length data as dependent and time as independent variables. Slopes of the regressed lines were considered as the root and leaf growth rates. The regression coefficients were then compared using t- test (Steel and Torrie 1980). In each plot three leaf samples were taken from middle parts of the second leaf. Samples were weighted immediately (W1) and incubated under darkness over a wet sponge for four hours. Leaf saturated weight was then measured after removing the excess water from leaf samples by a tissue paper (W2). Samples were oven dried at 80˚C for 24 hrs and again were weighted (W3). The relative water content (RWC) of a sample was then computed as follows:
10032
31 ×−−
=WWWWRWC
Finally, seedlings were removed, divided into root and shoot parts, and oven dried. Root and shoot dry weights were then determined. b) Field experiment The same cultivars were grown in the experimental field of Shahid Bahonar University of Kerman on May 2008 under normal (irrigation at seven-day intervals) and water stress (irrigation at 15-day intervals) conditions. Again, the experiment was arranged in a split plot design based on three randomized complete blocks, with irrigation intervals and cultivars in main plots and sub-plots, respectively. In each plot, there were four rows, 70cm apart and 20cm space between the plants. Plots were supplied with sufficient amount of N-P-K fertilizers and were hand-weeded during the growth period. Plants in one square meter of

Relationships between seedling growth rate and yield ….. 13
the central rows in each plot were harvested at physiological maturity and their grain yield was recorded. Data were subjected to analysis of variance. Cultivar means were compared using Duncan's multiple range tests. Results a) Root growth: The effect of water stress was highly significant on root length of seedlings, two days after application of PEG solutions (Table1). Cultivar effect on root and leaf lengths during the growth period was also highly significant. Cultivar by stress interaction was only significant on root length after ten days (Table1). At the end of the experiment, Jeta showed the highest root length (15.62cm) and TC-647 the lowest root length (10.44cm) among cultivars (Table 2). b) Leaf growth: Lengths of the first and second true leaves were significantly affected by water stress after two days (Table1). Growth of the first and second leaves, 5 to 10 and 11 to 14 days after sowing, respectively, were significantly affected by water stress. Leaves were, generally, significantly affected by cultivar during the growth period (Table1). At the end of the experiment, Jeta and SC-404 showed the highest growth of the first leaf with 9.89 and 9.82 cm, respectively, while TC-647 with 7.22 cm showed the lowest growth (Table 3). In the case of second leaf, the highest and the lowest growth were recorded for SC-404 with 13.36 cm and TC-647 with 7.31 cm, respectively (Table 3). c) Seedling dry matter: Water stress and cultivar effects on seedling dry weight were significant. Generally seedling dry matter was lower under stress as compared with non-stress condition (Table1). The highest and the lowest root dry matter were observed in SC-404 and
TC-647 with 0.033 and 0.014g, respectively. In the case of leaf dry matter, the highest and the lowest values belonged to SC-404 (TC-647 with 0.095 and 0.034g, respectively) (Table 7). d) Leaf relative water content: Water stress significantly decreased leaf RWC and it was 6.9% lower under water stress compared with normal condition. However, cultivar effect on RWC was not significant (Table1). The highest and the lowest values of RWC were found in Jeta (93.8%) and SC-404 (91.3%), respectively (Table 7). e) Seedling growth rate: Under normal condition, root growth rate was significantly different among cultivars. However, the differences disappeared under water stress condition (Table 5). Generally, Jeta with 1.49 and DC-370 with 0.65cmday-1 showed the highest growth rates under normal and water stress conditions, respectively. On the other hand, TC-647 showed the lowest root growth rate under both normal and water stress conditions with 0.84 and 0.36cmday-1, respectively (Table 4) (Figure 1). The highest growth rate of the first true leaf was also found in Jeta (2.01cmday-1), while the lowest rate was obtained in DC-370 (1.18cmday-1). Under water stress condition SC-404 showed the highest and TC-647 showed the lowest growth rates with 0.96 and 0.54cmday-1, respectively (Table 4) (Figure 1). Under normal condition, Jeta with 2.09 and TC-647 with 1.40cmday-1 showed the highest and the lowest growth rates of the second leaf, respectively. However, under water stress condition, SC-404 and Kordona with 0.96 and BC-666 with 0.37cmday-1 showed the highest and the lowest values, respectively (Table 4) (Figure 1).

14 Zharfa et al. 2011, 1(1): 9-23

Relationships between seedling growth rate and yield ….. 15
Table 4. Root and first and second leaf growth rates of maize cultivars under normal and water stress condition
Normal Water stress Cultivar Y=1.10X+1.40 Y=0.56X+4.133 Root Y=1.56X-4.20 Y=0.96X-0.99 First leaf Y=1.92X-9.58 Y=0.96X-4.23 Second leaf
SC404
Y=.0.98X+2.26 Y=0.45X+3.26 Root Y=1.44X-3.43 Y=0.61X-0.33 First leaf Y=1.74X-10.18 Y=0.71X-5.00 Second leaf
SC-704
Y=1.06X+1.95 Y=0.52X+3.99 Root Y=1.40X-3.22 Y=0.71X+0.42 First leaf Y=1.66X-7.99 Y=0.37X+0.81 Second leaf
BC-666
Y=0.84X+2.06 Y=0.36X+2.44 Root Y=1.32X-3.58 Y=0.54X-0.81 First leaf Y=1.40X-7.66 Y=0.53X-4.52 Second leaf
TC-647
Y=1.25X+2.02 Y=0.65X+3.33 Root Y=1.183X-1.44 Y=0.75X+0.62 First leaf Y=1.69X-7.45 Y=0.46X+1.75 Second leaf
DC-370
Y=1.41X+1.86 Y=0.50X+3.73 Root Y=2.01X-6.76 Y=0.76X-0.81 First leaf Y=2.09X-12.0 Y=0.77X-4.68 Second leaf
Jeta
Y=1.37X+0.97 Y =0.51X+3.76 Root Y=1.6X-4.73 Y=0.87X-1.02 First leaf
Y=1.82X-10.63 Y=0.96X-4.23 Second leaf Kordona
Leaf growth rates of cultivars were more variable under water stress condition than under normal condition. The differences between cultivars in terms of the second leaf growth rate were also significant. The differences were again greater under stress compared with the normal condition. f) Yield and yield components: Water stress significantly affected yield and its components. Cultivar effect on grain yield and its components was also significant (Table 6). The highest and the lowest grain yields were found in Jeta (with 6.17t/ha) and TC-647 (with 2.36 t/ha), respectively (Table 7). There was no interaction between watering condition and cultivar for grain yield (Table 6). The highest grain numbers were found in SC-704 (524.64), Jeta (515.27) and the lowest in TC-647 (267.5). Furthermore, the highest values of 1000 grain
weight were found in SC-404 (169.03g) and Jeta (160.57g) and the lowest values in TC-647 (with 120.94g) (Table 7). g) Correlations: Significant correlation coefficients were found between root and leaf growth rates. Generally, correlations under normal condition were stronger than water stress condition. Positive correlation coefficients were found between root growth rate and grain yield, though they were not significant at 5% probability level. However, the correlations were stronger under normal compared to water stress condition. Correlations of the first and the second leaf growth rates with yield were significant only under the normal condition. The correlation in the case of the second leaf was stronger than

16 Zharfa et al. 2011, 1(1): 9-23
Table 5. Calculated t-student values used for the comparison of maize seedlings growth rates under normal and water stress conditions
SC-404 SC-704 BC-666 TC-647 DC-370 Jeta Normal 2.69* Root Stress 1.28 ns Normal 1.94ns First leaf Stress 18.99** Normal 2.44ns
SC-704
Second leaf Stress 7.03** Normal 0.93ns -1.68ns Root Stress 0.39 ns -0.86 ns Normal 1.88ns -0.03ns First leaf Stress 13.07** -7.76** Normal 4.08* 1.29ns
BC-666
Second leaf Stress 24.07** 12.08** Normal 6.14** 2.75* 4.74** Root Stress 2.53* 1.32 ns 2.10* Normal 2.94* 1.14 ns 1.16 ns First leaf Stress 14.71** 2.71* 6.75** Normal 7.52** 4.88** 4.13*
TC-647
Second leaf Stress 13.17** 5.06** -6.65** Normal -3.45** -5.34** -3.95** -8.56** Root Stress -0.97 ns -2.54* -1.42 ns -4.20** Normal 5.06** 3.46** 3.41** 2.14ns First leaf Stress 9.17** -7.74** -2.05ns -7.40** Normal 3.78* 0.94ns -0.44ns -7.52**
DC-370
Second leaf Stress 19.60** 8.75** -6.37** 3.01* Normal -7.42** -8.67** -7.54** -12.11** -3.51** Root Stress 0.72 ns -0.54 ns 0.318 ns -1.81 ns 1.83 ns Normal -3.78** -5.46** -5.38** -6.19** -7.79** First leaf Stress 8.21** -8.10** -2.70** -7.75** -0.63ns Normal -2.24ns -4.36* -5.92** -8.88** -5.69**
Jeta
Second leaf Stress 5.55** -1.79ns -16.06** -7.36** -12.12** Normal -8.22** -9.17** -8.02** -13.45* -3.11** 1.15ns Root Stress 0.60 ns -0.66 ns 0.20 ns -11.93 ns 1.69ns -0.11 ns Normal 3.64** -12.66** -7.49** -11.00** -4.85ns -4.10** First leaf Stress -0.41ns -2.33* -2.26ns -3.29* -5.33** 3.39** Normal 1.27ns -1.07ns -2.44ns -5.84** -2.12ns 3.28*
Kordona
Second leaf Stress 3.82* -1.95ns -11.65** -6.28** -9.15** -0.52ns
*, **: Significant at 5 and 1% probability level, respectively. ns: Non-significant.

Relationships between seedling growth rate and yield ….. 17
y = 1.4195x + 1.8613R2 = 0.9947
y = 0.8412x + 2.0626R2 = 0.993
02468
101214161820
0 1 2 3 4 5 6 7 8 91011121314
days after sowing
root
leng
ht (c
m) TC647
Jeta
y = 0.6521x + 3.3379R2 = 0.9808
y = 0.3667x + 2.4465R2 = 0.9839
02468
101214
0 1 2 3 4 5 6 7 8 91011121314
days after sowing
root
leng
ht (c
m) DC370
TC647
y = 2.0195x - 6.7605R2 = 0.9907
y = 1.1832x - 1.4404R2 = 0.9414
02468
10121416
4 5 6 7 8 9 1011121314
days after sowing
first
leaf
leng
ht (c
m)
Jeta
DC370
y = 0.9625x - 0.9959R2 = 0.9953
y = 0.5424x - 0.8116R2 = 0.8968
02468
1012
4 5 6 7 8 9 1011121314
days after sowing
first
leaf
leng
ht (c
m)
SC404
TC647
y = 2.0955x - 12.021R2 = 0.9995
y = 1.4022x - 7.669R2 = 0.8907
0
5
10
15
20
10 11 12 13 14
days after sowing
seco
nd le
af le
nght
(cm
)
Jeta
TC647
y = 0.9662x - 4.2315R2 = 0.9744
y = 0.3773x + 0.813R2 = 0.9443
0
2
4
6
8
10
10 11 12 13 14
days after sowing
seco
nd le
af g
row
th (c
m)
SC404
BC666
Figure 1. Linear regression lines showing the highest and the lowest growth rates of roots, first leaf and second leaf of maize seedlings grown under normal (left) and water stress (right) conditions

18 Zharfa et al. 2011, 1(1): 9-23
the case of the first leaf. On the other hand, mean seedling growth rate (roots and leaves) was significantly correlated with grain yield under normal condition (Table 8). Discussion This study showed the decline of root and leaf growth under water stress conditions. Retardation of growth under low water availability, was also reported by other workers in maize root (Vamerali et al. 2003, -Fan and Neumann 2004, Ogawa et al. 2006 and Kolarovic et al. 2006), leaf (Douglas and Paleg 1981, Sobrado 1986 and Lu and Neumann 1998) and other crop plants (Mian et al. 1993, Matsuura et al. 2000, Radhouane, 2007 and Aydi et al. 2008). It has been shown that water stress decreases the cell division and elongation rates and as a result decreases the growth rate of plants (Choi et al. 2000). Lower rates of cell division and cell elongation may be the cause of lower growth of roots and shoots under water stress condition. It was shown that leaf water potential decreases in water stressed plants due to decrease in leaf turgor pressure and as a result leaf elongation rate decreases (Hsiao 1973). Cell wall elasticity also decreases under water stress condition due to hormonal and hydraulic signals (Nilson and Orcut 1996). This in turn may reduce the final size of the cells (Nilson and Orcut 1996). Reduced values of root and shoot dry matter under water stress condition was reported in soybean (Michalek and Browski 2005), maize (Ogawa et al. 2006) and wheat (Kerepesi and Galiba 2000). Water stress also reported to reduce stem dry matter in sensitive cultivars compared to the tolerant genotypes
(Turkan, et al. 2005). In wheat, barley and bean, shoot dry matter was decreased under water stress condition (Samia 2008). Reduced shoot dry matter was also reported in maize (Chammacho and Caraballo 1994), and bean (Alyari et al. 2001). Reduced dry matter may be attributed to lower activities of photosynthetic enzymes under water stress condition (Abdalla and El-Khoshiban, 2007). Higher levels of triglycerides and sterylesters are shown in maize leaves under water stress environments (Douglas and Paleg 1981). Higher RWC in water stressed plants may be the result of lower rates of water loss due to stomatal closure and more developed root systems (Valentovic et al. 2006). Lower levels of RWC have been reported in maize (Valentovic et al. 2006) and triticale (Kayden and Yagmur, 2008) when confronted with water stress. Lower growth rates of leaves compared to the roots may be due to higher levels of water stress imposed on them. Since roots are in direct contact with solution, they may be exposed to lower levels of water stress. This may cause the roots to have higher growth rates. However, since roots have to penetrate into soil in the field, they may not show the same response as they did under hydro culture condition. Smith (1990) concluded that the difference between root and shoot growth under normal and water stress condition could be the result of accumulation of indigenous hormones and osmotic adjustment. In the water stress environment, the regular arrangement of microtubules in the cell walls changes and the level of ABA increases which limits cell growth (Lu et. al. 2007). On the other hand, higher concentration of osmolites
Relationships between seedling growth rate and yield ….. 19
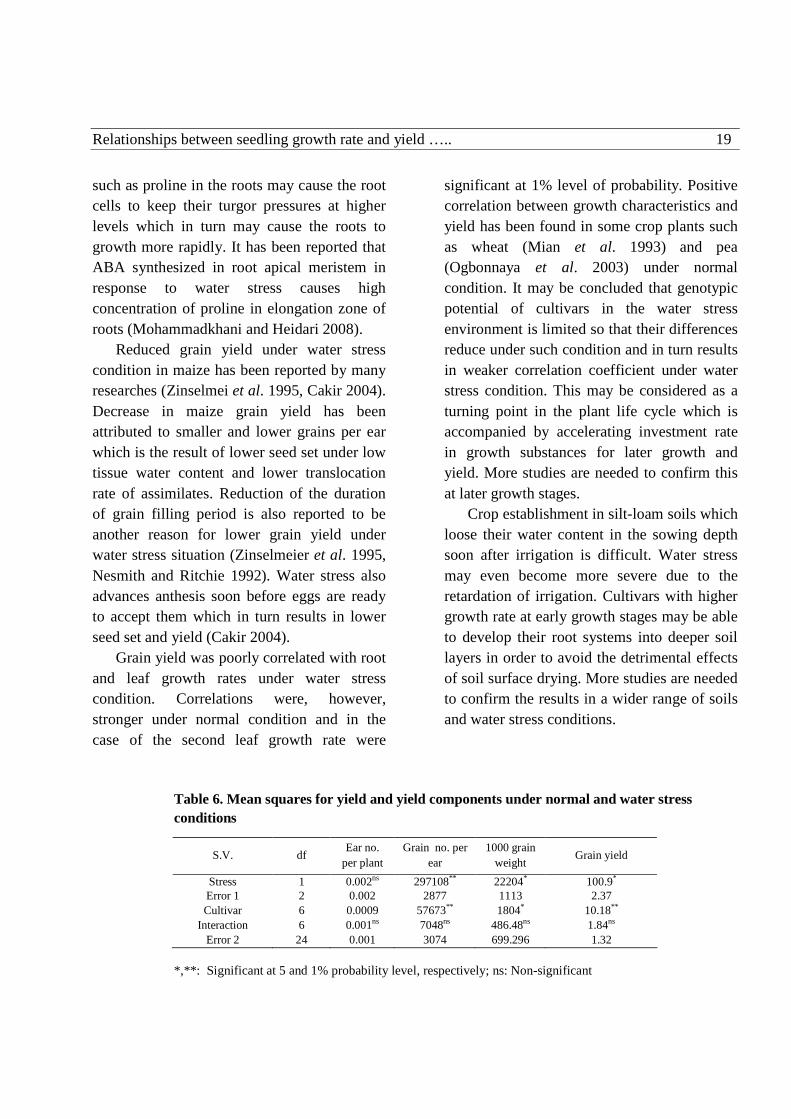
such as proline in the roots may cause the root cells to keep their turgor pressures at higher levels which in turn may cause the roots to growth more rapidly. It has been reported that ABA synthesized in root apical meristem in response to water stress causes high concentration of proline in elongation zone of roots (Mohammadkhani and Heidari 2008). Reduced grain yield under water stress condition in maize has been reported by many researches (Zinselmei et al. 1995, Cakir 2004). Decrease in maize grain yield has been attributed to smaller and lower grains per ear which is the result of lower seed set under low tissue water content and lower translocation rate of assimilates. Reduction of the duration of grain filling period is also reported to be another reason for lower grain yield under water stress situation (Zinselmeier et al. 1995, Nesmith and Ritchie 1992). Water stress also advances anthesis soon before eggs are ready to accept them which in turn results in lower seed set and yield (Cakir 2004). Grain yield was poorly correlated with root and leaf growth rates under water stress condition. Correlations were, however, stronger under normal condition and in the case of the second leaf growth rate were
significant at 1% level of probability. Positive correlation between growth characteristics and yield has been found in some crop plants such as wheat (Mian et al. 1993) and pea (Ogbonnaya et al. 2003) under normal condition. It may be concluded that genotypic potential of cultivars in the water stress environment is limited so that their differences reduce under such condition and in turn results in weaker correlation coefficient under water stress condition. This may be considered as a turning point in the plant life cycle which is accompanied by accelerating investment rate in growth substances for later growth and yield. More studies are needed to confirm this at later growth stages. Crop establishment in silt-loam soils which loose their water content in the sowing depth soon after irrigation is difficult. Water stress may even become more severe due to the retardation of irrigation. Cultivars with higher growth rate at early growth stages may be able to develop their root systems into deeper soil layers in order to avoid the detrimental effects of soil surface drying. More studies are needed to confirm the results in a wider range of soils and water stress conditions.
Table 6. Mean squares for yield and yield components under normal and water stress conditions
*,**: Significant at 5 and 1% probability level, respectively; ns: Non-significant
S.V. df Ear no. per plant
Grain no. per ear
1000 grain weight
Grain yield
Stress 1 0.002ns 297108** 22204* 100.9* Error 1 2 0.002 2877 1113 2.37 Cultivar 6 0.0009 57673** 1804* 10.18**
Interaction 6 0.001ns 7048ns 486.48ns 1.84ns Error 2 24 0.001 3074 699.296 1.32

20 Zharfa et al. 2011, 1(1): 9-23
Table 7. Root and leaf dry matter, relative water content (RWC) at seedling growth stage, yield and yield components of maize cultivars under study
Values within each column followed by the same letter are not significantly different at 0.05 probability level according to Duncan's test
Table 8. Correlation coefficients among root, shoot and seedling growth rates and grain yield under normal and water stress conditions
*, **: Significant at 5 and 1% probability level, respectively. ns: Non-significant
Yield (t/ha) 1000 grain
weight (g)
Grain no. per plant
Ear no. per
plant
RWC (%) Leaf dry matter (g)
Root dry matter (g)
Cultivar
5.13cde 169.03c 413.14b 1a 91.3a 0.095C 0.033d Sc404
5.44de 140.62abc 524.64c 1.01a 92.8ab 0.05a 0.019ab SC704
3.89bc 134.23abc 380.83b 1a 92.5ab 0.073b 0.027bcd BC666
2.36a 120.94a 267.5a 1a 91.5ab 0.034a 0.014a TC647
3.41ab 155.87bc 299.30a 1.03a 93.5ab 0.075bc 0.025bd DC370
6.17e 160.57bc 515.27c 1.01a 93.8b 0.085bc 0.031cd Jeta
4.23bcd 132.62ab 426.91b 1.01a 93.3ab 0.075bc 0.022ab Kordona
Root growth rate First leaf
growth rate Second leaf growth rate
Seedling growth rate
N S N S N S N S N Root growth rate S 0.54ns N 0.60ns -0.12ns First leaf growth rate S 0.62ns 0.64ns 0.38ns N 0.76* 0.39ns 0.81* 0.68ns Second leaf growth rate S 0.40ns -0.02ns 0.57ns 0.65ns 0.62ns N 0.71ns 0.12ns 0.96** 0.54ns 0.94** 0.62ns Seedling growth rate S 0.77* 0.44ns 0.80* 0.70ns 0.99** 0.58ns 0.93** N 0.56ns 0.18ns 0.79* 0.42ns 0.91** 0.47ns 0.88** 0.90** Grain yield S 0.28ns 0.09ns 0.56ns 0.32ns 0.76** 0.63ns 0.69ns 0.73ns

Relationships between seedling growth rate and yield ….. 21
Table 9. Maize cultivars characteristics used in the experiments Cultivar Grain yield
(t/ha) Response to abiotic
stresses Growing length
(day) 1000 grain weight (g)
SC-704 10-12 Non- tolerant to salt and drought
145-150 450
TC-647 8-9 Non- tolerant to salt and drought
115-125 440
DC-370 8-10 Relatively tolerant to salt and drought
90-110 280-420
SC-404 9-11 Relatively tolerant to salt and drought
100-115 450
BC 666 10-12 Sensitive to اdrought and
salt stress
120-140 400
Jeta 12-15 Relatively tolerant to salt and drought
120-140 300-400
Kordona 10-12 Relatively tolerant to salt and drought
120-140 300-400
Table10. Amount of chemical compounds used for making nutrient solutions according to Hoagland
Chemical compound Molecular weight Molarity (mmol)
Volume of solution needed for 1 liter of nutrient solution (ml)
NH4H2PO4 115.3 1000 2 Kno3 101.11 1000 6
Ca(NO3)2, 4H2O 236.15 1000 4 MgSO4, 7H2O 246.68 1000 1
HBO3 61.83 25 1 KCl 76 50 1
ZnSO4, 7H2O 287.54 2 1 CuSO4, 5H20 249.68 2 2.5 MnSO4, H2O 169.02 2 1
H2MOO4 162 2 1 NaEDTA
FeSO4, 7H20 373 278
1000 1
References
Abdalla M and El-Khoshiban NH, 2007. The influence of water stress on growth, relative water content, photosynthetic pigments, some metabolic and hormonal contents of two Triticium aestivum cultivars. Journal of Applied Sciences Research 3(12): 2062-2074.
Akmal M and Hirasawa T, 2004. Growth responses of seminal roots of wheat seedlings to a reduction in the water potential of vermiculite. Plant and Soil 267: 319–328.

22 Zharfa et al. 2011, 1(1): 9-23
Alyari H, Shekari F, Shekari, FB and Khoii FB, 2001. Effect of osmotic potential on growth of bean (Phaseolus vulgaris L.) under hydroponic conditions. Acta Horticulturae (ISHS) 644:199-204.
Aydi S, Aydi S, Gonzalez E and Abdelly C, 2008. Osmotic stress affects water relations, growth and nitrogen fixation in Phaseolus vulgaris plants Acta Physiologiae Plantarum 30(4):441-449.
Blum A, 1986. The comparative drought resistance of landraces of sorghum and millet from dry and humid regions. Annals of Botany 57: 835-846.
Blum A, Mayer J and Golan G, 1988. The effect of grain number per ear (sink size) on source activity and its water-relations in wheat. Journal of Experimental Botany 39(1): 106-114.
Cakir R, 2004. Effect of water stress at different development stages on vegetative and reproductive growth of corn. Field Crops Research 89: 1-16.
Chammacho RG and Caraballo DF, 1994. Evaluation of morphological characteristics in Venezuelan maize (Zea mays L.) genotypes under drought stress. Science Agriculture Piracicaba 51(3): 453-458.
Choi WY, Kang SY, Park HK, Kim SS, Lee KS, Shin HT and Chai SY, 2000. Effects of water stress by PEG on growth and physiological traits in rice seedlings. Korean Journal Crop Science 45(2): 112-117.
Cui K, Huang J, Xing Y, Yu S, Xu C and Peng S, 2008. Mapping QTLs for seedling characteristics under different water supply conditions in rice (Oryza sativa). Physiologia Plantarum 132(1): 53-68.
Douglas TJ and Paleg LC, 1981. Lipid composition of Zea mays seedlings and water Stress-induced changes. Journal of Experimental Botany 32: 499-508.
Fan L and Neumann PM, 2004. The spatially variable inhibition by water deficit of maize root growth correlates with altered profiles of proton flux and cell wall PH. Plant Physiology 135: 2291-2300.
Galle A, Csiszar J, Tari I and Erdei L, 2002. Changes in water and chlorophyll fluorescence parameters under osmotic stress in wheat cultivars. Plant Physiology 46(3-4): 85-86.
Grzesiak M, Rzepka TA, Hyra T, Hura T and Skoczowski A, 2007. Changes in response to drought stress of triticale and maize genotypes differing in drought tolerance. Photosynthetica 42(2): 280-287.
Hsiao TC, 1973. Plant responses to water stress. Annals Review of Plant Physiology 24: 519–70. Ingram J and Bartels D, 1996. The molecular basis of dehydration tolerance in plants. Plant Physiology 47: 337-
403. Kayden D and Yagmur M, 2008. Germination, seedling growth and relative water content of shoot in different
seed sizes of triticale under osmotic stress of water and NaCl. African Journal of Biotechnology 7(16): 2862-2868.
Kerepesi I and Galiba G, 2000. Osmotic and salt stress-induced alteration in soluble carbohydrate content in wheat seedling. Crop Science 40: 482-487.
Kolarovic L, Luxova M and Valentovic P, 2006. Effect of osmotic stress in early stages of ontogenesis on root respiration, growth, sugar content and cell injury in maize seedlings differing in drought sensitivity. Journal of Integrative Plant Biology 48: 814-832.
Lu B, Gong Z, Wang J, Zhang J and Ling J, 2007. Microtubule dynamics in relation to osmotic stress-induced ABA accumulation in Zea mays roots. Journal of Experimental Botany 58(10):1-8.
Lu Z and Nuemman PM, 1998. Water-stressed maize, barley and rice seedlings show species diversity in mechanisms of leaf growth inhibition. Journal of Experimental Botany 49(329): 1945-1954.
Matsuura A, Inanga S and Sugimoto Y, 2000. Growth of roots emerged from excised phytomers of three gramineous species under a low osmotic potential. Plant Production Science 3(1): 55-60.
Mian MAR, Nafziger ED and Teyker RH, 1993. Root growth of wheat genotypes in hydroponic culture and in the greenhouse under different soil moisture regimes. Crop Science 33: 283-286.

Relationships between seedling growth rate and yield ….. 23 Michalek S and Browski EA, 2005. Effect of simulated drought on stomatal conductance, transpiration and
growth of Polish soybean cultivars. Annales Universitatis Ma ia Ecurie - Sklodows ka Lubl in –Polonia 15: 105-110.
Michel BE and Kaufmann MR, 1973. The osmotic potential of poly ethylene glycol 6000. Plant Physiology 51: 914-916.
Mohammadkhani N and Heidari R, 2008. Drought induced accumulation of soluble sugars and proline in two maize varieties. World Applied Science Journal 3(3): 448-453.
Nesmith DS and Ritchie JT, 1992. Short and long-term responses of corn to a pre-anthesis soil water deficit. Agronomy Journal 84: 107-113.
Nilson ET and Orcut DM, 1996. The physiology of plants under stress. John Wiley and Sons, New York, USA. Ogawa A, Kawashima C and Yamauchi A, 2005. Sugar accumulation along the seminal root axis, as affected by
osmotic stress in maize: a possible physiological basis for plastic lateral root development. Plant Production Science 8(2): 173-180.
Ogawa A, Kawashima CH and Yamauchi A, 2006. Root osmotic adjustment under osmotic stress in maize seedling 2- Mode of accumulation of several solutes for osmotic adjustment in the root. Plant Production Science 9(1): 39-46.
Ogbonnaya CI, Sarr B, Brou C, Diouf O, Diop NN and Roy-Macauley H, 2003. Selection of cowpea genotypes in hydroponics, pots and field for drought tolerance. Crop Science 43: 1114–1120.
Radhouane L, 2007. Response of Tunisian autochthonous pearl millet (Pennisetum glaucum L.) R. Br.) to drought stress induced by polyethylene glycol6000. African Journal of Biotechnology 6(9): 1102-1105.
Samia ESS, 2008. Effect of salinity and osmotic stresses on some economic plants research. Journal of Agriculture and Biological Sciences 4(2): 159-166.
Smith H, 1990. Signal perception, differential expression within multi gene and the molecular basis of phenotypic plasticity. Plant Cell and Environment.13:585-594.
Sobrado MA, 1986. Tissue water relations and leaf growth of tropical corn cultivars under water deficits. Plant, Cell and Environment 9(6): 451-457.
Steel RGD and Torrie GH, 1980. Principles and Procedures of Statistics, a Biometrical Approach. Mcgraw-Hill Book Company, pp. 633
Teulat B, Monneveux P, Borries C, Souyris I, Charrier A and This D, 1997. Relationships between relative water content and growth parameters under water stress in barley: a QTL study. New Phytologiest 137: 99-107.
Turkan I, Bor M, Ozdemir F and Koca H, 2005. Differential responses of lipid peroxidation and antioxidants in the leaves of drought-tolerant P. acutifolius Gray and drought-sensitive P. vulgaris L. subjected to polyethylene glycol mediated water stress. Plant Science 168: 223-231.
Valentovic P, Luxova M, Kolarovic L and Gasparikova O, 2006. Effect of osmotic stress on compatible solutes content, membrane stability and water relations in two maize cultivars. Plant Soil and Environment 52 (4): 186-191.
Vamerali T, Saccomani M, Bano S, Mosca G, Guarise M and Ganis A, 2003. Comparison of root characteristics in relation to nutrient and water stress in two maize hybrids. Plant and Soil 255: 157–167.
Veselov DS, Mustafina AR, Sabirjanova IB, Akhiyarova GR, Dedov AV, Veselov SU and Kudoyarova GR, 2002. Effect of PEG-treatment on the leaf growth response and auxin content in shoots of wheat seedlings. Plant Growth Regulation 38: 191-194.
Zinselmeier C, Westgate ME and Jones RJ, 1995. Kernel set at low water potential does not vary with source/sink ratio in maize. Crop Science 35: 158-163.

Journal of Plant Physiology and Breeding ISSN: 2008-5168 2011, 1(1): 25-38
The Effect of Water Stress on Remobilization of Pre-anthesis Stored Assimilates to Grains in Wheat A Maghsoudi Moud1* and M Islami2
Received : 16 February 2010 Accepted : 27 September 2010
1Assistant Professor, Dept. of Agronomy and Plant Breeding, Faculty of Agriculture, S.B. University of Kerman, Kerman, Iran.
2Graduate student, Dept. of Agronomy and Plant Breeding, Faculty of Agriculture, S.B. University of Kerman, Kerman, Iran.
* Corresponding author : E-mail: [email protected]
Abstract Five bread wheat (Triticum aestivum L.) cultivars including Kavir, Pishtaz, Niknejad, Omid and Roshan were evaluated in a split plot experiment based on randomized complete block design with three replications. Water stress and well-watered conditions were assigned to the main plots and varieties to the subplots. Water stress was imposed by withholding irrigation at the booting stage. During a period of 45 days, which spanned before and after anthesis, plants were sampled and changes in dry matter of peduncle and penultimate internodes were assessed. An increase in grain weight was accompanied with a decrease in peduncle and penultimate internodes dry matter, which could be attributed to the remobilization of stored assimilates to grains. Remobilization of stored assimilates was relatively higher under water-stress condition as compared with the well-watered environment. Under water stress condition, tall cultivars remobilized more assimilates than the dwarf genotypes. In the well-watered plots, remobilization percentage from peduncle was more than penultimate internodes in tall varieties as compared with the dwarf varieties. On the other hand, under water stress condition, more assimilates were remobilized from penultimate than the peduncle in dwarf varieties as compared to the tall genotypes. In the dwarf genotypes assimilates remobilization was reduced under water stress conditions while it was increased in the tall cultivars. Keywords: Assimilate, Drought, Remobilization, Wheat
Introduction Different physiological processes are involved in grain development and yield of wheat crop under water stress condition (Austin 1989, Richards 1996). Current photosynthesis, remobilization of assimilates stored in the
vegetative organs and cell division are among the most important factors (Rawson and Hoestra 1969, Austin et al. 1977, Nicolas et al. 1985, Austin 1989, Davidson and Chevalier 1992). Sufficient amount of light, water and nutrient elements in the growing media are also

26 Maghsoudi and Islami 2011, 1(1): 25-38 necessary for physiological processes to take place at optimum level (Levitt 1983). To reduce the detrimental effect of drought on yield, many plants including cereals store carbohydrates in the vegetative organs such as stems and leaves before reproductive stage and then remobilize them into the grains (Nicolas et al. 1985, Kobata et al. 1992, Kobata et al. 1994, Ehdaie and Waines 1996, Richards 1996). This feature has been proposed as a selection criterion for selecting more stable genotypes in terms of grain yield particularly under water stress condition (Blum et al. 1991, Regan 1993, Ehdaie and Waines 1996, Nicolas 1996). This may cause both biological and grain yield to increase under such a stressful condition. Wheat is the most important crop plant grown in the semi-arid regions of Iran in which usually experiences water stress during grain filling period. Under such conditions, normal grains could be obtained if pre-anthesis stored carbohydrates in the stem can be remobilized efficiently (Blum et al. 1983a, Blum et al. 1983b, Ehdaie and Waines 1996). Pre-anthesis assimilates were shown to provide up to 27% of the final grain yield (Bedinger et al. 1977) and even more under dry environmental conditions (Pheloung and Siddique 1991). In wheat, genotypic variation has been found for translocation efficiency (Blum et al. 1991, Regan et al. 1993, Ehdaie and Waines 1996) though environmental conditions significantly affect genotypes ability to remobilize the stored assimilates. Application of a chemical desiccant at post-anthesis stage can stop current photosynthesis.
Therefore, tolerance to drought stress, in terms of translocation-based grain filling can be evaluated by comparison of cultivars without active leaves but with carbohydrate stores in their stems (Regan et al. 1993). In wheat, selecting such plants with large grains led to the improvement of grain weight (Regan et al. 1993). There are few reports regarding the role of pre-anthesis stored assimilates on grain filling of wheat under water stress condition (Shakiba et al. 1996). This study was, then, performed to investigate the effect of water stress on remobilization of assimilates from main stem internodes to the grains in tall and dwarf varieties of wheat. For this purpose, several bread wheat cultivars, recommended for planting in dryland conditions of the central and southern part of Iran, were used in the experiment. Materials and Methods
This experiment was conducted in the research field of Faculty of Agriculture, Kerman University with an average annual precipitation of 143.2 mm in 2004- 2005. Seeds of five bread wheat cultivars including three dwarf (Kavir, Pishtaz, Niknejad) and two tall (Omid and Roshan) genotypes which were recommended for planting in warm dryland conditions of central and southern parts of Iran, were sown in 5×2 square meter experimental plots. Two groups of such plots were considered as main plots and randomly assigned to two different water supplying regimes. During the period from seeding to the

The Effect of Water Stress on Remobilization of….. 27
beginning of stem elongation, all plots were normally irrigated and thereafter well-watered plots were continued to be irrigated whereas the water stressed plots not irrigated to provide water stress development in plants. Well-watered plots were irrigated at booting, flowering and grain filling stages. Plots were replicated three times, based on a randomized complete block design, each with a different randomly arrangement of sub-plots (five wheat cultivars). During a period of 45 days before and after anthesis, plants was sampled and divided into peduncle and penultimate internodes, ears and grains. These parts were then oven dried at 75°C for 72 hrs and weighted. Samplings were done at ear emergence, 50% flowering, early grain filling (milky stage), mid grain filling (dough stage) and physiological maturity. Each time six plants per plot were sampled. Dry matter changes of these parts-expressed as the sample means-before and after anthesis were then calculated. Positive differences between dry matter at two successive stages were attributed to the storage of assimilates and negative values to remobilization to the grains. Remobilization percentage (R%) was calculated using the following equation:
100%1
21 ×−
=d
ddR
In which, d1 is the internode dry weight at the stage with highest value and d2 is its dry weight at physiological maturity. In order to determine the stress level imposed to the plants during the growth period right after the last irrigation in water stressed
plots, segments of flag leaves were taken from both well-watered and water-stressed plants at flowering, milky and soft dough stages. All samples in a day were taken within one hour at 11:00-12:00 AM local time. Immediately after cutting, fresh leaf weight was measured (FW). Then, leaf samples were immediately saturated to full turgidity on the lower shelf of a lab refrigerator (about 8-10oC) in darkness over a wet sponge for 4 hrs and again were weighted (SW). Finally, samples were oven dried at 80oC for 24 hrs and weighted (DW). Leaf relative water content (RWC) was, then, calculated using the following equation:
100DWSWDWFWRWC ×
−−
=
Data were subjected to analysis of variance. Mean values were compared using Duncan's multiple range test. Results and Discussion a) Leaf RWC: At all three sampling stages, well-watered plants had higher RWC than water-stressed plants. Under both well-watered and water-stressed conditions, RWC was higher in the first than the second and third sampling stages Results also showed that at all stages Roshan and Omid (tall varieties) had the highest RWC as compared to the dwarf genotypes. Generally, Roshan indicated the highest RWC at all sampling stages under well-watered and Omid under water stress condition (Table 1). Several mechanisms has been proposed to be responsible for higher RWC under such conditions such as partially opened stomata, smaller leaf area, leaf rolling and osmotic adjustment (Jones & Lezenby 1988,

28 Maghsoudi and Islami 2011, 1(1): 25-38 Saneoka, 1996), enhancement of senescence in extra leaves, leaf orientation on stem and leaf angel to stem (Humphreys 1981, Levitt 1983, Austin 1989). b) Grain dry weight: During the sampling period, grain dry weight was increased up to maturity under both well-watered and water stressed conditions. However, almost in all cultivars grain dry weight was higher in well-
watered as compared to the water-stressed condition. On the other hand, grain weight tended to increase more sharply under water stress condition particularly at later growth stages, as shown in Figure 1. This may be due to higher rates of assimilate remobilization from internodes to the grains under stress condition.
Table 1. Relative water content rates (%) of flag leaf at flowering, milky and soft dough sampling stages
Well-watered Water-stressed
Stage Roshan Pishtaz Kavir Omid Niknejad Roshan Pishtaz Kavir Omid Niknejad
Flowering 97.4a 95.9ab 94.7bc 93.0cd 92.0d 89.9e 86.6f 82.7g 88.8e 84.2g
Milky 96.6a 96.0a 92.0b 93.1b 90.3b 83.1d 71.3f 68.6c 78.3e 71.0f
Soft dough 92.3a 91.0ab 89.0b 89.3ab 88.5b 78.6c 66.6e 63.6f 75d 67.3e
Differences between mean values within each sampling stage which are followed by the same letter are not significantly different at 5% level of probability.
c) Peduncle dry weight: Significant
differences were found for peduncle dry weight
under both well-watered and water-stressed
conditions (Table 2). In all varieties, peduncle
dry weight increased up to a maximum value
and then decreased up to physiological maturity
(Figures 1 & 2). In all varieties the increase in
peduncle dry weight continued until the middle
of the grain filling stage under well-watered
condition, except Omid that had the highest dry
weight in the early grain filling; thereafter dry
weight decreased until physiological maturity
(Figure 2). In both environments, dry weight of
all varieties was then started to decrease until
plants reached physiological maturity. The rate
of decrease was more in water-stressed as
compared with the well-watered condition. This
may be the result of the adverse effect of water
stress on photosynthesis, less amount of stored
assimilates in stem or beginning of remobili-
zation from peduncle to grains. Under water
stress condition, Omid and Pishtaz at the
flowering, Roshan and Kavir at the early grain
filling and Niknejad at the middle of grain
filling stages had the highest dry weight (Figure
1). Under well-watered condition due to higher
amounts of stored assimilates, plants continued
to store assimilates in peduncle for a longer

The Effect of Water Stress on Remobilization of….. 29
Roshan
0
0.005
0.01
0.015
0.02
0.025
0.03
0.035
0.04
120 140 160 180 200
Days after sowing
Gra
in d
ry w
eigh
t (g)
Omid
0
0.005
0.01
0.015
0.02
0.025
0.03
0.035
140 150 160 170 180 190 200
Days after sowing
Gra
in d
ry w
eigh
t (g)
Kavir
0
0.005
0.01
0.015
0.02
0.025
0.03
120 140 160 180 200
Days after sowing
Gra
in d
ry w
eigh
t (g)
Niknegad
0
0.005
0.01
0.015
0.02
0.025
0.03
0.035
120 140 160 180 200
Days after sowing
Gra
in d
ry w
eigh
t (g)
Pishtaz
0
0.005
0.01
0.015
0.02
0.025
0.03
0.035
120 140 160 180 200
Days after sowing
Gra
in d
ry w
eigh
t (g)
Figure 1. Time course of wheat cultivars grain dry weight change at different growth stages under well watered (triangles) and water-stressed (circles) conditions

30 Maghsoudi and Islami 2011, 1(1): 25-38 period of time as compared with the water stress condition. Decrease in dry matter was started earlier in water-stressed plants due to more sink demand for assimilates and carbohydrates (Shakiba et al. 1996). d) Penultimate internode dry weight: Effects of water condition, variety, and their interaction
were significant on remobilization percentage of dry matter in the penultimate internode (Table 2). All varieties reached the highest value of penultimate dry weight during grain filling stage (Figures 3 & 4). In the well-watered condition, penultimate internode dry weight of all varieties
Table 2. Effects of water stress condition and variety on peduncle and penultimate internode dry weight during pre-and post-anthesis growth stages of wheat
Ear emergence Flowering 50% flowering Mid grain filling Maturity SV df
Peduncle penultimate Peduncle penultimate Peduncle penultimate Peduncle penultimate Peduncle penultimate
Water Stress 1 ns * ** * ** ns ** ** ** **
Variety 4 ns ** ns ** ** * * * * **
Interaction 4 ns ns ns ns ** ns ns * ** **
* and **: Significant at 5% and 1% probability levels, respectively. ns: Non-significant was more than the water-stressed condition. Under water stress treatment, Roshan at the flowering and other varieties at the early grain filling stages had the highest penultimate dry weight and thereafter, started to decrease until physiological maturity (Figure 4). Under well-watered condition, Omid at the flowering and other varieties at the mid-grain filling stages had the highest penultimate internode dry weight and thereafter decreased in all varieties until physiological maturity (Figure 3). Under well-watered condition, plants were expected to continue to store assimilates in the penultimate internode for a longer period of time than water-stressed condition, which may be due to higher levels of relative water content. In the water stressed plants, the penultimate dry weight decreased which could be due to lower rates of
hotosynthesis and higher rate of respiration and sinks demand for assimilates (Shakiba et al. 1996). e) Peduncle remobilization percentage (R%): Results showed that after reaching to its maximum dry matter, peduncle dry weight started to decline from grain filling to physiological maturity indicating that assimilates move to the grains. Effects of water stress, variety and water stress × variety interaction on the percent of remobilized assimilates were significant (Table 3). Roshan and Pishtaz, with 36.9% and 25.4%, showed the highest and lowest remobilization, respectively. The difference between water-stressed and well-

The Effect of Water Stress on Remobilization of….. 31
Omid
00.050.1
0.150.2
0.250.3
0.350.4
120 130 140 150 160 170 180 190 200
Days after sowing
Dry
mat
ter
(gr)
Roshan
00.050.1
0.150.2
0.250.3
0.350.4
120 130 140 150 160 170 180 190 200
Days after sowing
Dry
mat
ter
(gr)
Kavir
00.050.1
0.150.2
0.250.3
0.35
120 130 140 150 160 170 180 190
Days after sowing
Dry
mat
ter
(gr)
Niknejad
00.050.1
0.150.2
0.250.3
0.35
120 130 140 150 160 170 180 190
Days after sowing
Dry
mat
ter
(gr)
Pishtaz
00.050.1
0.150.2
0.250.3
0.350.4
120 130 140 150 160 170 180 190
Days after sowing
Dry
mat
ter
(gr)
Figure 2. Time course of wheat cultivars peduncle dry weight change at different growth stages under well-watered (triangles) and warter stress (circles) conditions

32 Maghsoudi and Islami 2011, 1(1): 25-38 watered conditions for the percentage of assimilates remobilization was also significant (data not shown). Mean values for water-stressed and well-watered conditions were 28.4% and 33.3٪, respectively (Figure 4). It has been reported that contribution of the pre-anthesis assimilates of stem to grain was greater under drought (46.6%) than well-watered (29.5%) field conditions (Pheloung and Siddique 1991). In the well-watered plants, assimilate remobilization ranged from 13.8٪ in Omid to 44.4٪ in Niknejad (Figure 4). On the other hand, under water stress condition assimilate remobilization was lowest in Niknejad (8.57%) and highest in Roshan (52.68%) and Omid (50.40%) (Figure 4). Under the well-watered condition, tall varieties (Omid and Roshan) had the lowest R% from peduncle to the grains while dwarf genotypes, particularly Niknejad, indicated the highest value. In the water stress condition, tall varieties showed the highest R% (Figure 4) and, generally, it was two to three times more than the R% observed in the plants under well-watered condition. R% declined in the dwarf varieties under the water stress condition. Obviously, photo-assimilates have to move in a longer distance in the tall varieties. This in turn may increase the hydraulic resistance of the phloem against the movement of photo-assimilates (Setter 1993). Therefore, increasing the hydraulic resistance may not be considered as the cause of decreased R% in the dwarf cultivars unless the increasing resistance is caused by reducing the diameter of the phloem elements (O'Brien et al. 1985). On the other hand, slower rate of photo-assimilate
remobilization as a result of lower capacity of the dwarf varieties to store photo-assimilates produced before anthesis and lower sink demand for assimilates due to smaller grains and slower rate of endosperm cell division (Ober et al. 1991, Setter & Flannigan 2001) may also be considered as the cause of lower R%. Significant water stress × variety interaction indicated that R% in different varieties were different in well-watered and water stress conditions. It has been shown that, at first, assimilates mobilize from fully expanded leaves to enhance developing organs and this mobilization takes place separately in each stem and tiller (Rawson & Hoestera 1964). Leaf assimilates are then temporarily stored in the peduncle and penultimate internodes. Assimilates from flag leaf were shown to be used as the main source for remobilization to the grains (Rawson & Hoestera 1964). More partitioning of the flag leaf assimilates has been observed in tall varieties and at the beginning of enhanced kernel growth (Madore and Waines 1996) and a decline of dry weight was observed that is due to the movement of dry matter or respiration (Rawson & Evans 1971). Internode weight at anthesis and post-anthesis was higher in tall varieties as compared with semi dwarf genotypes (Nicolas et al. 1985, Madore and Waines 1996). In our experiment, tall varieties also showed higher peduncle biomass and more remobilization from this organ. Other researchers also reported the same results in wheat (Phelonge and Siddique 1991, Madore and Waines 1996, Ehdaei and Waines 1996). Austin et al. (1977) showed that remobilization

The Effect of Water Stress on Remobilization of….. 33
of stored assimilates to grains was higher in tall varieties in which stem and leaf dry weight decreasd rapidly after anthesis, so higher remobilization in the tall varieties was expected to be due to faster remobilization of assimilates to grains. Among the dwarf varieties, Kavir had the highest R% (40.9%) and Omid and Roshan had the lowest value in the well-watered than water stressed treatments (Figure 4). Remobilization in the tall varieties was two or three times higher in the water stress
condition as compared with the well-watered condition. A decline was observed in the dwarf varieties. Among dwarf varieties, the highest R% was observed in Kavir and Niknejad under water stress and well-watered conditions, respectively. Rawson and Evans (1971) reported the higher possibility of lower storage and susceptibility to environmental stresses in modern dwarf varieties.
Table 3. Effects of water stress condition and variety on peduncle and penultimate internode remobilization percentage
SV df Remobilization percentage
peduncle penultimate
Water stress 1 * **
Variety 4 * ns
Interaction 4 ** **
* and **: Significant at 5% and 1% probability levels, respectively. ns: Non-significant f) Penultimate internode remobilization percentage (R%): Data analysis showed that withholding irrigation caused significant decrease in penultimate dry matter in all varieties. Water stress and water stress × variety interaction were significant for the percent of remobilized assimilates (Table 3). Considering penultimate internode, Kavir and Omid, with 47.9% and 39.1%, showed the highest and the lowest remobilization percentage, respectively. Under well-watered and water-stressed
conditions mean R% were 39.4% and 50.4%, respectively. Under the well-watered condition R% from penultimate internode ranged from 53.5% in Niknejad to 16.5% in Omid (Figure 5). In the water-stressed plants, however, it ranged from 61.7% in Omid to 39.3% in Pishtaz (Figure 5). In Omid, Roshan and Kavir, R% from penultimate in the water-stressed condition was more than the well-watered condition. However, it was lower in Pishtaz and Niknejad. Omid and

34 Maghsoudi and Islami 2011, 1(1): 25-38
Omid
00.050.1
0.150.2
0.250.3
0.350.4
120 130 140 150 160 170 180 190 200
Days after sowing
Dry
mat
ter
(gr)
Roshan
00.050.1
0.150.2
0.250.3
0.350.4
120 130 140 150 160 170 180 190 200
Days after sowing
Dry
mat
ter
(gr)
Kavir
00.050.1
0.150.2
0.250.3
0.350.4
120 130 140 150 160 170 180 190
Days after sowing
Dry
mat
ter
(gr)
Niknejad
00.050.1
0.150.2
0.250.3
0.350.4
120 130 140 150 160 170 180 190
Days after sowing
Dry
mat
ter
(gr)
Pishtaz
00.050.1
0.150.2
0.250.3
0.350.4
120 130 140 150 160 170 180 190
Days after sowing
Dry
mat
ter
(gr)
Figure 3. Time course of wheat cultivars penultimate internode dry weight change at different growth stages under well watered (triangles) and water-stressed (circles) conditions

The Effect of Water Stress on Remobilization of….. 35
05
101520253035404550
Roshan Pishtaz Kavir Omid Niknejad
Rem
obili
zatio
n Ra
te (%
)
0
10
20
30
40
50
60
Roshan Pishtaz Kavir Omid Niknejad
Rem
obili
zatio
n Ra
te (%
)
FigureFigureure 4. Stored assimilates remobilization (%) from peduncle to grains in wheat cultivars grown under well-watered (left) and water-stressed (right) conditions
Roshan (tall varieties) had the highest R% in the
water-stressed environment. Omid and Roshan,
with 61.7% and 55.5%, had the highest R%
under water-stressed condition. R% increased to
more than three folds in Omid. In tall varieties,
R% from peduncle and penultimate internodes
were higher. Madore and Waines (1996) also
reported the same results. In the case of Omid
and Roshan, remobilization rate under well-
watered condition decreased to less than 50% of
the water stress condition. In the water-stressed
condition, R% decreased in the dwarf varieties
but increased in the tall genotypes. In the dwarf
varieties, R% from penultimate was more than
peduncle under both conditions. The same
results were observed in the tall varieties
although the differences between the two
sources were low. Nicolas et al. (1985) found
that sources were low. Nicolas et al. (1985)
found that sources were low. Nicolas et al.
(1985) found that three days before
flowering,assimilates start to accumulate in the
penultimate internode and reach their maximum
values nine days after anthesis. At this period
source of assimilates precedes sink demand.
Davidson and Chevaliar (1992) concluded that
among internodes, penultimate was the strongest
internode to reserve assimilates, coming from
leaf blades, and later remobilization of them to
the ear. Mador and Waines (1996) reported that
mean R% from the penultimate internode was
more than peduncle showing its higher
contribution to grain filling. As the
photosynthetic machinery of plants is working at
its highest capacity, the penultimate internode

36 Maghsoudi and Islami 2011, 1(1): 25-38
0
10
20
30
40
50
60
70
Roshan Pishtaz Kavir Omid Niknejad
Rem
obili
zatio
n Ra
te (%
)
0
10
20
30
40
50
60
70
Roshan Pishtaz Kavir Omid Niknejad
FigureFigureure 5. Stored assimilates remobilization (%) from penultimate internode to grains in wheat cultivars grown under well-watered (left) and water-stressed (right) conditions
dry weight, after full elongation, starts to increase indicating the availability of assimilates needed for both plant structure and reservation in stem tissues. Remobilization of stored dry matter from the second internode to the top of the stem and ear then makes the internodes dry weight to decrease. Respiration is also responsible for stem dry matter decrease particularly because air and plant canopy temperature begin to increase later in the growing season, which coincides with the grain filling stage (Rawson & Evans 1971, Austin 1977, Austin 1989, Phelonge & Siddique 1991, Davidson & Chevaliar 1992). Current leaf photosynthesis can not compensate for such high levels of respiration particularly under stress condition (Phelonge & Siddique 1991).
Under such conditions, remarkable amounts of dry matter are expected to come from pre-anthesis storages to fill the grains (Gent 1994). Varieties showed a faster decrease in internode dry weight under water stress condition. Both peduncle and penultimate internodes had a role in remobilization. Higher R% of the tall varieties as compared with the dwarf genotypes could be due to higher levels of water status which is reflected in the higher flag leaf RWC, higher photosynthetic activity and efficiency of remobilization from both internodes (Rawson & Evans, 1971, Madore and Waines 1996). Although remobilization was observed under both growing conditions but it was more under the water stress than the well-watered condition.

The Effect of Water Stress on Remobilization of….. 37
References
Austin RB, 1989. Maximizing crop production in water-limited environments. In: Baker FWG (Ed). Drought Resistance in Cereals. CAB International, pp. 13-25.
Austin RB, Edrich JA, Ford MA and Blackwell RD, 1977. The fate of the dry matter, carbohydrates and C14 lost from the leaves and stems of wheat during grain filling. Annals of Botany 41: 1306-1321.
Bedinger F, Muscarve RB and Fisher RA, 1977. Contribution of stored pre-anthesis assimilates to grain yield in wheat and barley. Nature 270: 431-433.
Blum A, Poyarkova H, Golan G and Mayer J, 1983a. Chemical desiccation of wheat plants as a simulator of post-anthesis stress. I. Effects on translocation and kernel growth. Field Crops Research 6: 51-58
Blum A, Mayer J and Golan G, 1983b. Chemical desiccation of wheat plants as a simulator of post-anthesis stress. II. Relations to drought stress. Field Crops Research 6: 149-155.
Blum A, Shipler L, Golan G, Mayer J and Sinmena B, 1991. Mass selection of wheat for grain filling without transient photosynthesis. Euphytica 54: 111-116.
Davidson DJ and Chevalier PM, 1992. Storage and remobilization of water–soluble carbohydrates in stems of spring wheat. Crop Science 32: 186- 190.
Ehdaie B and Waines JG, 1996. Genetic variation for contribution of pre-anthesis assimilation to grain yield in spring wheat. Journal of Genetic and Breeding 50: 48-56.
Humphreys LR, 1981. Environmental Adaptation of Tropical Pasture Plants. Macmillan, London. Jones MB and Lezenby A, 1988. The Grass Crop (The Physiological Bases of Production). Chapman and Hall,
New York. Pp. 369 Kobata T, Palta AJ, Turner NC and Fillery IR, 1994. Remobilization of carbon in wheat as influenced by post-
anthesis water deficits. Crop Science 34: 118-124. Kobata T, Plata JA and Turner NC, 1992. Rate of development of post-anthesis water deficit and grain filling of
spring wheat. Crop Science 32: 1238-1242. Levitt J, 1983. Response of Plant to Environmental Stresses. Academic Press, New York. Madore MA and Waines JG, 1996. Contribution of internode reserves to grain yield in a tall and semi-dwarf
spring wheat. Journal of Genetics and Breeding 50: 91-100. Nicolas ME, 1996. Genetic variation for contribution of pre-anthesis assimilates to grain yield in spring wheat.
Journal of Genetics and Breeding 50: 47-56. Nicolas ME, Lambers H, Simpson RJ and Dalling MJ 1985. Effect of drought on metabolism and partitioning of
carbon in two wheat varieties differing in drought tolerance. Annals of Botany 55: 727-747. Nicolas ME and Turner NC, 1993. Use of chemical desiccation and senescing agents to select wheat lines
maintaining stable grain size during post anthesis drought. Field Crop Research 31: 155-171. Ober ES, Setter TL, Madison JT, Thompson JF and Shapiro PS, 1991. Influence of water deficit on maize
endosperm development. Enzyme activities and RNA transcripts of starch and zein synthesis, abscisic acid, and cell division. Plant Physiology 97: 154–164.
O'Brien TP, Sammut ME, Lee JW and Smart MG. 1985. The vascular system of the wheat spikelet. Australian Journal of Plant Physiology 12: 487–512.
Pheloung PC and Siddique KHM, 1991. Contribution of stem dry matter to grain yield in wheat cultivars. Australian Journal of Plant Physiology 18: 53-64.
Plaut Z, Butow BJ, Blumenthal CS and Wrigley CW, 2004. Transport of dry matter into developing wheat kernels and its contribution to grain yield under post-anthesis water deficit and elevated temperature. Field Crops Research 86: 185-198.
Rawson HM and Evans L, 1971. The contribution of stem reserves to grain development in a range of wheat cultivars of different height. Australian Journal of Agricultural Research 22: 851-863.
Rawson HM and Hoestra G, 1969. Translocation and remobilization of C14 assimilated at different stages by each leaf of wheat plant. Australian Journal of Biological Science 22: 321-331.

38 Maghsoudi and Islami 2011, 1(1): 25-38 Regan KL, Whan BR and Turner NC, 1993. Evaluation of chemical desiccation as a selection technique for
drought resistance in a dryland wheat breeding program. Australian Journal of Agricultural Research 44: 1683-2691.
Richards RA, 1996. Defining selection criteria to improve yield under drought. Plant Growth Regulation 20: 157-166.
Saneoka H, Ogata S and Agata W, 1996. Cultivars differences in dry matter production and leaf water relation in water-stressed maize. Grassland Science 41: 294-301.
Setter TL, 1993. Assimilate allocation in response to water deficit stress. P. 733-739. In: Buxton DR (Ed). International Crop Science I. Crop Science Society of America, Madison, Wisconsin.
Setter TL and Flannigan BA, 2001. Water deficit inhibits cell division and expression of transcripts involved in cell proliferation and endoreduplication in maize endosperm. Journal of Experimental Botany 52: 1401-1408.
Shakiba MR, Ehdaie B, Madore MA and Waines JG. 1996. Contribution of internode reserves to grain yield in a tall and semidwarf spring wheat. J Gent Breed 50: 91–100.

Journal of Plant Physiology and Breeding ISSN: 2008-5168 2011, 1(1): 39-47
Chemical Composition, Yield and Yield Components of Two Wheat
Cultivars in Response to Salt Stress H Sadeghi1* and Y Emam2
Received: 15 July 2010 Accepted: 5 January 2011
1Assistant Professor of College of Agriculture, Shiraz University, Shiraz, Iran 2 Professor of College of Agriculture, Shiraz University, Shiraz, Iran * Coresponding author : E-mail [email protected]
Abstract In most southern provinces of Iran, soil salinity is a growing problem, particularly in irrigated agricultural areas, and has been found to reduce wheat yield, dramatically. To investigate the effect of sodium chloride on two wheat (Triticum aestivum L.) cultivars, four levels of salinity: 0, 4, 8 and 12 dS/m, were employed as a factorial experiment arranged in a randomized complete block design with four replications in a controlled environment of the greenhouse during 2006-2007. The results indicated that increasing salinity from 0 to 12 dS/m, decreased the emergence percentage significantly. Two cultivars of Kavir and Shiraz responded differently to salinity, so that Kavir showed a significantly higher emergence rate. This cultivar also had greater shoot potassium content. Number of tillers and leaves per plant and, also, plant height were decreased upon increasing salinity level. The shoot sodium content was, also increased by increasing the salinity level in both cultivars. However, sodium content of Kavir in comparison with Shiraz, was lower, probably due to Na+ exclusion mechanisms in this cultivar. The highest grain number and phytomass was obtained from Kavir at the lowest salinity level. Phytomass and grain yield were, also significantly decreased as the result of salinity. Less adverse effect of salinity on Kavir indicates that this cultivar might be suitable for saline soils, an object which worth more investigation. Keywords: Potassium, Salinity, Sodium, Wheat, Yield components Introduction In most southern provinces of Iran, salinity is a growing problem particularly in irrigated agricultural areas with rising water tables, poor water quality and/or deficient soil drainage. Soil salinity has reduced wheat yield usually when values of electrical conductivity were above 6 dS/m throughout the root zone (Munns et al. 2006).
Salt stress is one of the most important abiotic stresses affecting natural productivity
and causes significant crop loss worldwide.
For plants, the sodium ion (Na+) is harmful, whereas the potassium ion (K+) is an essential ion. The cytosol of plant cells normally
contains 100–200 mM of K+ and 1–10 mM of Na+ (Taiz and Zeiger 2002); this Na+/K+ ratio is optimal for many metabolic functions in
cells. Physico-chemically, Na+ and K+ are similar cations. Therefore, under the typical NaCl-dominated salt environment in nature,
accumulation of high Na+ in the cytosol, and

40 Sadeghi and Imam 2011, 1(1): 39-47
thus high Na+/K+ ratios, disrupts enzymatic functions that are normally activated by K+ in cells (Bhandal and Malik 1988, Tester and Davenport 2003, Munns et al. 2006). Therefore, it is very important for cells to maintain a low concentration of cytosolic Na+ or to maintain a low Na+/K+ ratio in the cytosol under NaCl stress (Maathuis and Amtmann 1999).
In wheat, it has been showed that the two responses occur sequentially, giving rise to a two-phase growth response to salinity (Munns 1993). For example, comparison of two genotypes with contrasting rates of Na+ uptake and long-term differences in salt tolerance (Schachtman et al. 1991), showed that both genotypes had similar growth reduction for the four first weeks in 150 mM NaCl, and it was not until afterwards that a growth difference between the genotypes was clearly observed (Munns et al. 1995). However, within two weeks, dead leaves were visible on the more sensitive genotype and the rates of leaf death of old leaves were clearly greater on the sensitive than on the tolerant genotype. Once the number of dead leaves increased above about 20% of the total, plant growth slowed down and many individuals started to die (Munns et al. 1995). Improved salt tolerance of crops can lessen the leaching requirement, and so lessen the costs of an irrigation scheme, both in the need to import fresh water and to dispose of saline water (reviewed by Pitman and Läuchli 2002). Salt-tolerant crops have a much lower leaching requirement than salt-sensitive ones. In dry-land agriculture, improved salt tolerance can increase yield on the saline soils.
In most southern provinces of Iran, where the rainfall is low and the salt remains in the subsoil, increased salt tolerance will allow
plants to extract more water. Salt tolerance may have its greatest impact on crops growing on soils with natural salinity, when all of the other agronomic constraints have been overcome (e.g. disease resistance and nutrient deficiency); subsoil salinity remains a major limitation to agriculture in all semi-arid regions as most southern provinces of Iran. Even where clearing of land in higher rainfall zones has caused water-tables to rise and salt to move, improved salt tolerance of crops will have a place. The introduction of deep-rooted
perennial species is necessary to lower the water-table, however, salt tolerance will be required not only for the ‘de-watering’ species, but also for the annual crops that follow, as salt will be left in the soil when the water-table is lowered (Francois et al. 1994).
Wheat is a moderately salt-tolerant crop
(Maas and Hoffman 1977). One of the two new cultivars of wheat, used in the present study, Kavir, is an improved genotype recommended for saline areas in most southern provinces of Iran, However, the salt tolerance mechanisms of these varieties have not been studied in detail. The objective of the present study was to quantify plant growth, yield and yield components of the two wheat cultivars in relation to various concentrations of NaCl. In addition, NaCl effect on the chemical composition of the plant organs was investigated.
Materials and Methods Site, treatment application and data collection
This experiment was conducted to evaluate the effect of four levels of salinity (0, 4, 8 and 12 dS/m) on two wheat cultivars (Kavir, a relatively salt tolerant genotype and Shiraz, a salt sensitive cultivar). The desired

Chemical Composition, Yield and Yield Components of…… 41
salinity levels were developed by mixing the required amount of NaCl and CaCl2 (5:1) in soil before filling the pots (0, 2.16, 4.32, 8.64 g/kg soil). The wheat crop was sown on 17 November 2006 and harvested on 29 April 2007.The experiment was carried out in a greenhouse at the College of Agriculture, Shiraz University, Shiraz, Iran (52o 46'E, 29o 50'N, altitude 1810 m asl), on a fine mixed, mesic Typic Calcixerpets soil with air temperature in the range of about 25 to 30 °C and light intensity in the range of about 600–1000 µmol m–2 s–1, as a factorial experiment arranged in a randomized complete block design with four replications. Soil properties are shown in Table 1. Pre-germinated seeds were sown in 5 L perforated plastic pots filled
with fertilized (50, 25 and 25 N, P and K mg kg–1, respectively) soil and were kept in concrete tanks filled with tap water according
to Maas et al. (1986). The level of water was maintained at 3 cm below the soil surface for two days. Ten seeds of each cultivar were sown in each pot, thinned to five seedlings at two-leaf stage. The pots were kept flooded
thereafter for the rest of the experiment. The emergence percentage and number of leaves per plant were recorded throughout the experiment. Plants were harvested and threshed manually. The data regarding grain number, straw yield, grain weight, spikes per plant, tillers per plant and shoot length were recorded (Wilhelm et al. 1989).
Table 1. Soil properties (0-30 cm) before plant sowing
Year OC (%) pH Sand
(%) Silt (%)
Clay (%)
Soil texture
EC (dSm-1)
P (mg kg-1)
K (mg kg-1)
Total N (%)
2005-06 0.83 7 7 66.7 26.3 Silty loam 0.05 16.5 476 0.08
Sodium and potassium measurements Dried samples were ground to a fine
powder and about 0·1 g was transferred to a
test tube containing 10 mL of 0·1 N acetic acid, and heated in a water bath at 80 °C for 2 h. The extracted tissue was cooled at room temperature and left overnight, and then
filtered using filter paper number 40. Sodium and potassium concentrations were then determined using an atomic absorption
spectrometer (Munns and James 2003). Proline measurements
Fresh flag leaf tissue (0·5 g) was ground in liquid nitrogen and then extracted in 20 ml of hot water for 30 min with moderate
shaking. The homogenate was centrifuged at 5000 g for 10 min. The proline concentration
was quantified by application of the ninhydrin
acid reagent method as described by Bates et al. (1973) using L-proline as a standard. Statistical analysis
Statistical analysis for each variable was performed based on a randomized complete block design model using SAS software (SAS Institute 1985). Means were compared by Duncan's multiple range test at p ≤ 0.05.
Results and Discussion Effect of sodium chloride on growth and morphological characteristics
Salinity had significant effect on morphological traits of both cultivars. The results indicated that increasing salinity from 0 to 12 dS/m, decreased emergence

42 Sadeghi and Imam 2011, 1(1): 39-47
percentage significantly. The two cultivars (Kavir & Shiraz) responded differently to salinity and Kavir showed significantly higher emergence rate. Number of tillers and leaves per plant and, also the plant height were decreased upon increasing salinity level (Table 2), which is in agreement with the finding of Abdullah et al. (1978). It was found that Kavir was superior to Shiraz as far as the salinity tolerance characteristics (as shown in Table 2) were concerned. Kingsbury et al. (1984) showed that the major difference between two lines of wheat in salinity tolerance was their different response to specific ion effects, at the level of the organ, tissue, cell, and sub-cellular entities. Superior compartmentation of toxic ions by the more salt-tolerant line, presumably in the vacuole, might have enabled it to maintain its
cytoplasmic metabolic apparatus in a stable and more nearly normal state than the
sensitive line. Therefore, a measure of true cytoplasmic toleration of salt maybe needed. The first phases of the growth response results from the effect of salt outside the plant i.e. the salt in the soil solution (the osmotic stresses) reduces leaf growth as shown in Table 2. Indeed, salts themselves do not build up in the growing tissues at concentrations that inhibit growth, as the rapidly elongating
cells can accommodate the salt that arrives in the xylem within their expanding vacuoles. Thus, the salt taken up by the plant does not directly inhibit the growth of new leaves (Munns 1993).
The second phase of the growth response results from the toxic effect of salt inside the plant. The salt taken up by the plant
Table 2. Means of main effects and their interaction for morphological traits
Treatment Emergence percent
Leaves per plant
Tillers per plant
Plant height (cm)
Spikes per plant
Cultivar (V1) Shiraz 58.58 a 5.91 a 1.33 a 30.46 a 1.16 a (V2) Kavir 64.41 a 7.66 a 1.99 a 32.66 a 1.41 a
Salinity (dS/m) (S0) 0 94.00 a 13.83 a 3.00 a 53.17 a 2.50 a (S 1) 4 93.67 a 10.00 b 2.50 a 44.67 b 1.83 b (S2) 8 55.00 b 3.33 c 1.16 b 28.50 c 083 c (S3) 12
3.33 c +- - - -
Cultivar *Salinity
V1S0 92.67 a 13.33 a 2.66 ab 48.33 ab 2.33 ab V1S1 94.00 a 8.33 b 2.00 bc 48.33 ab 1.66 bc V1S2 47.67 c 2.00 cd 0.66 d 25.33 d 0.66 de V1S3 0.00 e 0.00 d 0.00 d 0.00 d 0.00 d V2S0 95.33 a 14.33 a 3.33 a 58.00 a 2.66 a V2S1 93.33 a 11.67 a 3.00 a 41.00 bc 2.00 ab V2S2 61.33 b 4.66 c 1.66 c 31.67 cd 1.00 cd V2S3 6.66 d - - - -
Means at each column for each source, followed by similar letters are not significantly different using Duncan's multiple range tests (p ≤ 0.05). + No plant growth due to salinity

Chemical Composition, Yield and Yield Components of…… 43
concentrates in the old leaves. Continued transport of salt into transpiring leaves over a long period of time, eventually results in very high Na+ and Cl– concentrations, and the
leaves died as it was observed in our experiment (see Table 2 and 4). The cause of the injury is probably due to the salt load exceeding the ability of the cells to compartmentalize salts in the vacuole. Salts then would rapidly build up in the cytoplasm and inhibit enzyme activity (Munns 1993). Alternatively, they might build up in the cell walls and dehydrate the cell (Flowers et al. 1991). However, Mühling and Läuchli (2002) found no evidence for this in maize cultivars that differed in salt tolerance Relationship between salinity and yield components
The results revealed that the highest grain number and phytomass was obtained
from Kavir at the lowest salinity level (Table 3). Phytomass and grain yield were, also decreased upon salinity, significantly. Yield reduction was attributed, primarily to the reduced spike weight and individual seed weight rather than spike number (Table 3). This finding confirms the results of Francois et al. (1989). The straw yield was more sensitive to salinity than was the grain yield (Table 3).
Our results also suggest that estimates of grain yield might bring another complexity to the salinity response, not just because the crops must be grown in controlled environments for long periods of time, but also due to the complexity of the converting shoot biomass into the grain. A low level of salinity may not reduce grain weight even though the leaf area and phytomass is reduced (Table 3), the fact that grain yield may not decrease until a given (‘threshold’) salinity is reached (Maas and Hoffman 1977).
Table 3. Means of main effects and their interaction for yield and yield components of two wheat cultivars
Spike weight (g)
Straw weight (g)
Leaf area at anthesis
(cm2)
Phytomass (g)
Grain yield per plant (g)
Grain weight per plant (g)
No. of grains per
plant Treatment
Cultivars
2.90 b 1.38 b 4200 b 3.31 b 1.75 b. + -+-
0.18 a 9.75 a (V1) Shiraz
3.60 a 1.75 a 4700 a 4.02 a 2.15 a 0.17 a 12.66 a (V2) Kavir Salinity (dS/m)
11.20 a 3.09 a 5700 a 11.67 a 8.24 a 0.43 a 19.17 a (S0) 0 5.78 b 2.21 b 5150 b 6.21 b 3.75 b 0.25 a 15.00 ab (S 1) 4 0.98 c 0.96 c 3100 c 1.36 c 0.43 c 0.04 b 10.67 b (S2) 8
- - - - - - +- (S3) 12 Cultivars* Salinity
10.35 a 2.65 b 5350 a 10.75 a 7.56 a 0.54 a 14.00 ab V1S0 4.91 b 2.25 b 5200 ab 5.31 b 2.86 b 0.20 bc 14.33 ab V1S1 0.39 c 0.63 d 2800 d 0.79 c 0.11 c 0.0 1 c 10.67 bc V1S2
- - - - - - - V1S3 11.49 a 3.53 a 5750 a 11.89 a 8.03 a 0.33 ab 24.33 a V2S0 6.78 b 2.18 b 5210 b 7.18 b 4.70 b 0.30 abc 15.67 ab V2S1 1.71 c 1.29 c 3400 c 2.11 c 0.75 c 0.07 bc 10.67 bc V2S2
Means at each column for each source, followed by similar letters are not significantly different using Duncan's multiple range tests (p ≤ 0.05).
+ No plant growth due to salinity

44 Sadeghi and Imam 2011, 1(1): 39-47
Effect of sodium chloride on the chemical composition Our results showed that Kavir had greater shoot potassium content (Table 4). The shoot sodium concentration was also increased by increasing the salinity level in both cultivars; however, the sodium content of Kavir in comparison with Shiraz, was lower, probably due to Na+ exclusion mechanisms in this cultivar (Table 4). The increase in Na+ and Cl– and decrease in K+ content of wheat grains suggest that the effect of salinity on the physiological phenomenon is due to changes in the ionic content of the plants (Abdullah et al. 1978). Other approaches to improve salt tolerance in wheat are based on the mechanisms for salt tolerance, using physiological traits to select within the germplasm. In wheat, salt tolerance is associated with low rates of transport of Na+ to shoots, with high selectivity for K+ over Na+ (Gorham et al. 1987, 1990). Correlations between grain yield and Na+ exclusion from leaves, along with the associated enhanced K+/Na+ discrimination, have been shown in wheat (Chhipa and Lal 1995, Ashraf and O'Leary 1996, Ashraf and Khanum 1997), although the relationship may not hold across all genotypes (Ashraf and McNeilly 1988, El-Hendawy et al. 2005), showing that Na+ exclusion is not the only mechanism of salt tolerance (Colmer et al., 2006). There is a strong correlation between salt exclusion and salt tolerance in many species (reviewed by Läuchli, 1984; Munns and James 2003). Figure 1 shows the negative relationship between leaf Na+ concentration
and salt tolerance of Kavir. In general, Kavir, which was characterized with the lowest Na+ concentrations, produced greater dry matter than the Shiraz cultivar (Table 4). This low-Na+ genotype had fewer injured leaves, and a greater proportion of living to dead leaves, as observed during the experiment. The effect on
growth was probably due to a better carbon balance in the genotype with less Na+. Similar relationship between shoot dry matter and leaf Na+ was found in a population from the cross between high- and low-Na+ genotypes (Munns and James 2003). The results showed that there was a significant difference among different salinity levels for proline content of the two cultivars, and Kavir had greater proline content (Table 4). The proline content in both cultivars was also increased by increasing the salinity level (Table 4). Moradi and Ismail (2007) stated that it has been repeatedly inferred, but not yet proven, that there might be a relationship between salt tolerance and the accumulation of proline and other metabolites for osmotic adjustment. However, Colmer et al. (1995) suggested that the increase in proline concentration may not be associated with salinity tolerance. Indeed, elevated proline
levels may also confer additional regulatory or osmo-protective functions under salt stress, such as its role in the control of the activity of plasma membrane transporters involved in
cell osmotic adjustment in barley roots (Cuin and Shabala 2005).

Chemical Composition, Yield and Yield Components of…… 45
Figure 1. Relationship between salinity tolerance (% growth of the control) and leaf Na+ concentration in the Kavir cultivar. Na+ concentrations were measured on the third leaf after 10 d in 150 mM NaCl and shoot biomass after 24 d. Values are expressed as a percentage of shoot biomass in the control condition (R2=0.8252). All values are based on means (n=5).
Table 4. Mean comparison of main and interaction effects of chemical composition of two wheat cultivars
Treatment K+ (mmol per Kg) Proline (µ g/g) Na+ (mmol per Kg)
Cultivars
(V1) Shiraz 222.70 b 0.25 b 157.10 b
(V2) Kavir 435.50 a 0.34 a 13.80 a
Salinity (dS/m)
(S0) 0 319.40 c 0.25 d 94.10 d
(S 1) 4 410.70 b 0.27 b 87.30 b
(S2) 8 586.50 a 0.41 a 160.50 a
(S3) 12 - - - V1S0 287.20 d 0.25 d 141.14 d
V1S1 209.00 d 0.26 b 168.80 b
V1S2 394.90 c 0.33 a 318.40 a
V1S3 - - - V2S0 351.70 c 0.29 d 46.80 de
V2S1 612.30 b 0.30 ab 5.80 e
V2S2 778.10 a 0.37 a 2.50 e
Means at each column for each source, followed by similar letters are not significantly different using Duncan's multiple range tests (p ≤ 0.05). + No plants growth due to salinity
Y = - 140.28 x + 2768.1 R 2 = 0.8252 **
0 10 20 30 40
0 0.75 1.5 2.25 3 Leaf 3 Na + concentration (mmol g Dw-1)
Salinity tolerance
+
50

46 Sadeghi and Imam 2011, 1(1): 39-47
Conclusion Our results indicated that the two cultivars, Kavir & Shiraz, responded differently to salinity, so that Kavir showed significantly higher emergence rate. This cultivar (Kavir) also had greater shoot potassium content. Number of tillers and leaves per plant and also plant height were decreased in both cultivars upon increasing salinity. The shoot sodium content in both cultivars was also increased by increasing the salinity level; however, the
sodium content of Kavir, compared to Shiraz, was lower probably due to Na+ exclusion mechanisms in this cultivar. The results also revealed that the highest grain number and phytomass was obtained from Kavir at the lowest salinity level. Phytomass and grain yield were, also decreased upon salinity significantly. Overall, it appeared that less adverse effect of salinity on Kavir cultivar may make it more suitable for growth in saline soils. This subject is worthy of further explorations.
References Abdullah Z, Ahmad R and Ahmad J, 1978. Salinity induced changes in the reproductive physiology of wheat
plants. Plant and Cell Physiology 19: 99-106. Ashraf M and Khanum A, 1997. Relationship between ion accumulation and growth in two spring wheat lines
differing in salt tolerance at different growth stages. Journal of Agronomy and Crop Science 178: 39–51. Ashraf M and McNeilly T, 1988. Variability in salt tolerance of nine spring wheat cultivars. Journal of
Agronomy and Crop Science 160: 14–21. Ashraf M and O'Leary JW, 1996. Responses of some newly developed salt-tolerant genotypes of spring wheat
to salt stress. 1. Yield components and ion distribution. Journal of Agronomy and Crop Science176: 91–101.
Bates LS, Waldren RP and Teare ID, 1973. Rapid determination of free proline for water-stress studies. Plant Soil 39: 205-207.
Bhandal IS and Malik CP, 1988. Potassium estimation, uptake, and its role in the physiology and metabolism of flowering plants. International Review of Cytology 110: 205–254.
Chhipa BR and Lal P, 1995. Na/K ratios as the basis of salt tolerance in wheat. Australian Journal of Agricultural Research 46: 533–539.
Colmer TD, Epstein E and Dvorak J, 1995. Differential solute regulation in leaf blades of various ages in salt-sensitive wheat and salt tolerant wheat x Lophopyrum elongatum (Host) A. Löve amphiploid. Plant Physiology 108: 1715–1724.
Colmer TD, Flowers TJ and Munns R, 2006. Use of wild relatives to improve salt tolerance in wheat. Journal of Experimental Botany 57: 1059–1078.
Cuin TA and Shabala S, 2005. Exogenously supplied compatible solutes rapidly ameliorate NaCl-induced potassium efflux from barley roots. Plant and Cell Physiology 46: 1924–1933.
El-Hendawy SE, Hu Y and Schmidhalter U, 2005. Growth, ion content, gas exchange, and water relations of wheat genotypes differing in salt tolerances. Australian Journal of Agricultural Research 56: 123–134.
Flowers TJ, Hajibagheri MA and Yeo AR, 1991. Ion accumulation in the cell walls of rice plants growing under saline conditions: evidence for the Oertli hypothesis. Plant, Cell and Environment 14: 319–325.
Francois LE, Donovan TJ, Lorenz K and Maas EV, 1989. Salinity effects on rye grain yield, quality, vegetative growth, and emergence. Agronomy Journal 81: 707-712.
Francois LE, Grieve CM, Maas EV, Donovan TJ and Lesch SM, 1994. Time of salt stress affects growth and yield components of irrigated wheat. Agronomy Journal 86: 100–107.
Gorham J, Hardy C, Wyn Jones RG, Joppa LR and Law CN, 1987. Chromosomal location of a K/Na discrimination character in the D-genome of wheat. Theoretical and Applied Genetics 74: 584–588.

Chemical Composition, Yield and Yield Components of…… 47
Gorham J, Wyn Jones RG and Bristol A, 1990. Partial characterization of the trait for enhanced K+-Na+ discrimination in the D-genome of wheat. Planta 180: 590–597.
Kingsbury Ralph W, Epstein E and Pearcy W, 1984. Physiological responses to salinity in selected lines of wheat. Plant Physiology 74: 417-423.
Läuchli A, 1984. Salt exclusion: an adaptation of legumes for crops and pastures under saline conditions. In: Staples RC (Ed). Salinity Tolerance in Plants: Strategies for Crop Improvement. Wiley, New York, pp. 171–187.
Maas EV and Hoffman GJ, 1977. Crop salt tolerance – current assessment. Journal of the Irrigation and Drainage Division of the American Society of Civil Engineering 103: 115–134.
Maathuis FJM and Amtmann A, 1999. K+ nutrition and Na+ toxicity the basis of cellular K+/Na+ ratios. Annals of Botany 84: 123–133.
Moradi F and Ismail AM, 2007. Responses of photosynthesis, chlorophyll fluorescence and ROS-scavenging systems to salt stress during seedling and reproductive stages in rice. Annals of Botany 99: 1161-1173.
Mühling KH and Läuchli A, 2002. Effect of salt stress on growth and cation compartmentation in leaves of two plant species differing in salt tolerance. Journal of Plant Physiology 159: 137–146.
Munns R, 1993. Physiological processes limiting plant growth in saline soil: some dogmas and hypotheses. Plant, Cell and Environment 16: 15–24.
Munns R and James RA, 2003. Screening methods for salt tolerance: a case study with tetraploid wheat. Plant and Soil 253: 201–218.
Munns R, James AJ and Läuchli A, 2006. Approaches to increasing the salt tolerance of wheat and other cereals. Journal of Experimental Botany 57: 1025–1043.
Munns R, Schachtman DP and Condon AG, 1995. The significance of a two-phase growth response to salinity in wheat and barley. Australian Journal of Plant Physiology 22: 561–569.
Pitman MG and Läuchli A, 2002. Global impact of salinity and agricultural ecosystems. In: Läuchli A and Lüttge U (Eds). Salinity: Environment – Plants – Molecules. Kluwer, Dordrecht, pp. 3–20.
SAS Institute, 1985. SAS user’s guide . Statistics. Version 5. SAS Inst., Cary, NC, USA. Schachtman DP, Munns R and Whitecross MI, 1991. Variation of sodium exclusion and salt tolerance in
Triticum tauschii. Crop Science 31: 992–997. Taiz L. and Zeiger E, 2002. Plant Physiology. Sinauer Associates Inc., Sunderland, Massachusetts. Tester M and Davenport R, 2003. Na+ tolerance and Na+ transport in higher plants. Annals of Botany 91: 503–
527. Wilhelm WW, Bouzerzour H and Power JF, 1989. Soil disturbance-residue management effect on winter wheat
growth and yield. Agronomy Journal 81: 581-588.

Journal of Plant Physiology and Breeding ISSN: 2008-5168 2011, 1(1): 49-62
Karyotypic Study and Chromosome Evolution in Some Iranian
Local Onion Populations R Paknia1 and G Karimzadeh1*
Received : 2 February 2010 Accepted : 6 November 2010
1Plant Breeding and Biotechnology Department, Faculty of Agriculture, Tarbiat Modares University, Tehran, Iran
*Corresponding author Email: [email protected] Abstract A karyotypic study was performed on 12 Iranian local onion (Allium cepa L.) populations. A number of mitotic cells at metaphase stage for each population were prepared. Chromosomes of suitable mitotic cells were counted and various parameters, including long arm (L), short arm (S), total length of chromosome (TL), relative length of chromosome (RL), arm ratio (AR), r-value, total chromosome volume (TCV) and centromeric index (CI), were measured. All populations were diploid with 2n=2x=16 and they were differentiated by their karyotype formula and parameters. Chromosome length varied in the populations and the highest quantity of chromatinic material was found in BehdashtShahrud onion. The onion populations under study occupied classes 1A and 2A of Stebbins’ karyotype classification, indicating the presence of a primitive symmetrical karyotype in these populations. The mean chromosome length ranged from 8.54 to 11.97 µm. Haploid genome length was in the range of 67.79 to 96.65 µm and mean centromeric index (CI) of complements varied from 41.1 to 43.7%.The chromosome types were detected as mostly metacentrics “m” and some submetacentrics “sm”, showing the karyotype formula of 8m (two populations), 7m+1sm (eight populations) and 6m+2sm (two populations). The cluster analysis using chromosomal parameters and based on Ward’s minimum variance algorithm assigned the populations into two groups.
Keywords: Allium cepa, Centromeric index, Chromosome type, Karyotype, Onion
Introduction The genus Allium includes agronomically useful species. The taxonomic position of onion and related genera has long been a matter of controversy. In early classifications of angiosperms, Allium species were placed in the Liliaceae but later, they were more often included in the Amaryllidaceae on the basis of their florescence structure. Alliumcepa is one of the oldest cultivated vegetables, recorded for over 4000 years (Fritsch and Friesen 2002,
Phillip and Jenderek 2003). It is a biennial plant growing vegetatively one year and produces its seeds in the second year after prior exposing to a period of cold temperatures (Kovatch 2003). The Allium genus has great economic significance because it includes several important vegetable crops and ornamental species. All plant parts of onions except the seeds may be consumed by human, and wild species are exploited by local inhabitants.

50 Paknia and Karimzadeh 2011, 1(1): 49-62
Onion is propagated by seeds, bulbs or sets (small bulbs).
Currently, there are different opinions about the number of species in this genus (Xingjin et al. 2000). Estimations indicate about 750 species in the genus Allium (Stearn 1992) and 650 more synonymous species names exist (Gregory et al. 1998). The species of section cepa are diploid (2n=2x=16) although the occasional occurrence of individual tetraploid bulbs has been reported contrary to what is found in other Allium groups. The chromosomes are either metacentric or submetacentric which differs somewhat in their length; only the satellite chromosome pair is subtelocentric (subacrocentric) and the satellites being attached to the short arms. Most species of the section cepahave very small dot like satellite, as in other subgroups of this genus (Fritsch and Friesen 2002).
In spite of the cytological similarities between the species of section cepa, there are strong crossing barriers between them preventing interspecific gene flow even where sympatric distribution of two species occurs. Although in modern breeding programs, many classical cultivar groups have been crossed, the boundaries between the different taxa are becoming blurred, making it difficult to place materials within the scheme (Fritsch and Friesen 2002). To expand the genetic variation of onion, onion has been crossed with other Allium species, e.g.A. sativum (Yamashitaet al. 2002). Since onion is regarded as an important crop worldwide, for decades there have been well-established onion breeding and seed production programs in the world, developing
short intermediate and long-day cultivars. Today, almost 90% of the cultivars used come from local breeding programs (Martinez et al. 2000, Paknia et al. 2007). Chromosome identification is essential for biotechnological studies including genome analysis, somatic hybridization and ploidy manipulation (Yamamoto and Tominaga 2004). Karyotype features allow individual species to be distinguished. Thus, chromosome variation, although not always large, has accompanied evolutionary divergence of the taxa studied, a general phenomenon observed in both the plant and animal kingdoms (Acosta et al. 2005). Knowledge of karyotype relationships is an important prerequisite for effective plant genetic and breeding studies (Martinez-Gomez et al. 2003) and also provides valuable information related to the mechanism of genome evolution (Wilkinson 1994). Widely different karyotypes have been found among plants with the same chromosome number, and the relationships between karyotypes are not easily inferred from the morphology of the chromosomes (Brighton 1976). Distinguishing chromosomes based on the length may be charged with significant error due to variation in chromosome contraction within the chromosome complement in either one or different cells (Bajer 1959).
Hybrids obtained from the pollination of Allium cepaby other species were easily identified due to the presence of acrocentric chromosomes characteristic for the paternal genotypes (Keller et al. 1996). The onion breeding is slow process primarily due to the biennial nature of this outcrossing species (Alan et al. 2003). Alteration in chromosome

Karyotypic Study and Chromosome Evolution in Some ……. 51
number and structure raises question about the origin, extent and evolutionary relationships of chromosome variants. Cytological variation also needs to be taken into account when conservation strategies are planned for the restoration of depleted populations, or the establishment of new ones, as the mixing of cytotypes can lead to hybrids (Murray and Young 2001). Cytotaxonomic studies provide taxonomic insight, at different hierarchical levels, not only through the determination of chromosome numbers, but also through the elaboration and comparison of karyotypes, in addition to the analysis of interphase nuclei and of chromatinic condensation standards in prophase. Cytotaxonomic studies can also contribute to discussions on evolutionary trends through chromosome changes.
The aims of this study were i) to quantify the cytological variation among 12 Iranian local onion populations, using karyotype analysis and ii) to establish karyologic relationship among the populations. Materials and Methods
Seeds of 12 Iranian local onion populations (Table 1) obtained from Seed and Plant Improvement Institute (SPII), Karaj, Iran, were germinated on damp filter paper in petri dishes at room temperature. For the analysis of somatic chromosomes, 1-1.5 cm long fresh root tips were collected from rapidly growing germinating seeds. Different protocols for pretreatment were tested and the best result was obtained from 8 mM of 8-hydroxyquinoline in darkness at room temperature for 2.5 h. Sample roots were subsequently washed three times
with distilled water (each 5 min) at room temperature. They were then fixed in Carnoy's fixative (glacial acetic acid: ethanol; 3:1) for overnight at 4°C. After thorough washing with distilled water, accesses transferred to 70% (v/v) aqueous ethanol and stored in a refrigerator until use. Hydrolysis was carried out with 1 M HCl for 8-12 min at 60°C. Thereafter, root tips were stained in 2% (w/v) aceto-carmine for 7-8 h at 20°C according to Ostergren and Haneen (1962). The stained root tips were squashed in a drop of 45% (v/v) acetic acid. The slides were frozen in liquid nitrogen to permit coverslip removal and permanently mounted.
At least five well-spread metaphase plates from different individuals were analyzed per population. The best metaphasic plates were photographed, using a camera attached to the BX50 Olympus microscope and then scanned at 200-resolution and loaded in Photoshop 8.0. Chromosome morphology was described using nomenclatures proposed by Levan et al. (1964). For numerical characterization, arm ratio (AR) of each pair, relative length of chromosome (RL), ratio between the longest and the shortest chromosome pair (r-value), form percentage (%F) and total form percentage (%TF) were calculated.. AR, RL, r-value, %F and %TF were calculated as follows:
SLAR = ;
∑=
TLTLRL ;
LSvaluer =− ;
100% ×=TLSF ; 100
TLS
TF% ×=∑∑

52 Paknia and Karimzadeh 2011, 1(1): 49-62
Table 1. Names and photoperiod requirement of 12 Iranian local onion populations
Population No. Native names Photoperiod requirement
1 White Ghom Long day 2 Red Azar Shahr Long day 3 White Kashan Long day 4 Dorche Isfahan Long day 5 Gholy Geseh Zanjan Long day 6 Behdasht Shahrud Long day 7 Ramhormoz Medium day 8 Red Ray Long day 9 White Khomein Long day 10 Red Neyshabur Long day 11 White Neyshabur Long day 12 White Sary Median day
where S and L are short and long arms of chromosome , respectively, TF is total length of chromosome and %TF is total form percentage of chromosome. The karyotype symmetry classes of Stebbins (1971) were further quantitatively differentiated into finer karyotype evolutionary gradations, the parameter of chromosome-dispersion (Lavania and Srivastava 1999). The values of Dispersion Index (DI) for a given karyotype were estimated from the following equations:
100×=xTL
xSCG
Where CG is the centromeric gradient, xS is the length of median short arm and xTL is the total length of median chromosome.
100×=X
SDCV
Where SD is standard deviation, X is mean chromosome length and CV is coefficient of variation for chromosome length.
DI = Proportionate measure of CG with respect to CV Total volume of chromosome (TVC) was estimated, using the following formula:
TVC = π r2 × TL Where π is the ratio of a circle's circumference (=3.14), “r” and TL are the average chromosome radius and total chromosome length, respectively.
To estimate karyotype asymmetry, two numerical parameters were used according to Romero-Zarco (1986) method as follows:
nxLxS
A
n
∑= 11
Where xS and xL are the mean length of the short and long arms of each pair of homologs, respectively, n is the number of homologs and
1A is intrachromosomal index.
XSA =2

Karyotypic Study and Chromosome Evolution in Some ……. 53
Where S and X are standard deviation and mean chromosome length, respectively and
2A is interchromosomal index. The resultant data were first examined for
normality test and then analyzed according to a completely randomized design with five replications of metaphase cells. Tukey's test was carried out for population mean comparisons (Coulaud et al. 1999, Guillermo Seijo and Fernandez 2003; Mahdavi and Karimzadeh 2010, Karimzadeh et al. 2011). Cluster analysis was performed using Ward’s minimum variance method and squared
Euclidean distance coefficient. Principal component analysis (PCA) was carried out to differentiate the studied populations based on karyotype parameters (Jolliffe 1986).
Results and Discussion Karyotype formula and parameters for 12
Iranian local onion populations are summarized in Table 2. Figure 1 illustrates the mitotic metaphases and Figure 2 demonstrates their
Table 2. Haploid karyotypic parameters measured on the 12 Iranian local onion populations. CV%= coefficient of variation; S%= symmetry index; TF%= total form percentage; DI= dispersion index; ST= Stebbins asymmetry categories; A1= intrachromosomal index; A2= interchromosomal index; KF= karyotype formula; SAT= satellite position; Pop.= population
SAT KF A2 A1 ST DI TF% S% CV% Pop. No.
2L, 6L 7m+1sm 0.159 0.256 1A 6.794 42.46 59.09 15.886 1
4L, 6lL 7m+1sm 0.149 0.253 1A 6.217 42.57 66.36 14.240 2
6L, 8L 7m+1sm 0.123 0.266 1A 5.521 41.93 66.16 13.004 3
3L, 6L 6m+2sm 0.128 0.304 1A 5.384 40.97 67.04 12.813 4
nd* 7m+1sm 0.138 0.245 1A 6.009 42.77 66.85 13.794 5
3L, 6L 8m 0.120 0.256 1A 4.938 42.34 68.64 11.958 6
2L, 6S 7m+1sm 0.133 0.227 2A 5.885 43.36 67.80 13.346 7
3L 6m+2sm 0.137 0.317 2A 5.632 40.51 67.41 13.666 8
3S, 6L 7m+1sm 0.148 0.245 1A 6.304 42.48 61.94 14.831 9
4L, 6L 8m 0.127 0.239 1A 5.357 43.46 68.64 12.758 10
6L, 7L 7m+1sm 0.139 0.258 1A 5.794 42.20 67.97 13.904 11
6L, 7L 7m+1sm 0.140 0.230 2A 6.023 42.58 65.78 13.998 12
* nd = Not detected

54 Paknia and Karimzadeh 2011, 1(1): 49-62

Karyotypic Study and Chromosome Evolution in Some ……. 55
Figure 1. Somatic cells of the studied 12 onion populations (2n=16). Scale bar = 5 µm. (for population names see Table 1) respective idiograms. All populations were diploid with 2n=2x=16 chromosomes. The chromosome number (2n=2x=16) identified for Iranian local populations in the present study was in agreement with the number reported by Xingjin et al. (2000) and Fritsch and Friesen (2002). In our best knowledge, this is the first published cytological work n Iranian local population.
Analysis of variance indicated significant differences among populations for most of the karyological parameters (Table 3). Means are shown in Table 4. Chromosome variation among populations of the same species has been observed in many plant groups (Maffei et al. 1999). Among the populations studied, the highest total chromosomes length, the longest chromosomes, shortest chromosome, centro-meric index (CI) and total chromosome length were observed in BehdashtShahrud population (11.97, 6.93, 5.046, 0.442 and 96.65 µm, respectively) and the lowest values were detected in White Khomein. White Sary onion had higher total volume (34.5 µm3) and White Ghom possessed the largest dispersion index
(6.974) among the populations examined. Karyotype asymmetry was determined for all populations in which TF%, S% and Romero-Zarco (1986) indices showed higher degree of symmetry; the karyotypes of BehdashtShahrud population were the most asymmetric. Total F% analysis showed that symmetrical karyotype had median to nearly median chromosome with a moderate fluctuation in TF% values (from 40.51% in Red Ray to 43.46% in Red Neyshabur). The maximum asymmetry value is 50% where all chromosomes are metacentric (Huziwara 1962). The gradual alterations to shifting of TF% values may be due to the chromosomal abnormalities. The structural alterations in chromosome morphology, as well as the variations of secondary constricted chromosomes may be due to chromosome duplication or translocations between chromosomes with or without secondary constrictions at a very early stage of evolution (Das 1991, Das et al. 1998, Mohanty et al. 2004).

56 Paknia and Karimzadeh 2011, 1(1): 49-62
Table 3. Mean squares (MS) for karyotypic parameters of the studied Iranian native onion population. L= long arm; S= short arm; TL= total chromosome length; AR= arm ratio (L/S); r-value= (S/L); TCV= total chromosome volume (µm3); CI= centromeric index, F%= form percentage of chromosome
MS SOV df
L S TL AR r-value TCV CI F%
Population 11 1.578*** 0.806** 4.470** 0.018** 0.003* 0.215ns 0.0004* 0.027ns
Error 48 0.435 0.271 1.319 0.006 0.001 0.162 0.0001 0.026
CV% 11.0 11.6 11.0 5.7 4.9 7.4 2.9 11.3
ns Not significant at 5% probability level, *, **, *** Significant at 5%, 1% and 0.1% probability levels, respectively
In our study, the mean chromosome length
ranged from 8.54 to 11.97 µm. Haploid genome length varied from 67.79 to 96.65 µm (Table 4). The mean centromeric index in the complement differed from 41.1% to 44.2% (Table 4). DI has been found as a useful parameter to differentiate quantitatively the closely related karyotypes belonging to the same class of symmetry (Lavania and Srivastava 1999). In this study, the higher values of DI indicated higher levels of karyotype specialization. The CV% estimated for the homology of chromosome/chromosome arms, spread over populations, is considered to serve as a general guiding parameter to detect the extent of gradual variation (Table 2). As a whole, karyotypes of the populations examined had predominance of either “m” (centromere at
median region) or “sm” (sub-metacentric) chromosome types (Table 2). In other words, the most common haploid formula among Iranian local Allium cepa populations was 7m+1sm (eight populations), followed by 6m+2sm, (two populations) and 8m (two populations) (Table 2). Unal et al. (1997) with the analysis of Allium enginii karyotypes identified 16 somatic chromosomes (2n=2x=16) with total haploid chromosome length of 80.29 µm. The chromosome length was changed from 8.43 to 11.83 µm and the arms ratio was ranged between 1.02 and 1.46. All of the eight haploid chromosomes of Allium enginii were metacentrics (Unal et al. 1997), while in our study, the Allium cepa populations showed differed chromosome types.

Karyotypic Study and Chromosome Evolution in Some ……. 57
Table 4. Means (±S.E.) of karyotypic parameters of the studied Iranian native onion populations. L= long arm; S= short arm; TL= total chromosome length; AR= arm ratio (L/S); r-value= S/L; CI= centromeric index, Pop.= population
CI r-value AR TL S L Pop.
No.
0.429±0.002ab 0.760±0.006ab 1.354±0.017ab 9.933±0.380ab 4.272±0.173ab 5.661±0.209ab 1
0.437±0.004a 0.788±0.011ab 1.313±0.021ab 10.077±0.330ab 4.402±0.171ab 5.675±0.165ab 2
0.426±0.006ab 0.758±0.017ab 1.391±0.036ab 10.239±0.809ab 4.385±0.383ab 5.854±0.432ab 3
0.420±0.004ab 0.743±0.012ab 1.450±0.032ab 10.827±0.577ab 4.561±0.264ab 6.266±0.316ab 4
0.435±0.007ab 0.781±0.022ab 1.323±0.045ab 11.022±0.408ab 4.777±0.168ab 6.244±0.269ab 5
0.421±0.008ab 0.744±0.021ab 1.421±0.050ab 11.972±0.464a 5.046±0.252a 6.927±0.238a 6
0.442±0.006a 0.803±0.019a 1.285±0.035ab 11.098±0.262ab 4.925±0.149ab 6.172±0.145ab 7
0.411±0.008b 0.714±0.021b 1.500±0.058a 10.891±0.274ab 4.475±0.087ab 6.415±0.228ab 8
0.427±0.005ab 0.760±0.015ab 1.384±0.028ab 8.548±0.340ab 3.663±0.140b 4.885±0.211b 9
0.428±0.005ab 0.760±0.017ab 1.367±0.025ab 11.426±0.854ab 4.876±0.333b 6.550±0.527ab 10
0.421±0.002ab 0.742±0.009ab 1.124±0.010ab 9.812±0.612ab 4.141±0.258ab 5.671±0.356ab 11
0.430±0.006ab 0.770±0.017ab 1.367±0.040ab 9.446±0.423ab 4.0740.237ab 5.372±0.188ab 12
Means within each column followed by different symbol letters are significantly different at 5% probability level
Stebbins (1971) found that increased karyotype asymmetry is associated with increased morphological specialization. In general, the karyotypes of onion populations in our study were mostly symmetrical and fell in Stebbins 1A category of symmetry, except for Ramhormoz, Red Ray and White Sary populations which fell in 2A category (Table 2). Romero-Zarco (1986) indices permitted the detection of slight differences among populations. These indices (A1 and A2) showed small ranges of between-population variations (Table 1). The karyotype asymmetry of the studied populations was very similar, in particular the values of the A1 intrachromo- somal index parameter, the highest value
(0.317) was found in the Red Ray population. The diversity was found in the presence, or in the absence, of chromosomes with satellites on either short or long arm. Satellites were detected in one or two chromosome pairs in the karyotype of onion populations tested. Most of populations possessed a satellite on 6L, except in GholyGesehZanjan in which the satellite was not detected (Table 2, Figure 2).
Genetic relationship among populations was assessed by cluster analysis. Grouping based on Ward’s minimum variance algorithm and squared Euclidean distance coefficient assigned the populations into two clusters (Figure 3). Cluster I consisted of nine populations (Dorche Isfahan, holyGesehZanjan,

58 Paknia and Karimzadeh 2011, 1(1): 49-62
Ramhormoz, White Ghom, Red AzarShahr, White Khomein, White Neyshabur, Red Ray, RedNeyshabur) and Cluster II contained three populations (White Kashan, BehdashtShahrud, White Sary). This clustering,based on cytogenetic data, showed close relationship between three populations (White Kashan, White Sary, BehdashtShahrud), supporting morphological characteristics of the genus (Paknia et al. 2007). These populations appeared to be very similar, locating closely to each other in a single cluster, while other cluster showed to be distant.
The principal component analysis (PCA) based on karyotypic parameters showed that the first two principal components account for the 84.7% of the total variations and they were projected in a two-dimensional graphic (Figure 4). The first component (46.7%) emphasized the position of the centromer, while the second component (38%) accentuated variation in complement length. The arrangement of populations based on PCA was fully agreed with the result of cluster analysis. Differences
in karyotype formula and asymmetry indices found among onion populations suggest that structural changes may have contributed to the diversification of the studied populations.
In conclusion, the main object of the present report was to select onion populations with the most homology in chromosomal variations for the purpose of crossing in plant breeding programs. Crosses of Dorche Isfahan, White Ghom, White Khomein, Red Ray and White Kashan populations by GholyGesehZanjan or Ramhormoz, Red AzarShahr, White Neyshabur, RedNeyshabur and White Saryare, therefore suggested for obtaining the higher genetic variation. This type of analysis can help breeders choosing diverse parents for heterosis breeding programs aimed at varietal improvement.
Acknowledgements This work was financially supported by a
grant of the Tarbiat Modares University, Tehran, Iran

Karyotypic Study and Chromosome Evolution in Some ……. 59
Figure 2. Idiograms of somatic cells of 12 onion populations under study (for population names see Table 1)
Chr
omos
ome
leng
th (µ
m)

60 Paknia and Karimzadeh 2011, 1(1): 49-62
Figure 3. Dendrogram showing the phonetic relationships among the 12 Iranian native onion populations under study, constructed by the Ward’s method using the matrix of karyotype distances (Cophenetic correlation coefficient= 0. 654)
Figure 4. Diagram resulted from the principal component analysis of the studied populations. The first component was highly related with r value and the second was strongly related with the length of complements (for population names see Table 1)

Karyotypic Study and Chromosome Evolution in Some ……. 61
References Acosta MC, Bernardello G, Guerra M and Moscone EA, 2005. Karyotype analysis in several South American
species of SolanumandLycianthesrantonnei(Solanaceae). Taxon 54: 713–723. Alan AR, Mutschler MA, Brants A, Cobb E and Earle ED, 2003. Production of gynogenic plants from hybrids of
Allium cepa L. and A. roylei stern. Plant Science 165: 1201-1211. Bajer A, 1959. Change in length and volume of mitotic chromosomes in living cells. Heredity 45: 579-596. Brighton CA, 1976. Cytological problems in the genus Crocus (Iridaceae) I.Crocus vernus aggregate.
KewBulletin 31: 33-46. Coulaud J, Barghi N, Lefebvre C and Siljak-Yakovlev S, 1999. Cytogenetic variation in populations of Armeria
maritime (Mill) wild in relation to geographical distribution and soil stress tolerances. Canadian Journal of Botany77: 673-685.
Das AB, 1991.Chromosomal variability in relation with 4C DNA content in the subtribeCarinae. Cytologia 56: 627-632.
Das AB, Rai S and Das P, 1998.Karyotype analysis and 4C DNA content in some cultivars of ginger (Zingiberofficinale Ross).Cytobios 93: 175-184.
Fritsch RM and Friesen N, 2002. Evolution, domestication and taxonomy of Allium genus. In: Rabinowitch HD (Ed). Allium Crop Science: Recent Advances. CABI Publishing, UK,Pp. 5-30.
Fry JC, 1993. Biological Data Analysis.Oxford IRL Press, UK. Gregory M, Fritsch RM, Friesen N, Khassanov FO and Mc-Neal DW, 1998. Nomenclature Allium. Allium
Names and Synayms- a World Guide. Royal Botanic Gardens Kew, UK. Guillermo Seijo J and Fernandez A, 2003. Karyotype analysis and chromosome evolution in South American
species of Latyrus(Leguminosae). American Journal of Botany 90: 980-987. Huziwara Y, 1962. Karyotype analysis in some genera of Composite. VIII. Further studies on the chromosome
of aster. American Journal of Botany49: 116-119. JolliffeI, 1986. Principal Component Analysis. Springer Verlag Inc., New York, USA. Karimzadeh G, Danesh-GilevaeiM and Aghaalikhani M, 2011. Karyotypic and nuclear DNA variations in
Lathyrussativus (Fabaceae).Caryologia, 64(1): (In Press). Keller ERJ, Schubert I, Fuchs J and Meister A, 1996. Interspecific crosses of onion with distant Allium species
and characterization of the presumed hybrids by means of flow cytometry, karyotype analysis and genomic in situ hybridization. Theoretical and Applied Genetics 92: 417-424.
Kovatch JT, 2003. Onion (Allium cepa).Allium cepa var. Aggregatum.Master Gardeners: Multiplier Onion.http://www.co.ozaukee.wi.us/MasterGardener/Journal/MultOnion.PDF.
Lavania UC and Srivastava S, 1999.Quantitative delineation of karyotype variation in Papaver as a measure of phylogenetic differentiation and origin. Current Science 77: 429-435.
Levan A, FredgaK and Sandberg A, 1964. Nomenclature for centromeric position on chromosome.Hereditas, 52: 201-220.
Maffei EMD, Marin-Morales MA, RuasCF and Matzenacher NL, 1999. Chromosomal polymorphism in 12 populations of Mikaniamicrantha(Composite). Genetics and Molecular Biology 22: 433-444.
Mahdavi S and Karimzadeh G, 2010.Karyological and nuclear DNA content variation in some Iranian endemic Thymus species (Lamiaceae). Journal of Agricultural Science and Technology (JAST), 12: 447-458.
http://www.jast.ir/?_action=showPDF&article=356&_ob=f6268c4564db6f9dbd1cad004d69ab5d&fileName=full_text.pdf.
Martinez LE, Aguero CB, Lopez ME and Galmarini CR, 2000. Improvement of in vitrogynogenesis induction in onion (Allium cepa L.) using polymines. Plant Science156: 221-226.
Martinez-Gomez P, Vaknin Y, GradzielTM and Dicenta F, 2003. Karyotype analysis in Almond. ISHS ActaHorticulturae 622.http://www.actahort.org/books/622/.
Mohanty IC, Mahapatra D, MohantyS and DasAB, 2004. Karyotype analyses and studies on the nuclear DNA content in 30 genotypes of potato (Solanumtuberosum L.). Cell Biology International 28: 625-633.

62 Paknia and Karimzadeh 2011, 1(1): 49-62
Murray BG and Young AG, 2001.Widespread chromosome variation in the endangered grassland herb Rutidosisleptorrhynchoides F. Muell.(Asteraceae: Gnaphalieae). Annals of Botany 87: 83-90.
Ostergren G and Haneen KW, 1962.A squash technique for chromosome morphological studies. Heredity 48: 332-341.
Paknia R, Karimzadeh G and Khodadadi M, 2007.Studies of morphological variation and path analysis in some Iranian native onion (Allium cepa L.) populations. Iranian Journal of Agricultural Sciences, 38-1(1): 131-140 (In Farsi with English Abstract)
Phillip NS and Jenderek M, 2003.Flowering, seed production, and the genetics of garlic breeding. Plant Breeding 23: 211-244.
Rohlf, FJ, 2000. NTSYS-pc: Numerical Taxonomy and Multivariate Analysis System.Version 2.1.Exeter Publications, New York, USA.
Romero-Zarco CA, 1986. A new method for estimating karyotype asymmetry. Taxon 35: 526-530. Ryan B and Joiner BL, 2001.Minitab Handbook, Fourth edition. Duxbury Press, California, USA. Srivastava MS, 2002.Methods of Multivariate Statistics. John Wiley and Sons, USA. Stearn WT, 1992. How many species of Alliumare known? Kew Magazine 9: 180-182. Stebbins GL, 1971. Chromosomal Evaluations in Higher Plants.Edward Arnold Publisher, London, UK. Ünal F, DumanH and Özhatay N, 1997. Karyotypic study in Allium enginiiN. Özhatay and B. Mathew.GaziÜniv
Fen, BilimDergCilt 10(4): 515-521. Wilkinson MJ, 1994. Genome Evolution in Potatoes. In: Bradshaw JE and MacKay GR (Eds). Potato Genetics.
Pp. 56-57. Cab International, Wallingford. Xingjin HE, Song GE, JiemeiXU and Deyun H, 2000. Phylogeny of Chinese Allium using PCR-RFLP analysis.
Science in China 43: 454-463. Yamamoto M and Tominaga S, 2004.Chromosome identification in haploid clementne (Citrus clementina hort.
Ex Tanaka) by fluorescent staining.ScientiaHorticulturae 101: 201-206. Yamashita K-I, Hisatsune Y, Sakamoto T, Ishizuka K and Tashiro Y, 2002. Chromosome and cytoplasm
analyses of somatic hybrids between onion (Allium cepa L.) and garlic (A. sativum L.). Euphytica 125(2): 163-167.

Journal of Plant Physiology and Breeding ISSN: 2008-5168 2011, 1(1): 63-73
Estimation of Combining Ability and Gene Effects in Forage Maize
(Zea mays L.) Using Line × Tester Crosses J Mosa Abadi1, S Khavari Khorasani2, B Syah Sar3, S Movafeg2 and M Golbashy4*
Received: 7 June 2010 Accepted: 17 December 2010
1 MSc student of Agronomy & Plant Breeding, Zabol University, Zabol, Iran 2 Seed and Plant Improvement Division, Khorasan Razavi Agriculture Research and Natural Resources Institute, Mashhad, Iran 3 Department of Agronomy and Plant Breeding, Zabol University, Zabol, Iran 4 PhD student of Nano-Biotechnology, University of Tehran, Tehran, Iran *Corresponding author Email: [email protected] Abstract Determination of gene effects and combining abilities is a critical stage in maize hybrid breeding. In the present study, 20 S6 lines as female and three S6 inbred lines (K18, K19 and K1264/5-1) as tester were crossed and the resulting test cross progenies were evaluated in a randomized complete block design with three replications in 2008. During the growing period, several agronomic characters including forage yield were measured. Effects of lines and testers were significant on all the characters except ASI and days to physiological maturity for lines and ASI for testers. This indicated the importance of additive gene effect in controlling most of the traits under investigation. Inbred lines L5, L14 and L1 were identified as good general combiners for forage yield because they showed significant positive GCA for this trait. L14 was superior compared with L1 and L5 because of significant positive GCA for most of the agronomic characters. These lines, especially L14, have potential additive gene effects to be utilized in the breeding programs. T3 tester showed favorable additive gene effects for forage yield, its components, early maturity and shorter stature. The highest forage yield (79.040 t/ha) with large positive SCA belonged to L5 × T3 combination. L2 × T3 and L15 × T2 crosses were other desirable combinations. Additive genetic variance was substantially higher than dominance genetic variance for all of the traits except days to physiological maturity. This indicated that additive gene effects were more prominent than dominance effects in controlling forage yield and some other agronomic traits in relation to the studied S6 inbred lines. Therefore, narrow sense heritability estimates closely resembled the broad sense heritability values except for phenological characters. Medium to high narrow sense heritability estimates enable to select for favorable additive gene effects among the studied lines.
Keywords: GCA, Inbred line, Maize, SCA, Testcross, Tester

64 Mosa Abadi et al. 2011, 1(1): 63-73
Introduction Development of new hybrid varieties in maize requires information about genetic structure of the parental lines and their progenies. This information can be derived from different mating designs such as diallel (Hayman 1954, Jinks 1954, Griffing 1956) and line × tester (Kempthorne 1957) crosses. Venkatesh et al. (2001) used line × tester method to evaluate the progeny of 42 test crosses (21 lines and 2 testers) in order to decrease number of lines at the early stage of screening. Line × tester method has been used in various studies (e.g. Hossein and Aziz 1998, Petrovice 1998, Mankir et al. 2004, Wali et al. 2010, Hefny 2010) to determine general combining ability (GCA) and specific combining ability (SCA) of the lines under study. Petrovice (1998) suggested that combination of lines with significant positive or negative GCA can lead to positive and significant SCA in their test crosses. However, Hossein and Aziz (1998) showed that parents with high GCA for a trait do not give necessarily a high SCA for the same trait. Riboniesa and Efren (2008) classified white inbred lines of maize into two heterotic groups using yield combining ability effects. Line × tester analysis is also helpful in estimating genetic variance components and types of gene effects (Singh and Chaudhary 1985). Venkatesh et al. (2001) using line × tester method found significant differences between lines, testers and line × tester combinations indicating the contribution of both additive and non- additive (dominance) gene actions in controlling grain yield. Hede et al. (1999) crossed 23 tropical maize inbred lines
with four broad based synthetic testers and evaluated the progenies in six environments. Analysis of variance showed significant GCA and SCA for grain yield. Konak et al. (1999) in a 6× 4 line × tester analysis reported that additive gene action was more prominent in controlling plant height and number of kernel rows, however, grain yield, 100 seed weight, ear height, ear length and time to maturity were mainly affected by dominance effects. Petrovice (1998) also obtained the similar results for number of kernel rows, grain yield, 100 seed weight and ear height. Chokan (1999) evaluated the progenies of a line × tester cross in maize at normal and high plant densities. Significant additive genetic variances were observed for kernel number per row and number of kernel rows under high plant density. For other traits, including grain yield, additive and dominance genetic variances were significant in both conditions. Degree of dominance for most traits was in the range of overdominance. Jha and Khera (1992) in a factorial mating system using five testers as female and 16 S3 lines as male parents in maize under two environments reported significant variation for all the components. For grain yield, SCA and SCA× environment interaction were more important than GCA and its interaction with environment, indicating the role of non-additive gene action in controlling grain yield. Although both additive and dominance type of gene action has been documented in maize, but dominance gene effect was reported more important than the additive type, especially for grain yield. The objectives of this study were to estimate GCA, SCA and the gene effects for forage yield

Estimation of Combining Ability and Gene Effects.... 65
and related characters in maize using hybrids produced by the line × tester mating system. Materials and Methods The experiment was conducted in Khorasan Razavi Agriculture Research and Natural Resources Center, Iran, in 2008 using 60 maize test crosses. A set of 20 S6 inbred lines as female were crossed with three inbred lines (T1=K18, T2=K19, T3=K1264/5-1) as male parents or testers in three separate fields in 2007. The resulting test crosses were evaluated in 2008 using a randomized complete block design with three replications. Each test cross progeny was planted in a row with 4.5 m length and between-row and within-row spacing of 75 and 16.5 cm, respectively. During the growing season, plant height, ear height, stem diameter, number of leaves above ear, total number of leaves, number of ears per plant were measured randomly on 10 competitive plants in each plot. In addition, days to silking, days to anthesis, anthesis-silking interval (ASI) and days to physiological maturity were reported. Furthermore, all competitive plants from a plot were cut to the ground level at dough stage and after adjusting for moisture level, the forage yield was recorded on the basis of kilograms per hectare of harvested area. The collected data were analyzed by SAS (Version 9.1) program. GCA and SCA and standard errors of the estimates were determined by the following formula (Singh and Chaudhary 1985): GCA (Lines) = Yi../rt – Y…/rlt GCA (Testers) = Y.j./rl – Y…/rlt SCA= Yij./r – Yi../rt – Y.j./rl + Y…/rlt SE (GCA for line)= (Me/rt)1/2
SE (GCA for tester)= (Me/rl)1/2 SE (SCA)= (Me/r)1/2 SE (GCAi – GCAi') line= (2Me/rt)1/2 SE (GCAj – GCAj') tester= (2Me/rl)1/2 SE (SCAij – SCAi'j')= (2Me/r)1/2 Where, Yi..= Total of the ith line, Y.j.= Total of the jth tester, Y…= Grand total, r, l and t = number of replications, lines and testers, respectively, SE= Standard error of the estimate and Me= Error mean square Additive genetic variance (σ2
A), dominance genetic variance (σ2
D), narrow sense heritability (h2
N), broad sense heritability (h2B) and average
degree of dominance were estimated as below (Singh and Chaudhary 1985): σ2
A= (4/1+F) σ2gca
σ2D= (2/1+F)2 σ2
sca
h2N= σ2
A/ σ2P
h2B= (σ2
A+ σ2D)/ σ2
P
Average degree of dominance= (2σ2D/ σ2
A)1/2
Where, σ2gca= Estimate of GCA variance, σ2
sca= Estimate of SCA variance, σ2
P= Estimate of phenotypic variance (plot mean basis) and F= Inbreeding coefficient, which was considered as unity because both lines and testers were inbred. Lines were considered as random and testers as fixed factors. Therefore, additive genetic variance was only calculated from σ2
gca of the lines. Results and Discussion Analysis of variance showed significant differences between test crosses for all ofthe traits except ASI (Table 1). Effects of lines and testers were also significant for all the measured traits except for ASI (both lines and testers) and

66 Mosa Abadi et al. 2011, 1(1): 63-73
Table 1. Analysis of variance for agronomic traits of maize test crosses
Mean squares Sources of variation
Degrees of
freedom Ear height Plant
height Stem
diameter
Anthesis- silking interval
Days to anthesis
Days to silking
Forage yield
Number of leaves above ear
Number of leaves
Number of
ears/plant
Days to Physiological
maturity Replication 2 616.87** 962.62** 14.81** 0.206ns 2.93ns 3.02ns 851.13** 0.138ns 5.36** 0.053* 28.85
Cross 59 261.40** 558.40** 5.51** 0.747ns 18.09** 18.33** 166.96** 0.127** 1.01** 0.025** 62.56** Line 19 480.22** 838.58** 5.11** 0.974ns 13.05** 12.85** 191.82** 0.691** 1.72** 0.034* 34.48ns
Tester 2 2169.05** 6791.49** 89.17** 0.339ns 308.53** 328.65** 1603.88** 0.681** 8.55** 0.088* 735.8**
Line ×Tester 38 51.59ns 90.26ns 1.31ns 0.655ns 5.32* 4.74* 78.90ns 0.098* 0.27ns 0.017ns 41.17** Error 118 56.43 71.99+ 1.45+ 0.578 3.16+ 2.98 70.50+ 0.061 0.32 0.014 21.88
* , **: Significant at 0.05 and 0.01 probability levels, respectively ns: Non-significant +: Error mean squares (with 117 degrees of freedom) excluding non-additivity variance

Estimation of Combining Ability and Gene Effects.... 67
for days to physiological maturity (lines) which indicates the existence of genetic variability among lines and testers in terms of general combining ability. However, mean squares for testers were substantially larger than lines for most of the traits under study. Line × tester interaction was only significant for number of leaves above ear, days to silking, days to anthesis and days to physiological maturity suggesting that dominance gene action was also involved in governing these traits. Table 2 shows the estimates of GCA for lines and testers and their SCA. L5, L14 and L1 Inbred lines showed significant positive GCA for forage yield whereas L1 had significant positive GCA for total number of leaves and number of leaves above ear. L15 also showed significant positive GCA for stem diameter, ear height and days to anthesis and significant negative GCA for ASI. L14 was superior over L1 and L5 having significant positive GCA for most of the agronomic characters including total number of leaves, number of leaves above ear, number of ears per plant, stem diameter, plant height and ear height. Thus, these three inbred lines, especially L14, have potential to be utilized for producing synthetic maize varieties and for other breeding purposes. Among the testers, T3 showed significant positive GCA for total number of leaves, number of leaves above ear, number of ears per plant, forage yield and significant negative GCA for days to anthesis, days to silking, days to physiological maturity, stem diameter, plant height and ear height (Table 2.). Therefore, this tester had favorable additive genes for forage yield and its components and, also, additive genes for early maturity and shorter stature. T1
and T2 had significant positive GCA for days to anthesis, days to silking and days to physiological maturity indicating that these testers had additive genes for late maturity. On the other hand, for plant height and ear height positive and significant GCA was observed for T2, while negative and significant for T1. The existence of considerable diversity among testers for GCA of different characters justified the use of these genotypes for testing the GCA of S6 inbred lines under study. Promising crosses are selected based on per se performance, standard heterosis and SCA effects. The highest forage yield (79.040 t/ha) belonged to L5 × T3 combination (Table 3). This combination had also high positive SCA for forage yield. The superiority of L5 × T3 hybrid can be attributed to its higher leaf number, days to physiological maturity and more ears per plant (data not shown). Higher forage yield and SCA for forage yield were also observed in L1 × T2, L2 × T3 and L15 × T2. L15 × T2 had also large positive SCA for number of leaves above ear. Furthermore, negative SCA of days to anthesis and days to silking were observed for L5 × T3, L2 × T3 and L15 × T2, while positive SCA of these characters were determined for L1 × T2. However, none of the SCAs for these combinations were significant. Early and medium-maturing forage maize hybrids are desirable in the area of study in order to decrease the risk of early autumn cold stress. Therefore, for traits such as days to anthesis and silking, negative GCA or SCA are preferred. Thus, on the basis of forage yield and maturity the genotypes L5 × T3, L2 × T3 and L15 × T2 may be regarded as promising hybrids and

68 Mosa Abadi et al. 2011, 1(1): 63-73
Table 2. Estimates of general combining ability of maize inbred lines and testers Days to
Physiological maturity
Ear height Plant height Stem
diameter ASI
Days to anthesis
Days to silking
Forage yield
Number of ears/plant
Number of leaves above
ear
Number of leaves
Line
0.244 -0.22 0.45 0.60 -0.32 0.12 -0.19 6.36 0.04 0.36 0.70 L1 -0.978 -10.86 -9.92 0.55 0.02 0.01 0.03 -5.25 0.08 -0.08 0.13 L2 -2.200 -11.09 -10.95 0.24 0.13 -0.77 -0.64 -1.43 -0.07 -0.31 -0.66 L3 -1.422 -1.17 -15.93 0.89 0.24 -1.54 -1.31 0.09 0.07 -0.61 -0.33 L4 2.689 5.79 3.38 1.10 -0.54 1.46 0.92 10.04 0.02 0.04 0.26 L5 -1.867 -13.44 -22.36 -1.00 0.24 -3.10 -2.86 -9.45 -0.06 -0.32 -0.64 L6 1.578 -7.67 4.45 -0.01 0.24 -0.77 -0.53 -2.55 -0.06 0.15 -0.24 L7 -0.200 1.23 6.53 0.34 -0.21 0.68 0.47 2.34 0.09 0.21 0.69 L8 0.244 0.40 4.45 -0.82 -0.32 1.23 0.92 -0.33 -0.05 0.00 0.32 L9 0.244 1.37 -0.89 -0.76 0.13 -0.43 -0.31 -0.30 0.01 -0.12 -0.28 L10 -3.867 -0.77 1.95 0.12 -0.32 -0.43 -0.75 0.72 0.08 0.64 0.53 L11 -2.533 -5.08 -11.13 -0.61 -0.09 -1.88 -1.97 -5.08 -0.08 -0.01 0.02 L12 -1.644 5.57 4.53 -1.14 0.02 -0.10 -0.08 -2.53 -0.03 -0.15 -0.18 L13 3.022 12.69 19.06 1.72 -0.21 1.23 1.03 7.44 0.10 0.26 0.53 L14 1.133 7.56 5.84 0.07 -0.09 1.12 1.03 0.21 0.06 0.01 -0.08 L15 3.467 -3.70 0.75 0.41 0.91 1.46 2.36 -1.02 -0.04 0.05 -0.08 L16 2.022 2.49 2.60 -0.35 0.46 0.90 1.36 3.80 -0.06 -0.38 -0.87 L17 -0.200 7.21 6.11 -0.53 -0.09 0.79 0.70 -2.73 -0.01 -0.01 0.10 L18 -0.533 -2.26 0.49 -0.72 -0.32 0.12 -0.19 -3.41 -0.09 0.16 -0.10 L19 0.800 11.95 10.63 -0.09 0.13 -0.10 0.03 3.15 0.05 0.10 0.15 L20 1.56 2.504 2.828 0.401 0.253 0.593 0.575 2.799 0.039 0.082 0.189 SE(GCA)
2.21 3.541 4.000 0.568 0.358 0.838 0.814 3.958 0.056 0.116 0.267 SE(GCAi-GCAi')
Tester 1.77 -4.23 -8.31 0.35 -0.01 0.51 0.50 -4.44 -0.036 -0.10 -0.05 T1 2.27 6.88 11.92 1.01 0.08 1.97 2.05 -1.24 -0.004 -0.01 -0.35 T2 -4.03 -2.66 -3.69 -1.36 -0.07 -2.48 -2.55 5.68 0.040 0.11 0.40 T3 0.60 0.970 1.095 0.155 0.098 0.229 0.223 1.084 0.015 0.032 0.073 SE(GCA)
0.85 1.371 1.549 0.220 0.139 0.325 0.315 1.533 0.022 0.045 0.103 SE(GCAj-GCAj')
ASI: Anthesis-silking interval

Estimation of Combining Ability and Gene Effects… 69 Table 3. Forage yield and specific combining ability of several characters for line × tester combinations of maize under study
Specific combining ability Specific combining ability No. of leaves
above ear Days to anthesis
Days to silking
Forage yield
Forage yield
Cross No. of leaves above ear
Days to anthesis
Days to silking
Forage yield
Forage yield
Cross
0.035 -1.950 -1.500 -1.005 50.445 L11×T1 -0.154 -0.506 -0.722 -5.140 51.952 L1×T1 0.076 1.250 0.617 1.252 55.897 L11×T2 -0.046 1.028 1.061 6.328 66.615 L1×T2 -0.111 0.700 0.883 -0.247 61.317 L11×T3 0.200 -0.522 -0.339 -1.187 66.019 L1×T3 0.113 -0.172 0.056 -2.495 43.154 L12×T1 0.046 0.605 0.389 -3.531 41.954 L2×T1 0.020 -0.306 -0.494 6.968 55.813 L12×T2 -0.013 1.138 1.172 -5.621 43.060 L2×T2 -0.133 0.478 0.439 -4.473 51.290 L12×T3 -0.033 -1.745 -1.561 9.152 64.752 L2×T3 -0.110 1.050 0.500 5.530 53.730 L13×T1 0.146 -0.283 -0.944 -3.319 45.981 L3×T1 0.065 -1.083 -0.717 3.994 55.390 L13×T2 0.087 0.917 1.506 1.325 53.821 L3×T2 0.045 0.033 0.217 -9.524 48.791 L13×T3 -0.233 -0.633 -0.561 1.994 61.408 L3×T3 0.179 -0.283 0.056 3.846 62.020 L14×T1 -0.221 -1.839 -1.611 -3.159 47.579 L4×T1 -0.180 0.583 -0.161 -3.906 57.463 L14×T2 0.220 1.028 1.172 2.104 56.038 L4×T2 0.000 -0.300 0.106 0.060 68.348 L14×T3 0.000 0.811 0.439 1.055 61.908 L4×T3 -0.210 2.161 1.722 -2.790 48.145 L15×T1 0.002 0.161 -0.167 -2.625 58.145 L5×T1 0.131 -1.306 -1.161 8.354 62.485 L15×T2 -0.057 1.028 1.283 -5.532 58.433 L5×T2 0.078 -0.856 -0.561 -5.564 55.486 L15×T3 0.056 -1.189 -1.117 8.156 79.040 L5×T3 0.057 -0.172 0.056 1.167 50.876 L16×T1 -0.343 0.050 0.278 -20.047 40.723 L6×T1 -0.135 0.361 1.172 1.233 54.138 L16×T2 0.298 -0.750 -0.606 -17.145 46.820 L6×T2 0.078 -0.189 -1.228 -2.400 57.424 L16×T3 0.045 0.700 0.328 -21.281 49.603 L6×T3 0.179 0.383 0.722 1.289 55.821 L17×T1 0.103 -1.617 -1.722 -2.227 45.956 L7×T1 -0.146 -0.750 -1.161 0.643 58.371 L17×T2 -0.075 0.250 0.394 -2.524 48.855 L7×T2 -0.033 0.367 0.439 -1.932 62.715 L17×T3 -0.028 1.367 1.328 4.751 63.049 L7×T3 0.013 -1.506 -1.278 0.452 48.457 L18×T1 0.090 -0.394 0.278 2.170 55.243 L8×T1 -0.046 0.694 0.172 -0.861 50.340 L18×T2 -0.135 0.472 -0.272 -2.337 53.932 L8×T2 0.034 0.811 1.106 0.409 58.529 L18×T3 0.045 -0.078 -0.006 0.167 63.354 L8×T3 0.046 1.494 1.611 6.843 54.163 L19×T1 0.268 1.050 0.500 -1.838 48.560 L9×T1 -0.213 -2.306 -2.272 -8.251 42.264 L19×T2 0.176 0.917 0.950 1.121 54.715 L9×T2 0.167 0.811 0.661 1.408 58.842 L19×T3 -0.444 -1.967 -1.450 0.717 61.230 L9×T3 -0.098 1.383 1.389 7.578 61.455 L20×T1 -0.143 0.383 0.389 -0.189 50.246 L10×T1 -0.057 -2.750 -2.494 -7.936 49.136 L20×T2 0.031 -0.417 -0.161 1.298 54.928 L10×T2 0.156 1.367 1.106 0.358 64.349 L20×T3 0.111 0.033 -0.228 -1.109 59.440 L10×T3
4.848 4.848 SE (mean) 0.143 1.026 0.997 4.848 0.143 1.026 0.997 4.848 SE (SCA) 0.202 1.451 1.409 6.856 0.202 1.451 1.409 6.856 SE (SCAij – CAi'j')

70 Mosa Abadi et al. 2011, 1(1): 63-73
should be evaluated further for forage yield and other desirable characters. Estimates of various genetic parameters are presented in Table 4. Negative estimates of genetic components of variance for some characters were set to zero based on expected mean squares. Negative estimates of genetic components can be derived from unsuitable genetic and statistical model, insufficient sampling of original population, sampling error and improper experimental design (Mather and Jinks1982, Roy 2000). Although dominance genetic variance was present for some characters under study, additive genetic variance was much larger than dominance genetic variance for all of the traits except days to physiological maturity indicating that additive gene effects were more important than dominance effects in controlling forage yield. Therefore, the estimates of narrow sense heritability were very close to those of broad sense except for phenological characters. Narrow sense heritability estimates ranged from 0.17 for days to physiological maturity to 0.84 for plant height. Narrow sense heritability of forage yield was medium (0.51). Medium to high narrow sense heritability estimates suggest the possibility of selecting for additive gene effects among the studied lines. Except for days to physiological maturity, average degree of dominance was in the range of incomplete dominance. Large over-dominance value (2.14) for days to physiological maturity may be due to the result of correlated gene distributions among parents so that partial dominance appears as over-dominance (Hayman 1954). Ferret et al. (1991) reported that for stover and whole plant dry matter yield (DMY) in two dent
maize populations additive gene effect was the most important gene action. Moreno-González et al. (2000) in a study using European flint (F) and U.S. corn belt dent (D) populations for forage use, reported non-significant average heterosis for stover DMY. In contrast, all populations had high significant heterosis for ear DMY, and six populations had significant heterosis for whole plant DMY. In addition, overall average heterosis was significant for ear and whole plant DMY. Therefore, they stated that most of the contribution to heterosis of the whole plant DMY was provided by the ear fraction rather than the stover fraction. Similarly, based on the results of Boppenmaier et al. (1992), stover fraction of DMY had higher effect on heterosis than the grain in maize hybrids. Moreno-González et al. (2000) suggested that dominance gene action for the ear DMY fraction may be present in all F × F, F × D and D × D types of crosses, whereas dominance gene action for the stover DMY fraction may be present in the F × D crosses. Therefore, they concluded that breeding strategies for silage hybrids should use populations from the F × D heterotic pattern. Both additive and non-additive gene effects for plant height were reported by Konak et al. (1999), Lee and Shung (1995) and Menkir et al. (2004), leaf number by Jha and Khera (1992), days to silking by Neastares et al. (1999) and Mendoza et al. (2000) and days to anthesis by Lopes et al. (1995) and Menkir et al. (2004). Esmaili et al. (2005) reproted additive gene effects for plant height, days to anthesis, days to physiological maturity and leaf no. Higher non-additive gene effects was obtained for days to silking by several researchers (Konak et al.

Estimation of Combining Ability and Gene Effects.... 71
Table 4. Estimates of additive genetic variance, dominance genetic variance, narrow sense heritability, broad sense
heritability and average degree of dominance for the maize characters under study
Estimates of parameters
Ear height
Plant height
Stem diamet
er
Anthesis- silking interval
Days to anthesis
Days to silking
Forage yield
Number of leaves
above ear
Number of leaves
Number of ears/plant
Days to Physiological
maturity σ2
A 94.18 170.35 0.81 0.098 2.20 2.19 26.96 0.14 0.31 0.004 2.8 σ2
D 0.00 6.09 0.00 0.026 0.72 0.59 2.8 0.012 0.00 0.001 6.43 h2
N 0.83 0.84 0.63 0.31 0.66 0.58 0.51 0.81 0.74 0.41 0.17 h2
B 0.83 0.88 0.63 0.39 0.88 0.74 0.55 0.88 0.74 0.52 0.58 Average degree of dominance - 0.27 - 0.73 0.65 0.73 0.46 0.41 - 0.71 2. 14

72 Mosa Abadi et al. 2011, 1(1): 63-73
1999, Nestares et al. 1999, Esmaili et al. 2005), although some researchers indicated the contribution of additive gene effects for this character (Rissi and Hallauer 1991, Jha and Khera 1992). Petrovice (1998) indicated the importance of non-additive gene action in governing plant height, while others (Jha and Khera 1992, Konak et al. 1999) showed the prominence of additive gene action for the this trait. Furthermore, Hefny (2010) reported the greater role of additive gene effects in controlling
days to anthesis. The different results can be due to different experimental materials and environmental conditiona or the use of different methods for estimating genetic parameters (Konak et al. 1999). Acknowledgement
This study was supported by Seed and Plant Improvement Institute (SPII), Karaj, Iran. We thank M. Mohammadi for his help in the field experiments.
References Boppenmaier J, Melchinger AE, Brunklaus-Jung E, Geiger HH and Herrmann RG, 1992. Genetic diversity for
RFLPs in European maize inbreds: I. Relation to performance of flint × dent crosses for forage traits. Crop Science 32: 895–902.
Chokan R, 1999. Estimation of combining ability, additive and dominance variances of characters using line× tester crosses of maize inbred lines. Seed and Plant 15:47-55 (In Farsi with English abstract).
de Rissi R and Hallauer AR, 1991. Evaluation of four testers for evaluation of maize (Zea mays L.) lines in a hybrid development program. Brazilian Journal of Genetics 14: 467-481.
Griffing B, 1956. Concept of general and specific combining ability in relation to diallel crossing system. Australian Journal of Biological Sciences 9: 463-493.
Hallauer AR & Miranda FJB, 1988. Quantitative Genetics in Maize Breeding, 2nd Ed. Iowa State University Press, Ames, Iowa, USA.
Hayman BI, 1954.The theory and analysis of diallel crosses. Genetics 39: 789-809. Hede AR, Srinivasan G, Stolen O and Vasal SK, 1999. Identification of heterotic pattern in tropical inbred maize
lines using broad based synthetic testers. Maydica 44: 325-331. Hefny M, 2010. Genetic control of flowering traits, yield and its components in maize (Zea mays L.) at different
sowing dates. African Journal of Crop Science 2: 236-249. Hussain MR & Aziz K, 1998. Study of combing ability in maize line × tester hybridization. Pakistan Journal of
Biological Science 1: 196-198. Jha PB & Khera AS, 1992. Evaluation of maize inbred lines derived from two heterotic population. Indian
Journal of Genetics and Plant Breeding 52: 126-131. Jinks JL, 1954. The analysis of heritable variation in a diallel cross of Nicotiana rustica varieties. Genetics 39:
767-788. Kempthorne O, 1957. An Introduction to Genetic Statistics. John Wiley, New York, pp. 545. Konak C, Unay A, Serter E, and Basal H, 1999. Estimation of combining ability effects, heterosis and
heterobeltiosis by line × tester method in maize. Turkish Journal of Field Crops 4: 1-9. Kumar MNV, Kumar SS and Ganesh M, 1999. Combining ability studies for oil improvement in maize (Zea
mays L.) Crop Research Hissar 18: 93-99. Lee Ho S and Shung Lu H, 1995. Identification of heterotic patterns with inbred line testers in maize. Journal of
Agricultural Research China 44: 242-250.

Estimation of Combining Ability and Gene Effects.... 73
Llaurado´ M and Moreno-Gonzalez J, 1993. Classification of northern Spanish populations of maize by methods of numerical taxonomy. I. Morphological traits. Maydica 38: 15–21.
Lopes UV, Galvao JD and Cruz CD 1995. Inheritance of the flowering time in maize. 1. Diallel analysis. . Pesquisa Agropecuaria Brasileira 30: 1267-1271.
Mather K and Jinks JL, 1982. Biometrical Genetics. The Study of Continuous Variation, 3rd Ed. Chapman and Hall, New York, pp. 396.
Mendoza M, Oyervides A and Lopez A, 2000. New maize cultivars with agronomic potential for the humid tropics. Agronomica Meso Americana 11: 83-88.
Menkir A, Melake-Berhan A, Ingelbrecht I and Adepoju A, 2004. Grouping of tropical mid-altitude maize inbred lines on the basis of yield data and molecular markers. Theoretical and Applied Genetics 108: 1582-1590.
Moreno-Gonza´lez J, Martı´nez I, Brichette I, Lo´pez, A and Castro P, 2000. Breeding potential of European flint and U.S. corn belt dent maize populations for forage use. Crop Science 40: 1588–1595.
Nestares G, Frutos E and Eyherabide G, 1999. Combining ability evaluation in orange flint lines of maize. Pesquisa Agropecuaria Brasileira 34: 1399-1406.
Petrovic Z, 1998. Combining abilities and mode of inheritance of yield and yield components in maize (Zea mays L.). Novi Sad, Yugoslavia, 85p.
Riboniesa PL and Efren EM, 2008. Classifying white inbred lines into heterotic groups using yield combining ability effects. USM R&D Journal 16: 99-103.
Roy D, 2000. Plant Breeding, Analysis and Exploitation of Variation. Alpha Science International Ltd, Pangbourne, UK, pp.
Singh RK and Chaudhary BD. 1985. Biometrical Methods in Quantitative Genetic Analysis. Kalyani Publishers, India.
Venkatesh V, Singh NN and Gupta NP, 2001. Early generation identification and utilization of potential inbred lines in modified single cross hybrids of maize (Zea mays L.). Indian Journal of Genetics and Plant Breeding 61: 309-313.
Wali MC, Kachapur RM, Chandrashekhar CP, Kulkarni VR and Devara Navadagi SB, 2010. Gene action and combining ability studies in single cross hybrids of maize (Zea mays L.). Karnataka J. Agric. Sci. 23: 557-562.

Journal of Plant Physiology and Breeding
ISSN: 2008-5168 2011, 1(1): 75-92
Grain Filling Rate and Duration in Bread Wheat Under Irrigated and Drought
Stressed Conditions
AG Sanjari Pireivatlou1*
, RT Aliyev2 and B Sorkhi Lalehloo
3
Received: 18 April 2010 Accepted: 1 October 2010
1Agricultural and Natural Resources Research Station of Ardabil, Ardabil, Iran
2Azerbaijan National Academy of Science, Genetic Resources Institute, Baku, Republic of Azerbaijan
3Seed and Plant Improvement Institute (SPII), Karaj, Iran
*Corresponding author Email: [email protected] Abstract Eleven wheat cultivars were evaluated at 10-day intervals, beginning from anthesis, under irrigated and drought stress conditions during 2006-2007. The effects of irrigation, genotype and date of harvest were significant for most of the studied characters. Water deficit decreased pre-and post-anthesis assimilation rate, grain weight per spike, grain number per spike and 1000 grain weight about 5.7, 24.5, 21.2, 15.7 and 6.4 %, respectively. Mobilization, mobilization efficiency and contribution of pre-anthesis assimilates to kernels were considerably increased under drought stress condition. Grain weight, grain growth rate and contribution of current assimilates to grain filling decreased under drought stress about 7.18, 22.1 and 29.6 %, respectively. However, the effective grain filling period was considerably increased in the stressed plants. Grain filling rate was correlated with the accumulation of dry matter at maturity, grain weight per spike and grain number per spike in the irrigated and drought stressed environments (r=0.87** and 0.53, r=0.87** and r=0.62*, r=0.75* and r=0.63*, respectively). A negative correlation was found between effective grain filling period and grain yield/spike under irrigation (r =-0.65*) and drought stress (r =-0.76**) conditions. Furthermore, positive correlations between grain filling rate and grain yield were obtained in the irrigated and drought stressed environments (r = 0.87** and r = 0.62*, respectively). It seems that accumulation of pre-anthesis assimilates (mainly under drought stress), short effective grain filling period and high grain filling rate are major factors for producing higher grain yield in wheat under both irrigated and drought stress conditions. Keywords: Drought stress, Effective grain filling period, Grain filling rate, Wheat Introduction Genetic variability exists among winter cereal genotypes in response to environmental factors such as drought stress condition, and thus,
selection of genotypes for each production area is feasible (Gooding et al. 2003). Based on Santiveri et al. (2002), grain dry weight at maturity was determined by the rate of dry

Sanjari et al. 2011, 1(1): 75-92
76
weight accumulation and the length of dry weight accumulation period. The assimilate supply problem may be compounded by further reductions in photosynthesis due to water stress and suggests that the reduction in grain number caused by stress at this critical period is proportional to the reduction in leaf-area development and hence, in available assimilate during about 25 days before anthesis (Fischer 1980). Grain growth and development in wheat depend on C from three sources: current assimilates produced by photosynthesis in leaves and stems, mobilization of the stored carbohydrates and N containing compounds within these organs and their subsequent transport to the spike and growing kernels, and assimilates produced by the spike (Bradford and Hasio 1982, Sanjari Pireivatlou and Yazdasepas 2009). Van Herwaarden et al. (1998) showed that under dry conditions, the apparent contribution of stored assimilates could be 75-100% of grain yield, compared with 37-39% under rainfall conditions. In fact, a high correlation was found between the use of non-structural carbohydrates stored in stems and grain yield under drought conditions (Gavuzz et al. 1997). Wheat crops grown in dry land areas may depend more on the stem reserves for grain filling than crops grown under well-watered conditions (Ehdaie et al. 2006). There are two components involved in the extent of contribution of stored reserves to grain yield in wheat; the first is the ability to store assimilates in the stem and the second is the efficiency of the crop to mobilize and translocate the reserved materials to the grains. The second component is a function of sink strength in a genotype, which depends on the number of grains per spike and
mean grain weight (Ehdaie and Waines 1996). Stored reserves and their contribution to grain can be estimated by measuring post-anthesis changes in the internode dry matter (Hunt1997, Cruz-Aguado et al. 2000), changes in internode water soluble carbohydrate content during grain-filling period (Blum et al. 1994), or by difference between shoot dry weight at anthesis and at maturity excluding the grains (Flood et al. 1995). Grain filling duration seems to be more affected by environmental factors than grain filling rate (Wiegand and Cuellar 1981, Royo et al. 2000). Genetic variation for the duration of grain filling has been reported for wheat (Bruckner and Frohberg 1987). However, final grain weight has also been suggested to be proportional to grain filling rate (Wiegand and Cuellar 1981), because grain filling duration is largely influenced by temperature under terminal stress conditions. Therefore, selection of genotypes with high grain filling rates appears to be a successful strategy for increasing grain yield (Van Sanford 1985, Bruckner and Frohberg 1987, Knott and Gebeyehou 1987), especially for regions where grain filling duration is restricted by high temperatures (Wiegand and Cuellar 1981, Bruckner and Frohberg 1987). Lack of relationship between grain yield and grain filling duration has been reported for wheat (Nass and Reisser 1975, Van Sanford 1985, Bruckner and Frohberg 1987). Grain growth of field crops is initially slow, enters a linear phase where the growth rate is fast and then slows down toward maturity (Yoshida 1981). Cho et al. (1988) divided rice grain filling duration into three phases: lag phase of five days from heading, linear increasing

Grain Filling Rate and Duration in Bread Wheat…….. 77
phase of 5–20 days after heading and late grain filling period thereafter. However, grain filling patterns frequently demonstrate genotypic variations in many cereal crops. Yoshida (1981) suggested that effective grain filling duration, where grain growth is linear, is more important than the duration of ripening from the date of heading to the time when maximum grain weight is attained (Yashida 1981). The rate of dry matter accumulation by kernels was considerably decreased by water deficit in wheat cultivars (Plaut et al. 2004). Przulj and Momellovie (2003) reported that in the years with favorable growing conditions during vegetative growth, the main portion of dry matter was stored before anthesis, while in the years with unfavorable conditions during the same period significant amounts of dry matter were accumulated during grain filling as well. The more adapted cultivars continued the accumulation of dry matter and nitrogen during the grain filling period, while in the less adapted ones the main portion accumulated before anthesis (Przulj and Momellovie 2003). Austin et al. (1977) reported that a major quantity of pre-anthesis dry matter was used for sinks other than kernel and found that only 73 % of the losses of vegetative weight were used for kernel growth. Respiratory (Rawson and Evans 1971) and dead leaf losses (Bidenger et al. 1977) can account for the rest of losses. Modern cultivars seem to be relatively less sink-limited during post-anthesis than their predecessors (Shearman et al. 2005), as the semi dwarf wheat seems less sink-limited than the traditional tall wheat. The major purposes of this study were to understand the accumulation rates of dry matter during pre-anthesis and the effects of grain
filling rate and grain filling duration on grain yield in bread wheat genotypes under irrigated and drought stressed conditions. Material and Methods Eleven diverse wheat cultivars (Table 1) were evaluated under two water treatments (well watered and drought stress) in 2006-2007. Each experiment was laid out in a randomized complete block design with three replications. Seeds were planted on 15th October 2006, in a clay loam soil at Agricultural and Natural Resources Research Station of Ardabil (38o 15´ N, 48o 20´ E, with an elevation about 1350 m above sea level), Iran. Plants in the normal condition were irrigated five times from planting until they reached physiological maturity (i.e. at planting, tillering, booting, anthesis and milk stages). In the normal condition, plants received 672.4 mm of water (406 mm irrigation + 266.4 mm rain year-1) and those in drought stress condition received only 266.4 mm seasonal rainfall during the 2006-2007 growing year. However, 78.7% of this rainfall was received before booting stage, 19.6 % between booting and heading stage (4.0-4.9 sub-stage of Zadoks), and 1.7% fell between heading and early grain filling period (6.0 to 7.0 sub-stage of Zadoks). Based on the climatic data of Ardabil region, a period of drought was occurred during grain filling stage of wheat in June and July. The absolute maximum and mean temperatures in the grain filling period were 30˚C and 8.0˚C, respectively. Average temperatures were optimum during grain filling period (data not shown). Each plot consisted of two rows, 2 m in length. Inter-row spacing was 30 cm and kg

Sanjari et al. 2011, 1(1): 75-92
78
Table 1. The pedigree, origin and growth habit of wheat cultivars under study No Pedigree Origin Growth habit 1 Siosson/M-73-4/3/Bez-2B/Cgn/Veratza Iran Spring and semi dwarf 2 MV17 Hungary Winter and semi dwarf 3 Kal/Bb//Cj”s”/3/Hork”s”/4/Mv17/5/Gascogne/3/P101/Anza//1-66-49 Iran Winter and semi dwarf 4 Gaspard/6/Bow”s”/Crow”s”/5/Omid/4/Hys//Drc*2/7c/3/2*Rsh Iran Winter and semi dwarf 5 Mv-92-2854//Rsh*2/10120 Iran Winter and semi dwarf 6 ID800994w/Vee//F900K/3/Pony/Opata 9th EYT+ Winter and semi dwarf 7 Es14//Sitta//Agri/Nac 9th EYT+ Spring and semi dwarf 8 Sardari (landrace) Iran Facultative and tall 9 Agri/Nac//Atilla Iran Facultative and semi dwarf
10 Siossons France Winter and semi dwarf 11 Landrace Azerbaijan Spring and tall
+International Elite Yield Trial, CIMMYT interplant spacing was 3 to 5 cm. The land was fallowed in the previous year and 100 kg ha-1 urea was utilized at the tillering stage. All cultural practices (i.e., hoeing, weeding, fertilization, etc.) were practiced uniformly, except for irrigation which was based on the respective treatments. Data for grain growth rate (GGR), effective grain filling period (EGFP), mobilization of reserves (MDM), mobilization efficiency (ME), contribution of pre-anthesis assimilates (CPAA) and contribution of current assimilates (CCA) viz., plant height, plant weigh, grain weight per spike, grain number per spike, etc. were collected by harvesting five spikes from main stems and primary tillers (Gooding et al. 2003) at 10-day intervals (five times) from anthesis to physiological maturity. The following parameters related to dry matter mobilization were estimated in this research: 1. Pre-anthesis and post-anthesis dry matter accumulation (mg per plant). 2. Mobilization of dry matter (mg per plant) = dry matter at anthesis – dry matter (leaf + culm + chaff) at maturity.
3. Mobilization efficiency (%) = Mobilization of dry matter /dry matter at anthesis ×100. 4. Contribution of assimilates to grain (%) = Mobilization of dry matter /grain weight ×100 (Papakosa and Gagianas 1991). Effective grain filling period= grain dry weight at maturity/ linear grain growth rate (Santiveri et al. 2002). Analysis of variance (ANOVA) was performed for each character in each experiment. The combined ANOVA was also performed for irrigation experiments. Associations between characters were examined by calculating correlation coefficients. Means were compared using the LSD test (Steel et al. 1997). Results and Discussion The combined ANOVA showed significant effect of irrigation, date of harvest, genotype and genotype × irrigation interaction on most of the studied characters (data are not shown). Heading time of wheat cultivars was reduced under drought stress condition as compared with the irrigated condition (161.5 and 159.8 days,

Grain Filling Rate and Duration in Bread Wheat…….. 79
respectively). Sardary, a tall landrace, had the earliest heading time, whereas a tall landrace from Azerbaijan republic, had the latest heading time under both well watered and drought stress conditions. Drought, on the average, reduced the aboveground dry matter by 5.7 and 24.5% at anthesis and maturity, respectively. Furthermore, significant differences were found between genotypes in terms of this character at anthesis under drought stress condition. The landrace from Azerbaijan Republic had the highest aboveground dry matter (3170 mg) and the genotype No. 6 had the lowest amount (1555 mg) under this condition (Table 2). Thereby contribution of pre-anthesis assimilates to grain under drought stress condition was higher in the landrace of Azerbaijan Republic (88.5%) than the genotype No. 6 (59.3%) (Table 2). It seems that the landrace from Azerbaijan reserved high amount of non-structural assimilates in the pre-anthesis growth stage and mobilized them into grains under drought stress condition. Ehdaie and Waines (1996) also reported the same results for Iranian landraces. There were no significant differences among genotypes for dry matter at maturity and grain weight per spike under drought stress condition. Genotypic variation for this trait was considerably decreased at maturity under drought stress condition (Table 2). Although the genotypic differences were not significant at this condition, however, the highest and lowest aboveground dry matter reduction belonged to genotypes No. 9 and landrace of Azerbaijan Republic (50.2% and 19.1%, respectively). It is assumed that this reduction from anthesis to maturity was due to the utilization of assimilates
for kernel development. The average contribution of pre-anthesis dry matter to kernel weight was 30.7% and 55.9% in the irrigated and drought stress conditions, respectively (Table 2). Some genotypes, such as No. 9 and No. 8, lost much more dry matter from anthesis to maturity in the irrigated condition (38.7 and 34.6 %, respectively). Thus, a major quantity of pre-anthesis dry matter was used for sinks other than kernels. Austin et al. (1977) found that only 73 % of the loss of vegetative weight were attributed to kernel growth. Respiration (Rawson and Evans 1971) and dead leaves (Bidenger et al. 1977) could be responsible for the rest of the loss. The highest reduction of grain weight per spike (48.9%) under drought stress condition was also found in the genotype No. 6. However, grain weight per spike was increased (5.1%) in the genotype No. 3 under drought stress condition. Drought reduced grain number per spike by 15.7%. Fisher (1980) also reported the reduction in grain number per spike under water stress environment. However, the amount of reduction varied for different genotypes. The highest reduction (46.1%) was found in the genotype No. 6 in contrast with the genotype No. 3, in which grain number per spike was increased under drought stress condition (9.7%). On the other hand, grain number per spike in irrigated and drought stress conditions were similar in relation to the landrace of Azerbaijan Republic. Mobilization of dry matter and mobilization efficiency were increased under drought stress condition by 60.1% and 74.9%, respectively. However, genotypes responded differently to drought for the amount of pre-anthesis dry matter translocation and translocation efficiency.

Sanjari et al. 2011, 1(1): 75-92
80

Grain Filling Rate and Duration in Bread Wheat…….. 81
Contribution of pre-anthesis dry matter to kernels was increased under drought stress by 82.1%. Mobilization of pre-anthesis assimilates, mobilization efficiency and contribution of pre-anthesis assimilates to kernels under drought stress condition, were higher in the drought tolerant variety of Sardary, Agri/Nac/Atilla and the landrace of Azerbaijan as compared with other varieties. These genotypes had dry matter mobilization of 1115, 1105, 1591 mg, mobilization efficiency of 54.4, 50.2, 50.2% and pre-anthesis assimilate contribution of 86.8, 94.8, 88.5%, respectively (Table 2). Van Herwaarden et al. (1998) reported that under dry conditions in the field, the apparent contribution of stored assimilates could be 75-100% of the grain yield as compared with 37-39% under high rainfall conditions. According to the results obtained, genotype No. 9, with 94.8 % of dry matter contribution to grain, produced 1165 mg grain per spike, whereas genotype No. 1, with 23.5 % of assimilate contribution to grain, produced 2220 mg grain per spike (Table 2). This shows that genotypes with larger amount of assimilate contribution to grain tended to have lower grain yields. The coefficient of `determination (R
2) between mobilization of
pre-anthesis assimilates and grain yield was only 0.07, which means that the mobilization of dry matter was not useful for high grain yield production. The relationship between the contribution of pre-anthesis assimilates to grain yield and drought tolerance is not well understand, as also reported by Przulj and Momcilovic (2003). Drought, on the average, decreased dry matter accumulation in kernels by 6.4%, however, reduction varied in different genotypes. Genotype No. 2, showed highest
reduction (19.1 %) but, in Sardary, Agri/Nac/Atilla and Siosson the rate of dry matter accumulation by kernels increased under drought stress condition (Table 1), as also reported by Plaute et al. (2004).
Drought stress decreased grain weight at maturity by 7.18 %. However, the reduction varied in different wheat genotypes. The highest reduction was occurred in genotype No. 2, by 19.1%, whereas in genotypes No. 8, 9 and 10 the grain weight at maturity increased by 0.48, 8.2 and 9.7 %, respectively. Grain growth rate and contribution of current assimilates to developing grains were also decreased under drought stress condition by 22.1 and 29.6%, respectively. The highest reduction was observed in genotype No. 2 (44.9%) and the rate of grain growth in genotype No. 5 was substantially increased (32.3%) under drought stress condition. The mean values observed for effective grain filling period and grain filling rate suggest that there was compensation between both traits especially in genotypes No. 1 and No. 5 under drought stress condition and No. 1 and No. 11 under irrigated condition, where the highest rate but the shorter duration were found (Table 3). In fact, a negative phenotypic correlations (r =-0.73** and r =-0.84** under irrigated and drought stress conditions, respectively) were observed between these two traits across the genotypes. The grain filling rate in genotypes No, 1, 2, 4, 6, 8, 9 and 11 decreased, whereas the effective grain filling period increased under drought stress condition in contrast with the irrigated condition. The amount of grain filling under drought stress condition in genotypes No. 3, 5 and 10 were increased, whereas the duration

Sanjari et al. 2011, 1(1): 75-92
82
Table 3. Grain weight (GW) at maturity, linear grain growth rate (LGGR), effective grain filling period (EFGP), contribution of pre-anthesis assimilates (CPAA) and contribution of current assimilates (CCA) in wheat genotypes under irrigated and drought stress conditions
Irrigated condition Drought stress condition Genotype
GW
(mg)
LGGR
(mg/grain
/day)
EGFP CPAA
(%)
CCA
(%)
GW
(mg)
LGGR
(mg/grain
/day)
EGFP CPAA
(%)
CCA
(%)
1 38.7 60.2 0.64 8.5 91.5 33.9 41.1 0.85 23.5 67.5
2 42.3 48.8 1.16 0.0 100.0 34.2 26.9 1.27 38.3 67.3
3 41.7 33.0 1.35 44.8 55.2 39.9 38.0 1.18 53.2 46.8
4 40.8 43.9 0.96 0.0 100.0 34.0 33.4 1.31 32.7 67.3
5 38.1 34.1 1.11 39.5 60.5 37.1 45.1 1.07 53.8 46.2
6 41.1 49.6 0.82 30.0 70.0 38.4 30.0 1.29 59.3 40.7
7 44.4 33.5 1.45 34.1 65.9 39.2 28.5 1.38 45.8 54.2
8 41.7 27.6 1.52 66.5 33.5 41.9 24.6 1.94 86.8 13.2
9 33.9 23.8 1.47 56.2 43.8 36.7 20.1 2.15 94.8 5.2
10 35.0 41.2 1.88 21.0 79.0 38.4 28.6 1.36 38.5 61.5
11 46.6 57.6 0.81 37.7 62.3 39.1 36.6 1.15 88.5 11.5
LSD 5% 11.30 30.45 0.82 30.7 - 14.25 28.1 1.03 55.9 -
Mean 40.4 41.2 1.20 30.75 62.2 37.5 32.1 1.36 55.9 43.8
Changes under drought stress relative to irrigated conditions -7.18 -22.1 13.3 81.8 -29.6

Grain Filling Rate and Duration in Bread Wheat…….. 83
of grain filling was decreased as compared with the irrigated condition. In conclusion, the higher rates were accompanied by the shorter duration across the genotypes studied, as also reported by Gooding et al. (2003).
Data about grain growth was well described by the logistic model proposed by Darroch and Baker (1990), because the coefficients of determination obtained were higher than 98% in most cases (Figures 1 to 14). Grain filling duration depended strongly on the environment, which accounted for 22.1% of the total variation. Probably genotypic variations were partially responsible for the observed differences in the grain filling duration. A reduction of 46.7% in grain filling duration was observed in the latest flowering genotype (No. 11) as compared with the earliest genotype, No. 8 (Table 3).
Differences between genotypes for grain filling duration were significant (Table 3). There was no evidence that grain filling in primary tillers suffered more from the stress than in main stem. For example coefficient of determinations between grain weight and grain number were 0.71 and 0.66 under irrigated and drought stress conditions, respectively (Figures 1 and 2). Under irrigated condition, the grain weight of the winter genotypes was 39.8 mg, whereas in the spring genotypes this ranged between 44.4 mg for the genotype No. 7 (Es14//Sitta//Agri/Nac), and 46.6 mg for the genotype No. 11 (Landrace of Azerbaijan Republic) (Table 3) whereas, on the average, the same grain weight was found in the winter and spring genotypes, as reported by Santiveri et al. (2002).
The timing and duration of the stresses coincided broadly with the different phases of grain development. The period from day 1 to 10 appeared to cover a lag phase, associated with cell division, and the start of the linear phase of grain growth. The period from day 11 to 40 broadly corresponded to the linear phase of grain growth in the irrigated plants (Figure 2). When stress was applied during this period (Figure 2), day 40 occurred after the end of the linear phase of grain filling. The period from day 41 to 50 occurred after maximum dry matter content was attained and therefore, coincided with the maturation period. All stresses imposed before the end of linear phase of grain growth reduced final mean grain weight (Table 3, Figure 2). This reduction was most marked when drought stress occurred between days 40 and 50 after anthesis (Figure 2). On the average, the effect of drought stress between days 11 and 40 was approximately additive (Figure 2), as reported earlier (Gooding et al. 2003). Drought stress also reduced grain number per spike (Table 3).
The period of lag phase was from day 1 to 20 and from day 20 to 40 and broadly corresponded to the linear phase of grain growth, when stress was imposed during this period (Figure 3), and day 40 occurred after the end of the linear phase of grain filling. The period from day 41 to 50 occurred after maximum dry matter content was attained and therefore, coincided with the maturation period in the genotype No. 1. All stresses imposed before the end of the linear phase of grain growth, reduced final mean grain weight by

Sanjari et al. 2011, 1(1): 75-92
84
Figure 1. Relationship between grain weight and grain number on wheat genotypes under irrigated condition
Figure 2. Relationship between grain weight and grain number on wheat genotypes under rainfed condition
y = 24.137x + 177.6R2 = 0.6659
800
1000
1200
1400
1600
1800
25 30 35 40 45 50 55 60Grain number
Gra
in w
eigh
t (m
g)
y = 18.875x + 621.53R2 = 0.7113
1200
1300
1400
1500
1600
1700
1800
30 35 40 45 50 55 60Grain number
Gra
in w
eigh
t (m
g)G
rani
n w
eigh
t (m
g)
Gra
nin
wei
ght (
mg)

Grain Filling Rate and Duration in Bread Wheat…….. 85
12.4% (Table 3, Figure 3). This reduction was mostly marked when drought stress occurred between days 40 and 50 after anthesis (Figure 3). The effect of drought stress between days 20 and 40 has been reported to be additive (Gooding et al. 2003) as it was in our experiment (Figure 3).
All stresses applied before the end of the linear phase of grain growth reduced final grain weight (Table 3, Figures 4 to 12). This reduction was considerable when drought stress occurred between days 1 and 20 after anthesis (Figures 4 to 12). Effect of drought stress between days 21 and 40 was approximately additive upon exposure to the stress condition (Figures 4 to 12). Reductions in the final grain weight were mostly attributable to an earlier end to the grain filling when stress was applied and day 40 occurred after the end of the linear phase of grain filling. All stresses imposed before the end of the linear phase of grain growth reduced final grain weight by 12.4, 19.1%, 4.3%, 16.7%, 2.6%, 6.6%, 11.7% and 16.1% for the genotypes No. 1, 2, 3, 4, 5, 6, 7 and 11, respectively (Table 3, Figures 4, 5, 6, 7, 8, 9, 10 and 14). This reduction was most marked when drought stress occurred between days 40 and 50 after anthesis. On the average, the effect of drought stress between days 11 and 40 was additive across genotypes.
In the genotypes No. 8 and 10, the period of lag and linear grain growth were from day 1 to 20 and from day 21 to 40, respectively. The linear grain growth in the genotypes No. 8 and 10 were more additive under drought stress than irrigated condition so that grain filling continued until the end of physiological maturity
and no reduction was observed in grain weight. In the genotype No. 9, the period from days 1-10 was lag period under both irrigated and drought condition. The linear grain growth was more additive under drought stress than irrigated conditions (Figure 11).
Grain filling rate was negatively and significantly correlated (r= -0.68) with the contribution of assimilates to developing kernels in the irrigated condition. Under irrigated and drought stress conditions, phenotypic correlations of grain filling rate with grain weight per spike (r= 0.87, r= 0.62) and grain number per spike (r= 0.71, r= 0.63) were significant. Furthermore, a significant positive correlation coefficient between grain filling rate and accumulation of dry matter at maturity (r=0.87) was observed in the irrigated environment. The observed values for effective grain filling period and grain filling rate suggested the compensation between these traits in both drought stress and irrigated plants. In fact, a significant negative phenotypic correlation was observed between these traits under irrigated and drought stress conditions (r =−0.73, r=-0.84, respectively). The same result was also reported by Goodong et al. (2003). Mobilization of dry matter from vegetative
organs to developing kernels was significantly
correlated with accumulation of post-anthesis
assimilate (r= -0.72), grain weight per spike (r=
-0.74), grain number per spike (r= -0.73) and
contribution of pre-anthesis assimilate to kernels
(r= 0.95) in the irrigated environment. However,
this character was only significantly correlated

Sanjari et al. 2011, 1(1): 75-92
86
Figure 3. Changes in grain weight of wheat genotypes under irrigated and drought stress conditions
Figure 4. Effective grain filling in the wheat genotype No. 1 under irrigated and drought stress conditions
Figure 5. Effective grain filling in the wheat genotype No. 2, under irrigated and drought stress
conditions
y = -0.0768x3 + 6.1587x2 - 91.382x + 899.14R2 = 0.9867
y = -0.0826x3 + 6.363x2 - 94.832x + 765.89R2 = 0.9919
0
500
1000
1500
2000
2500
0 10 20 30 40 50
Days aftre anthesis
Gra
n weigh
t (mg)
IrrWsPoly. (Irr)Poly. (Ws)
y = -0.1866x3 + 16.773x2 - 375.66x + 2882.4R2 = 0.9858
y = -0.1174x3 + 9.0444x2 - 145.59x + 1077.6R2 = 0.9998
0
500
1000
1500
2000
2500
3000
3500
0 10 20 30 40 50
Days after anthesis
Gra
in w
eigh
t (mg)
IrrWsPoly. (Irr)Poly. (Ws)
y = -0.0476x3 + 3.5642x2 - 19.62x + 477.08R2 = 0.9961
y = -0.0618x3 + 4.5302x2 - 45.686x + 587.04R2 = 0.9956
0
500
1000
1500
2000
2500
3000
0 10 20 30 40 50
Days after anthesis
Gra
in w
eigh
t (m
g)
IrrWsPoly. (Irr)Poly. (Ws)
Gra
nin
wei
ght (
mg)
G
rani
n w
eigh
t (m
g)
Gra
nin
wei
ght (
mg)
Days after anthesis
Days after anthesis
Days after anthesis
Gra
nin
wei
ght (
mg)

Grain Filling Rate and Duration in Bread Wheat…….. 87
y = -0.0792x3 + 6.8526x2 - 130.86x + 1313.8R2 = 0.9894
y = -0.0301x3 + 1.7622x2 + 22.151x - 144.05R2 = 0.925
0
500
1000
1500
2000
2500
0 10 20 30 40 50
Days after anthesis
Gra
in w
eigh
t (mg)
IrrWsPoly. (Irr)Poly. (Ws)
iFigure 6. Effective grain filling in the wheat genotype No. 3, under irrigated and drought stress conditions
Figure 7. Effective grain filling in the wheat genotype No. 4, under irrigated and drought stress conditions
Figure 8. Effective grain filling in the wheat genotype No. 5, under irrigated and drought stress conditions
y = -0.0846x3 + 6.9268x2 - 123.92x + 1182.6R2 = 0.9985
y = -0.0288x3 + 1.556x2 + 31.068x - 135.13R2 = 0.9879
0
400
800
1200
1600
2000
2400
0 10 20 30 40 50
Days after anthesis
Gra
in w
eigh
t (mg)
IrrWsPoly. (Irr)Poly. (Ws)
y = -0.0476x3 + 3.5642x2 - 19.62x + 477.08R2 = 0.9961
y = -0.0618x3 + 4.5302x2 - 45.686x + 587.04R2 = 0.9956
0
500
1000
1500
2000
2500
3000
0 10 20 30 40 50
Days after anthesis
Gra
in w
eigh
t (m
g)
IrrWsPoly. (Irr)Poly. (Ws)
Gra
nin
wei
ght (
mg)
G
rani
n w
eigh
t (m
g)
Days after anthesis
Days after anthesis
Days after anthesis
Gra
nin
wei
ght (
mg)

Sanjari et al. 2011, 1(1): 75-92
88
y = -0.0177x3 + 0.1691x2 + 92.168x - 569.15R2 = 0.9784
y = -0.0687x3 + 5.2807x2 - 62.284x + 346.54R2 = 0.9583
0
500
1000
1500
2000
2500
0 10 20 30 40 50
Days after anthesis
Gra
in w
eigh
t (m
g)
IrrWsPoly. (Irr)Poly. (Ws)
y = -0.0168x3 + 0.6862x2 + 50.046x - 155.65R2 = 0.9821
y = -0.0391x3 + 2.7253x2 - 11.071x + 207.82R2 = 0.9734
0
500
1000
1500
2000
2500
0 10 20 30 40 50
Days after anthesis
Gra
in w
eigh
t (m
g)
Irr
Ws
Poly. (Irr)
y = -0.0769x3 + 5.66x2 - 83.156x + 1013.2R2 = 0.9699
y = -0.1232x3 + 9.7407x2 - 176.06x + 1128.4R2 = 0.9915
0
400
800
1200
1600
2000
0 10 20 30 40 50
Days afte r anthe sis
Gra
in w
eigh
t (m
g)
IrrWsPoly. (Irr)Poly. (Ws)
Figure 9. Effective grain filling in the wheat genotype No. 6 under irrigated and drought stress conditions
Figure 10. Effective grain filling in the wheat genotype No. 7 under irrigated and drought stress conditions
Figure 11. Effective grain filling in the wheat genotype No. 8 under irrigated and drought stress conditions
Gra
nin
wei
ght (
mg)
G
rani
n w
eigh
t (m
g)
Gra
nin
wei
ght (
mg)
Days after anthesis
Days after anthesis
Days after anthesis

Grain Filling Rate and Duration in Bread Wheat…….. 89
y = 0.005x3 - 2.4551x2 + 172.68x - 1009.9R2 = 0.9641
y = -0.0663x3 + 4.5086x2 - 43.237x + 560.72R2 = 0.9908
0
500
1000
1500
2000
2500
3000
0 10 20 30 40 50
Days afte r anthe sis
Gra
in w
eigh
t (m
g)
Irr
Ws
Poly. (Irr)Poly. (Ws)
y = -0.1693x3 + 14.872x2 - 336.43x + 2881R2 = 0.9565
y = -0.0945x3 + 8.906x2 - 210.38x + 1925.5R2 = 0.954
0
500
1000
1500
2000
2500
3000
0 10 20 30 40 50
Days after anthesis
Gra
in w
eigh
t (m
g)
IrrWsPoly. (Irr)Poly. (Ws)
y = -0.1743x3 + 15.124x2 - 317.61x + 2086.5R2 = 0.9711
y = -0.1552x3 + 12.889x2 - 252.82x + 1586.8R2 = 0.9731
0
500
1000
1500
2000
2500
3000
0 10 20 30 40 50
Days after anthesis
Gra
in w
eigh
t (m
g)
IrrWsPoly. (Irr)Poly. (Ws)
Figure 12. Effective grain filling in the wheat genotype No. 9 under irrigated and drought stress conditions
Figure 13. Effective grain filling in the wheat genotype No. 10 under irrigated and drought stress conditions
Figure 14. Effective grain filling in the wheat genotype No. 11 under irrigated and drought stress conditions
Gra
nin
wei
ght (
mg)
G
rani
n w
eigh
t (m
g)
Gra
nin
wei
ght (
mg)
Days after anthesis
Days after anthesis
Days after anthesis

Sanjari et al. 2011, 1(1): 75-92
90
with the contribution of pre-anthesis assimilate
to kernels (r=0.87) and grain weight (r= 0.61)
under drought stress condition. Gavuzzi et al.
(1997) reported high correlation of grain yield
with the storage of non-structural carbohydrates in the drought condition.
Significant phenotypic correlation coefficients of effective grain filling period with grain weight (r= -0.70, r= -0.67), accumulation of pre-anthesis assimilates (r= -0.6, r= -0.76) and grain filling rate (r= -0.73, r= -0.84) were observed under irrigated and drought stress conditions, respectively. Effective grain filling period was also significantly correlated with accumulation of post-anthesis assimilates (r= -
0.79) and grain number per spike (r= 0.68) in in the drought stressed plants. In addition, a phenotypic correlation coefficient of 0.56 was found between grain number per spike and accumulation of pre- anthesis assimilates under drought stress condition. According to Fischer (1980), who reported the same results, the assimilate supply problem may be compounded by further reductions in photosynthesis due to water stress, so it was suggested that the reduction in seed number caused by stress at this critical period is proportional to the reduction in leaf area development and hence, in available assimilates during approximately 25 days before anthesis.
References Bidenger F, Musgrave RB and Fischer RA, 1977. Contribution of stored pre-anthesias assimilate to grain yield
in wheat and barley. Nature 270: 731-733. Blum A, Sinmena B, Mayer J, Golan G and Shpiler L, 1994. Stem reserve mobilization supports wheat-grain
filling under heat stress. Aust J Plant Physiol 21: 771-781. Bradford KJ and Hasio TC, 1982. Physiological responses to moderate water stress. In: Lange OL, Nobel PS,
Osmond CB and Ziegler H (Eds). Encyclopedia of Plant Physiology. New Series: Physiological Plant Ecology. II. Water Relations and Carbon Assimilation. Vol. 12B. Springer Berlin.
Bruckner PL and Frohberg RC, 1987. Rate and duration of grain fill in spring wheat. Crop Sci 27: 451–455. Cho DS, Jong SK, Son SY and Park YK, 1988. Studies on the duration and rate of grain filling in rice (Oryza
sativa L.). II. Difference between the parts of a panicle. Kor J Crop Sci 32: 5–11. Cross HZ, 1975. Diallel analysis of duration and rate of grain filling of seven inbred lines of corn. Crop Sci 15:
532–535. Cruz-Aguado JA, Rodes R, Perez IP and Dorado M, 2000. Morphological characteristics and yield components
associated with accumulation and loss of dry matter in internodes of wheat. Field Crops Res 66: 129-139. Ehdaie B, Alloush GA, Madore MA and Waines JG, 2006. Genotypic variation for stem reserves and
mobilization in wheat: I. Post-anthesis changes in internode dry matter. Crop Sci 46: 735-746. Ehdaie B and Waines JG, 1996. Genetic variation for contribution of pre-anthesis assimilates to grain yield in
spring wheat. J Genet Breed 50: 47-56. Fischer RA, 1980. Influence of water stress on crop yield in semi- arid regions. In: Kramer PJ and Turner NC
(Eds). Adaptations of Plants to Water and High Temperature Stress. John Wiley, New York, pp. 323-329. Flood RG, Martin PJ and Gardener WK, 1995. Dry matter accumulation and partitioning and its relationships to
grain yield in wheat. Aust J Exp Agric 35: 495-502.

Grain Filling Rate and Duration in Bread Wheat…….. 91
Gavuzzi P, Rizz M, Palumbo M, Campanile RG, Ricciardi GL and Borghi B, 1997. Evaluation of field and laboratory predictors of drought and heat tolerance in winter cereals. Can J Plant Sci 77: 523-532.
Gooding MJ, Ellis RH, Shewry PR and Schofield JD, 2003. Effects of restricted water availability and increased temperature on the grain filling, drying and quality of winter wheat. J Cereal Sci 37: 295-309.
Ho KM and Jui PY, 1989. Duration and rate of kernel filling in barley. Cer Res Comm 17: 69–76. Hunt LA, 1979. Stem weight changes during grain filling in wheat Triticum-Aestivum from diverse sources. In:
Ramanujam S (Ed). Proceedings of the 5th International Wheat Genetics Symposium. Vol. 1 and 2, Feb. 23-28, 1978. Indian Society of Genetics and Plant Breeding, New Delhi, India, pp. 923-929.
Knott DR and Gebeyehou G, 1987. Relationship between the lengths of the vegetative and grain filling periods and agronomic characters in three durum wheat crosses. Crop Sci 27: 857–860.
Nass HG and Reisser B, 1975. Grain filling period and grain yield relationship in spring wheat. Can J Plant Sci 55: 673–678.
Papakosa DK and Gagianas AA, 1991. Nitrogen and dry matter accumulation, remobilization and losses for Mediterranean wheat during grain filling. Agron J 83: 864-870.
Plaut Z, Butow BJ, Blumenthal CS and Wrigley CW, 2004. Transport of dry matter into developing wheat kernels and its contribution to grain yield under post-anthesis water deficit and evaluated temperature. Field Crops Res 86: 185-198.
Przulj N and Momellovie V, 2003. Dry matter and nitrogen accumulation and use in spring barley. Plant Soil Environ 49: 36-47.
Rawson HM and Evans LT, 1971. The contribution of stem reserve to grain development in a range of wheat cultivars of different height. Aust J Agric Res 22: 851- 863.
Royo C, Abaza M, Blanco R and Garcı´a del Moral LF, 2000. Triticale grain growth and morphometry as affected by drought stress, late sowing and simulated drought stress. Aust J Plant Physiol 27: 1051–1059.
Sanjari Pireivatlou A and Yazdansepas A, 2009. Genotypic variation of the trait stem reserves in bread wheat (Triticum aestivun L.) genotypes under post-anthesis drought stress condition. Iran J Field Crop Sci 39: 181-191 (In Persian with English abstract).
SAS Institute Inc. 1987. SAS/STAT™ Guide for Personal Computers, 6th ed. Cary, NC, 534 pp. Santiveri F, Royo C and Romagosa I, 2002. Patterns of grain filling of spring and winter hexaploid triticales.
Eur J Agron 16: 219–230. Shearman VJ, Sylvester-Bradley R and Foulkes MJP, 2005. Physiological processes associated with wheat yield
progress in the UK. Crop Sci 45: 175–185. Slafer GA, Calderini DF and Miralles DJ, 1996. Yield components and compensation in wheat: opportunities for
further increasing yield potential. In: Reynolds MP, Rajaram S and McNab A (Eds). Increasing Yield Potential in Wheat: Breaking the Barriers. CIMMYT, Mexico, DF, pp.101–133.
Slafer GA, Satorre EH and Andrade FH, 1994. Increases in grain yield in bread wheat from breeding and associated physiological changes. In: Slafer GA (Ed). Genetic Improvement of Field Crops. Marcel Dekker Inc., New York, pp. 1–68.
Steel RGD, Torrie JH and Dickey DA, 1997. Principles and Procedures of Statistic. 3rd ed. McGraw Hill, New York.

Sanjari et al. 2011, 1(1): 75-92
92
Van Herwaarden Af, Richards RA, Farquhar CD and Angus JF, 1998. ‘Haying off’, the negative grain yield response of dryland wheat to nitrogen fertilizer. III. The influence of water deficit and heat shock. Aust J Agric Res 49: 1095-1110.
Van Sanford DA, 1985. Variation in kernel growth characters among soft red winter wheats. Crop Sci 25: 626–630.
Varughese G, 1996. Triticale: present status and challenges ahead. In: Güedes–Pinto H, Darvey N and Carnide VP (Eds). Triticale: Today and Tomorrow. Kluwer Academic, Deventer, The Netherlands, pp. 13–20.
Wiegand CL and Cuellar JA, 1981. Duration of grain filling and kernel weight of wheat affected by temperature. Crop Sci 21: 95–101.
Wych, RD, McGraw RL and Stutham DD, 1982. Genotype × year interaction for length and rate of grain filling in oats. Crop Sci 22: 1025–1028.
Yoshida S, 1981. Fundamentals of Rice Crop Science. International Rice Research Institute, Los Banos, Philippines, pp. 59–60.

Vol. 1 No. 1 2011 ISSN: 2008-5168 Crop Physiology
1
K Ghassemi-Golezani, M Taifeh-Noori, S Oustan, M Moghaddam and S Seyyed Rahmani Physiological Performance of Soybean Cultivars Under Salinity Stress …………………….
9
M Zharfa, A Maghsoudi Moud and VR Saffari Relationships Between Seedling Growth Rate and Yield of Maize Cultivars Under Normal and Water Stress Conditions …………………………………………………………………
25
A Maghsoudi Moud and M Islami Water Stress Effect on Remobilization of Pre-Anthesis Stored Assimilates to Grains in Wheat …………………………………………………………………………………………
39
H Sadeghi and Y Emam Chemical Composition, Yield and Yield Components of Two Wheat Cultivars in Response to Salt Stress ………………………………………………………………………………….
Plant Genetics and Breeding
49 R Paknia and G Karimzadeh Karyotypic Study and Chromosome Evolution in Some Iranian Local Onion Populations…………
63
J Mosa Abadi, S Khavari Khorasani, B Syah Sar, S Movafeg and M Golbashy
Estimation of Combining Ability and Gene Effects in Forage Maize (Zea mays L.) Using Line × Tester Crosses ………………………………………………………………………...
75 A Sanjari Pireivatlou, RT Aliyev and B Sorkhilaleloo Grain Filling Rate and Duration in Bread Wheat Under Irrigated and Drought Stressed Conditions…