journal of power sources - university of surreyepubs.surrey.ac.uk/814151/1/importance of balancing...
TRANSCRIPT

lable at ScienceDirect
Journal of Power Sources xxx (2017) 1e9
Contents lists avai
Journal of Power Sources
journal homepage: www.elsevier .com/locate/ jpowsour
Importance of balancing membrane and electrode water in anionexchange membrane fuel cells
T.J. Omasta a, b, L. Wang c, X. Peng a, b, C.A. Lewis a, b, J.R. Varcoe c, W.E. Mustain a, b, *
a Department of Chemical & Biomolecular Engineering, University of Connecticut, Storrs, CT, 06269, USAb Center for Clean Energy Engineering, University of Connecticut, Storrs, CT, 06269, USAc Department of Chemistry, University of Surrey, Guildford, GU2 7XH, UK
h i g h l i g h t s
* Corresponding author. Department of ChemicalUniversity of Connecticut, Storrs, CT, 06269, USA.
E-mail address: [email protected] (W.E. M
http://dx.doi.org/10.1016/j.jpowsour.2017.05.0060378-7753/© 2017 The Authors. Published by Elsevie
Please cite this article in press as: T.J. Omas
g r a p h i c a l a b s t r a c t
� Very high power density achieved,1.4 W cm�2 at 60 �C.
� Water content and balance play sig-nificant role in AEMFC performance.
� Electrode and operational variableinvestigated.
� Anode and Cathode floodingobserved under certain conditions.
� High conductivity membranes enablerapid water back diffusion.
a r t i c l e i n f o
Article history:Received 25 March 2017Received in revised form29 April 2017Accepted 3 May 2017Available online xxx
Keywords:Anion exchange membrane fuel cellWaterHigh performanceElectrodeFlooding
a b s t r a c t
Anion exchange membrane fuel cells (AEMFCs) offer several potential advantages over proton exchangemembrane fuel cells (PEMFCs), most notably to overcome the cost barrier that has slowed the growthand large scale implementation of fuel cells for transportation. However, limitations in performance haveheld back AEMFCs, specifically in the areas of stability, carbonation, and maximum achievable currentand power densities. In order for AEMFCs to contend with PEMFCs for market viability, it is necessary torealize a competitive cell performance. This work demonstrates a new benchmark for a H2/O2 AEMFCwith a peak power density of 1.4 W cm�2 at 60 �C. This was accomplished by taking a more precise lookat balancing necessary membrane hydration while preventing electrode flooding, which somewhatsurprisingly can occur both at the anode and the cathode. Specifically, radiation-grafted ETFE-basedanion exchange membranes and anion exchange ionomer powder, functionalized with benchmarkbenzyltrimethylammonium groups, were utilized to examine the effects of the following parameters onAEMFC performance: feed gas flow rate, the use of hydrophobic vs. hydrophilic gas diffusion layers, andgas feed dew points.© 2017 The Authors. Published by Elsevier B.V. This is an open access article under the CC BY license
(http://creativecommons.org/licenses/by/4.0/).
1. Introduction
Anion exchange membrane fuel cells (AEMFCs) have
& Biomolecular Engineering,
ustain).
r B.V. This is an open access article
ta, et al., Journal of Power Sou
experienced a surge of interest in the past decade as a lower costalternative to proton exchange membrane fuel cells (PEMFCs)[1e3]. The increased pH in the alkaline AEMFC facilitates the use ofa wider range of non-precious metal catalysts at the cathode due tofavorable oxygen reduction reaction kinetics in alkaline vs. acidmedia [4,5]. Anion exchange membranes (AEMs) have alsodemonstrated a lower fuel permeability than proton exchange
under the CC BY license (http://creativecommons.org/licenses/by/4.0/).
rces (2017), http://dx.doi.org/10.1016/j.jpowsour.2017.05.006

T.J. Omasta et al. / Journal of Power Sources xxx (2017) 1e92
membranes when used in direct alcohol fuel cells [6]. Additionally,switching to AEMFCs enables the use of lower cost cell and stackcomponents because of increased materials stability in alkaline vs.acidic environment. Despite these significant advantages, PEMFCshave remained favored due to a sizable performance gap betweenthe two technologies [1,7e11]. Recently, this situation hasimproved [12e14], but the level of understanding on what factorsare important for improved performance is still limited. Therefore,further studies are required to fully understand the fundamentaland operational variables that limit AEMFC performance, and todevelop strategies that overcome these limitations.
One variable that has been mostly overlooked in the AEMFCliterature is the cell water content and balance. This is most likelybecause of the differences in the role of water in AEMFCs (Fig. 1A)vs. PEMFCs (Fig. 1B). In PEMFCs, water is only generated (at thecathode as a product of the oxygen reduction reaction, ORR) andnot electrochemically consumed, such that its major role is thehydration of polymer electrolyte components to facilitate Hþ con-duction. Water is also moved to the cathode from the anode byelectro-osmotic drag as Hþ produced by the hydrogen oxidationreaction (HOR) moves through the PEM. Thus, removing cathodewater is the prime concern in the PEMFC to avoid catastrophicelectrode flooding. Though it is possible at high current densities todry out the PEMFC anode, the high rate of water back diffusionthrough Nafion® (especially thin ca. 25 mm membranes) can natu-rally mitigate against this effect.
In the AEMFC, water is both electrochemically generated (at theanode from the HOR) and consumed (at the cathode by the ORR)during cell operation. Water is moved from the cathode to theanode by electro-osmotic drag (in the reverse direction of aPEMFC). There is a need in this system to provide adequatewater tomaintain AEM and electrode hydration, without flooding or dryingout the catalyst or gas diffusion layers [15]e both of which can limitthe achievable current and power densities of operating cells. Thechallenge faced is that the balance between proper membranehydration and flooded catalysts layers is thin, which can lead to lowperforming cells that are the result of undiagnosed water man-agement issues, not the cell components used (i.e. catalysts,membrane). At one extreme, excess water in the catalyst layers canlead to catastrophic flooding. At the other, it is becoming apparent
Fig. 1. Schematic comparison of water consumption, generation
Please cite this article in press as: T.J. Omasta, et al., Journal of Power So
that OH�-derived AEM degradation is most serious at low hydra-tion (typically at the cathode) [16].
The properties of specific AEMs influence not only primarywater behavior, i.e. number of molecules of H2O per stationarycation(þ) site (l), ion exchange capacity (IEC), and conductivity (s),but also secondary effects such as water back diffusion (anode tocathode). To avoid cathode dry-out and/or anode flooding inAEMFCs, it would be preferable for the AEM to have high waterback diffusion. However, many AEMs in the literature do not havethe same efficient phase separation as Nafion® and limited OH�
conductivity (Table 1), which translates directly to low water back-diffusion rates [15,17]. Therefore, engineering solutions have beenexplored in a number of studies, including running commercialsystems at very low current density [16], pressurizing the gasstreams, or even feeding condensedwater through the cathode [10]e none of which are tenable long-term solutions to high per-forming AEMFCs. Compared to many modern AEMs (Table 1),radiation-grafted ETFE-based AEMs have been reported to havehigh conductivity [13,18] and high water back diffusion rates[15,17], which may be utilized to alleviate the water gradient that isintrinsic to operating AEMFCs. However, high water back diffusionrisks the introduction of new variables to be considered, includingthe possibility for cathode flooding.
The aim of this work is to examine the influence of the electrodeand gas diffusion layers as well as the flow rate and dew points ofthe anode and cathode gases on AEMFC performance. ETFE-basedbenzyltrimethylammonium-functionalized radiation-grafted alka-line AEMs and anion exchange ionomers (AEIs) are investigated [9].In order to maximize cell performance, both hydrophobic and hy-drophilic gas diffusion layers are tested, which when coupled withmanipulation of the gas feed dew points (fromwater poor to waterrich conditions) allows for a better understanding of how tomaintain AEM and AEI hydration without flooding the catalystlayer.
2. Experimental
2.1. AEM synthesis and characterization
ETFE film (25 mm thickness) was supplied by Nowofol
, migration, and diffusion in AEMFCs (A) and PEMFCs (B).
urces (2017), http://dx.doi.org/10.1016/j.jpowsour.2017.05.006

Table 1Selected high peak power density and conductivity AEMs in the literature.
AEM Chemistry Peak Power DensityW cm�2
Cell Temp�C
A/C Dew Points�C
Back PressurekPag
Conductivity (OH�), s,mS cm�1
Ex-situ s Condition�C/RH
ETFE-g-VBCTMA [this work] 1.40 60 54/57 0 132 80/95%aQAPS [14,19] 1.00 60 60/60 100 108 80/100%LDPE-g-VBC [11] 0.82 60 70/- 0 100 60/100%A901 [10] 0.74 80 85/85 250 38 20/90%BPI (74.6% DOG) [20] 0.61 50 e 0 105 60/100%PF AEM Gen 1 [21] 0.43 60 60/60 e 55 23/100%MHT-PMBI [22] 0.37 60 60/60 0 23 30/95%T25NC6NC5N [23] 0.36 60 60/60 100 99 23/100%PVBTAC [24,25] 0.28 60 52/59 e 91 80/90%C-HPPES-4/1 [26] 0.08 80 80/80 e 77 30/100%
- not reported.
T.J. Omasta et al. / Journal of Power Sources xxx (2017) 1e9 3
Kunststoffprodukte GmbH (Germany). VBC monomer (mixture of3- and 4-isomers; 500e100 ppm tert-4-butylcatechol and700e1100 ppm nitromethane inhibitors) was supplied by Sigma-Aldrich and used without the removal of inhibitors. 1-Octyl-2-pyrrolidone and aqueous trimethylamine solution (TMA, 45 wt%)were also purchased from Sigma-Aldrich. Toluene and 2-propanolwere of reagent grade and supplied by Fisher Scientific. All chem-icals were used as received. The ultra-pure deionized (DI) waterused in this work had a resistivity of 18.2 MU cm.
The AEM was prepared from pre-formed ETFE films using theperoxidation (pre-irradiation in air) method previously reported[12]. The ETFE films were subjected to electron-beam irradiation inair to 30 kGy total absorbed dose (using a 4.5 MeV DynamatronContinuous Electron Beam Unit at Synergy Health, South Marston,UK). As the irradiation step is performed in air, immediate reactionof the radicals that are formed with O2 molecules leads to thecreation of peroxide and hydroperoxide groups on the polymers.The peroxidated ETFE films then act as a solid-state free-radicalinitiator for the subsequent graft polymerization step. After irra-diation, the films were transported back to the laboratory in dry icebefore they were stored in a freezer at �40 �C (the peroxide groupsare stable for around 6 months at this temperature [27]).
For the grafting step, the electron-beamed films (15 cm� 15 cm)were immersed in an aqueous dispersion of VBC (5%vol.) in sealedvessels along with addition of dispersant (1%vol. 1-octyl-2-pyrrolidone). The solutions were purged with N2 for 2 h beforethe vessel was sealed and heated at 70 �C. After the reaction period,the films were removed from the grafting mixture and washed intoluene; this process is employed to remove excess unreacted VBCand any poly(VBC) homopolymer (not bound to the ETFE basematerial) that may be present. The resulting intermediate ETFE-g-poly(VBC) films were subsequently dried at 70 �C for 5 h in a vac-uum oven to remove all traces of solvent. The gravimetric degree ofgrafting (DoG, %) of the intermediate membranes was calculatedusing Equation (1).
DoG ¼ mg �mi
mi� 100% (1)
wheremg is themass of the grafted sample andmi is the initial massof the pre-grafted irradiated films.
To quaternize, the intermediate films were then submerged inthe aqueous TMA solution at ambient temperature for 24 h, thenwashed in DI water, and finally heated in fresh DI water; this pro-cedure was adopted to remove any excess TMA from the resultingquaternized ETFE-g-poly(vinylbenzyltrimethylammonium) AEMs.Final conversion to the chloride-anion-form ETFE-g-poly(-VBTMAþCl�) AEMs was achieved by immersing the AEMs inaqueous NaCl (1 M) for 15 h with one change of NaCl solution
Please cite this article in press as: T.J. Omasta, et al., Journal of Power Sou
during this period to ensure complete ion-exchange. The resultingAEMs were then soaked in deionized water to remove any excessNaCl-derived co- and counter-ions. The final desired radiation-grafted AEM(Cl�) films were stored in water until required andwere not allowed to dry out at any point before subsequent mea-surements/experiments were conducted.
Table 2 summarizes the key properties of the AEM films used inthis study. Details on the standard methods to characterize theAEM, such as ion-exchange capacity (IEC), water uptake (WU),through plane swelling (TPS), and conductivity determinations, canbe found in our recent synthesis optimization study [12].
2.2. Anion-exchange ionomer (AEI) powder synthesis
The synthesis of the AEI powderwas reported previously [9] andis summarized here. ETFE powder (Z8820X, AGC Chemicals Europe)with a particle size of 20e30 mm was peroxidated in air using anelectron-beam with a total absorbed dose of 70 kGy. The resulting“activated” powder was then submerged in a solution containingVBC, 2-propanol, and Surfadone LP-100 (ISPcorp) with a volumeratio of 1.00:3.95:0.05. The mixture was purgedwith N2 for 2 h, andthen sealed and heated for 72 h at 60 �C. The powder was recoveredby filtration, washed with toluene, and dried at 50 �C under vac-uum, resulting in ETFE-g-poly(VBC) grafted powders.
The powder was quaternized by submersion in an aqueous TMAsolution (TMA, 50%wt. in water, Acros Organics) for 5 h at ambienttemperature. The resulting powder was washed 5 times with DIwater, and then heated in DI water for 18 h at 50 �C. After a furtherwater wash step (5 � DI water), the powder was dried for 5 d at40 �C under vacuum. The final resulting ETFE-g-poly(VBTMAþCl�)AEI powder (in the most chemically stable Cl� form), that was usedin all of the electrodes in this manuscript, possessed an IEC of1.24 ± 0.06 mmol g�1 (n ¼ 3).
2.3. Materials and gas diffusion electrode (GDE) preparation
First, the AEI powder was ground with a mortar and pestle for10 min to reduce the amount of aggregated particles. Next,100e150 mg of one of three carbon supported catalysts was addedto the AEI in a 20:80 (AEI:catalyst) mass ratio along with 1 mL DIwater: BASF C1-50 (50%wt. high purity Pt supported on Vulcan XC-72R carbon), Alfa Aesar HiSPEC 4000 (Pt, nominally 40%wt., sup-ported on Vulcan XC-72R carbon), or Alfa Aesar HiSPEC 10000 (Pt,nominally 40%wt., and Ru, nominally 20%wt., supported on VulcanXC-72R carbon). Each catalyst-AEI mixture was ground with amortar and pestle for 10 min, a length of time that was selectedbecause it invariably produced a visually and texturally homoge-nous slurry, suggesting that no AEI agglomerates remained. Then,2 mL of 2-propanol (Fisher Chemical Optima) was added to the
rces (2017), http://dx.doi.org/10.1016/j.jpowsour.2017.05.006

Table 2Summary of the key properties the AEM used in this study. Errors are sample standard deviations (repeat measurements on n ¼ 3 samples of the AEM).
AEM DoG (%) IECMmol g�1
WU (%) Tdrymm
ThydMm
TPS (%) s(Cl- 80 �C)
mS cm�1
RG-ETFE(30 kGy)-AEM 79 2.05 ± 0.05 67 ± 7 45 ± 2 60 ± 1 33 ± 4 63 ± 2
T.J. Omasta et al. / Journal of Power Sources xxx (2017) 1e94
mortar and ground for a further 5 min, after which the catalystslurry was completely transferred to a LDPE vial, and combinedwith an additional 7 mL of 2-propanol to produce a low viscosityink. Each ink was homogenized in an ambient temperature ultra-sonic bath (Fisher Scientific FS30H) for 60 min, during which timethe water in the ultrasonic bath was replaced three times to avoidoverheating.
The resulting catalyst inks were used to fabricate gas diffusionelectrodes (GDEs) by hand spraying onto a larger area gas diffusionlayer (GDL) with an Iwata Eclipse HP-CS using 15 psig N2 (AirgasUltra High Purity). The GDLs used were Toray TGP-H-060 witheither 5% PTFE wetproofing or 0% PTFE wetproofing by weight.5 cm2 GDEs were then cut from the larger sprayed electrode for usein the cell hardware. Generally, the target total metal loading of theresulting GDEs was 0.6 ± 0.1 mgmetal cm�2, and the actual catalystloading for each data set will be given in the text and/or figurecaptions.
2.4. MEA assembly and single-cell AEMFC testing
Prior to MEA and fuel cell assembly, the GDEs and AEMs wereseparately immersed in aqueous KOH (1 M, Fisher Chemical, pel-lets/certified ACS) for 60 min, replacing the solution every 20 minto ensure complete ion-exchange. During this hydration and ion-exchange process, no substantial electrocatalyst or AEI particleswere observed to wash off the GDE surface, showing adequateadhesion of the catalyst layers onto the GDLs. Excess aqueous KOHandwater were removed from the electrodes andmembranewith alaboratory cloth prior to assembly. Each set of GDEs and AEM werepressed together in-cell to form the membrane electrode assembly(MEA) with no prior hot pressing. The MEAs were secured in 5 cm2
Fuel Cell Technologies hardware between two single pass serpen-tine flow graphite plates using 6 mil (150 mm) PTFE gaskets with20% pinch (5.1 N m torque). An 850E Scribner Fuel Cell Test Stationwas used for all testing. H2 and O2 gas feeds were supplied to theanode and cathode, respectively, at various flow rates and dewpoints without backepressurization (ca. 1 atm absolute).Throughout this manuscript, the dew points of the supplied gaseswill be identified in an Anode/Cathode format with the dew pointsreported in �C, e.g. 57/55 would correspond to an anode dew pointof 57 �C and a cathode dew point of 55 �C. The cell temperature washeld constant at 60 �C ± 0.5 �C for a majority of the experiments. Inthe cases where cell temperatures other than 60 �C were used, thereported format will be Anode/Cathode/Cell in �C, i.e. 69.5/69.5/70for a cell operating at 70 �C with symmetric feed gas dew pointsslightly below saturation. The temperature of the heated gas followlines between the fuel cell test stand and the cell were maintainedat 5 �C above the respective gas dew points.
All of the polarization curves shown were collected underpotentiometric control at a scan rate of 10 mV s�1 in order to bettertease out flooding issues under water starved and flooded condi-tions. When the water management issues were well controlled,there was not a significant difference between point by point andlinear sweep polarization curves, which is shown in Fig. S1 for thehighest performing cells. Additionally, tests were repeated aftermultiple hours and varying the testing conditions to ensure sta-bility, recoverability, and repeatability.
Please cite this article in press as: T.J. Omasta, et al., Journal of Power So
3. Results and discussion
3.1. Cell operation and response during start-up/break-in
The typical startup procedure for AEMFCs is simple and com-parable to PEMFCs [8,28,29], where a constant cell dischargevoltage is controlled for a set time [12,30]. In AEMFCs, the startupprocedure does two things: (1) similar to PEMFCs, hydration andformation of ion transport domains throughout the membrane;and (2) allows for the purging of (bi)carbonate (CO3
2� and HCO3�)
ions from the MEA (formed on exposure of the OH�-exchangedMEA components to CO2 in the air on transfer to the fuel cell testfixture). The latter activation process lowers the ohmic resistance ofthe cell by ensuring the anion transport is predominantly OH� [31].To control the charge mobility and (bi)carbonate removal (inde-pendently to some extent), this work employs a two-stage break-inprocedure, starting at a “low strain” with a voltage hold at 0.5 V,followed by a more aggressive, brief voltage hold at 0.2 V. Theseparation of these two steps is intended to maximize membraneperformance by avoiding the use of a long duration, high currentstress that could accelerate membrane degradation [16,30,32].
During the first break-in stage at 0.5 V, a cell will typically showa steady current increase over time until a preliminary plateau isreached (typically after 40e60 min). At this point, the cell is movedto the second break-in stage at 0.2 V. Under control at 0.2 V, the cellwill undergo a further increase in current as (bi)carbonate anionsare removed, along with additional water being driven through theAEM by electroosmotic drag. As the (bi)carbonate anions arepurged from the AEM, they are expelled as CO2 in the anodeexhaust as (bi)carbonate participates in the HOR [33].
At full gas humidity, i.e. 60/60, the transition from 0.5 V to 0.2 Vcan be problematic as the increase in current disrupts the waterbalance, resulting in an instability in the voltage and current out-puts of the cell. A more subtle example of this issue can be observedin Fig. 2A where the voltage and current are unstable for the first2.5 min of the second (0.2 V) break-in stage. The current increasessignificantly during this voltage instability, from 1.3 to 1.8 A cm�2.After the voltage stabilizes, the current further increases and peaksat 2.1 A cm�2 before starting to decline. The increase in cell currentto 2.1 A cm�2 coupled with the change in cell potential facilitatesthe “self-purging” phenomena that is known to occur through anincreased generation of OH� at the cathode and flux of OH� ions tothe anode [1,31,34]. The (bi)carbonate self-purging during startupwas observed by passing the anode effluent through a non-dispersive infrared CO2 detector (PP Systems SBA-5). While someCO2 is detected when the cell is held at 0.5 V, a significant amountof CO2 elutes when the cell is polarized to 0.2 V, as expected. Thesespikes in the effluent CO2 correspond to the self-purging of (bi)carbonates associated with the covalently-bound cations on theAEM and AEI polymeric chains and in the accompanying waterphase (ion displacement and a shift in OH�/(bi)carbonateequilibrium).
Fig. 2B depicts a startup with more significant water manage-ment challenges: the current increase is low during the initial 0.5 Vhold, and the cell is extremely unstable when the polarization isincreased to 0.2 V, which results in a complete cell “crash”. Thiserratic behavior is awell-known characteristic of electrode flooding
urces (2017), http://dx.doi.org/10.1016/j.jpowsour.2017.05.006
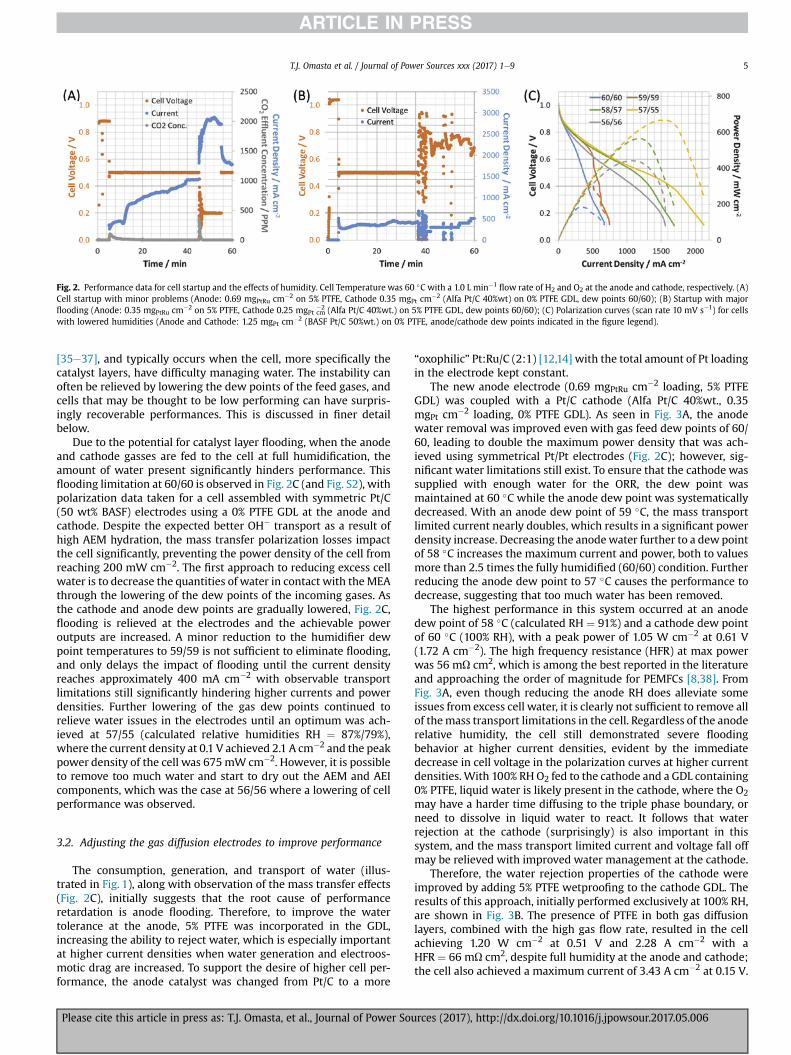
Fig. 2. Performance data for cell startup and the effects of humidity. Cell Temperature was 60 �C with a 1.0 L min�1flow rate of H2 and O2 at the anode and cathode, respectively. (A)
Cell startup with minor problems (Anode: 0.69 mgPtRu cm�2 on 5% PTFE, Cathode 0.35 mgPt cm�2 (Alfa Pt/C 40%wt) on 0% PTFE GDL, dew points 60/60); (B) Startup with majorflooding (Anode: 0.35 mgPtRu cm�2 on 5% PTFE, Cathode 0.25 mgPt cm
�2 (Alfa Pt/C 40%wt.) on 5% PTFE GDL, dew points 60/60); (C) Polarization curves (scan rate 10 mV s�1) for cellswith lowered humidities (Anode and Cathode: 1.25 mgPt cm�2 (BASF Pt/C 50%wt.) on 0% PTFE, anode/cathode dew points indicated in the figure legend).
T.J. Omasta et al. / Journal of Power Sources xxx (2017) 1e9 5
[35e37], and typically occurs when the cell, more specifically thecatalyst layers, have difficulty managing water. The instability canoften be relieved by lowering the dew points of the feed gases, andcells that may be thought to be low performing can have surpris-ingly recoverable performances. This is discussed in finer detailbelow.
Due to the potential for catalyst layer flooding, when the anodeand cathode gasses are fed to the cell at full humidification, theamount of water present significantly hinders performance. Thisflooding limitation at 60/60 is observed in Fig. 2C (and Fig. S2), withpolarization data taken for a cell assembled with symmetric Pt/C(50 wt% BASF) electrodes using a 0% PTFE GDL at the anode andcathode. Despite the expected better OH� transport as a result ofhigh AEM hydration, the mass transfer polarization losses impactthe cell significantly, preventing the power density of the cell fromreaching 200 mW cm�2. The first approach to reducing excess cellwater is to decrease the quantities of water in contact with theMEAthrough the lowering of the dew points of the incoming gases. Asthe cathode and anode dew points are gradually lowered, Fig. 2C,flooding is relieved at the electrodes and the achievable poweroutputs are increased. A minor reduction to the humidifier dewpoint temperatures to 59/59 is not sufficient to eliminate flooding,and only delays the impact of flooding until the current densityreaches approximately 400 mA cm�2 with observable transportlimitations still significantly hindering higher currents and powerdensities. Further lowering of the gas dew points continued torelieve water issues in the electrodes until an optimum was ach-ieved at 57/55 (calculated relative humidities RH ¼ 87%/79%),where the current density at 0.1 V achieved 2.1 A cm�2 and the peakpower density of the cell was 675mW cm�2. However, it is possibleto remove too much water and start to dry out the AEM and AEIcomponents, which was the case at 56/56 where a lowering of cellperformance was observed.
3.2. Adjusting the gas diffusion electrodes to improve performance
The consumption, generation, and transport of water (illus-trated in Fig. 1), along with observation of the mass transfer effects(Fig. 2C), initially suggests that the root cause of performanceretardation is anode flooding. Therefore, to improve the watertolerance at the anode, 5% PTFE was incorporated in the GDL,increasing the ability to reject water, which is especially importantat higher current densities when water generation and electroos-motic drag are increased. To support the desire of higher cell per-formance, the anode catalyst was changed from Pt/C to a more
Please cite this article in press as: T.J. Omasta, et al., Journal of Power Sou
“oxophilic” Pt:Ru/C (2:1) [12,14] with the total amount of Pt loadingin the electrode kept constant.
The new anode electrode (0.69 mgPtRu cm�2 loading, 5% PTFEGDL) was coupled with a Pt/C cathode (Alfa Pt/C 40%wt., 0.35mgPt cm�2 loading, 0% PTFE GDL). As seen in Fig. 3A, the anodewater removal was improved even with gas feed dew points of 60/60, leading to double the maximum power density that was ach-ieved using symmetrical Pt/Pt electrodes (Fig. 2C); however, sig-nificant water limitations still exist. To ensure that the cathode wassupplied with enough water for the ORR, the dew point wasmaintained at 60 �C while the anode dew point was systematicallydecreased. With an anode dew point of 59 �C, the mass transportlimited current nearly doubles, which results in a significant powerdensity increase. Decreasing the anodewater further to a dew pointof 58 �C increases the maximum current and power, both to valuesmore than 2.5 times the fully humidified (60/60) condition. Furtherreducing the anode dew point to 57 �C causes the performance todecrease, suggesting that too much water has been removed.
The highest performance in this system occurred at an anodedew point of 58 �C (calculated RH ¼ 91%) and a cathode dew pointof 60 �C (100% RH), with a peak power of 1.05 W cm�2 at 0.61 V(1.72 A cm�2). The high frequency resistance (HFR) at max powerwas 56 mU cm2, which is among the best reported in the literatureand approaching the order of magnitude for PEMFCs [8,38]. FromFig. 3A, even though reducing the anode RH does alleviate someissues from excess cell water, it is clearly not sufficient to remove allof themass transport limitations in the cell. Regardless of the anoderelative humidity, the cell still demonstrated severe floodingbehavior at higher current densities, evident by the immediatedecrease in cell voltage in the polarization curves at higher currentdensities. With 100% RHO2 fed to the cathode and a GDL containing0% PTFE, liquid water is likely present in the cathode, where the O2may have a harder time diffusing to the triple phase boundary, orneed to dissolve in liquid water to react. It follows that waterrejection at the cathode (surprisingly) is also important in thissystem, and the mass transport limited current and voltage fall offmay be relieved with improved water management at the cathode.
Therefore, the water rejection properties of the cathode wereimproved by adding 5% PTFE wetproofing to the cathode GDL. Theresults of this approach, initially performed exclusively at 100% RH,are shown in Fig. 3B. The presence of PTFE in both gas diffusionlayers, combined with the high gas flow rate, resulted in the cellachieving 1.20 W cm�2 at 0.51 V and 2.28 A cm�2 with aHFR ¼ 66 mU cm2, despite full humidity at the anode and cathode;the cell also achieved a maximum current of 3.43 A cm�2 at 0.15 V.
rces (2017), http://dx.doi.org/10.1016/j.jpowsour.2017.05.006

Fig. 3. Performance data AEMFCs during electrode optimization. Cell Temperature was 60 �C with a 1.0 L min�1flow rates of H2 and O2 at the anode and cathode, respectively. (A)
Incorporation of Pt/Ru catalyst and 5% PTFE GDL in anode (anode: 0.69 mgPtRu cm�2 on 5% PTFE, cathode 0.35 mgPt cm�2 (Alfa Pt/C 40%wt.) on 0% PTFE GDL, anode/cathode dewpoints indicated in the legend; (B) Addition of 5% PTFE to cathode GDL: 60/60 anode/cathode dew points (anode: 0.6 mgPtRu cm�2 on 5% PTFE, cathode 0.4 mgPt cm�2 (Alfa Pt/C 40%wt.) on 5% PTFE GDL), and 54/57 anode cathode dew points (anode: 0.67 mgPtRu cm�2 on 5% PTFE, cathode 0.53 mgPt cm�2 (Alfa Pt/C 40%wt.) on 5% PTFE GDL).
T.J. Omasta et al. / Journal of Power Sources xxx (2017) 1e96
However, even though improved water rejection eliminated thecatastrophic water limitations, it can be observed in the forwardand backward scan of the 60/60 experiment from Fig. 3B (Fig. S3)that the water problem is not completely solved, and more changesare needed to optimize performance. The return scan achieves a20% higher maximum power density, expected to be caused byfurther relief of catalyst layer water when H2O consumption andtransport is increased at higher currents.
Therefore, the dew points for the electrode configuration inFig. 3B are then optimized to 54/57 �C (calculated RHs ¼ 75%/85%),leading to a power density of 1.4 W cm�2 at 0.55 V and 2.57 A cm�2
(HFR¼ 50mU cm2). This AEMFC is the highest performing reportedin the literature to date (Table 1). The lower anode dewpoint clearlyavoided flooding even at current densities nearing 4.0 A cm�2.Additionally, the lower cathode dew point provided flooding reliefwithout dry-out, supporting the back-diffusion hydration mecha-nism proposed in this study. IR-correction of the optimized con-dition results in an IR-free peak power of 1.8 W cm�2, which showsthe potential for peak power gains with tuned ionomer:carbonratios, catalyst loadings, catalyst layer fabrication and porositythrough optimized ink preparation methods, carefully controlledRHs, and the use of thinner AEMs. The concept of increased watermass transport away from the anode with thinner AEMs wasrecently explored using a pore-filled AEMs and a poly(vinylbenzyltrimethylammonium) ionomer, with some success [25], though theelectrodes reported in this prior work flooded significantly even atlow current densities (ca. 800 mA/cm2). This again highlights theneed for considerable additional experimental and theoreticalwork in AEMFC electrode engineering.
Overall, the cells that are reported in this work highlight theperformances that can be achieved inwater balanced AEMFCs, withcatalyst layers capable of appropriate water rejection resulting indesirable AEM hydration, strong OH� anion transport, and miti-gation of catalyst layer flooding. This performance characteristic,avoiding cathode dry out even at high current density and reducedRH feeds, may be different than observed with AEMFCs containingother materials because of the novelty of the electrode fabricationmethod used in this work as well as the use of the powder AEI andhigh ionic conductivity of the ETFE-based AEM used in this study;thewatermobility and resulting water back diffusion are, therefore,significantly enhanced [15,17], leading to balanced anode andcathode water with avoidance of anode flooding and cathode dryout. Fig. 4 shows a qualitative comparison of the electrode/mem-branewater contentwhen back diffusion is able to play a significant
Please cite this article in press as: T.J. Omasta, et al., Journal of Power So
role in the movement and balancing of water (illustrating the keyideas of this work). There is an ideal gas feed humidity where thewater at the cathode is maintained and the AEM is properly hu-midified, despite potentially running the AEMs with gas feedsbelow 100% RH.
3.3. Influence of H2 and O2 gas flow rate
In addition to wetproofing the electrodes, the feed gas flow ratecan be used to elucidate water issues in operating fuel cells. Bycomparing different gas feed flow rates at the anode and cathodeusing 0% PTFE GDLs, the water removal rate was investigated.Fig. 5A shows the effect of a symmetrical 25% decrease in anode andcathode feed gas flow rates (both decreased from 1.0 L min�1 to0.75 L min�1). When the flow rate is decreased with cell dew pointsoptimized at 57/55 and the AEMFC being discharged at 0.5 V (t¼ 0),the current rapidly drops from 1250 mA cm�2 to approximately500 mA cm�2. With a 0.5 V discharge hold and 0.75 L min�1, thecurrent response exhibits a highly variable saw tooth pattern,which is typical of catalyst layer flooding.
A comparison of the cell performance at the two flow rates canbe observed in Fig. 5B where the higher flow rate relieves theflooding limitation and is able to generate 2.5 � greater power andcurrent densities. The polarization curves were taken after equili-bration at each flow rate for 60 min under otherwise identicalconditions. The lower flow rate demonstrates a significant masstransfer limitation that initiates very early in the polarization curve(0.8 V and 300 mA cm�2). This effect cannot be accounted for by asimple reduction in the reaction rate because of gaseous reactantconsumption, as theminimum stoichiometric ratio of feed gasses at1.0 L min�1 are 15 and 30 � reactant consumption for pure H2 andO2 respectively.
Further testing with cathode oxygen vs. cathode air (CO2-free) isshown in Fig. 5C and D, respectively. This data lends support to theidea that higher flow rates lead to improved water removal, as thevolumetric flow rates remain the same in both cases, but thecathode supplied with air has only 21% the partial pressure of O2 inthe catalyst layer. The polarization data shows that the volumetricflow rate of the cathode gas is the most important aspect of theneed for a high flow rate, as opposed to the specific amount of O2provided to the inlet. Lowering the reactant supply by a factor of 5has minimal effect on performance (reduction in peak power ofonly 10%), while lowering the volumetric flow rate of the gas feedby a quarter significantly lowers the peak power (by 60%). This
urces (2017), http://dx.doi.org/10.1016/j.jpowsour.2017.05.006

Fig. 4. Schematic showing the hypothesized distribution of water across the AEM and electrodes in an AEMFC, containing a high conductivity AEM with high water back diffusion,with increasing gas stream relative humidity.
Fig. 5. Performance data for a study on varying gas flow rates and oxidant makeup (Anode and Cathode: 1.25 mgPt cm�2 (BASF 50%wt.) on a 0% PTFE GDL, with anode/cathode dewpoints ¼ 57/55 �C). (A) Current response at 0.5 V H2/O2 AEMFC discharge with a decrease in gas flow rates from 1.00 to 0.75 L min�1 at t ¼ 0; (B) H2/O2 AEMFC polarization curveswith these two flow rates; (C) H2/O2 AEMFC polarization curves with 1.0 L min�1
flow rates with and without IR-correction; (D) Polarization curve with 1.0 L min�1 H2 and CO2-free-air.
T.J. Omasta et al. / Journal of Power Sources xxx (2017) 1e9 7
Please cite this article in press as: T.J. Omasta, et al., Journal of Power Sources (2017), http://dx.doi.org/10.1016/j.jpowsour.2017.05.006

Fig. 6. Polarization curves for AEMFCs with catalyst layer optimization (Anode: 0.35 mgPtRu cm�2 on 5% PTFE, GDL Cathode 0.25 mgPt cm�2 (Alfa 40%wt.) on 5% PTFE GDL): (A)Modifying anode dew point (cell T ¼ 60 �C); (B) Modifying cathode dew point (cell T ¼ 60 �C); (C) Optimizing both dew points (cell T ¼ 60 �C); (D) Cell T and humidity increase.Legend labels ¼ anode dew point/cathode dew point (panel AeC) or anode dew point/cathode dew point/cell (panel D).
T.J. Omasta et al. / Journal of Power Sources xxx (2017) 1e98
demonstrates the impact of water rejection in the electrodes andthe importance of this to the overall cell performance.
The cell is further tested with the anode flow rate reduced to0.2 L min�1 to match the molar flow rate of oxygen supplied to thecell under air operation (Fig. S4). Lowering the H2 flow rate onlydecreases the performance slightly and does not show the samecatastrophic effect seen when lowering the cathode flow rate.When the cathode stream is switched back to O2 but with a flowrate of only 0.2 L min�1, the cell is unable to hold a current at 0.5 Vand “crashed” immediately. These results support the importanceof water removal at the cathode.
Aworking hypothesis for the sudden and severe influence of theflow rate is now discussed. With a flow rate of 1.0 L min�1, theaverage gas velocity in the single pass serpentine channel isextremely high at 21 mm s�1, and this leads to a pressure dropalong the flow path that results in a substantial pressure gradientbetween passes of the serpentine flow field. This causes the gas to“jump the bar”where a portion of the gas flow preferentially passesthrough the gas diffusion layer and the catalyst layer, avoiding theaccumulation of liquid water. With the lower flow rate, the watercan collect in the catalyst layer and GDL, resulting in flooding andpreventing adequate O2 supply to the triple phase boundary.Therefore, other flow designs may increase the “jumping the bar”effect, yielding the positive effect of water removal from the cata-lyst layers at higher current densities and lower flow rates. This willbe the subject of a future study.
3.4. Reducing the catalyst loading
To realize the potential of AEMFCs from a cost perspective, it will
Please cite this article in press as: T.J. Omasta, et al., Journal of Power So
be necessary to lower (and ultimately eliminate) the platinumgroup metal (PGM) loadings in the catalyst layers. Therefore, thetotal catalyst loading was reduced by approximately half, with ananode loading of 0.35 mgPtRu cm�2 and a cathode loading of 0.25mgPt cm�2 (Alfa, Pt/C, 40 wt %.). Both electrodes were fabricatedwith 5% PTFE in the GDL. Despite using the three advances dis-cussed - a high flow rate, lower relative humidity, and hydrophobicGDL - the cell experienced water mass transport limitations at alltested dew points (Fig. 6AeC). This is likely due to the thickness ofthe electrode, where thinner layers lower the water “capacity” ofthe catalyst layer, or the ability to absorb and transport excesswater away from the catalyst during flooding conditions as well asprovide water in the case of local dry-out. At full humidity, the cellis unable to sustain a current above 500 mA cm�2, where the onlydifference from the maximum performing cell in this study(1.4 W cm�2 and operation approaching A cm�2) is the thinnercatalyst layer. Even under galvanostatic control, the cell crashedand was unable to maintain steady performance at full humidifi-cation (Fig. 2B).
One possible way to combat the lower water capacity andinability of the thinner layer to reject water is to increase the celltemperature. The influence of higher operating temperature wasinvestigated using the same cell configuration as Fig. 6AeC, butwith an increased cell temperature of 70 �C with the setting of bothhumidifiers to a temperature of 69.5 �C (calculated RH ¼ 97.9%). Acomparison between 70 �C and the best performing 60 �C test withthe same cell configuration can be seen in Fig. 6D. Even at 98% RH,the increased temperature mitigates the water issues in the cellthat were present at 60 �C. This is likely due to the presence of moreabsolute water content in the vapor phase, along with an increased
urces (2017), http://dx.doi.org/10.1016/j.jpowsour.2017.05.006

T.J. Omasta et al. / Journal of Power Sources xxx (2017) 1e9 9
ability for the gas flow to accept and discharge water. The increasedwater management ability shows that higher temperature may beable to alleviate the catalyst layer and GDL flooding while main-taining high levels of hydration for the AEM. This represents apromising avenue for the future application of AEMFCs, althoughmoreworkmust be done in the polymer community to createmorechemically and mechanically robust AEMs with high ionic con-ductivities at temperatures >60 �C.
4. Conclusions
In this work, it was shown that the amount and balance of wateris important in order to achieve high performing anion exchangemembrane fuel cells (AEMFC). Cell performance can be systemati-cally increased by tuning the cell water to optimize the dynamic(and sometimes delicate) balance between membrane hydrationand electrode flooding/dry-out. It was observed that a number ofAEMFC operation conditions can even lead to the flooding of theAEMFC cathode. There are several possible variables that can becontrolled to actively manipulate the cell water: gas feed dewpoints, catalyst layer hydrophobicity, anode and cathode gas flowrates, flow channel design, catalyst layer engineering, and thephysicochemical properties of the anion exchange membrane andionomers. Additionally, operating at higher temperature increasesthe amount of absolute water in the vapor phase, and likely thewater buffering capacity. Future work by our teams will investigatethe influence of ionomer:carbon ratio, ionomer ion-exchange ca-pacity and chemistry, electrode fabrication technique, catalystloading, and catalyst layer porosity on the AEMFC performance.
Acknowledgments
The authors gratefully acknowledge the financial support of theUS DOE Early Career Program (Award Number DE-SC0010531) forthe effort expended by T.J.O., X.P., and W.E.M. to perform this workas well as equipment and supplies. W.E.M. would also like to thankthe U.S.-U.K. Fulbright commission, which funded his FulbrightScholar Fellowship at the University of Surrey in 2016. The mate-rials development efforts by the University Surrey team were fun-ded by the UK's Engineering and Physical Sciences Research Council(EPSRC grants EP/M014371/1, EP/M005933/1, and EP/I004882/1).
Appendix A. Supplementary data
Supplementary data related to this article can be found at http://dx.doi.org/10.1016/j.jpowsour.2017.05.006.
References
[1] J.R. Varcoe, P. Atanassov, D.R. Dekel, A.M. Herring, M.A. Hickner, P.A. Kohl,A.R. Kucernak, W.E. Mustain, K. Nijmeijer, K. Scott, T. Xu, L. Zhuang, EnergyEnviron. Sci. 7 (2014) 3135e3191.
[2] Z. Yang, J. Ran, B. Wu, L. Wu, T. Xu, Curr. Opin. Chem. Eng. 12 (2016) 22e30.[3] M.A. Hickner, A.M. Herring, E.B. Coughlin, J. Polym. Sci. Part B Polym. Phys. 51
Please cite this article in press as: T.J. Omasta, et al., Journal of Power Sou
(2013) 1727e1735.[4] S.D. Poynton, J.P. Kizewski, R.C.T. Slade, J.R. Varcoe, Solid State Ion. 181 (2010)
219e222.[5] S. Lu, J. Pan, A. Huang, L. Zhuang, J. Lu, Proc. Natl. Acad. Sci. U.S.A. 105 (2008)
20611e20614.[6] J.R. Varcoe, R.C.T. Slade, E.L.H. Yee, S.D. Poynton, D.J. Driscoll, J. Power Sources
173 (2007) 194e199.[7] H.A. Gasteiger, S.S. Kocha, B. Sompalli, F.T. Wagner, Appl. Catal. B 56 (2005)
9e35.[8] X. Peng, T. Omasta, W. Rigdon, W.E. Mustain, J. Electrochem. Soc. 163 (2016)
E407eE413.[9] S.D. Poynton, R.C.T. Slade, T.J. Omasta, W.E. Mustain, R. Escudero-Cid, P. Oc�on,
J.R. Varcoe, J. Mater. Chem. A 2 (2014) 5124e5130.[10] R.B. Kaspar, M.P. Letterio, J.A. Wittkopf, K. Gong, S. Gu, Y. Yan, J. Electrochem.
Soc. 162 (2015) F483eF488.[11] M. Mamlouk, J. Horsfall, C. Williams, K. Scott, Int. J. Hydrogen Energy 37
(2012) 11912e11920.[12] L.Q. Wang, E. Magliocca, E.L. Cunningham, W.E. Mustain, S.D. Poynton,
R. Escudero-Cid, M.M. Nasef, J. Ponce-Gonz�alez, R. Bance-Souahli, R.C.T. Slade,D.K. Whelligan, J.R. Varcoe, Green Chem. 19 (2017) 831e843.
[13] J. Ponce-Gonz�alez, D.K. Whelligan, L. Wang, R. Bance-Soualhi, Y. Wang,Y. Peng, H. Peng, D.C. Apperley, H.N. Sarode, T.P. Pandey, A.G. Divekar,S. Seifert, A.M. Herring, L. Zhuang, J.R. Varcoe, Energy Environ. Sci. 9 (2016)3724e3735.
[14] Y. Wang, G. Wang, G. Li, B. Huang, J. Pan, Q. Liu, J. Han, L. Xiao, J. Lu, L. Zhuang,Energy Environ. Sci. 8 (2015) 177e181.
[15] T.D. Myles, A.M. Kiss, K.N. Grew, A.A. Peracchio, G.J. Nelson, W.K. Chiu,J. Electrochem. Soc. 158 (2011) B790eB796.
[16] D.R. Dekel, Performance of anion exchange membrane fuel cells: a review, in:Workshop on Ion Exchange Membranes for Energy Applications e EMEA2015,2015.
[17] A.M. Kiss, T.D. Myles, K.N. Grew, A.A. Peracchio, G.J. Nelson, W.K. Chiu,J. Electrochem. Soc. 160 (2013) F994eF999.
[18] T.P. Pandey, A.M. Maes, H.N. Sarode, B.D. Peters, S. Lavina, K. Vezzu, Y. Yang,S.D. Poynton, J.R. Varcoe, S. Seifert, M.W. Liberatore, V. Di Noto, A.M. Herring,Phys. Chem. Chem. Phys. 17 (2015) 4367e4378.
[19] C. Chen, J. Pan, J. Han, Y. Wang, L. Zhu, M.A. Hickner, L. Zhuang, J. Mater. Chem.A 4 (2016) 4071e4081.
[20] R. Espiritu, M. Mamlouk, K. Scott, Int. J. Hydrogen Energy 41 (2016)1120e1133.
[21] B.S. Pivovar, Advanced Ionomers & MEAs for Alkaline Membrane Fuel Cells,in: DOE Hydrogen and Fuel Cells Program Review, 2016.
[22] A.G. Wright, J. Fan, B. Britton, T. Weissbach, H. Lee, E.A. Kitching, T.J. Peckham,S. Holdcroft, Energy Environ. Sci. 9 (2016) 2130e2142.
[23] L. Zhu, J. Pan, Y. Wang, J. Han, L. Zhuang, M.A. Hickner, Macromolecules 49(2016) 815e824.
[24] G.S. Sailaja, S. Miyanishi, T. Yamaguchi, Polym. Chem. 6 (2015) 7964e7973.[25] Y. Oshiba, J. Hiura, Y. Suzuki, T. Yamaguchi, J. Power Sources 345 (2017)
221e226.[26] A.N. Lai, D. Guo, C.X. Lin, Q.G. Zhang, A.M. Zhu, M.L. Ye, Q.L. Liu, J. Power
Sources 327 (2016) 56e66.[27] J.P. Kizewski, N.H. Mudri, J.R. Varcoe, Radiat. Phys. Chem. 89 (2013) 64e69.[28] D. Ramaker, A. Korovina, V. Croze, J. Melke, C. Roth, Phys. Chem. Chem. Phys.
16 (2014) 13645e13653.[29] S. Sun, F. Jaouen, J. Dodelet, Adv. Mater. 20 (2008) 3900e3904.[30] A.M. Park, R.J. Wycisk, X. Ren, F.E. Turley, P.N. Pintauro, J. Mater. Chem. A 4
(2016) 132e141.[31] L.A. Adams, S.D. Poynton, C. Tamain, R.C.T. Slade, J.R. Varcoe, ChemSusChem. 1
(2008) 79e81.[32] J.A. Vega, C. Chartier, W.E. Mustain, J. Power Sources 195 (2010) 7176e7180.[33] J.A. Vega, S. Smith, W.E. Mustain, J. Electrochem. Soc. 158 (2011) B349eB354.[34] M. Inaba, Y. Matsui, M. Saito, A. Tasaka, K. Fukuta, S. Watanabe, H. Yanagi,
Electrochemistry 79 (2011) 322e325.[35] W. He, G. Lin, T. Van Nguyen, AIChE J. 49 (2003) 3221e3228.[36] H. Li, Y. Tang, Z. Wang, Z. Shi, S. Wu, D. Song, J. Zhang, K. Fatih, J. Zhang,
H. Wang, J. Power Sources 178 (2008) 103e117.[37] F. Weng, A. Su, C. Hsu, C. Lee, J. Power Sources 157 (2006) 674e680.[38] M.V. Williams, E. Begg, L. Bonville, H.R. Kunz, J.M. Fenton, J. Electrochem. Soc.
151 (2004) A1173eA1180.
rces (2017), http://dx.doi.org/10.1016/j.jpowsour.2017.05.006