journal of sea research - europa
TRANSCRIPT
Journal of Sea Research xxx (2014) xxx–xxx
SEARES-01257; No of Pages 9
Contents lists available at ScienceDirect
Journal of Sea Research
j ourna l homepage: www.e lsev ie r .com/ locate /seares
Standardising the assessment of Functional Integrity inbenthic ecosystems
Silvia de Juan a,⁎, Judi Hewitt a, Simon Thrush a,b, Debbie Freeman c
a National Institute of Water and Atmospheric Research, P.O. Box 11-115, Hamilton, New Zealandb Institute of Marine Sciences, Auckland University, New Zealandc Department of Conservation, P.O. Box 10-420, Wellington 6143, New Zealand
⁎ Corresponding author.E-mail address: [email protected] (S. de Juan
http://dx.doi.org/10.1016/j.seares.2014.06.0011385-1101/© 2014 Elsevier B.V. All rights reserved.
Please cite this article as: de Juan, S., et al., Stdx.doi.org/10.1016/j.seares.2014.06.001
a b s t r a c t
a r t i c l e i n f oArticle history:Received 31 March 2014Received in revised form 27 May 2014Accepted 2 June 2014Available online xxxx
Keywords:Ecosystem integrityFunctional componentsFunctional diversityHabitat complexityVideo surveyBenthic communities
Ecological integrity is an overarching concept that integrates multiple properties of ecosystems, including struc-ture, function and resilience to external change.We explore the links between ecological integrity and structuralsurrogates for ecosystem functioning to develop a cost-effective assessment of Functional Integrity for marinehabitats based on biological traits, abundance and heterogeneity, focused on the visible components of the sea-floor, i.e., epibenthic flora and fauna and seabed biogenic habitat features. The assessmentwas based on diversityand redundancy of functional traits of the identified benthic components, supplemented by estimates of spatialheterogeneity (habitat transitions) and vertical habitat complexity. This approach was developed using videodata collected in different years with different sampling strategies in two locations: Kawau Bay in North IslandofNewZealand, and Port Pegasus in Stewart Island, off South Island ofNewZealand; this last locationwas a prioriexpected to be nearly—pristine. Despite variability in sampling techniques and environmental settings, the ap-proach proved effective and evidenced higher measures of Functional Integrity in the Port Pegasus location.This study introduces a first step to measure ecological integrity by successfully converting video data to surro-gates of Functional Integrity, in a way expected to be habitat independent.
© 2014 Elsevier B.V. All rights reserved.
1. Introduction
Globally, the main objective of many different frameworks andpolicies is to maintain or develop a good environmental status formarine ecosystems (Cochrane et al., 2010; SCBC, 2010), also referredas ecological integrity (EI). However, EI is not always either conceptuallyor operationally defined, as it is a high-level concept perhaps betterunderstood by its absence rather than its presence. The term EI encom-passes ecosystem structure, function and resilience (Özkundackzi et al.,2014) and it refers to the necessity to safeguard the self-organising ca-pacity of ecosystems (Burkhard et al., 2011). But an important featureis that there is no “fossilisation” of the current or past state of thebiota. Rather, there is recognition that following human modificationand environmental change, the configuration of indigenous communi-ties at a location may be quite different from that of the past (Leeet al., 2005). The elements of EI allow for natural successional changeand trophic cascades and acknowledge that compositional shifts canoccur in environments that have been modified by human activities.
Over the past decades, there has been an explosion of indices of“ecosystem health”, “good environmental status” or “ecological integri-ty” (note the ambiguous definitions), partly due to the need for new
).
andardising the assessment o
tools for assessing the status of marine waters, which is requiredby regulations like the US CleanWater Act and EUWater and Marinestrategy framework directives. But there is a general lack of scientificconsensus and most indices are very location — and stress — specific(Borja et al., 2008; Hale and Heltshe, 2008; Van Hoey et al., 2010).Many ecosystem indicators developed for coastal areas are based on di-viding macrobenthic species into the previously defined ecologicalgroups in relation to the stressor, and examine the relative decrease ofsensitive species confronted with a stressor, ( e.g., Dauvin, 2007;Rosenberg et al., 2004; Simboura et al., 2005). But one of the problemswith many of the indices currently available is that they focus on struc-ture and deal less explicitly with function and thus may be poor surro-gates for EI.
For ecological function at present there is a gap in terms of whatwe can easily and routinely measure and what these values mean(Birchenough et al., 2012). Directly measuring aspects of functionis possible but in many cases it is more likely to be supported as a re-search question rather than a routine long-termmonitoring tool, due tocosts. The functional traits of the organisms and their interactions deter-mine the functioning and stability of communities and ecosystems(Loreau et al., 2001) and thus potentially offer useful surrogate variablesfor ecosystem function. In this context, changes in functional compo-nents provide information about how communities respond to environ-mental stress and, in some contexts of their resilience (Lavorel and
f Functional Integrity in benthic ecosystems, J. Sea Res. (2014), http://
2 S. de Juan et al. / Journal of Sea Research xxx (2014) xxx–xxx
Garnier, 2002). The scientific challenge now is to scale up these studiesto assess their relevance for monitoring diverse marine ecosystems aswell as their dynamics and response to different sources of stress.
A thorough EI assessment implies broad spatial knowledge ofhabitats, biological communities and human uses, and this is currentlylacking frommostmarine regions world-wide (Douvere, 2008). As eco-systems are interconnected, comprehensive monitoring and evaluatingcriteria are needed for measuring EI at regional levels (Reza andAbdullah, 2011). Recent advances in acoustic and visual survey tech-niques offer a great potential to support demands for frequentmonitor-ing of seabed habitats at a range of spatial scales (Freitas et al., 2011; LoIacono et al., 2008). Remotely operated vehicles (ROVs) have proven tobe very efficient for quantifying the distribution, structure, abundanceand health status of benthic organisms in a variety of ecosystems(Teixidó et al., 2011; Thrush et al., 2001). Amongst several advantages,these techniques imply non-intrusive sampling (Teixidó et al., 2011)and record “real” images of the seafloor that are more likely to capturethe behaviours of larger mobile species that are missed by other sam-pling methods. These techniques would allow direct estimations ofepibenthic flora and fauna densities, aswell as the identification of hab-itat structures (Hewitt et al., 2004), that can be linked to elements of EI.
Indicators of EI aim to summarise copious, complex, scientific in-formation in a simple, condensed, and comprehensible way. Onemethod of simplifying the “complexity of ecosystems”, that inte-grates well with functional trait analysis, is to target selected ecosys-tem components. Our proposed method is based on the functionalcomponents and functional diversity of benthic communities (hereonwe refer to Functional Integrity, FI). Targeting of benthic organismshas many advantages: they are relatively non-mobile and thereforeuseful for studying the local disturbance; some of these species arelong-lived and would represent historical disturbance; many of thelarger organisms can be monitored remotely over large scales (100 mto km) by video; and there is extensive literature on their distributionin specific environments and on changes related to various stresses.We propose to further reduce complexity by targeting “visible” benthicorganisms (flora and fauna), recognising that while infauna and floraserve many important functions, in many systems visible componentscan represent the “invisible ones”, i.e., inconspicuous fauna not regis-tered by video (Reiss et al., 2010; Thrush et al., 2001). Based on theknown relationships between ecosystem components (infauna–epibenthos and epibenthos–water column, though biotic interactionsor nutrient fluxes, etc., e.g., Hewitt et al., 2006; Lohrer et al., 2005;
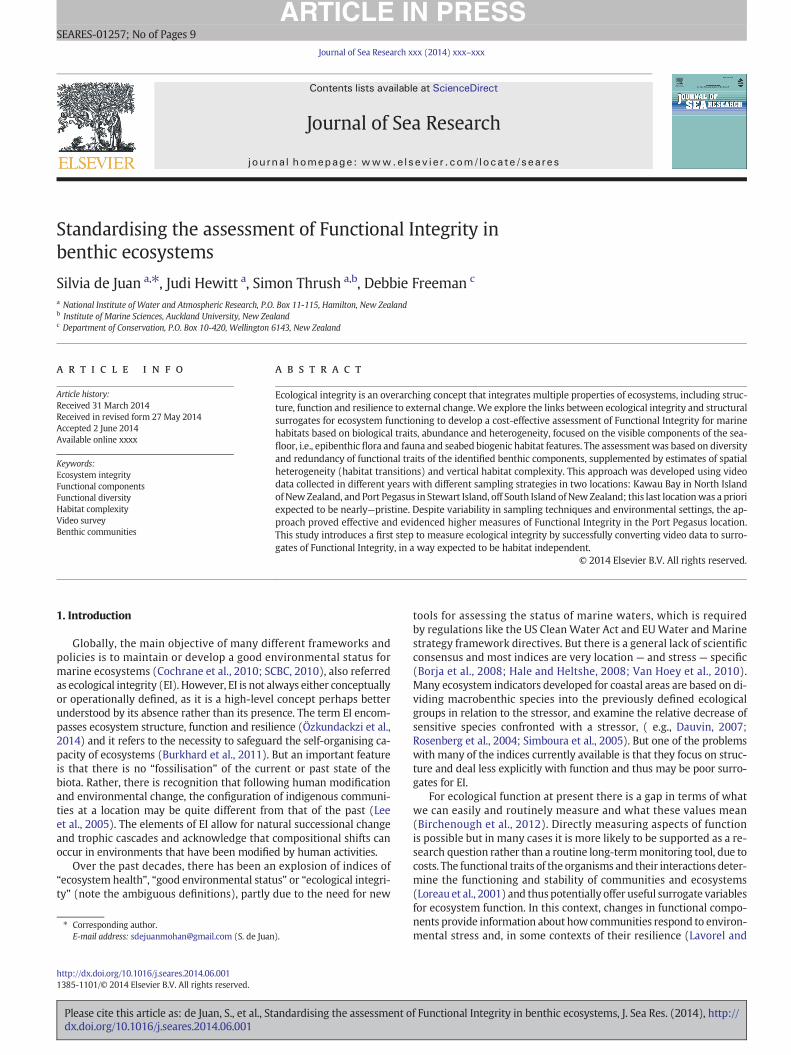
Fig. 1. General features of marine ecosystems to include in an ecological integrity assessmentplexity are components of broader elements of habitat structure and complexity; functional divdancy, together with diversity and composition, determine the resilience and recovery of ecos
Please cite this article as: de Juan, S., et al., Standardising the assessment odx.doi.org/10.1016/j.seares.2014.06.001
Turner et al., 1997), we propose surveying visible epibenthos at largescales with remote sensing techniques and converting this informationto aspects important for ecosystem functioning. Importantly, we pro-pose using a biological traits methodology that should be independentof habitat type or regional species pool (Bremner et al., 2003; Hewittet al., 2008). In the development of this proposed assessment frame-work, we introduce a case study of two subtidal coastal ecosystems inNew Zealand that are expected to differ in terms of the integrity of ben-thic ecosystems. The objective of using the two locations was to deter-mine whether the proposed approach could be used in two differentenvironments where different video surveying methods were used.We evaluate the results against the prediction that functional diversitydecreases with increasing environmental stress (Mouillot et al., 2006),and discuss its potential further application at broader scales.
1.1. Study approach
The strategy we propose is based on obtaining different metricslinked with the functional diversity of benthic systems that composean essential subset of some elements of EI (Fig. 1) and that will guidethe assessment of the broad concept of FI. The FI metrics proposed en-compass the spatial heterogeneity, i.e., the variety and arrangement ofbiogenic habitats, defined by dominant engineering species (e.g., kelpforests, sponge gardens or shrimp burrow dominated habitats), inboth 2 and 3 dimensions and then assess functional composition and di-versity based on biological traits related to ecosystem functioning.
The underlying concept of functional diversity and functional traitsis that functional structure of a community and its effects on other as-pects of the ecosystem can be represented by a set of biological traitsthat relate to various aspects of how a community or ecosystemfunctions (e.g., dispersal, recovery, trophic dynamics, nutrient fluxes)(Bremner et al., 2003; de Juan et al., 2007; Villnäs et al., 2011)(Table 1). The Biological Traits Analysis (BTA) is well rooted in ecologi-cal theory (Statzner et al., 2001) and it fulfils most of the requirementsof a good bio-monitoring tool: i) it enables priori predictions of the eco-logical responses of communities to environmental conditions (e.g., deJuan et al., 2009; Townsend and Hildrew, 1994); ii) biological traitsare indirectly related with ecological functions, for example, reproduc-tive frequency and body size are related to secondary production(Queirós et al., 2006; Statzner et al., 2001), such that analyses of biolog-ical traits are now frequently regarded as surrogates of functionality;iii) it allows the distinction amongst different types of human
and overlap with Functional Integrity assessment: spatial heterogeneity and habitat com-ersity and composition inform of the biological diversity of systems; and functional redun-ystems.
f Functional Integrity in benthic ecosystems, J. Sea Res. (2014), http://
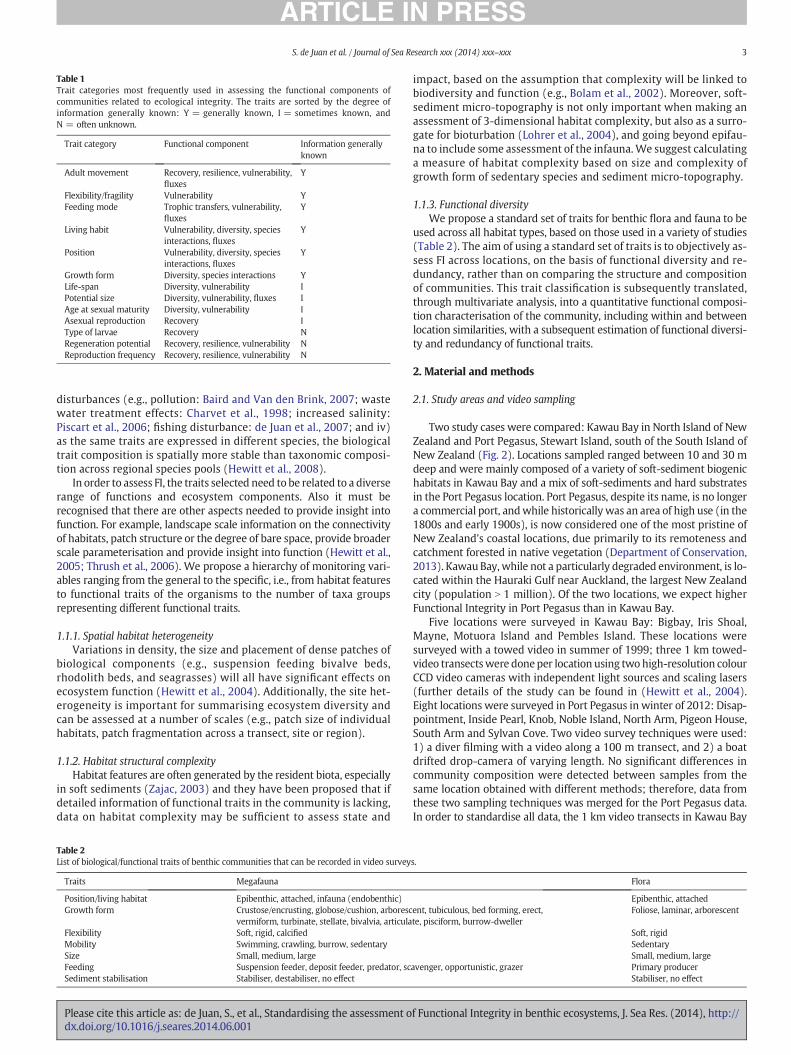
Table 1Trait categories most frequently used in assessing the functional components ofcommunities related to ecological integrity. The traits are sorted by the degree ofinformation generally known: Y = generally known, I = sometimes known, andN = often unknown.
Trait category Functional component Information generallyknown
Adult movement Recovery, resilience, vulnerability,fluxes
Y
Flexibility/fragility Vulnerability YFeeding mode Trophic transfers, vulnerability,
fluxesY
Living habit Vulnerability, diversity, speciesinteractions, fluxes
Y
Position Vulnerability, diversity, speciesinteractions, fluxes
Y
Growth form Diversity, species interactions YLife-span Diversity, vulnerability IPotential size Diversity, vulnerability, fluxes IAge at sexual maturity Diversity, vulnerability IAsexual reproduction Recovery IType of larvae Recovery NRegeneration potential Recovery, resilience, vulnerability NReproduction frequency Recovery, resilience, vulnerability N
3S. de Juan et al. / Journal of Sea Research xxx (2014) xxx–xxx
disturbances (e.g., pollution: Baird and Van den Brink, 2007; wastewater treatment effects: Charvet et al., 1998; increased salinity:Piscart et al., 2006; fishing disturbance: de Juan et al., 2007; and iv)as the same traits are expressed in different species, the biologicaltrait composition is spatially more stable than taxonomic composi-tion across regional species pools (Hewitt et al., 2008).
In order to assess FI, the traits selected need to be related to a diverserange of functions and ecosystem components. Also it must berecognised that there are other aspects needed to provide insight intofunction. For example, landscape scale information on the connectivityof habitats, patch structure or the degree of bare space, provide broaderscale parameterisation and provide insight into function (Hewitt et al.,2005; Thrush et al., 2006). We propose a hierarchy of monitoring vari-ables ranging from the general to the specific, i.e., from habitat featuresto functional traits of the organisms to the number of taxa groupsrepresenting different functional traits.
1.1.1. Spatial habitat heterogeneityVariations in density, the size and placement of dense patches of
biological components (e.g., suspension feeding bivalve beds,rhodolith beds, and seagrasses) will all have significant effects onecosystem function (Hewitt et al., 2004). Additionally, the site het-erogeneity is important for summarising ecosystem diversity andcan be assessed at a number of scales (e.g., patch size of individualhabitats, patch fragmentation across a transect, site or region).
1.1.2. Habitat structural complexityHabitat features are often generated by the resident biota, especially
in soft sediments (Zajac, 2003) and they have been proposed that ifdetailed information of functional traits in the community is lacking,data on habitat complexity may be sufficient to assess state and
Table 2List of biological/functional traits of benthic communities that can be recorded in video survey
Traits Megafauna
Position/living habitat Epibenthic, attached, infauna (endobenthic)Growth form Crustose/encrusting, globose/cushion, arboresc
vermiform, turbinate, stellate, bivalvia, articulaFlexibility Soft, rigid, calcifiedMobility Swimming, crawling, burrow, sedentarySize Small, medium, largeFeeding Suspension feeder, deposit feeder, predator, scSediment stabilisation Stabiliser, destabiliser, no effect
Please cite this article as: de Juan, S., et al., Standardising the assessment odx.doi.org/10.1016/j.seares.2014.06.001
impact, based on the assumption that complexity will be linked tobiodiversity and function (e.g., Bolam et al., 2002). Moreover, soft-sediment micro-topography is not only important when making anassessment of 3-dimensional habitat complexity, but also as a surro-gate for bioturbation (Lohrer et al., 2004), and going beyond epifau-na to include some assessment of the infauna.We suggest calculatinga measure of habitat complexity based on size and complexity ofgrowth form of sedentary species and sediment micro-topography.
1.1.3. Functional diversityWe propose a standard set of traits for benthic flora and fauna to be
used across all habitat types, based on those used in a variety of studies(Table 2). The aim of using a standard set of traits is to objectively as-sess FI across locations, on the basis of functional diversity and re-dundancy, rather than on comparing the structure and compositionof communities. This trait classification is subsequently translated,through multivariate analysis, into a quantitative functional composi-tion characterisation of the community, including within and betweenlocation similarities, with a subsequent estimation of functional diversi-ty and redundancy of functional traits.
2. Material and methods
2.1. Study areas and video sampling
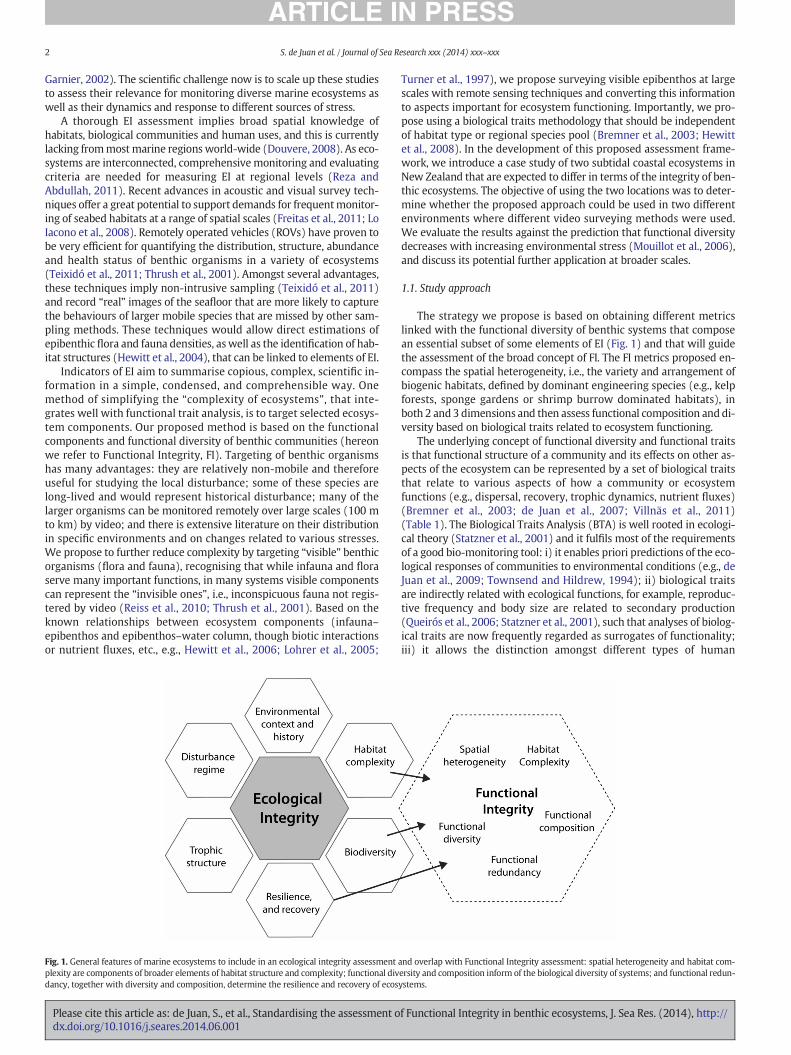
Two study cases were compared: Kawau Bay in North Island of NewZealand and Port Pegasus, Stewart Island, south of the South Island ofNew Zealand (Fig. 2). Locations sampled ranged between 10 and 30 mdeep and were mainly composed of a variety of soft-sediment biogenichabitats in Kawau Bay and a mix of soft-sediments and hard substratesin the Port Pegasus location. Port Pegasus, despite its name, is no longera commercial port, andwhile historically was an area of high use (in the1800s and early 1900s), is now considered one of the most pristine ofNew Zealand's coastal locations, due primarily to its remoteness andcatchment forested in native vegetation (Department of Conservation,2013). KawauBay,while not a particularly degraded environment, is lo-cated within the Hauraki Gulf near Auckland, the largest New Zealandcity (population N 1 million). Of the two locations, we expect higherFunctional Integrity in Port Pegasus than in Kawau Bay.
Five locations were surveyed in Kawau Bay: Bigbay, Iris Shoal,Mayne, Motuora Island and Pembles Island. These locations weresurveyed with a towed video in summer of 1999; three 1 km towed-video transectswere doneper location using twohigh-resolution colourCCD video cameras with independent light sources and scaling lasers(further details of the study can be found in (Hewitt et al., 2004).Eight locations were surveyed in Port Pegasus in winter of 2012: Disap-pointment, Inside Pearl, Knob, Noble Island, North Arm, Pigeon House,South Arm and Sylvan Cove. Two video survey techniques were used:1) a diver filming with a video along a 100 m transect, and 2) a boatdrifted drop-camera of varying length. No significant differences incommunity composition were detected between samples from thesame location obtained with different methods; therefore, data fromthese two sampling techniques was merged for the Port Pegasus data.In order to standardise all data, the 1 km video transects in Kawau Bay
s.
Flora
Epibenthic, attachedent, tubiculous, bed forming, erect,te, pisciform, burrow-dweller
Foliose, laminar, arborescent
Soft, rigidSedentarySmall, medium, large
avenger, opportunistic, grazer Primary producerStabiliser, no effect
f Functional Integrity in benthic ecosystems, J. Sea Res. (2014), http://

Fig. 2.Map of New Zealand with the location of the two study areas: Kawau Bay in the North Island and Port Pegasus on Stewart Island, south of New Zealand South Island.
4 S. de Juan et al. / Journal of Sea Research xxx (2014) xxx–xxx
were randomly split into 100 m samples, obtaining 5–6 samples perlocation.
2.2. Spatial heterogeneity index
Habitat types were defined based on the dominant biological com-ponent (e.g., tube mat, mixed sponge-bivalve bed, kelp canopy, baresand, bioturbated mud) that was assigned after viewing the full videofootage. Species differences within these broad categories were onlyused to define different habitats if they resulted in obviously visual dif-ferences in density, height protruding above seafloor, or form. For ex-ample, scallop and horse mussels are both bivalves yet they can easilybe identified as different habitat types based on complexity. Similarly,differences in growth form between 2 canopy forming kelps would re-sult in them being treated as different habitats along a transect. Thiswould also be the case with the same species of kelp if the growthheight and density changed markedly. The spatial heterogeneity wasdefined as the number of habitat transitions in each video sample andfor Kawau Bay it was standardised as the average of transitions per100 m in each location.
Table 3Scores assigned to the growth form and micro-topography to assess the form complexity. Bracomplexity was then determined by weighting form complexity scores by vertical size and occ
Growth form and sediment microtopographic features Branching
Arborescent 3Foliose 3Erect colonial or bed-forming 1Erect other 1Single tubes 1Crustose 1Mounds 1Burrows 1
Please cite this article as: de Juan, S., et al., Standardising the assessment odx.doi.org/10.1016/j.seares.2014.06.001
2.3. Habitat complexity index
A vertical habitat complexity index was developed based on growthforms and sedimentmicro-topography that enhanced the vertical reliefof the basal substrate (form complexity see Table 3). These definitionswere originally developed for the soft-sediment habitats from KawauBay; the one extra growth form that had to be added for the hard sub-strate was “foliose”. This was added because it was felt that it was im-portant to differentiate between the more flexible foliose algae andthe more rigid branching algal and sponge species. These were rankeddepending on how intricately they were branched, their likely spatialextent (2-dimensional extent of a single unit) and their rigidity(Table 3), based on expert's judgement. This rank was then weightedby the vertical size of the habitat-former (small, medium, large, multi-plied by 1, 2 and 3 respectively). Small was defined as b15 cm,mediumas 15–50 cm and large as N50 cm. The obtained score was then multi-plied by the relative occurrence of the corresponding components ob-served across each sample. Sample results were then averaged foreach location. Analysis of the sensitivity of results to the initial rankswas conducted, namely around mounds, burrows and crustose ranks,however, any differences appeared removed once the size weighting
nching, spatial extent and rigidity were added to create form complexity. Vertical habitaturrence.
Spatial extent Rigidity Form complexity
1 1 51 42 1 41 1 3
1 21
2 31 2
f Functional Integrity in benthic ecosystems, J. Sea Res. (2014), http://

Table 4Metrics obtained from the video samples in Kawau Bay (5 locations) and Port Pegasus (8locations): spatial heterogeneity (SH) as the average of transitions standardised to 100 mtransect; habitat complexity (HC) as the size weighted average occurrence of complexityscores (Table 3); “overall” is the average of locations in each area ± standard deviation.
Kawau Bay SH HC
5S. de Juan et al. / Journal of Sea Research xxx (2014) xxx–xxx
was applied. In the Port Pegasus data these analyses were conducted onfull transects, for the Kawau Bay data, they were conducted on detailedanalyses of randomly selected 100 m sections. Relative occurrence wasdefined as 0 (not observed), 1 (observed occasionally), 2 (common,found multiple times or for extended minutes of footage) and 3 (abun-dant, widespread and dominant).
Bigbay 0.8 77Iris Shoal 0.6 90Mayne 0.4 62Motuora 0.9 57Pembles 0.73 71Overall 0.69 ± 0.19 71.4 ± 13
Port Pegasus SH HC
Disappointment 1.3 113Inside Pearl 1.9 101Knob 3.3 107Noble Island 2.8 149North Arm 2.6 63.7Pigeon House 2.3 117South Arm 1.2 118Sylvan cove 1.8 90Overall 2.4 ± 0.78 106.4 ± 30.5
2.4. Functional traits
Imageswere inspected to assess relative occurrence of visual benthicorganisms and seabed structures, occasionally to a species level butmore generally to a taxonomic/biotic group (e.g., branching sponges,large arborescent kelp, turfing algae, crustose coralline, large burrows).The trait categories listed in Table 2 were assigned to all groups identi-fied in the samples. Fuzzy coding was used to allow the species to varyin the degree inwhich it exhibited affinity to a specific trait within a cat-egory (Chevenet et al., 1994). This fuzzy probability matrix was multi-plied by relative occurrence to obtain a trait abundance matrix forsubsequent analysis. The trait occurrence matrix was analysed withmultivariate statistics to test for variability in the functional trait com-position across sites within a location using: non-metric multi-dimensional scaling ordination based onBray–Curtis similarity, Analysisof Similarities and the Similarity Percentages (MDS, ANOSIM andSIMPER procedures with PRIMER, Clarke and Warwick, 1994). The oc-currence matrix was square-root transformed prior to multivariateanalysis.
The number of functional traits, evenness and Shannon–Wiener di-versity of traits observed in each sample were also calculated. Function-al redundancy was assessed by high trait richness (i.e., abundant traits:traits with at least three distinct biotic group possessing this same func-tional trait) and high frequency of occurrence (i.e., common traits: traitswith relative occurrence N 2 at some stage along each transect).
Overall differences between areas and between locations withineach area for each of these metrics were assessed with non-parametric Kruskal–Wallis tests. No multiple comparisons were per-formedwithin areas due to the un-balanced design and the relativelylow n (d.f. = 7 for Port Pegasus and d.f. = 4 for Kawau Bay). There-fore, comparisons between locations within an area were qualita-tively assessed after significant Kruskal–Wallis test.
3. Results
3.1. Spatial heterogeneity
In Kawau Bay, the average spatial heterogeneity (number of transi-tions per sample) ranged from 0.9 in Motuora Island to 0.4 in Mayne,but no significant differences were detected. In Port Pegasus, the aver-age number of habitat transitions per sample was lowest in SouthArm, 1.2, and highest in Knob, 3.3 (p b 0.01). The overall spatial hetero-geneity was highest in Port Pegasus area, p b 0.001 (Table 4).
3.2. Habitat complexity
In Kawau Bay, the habitat complexity was highest in Iris Shoal,which was dominated by bivalve beds (Atrina zelandica) and sponges,and lowest in Motuora Island (a mix of bare sand/mud and Atrina)and Mayne (dominated by scallop beds) (p b 0.05). In Port Pegasus,the habitat complexity was highest in Noble Island, which was pre-dominantly rocky reef substrate, and lowest in North Arm location(p b 0.01), a mix of soft-sediment and rocky reef substrates. Theoverall habitat complexity was higher in Port Pegasus (p b 0.001), al-though North Arm and Sylvan Cove values were similar to those fromKawau Bay (Table 4).
Please cite this article as: de Juan, S., et al., Standardising the assessment odx.doi.org/10.1016/j.seares.2014.06.001
3.3. Functional traits
In Kawau Bay, the locations differed in relative abundance offunctional traits (ANOSIM test: 0.54, p b 0.01). All pair-wise compar-isons of locations were significantly dissimilar, with the exception ofBigbay, Mayne and Motuora Island, where no significant differenceswere detected between these 3 locations (Fig. 3a). In Port Pegasus,no location was distinctly different from any other in the ordinationspace (ANOSIM test: 0.3, p b 0.01; Fig. 3b) and Inside Pearl was notsignificantly dissimilar to any other site, while Disappointment,Knob, Pigeon and Sylvan cove were dissimilar to only half of thesites. The within-location similarity was high at all locations inboth Kawau Bay and Port Pegasus (Bray–Curtis similarity N80%).
Number of traits and Shannon index in Kawau Bay were highestin Iris Shoal and lowest in Pembles Island and Motuora Island; theother 2 locations had similar values (Table 5); significant differenceswere only detected for the Shannon index, p = 0.03. In Port Pegasus,the number of traits and the Shannon indexwere higher in Disappoint-ment and North Arm, and lower in Knob and Noble Island (number oftraits: p = 0.04; Shannon index: p = 0.01). Evenness was similaracross locations within each area, but was higher on average in KawauBay (p b 0.001). The average number of traits across locations wasalso higher in Kawau Bay (p N 0.001), while no significant differenceswere detected for the Shannon index between locations (Table 5).
In Port Pegasus, the number of abundant traits (N2 biotic groupswith that trait) that occurred on a transect was fairly consistent acrosslocations (Table 5), ranging from 10 (Noble Island) to 15 traits (SouthArm), and averaging 13 across locations. In Kawau Bay the number ofabundant traits was lower, averaging 11 across locations, ranging from9 in Mayne to 13 in Iris Shoal (Table 5). In Port Pegasus, the numberof common traits (traitswith relative occurrence N 2) varied little acrosslocations, ranging from 19 (Inside Pearl) to 24 (North Arm, PigeonHouse and South Arm). In Kawau Bay the number of common traitshad an average across locations of 18.9, ranging between 23 in IrishShoal to 16 in Mayne (Table 5). Neither of these two measures of func-tional redundancy was significantly different between sites within a lo-cation, but weak significant differences were detected betweenlocations (p = 0.031 for common traits and 0.026 for abundant traits).
4. Discussion
In this study we propose an approach to assess the Functional In-tegrity of marine benthic ecosystems based on the estimation of the
f Functional Integrity in benthic ecosystems, J. Sea Res. (2014), http://

Fig. 3. Non-metric multi-dimensional scaling ordination of the relative abundance of functional traits in the two study sites: Kawau bay (a) and Port Pegasus (b). Samples from the 5locations in Kawau Bay and 8 locations in Port Pegasus are represented by symbols.
6 S. de Juan et al. / Journal of Sea Research xxx (2014) xxx–xxx
relative occurrence of functional components of the seafloor, identi-fied by video surveys that comprises a range of metrics rather than asingle one (Fig. 4). The approach starts with a general characterisa-tion of the seafloor structure and increases in complexity to estimateindices of functional diversity and redundancy; the approach aims tobe flexible as it could be re-adjusted as larger sets of data becomeavailable. However, we see our Functional Integrity metrics as onlyone step. Functional Integrity indices need to be considered withinthe environmental setting (specific stressors and historical context),and their temporal dynamics need to be established. Knowledge onthe existing sources of stress is important, as, for example, habitattransitions could be linked to stress gradients conditioning observedpatterns. If any specific stressors were considered to be of impor-tance, we would expect that trait categories assumed to respond tothose stressors would be explicitly included and assessed separately.
Please cite this article as: de Juan, S., et al., Standardising the assessment odx.doi.org/10.1016/j.seares.2014.06.001
Our approach was applied in two areas that varied in the degree ofsoft versus hard substrates and that were surveyed in different yearswith different video techniques. In accordance with predictions oflower functional diversity and seabed structural complexity with stress(Thrush and Dayton, 2002), the average FI metrics in Port Pegasus,where anthropogenic stress was expected to be lowest, were consis-tently higher than those in Kawau Bay. Kawau Bay was characterisedby bare soft-sediments alternating with biogenic habitats and the habi-tat complexity and spatial heterogeneity were considerably lower thanin Port Pegasus, characterised by a mix of rocky reef and soft sediment.Port Pegasus appeared to be a region supporting a diverse array of func-tional traits at relatively small scales, with a large number of traits withboth high occurrence and large number of organisms with the sametrait (22 and 13 traits respectively out of an overall of 38 traits) thatwould contribute to resilience facing external stress. While encouraged
f Functional Integrity in benthic ecosystems, J. Sea Res. (2014), http://

Table 5Functional diversity in Kawau Bay (5 locations) and Port Pegasus (8 locations): number of traits (S), Shannon index (H) and evenness (J); “abundant traits” is the number of traitsrepresented by N2 taxonomic/biotic groups in each transect; “common traits” is the number of traits with relative occurrence N2 along a transect; “overall” is the average of location ineach area ± standard deviation.
Kawau Bay S H J Common traits Abundant traits
Bigbay 32.3 3.4 0.98 17 11Iris Shoal 34.2 3.5 0.99 23 13Mayne 32 3.4 0.98 16 9Motuora 30 3.3 0.98 19 10Pembles 29.6 3.3 0.98 19 10Overall 31.7 ± 3.6 3.4 ± 0.1 0.98 ± 0.01 18.9 ± 5.6 11 ± 2.5
Port Pegasus S H J Common traits Abundant traits
Disappointment 30.7 3.13 0.92 22 13Inside Pearl 28.1 3.01 0.9 19 14Knob 25 2.95 0.92 20 12Noble Island 24.8 2.93 0.91 22 10North Arm 30.1 3.14 0.92 24 13Pigeon House 27.8 3.05 0.92 24 14South Arm 29 3.10 0.92 24 15Sylvan cove 28.4 3.08 0.93 23 14Overall 27.7 ± 2.8 3.03 ± 0.01 0.91 ± 0.01 22.3 ± 1.9 13 ± 1.6
7S. de Juan et al. / Journal of Sea Research xxx (2014) xxx–xxx
by these results we see an important next step that is to use the meth-odology in a series of locations that represent a stronger gradient in an-thropogenic disturbance and thus potentially in Functional Integrity.
Fig. 4. Proposed protocol for the assessment of Functional Integrity based on video surveys and eof the FI metrics, and on the assumption that the assessment would be improved as more data
Please cite this article as: de Juan, S., et al., Standardising the assessment odx.doi.org/10.1016/j.seares.2014.06.001
In NewZealand, the concept of ecological integrity is being used by agovernment agency, the Department of Conservation, to monitor andreport on the status of conservation lands, utilising a suite of indicators
xample of the assessment in Kawau Bay and Port Pegasus, based on the overall comparisonare obtained, aiming to match the protocol proposed.
f Functional Integrity in benthic ecosystems, J. Sea Res. (2014), http://

8 S. de Juan et al. / Journal of Sea Research xxx (2014) xxx–xxx
of ecological integrity, including the representation of functionalgroups, species demography and distribution and abundance of in-vasive species (Bellingham et al., 2013). A systematic monitoringsystem is currently being employed, allowing a broad-scale assess-ment of the status of New Zealand's native terrestrial species andecosystems (Department of Conservation, 2013). This system wasconsidered to allow not only national and regional reporting of sta-tus and trend in EI, but also contribute to the evaluation of the effec-tiveness of conservation management and policy, provide an earlywarning system and inform the prioritisation for resource allocation(Bellingham et al., 2013). A similar monitoring and reporting frame-work for the marine environment is currently in development andwill be an invaluable opportunity for extending and testing ourapproach.
With the implementation of our methodology to the Kawau Bayand Port Pegasus data, we could identify two major problems, name-ly sampling extent and defining habitat transitions, which we wouldfurther explore when conducting future sampling. Preferably, videotransects should cover similar lengths at a standardised width, butthis is rarely practical due to variations in waves, currents and visi-bility. Recording geo-location, so that estimations of surveyed areascould be made, would at least allow relative differences related tosampling extent to be examined and possibly overcome. Another arearequiring standardisation is the definition of habitat transitions. Whilewe found it easier to define a transition had occurred rather than to de-finewhat a habitat was, or the exact GIS location of the transition, it wasessentially a subjective process. Having developed themethod, it wouldnow be appropriate to define the relative change, in terms of density,form and size, required to be considered as a transition. Our score rank-ing of form complexity could also be improvedwithmore sampling andanalysis. It appears reasonably robust with respect to habitats as weonly had to incorporate one new form (namely foliose) in movingfrom the soft-sediment habitats, in which the scoring was developed,to the soft-hard substrate mix of habitats in Port Pegasus. We did testthe sensitivity of the estimate of habitat complexity to some aspects,namely assigning mounds as higher than burrows and assigning crus-tose as the lowest value, and found that these minor changes weresmoothed over by the size weighting. However, incorporating opinionsof others working in different areas and trialling across a range of sys-tems will undoubtedly result in improvements.
Our data suggests that locations may be differentially ranked usingdifferent measures. Locations with the lowest spatial heterogeneityand/or vertical habitat complexity had high diversity of traits and viceversa, suggesting that diversity is maintained through a variety of pro-cesses. This finding adds to the complexity of determining a singleindex of Functional Integrity and suggests that, similar to the broaderconcept of ecological integrity, it should be considered as amultifacetedconcept. This is not surprising, as we would expect that integrity, andespecially resilience, would be maintained bymultiple processes; how-ever, it does raise the issue of how thesemeasures should be integrated.Due to the limitations imposed by the differences in survey protocol,and only having 2 areas sampled expected to exhibit different levels ofecosystem degradation, we merely do simple comparisons of metrics.However, an array of sophisticated statistical techniques is currentlyavailable; this could range from simple Decision Trees to StructuralEquation Models that link changes in indicator response to environ-mental variability (Thrush et al., 2012). Simultaneously evaluatingmultiple-metrics, all related to some degree with the FI, may aid the as-sessment of the ecological status of a location, where not all metricspoint to the same status. Also, the approach might be improved by dif-ferently scoring the metrics, on the basis of their tighter link to the FIof a location. But in order to use these techniques, a number of stepsare required, the first of which we suggest is the adoption of a standardprotocol as discussed above. Other steps include sampling both in moredegraded areas and in a variety of habitat types, and the collection of en-vironmental and historical context data (Fig. 4).
Please cite this article as: de Juan, S., et al., Standardising the assessment odx.doi.org/10.1016/j.seares.2014.06.001
The approach we propose is based on elements visible from a videosurvey of the seafloor. Thus, there are a number of functional compo-nents that are notwell covered (e.g., nutrientfluxes,microphytobenthosand infaunal productivity and trophic links), although generally linksbetween fluxes and large visible epifauna and flora and links betweenthe diversity of infauna and epibenthos have been demonstrated (e.g.,Lohrer et al., 2005; Thrush et al., 2014). While it is accepted that largeepifauna are key components of hard substrates, often driving the distri-bution of other species, epifauna and flora are often also key species insoft substrate systems, influencing the infauna by providing habitats, af-fectingproductivity andmodifying environmental factors. In areaswith-out large epibenthos, the presence of key functional infauna can often beseen by modifications to the sediment microtopography (burrows,holes, mounds) (Hewitt et al., 2004). However, this needs to be robustlytested in any habitat typewhere this approach could be used to evaluateFI. It maybe that a hierarchical sampling method that nests collection ofinfaunal datawithin the broader scale video datawill not only build ro-bustness but also form a link to past surveys focused on grabs andcores. Moreover, the metrics we proposed are cost-efficient but inorder to escalate to ecological integrity, collection of other measuresof the ecosystem status should also be done, e.g., water turbidity,presence of non-native species, sediment deposition on theepibenthic fauna and flora (Fig. 1) (Özkundackzi et al., 2014). Manyof these could also be assessed from video images, but would requiredevelopment of some standard methodologies. Such standardisationof methodology and the collation of measures of the various compo-nents of ecological integrity, being the FI metrics an essential part ofthis process, would allow a comprehensive assessment of the statusand trends in marine species and habitats, including for the purposesof monitoring and reporting on the effectiveness of conservation man-agement and prioritising resources (Bellingham et al., 2013).
5. Conclusions
Ecosystem integrity assessments need to capture the structure,function and resilience of natural systems, emphasising the need toincorporate function and ecosystem performance information intothe development of indicators. Here we have demonstrated a suc-cessful method for converting video data to functional traits data,and other important aspects of seafloor functioning. What we proposeis a framework that allows for, and encourages, detailedmeasurementsof the functional components of the seabed, as an essential constituentof EI, and supports continuous knowledge generation considered ap-propriate to management. We also stress the importance of buildingon previous monitoring and maintenance of time series in developingan appropriate framework for an ecological integritymonitoring strate-gy. Combining the indicators that represent Functional Integrity in ameaningful way requires development and validation of a method fordoing this. Moving further from this to combine indicators of differentcomponents of ecological integrity will require a sustained research atregional scales focussed on ecological knowledge and possiblemanage-ment actions. Currently, monitoring of the ecosystem status at regionalscales based on video surveys of the seafloor is probably the most cost-efficient approach; as demonstrated in our case study, functional com-ponents of the seafloor can be obtained from video images and usedto assess the Functional Integrity of the area. The way forward shouldfocus on combining this approach with other measures obtained fromvideo images and that link with the integrity of the ecosystems.
Acknowledgements
This manuscript was prompted by the New Zealand Department ofConservation strategy for monitoring of ecological integrity and theideas and techniques were co-developed by its staff and authors.Funding was largely from the Department of Conservation's Scienceand Capability Group (Science Investigation numbers 4306 and 4470),
f Functional Integrity in benthic ecosystems, J. Sea Res. (2014), http://

9S. de Juan et al. / Journal of Sea Research xxx (2014) xxx–xxx
although data collection in Kawau Bay and its analysis were funded bythe New Zealand Foundation for Research and Technology (ProjectCO1X0212) and NIWA (NZNational Institute ofWater and AtmosphericResearch) Coasts and Oceans Core funding. SdJ was funded by a post-doctoral mobility grant from The Spanish Ministry of Education(Programa nacional de movilidad de recursos humanos del PlanNacional I + D + i 2008–2011). We thank Roberta D'Archino for theanalysis of video data from Port Pegasus, and Andrew Lohrer and MikeTownsend for contributing to the subsequent analyses of that data.Also, we thank the two reviewers that helped improve this manuscript.
References
Baird, D.J., Van den Brink, P.J., 2007. Using biological traits to predict species sensitivity totoxic substances. Ecotoxicol. Environ. Saf. 67, 296–301.
Bellingham, P.J., Richardson, S.J., Gormley, A.M., MacLeod, C.J., Forsyth, D.M., 2013. Depart-ment of Conservation biodiversity indicators: 2013 assessment. Landcare Research,Lincoln, New Zealand.
Birchenough, S.N.R., Parker, R.E., McManus, E., Barry, J., 2012. Combining bioturbation andredox metrics: potential tools for assessing seabed function. Ecol. Indic. 12, 8–16.
Bolam, S.G., Fernandes, T., Huxham, M., 2002. Diversity, biomass, and ecosystem pro-cesses in the marine benthos. Ecol. Monogr. 72, 599–615.
Borja, A., Bricker, S.B., Dauer, D.M., Demetriades, N.T., Ferreira, J.G., Forbes, A.T., Hutchings,P., Jia, X., Kenchington, R.A., Carlos Marques, J., Zhu, C., 2008. Overview of integrativetools and methods in assessing ecological integrity in estuarine and coastal systemsworldwide. Mar. Pollut. Bull. 56, 1519–1537.
Bremner, J., Rogers, S.I., Frid, C.L., 2003. Assessing functional diversity in marine benthicecosystems: a comparison of approaches. Mar. Ecol. Prog. Ser. 254, 11–25.
Burkhard, B., Opitz, S., Lenhart, H., Ahrendt, K., Garthe, S., Mendel, B., Windhorst, W., 2011.Ecosystem basedmodeling and indication of ecological integrity in the German NorthSea—case study offshore wind parks. Ecol. Indic. 11, 168–174.
Charvet, S., Roger, M., Faessel, B., Lafont, M., 1998. Évaluation de l“état de santé écologiquedes hydrosystèmes par l”utilisation des traits biologiques. Ann. Limnol. Int. J. Limnol.34 (4) (EDP Sciences).
Chevenet, F., Doledec, S., Chessel, D., 1994. A fuzzy coding approach for the analysis oflong-term ecological data. Freshw. Biol. 31, 295–309.
Clarke, K.R., Warwick, R.M., 1994. Changes in marine communities: an approach tostatistical analysis and interpretation. Natural Environment Research Council,UK, Plymouth.
Cochrane, K., Connor, D.W., Nillsson, P., Mitchell, I., Reker, J., Franco, J., Valavanis, V.,Moncheva, S., Ekebom, J., Nygaard, K., Serrao, Santos R., Narberhaus, I., Packeiser, T.,van de Bund, W., Cardoso, A.C., 2010. Marine Strategy Framework Directive—TaskGroup 1 Report Biological Diversity (No. 24337). European Commission, Joint Re-search Centre, Ispra, Italy.
Dauvin, J.C., 2007. Paradox of estuarine quality: benthic indicators and indices, consensusor debate for the future. Mar. Pollut. Bull. 55, 271–281.
de Juan, S., Thrush, S.F., Demestre, M., 2007. Functional changes as indicators of trawlingdisturbance on a benthic community located in a fishing ground (NWMediterraneanSea). Mar. Ecol. Prog. Ser. 334, 117–129.
de Juan, S., Demestre, M., Thrush, S.F., 2009. Defining ecological indicators of trawling dis-turbance when everywhere that can be fished is fished: a Mediterranean case study.Mar. Policy 33, 472–478.
Department of Conservation, 2013. Department of Conservation Annual Report for theYear Ended June 2013. Department of Conservation, Wellington, New Zealand.
Douvere, F., 2008. The importance of marine spatial planning in advancing ecosystem-based sea use management. Mar. Policy 32, 762–771.
Freitas, R., Ricardo, F., Pereira, F., Sampaio, L., Carvalho, S., Gaspar, M.B., Quintino, V.,Rodrigues, A.M., 2011. Benthic habitat mapping: concerns using a combined ap-proach (acoustic, sediment and biological data). Estuar. Coast. Shelf Sci. 92,598–606.
Hale, S.S., Heltshe, J.F., 2008. Signals from the benthos: development and evaluation of abenthic index for the nearshore Gulf of Maine. Ecol. Indic. 8, 338–350.
Hewitt, J.E., Thrush, S.F., Legendre, P., Funnell, G.A., Ellis, J.I., Morrison, M.A., 2004. Map-ping of marine soft-sediment communities: integrated sampling for ecological inter-pretation. Ecol. Appl. 14, 1203–1216.
Hewitt, J.E., Thrush, S.F., Halliday, J., Duffy, C., 2005. The importance of small-scale habitatstructure for maintaining beta diversity. Ecology 86, 1619–1626.
Hewitt, J., Thrush, S., Gibbs, M., Lohrer, D., Norkko, A., 2006. Indirect effects of Atrinazelandica on water column nitrogen and oxygen fluxes: the role of benthic macrofau-na and microphytes. J. Exp. Mar. Biol. Ecol. 330, 261–273.
Hewitt, J.E., Thrush, S.F., Dayton, P.K., 2008. Habitat variation, species diversity and ecolog-ical functioning in a marine system. J. Exp. Mar. Biol. Ecol. 366, 116–122.
Lavorel, S., Garnier, E., 2002. Predicting changes in community composition and ecosys-tem functioning from plant traits: revisiting the Holy Grail. Funct. Ecol. 16, 545–556.
Lee, W., McGlone, M.,Wright, E., 2005. Biodiversity inventory andmonitoring: a review ofnational and international systems and a proposed framework for future biodiversity
Please cite this article as: de Juan, S., et al., Standardising the assessment odx.doi.org/10.1016/j.seares.2014.06.001
monitoring by the Department of Conservation. Landcare Research Contract ReportNo. LC0405/122.
Lo Iacono, C., Gràcia, E., Diez, S., Bozzano, G., Moreno, X., Dañobeitia, J., Alonso, B., 2008.Seafloor characterization and backscatter variability of the Almería Margin (AlboranSea) based on high resolution acoustic data. Mar. Geol. 250, 1–18.
Lohrer, A.M., Thrush, S.F., Gibbs, M., 2004. Bioturbators enhance ecosystem functionthrough complex biogeochemical interactions. Nature 431, 1092–1095.
Lohrer, A.M., Thrush, S.F., Hunt, L., Hancock, N., Lundquist, C.J., 2005. Rapid reworking ofsubtidal sediments by burrowing spatangoid urchins. J. Exp. Mar. Biol. Ecol. 321,155–169.
Loreau, M., Naeem, S., Inchausti, P., Bengtsson, J., Grime, J.P., Hector, A., Hooper, D.U., Huston,M.A., Raffaelli, D., Schmid, B., Tilman, D., Wardle, D., 2001. Biodiversity and ecosystemfunctioning: current knowledge and future challenges. Science 294, 804–808.
Mouillot, D., Spatharis, S., Reizopoulou, S., Laugier, T., Sabetta, L., Basset, A., Do Chi, T.,2006. Alternatives to taxonomic-based approaches to assess changes in transitionalwater communities. Aquat. Conserv. 16, 469–482.
Özkundackzi, D., Hamilton, D.P., Kelly, D., Schallenberg, M., de Winton, M., Verburg, P.,Trolle, D., 2014. Ecological integrity of deep lakes in New Zealand across anthropo-genic pressure gradients. Ecol. Indic. 37, 45–57.
Piscart, C., Usseglio-Polatera, P., Moreteau, J., Beisel, J., 2006. The role of salinity in the se-lection of biological traits of freshwater invertebrates. Arch. Hydrobiol. 166, 185–198.
Queirós, A.M., Hiddink, J.G., Kaiser, M.J., Hinz, H., 2006. Effects of chronic bottom trawlingdisturbance on benthic biomass, production and size spectra in different habitats. J.Exp. Mar. Biol. Ecol. 335, 91–104.
Reiss, H., Degraer, S., Duineveld, G.C.A., Kroencke, I., Aldridge, J., Craeymeersch, J.A.,Eggleton, J.D., Hillewaert, H., Lavaleye, M.S.S., Moll, A., Pohlmann, T., Rachor, E.,Robertson, M., Vanden Berghe, E., van Hoey, G., Rees, H.L., 2010. Spatial patterns of in-fauna, epifauna, and demersal fish communities in the North Sea. ICES J. Mar. Sci. 67,278–293.
Reza, M., Abdullah, S.A., 2011. Regional index of ecological integrity: a need for sustain-able management of natural resources. Ecol. Indic. 11, 220–229.
Rosenberg, R., Blomqvist, M., Nilsson, C., Cederwall, H., Dimming, A., 2004. Marine qualityassessment by use of benthic species-abundance distributions: a proposed new pro-tocol within the European Union Water Framework Directive. Mar. Pollut. Bull. 49,728–739.
SCBC, 2010. Global Biodiversity Outlook 3. Secretariat of the Convention on Biological Di-versity, Montreal, canada.
Simboura, N., Panayotidis, P., Papathanassiou, E., 2005. A synthesis of the biological qual-ity elements for the implementation of the European Water Framework Directive inthe Mediterranean ecoregion: the case of Saronikos Gulf. Ecol. Indic. 5, 253–266.
Statzner, B., Bis, B., Doledec, S., Usseglio-Polatera, P., 2001. Basic and applied ecologyperspectives for biomonitoring at large spatial scales: a unified measure for thefunctional composition of invertebrate communities in European running waters.Basic Appl. Ecol. 2, 73–85.
Teixidó, N., Albajes-Eizagirre, A., Bolbo, D., Le Hir, E., Demestre, M., Garrabou, J.,Guigues, L., Gili, J.M., Piera, J., Prelot, T., Soria-Frisch, A., 2011. Hierarchicalsegmentation-based software for cover classification analyses of seabed images(Seascape). Mar. Ecol. Prog. Ser. 431, 45–53.
Thrush, S.F., Dayton, P.K., 2002. Disturbance to marine benthic habitats by trawlingand dredging: implications for marine biodiversity. Annu. Rev. Ecol. Evol. Syst.33, 449–473.
Thrush, S.F., Hewitt, J.E., Funnell, G.A., Coummings, V.J., Ellis, J.I., Schulz, D., Talley, D.,Norkko, A., 2001. Fishing disturbance and marine biodiversity: role of habitat struc-ture in simple soft-sediment systems. Mar. Ecol. Prog. Ser. 221, 255–264.
Thrush, S.F., Gray, J.S., Hewitt, J.E., Ugland, K.I., 2006. Predicting the effects of habitat ho-mogenization on marine biodiversity. Ecol. Appl. 16, 1636–1642.
Thrush, S.F., Hewitt, J.E., Lohrer, A.M., 2012. Interaction networks in coastal soft-sedimentshighlight the potential for change in ecological resilience. Ecol. Appl. 22, 1213–1223.
Thrush, S.F., Hewitt, J.E., Parkes, S., Lohrer, A.M., Pilditch, C., Woodin, S.A., Wethey, D.S.,Chiantore, M., Asnaghi, V., de Juan, S., Kraan, C., Rodil, I.F., Savage, C., Van Colen, C.,2014. Experimenting with ecosystem interaction networks in search of threshold po-tentials in real world marine ecosystems. Ecology 95 (6), 1451–1457.
Townsend, C.R., Hildrew, A.G., 1994. Species traits in relation to a habitat templet for riversystems. Freshw. Biol. 31, 265–275.
Turner, S.J., Grant, J., Pridmore, R.D., Hewitt, J.E., Wilkinson, M.R., Hume, T.M., Morrisey, D.J., 1997. Bedload and water-column transport and colonization processes by post-settlement benthic macrofauna: does infaunal density matter? J. Exp. Mar. Biol.Ecol. 216, 51–75.
Van Hoey, G., Borja, A., Birchenough, S., Buhl-Mortensen, L., Degraer, S., Fleischer, D.,Kerckhof, F., Magni, P., Muxika, I., Reiss, H., Schröder, A., Zettler, M., 2010. The useof benthic indicators in Europe: from the Water Framework Directive to the MarineStrategy Framework Directive. Mar. Pollut. Bull. 60, 2187–2196.
Villnäs, A., Perus, J., Bonsdorff, E., 2011. Structural and functional shifts in zoobenthos in-duced by organic enrichment— implications for community recovery potential. J. SeaRes. 65, 8–18.
Zajac, R.N., 2003. Community and population-level responses to disturbance in a sandflatcommunity. J. Exp. Mar. Biol. Ecol. 294, 101–125.
f Functional Integrity in benthic ecosystems, J. Sea Res. (2014), http://