journal of selected topics in signal processing, vol. x
TRANSCRIPT
JOURNAL OF SELECTED TOPICS IN SIGNAL PROCESSING, VOL. X, NO. X, MARCH 2021 1
RODNet: A Real-Time Radar Object DetectionNetwork Cross-Supervised by Camera-Radar Fused
Object 3D LocalizationYizhou Wang, Student Member, IEEE, Zhongyu Jiang, Student Member, IEEE, Yudong Li,
Jenq-Neng Hwang, Fellow, IEEE, Guanbin Xing, and Hui Liu, Fellow, IEEE
Abstract—Various autonomous or assisted driving strategieshave been facilitated through the accurate and reliable perceptionof the environment around a vehicle. Among the commonlyused sensors, radar has usually been considered as a robustand cost-effective solution even in adverse driving scenarios,e.g., weak/strong lighting or bad weather. Instead of consideringto fuse the unreliable information from all available sensors,perception from pure radar data becomes a valuable alternativethat is worth exploring. However, unlike rich RGB-based imagescaptured by a camera, it is noticeably difficult to extract semanticinformation from the radar signals. In this paper, we proposea deep radar object detection network, named RODNet, whichis cross-supervised by a camera-radar fused algorithm withoutlaborious annotation efforts, to effectively detect objects fromthe radio frequency (RF) images in real-time. First, the rawsignals captured by millimeter-wave radars are transformed toRF images in range-azimuth coordinates. Second, our proposedRODNet takes a sequence of RF images as the input to predictthe likelihood of objects in the radar field of view (FoV).Two customized modules are also added to handle multi-chirpinformation and object relative motion. Instead of using human-labeled ground truth for training, the proposed RODNet is cross-supervised by a novel 3D localization of detected objects using acamera-radar fusion (CRF) strategy in the training stage. Finally,we propose a method to evaluate the object detection performanceof the RODNet. Due to no existing public dataset availablefor our task, we create a new dataset, named CRUW1, whichcontains synchronized RGB and RF image sequences in variousdriving scenarios. With intensive experiments, our proposedcross-supervised RODNet achieves 86% average precision and88% average recall of object detection performance, which showsthe robustness to noisy scenarios in various driving conditions.
Index Terms—Radar object detection, deep CNN, autonomousdriving, advanced driver assistance system, cross-modal su-pervision, M-Net, temporal deformable convolution, temporalinception CNN, radar object annotation.
I. INTRODUCTION
RADAR is a common sensor for driving assistance thesedays, since it is effective in most driving scenarios,
including different weather and lighting conditions, resultingin its robustness compared with other sensors, e.g., cameraand LiDAR. Many autonomous or assisted driving solutionsfocus on sensor fusion to improve the accuracy and reliability
The authors are with the Department of Electrical and Computer Engineer-ing, University of Washington, Seattle, WA 98105, USA. E-mail: {ywang26,zyjiang, yudonl, hwang, gxing, huiliu}@uw.edu.
H. Liu is also with Silkwave Holdings Limited, Hong Kong.Manuscript received September 1, 2020; revised December 14, 2020.1The dataset and code are available at https://www.cruwdataset.org/.
Visual Object 3D Localization CFAR Peak
Detection
Object Classes and Locations in RF Images
Camera to Radar Projection
RODNet
RGB Images RF Images RF Images
ConfMaps
Supervision
Teacher Student
Final Radar Object Detections (Classes & Locations) L-NMS
Locations Only
Classes & Locations
CRF
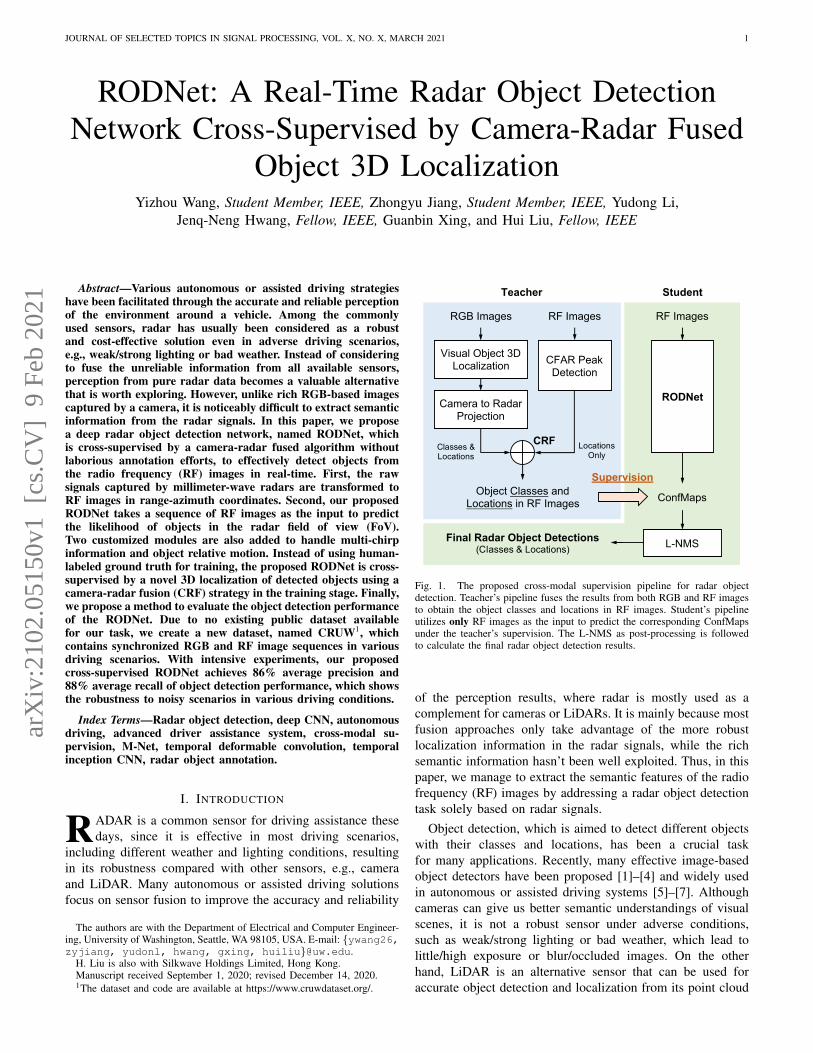
Fig. 1. The proposed cross-modal supervision pipeline for radar objectdetection. Teacher’s pipeline fuses the results from both RGB and RF imagesto obtain the object classes and locations in RF images. Student’s pipelineutilizes only RF images as the input to predict the corresponding ConfMapsunder the teacher’s supervision. The L-NMS as post-processing is followedto calculate the final radar object detection results.
of the perception results, where radar is mostly used as acomplement for cameras or LiDARs. It is mainly because mostfusion approaches only take advantage of the more robustlocalization information in the radar signals, while the richsemantic information hasn’t been well exploited. Thus, in thispaper, we manage to extract the semantic features of the radiofrequency (RF) images by addressing a radar object detectiontask solely based on radar signals.
Object detection, which is aimed to detect different objectswith their classes and locations, has been a crucial taskfor many applications. Recently, many effective image-basedobject detectors have been proposed [1]–[4] and widely usedin autonomous or assisted driving systems [5]–[7]. Althoughcameras can give us better semantic understandings of visualscenes, it is not a robust sensor under adverse conditions,such as weak/strong lighting or bad weather, which lead tolittle/high exposure or blur/occluded images. On the otherhand, LiDAR is an alternative sensor that can be used foraccurate object detection and localization from its point cloud
arX
iv:2
102.
0515
0v1
[cs
.CV
] 9
Feb
202
1

JOURNAL OF SELECTED TOPICS IN SIGNAL PROCESSING, VOL. X, NO. X, MARCH 2021 2
data. After the pioneer research on feature extraction frompoint cloud [8], [9], subsequent object detection from LiDARpoint cloud has been addressed [10]–[12]. However, thesemethods require relatively dense LiDAR point cloud for de-tailed semantic information, not to mention its high equipmentand computational costs.
Radar, on the other hand, is relatively more reliable inmost harsh environments. Frequency modulated continuouswave (FMCW) radar, which operates in the millimeter-wave(MMW) band (30-300GHz) that is lower than visible light,has the following properties: 1) MMW has great capabilityto penetrate through fog, smoke, and dust; 2) The hugebandwidth and high working frequency give FMCW radargreat range detection ability. Typically, there are two kindsof data representations for the FMCW radar, i.e., RF imageand radar points. The RF images are generated from the rawradar signals using a series of fast Fourier transforms (FFTs),and the radar points are then derived from these frequencyimages through a peak detection algorithm [13]. Although theradar points can be directly used as the input of the methodsdesigned for the LiDAR point cloud [14], [15], these radarpoints are usually much sparser (less than 5 points on a nearbycar) than the point cloud from a LiDAR [16], [17], so that theinformation is not enough to accomplish the object detectiontask. Whereas, the RF images can maintain the rich Dopplerand object motion information so as to have the capability ofunderstanding the semantic meaning of a certain object.
In this paper, we propose a radar object detection method,cross-supervised by a camera-radar fusion algorithm in thetraining stage, that can accurately detect objects purely basedon the radar signals. More specifically, we propose a novelradar object detection pipeline, which consists of two parts: ateacher and a student. The teacher’s pipeline estimates objectclasses and 3D locations in the field of view (FoV) by sys-tematically fusing the information from a reliable camera-radarsensor fusion algorithm. The student’s pipeline includes a radarobject detection network (RODNet) that only takes RF imagesequences as the input and estimates object confidence maps(ConfMaps, discussed in Section IV-C). From the ConfMaps,we can further infer the object classes and locations in theradar’s range-azimuth coordinates through our post-processingmethod, called location-based non-maximum suppression (L-NMS, discussed in Section IV-C). The RODNet in the stu-dent’s pipeline is trained by the annotations systematicallylabeled by the teacher pipeline without the laborious and un-reliable human labeling efforts. The aforementioned proposedpipeline is shown in Fig. 1. As for the network architectures ofthe RODNet, we implement a 3D convolution neural network(3D CNN) based on an hourglass (HG) architecture withskip connections [18] for feature extraction from RF images.Several customized modules are designed to take advantage ofthe special properties of the RF image sequences. First, chirpinformation in each radar frame, which contains the detailedobject features, is considered. Thus, a chirp merging module(M-Net) is proposed to combine the chirp-level features intothe frame-level features. Second, since the radar reflection pat-terns vary with time due to the relative motion between radarand objects, the classical 3D convolution cannot effectively
extract temporal features. Thus, a novel convolution operation,called temporal deformable convolution (TDC), is proposedto handle the temporal evolution of the features in RF imagesequences.
We train and evaluate the RODNet using our self-collecteddataset, called Camera-Radar of the University of Washington(CRUW), which contains various driving scenarios of about400K synchronized camera-radar frames. As mentioned above,instead of using radar points as the data format, we choose RFimages, which inherently contain detailed motion and surfacetexture information of objects. To assess the quantitativeperformance of our proposed RODNet, without the definitionof bounding box widely used in image-based object detection,we further introduce an evaluation method to evaluate the radarobject detection performance in RF images. With intensiveexperiments, our RODNet can achieve about 86% AP and88% AR for object detection performance solely based onRF images in various driving scenarios, regardless of whetherobjects are visible or not in the camera’s FoV.
Overall, our main contributions are the following:• A novel and robust radar object detection network called
RODNet for robust object detection in various drivingscenarios, which can be used for autonomous or assisteddriving without camera or LiDAR information.
• Customized modules, i.e., M-Net and temporal de-formable convolution (TDC), are introduced to take ad-vantage of the special properties of RF images effectively.
• A camera-radar fusion (CRF) supervision framework fortraining the RODNet, taking advantage of a monocu-lar camera based object detection and 3D localizationmethod facilitated with statistical detection inference ofradar RF images.
• A new dataset, named CRUW, containing synchronizedand calibrated camera-radar frames, is collected and canserve as a valuable dataset for camera/radar cross-modalresearch.
• A new evaluation method for RF image based radarobject detection task is proposed and justified for itseffectiveness.
The rest of this paper is organized as follows. Related worksfor camera and radar data learning are reviewed in Section II.The introduction on our proposed RODNet with customizedmodules is explained in Section III. The proposed CRF cross-modal supervision framework, obtaining reliable radar objectannotations, is addressed in Section IV. In Section V, wepresent our self-collected CRUW dataset used for our trainingand evaluation. Then, the evaluation method and the experi-ments are shown in Section VI. Finally, we conclude our workin Section VII.
II. RELATED WORKS
A. Learning of Vision Data
Image-based object detection [1]–[4], [19]–[22], which isfundamental and crucial for many computer vision applica-tions, is aimed to detect every object with its class and precisebounding box location from RGB images. Given the objectdetection results, most tracking algorithms focus on exploiting
JOURNAL OF SELECTED TOPICS IN SIGNAL PROCESSING, VOL. X, NO. X, MARCH 2021 3
the associations between the detected object bounding boxes inconsecutive frames, the so-called tracking-by-detection frame-work [23]–[29]. Among them, the TrackletNet Tracker (TNT)[26] is an effective and robust tracker to perform multipleobject tracking (MOT) of the detected objects with a staticor moving camera. Once the same objects among severalconsecutive frames are associated, the missing and erroneousdetections can be recovered or corrected, resulting in bettersubsequent 3D localization performance. Thus, we implementthis tracking technique into the vision part of our framework.
Object 3D localization has attracted great interest in au-tonomous and assisted driving communities [5], [6], [30]–[32]. One idea is to localize vehicles by estimating their 3Dstructures using a CNN, e.g., 3D bounding boxes [5] and 3Dkeypoints [6], [32], [33]. A pre-defined 3D vehicle model isthen used to estimate the deformations, resulting in accurate3D keypoints and the vehicle location. Another idea [30],[31], however, tries to develop a real-time monocular structure-from-motion (SfM) system, taking into account different kindsof cues, including SfM cues (3D points and ground plane) andobject cues (bounding boxes and detection scores). Althoughthese works achieve favorable performance in object 3D local-ization, they only work for the vehicles since only the rigid-body vehicle structure is assumed. To overcome this limitation,an accurate and robust object 3D localization system, basedon the detected and tracked 2D bounding boxes of objects, isproposed in [7], which can work for most common movingobjects in the road scenes, such as cars, pedestrians, andcyclists. Thus, this monocular camera based 3D localizationsystem is adopted, fused with radar localization information,as our systematic camera annotation method to provide theground truth for RODNet training.
B. Learning of Radar Data
Significant research in radar object classification has demon-strated its feasibility as a good alternative when camerasfail to provide good sensing performance [34]–[40]. Withhandcrafted feature extraction, Heuel, et al. [34] classify radarobjects using a support vector machine (SVM) to distinguishcars and pedestrians. Moreover, Angelov et al. [35] use aneural network to extract features from the short-time Fouriertransform (STFT) heatmap of radar signals. However, theabove methods only focus on the classification tasks, whichassume only one object has been appropriately identified in thescene. Recently, a radar object detection method is proposedin [41], which combines a statistical constant false alarm rate(CFAR) [13] detection algorithm with a CNN-based VGG-16classifier [42]. All of the above approaches are not applica-ble to the complex driving scenarios with noisy backgroundreflections, e.g., trees, buildings, traffic signs, etc., and couldeasily give many false positives. Besides, the laborious humanannotations on the radar RF images required by these methodsare usually impossible to obtain.
Recently, the concept of cross-modal learning has beenproposed in the machine learning community [43]–[46]. Thisconcept is trying to transfer or fuse the information be-tween two different signal modalities to help train the neural
networks. Specifically, RF-Pose [47] introduces the cross-modal supervision idea into wireless signals to achieve humanpose estimation based on WiFi range radio signals, using acomputer vision technique, i.e., OpenPose [48], to system-atically generate annotations of human body keypoints fromthe camera. However, radar object detection is more challeng-ing: 1) Feature extraction for object detection (especially forclassification) is more difficult than human joint detection,which only classify different joints by their relative locationswithout considering object motion and texture information;2) The typical FMCW radars on the vehicles have muchless resolution than the WiFi array sensors used in RF-Pose.As for autonomous or assisted driving applications, Major etal. [49] propose an automotive radar based vehicle detectionmethod using LiDAR information for cross-modal learning.However, our work is different from theirs: 1) They onlyconsider vehicles as the target object class, while we detectpedestrians, cyclists, and cars; 2) The scenarios in their datasetare mostly highways without noisy obstacles, which is easierfor radar object detection, while we are dealing with muchmore diverse driving scenarios. Palffy et al. [50] propose aradar based, single-frame multi-class object detection method.However, they only consider the data from a single radarframe, which does not involve the object motion information.
C. Datasets
Datasets are important to validate the algorithms, especiallyfor the deep learning based methods. Since the first completeautonomous driving dataset, named KITTI [51], is published,larger and more advanced datasets are now available [16],[52], [53]. However, due to the hardware compatibility andless developed radar perception techniques, most datasets donot incorporate radar signals as a part of their sensor systems.Among the available radar datasets, nuScenes [16] and AstyxHiRes2019 [54] consider radar with good calibration andsynchronization with other sensors. But their radar data formatis based on sparse radar points that do not contain the usefulDoppler and surface texture information of objects. WhileOxford Radar RobotCar Dataset [55] contains dense radarpoint clouds, it does not provide any object annotations. Afterextensive research on the available datasets, we cannot find asuitable one that includes large-scale radar data in RF imageformat with labeled ground truth. Therefore, we collect ourCRUW dataset, which will be introduced in Section V.
III. RADAR OBJECT DETECTION
In this section, the student’s pipeline of our radar objectdetection is addressed. First, the raw radar signals are pre-transformed to RF images to be compatible with the image-based convolution neural networks (CNNs). After that, somespecial properties and challenges of RF images are analyzed.Second, the proposed RODNet is introduced with variousfunctional components. Third, two customized modules areadded to the RODNet to handle the above challenges. Finally, apost-processing method, called location-based non-maximumsuppression (L-NMS), is adopted to recover ConfMaps for thefinal detections.

JOURNAL OF SELECTED TOPICS IN SIGNAL PROCESSING, VOL. X, NO. X, MARCH 2021 4
FMCW Radar Signals Range Estimation RF Images
B
A
Range
C
Range
B
A
C
Range FFT
Angle FFTLPF
Fig. 2. The workflow of the RF image generation from the raw radar signals.
A. Radar Signal Processing and Properties
In this work, we use a common radar data representation,named radio frequency (RF) image, to represent our radarsignal reflections. RF images are in radar range-azimuth co-ordinates and can be described as a bird’s-eye view (BEV)representation, where the x-axis denotes azimuth (angle) andthe y-axis denotes range (distance). FMCW radar transmitscontinuous chirps and receives the reflected echoes from theobstacles. After the echoes are received and pre-processed, weimplement the fast Fourier transform (FFT) on the samples toestimate the range of the reflections. A low-pass filter (LPF)is then utilized to remove the high-frequency noise across allchirps in each frame at the rate of 30 FPS. After the LPF, weconduct a second FFT on the samples along different receiverantennas to estimate the azimuth angle of the reflectionsand obtain the final RF images. This RF image generationworkflow is shown in Fig. 2. After being transformed intoRF images, the radar data become a similar format as imagesequences, which can thus be directly processed by an image-based CNN.
Moreover, radio frequency data have the following specialproperties to be handled for the object detection task.
• Rich motion information. According to the Dopplerprinciple of the radio signal, rich motion information isincluded. The objects’ speed and its law of variation overtime is dependent on their surface texture information,size and shape details, etc. For example, the motioninformation of a non-rigid body, like a pedestrian, isusually widely distributed, while for a rigid body, likea car, it should be more consistent due to the Dopplereffect. To better utilize the temporal information, we needto consider multiple consecutive radar frames, instead ofone single frame, as the system input.
• Inconsistent resolution. Radar usually has high-resolution in range but low-resolution in azimuth angledue to the limitation of radar hardware specifications, likethe number of antennas and the distances among them.
• Complex numbers. Radio signals are usually representedas complex numbers containing frequency and phaseinformation. This kind of data is unusual to be modeledby a typical CNN architecture.
According to the above properties, the proposed radar objectdetection method needs to have the following capabilities:1) Extract temporal information; 2) Handle multiple spatial
scales; 3) Be able to deal with complex number data. Thesecapabilities.
B. RODNet Architecture
There are three functional components adopted in construct-ing the network architecture of the RODNet, as shown inFig. 3 (a)-(c), which is implemented based on a 3D CNNwith an autoencoder structure. More specifically, our RODNetstarts with a naıve version of a 3D CNN autoencoder network,shown in Fig. 3 (a). Then, built upon an hourglass based au-toencoder [18], shown in Fig. 3 (b), where skip connections areadded to transmit the features directly from bottom layers totop layers. We further add the temporal inception convolutionlayers to extract different lengths of temporal features fromthe input RF image sequence, inspired by the spatial inceptionconvolution layer proposed in [56], shown in Fig. 3 (c).
The input of our network is a snippet of RF images Rwith dimension (CRF , T, n,H,W ), where CRF is the numberof channels in each complex-numbered RF images, referring[47], where the real and imaginary values are treated as twodifferent channels in one RF image, i.e., CRF = 2; T is thenumber of RF image frames in the snippet; n is the numberof chirps in each frame; H and W are the height and widthof the RF images, respectively.
After passing through the network, ConfMaps D withdimension (Ccls, T,H,W ) are predicted, where Ccls is thenumber of object classes. Note that RODNet predicts separateConfMaps for each object class of radar RF images. Withsystematically derived binary annotations using the teacher’spipeline described in Section IV, we can train our RODNetusing binary cross-entropy loss,
` = −∑cls
∑i,j
Dclsi,j log Dcls
i,j +(1−Dcls
i,j
)log(
1− Dclsi,j
).
(1)Here, D represents the ConfMaps generated from CRF anno-tations, D represents the predicted ConfMaps, (i, j) representsthe pixel indices, and cls is the class label.
C. M-Net Module
Besides the temporal features across different frames ineach RF snippet, all the information from different chirpscontributes to the features for radar object detection. In order tobetter integrate this dynamic information from different chirps,we propose a customized module, called M-Net, before the RFsnippets are sent into the RODNet. As shown in Fig. 3 (d),the RF images of one frame with n chirps are sent into M-Netwith a dimension of (CRF , n,H,W ), where CRF = 2. First,a temporal convolution is applied to extract temporal featuresamong the n chirps. This M-Net CNN operation performslike a Doppler compensated FFT to extract dynamic motionfeatures but can be trained end-to-end in the deep learningarchitecture. Then, to merge the features from n chirps intoone, a temporal max-pooling layer is applied. Finally, theoutput of M-Net is the extracted radar frame features witha dimension of (C1, H,W ), where C1 is the number of filtersfor the temporal convolution. After M-Net is applied to each

JOURNAL OF SELECTED TOPICS IN SIGNAL PROCESSING, VOL. X, NO. X, MARCH 2021 5
(a) Vanilla RODNet
RF Image Sequence
(n CPF)
(b) RODNet with Skip Connections (HG) (c) RODNet (HG) with Temporal Inception CNN
range
azim
uth
chirp
(2, n, H, W)
(w, 1, 1)
range
azim
uth
Temporal Max-pooling
TemporalConvolution
(C1, H, W)(C1, n/2, H, W)
(d) M-Net Module for Chirp Merging
RF Images in OneFrame (n CPF)
Extracted RadarFrame Features
Offset Field Frame
Offsets
Temporal DeformableConvolution
(C1, T, H, W)
(2N, T, H,W)
(C2, T, H, W)
(e) Temporal Deformable Convolution (TDC) Module
M-Net
RF Image Sequence
(n CPF)
M-Net
Conv3D/TDC Batch Normalization ReLU Conv3D Transpose PReLU Inception
Conv3D
RF Image Sequence
(n CPF)
M-Net
Fig. 3. The architecture and modules of our proposed RODNet. Three different components of the RODNet are all implemented based on the 3D CNN/TDCand autoencoder network, as shown in (a), (b), and (c). The input of the RODNet is RF images with n chirps per frame (CPF). When n = 1, we select onlyone chirp’s data randomly to feed into the RODNet, while for n > 1, the M-Net module is implemented to merge the data from different chirps in this frame.The M-Net module, described in (d), takes one frame with multiple radar chirps as input and outputs this frame’s merged features. Moreover, the temporaldeformable convolution (TDC) module in (e) is introduced to handle the radar object dynamic motion within the input RF image sequence.
radar frame, the extracted features from all the frames in theinput snippet are concatenated along time and sent as the inputto the subsequent RODNet, as shown in Fig. 3 (a)-(c).
D. Temporal Deformable ConvolutionAs mentioned in Section III-B, the input of the RODNet
is a snippet of RF images after features are merged by theM-Net. Thus, during this period, locations of the objects inthe radar range-azimuth coordinates may be shifted due toobject relative motion, which means the reflection patternsin RF images may change their locations within the snippet.However, the classical 3D convolution can only capture thestatic features within a regular cuboid. Therefore it is not thebest feature extractor for the RF snippets with object’s relativemotion.
Recently, Dai et al. [57] propose a new convolution network,named deformable convolution network (DCN), for image-based object detection to handle the deformed objects withinthe images. In the deformable convolution, the original con-volution grid is deformable in the sense that each grid point isshifted by a learnable offset, and the convolution is operatedon these shifted grid points.
Inspired by DCN, we generalize the deformed kernel to the3D CNN and name this novel operator as temporal deformableconvolution (TDC). Use the 3D CNN with kernel size of(3, 3, 3) and dilation 1 as an example, the regular receptivefield R can be defined as
R = {(−1,−1,−1), (−1, 0, 0), · · · , (0, 1, 1), (1, 1, 1)}. (2)
For each location p0 on the output feature map y, the classical3D convolution can be described as
y(p0) =∑
pn∈Rw(pn) · x(p0 + pn), (3)
where w is the convolution kernel weight, x is the inputfeature map, and pn enumerates the locations in R.
In order to handle the object dynamic motion in the temporaldomain, we propose TDC by adding an additional offset field{∆pn}Nn=1, where N = |R| is the size of the receptive field.So that Eq. 3 becomes
y(p0) =∑
pn∈Rw(pn) · x(p0 + pn + ∆pn). (4)
Note that the offset field ∆pn is only deformed within eachtemporal location, i.e., the receptive location of a certain framewill not be deformed to other frames so that the temporaldomain of the offset field is always zero. To simplify theimplementation process, the offset vectors are defined as 2Dvectors so that the overall offset field has a dimension of(2N,T,H,W ). An illustration of our proposed TDC is shownin Fig. 3 (e).
Similar to [57], since the offset field ∆pn is typicallyfractional, Eq. 4 is implemented via bilinear interpolation as
x(p) =∑q
G(q,p) · x(q), (5)
where p = p0+pn+∆pn is the fractional location; q enumer-ates all integer locations in the 3D feature map x; and G is the
JOURNAL OF SELECTED TOPICS IN SIGNAL PROCESSING, VOL. X, NO. X, MARCH 2021 6
0.1 0.2 0.3 0.1 0 0 0 0
0.1 0.3 0.7 0.3 0.1 0 0
0.2 0.7 0.5 0.6 0.3 0.1 0 0
0.4 0.6 0.5 0.3 0.1 0.1 0
0.2 0.4 0.4 0.3 0.1 0 0 0
0 0.1 0.1 0.1 0.2 0.2 0.1 0
0 0 0 0.2 0.4 0.2 0
0 0 0 0.2 0.3 0.3 0.2 0
0.9
0.8
0.7Final Peaks
Suppressed Peaks
0.2 0.7 0.5
0.4 0.6
0.2 0.4 0.4
0.9
8-Neighbor Peak
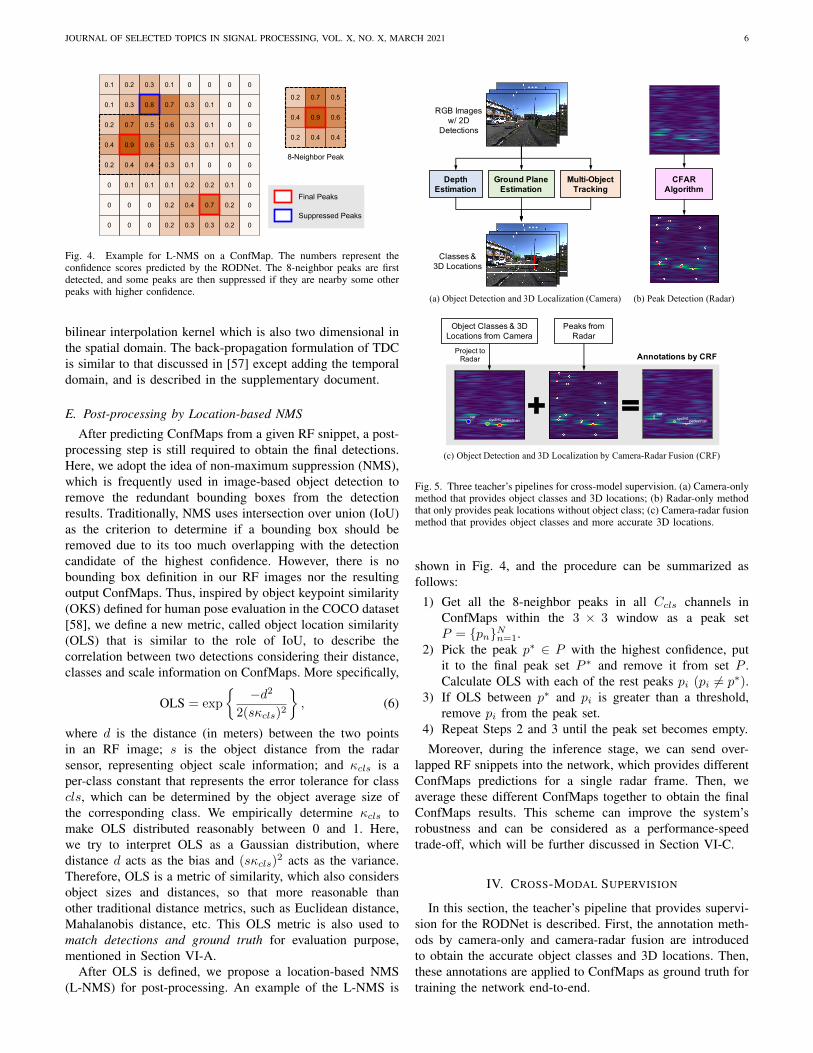
Fig. 4. Example for L-NMS on a ConfMap. The numbers represent theconfidence scores predicted by the RODNet. The 8-neighbor peaks are firstdetected, and some peaks are then suppressed if they are nearby some otherpeaks with higher confidence.
bilinear interpolation kernel which is also two dimensional inthe spatial domain. The back-propagation formulation of TDCis similar to that discussed in [57] except adding the temporaldomain, and is described in the supplementary document.
E. Post-processing by Location-based NMS
After predicting ConfMaps from a given RF snippet, a post-processing step is still required to obtain the final detections.Here, we adopt the idea of non-maximum suppression (NMS),which is frequently used in image-based object detection toremove the redundant bounding boxes from the detectionresults. Traditionally, NMS uses intersection over union (IoU)as the criterion to determine if a bounding box should beremoved due to its too much overlapping with the detectioncandidate of the highest confidence. However, there is nobounding box definition in our RF images nor the resultingoutput ConfMaps. Thus, inspired by object keypoint similarity(OKS) defined for human pose evaluation in the COCO dataset[58], we define a new metric, called object location similarity(OLS) that is similar to the role of IoU, to describe thecorrelation between two detections considering their distance,classes and scale information on ConfMaps. More specifically,
OLS = exp
{−d2
2(sκcls)2
}, (6)
where d is the distance (in meters) between the two pointsin an RF image; s is the object distance from the radarsensor, representing object scale information; and κcls is aper-class constant that represents the error tolerance for classcls, which can be determined by the object average size ofthe corresponding class. We empirically determine κcls tomake OLS distributed reasonably between 0 and 1. Here,we try to interpret OLS as a Gaussian distribution, wheredistance d acts as the bias and (sκcls)
2 acts as the variance.Therefore, OLS is a metric of similarity, which also considersobject sizes and distances, so that more reasonable thanother traditional distance metrics, such as Euclidean distance,Mahalanobis distance, etc. This OLS metric is also used tomatch detections and ground truth for evaluation purpose,mentioned in Section VI-A.
After OLS is defined, we propose a location-based NMS(L-NMS) for post-processing. An example of the L-NMS is
Depth Estimation
RGB Images w/ 2D
Detections
Ground Plane Estimation
Multi-Object Tracking
…
…
…
…Classes &
3D Locations
(a) Object Detection and 3D Localization (Camera)
CFAR Algorithm
(b) Peak Detection (Radar)
Object Classes & 3D Locations from Camera
car cyclist pedestrian
Peaks from Radar
carcyclist pedestrian
Annotations by CRF
(c) Object Detection and 3D Localization by Camera-Radar Fusion (CRF)
Project to Radar
Fig. 5. Three teacher’s pipelines for cross-model supervision. (a) Camera-onlymethod that provides object classes and 3D locations; (b) Radar-only methodthat only provides peak locations without object class; (c) Camera-radar fusionmethod that provides object classes and more accurate 3D locations.
shown in Fig. 4, and the procedure can be summarized asfollows:
1) Get all the 8-neighbor peaks in all Ccls channels inConfMaps within the 3 × 3 window as a peak setP = {pn}Nn=1.
2) Pick the peak p∗ ∈ P with the highest confidence, putit to the final peak set P ∗ and remove it from set P .Calculate OLS with each of the rest peaks pi (pi 6= p∗).
3) If OLS between p∗ and pi is greater than a threshold,remove pi from the peak set.
4) Repeat Steps 2 and 3 until the peak set becomes empty.
Moreover, during the inference stage, we can send over-lapped RF snippets into the network, which provides differentConfMaps predictions for a single radar frame. Then, weaverage these different ConfMaps together to obtain the finalConfMaps results. This scheme can improve the system’srobustness and can be considered as a performance-speedtrade-off, which will be further discussed in Section VI-C.
IV. CROSS-MODAL SUPERVISION
In this section, the teacher’s pipeline that provides supervi-sion for the RODNet is described. First, the annotation meth-ods by camera-only and camera-radar fusion are introducedto obtain the accurate object classes and 3D locations. Then,these annotations are applied to ConfMaps as ground truth fortraining the network end-to-end.

JOURNAL OF SELECTED TOPICS IN SIGNAL PROCESSING, VOL. X, NO. X, MARCH 2021 7
A. Camera-Only (CO) Supervision
Object detection and 3D localization have been exploredby researchers in computer vision community for many years.Here, we use Mask R-CNN [3] as our image-based objectdetector, which can provide object classes, bounding boxes,and their instance masks. While, object 3D localization is morechallenging due to the loss of the depth information duringthe camera projection from the 3D world into 2D images.To recover the 3D information from 2D images, we takeadvantage of a recent work on an effective and robust systemfor visual object 3D localization based on a monocular camera[7]. The proposed system takes a CNN inferred depth mapas the input, incorporating adaptive ground plane estimationand multi-object tracking results, to effectively estimate objectclasses and 3D locations relative to the camera. The mainstrength of this camera-only system is that it can robustlyestimate objects’ 3D locations purely from monocular videos,resulting in a very low requirement on the visual data used forannotation, i.e., one single camera is good enough to obtainthe annotation results. The rational behind this capabilitycan be described in three folds: 1) Depth estimation usedin the system is self-supervised by the stereo image pairsduring training, so as to provide the absolute scale informationmissing in the monocular camera systems; 2) Adaptive groundplane estimation, based on sparse detected object feet pointsand dense semantic segmented ground points, is proposed tohandle inaccurate depth within each frame; 3) A multi-objecttracking technique is incorporated to address the inter-framebias issue and temporally smooth the object 3D trajectories.A simplified illustration of the monocular camera object 3Dlocalization system proposed in [7] is shown in Fig. 5 (a).Stereo cameras can also be used for object 3D localization,however, high computational cost and sensitivity to camerasetup configurations (e.g., baseline distance) result in thelimitation of the stereo object 3D localization system.
However, as also observed in [59], the above camera-only system may not be accurate enough after transformingto the radar’s range-azimuth coordinates because: 1) Thesystematic bias in the camera-radar sensor system that thepeaks in the RF images may not be consistent with the 3Dgeometric center of the object; 2) Cameras’ performance canbe easily affected by lighting or weather conditions. Since wedo have the radar information available, camera-radar cross-calibration and supervision should be used. Therefore, an evenmore accurate self-annotation method, based on camera-radarfusion, is required for training the RODNet.
B. Camera-Radar Fusion (CRF) Supervision
An intuitive way of improving the above camera-onlyannotation is by taking advantage of radar, which has aplausible capability of range estimation without any systematicbias. Here, we adopt the Constant False Alarm Rate (CFAR)detection algorithm [13], which is commonly used in signalprocessing to detect peaks in the RF image. As shown inFig. 5 (b), CFAR algorithm can detect several peaks in theRF image, denoted as red dots. However, these detected peakscannot be directly used as supervision because 1) CFAR
algorithm cannot provide the object classes for each detection;2) CFAR algorithm usually gives a large number of falsepositive detections. Thus, an object localization method bycamera-radar fusion strategy is needed to address these issues.
Fig. 5 (c) illustrates the camera-radar fusion (CRF) pipeline,where the classes and 3D locations of the detected objects fromthe camera are first passed through a transformation to projectthe detections from 3D camera coordinates to radar range-azimuth coordinates. The transformation can be formulated as
ρc =√
(xc − xor)2 + (zc − zor)2,
θc = tan−1(xc − xorzc − zor
),
(7)
where (ρc, θc) denotes the projected location in radar range-azimuth coordinates; (xc, zc) denotes the object location in thecamera BEV coordinates; and (xor, zor) denotes the locationof radar origin in the camera BEV coordinates, aligned fromthe sensor system calibration. The peak detections from theCFAR algorithm are also involved in the same radar range-azimuth coordinates. Finally, the fusion algorithm is appliedto estimate the final annotations on the input RF image.
After the coordinates between the camera and radar arealigned, a probabilistic CRF algorithm is further developedto achieve a more reliable and systematic annotation perfor-mance. The basic idea of this algorithm is to generate twoprobability maps for camera and radar locations separately,and then fuse them by element-wise product. The probabilitymap for camera locations with object class cls is generated by
Pc(cls)(x) = maxi
{N(
12π√|Σc
i(cls)| exp
{− 1
2 (x− µci )>(Σci(cls))
−1(x− µci )})}
,
µci =
[ρciθci
],Σc
i(cls) =
[(dis(cls)/ci
)20
0 δ(cls)
]. (8)
Here, di is the object depth, s(cls) is the scale constant, ci isthe depth confidence, and δ(cls) is the typical azimuth errorfor camera localization. N (·) represents the normalizationoperation for each object’s probability map. Similarly, theprobability map for radar locations is generated by
Pr(x) = maxj
{N(
1
2π√|Σr
j |exp
{− 1
2 (x− µrj)>(Σrj)−1(x− µrj)
})},
µrj =
[ρrjθrj
],Σr
j =
[δrj 00 ε(θrj )
]. (9)
Here, δrj is the radar’s range resolution, and ε(·) is the radar’sazimuth resolution. Then, an element-wise product is used toobtain the fused probability map for each class,
PCRF(cls) (x) = P c(cls)(x) ∗ P r(x). (10)
Finally, the fused annotations are derived from the fusedprobability maps PCRF by peak detection.
The object 3D localization accuracy of both CO and CRFannotation is discussed later in Section VI-B.
JOURNAL OF SELECTED TOPICS IN SIGNAL PROCESSING, VOL. X, NO. X, MARCH 2021 8
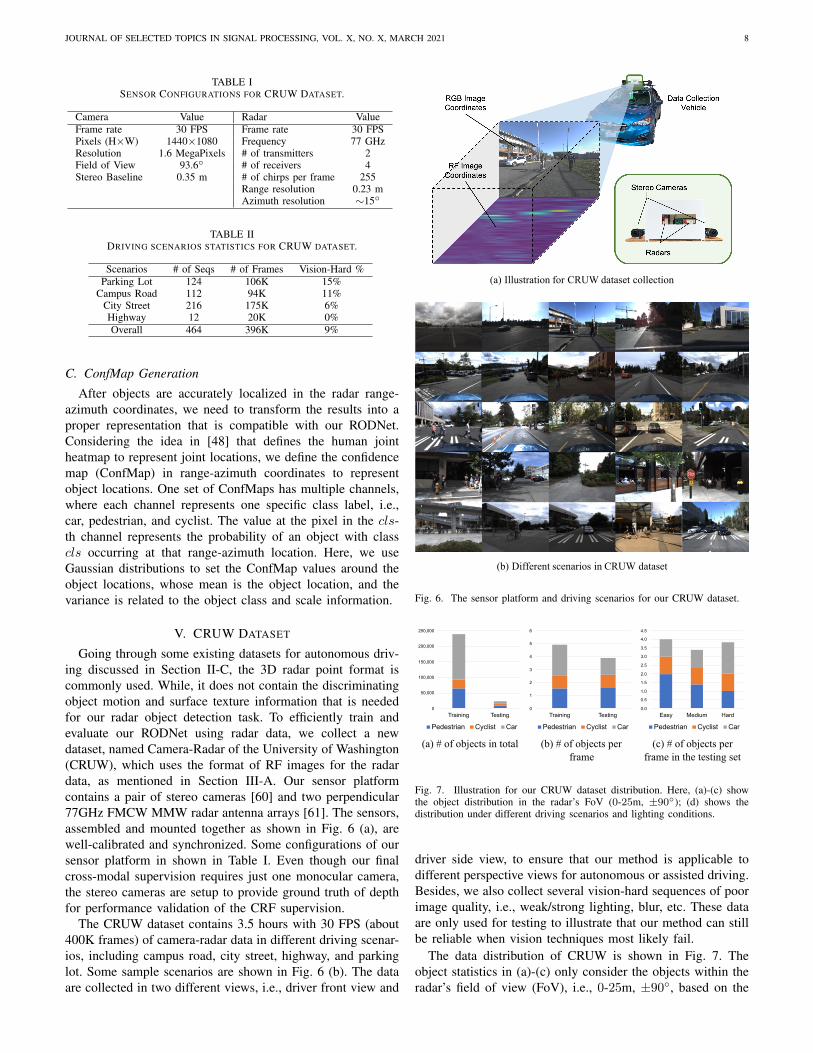
TABLE ISENSOR CONFIGURATIONS FOR CRUW DATASET.
Camera Value Radar ValueFrame rate 30 FPS Frame rate 30 FPSPixels (H×W) 1440×1080 Frequency 77 GHzResolution 1.6 MegaPixels # of transmitters 2Field of View 93.6◦ # of receivers 4Stereo Baseline 0.35 m # of chirps per frame 255
Range resolution 0.23 mAzimuth resolution ∼15◦
TABLE IIDRIVING SCENARIOS STATISTICS FOR CRUW DATASET.
Scenarios # of Seqs # of Frames Vision-Hard %Parking Lot 124 106K 15%
Campus Road 112 94K 11%City Street 216 175K 6%Highway 12 20K 0%Overall 464 396K 9%
C. ConfMap Generation
After objects are accurately localized in the radar range-azimuth coordinates, we need to transform the results into aproper representation that is compatible with our RODNet.Considering the idea in [48] that defines the human jointheatmap to represent joint locations, we define the confidencemap (ConfMap) in range-azimuth coordinates to representobject locations. One set of ConfMaps has multiple channels,where each channel represents one specific class label, i.e.,car, pedestrian, and cyclist. The value at the pixel in the cls-th channel represents the probability of an object with classcls occurring at that range-azimuth location. Here, we useGaussian distributions to set the ConfMap values around theobject locations, whose mean is the object location, and thevariance is related to the object class and scale information.
V. CRUW DATASET
Going through some existing datasets for autonomous driv-ing discussed in Section II-C, the 3D radar point format iscommonly used. While, it does not contain the discriminatingobject motion and surface texture information that is neededfor our radar object detection task. To efficiently train andevaluate our RODNet using radar data, we collect a newdataset, named Camera-Radar of the University of Washington(CRUW), which uses the format of RF images for the radardata, as mentioned in Section III-A. Our sensor platformcontains a pair of stereo cameras [60] and two perpendicular77GHz FMCW MMW radar antenna arrays [61]. The sensors,assembled and mounted together as shown in Fig. 6 (a), arewell-calibrated and synchronized. Some configurations of oursensor platform in shown in Table I. Even though our finalcross-modal supervision requires just one monocular camera,the stereo cameras are setup to provide ground truth of depthfor performance validation of the CRF supervision.
The CRUW dataset contains 3.5 hours with 30 FPS (about400K frames) of camera-radar data in different driving scenar-ios, including campus road, city street, highway, and parkinglot. Some sample scenarios are shown in Fig. 6 (b). The dataare collected in two different views, i.e., driver front view and
(a) Illustration for CRUW dataset collection
(b) Different scenarios in CRUW dataset
Fig. 6. The sensor platform and driving scenarios for our CRUW dataset.
0
1
2
3
4
5
6
Training Testing
Pedestrian Cyclist Car
0.0
0.5
1.0
1.5
2.0
2.5
3.0
3.5
4.0
4.5
Easy Medium Hard
Pedestrian Cyclist Car
(a) # of objects in total (b) # of objects perframe
(c) # of objects perframe in the testing set
0
50,000
100,000
150,000
200,000
250,000
Training Testing
Pedestrian Cyclist Car
Fig. 7. Illustration for our CRUW dataset distribution. Here, (a)-(c) showthe object distribution in the radar’s FoV (0-25m, ±90◦); (d) shows thedistribution under different driving scenarios and lighting conditions.
driver side view, to ensure that our method is applicable todifferent perspective views for autonomous or assisted driving.Besides, we also collect several vision-hard sequences of poorimage quality, i.e., weak/strong lighting, blur, etc. These dataare only used for testing to illustrate that our method can stillbe reliable when vision techniques most likely fail.
The data distribution of CRUW is shown in Fig. 7. Theobject statistics in (a)-(c) only consider the objects within theradar’s field of view (FoV), i.e., 0-25m, ±90◦, based on the
JOURNAL OF SELECTED TOPICS IN SIGNAL PROCESSING, VOL. X, NO. X, MARCH 2021 9
RG
B Im
ages
RF
Imag
esR
OD
Net
Res
ults
(a) (b) (c) (d) (e) (f) (g)
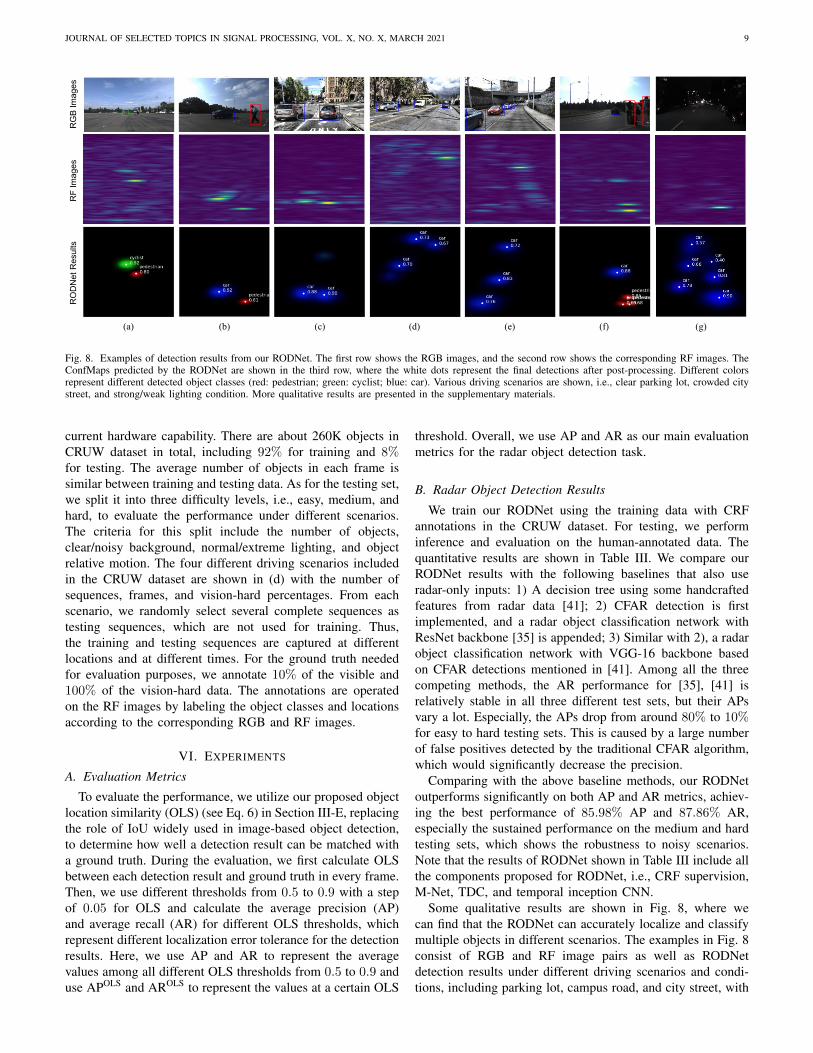
Fig. 8. Examples of detection results from our RODNet. The first row shows the RGB images, and the second row shows the corresponding RF images. TheConfMaps predicted by the RODNet are shown in the third row, where the white dots represent the final detections after post-processing. Different colorsrepresent different detected object classes (red: pedestrian; green: cyclist; blue: car). Various driving scenarios are shown, i.e., clear parking lot, crowded citystreet, and strong/weak lighting condition. More qualitative results are presented in the supplementary materials.
current hardware capability. There are about 260K objects inCRUW dataset in total, including 92% for training and 8%for testing. The average number of objects in each frame issimilar between training and testing data. As for the testing set,we split it into three difficulty levels, i.e., easy, medium, andhard, to evaluate the performance under different scenarios.The criteria for this split include the number of objects,clear/noisy background, normal/extreme lighting, and objectrelative motion. The four different driving scenarios includedin the CRUW dataset are shown in (d) with the number ofsequences, frames, and vision-hard percentages. From eachscenario, we randomly select several complete sequences astesting sequences, which are not used for training. Thus,the training and testing sequences are captured at differentlocations and at different times. For the ground truth neededfor evaluation purposes, we annotate 10% of the visible and100% of the vision-hard data. The annotations are operatedon the RF images by labeling the object classes and locationsaccording to the corresponding RGB and RF images.
VI. EXPERIMENTS
A. Evaluation Metrics
To evaluate the performance, we utilize our proposed objectlocation similarity (OLS) (see Eq. 6) in Section III-E, replacingthe role of IoU widely used in image-based object detection,to determine how well a detection result can be matched witha ground truth. During the evaluation, we first calculate OLSbetween each detection result and ground truth in every frame.Then, we use different thresholds from 0.5 to 0.9 with a stepof 0.05 for OLS and calculate the average precision (AP)and average recall (AR) for different OLS thresholds, whichrepresent different localization error tolerance for the detectionresults. Here, we use AP and AR to represent the averagevalues among all different OLS thresholds from 0.5 to 0.9 anduse APOLS and AROLS to represent the values at a certain OLS
threshold. Overall, we use AP and AR as our main evaluationmetrics for the radar object detection task.
B. Radar Object Detection Results
We train our RODNet using the training data with CRFannotations in the CRUW dataset. For testing, we performinference and evaluation on the human-annotated data. Thequantitative results are shown in Table III. We compare ourRODNet results with the following baselines that also useradar-only inputs: 1) A decision tree using some handcraftedfeatures from radar data [41]; 2) CFAR detection is firstimplemented, and a radar object classification network withResNet backbone [35] is appended; 3) Similar with 2), a radarobject classification network with VGG-16 backbone basedon CFAR detections mentioned in [41]. Among all the threecompeting methods, the AR performance for [35], [41] isrelatively stable in all three different test sets, but their APsvary a lot. Especially, the APs drop from around 80% to 10%for easy to hard testing sets. This is caused by a large numberof false positives detected by the traditional CFAR algorithm,which would significantly decrease the precision.
Comparing with the above baseline methods, our RODNetoutperforms significantly on both AP and AR metrics, achiev-ing the best performance of 85.98% AP and 87.86% AR,especially the sustained performance on the medium and hardtesting sets, which shows the robustness to noisy scenarios.Note that the results of RODNet shown in Table III include allthe components proposed for RODNet, i.e., CRF supervision,M-Net, TDC, and temporal inception CNN.
Some qualitative results are shown in Fig. 8, where wecan find that the RODNet can accurately localize and classifymultiple objects in different scenarios. The examples in Fig. 8consist of RGB and RF image pairs as well as RODNetdetection results under different driving scenarios and condi-tions, including parking lot, campus road, and city street, with

JOURNAL OF SELECTED TOPICS IN SIGNAL PROCESSING, VOL. X, NO. X, MARCH 2021 10
TABLE IIIRADAR OBJECT DETECTION PERFORMANCE EVALUATED ON CRUW DATASET.
Methods Overall Easy Medium HardAP AR AP AR AP AR AP AR
Decision Tree [41] 4.70 44.26 6.21 47.81 4.63 43.92 3.21 37.02CFAR+ResNet [35] 40.49 60.56 78.92 85.26 11.00 33.02 6.84 36.65CFAR+VGG-16 [41] 40.73 72.88 85.24 88.97 47.21 62.09 10.97 45.03
RODNet (Ours) 85.98 87.86 96.97 98.02 76.11 78.57 67.28 72.60
TABLE IVABLATION STUDIES ON THE PERFORMANCE IMPROVEMENT BY SEVERAL FUNCTIONAL COMPONENTS IN THE RODNET.
Backbone Supervision M-Net TDC Inception AP AP0.5 AP0.7 AP0.9 AR AR0.5 AR0.7 AR0.9
Vanilla
CO 52.62 78.21 54.66 18.92 63.95 84.13 68.76 30.71CRF 74.29 78.42 76.06 64.58 77.85 80.05 78.93 71.72CRF X 78.36 82.73 81.03 65.82 81.54 84.51 83.39 73.53CRF X X 79.86 84.08 82.37 66.74 82.85 86.06 84.43 73.93
Hourglass
CO 73.86 80.34 74.94 61.16 79.87 83.94 80.73 71.39CO X 77.75 82.88 79.93 61.88 81.11 85.13 82.78 68.63
CRF 81.10 84.71 83.08 70.21 84.26 86.54 85.42 77.44CRF X 83.37 87.51 86.04 71.11 85.64 88.55 87.19 77.37CRF X 83.76 87.99 86.00 70.88 85.62 88.79 87.37 76.26CRF X X 84.38 88.69 85.73 73.31 86.97 89.67 88.14 79.59CRF X X X 85.98 88.77 87.78 76.34 87.86 89.93 89.02 81.26
Fig. 9. Performance of vision-based and our RODNet on hard testing setwith different OLS thresholds, representing localization error tolerance. (CO:camera-only; CRF: camera-radar fusion; V: visible data; VH: vision-harddata.)
different lighting conditions. Some other examples to show thespecial strengths of our RODNet are shown in Section VI-D.
To illustrate our teacher’s pipeline is qualified for thiscross-supervision task, we evaluate the object 3D localizationperformance for both CO and CRF annotations in Table V.Besides, we also compare the performance between CO/CRFsupervision and our RODNet on both visible (V) and vision-hard (VH) data. The results are shown in Fig. 9 with respectto different OLS thresholds. From Fig. 9, the performanceof the vision-based method drops significantly given a tighterOLS threshold, while our RODNet shows its superiority androbustness on its localization performance. Moreover, theRODNet can still maintain the performance on vision-fail datawhere the vision-based methods have a hard time to maintainthe performance.
TABLE VTHE MEAN LOCALIZATION ERROR (STANDARD DEVIATION) OF CO/CRF
ANNOTATIONS ON CRUW DATASET (IN METERS).
Supervision Pedestrian Cyclist CarCO 0.69 (±0.77) 0.87 (±0.89) 1.57 (±1.12)
CRF 0.67 (±0.55) 0.82 (±0.59) 1.26 (±0.64)
Real-time Not real-time
16
16
8 4 2 1
84
2
168
4 2
Fig. 10. Performance-speed trade-off for real-time implementation. Here, theinference time of less than 100 ms is used as the real-time criterion. We usethe snippet length of 16, and the numbers beside the markers are the stepsbetween each two overlapped RF snippets.
C. Ablation Studies
In this section, we analyze the performance-speed trade-offof several components of the RODNet and dive into somedetails to show how our method can accomplish this radarobject detection task very well.
JOURNAL OF SELECTED TOPICS IN SIGNAL PROCESSING, VOL. X, NO. X, MARCH 2021 11
1) Performance-Speed Trade-off of the RODNet: Since ourRODNet starts with an M-Net chirp-merged input to thevanilla autoencoder with 3D convolution layers, further addedwith skip connections in hourglass (HG) structure and incep-tion convolution layers, and eventually with TDC incorpora-tion, it is important to know the performance influence of eachfunctional module, as well as the computational complexitiesinvolved.
First of all, APs under different OLS thresholds are evalu-ated in Table IV. Here, we use different combinations of thebackbones, supervision, and other modules in the RODNet.2
From the results in the table, the following conclusions can bereached: 1) The performance of the HG backbone is better thanthe vanilla backbone by around 5%. 2) Training the RODNetusing CRF supervision can improve the performance by about8%. 3) The customized modules, i.e., M-Net and TDC, alongwith temporal inception, can also each improve the detectionperformance by approximately 1%− 2%, respectively.
Moreover, real-time implementation is essential for au-tonomous or assisted driving applications. As mentioned inSection III-E, we use different overlapping lengths of RFframes during the inference. With more overlapped frames,more robust detection results from the RODNet can beachieved, however, the inference time will also increase. Thetraining and inference of the RODNet models are run on anNVIDIA Quadro GV100 GPU, and the time consumed isreported in Fig. 10. Here, we show the AP of three buildingarchitectures (Vanilla, HG, and HG with temporal inception)for the RODNet, and use 100 ms as a reasonable real-timethreshold. The results illustrate that the RODNet with therelatively simpler vanilla backbone can achieve real-time andfinish the prediction within 100 ms. As for the HG backbone,it steps across the real-time threshold when the overlappinglength increases. Moreover, HG without temporal inceptionlayers is slightly faster than HG with all network components.
5 10 15 20 25 30Snippet Length
70
75
80
85
AP (%
)
2 4 6 8 10 12Number of Chirps
80
81
82
83
84
85
AP (%
)
(a) AP for different snippet lengths
(b) AP for different numbers of chirps
Fig. 12. Results of different RF snip-pet length and number of chirps.
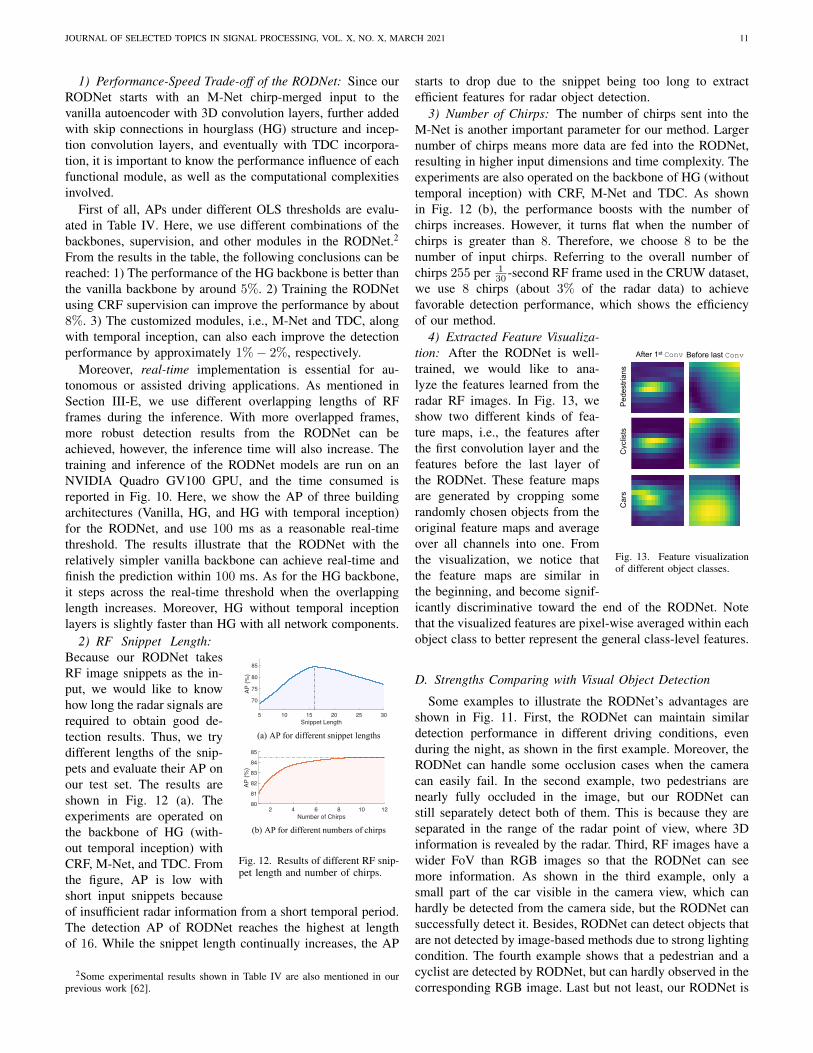
2) RF Snippet Length:Because our RODNet takesRF image snippets as the in-put, we would like to knowhow long the radar signals arerequired to obtain good de-tection results. Thus, we trydifferent lengths of the snip-pets and evaluate their AP onour test set. The results areshown in Fig. 12 (a). Theexperiments are operated onthe backbone of HG (with-out temporal inception) withCRF, M-Net, and TDC. Fromthe figure, AP is low withshort input snippets becauseof insufficient radar information from a short temporal period.The detection AP of RODNet reaches the highest at lengthof 16. While the snippet length continually increases, the AP
2Some experimental results shown in Table IV are also mentioned in ourprevious work [62].
starts to drop due to the snippet being too long to extractefficient features for radar object detection.
3) Number of Chirps: The number of chirps sent into theM-Net is another important parameter for our method. Largernumber of chirps means more data are fed into the RODNet,resulting in higher input dimensions and time complexity. Theexperiments are also operated on the backbone of HG (withouttemporal inception) with CRF, M-Net and TDC. As shownin Fig. 12 (b), the performance boosts with the number ofchirps increases. However, it turns flat when the number ofchirps is greater than 8. Therefore, we choose 8 to be thenumber of input chirps. Referring to the overall number ofchirps 255 per 1
30 -second RF frame used in the CRUW dataset,we use 8 chirps (about 3% of the radar data) to achievefavorable detection performance, which shows the efficiencyof our method.
Pede
stria
nsC
yclis
tsC
ars
After 1st Conv Before last Conv
Fig. 13. Feature visualizationof different object classes.
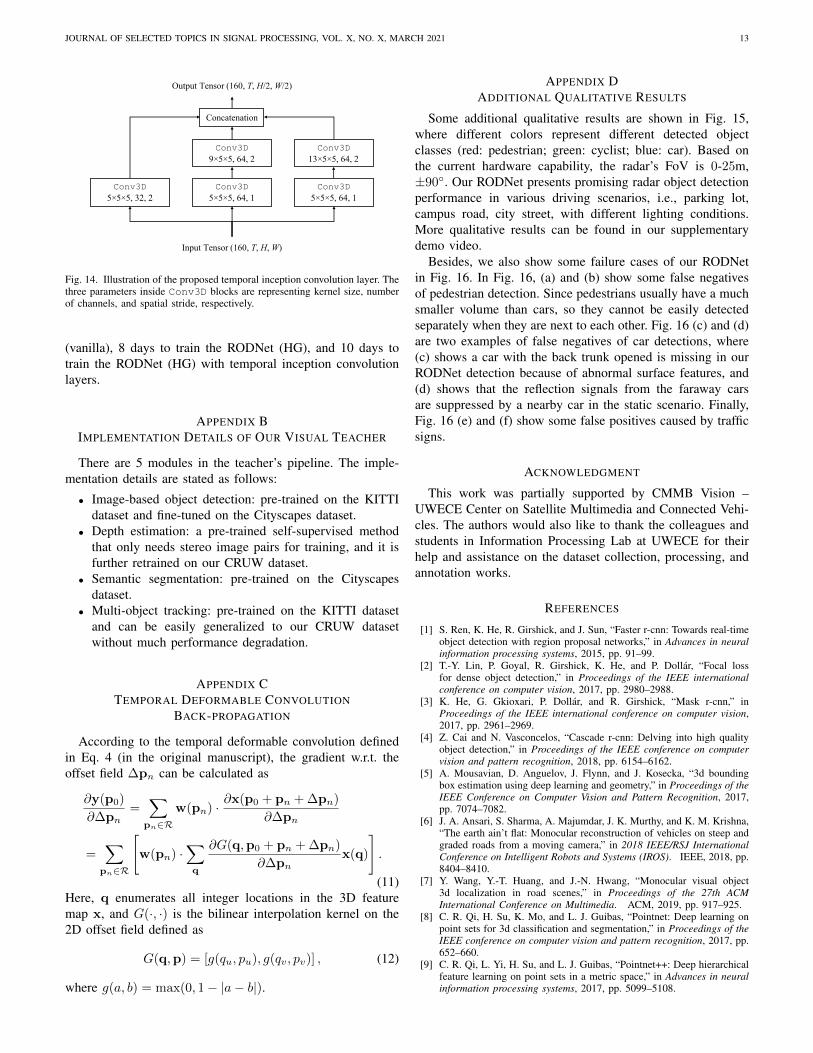
4) Extracted Feature Visualiza-tion: After the RODNet is well-trained, we would like to ana-lyze the features learned from theradar RF images. In Fig. 13, weshow two different kinds of fea-ture maps, i.e., the features afterthe first convolution layer and thefeatures before the last layer ofthe RODNet. These feature mapsare generated by cropping somerandomly chosen objects from theoriginal feature maps and averageover all channels into one. Fromthe visualization, we notice thatthe feature maps are similar inthe beginning, and become signif-icantly discriminative toward the end of the RODNet. Notethat the visualized features are pixel-wise averaged within eachobject class to better represent the general class-level features.
D. Strengths Comparing with Visual Object Detection
Some examples to illustrate the RODNet’s advantages areshown in Fig. 11. First, the RODNet can maintain similardetection performance in different driving conditions, evenduring the night, as shown in the first example. Moreover, theRODNet can handle some occlusion cases when the cameracan easily fail. In the second example, two pedestrians arenearly fully occluded in the image, but our RODNet canstill separately detect both of them. This is because they areseparated in the range of the radar point of view, where 3Dinformation is revealed by the radar. Third, RF images have awider FoV than RGB images so that the RODNet can seemore information. As shown in the third example, only asmall part of the car visible in the camera view, which canhardly be detected from the camera side, but the RODNet cansuccessfully detect it. Besides, RODNet can detect objects thatare not detected by image-based methods due to strong lightingcondition. The fourth example shows that a pedestrian and acyclist are detected by RODNet, but can hardly observed in thecorresponding RGB image. Last but not least, our RODNet is

JOURNAL OF SELECTED TOPICS IN SIGNAL PROCESSING, VOL. X, NO. X, MARCH 2021 12
RG
B Im
ages
RF
Imag
esR
OD
Net
Res
ults
(a) (b) (c) (d) (e) (f)
Fig. 11. Examples illustrate the strengths of our RODNet. Conditions from left to right: (a) difficult for vision-based methods during the night; (b) visuallyoccluded objects can be separately detected; (c) visually truncated vehicle can be detected; (d) pedestrian and cyclist fail to be detected under strong lightingcondition; (e) & (f) good detection results with noisy background.
able to distinguish noisy obstacles from objects after trained byCRF supervision. In the fifth and the last example, the noises,e.g., trees, walls, traffic signs, and poles, are suppressed in ourRODNet results.
VII. CONCLUSION
Object detection is crucial in autonomous driving and manyother areas. Computer vision community has been focusingon this topic for decades and has come up with many goodsolutions. However, vision-based detection schemes are stillsuffering from many adverse lighting and weather conditions.This paper proposed a brand-new and novel object detectionmethod purely from radar information, which can be morerobust than vision in adverse conditions. The proposed ROD-Net can accurately and robustly detect objects, based on fullysystematic cross-modal supervision scheme from an effectivecamera-radar fusion algorithm, in various autonomous andassisted driving scenarios even during the night or bad weather,which can potentially improve the role of radar in autonomousand assisted driving applications.
APPENDIX ANETWORK ARCHITECTURE IMPLEMENTATION
In this section, we describe the network architecture ofthe RODNet. We introduce two different kinds of backbones,i.e., vanilla and hourglass (HG). The detailed parameters ofthe neural network are presented in Table VI and Table VII,where Conv3D denotes 3D convolution layer; TDC denotestemporal deformable convolution layer; ConvT3D denotestranspose 3D convolution layer; and Conv3D(Skip) denotes3D convolution layer for skip connection.
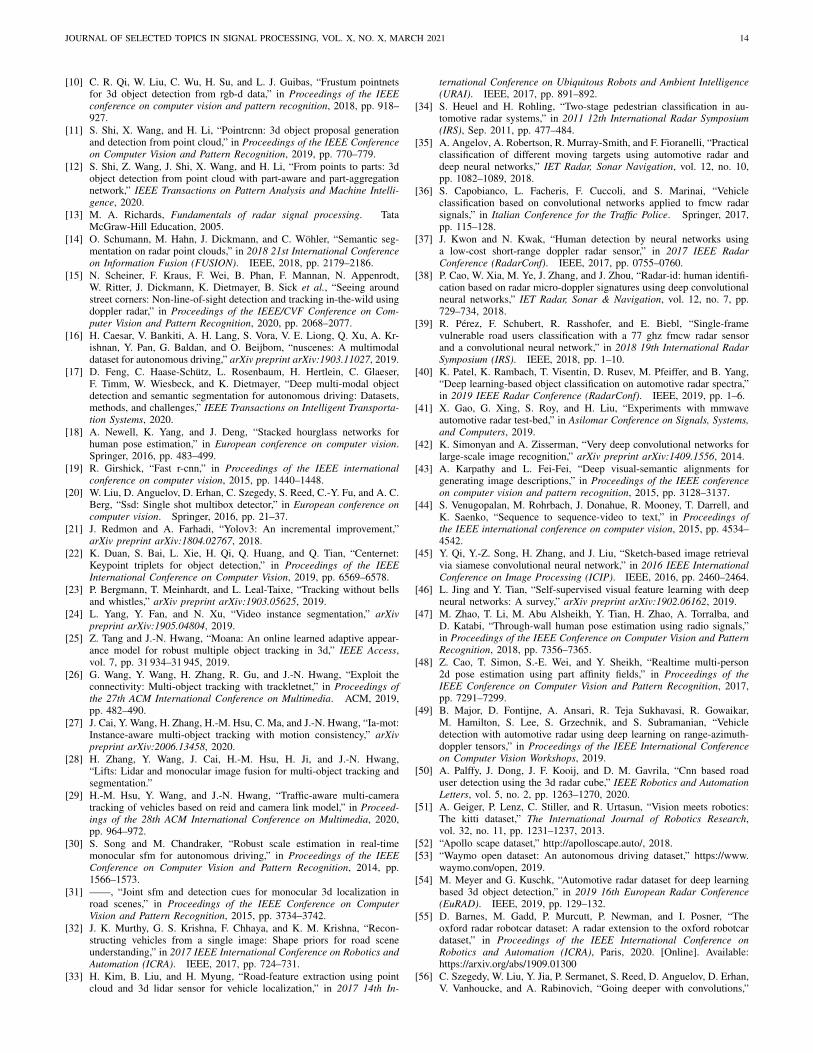
The illustration of our proposed temporal inception convolu-tion layer is shown in Fig. 14. We utilize three different lengthsfor the temporal convolution kernels, i.e., 5, 9, 13, to extractthe features with different temporal lengths. The features ofthe three different temporal lengths are then concatenated in
TABLE VIRODNET WITH THE VANILLA BACKBONE.
Layer Kernel Stride ChannelsConv3D/TDC (5, 3, 3) (1, 1, 1) 64Conv3D/TDC (5, 3, 3) (2, 2, 2) 64Conv3D (9, 5, 5) (1, 1, 1) 128Conv3D (9, 5, 5) (2, 2, 2) 128Conv3D (9, 5, 5) (1, 1, 1) 256Conv3D (9, 5, 5) (2, 2, 2) 256
ConvT3D (4, 6, 6) (2, 2, 2) 128ConvT3D (4, 6, 6) (2, 2, 2) 64ConvT3D (3, 6, 6) (1, 2, 2) 3
TABLE VIIRODNET WITH THE HG BACKBONE (SINGLE STACK).
Layer Kernel Stride ChannelsConv3D/TDC (5, 3, 3) (1, 1, 1) 32Conv3D/TDC (5, 3, 3) (1, 1, 1) 64
Conv3D (9, 5, 5) (1, 1, 1) 64Conv3D (9, 5, 5) (2, 2, 2) 64Conv3D (9, 5, 5) (1, 1, 1) 128Conv3D (9, 5, 5) (2, 2, 2) 128Conv3D (9, 5, 5) (1, 1, 1) 256Conv3D (9, 5, 5) (2, 2, 2) 256
Conv3D(Skip) (9, 5, 5) (1, 1, 1) 64Conv3D(Skip) (9, 5, 5) (2, 2, 2) 64Conv3D(Skip) (9, 5, 5) (1, 1, 1) 128Conv3D(Skip) (9, 5, 5) (2, 2, 2) 128Conv3D(Skip) (9, 5, 5) (1, 1, 1) 256Conv3D(Skip) (9, 5, 5) (2, 2, 2) 256
ConvT3D (4, 6, 6) (2, 2, 2) 128ConvT3D (4, 6, 6) (2, 2, 2) 64ConvT3D (3, 6, 6) (1, 2, 2) 64Conv3D (9, 5, 5) (1, 1, 1) 3
the channel domain and sent to the subsequent layers. Forsimplicity, we use 160 as the number of both input and outputchannels of all temporal inception convolution layers.
Moreover, we train the RODNet on an NVIDIA QuadroGV100 GPU. It takes about 4 days to train the RODNet
JOURNAL OF SELECTED TOPICS IN SIGNAL PROCESSING, VOL. X, NO. X, MARCH 2021 13
Conv3D5×5×5, 32, 2
Conv3D5×5×5, 64, 1
Conv3D9×5×5, 64, 2
Conv3D5×5×5, 64, 1
Conv3D13×5×5, 64, 2
Input Tensor (160, T, H, W)
Output Tensor (160, T, H/2, W/2)
Concatenation
Fig. 14. Illustration of the proposed temporal inception convolution layer. Thethree parameters inside Conv3D blocks are representing kernel size, numberof channels, and spatial stride, respectively.
(vanilla), 8 days to train the RODNet (HG), and 10 days totrain the RODNet (HG) with temporal inception convolutionlayers.
APPENDIX BIMPLEMENTATION DETAILS OF OUR VISUAL TEACHER
There are 5 modules in the teacher’s pipeline. The imple-mentation details are stated as follows:
• Image-based object detection: pre-trained on the KITTIdataset and fine-tuned on the Cityscapes dataset.
• Depth estimation: a pre-trained self-supervised methodthat only needs stereo image pairs for training, and it isfurther retrained on our CRUW dataset.
• Semantic segmentation: pre-trained on the Cityscapesdataset.
• Multi-object tracking: pre-trained on the KITTI datasetand can be easily generalized to our CRUW datasetwithout much performance degradation.
APPENDIX CTEMPORAL DEFORMABLE CONVOLUTION
BACK-PROPAGATION
According to the temporal deformable convolution definedin Eq. 4 (in the original manuscript), the gradient w.r.t. theoffset field ∆pn can be calculated as
∂y(p0)
∂∆pn=∑
pn∈Rw(pn) · ∂x(p0 + pn + ∆pn)
∂∆pn
=∑
pn∈R
[w(pn) ·
∑q
∂G(q,p0 + pn + ∆pn)
∂∆pnx(q)
].
(11)Here, q enumerates all integer locations in the 3D featuremap x, and G(·, ·) is the bilinear interpolation kernel on the2D offset field defined as
G(q,p) = [g(qu, pu), g(qv, pv)] , (12)
where g(a, b) = max(0, 1− |a− b|).
APPENDIX DADDITIONAL QUALITATIVE RESULTS
Some additional qualitative results are shown in Fig. 15,where different colors represent different detected objectclasses (red: pedestrian; green: cyclist; blue: car). Based onthe current hardware capability, the radar’s FoV is 0-25m,±90◦. Our RODNet presents promising radar object detectionperformance in various driving scenarios, i.e., parking lot,campus road, city street, with different lighting conditions.More qualitative results can be found in our supplementarydemo video.
Besides, we also show some failure cases of our RODNetin Fig. 16. In Fig. 16, (a) and (b) show some false negativesof pedestrian detection. Since pedestrians usually have a muchsmaller volume than cars, so they cannot be easily detectedseparately when they are next to each other. Fig. 16 (c) and (d)are two examples of false negatives of car detections, where(c) shows a car with the back trunk opened is missing in ourRODNet detection because of abnormal surface features, and(d) shows that the reflection signals from the faraway carsare suppressed by a nearby car in the static scenario. Finally,Fig. 16 (e) and (f) show some false positives caused by trafficsigns.
ACKNOWLEDGMENT
This work was partially supported by CMMB Vision –UWECE Center on Satellite Multimedia and Connected Vehi-cles. The authors would also like to thank the colleagues andstudents in Information Processing Lab at UWECE for theirhelp and assistance on the dataset collection, processing, andannotation works.
REFERENCES
[1] S. Ren, K. He, R. Girshick, and J. Sun, “Faster r-cnn: Towards real-timeobject detection with region proposal networks,” in Advances in neuralinformation processing systems, 2015, pp. 91–99.
[2] T.-Y. Lin, P. Goyal, R. Girshick, K. He, and P. Dollar, “Focal lossfor dense object detection,” in Proceedings of the IEEE internationalconference on computer vision, 2017, pp. 2980–2988.
[3] K. He, G. Gkioxari, P. Dollar, and R. Girshick, “Mask r-cnn,” inProceedings of the IEEE international conference on computer vision,2017, pp. 2961–2969.
[4] Z. Cai and N. Vasconcelos, “Cascade r-cnn: Delving into high qualityobject detection,” in Proceedings of the IEEE conference on computervision and pattern recognition, 2018, pp. 6154–6162.
[5] A. Mousavian, D. Anguelov, J. Flynn, and J. Kosecka, “3d boundingbox estimation using deep learning and geometry,” in Proceedings of theIEEE Conference on Computer Vision and Pattern Recognition, 2017,pp. 7074–7082.
[6] J. A. Ansari, S. Sharma, A. Majumdar, J. K. Murthy, and K. M. Krishna,“The earth ain’t flat: Monocular reconstruction of vehicles on steep andgraded roads from a moving camera,” in 2018 IEEE/RSJ InternationalConference on Intelligent Robots and Systems (IROS). IEEE, 2018, pp.8404–8410.
[7] Y. Wang, Y.-T. Huang, and J.-N. Hwang, “Monocular visual object3d localization in road scenes,” in Proceedings of the 27th ACMInternational Conference on Multimedia. ACM, 2019, pp. 917–925.
[8] C. R. Qi, H. Su, K. Mo, and L. J. Guibas, “Pointnet: Deep learning onpoint sets for 3d classification and segmentation,” in Proceedings of theIEEE conference on computer vision and pattern recognition, 2017, pp.652–660.
[9] C. R. Qi, L. Yi, H. Su, and L. J. Guibas, “Pointnet++: Deep hierarchicalfeature learning on point sets in a metric space,” in Advances in neuralinformation processing systems, 2017, pp. 5099–5108.
JOURNAL OF SELECTED TOPICS IN SIGNAL PROCESSING, VOL. X, NO. X, MARCH 2021 14
[10] C. R. Qi, W. Liu, C. Wu, H. Su, and L. J. Guibas, “Frustum pointnetsfor 3d object detection from rgb-d data,” in Proceedings of the IEEEconference on computer vision and pattern recognition, 2018, pp. 918–927.
[11] S. Shi, X. Wang, and H. Li, “Pointrcnn: 3d object proposal generationand detection from point cloud,” in Proceedings of the IEEE Conferenceon Computer Vision and Pattern Recognition, 2019, pp. 770–779.
[12] S. Shi, Z. Wang, J. Shi, X. Wang, and H. Li, “From points to parts: 3dobject detection from point cloud with part-aware and part-aggregationnetwork,” IEEE Transactions on Pattern Analysis and Machine Intelli-gence, 2020.
[13] M. A. Richards, Fundamentals of radar signal processing. TataMcGraw-Hill Education, 2005.
[14] O. Schumann, M. Hahn, J. Dickmann, and C. Wohler, “Semantic seg-mentation on radar point clouds,” in 2018 21st International Conferenceon Information Fusion (FUSION). IEEE, 2018, pp. 2179–2186.
[15] N. Scheiner, F. Kraus, F. Wei, B. Phan, F. Mannan, N. Appenrodt,W. Ritter, J. Dickmann, K. Dietmayer, B. Sick et al., “Seeing aroundstreet corners: Non-line-of-sight detection and tracking in-the-wild usingdoppler radar,” in Proceedings of the IEEE/CVF Conference on Com-puter Vision and Pattern Recognition, 2020, pp. 2068–2077.
[16] H. Caesar, V. Bankiti, A. H. Lang, S. Vora, V. E. Liong, Q. Xu, A. Kr-ishnan, Y. Pan, G. Baldan, and O. Beijbom, “nuscenes: A multimodaldataset for autonomous driving,” arXiv preprint arXiv:1903.11027, 2019.
[17] D. Feng, C. Haase-Schutz, L. Rosenbaum, H. Hertlein, C. Glaeser,F. Timm, W. Wiesbeck, and K. Dietmayer, “Deep multi-modal objectdetection and semantic segmentation for autonomous driving: Datasets,methods, and challenges,” IEEE Transactions on Intelligent Transporta-tion Systems, 2020.
[18] A. Newell, K. Yang, and J. Deng, “Stacked hourglass networks forhuman pose estimation,” in European conference on computer vision.Springer, 2016, pp. 483–499.
[19] R. Girshick, “Fast r-cnn,” in Proceedings of the IEEE internationalconference on computer vision, 2015, pp. 1440–1448.
[20] W. Liu, D. Anguelov, D. Erhan, C. Szegedy, S. Reed, C.-Y. Fu, and A. C.Berg, “Ssd: Single shot multibox detector,” in European conference oncomputer vision. Springer, 2016, pp. 21–37.
[21] J. Redmon and A. Farhadi, “Yolov3: An incremental improvement,”arXiv preprint arXiv:1804.02767, 2018.
[22] K. Duan, S. Bai, L. Xie, H. Qi, Q. Huang, and Q. Tian, “Centernet:Keypoint triplets for object detection,” in Proceedings of the IEEEInternational Conference on Computer Vision, 2019, pp. 6569–6578.
[23] P. Bergmann, T. Meinhardt, and L. Leal-Taixe, “Tracking without bellsand whistles,” arXiv preprint arXiv:1903.05625, 2019.
[24] L. Yang, Y. Fan, and N. Xu, “Video instance segmentation,” arXivpreprint arXiv:1905.04804, 2019.
[25] Z. Tang and J.-N. Hwang, “Moana: An online learned adaptive appear-ance model for robust multiple object tracking in 3d,” IEEE Access,vol. 7, pp. 31 934–31 945, 2019.
[26] G. Wang, Y. Wang, H. Zhang, R. Gu, and J.-N. Hwang, “Exploit theconnectivity: Multi-object tracking with trackletnet,” in Proceedings ofthe 27th ACM International Conference on Multimedia. ACM, 2019,pp. 482–490.
[27] J. Cai, Y. Wang, H. Zhang, H.-M. Hsu, C. Ma, and J.-N. Hwang, “Ia-mot:Instance-aware multi-object tracking with motion consistency,” arXivpreprint arXiv:2006.13458, 2020.
[28] H. Zhang, Y. Wang, J. Cai, H.-M. Hsu, H. Ji, and J.-N. Hwang,“Lifts: Lidar and monocular image fusion for multi-object tracking andsegmentation.”
[29] H.-M. Hsu, Y. Wang, and J.-N. Hwang, “Traffic-aware multi-cameratracking of vehicles based on reid and camera link model,” in Proceed-ings of the 28th ACM International Conference on Multimedia, 2020,pp. 964–972.
[30] S. Song and M. Chandraker, “Robust scale estimation in real-timemonocular sfm for autonomous driving,” in Proceedings of the IEEEConference on Computer Vision and Pattern Recognition, 2014, pp.1566–1573.
[31] ——, “Joint sfm and detection cues for monocular 3d localization inroad scenes,” in Proceedings of the IEEE Conference on ComputerVision and Pattern Recognition, 2015, pp. 3734–3742.
[32] J. K. Murthy, G. S. Krishna, F. Chhaya, and K. M. Krishna, “Recon-structing vehicles from a single image: Shape priors for road sceneunderstanding,” in 2017 IEEE International Conference on Robotics andAutomation (ICRA). IEEE, 2017, pp. 724–731.
[33] H. Kim, B. Liu, and H. Myung, “Road-feature extraction using pointcloud and 3d lidar sensor for vehicle localization,” in 2017 14th In-
ternational Conference on Ubiquitous Robots and Ambient Intelligence(URAI). IEEE, 2017, pp. 891–892.
[34] S. Heuel and H. Rohling, “Two-stage pedestrian classification in au-tomotive radar systems,” in 2011 12th International Radar Symposium(IRS), Sep. 2011, pp. 477–484.
[35] A. Angelov, A. Robertson, R. Murray-Smith, and F. Fioranelli, “Practicalclassification of different moving targets using automotive radar anddeep neural networks,” IET Radar, Sonar Navigation, vol. 12, no. 10,pp. 1082–1089, 2018.
[36] S. Capobianco, L. Facheris, F. Cuccoli, and S. Marinai, “Vehicleclassification based on convolutional networks applied to fmcw radarsignals,” in Italian Conference for the Traffic Police. Springer, 2017,pp. 115–128.
[37] J. Kwon and N. Kwak, “Human detection by neural networks usinga low-cost short-range doppler radar sensor,” in 2017 IEEE RadarConference (RadarConf). IEEE, 2017, pp. 0755–0760.
[38] P. Cao, W. Xia, M. Ye, J. Zhang, and J. Zhou, “Radar-id: human identifi-cation based on radar micro-doppler signatures using deep convolutionalneural networks,” IET Radar, Sonar & Navigation, vol. 12, no. 7, pp.729–734, 2018.
[39] R. Perez, F. Schubert, R. Rasshofer, and E. Biebl, “Single-framevulnerable road users classification with a 77 ghz fmcw radar sensorand a convolutional neural network,” in 2018 19th International RadarSymposium (IRS). IEEE, 2018, pp. 1–10.
[40] K. Patel, K. Rambach, T. Visentin, D. Rusev, M. Pfeiffer, and B. Yang,“Deep learning-based object classification on automotive radar spectra,”in 2019 IEEE Radar Conference (RadarConf). IEEE, 2019, pp. 1–6.
[41] X. Gao, G. Xing, S. Roy, and H. Liu, “Experiments with mmwaveautomotive radar test-bed,” in Asilomar Conference on Signals, Systems,and Computers, 2019.
[42] K. Simonyan and A. Zisserman, “Very deep convolutional networks forlarge-scale image recognition,” arXiv preprint arXiv:1409.1556, 2014.
[43] A. Karpathy and L. Fei-Fei, “Deep visual-semantic alignments forgenerating image descriptions,” in Proceedings of the IEEE conferenceon computer vision and pattern recognition, 2015, pp. 3128–3137.
[44] S. Venugopalan, M. Rohrbach, J. Donahue, R. Mooney, T. Darrell, andK. Saenko, “Sequence to sequence-video to text,” in Proceedings ofthe IEEE international conference on computer vision, 2015, pp. 4534–4542.
[45] Y. Qi, Y.-Z. Song, H. Zhang, and J. Liu, “Sketch-based image retrievalvia siamese convolutional neural network,” in 2016 IEEE InternationalConference on Image Processing (ICIP). IEEE, 2016, pp. 2460–2464.
[46] L. Jing and Y. Tian, “Self-supervised visual feature learning with deepneural networks: A survey,” arXiv preprint arXiv:1902.06162, 2019.
[47] M. Zhao, T. Li, M. Abu Alsheikh, Y. Tian, H. Zhao, A. Torralba, andD. Katabi, “Through-wall human pose estimation using radio signals,”in Proceedings of the IEEE Conference on Computer Vision and PatternRecognition, 2018, pp. 7356–7365.
[48] Z. Cao, T. Simon, S.-E. Wei, and Y. Sheikh, “Realtime multi-person2d pose estimation using part affinity fields,” in Proceedings of theIEEE Conference on Computer Vision and Pattern Recognition, 2017,pp. 7291–7299.
[49] B. Major, D. Fontijne, A. Ansari, R. Teja Sukhavasi, R. Gowaikar,M. Hamilton, S. Lee, S. Grzechnik, and S. Subramanian, “Vehicledetection with automotive radar using deep learning on range-azimuth-doppler tensors,” in Proceedings of the IEEE International Conferenceon Computer Vision Workshops, 2019.
[50] A. Palffy, J. Dong, J. F. Kooij, and D. M. Gavrila, “Cnn based roaduser detection using the 3d radar cube,” IEEE Robotics and AutomationLetters, vol. 5, no. 2, pp. 1263–1270, 2020.
[51] A. Geiger, P. Lenz, C. Stiller, and R. Urtasun, “Vision meets robotics:The kitti dataset,” The International Journal of Robotics Research,vol. 32, no. 11, pp. 1231–1237, 2013.
[52] “Apollo scape dataset,” http://apolloscape.auto/, 2018.[53] “Waymo open dataset: An autonomous driving dataset,” https://www.
waymo.com/open, 2019.[54] M. Meyer and G. Kuschk, “Automotive radar dataset for deep learning
based 3d object detection,” in 2019 16th European Radar Conference(EuRAD). IEEE, 2019, pp. 129–132.
[55] D. Barnes, M. Gadd, P. Murcutt, P. Newman, and I. Posner, “Theoxford radar robotcar dataset: A radar extension to the oxford robotcardataset,” in Proceedings of the IEEE International Conference onRobotics and Automation (ICRA), Paris, 2020. [Online]. Available:https://arxiv.org/abs/1909.01300
[56] C. Szegedy, W. Liu, Y. Jia, P. Sermanet, S. Reed, D. Anguelov, D. Erhan,V. Vanhoucke, and A. Rabinovich, “Going deeper with convolutions,”
JOURNAL OF SELECTED TOPICS IN SIGNAL PROCESSING, VOL. X, NO. X, MARCH 2021 15
in Proceedings of the IEEE conference on computer vision and patternrecognition, 2015, pp. 1–9.
[57] J. Dai, H. Qi, Y. Xiong, Y. Li, G. Zhang, H. Hu, and Y. Wei, “Deformableconvolutional networks,” in Proceedings of the IEEE internationalconference on computer vision, 2017, pp. 764–773.
[58] T.-Y. Lin, M. Maire, S. Belongie, J. Hays, P. Perona, D. Ramanan,P. Dollar, and C. L. Zitnick, “Microsoft coco: Common objects incontext,” in European conference on computer vision. Springer, 2014,pp. 740–755.
[59] Y. Wang, Z. Jiang, X. Gao, J.-N. Hwang, G. Xing, and H. Liu, “Rodnet:Object detection under severe conditions using vision-radio cross-modalsupervision,” arXiv preprint arXiv:2003.01816, 2020.
[60] “Flir systems,” https://www.flir.com/.[61] “Texas instruments,” http://www.ti.com/.[62] Y. Wang, Z. Jiang, X. Gao, J.-N. Hwang, G. Xing, and H. Liu, “Rodnet:
Radar object detection using cross-modal supervision,” in Proceedings ofthe IEEE/CVF Winter Conference on Applications of Computer Vision,2021, pp. 504–513.
Yizhou Wang is a Ph.D. student in Electrical andComputer Engineering at the University of Wash-ington, advised by Prof. Jenq-Neng Hwang. Hereceived his M.S. in Electrical Engineering in 2018from Columbia University, advised by Prof. Shih-FuChang. His research interests include autonomousdriving, computer vision, deep learning, and cross-modal learning.
Zhongyu Jiang received the B.E. degree in Com-puter Science and Technology from Tsinghua Uni-versity, Beijing, China, in 2018 and M.Sc. degree inComputer Science and System from the Universityof Washington, Tacoma. He is currently a Ph.D.student in Electrical and Computer Engineering,University of Washington.
Yudong Li is an undergraduate junior in the In-formation School at the University of Washington.He is pursuing the B.S. degree in Informatics, andplanning on graduation in 2022. Currently, he is aresearch assistant at the Information Processing Lab,University of Washington, facilitating the works onmachine learning related topics.
Jenq-Neng Hwang received the BS and MS de-grees, both in electrical engineering from the Na-tional Taiwan University, Taipei, Taiwan, in 1981and 1983 separately. He then received his Ph.D.degree from the University of Southern California.In the summer of 1989, Dr. Hwang joined theDepartment of Electrical and Computer Engineering(ECE) of the University of Washington in Seattle,where he has been promoted to Full Professor since1999. He served as the Associate Chair for Researchfrom 2003 to 2005, and from 2011-2015. He also
served as the Associate Chair for Global Affairs from 2015-2020. He is thefounder and co-director of the Information Processing Lab, which has wonCVPR AI City Challenges awards in the past years. He has written more than380 journal, conference papers and book chapters in the areas of machinelearning, multimedia signal processing, and multimedia system integrationand networking, including an authored textbook on “Multimedia Networking:from Theory to Practice”, published by Cambridge University Press. Dr.Hwang has close working relationship with the industry on multimedia signalprocessing and multimedia networking. Dr. Hwang received the 1995 IEEESignal Processing Society’s Best Journal Paper Award. He is a foundingmember of Multimedia Signal Processing Technical Committee of IEEESignal Processing Society and was the Society’s representative to IEEE NeuralNetwork Council from 1996 to 2000. He is currently a member of MultimediaTechnical Committee (MMTC) of IEEE Communication Society and also amember of Multimedia Signal Processing Technical Committee (MMSP TC)of IEEE Signal Processing Society. He served as associate editors for IEEET-SP, T-NN and T-CSVT, T-IP and Signal Processing Magazine (SPM). He iscurrently on the editorial board of ZTE Communications, ETRI, IJDMB andJSPS journals. He served as the Program Co-Chair of IEEE ICME 2016 andwas the Program Co-Chairs of ICASSP 1998 and ISCAS 2009. Dr. Hwangis a fellow of IEEE since 2001.
Guanbin Xing received his B.S. and M.S. degreesfrom Peking University, Beijing, China, in 1996 and1999, respectively, and his Ph.D. degree from theUniversity of Washington in 2004, all in electricalengineering. Dr. Xing has over 15 years of expe-rience as a senior system architect in the WirelessCommunications and Digital Broadcasting industry.In 2017, he joined CMMB Vision - UW EE Centeron Satellite Multimedia and Connected Vehicles asa research scientist working on the mmWave radarsignal processing and machine learning based sensor
fusion solutions for autonomous driving.
Hui Liu is the President and CTO of SilkwaveHoldings and an affiliate professor at University ofWashington. He received his B.S. in 1988 fromFudan University, Shanghai, China, and a Ph.D.degree in 1995 from the Univ. of Texas at Austin,all in electrical engineering. He was previously a fullprofessor/associate chair at the Dept. of EE, Univ. ofWashington and a chair professor/associate dean ofSchool of Electronic, Information & Electrical Engi-neering (SEIEE) at Shanghai Jiao Tong University.Dr. Liu was one of the principal designers of the
3G TD-SCDMA mobile technologies, and the founder of Adaptix whichpioneered the development of OFDMA-based mobile broadband networks(mobile WiMAX and 4G LTE). His research interests include broadbandwireless networks, satellite communications, digital broadcasting, machinelearning and autonomous driving. Dr. Liu has published more than 90 journalarticles, 2 textbooks, and has over 80 awarded patents. He was selected Fellowof IEEE for contributions to global standards for broadband cellular andmobile broadcasting. He is the General Chairman for the 2005 Asilomarconference on Signals, Systems, and Computers and the 2014 IEEE/CICInternational Conference on Communications in China (ICCC14). He is arecipient of 1997 National Science Foundation (NSF) CAREER Award, theGold Prize Patent Award in China, 3 IEEE best conference paper awards, andthe 2000 Office of Naval Research (ONR) Young Investigator Award.
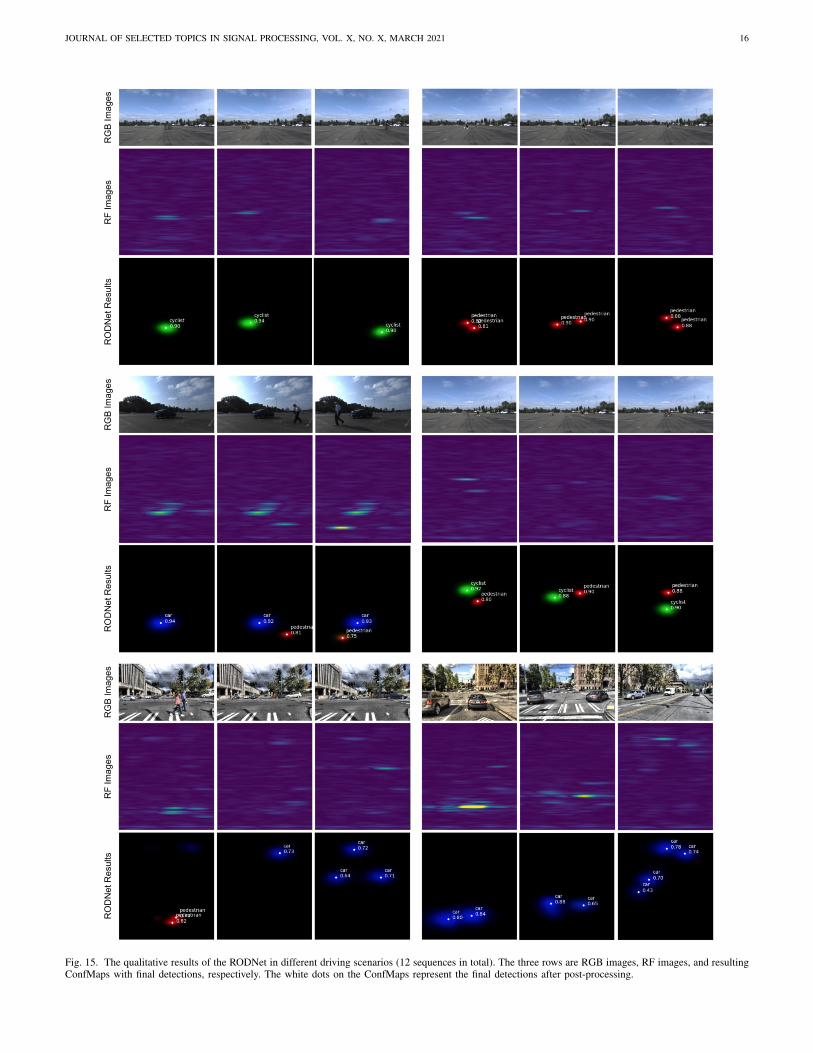
JOURNAL OF SELECTED TOPICS IN SIGNAL PROCESSING, VOL. X, NO. X, MARCH 2021 16
RG
B Im
ages
RF
Imag
esR
OD
Net
Res
ults
RG
B Im
ages
RF
Imag
esR
OD
Net
Res
ults
RG
B Im
ages
RF
Imag
esR
OD
Net
Res
ults
Fig. 15. The qualitative results of the RODNet in different driving scenarios (12 sequences in total). The three rows are RGB images, RF images, and resultingConfMaps with final detections, respectively. The white dots on the ConfMaps represent the final detections after post-processing.
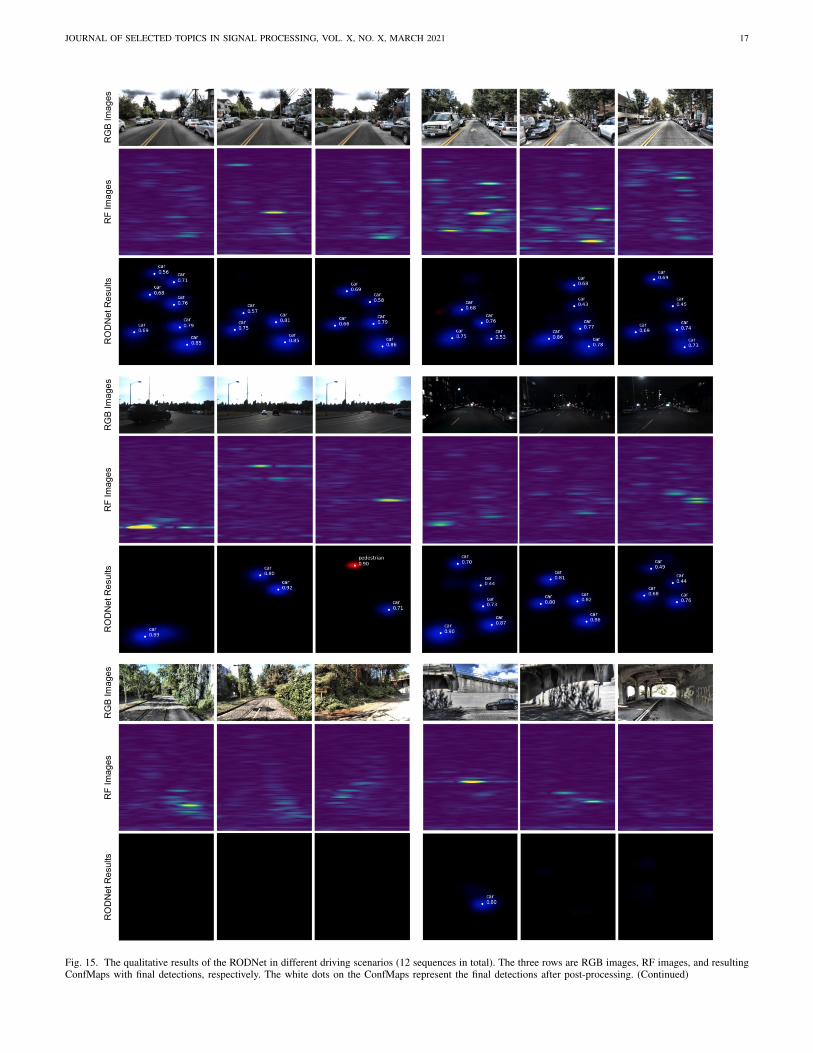
JOURNAL OF SELECTED TOPICS IN SIGNAL PROCESSING, VOL. X, NO. X, MARCH 2021 17
RG
B Im
ages
RF
Imag
esR
OD
Net
Res
ults
RG
B Im
ages
RF
Imag
esR
OD
Net
Res
ults
RG
B Im
ages
RF
Imag
esR
OD
Net
Res
ults
Fig. 15. The qualitative results of the RODNet in different driving scenarios (12 sequences in total). The three rows are RGB images, RF images, and resultingConfMaps with final detections, respectively. The white dots on the ConfMaps represent the final detections after post-processing. (Continued)

JOURNAL OF SELECTED TOPICS IN SIGNAL PROCESSING, VOL. X, NO. X, MARCH 2021 18
RG
B Im
ages
RF
Imag
esR
OD
Net
Res
ults
(a) (b) (c) (d) (e) (f)
Fig. 16. The failure cases of our RODNet. (a) & (b): False negatives when multiple pedestrians are very near (two pedestrians in both scenes); (c): Falsenegative for a car whose trunk is open (abnormal surface feature for a car); (d): False negatives due to the strong reflection of the nearby object in the staticscenario; (e) & (f): False positives from traffic signs.