journal of the asia-pacific centre for environmental ... … · journal of the asia-pacific centre...
TRANSCRIPT

132
Journal of the Asia-Pacific Centre for Environmental Accountability
Volume 18, Number 3, September 2012 EDITORIAL 155
FEATURE ARTICLES
Carbon efficiency in Australian NGER reporting companies: what does the integration tell us?
Wei Qian
159
Corporate sustainability accounting: beyond unfreezing
Dimitar Zvezdov
181
ENVIRONMENT EXTRA! 199
CALL FOR PAPERS 212
Published by the Centre for Accounting, Governance and Sustainability, University of South Australia Business School, Adelaide, Australia
Supported by CPA Australia (SA Division), Level 10, 420 King William Street, Adelaide, SA 5000, Australia
© University of South Australia 2012
ISSN 1448-6679

Vol. 18, No. 3, September 2012
155
Editorial
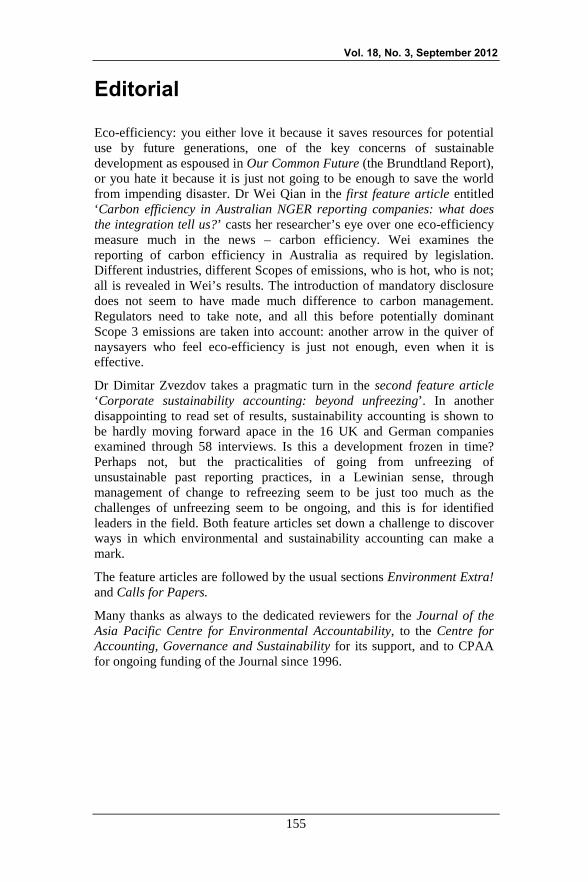
Eco-efficiency: you either love it because it saves resources for potential use by future generations, one of the key concerns of sustainable development as espoused in Our Common Future (the Brundtland Report), or you hate it because it is just not going to be enough to save the world from impending disaster. Dr Wei Qian in the first feature article entitled ‘Carbon efficiency in Australian NGER reporting companies: what does the integration tell us?’ casts her researcher’s eye over one eco-efficiency measure much in the news – carbon efficiency. Wei examines the reporting of carbon efficiency in Australia as required by legislation. Different industries, different Scopes of emissions, who is hot, who is not; all is revealed in Wei’s results. The introduction of mandatory disclosure does not seem to have made much difference to carbon management. Regulators need to take note, and all this before potentially dominant Scope 3 emissions are taken into account: another arrow in the quiver of naysayers who feel eco-efficiency is just not enough, even when it is effective.
Dr Dimitar Zvezdov takes a pragmatic turn in the second feature article ‘Corporate sustainability accounting: beyond unfreezing’. In another disappointing to read set of results, sustainability accounting is shown to be hardly moving forward apace in the 16 UK and German companies examined through 58 interviews. Is this a development frozen in time? Perhaps not, but the practicalities of going from unfreezing of unsustainable past reporting practices, in a Lewinian sense, through management of change to refreezing seem to be just too much as the challenges of unfreezing seem to be ongoing, and this is for identified leaders in the field. Both feature articles set down a challenge to discover ways in which environmental and sustainability accounting can make a mark.
The feature articles are followed by the usual sections Environment Extra! and Calls for Papers.
Many thanks as always to the dedicated reviewers for the Journal of the Asia Pacific Centre for Environmental Accountability, to the Centre for Accounting, Governance and Sustainability for its support, and to CPAA for ongoing funding of the Journal since 1996.

Journal of the Asia-Pacific Centre for Environmental Accountability
156
Notes for contributors
Manuscript requirements
Articles should be submitted in a word document, Times New Roman, 12 point, single spaced, single column, and attached to an email. References should be in the UniSA Harvard referencing style, available from the following link:
http://www.unisa.edu.au/ltu/students/study/referencing/harvard.pdf
As a guide to authors, articles should be no more than 6,000 words unless negotiated with the editors. The submission of shorter articles is particularly welcome. Each article should be preceded by an abstract of no more than 150 words.
To ensure anonymous review, authors should not identify themselves directly or indirectly in their manuscript. A ‘Paper Title Page’ should show the title of the manuscript; the author(s)’s details and an abstract. Refer to web page for full guidelines and style guide, available from the following link:
http://www.unisa.edu.au/cags/APCEA/instructions_for_authors.asp.
The reviewing process
Feature articles are independently reviewed by members of the Editorial Board in accordance with the requirements for classification as a C1 journal article in Australia: ‘For the purposes of the HERDC, an acceptable peer review process is one that involves an assessment or review of the research publication in its entirety before publication by independent, qualified experts. Independent in this context means independent of the author’.
Each article published in the Journal of the Asia Pacific Centre for Environmental Accountability is blind reviewed by at least two members of the Editorial Board. The journal is listed on the ARC’s ERA 2010 journal list which is considered acceptable as evidence of peer review for HERDC purposes.
Copyright
This work is copyright. Apart from any use as permitted under the Copyright Act 1968, no part may be reproduced by any process without prior written permission from Editor, Journal of the Asia Pacific Centre for
Vol. 18, No. 3, September 2012
157
Environmental Accountability. Requests and enquiries concerning reproduction and rights should be addressed to Professor Roger L. Burritt, editor, Journal of the Asia Pacific Centre for Environmental Accountability, Centre for Accounting, Governance and Sustainability, School of Commerce, University of South Australia, GPO Box 2471, Adelaide, South Australia, 5001 or emailed to [email protected].
The intellectual property of each paper remains vested in the authors as listed on the paper and the journal recognises the authors’ moral rights.
Disclaimer
This journal presents the opinions and comments of the author(s) and not necessarily those of the publisher. The University of South Australia, Centre for Accounting, Governance and Sustainability and the Asia Pacific Centre for Environmental Accountability expressly disclaim all liability for any loss or damage arising from reliance upon any information contained in this journal.
Editorial objectives
The objectives of the journal are, first, to explore the development of ideas about environmental and social accounting, reporting, accountability and assurance. Submission of research based on all methodologies and methods, e.g. qualitative, quantitative, mixed methods, inductive, deductive, abductive, inter-, multi-, and trans-disciplinary, are welcome. The second objective is to promote environmental, social and sustainability accounting, accountability, reporting assurance and taxation research to members of APCEA, professional practitioners and accountancy and finance academics, professional bodies and government policy makers. Editorial criteria
Major criteria used to evaluate papers are:
• subject matter must be of importance to the accounting discipline; • research questions must fall within the journal’s objectives; • research must be well designed and executed; and • presentation is well written and in conformance with the journal’s
style.
Potential contributors should contact the editor: Professor Roger L. Burritt Email: [email protected], Ph: +61 8 8302 7048, Fax: +61 8 8302 0992

Journal of the Asia-Pacific Centre for Environmental Accountability
158
Editorial Board
Editor Professor Roger L. Burritt University of South Australia, Australia APCEA Board Members Professor Cosmas Ambe, University of Limpopo, South Africa Professor Amanda Ball, University of Canterbury, New Zealand Professor Jane Broadbent, Royal Holloway, University of London, UK Professor Judy Brown, Victoria University of Wellington, New Zealand Professor Nola Buhr, University of Saskatchewan, Canada Professor Jong-Seo Choi, Pusan National University, Korea Professor Chris Cowton, University of Huddersfield, UK Associate Professor Lorne Cummings, Macquarie University, Australia Professor Charl de Villiers, University of Waikato, New Zealand Professor Craig Deegan, RMIT University, Australia Professor Istemi Demirag, Queen’s University Belfast Assistant Professor Federica Farneti, University of Bologna, Italy Professor Frank Figge, Euromed Management School, France Associate Professor Geoff Frost, University of Sydney, Australia Associate Professor Kathy Herbohn, University of Queensland, Australia Dr Christian Herzig, University of Nottingham, UK Professor Katsuhiko Kokubu, Kobe University, Japan Professor José Moneva, University of Zaragoza, Spain Associate Professor Collins Ngwakwe, University of Limpopo, South Africa Professor Gweneth Norris, Charles Darwin University, Australia Professor Gary O’Donovan, University of Tasmania, Australia Professor Eduardo Ortas-Fredes, University of Zaragoza Associate Professor Jean Raar, Swinburne University, Australia Dr Anna Lee Rowe, Curtin University, Australia Professor Dr Stefan Schaltegger, Leuphana University of Lüneburg, Germany Professor Dr Maliah Sulaiman, International Islamic University, Malaysia Professor Carol Tilt, Flinders University, Australia Professor Chris van Staden, University of Canterbury, New Zealand Professor Richard Welford, University of Hong Kong, Hong Kong Associate Professor Haslinda Yusoff, Universiti Teknologi MARA (UiTM)
Malaysia, Malaysia Editorial Support Dr Amanda Carter
Journal Administrator Ms Rainbow Shum
Vol. 18, No. 3, September 2012
159
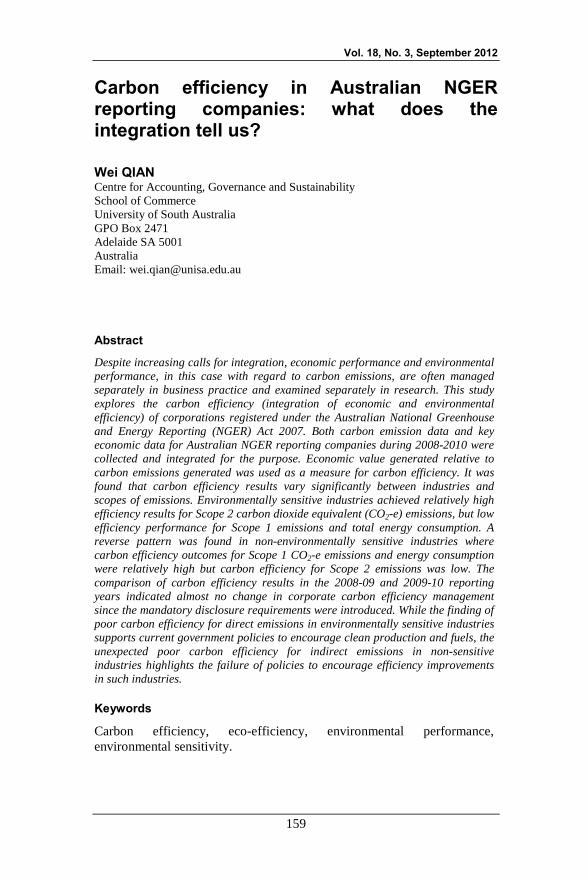
Carbon efficiency in Australian NGER reporting companies: what does the integration tell us?
Wei QIAN Centre for Accounting, Governance and Sustainability School of Commerce University of South Australia GPO Box 2471 Adelaide SA 5001 Australia Email: [email protected]
Abstract
Despite increasing calls for integration, economic performance and environmental performance, in this case with regard to carbon emissions, are often managed separately in business practice and examined separately in research. This study explores the carbon efficiency (integration of economic and environmental efficiency) of corporations registered under the Australian National Greenhouse and Energy Reporting (NGER) Act 2007. Both carbon emission data and key economic data for Australian NGER reporting companies during 2008-2010 were collected and integrated for the purpose. Economic value generated relative to carbon emissions generated was used as a measure for carbon efficiency. It was found that carbon efficiency results vary significantly between industries and scopes of emissions. Environmentally sensitive industries achieved relatively high efficiency results for Scope 2 carbon dioxide equivalent (CO2-e) emissions, but low efficiency performance for Scope 1 emissions and total energy consumption. A reverse pattern was found in non-environmentally sensitive industries where carbon efficiency outcomes for Scope 1 CO2-e emissions and energy consumption were relatively high but carbon efficiency for Scope 2 emissions was low. The comparison of carbon efficiency results in the 2008-09 and 2009-10 reporting years indicated almost no change in corporate carbon efficiency management since the mandatory disclosure requirements were introduced. While the finding of poor carbon efficiency for direct emissions in environmentally sensitive industries supports current government policies to encourage clean production and fuels, the unexpected poor carbon efficiency for indirect emissions in non-sensitive industries highlights the failure of policies to encourage efficiency improvements in such industries.
Keywords
Carbon efficiency, eco-efficiency, environmental performance, environmental sensitivity.

Journal of the Asia-Pacific Centre for Environmental Accountability
160
Planet, people and profit are inextricably intertwined. A key challenge for leadership is to make sustainability issues mainstream. Strategy, risk, performance and sustainability have become inseparable.
– King Code of Governance for South Africa 2009 (Institute of Directors in Southern Africa 2009, p. 11)
1. Introduction
Since the passage of the National Greenhouse and Energy Reporting (NGER) Act in 2007, Australian companies, in particular, those high polluting entities, have identified themselves in a position that they have to take greenhouse gas emissions more seriously than ever. The carbon tax legislation will perhaps give another big boost to carbon management and disclosure. While corporate carbon performance is now under closer scrutiny by various corporate stakeholders including investors and shareholders, their financial performance attracts greater attention too because of the tougher economic conditions since the global financial crisis.
Many previous studies advocate the positive link between corporate environmental performance and economic performance and provide evidence that companies can achieve “win-win” in both environmental and economic performance (see e.g. Porter & van der Linde 1995; Konar & Cohen 2001; Derwall, Guenster & Koedijk 2005). The past few years have seen increasing calls for integration (Institute of Directors in Southern Africa 2009; Eccles & Krzus 2010). However, in practice, the connection between economic and environmental performance remains elusive. In a recent study of 30 large global companies, Hubbard (2009) reported that economic indicators of performance were mostly omitted in corporate sustainability reports as the position put forward by most companies was that financial performance should be within the annual report. Therefore, questions remain as to whether sustainability and carbon issues have been integrated into core business (Eccles & Krzus 2010) and whether eco-efficiency (i.e. “win-win” in both economic and ecological efficiency) (Schaltegger & Burritt 2000) has been managed and achieved. While debates on the relationship between corporate economic and environmental performance have never been resolved, KPMG’s (2010) recent International Survey of Corporate Responsibility shows that only three per cent of companies worldwide are reporting corporate sustainability on an integrated basis, i.e. most companies merely produce a report combining the sustainability report and financial report (or annual report), instead of integrating strategic performance outcomes more broadly in one report. This result seems to suggest that eco-efficiency has been overlooked in the corporate world.

Vol. 18, No. 3, September 2012
161
Eco-efficiency is an important indicator for corporate sustainability. Eco-efficiency measures economic value added relative to environmental impacts generated which explicitly reflects “integration of economic information (the flow of financial funds such as income, expense, revenues and costs, which is linked to changes in stocks of funds [assets, liabilities and equities]) from conventional accounting with environmental information (environmental interventions such as emissions and resource use, which is linked with changes in eco-asset balances) derived from ecological accounting” (Schaltegger & Burritt 2000, p. 358).
Although eco-efficiency was proposed over a decade ago and its significance in examining integrated performance for business and countries as a whole (e.g. eco-efficient Gross Domestic Product (GDP) has been increasingly acknowledged (Schaltegger & Burritt 2000; Korhonen & Seager 2008), the application of eco-efficiency in measuring carbon performance, i.e. carbon efficiency, is limited, partly because eco-efficiency information has seldom been communicated in corporate reporting (Cerin 2002) and partly because carbon emissions have not been priced (or costed) until recently. Motivated by the gaps both in literature and corporate practice, this research uses recently released carbon emission data in the Australian NGER to explore the following three questions:
• To what extent are Australian corporations managing carbon efficiency based on their current investments and activities?
• How are carbon efficiency results different between environmentally sensitive industries where the carbon tax will apply and non-environmentally sensitive industries which the carbon tax will not directly affect?
• Is there any change in carbon efficiency after the mandatory disclosure requirements?
The remainder of the paper is structured as follows. In Section 2, extant literature is reviewed, focusing on corporate environmental performance, eco-efficiency, environmental sensitivity, and the role of mandatory environmental disclosures. Section 3 discusses data collection and sample selection, followed by a discussion of carbon efficiency measurements in Section 4. The presentation of the results is contained in Section 5 and the paper draws conclusions in Section 6.
2. Extant literature
2.1 Environmental performance, economic performance and eco-efficiency
Researchers believe business can do well by doing good, and therefore the business case, i.e. win-win, is the way to move towards sustainability (e.g.

Journal of the Asia-Pacific Centre for Environmental Accountability
162
Schaltegger & Wagner 2006; Falck & Heblich 2007). The economic benefits of managing social and environmental performance may include reducing cost and business risk, increasing reputation and developing new markets such as green product markets. Some empirical studies report a positive relationship between economic performance and corporate social responsibility (Schnietz & Epstein 2005), or environmental performance (Wahba 2008), or social performance (Spicer 1978; Waddock & Graves 1997), or corporate sustainability (Lo & Sheu 2007). The positive link is favoured by business communities and practitioners suggest the interests of shareholders and other stakeholders could be satisfied if sustainability issues are managed.
Substantial investment is often required to generate economic benefits. Some researchers argue that sustainability initiatives could destroy corporate value and increase financial risk and uncertainty (Kiernan 2007; Seeger & Hipfel 2007). In their views, sustainability is worth pursuing only when it can clearly satisfy the profit maximisation motive (Hopkins 2005). The inconclusive debate on the link between corporate environmental and economic performance (Porter & Kramer 2006) increases the demand for taking integrated performance into consideration, i.e. eco-efficiency. This is not only for the benefit of internal business decision-making, but also for information needs from external investors, lenders, suppliers, and other stakeholders.
The concept of eco-efficiency originates from business practice where it is expressed as creating more economic value with less environmental impact, or simply doing more with less (Ehrenfeld 2005). The OECD has called eco-efficiency the efficiency with which ecological resources are used to meet human needs, that is:
Eco-efficiency is achieved by the delivery of competitively-priced goods and services that satisfy human needs and bring quality of life, while progressively reducing ecological impacts and resource intensity throughout the life-cycle to a level at least in line with the earth’s estimated carrying capacity. (WBCSD 2000, p. 4)
Previous eco-efficiency studies predominantly focus on the concept and theory (Ehrenfeld 2005; Burritt & Schaltegger 2001), and tools and measures (Burritt & Saka 2006; Ciroth 2009; Hahn et al. 2010). Few studies of accounting and reporting for eco-efficiency indicate that eco-efficiency has yet been taken into consideration in corporate environmental reporting (Burritt & Schaltegger 2001; Erkko, Melanen & Mickwitz 2005). This is particularly the case because economic performance and environmental performance are still largely examined separately. While the concept of integrating environmental and economic performance may be easily understood, managing and communicating this performance in an integrated way seem challenging. Therefore, the first objective of this paper is to explore and understand eco-efficiency outputs
Vol. 18, No. 3, September 2012
163
(i.e. carbon efficiency in the context of carbon emission) of Australian corporations.
2.2 Environmental sensitivity and legitimacy
Deegan and Gordon (1996) note that environmental issues are more heavily emphasised in those industries identified as “environmentally sensitive”, e.g. mining, chemicals, coal, transport, and oil/gas explorers. These industries are in the public arena and subject to greater public scrutiny. Frost and Wilmshurst (2000) find that environmentally sensitive industries (e.g. mining and resources, chemical and petroleum (gas/oil)) report more environmental information and are more aware of environmental-related costs, although their environmental-related management accounting procedures are not significantly different from those in non-environmentally sensitive industries, such as retailing. Cho and Patten (2007) also reveal that firms operating in environmentally sensitive industries, such as oil exploration, paper manufacturing, chemical and allied products, petroleum refining and metals, disclosure more non-litigation-related environmental information in order to achieve social legitimacy.
Legitimacy theory and the legitimacy perspective are frequently used in literature when explaining corporate environmental management, corporate social responsibility management and corporate disclosures (Dowling & Pfeffer 1975; Owen 1990; O’Donovan 2002; Deegan 2002; Deegan, Rankin & Tobin 2002; Mobus 2005). Based on earlier works such as Dowling and Pfeffer (1975) and Owen (1990), Deegan (2002, p. 292) surmises that if an organisation is perceived by its broader society as being legitimate, then society confers a state of legitimacy to the organisation. Therefore, organisations facing greater exposure to public policy processes are more likely to seek legitimacy through managing social and environmental problems, improving social and environmental performance and disclosing more social and environmental information.
In combating climate change and carbon emissions, environmentally sensitive industries are more likely to be threatened by breaches of social legitimacy. Highly polluting companies in the public eye may bear more social and political risks and may be more willing to improve carbon efficiency and performance than non-heavily polluting companies. Therefore, the second objective of this paper is to explore and understand whether and how carbon efficiency outcomes differ between environmentally sensitive and non-sensitive industries.
2.3 Mandatory disclosure and environmental performance
Although mixed results have been found in previous literature examining the relationship between voluntary disclosure and environmental performance (e.g. Ingram & Frazier 1980; Freedman & Wasley 1990; Patten 2002; Al-Tuwaijri, Christensen & Huges 2004; Cho & Patten 2007;

Journal of the Asia-Pacific Centre for Environmental Accountability
164
Clarkson et al. 2008), extant studies of mandatory schemes largely agree that there tends to be a positive relationship between mandatory disclosure requirements and environmental performance (Mobus 2005; Delmas, Montes-Sancho & Shimshack 2010; Liu et al. 2010). Mobus (2005) finds that firms would increase their regulatory compliance levels when a mandatory disclosure program of noncompliance is in place. Delmas, Montes-Sancho and Shimshack (2010) reveal that mandatory disclosure programs in the US electricity industry helped achieve stated policy goals and the proportion of fossil fuels decreases while the proportion of clean fuels increases in response to the mandatory disclosure programs. The study of Liu et al. (2010) indicates that companies with lower ratings in the mandatory government-orientated environmental disclosure program in China are more likely to improve their environmental performance in subsequent years. This may reflect the shame and fear theory where companies fear that to be listed as low ranking performers attracts negative political attention; therefore, lower rating companies are more likely to improve environmental performance (Stephan 2002).
Nevertheless, Delmas, Montes-Sancho and Shimshack (2010) highlight that mandatory disclosure programs may sometimes produce unintended consequences: they find that clean firms became cleaner while dirty firms remain unchanged after the mandatory disclosure programs were in place. This result challenges the effectiveness of policy tools such as information disclosure programs. Hence, it is of interest to explore whether a mandatory disclosure requirement such as the NGER scheme could trigger the improvement of corporate carbon efficiency, which forms the third objective of this paper.
3. Data collection
This study uses both environmental and financial data. The environmental data including greenhouse gas emissions and energy consumption information was collected from the Australian NGER 2008-09 and 2009-10. Under the Australian NGER Act 2007 (Section 23), registered controlling corporations are obliged to report information on greenhouse gas emissions and energy consumption to the Greenhouse and Energy Data Officer (GEDO). Since the 2008-2009 financial year the GEDO publishes an extract of the information reported. Section 12 of the NGER Act 2007 set an incremental change for the reporting threshold. In 2008-2009, corporations that had total greenhouse gas emissions (CO2 equivalent or CO2-e)1 above 125 kilotonnes (KT) or total amount of
1 According to the NGER Act 2007, greenhouse gases include carbon dioxide; methane; nitrous oxide; sulphur hexafluoride; specified kinds of hydro fluorocarbons; and specified kinds of perflurorocarbons. Greenhouse gas emissions are measured as kilotonnes of carbon dioxide equivalent (each gas is multiplied by a global warming potential factor to get an equivalent amount of carbon dioxide).

Vol. 18, No. 3, September 2012
165
energy produced or consumed above 500 terajoules (TJ) are required to meet the thresholds for reporting. The thresholds change to 87.5 KT and 350 TJ for 2009-2010 and 50 KT and 200 TJ for later years.
Under the NGER Act, corporations that meet the thresholds are required to report their Scope 1 greenhouse gas emissions, Scope 2 greenhouse gas emissions, and total energy consumption. According to the explanatory information released in 2008-09 and 2009-10 NGER data, Scope 1 emissions are greenhouse gases released into the atmosphere as a direct result of an activity or series of activities that constitute the facility. An example of this would be gases emitted by burning coal to generate electricity at an electricity production facility. Scope 1 emissions are more likely generated by energy intensive (i.e. environmentally sensitive) industries such as oil/gas exploration, mining and minerals, chemicals, transportation, utilities, etc., where greenhouse gas emissions are directly linked to their production processes or activities.
Scope 2 emissions are greenhouse gases emitted at a second facility because of the electricity, heating, cooling or steam that is consumed at the facility. An example would be emissions in a car factory because of its use of electricity for lighting. Scope 2 emissions from one facility are part of Scope 1 emissions from another facility. While energy intensive industries may still have high Scope 2 emissions, some non-environmentally sensitive industries may also be heavy Scope 2 emitters (i.e. heavy energy consumers) because of their consumption of electricity, heating, cooling or steam2.
Facility-based energy consumption is the use or disposal of energy from the operations of the facility including own use and losses in extraction, production and transmission. As energy may be consumed when it is transformed into other energy products, some forms of energy produced upstream at one facility may be a downstream input for use or conversion to other energy forms at the same or different facility.
The financial data of the NGER registered corporations were mainly sourced from the Company 360˚ Select database which contains not only public company financials, but large private companies in Australia. Missing data from this source was supplemented by financial data in FinAnalysis which is limited to Australian Stock Exchange (ASX) listed companies. To match the environmental data from the NGER, financial
2 It is acknowledged that there are other indirect emissions which are classified as Scope 3 emissions. Scope 3 emissions are potential emissions embodied in fuels or synthetic greenhouse gases which a corporation imports, produces or supplies (NGER Act 2007). Although the definition of eco-efficiency relies on life-cycle analysis which includes Scope 3 emissions but is ignored in Scope 1 and 2 emissions calculations, the NGER data does not include Scope 3 emissions.

Journal of the Asia-Pacific Centre for Environmental Accountability
166
data included revenue and profit data in 2008-09 and 2009-10 financial years3.
In 2008-09, 233 corporations registered and reported their greenhouse and energy data to the GEDO. In 2009-10, 295 corporations registered and provided their data, which included 73 new registrants and 11 de-registrations. Only one quarter of the registrants are ASX listed companies and about half of the registrants are private companies. The remaining includes one quarter public unlisted corporations (mainly foreign- and state-owned companies) and a few non-corporate organisations, such as universities, local government, unit trust and not-for-profit (NFP) organisations. As some companies do not have two years of environmental data and many financials in private companies and non-corporate organisations are not available, the total number of registered corporations included in this study is 155, including 58 ASX listed companies, 43 public unlisted companies and 54 private companies. The sample corporations contain full environmental and financial data for both 2008-09 and 2009-10 reporting years. Table 1 summarises the profile of sample registrants.
Table 1: Profile of sample registrants
Registrants Type 2009 registrants
2010 registrants
Paired Samples (2009 & 2010)
Publicly listed (ASX) 61 69 58 Publicly unlisted 57 68 43 Private 104 142 54 Others (NFP, trust, local council, etc.)
11 16 0
Total 233 295 155 As discussed previously on legitimacy and environmental sensitivity, close attention has been paid to emission- or energy-sensitivity of different industries. According to the Global Industry Classification Standard (GICS) adopted by the Australian Stock Exchange, industries can be classified into ten sectors: energy, materials, industrials, consumer discretionary, consumer staples, health care, financials, information technology, telecommunication services, and utilities. The materials sector, mainly chemicals, construction materials, metals, and mining, dominates the NGER registrants. The sample data in this study include 55 (35.5%) materials, followed by 26 (16.8%) utilities mainly electric and gas utilities, 17 (11%) industrials mainly capital goods and transportation, 16
3 It is acknowledged that some private companies may have reporting dates different from a normal financial year used in the NGER. The variation of the reporting period could be between one to six months. Given that financials of a company, such as revenue and earnings, are likely to be consistent in a short period of time, the potential variation generated because of such time difference is considered minimal.

Vol. 18, No. 3, September 2012
167
(10.3%) consumer staples mainly food and beverage, 15 (9.7%) financials mainly bank and real estate, 12 (7.7%) energy mainly oil and gas exploration and production, 10 (6.5%) consumer discretionary mainly consumer services, automobiles, retailing and media, 3 (1.9%) health care, and 1 (0.6%) telecommunication services. Table 2 presents the industry distribution of the sample registrants.
Table 2: Industry sectors of sample registrants
Industry sector Sample registrants Materials 55 Utilities 26 Industrials 17 Consumer staples 16 Financials 15 Energy 12 Consumer discretionary 10 Health care 3 Telecommunication services 1 Total 155 It should be noted that this study does not attempt to draw a random sample to achieve generalisability, given the small number of corporate registrants and the lack of information in private companies. However, the sample registrants were compared with the total registrants in the NGER data and it appeared that the industry distribution of the sample registrants follows the same pattern in the total registrants.
4. Carbon efficiency measurements
Carbon efficiency in this study is measured based on the definition of eco-efficiency (Schaltegger & Burritt 2000) expressed as:
Eco-efficiency=financial performance/environmental performance
Key financial performance indicators of a company include its revenue and profit. Eco-efficiency based on the revenue measurement reflects a corporation’s ability to create/add corporate value per unit of environmental impact created/added. To match with environmental performance measured as greenhouse gas emissions and energy consumption from corporate operating processes and activities, revenue in this study includes operating revenue excluding other comprehensive income that is not directly attributed to corporate operations, e.g. gains from asset revaluation or foreign currency exchange. Therefore, carbon efficiency based on the revenue measurement can be expressed as follows:

Journal of the Asia-Pacific Centre for Environmental Accountability
168
Carbon efficiency1=Operating revenue generated/Scope 1 CO2-e emitted; Carbon efficiency2=Operating revenue generated/Scope 2 CO2-e emitted; Carbon efficiency3=Operating revenue generated/Energy consumed.
From a shareholder’s perspective, return on their investment is of most concern. This return is reflected as profit distributable to shareholders. While earnings before interest and tax (EBIT) or earnings before interest, tax, depreciation and amortisation (EBITDA) may better reflect a corporation’s asset efficiency and potential to generate future cash flows, net profit after tax (NPAT) is more directly linked to return on shareholder’s equity investment. Therefore, carbon efficiency based on net profit available to shareholders reflects a corporation’s ability to yield NPAT per unit of carbon emission created/added. Therefore carbon efficiency based on the profit measurement can be expressed as:
Carbon efficiency4 = NPAT / Scope 1 CO2-e emitted; Carbon efficiency5 = NPAT / Scope 2 CO2-e emitted; Carbon efficiency6 = NPAT / Energy consumed.
5. Results
There is no surprise that utilities, energy and materials industries are heavy emitters or energy consumers reflected in the NGER data. Examples include Macquarie Generation, Delta Electricity Australia Pty Ltd, Woodside Petroleum Ltd, Exxonmobil Australia Pty Ltd and Rio Tinto Ltd. As Macquarie Generation, the largest electricity company in Australia, claimed, the carbon tax scheme will have significant impact and may lead such companies to incur larger financial losses than other companies in Australia (Macquarie Generation 2011).
3,942
9,554
10,020
20,742
41,807
115,094
326,204
435,285
1,031,791
0 200,000 400,000 600,000 800,000 1,000,000 1,200,000
Energy
Materials
Industrials
Utilities
Consumer Staples
Health Care
Consumer Discretionary
Telecommunication
Financials
A$
Figure 1: Carbon efficiency1 – Operating revenue generated per tonne of Scope 1 CO2-e emissions
When integrating economic performance with environmental performance the carbon efficiency outcomes show useful results: Figures 1 and 2 report
Vol. 18, No. 3, September 2012
169
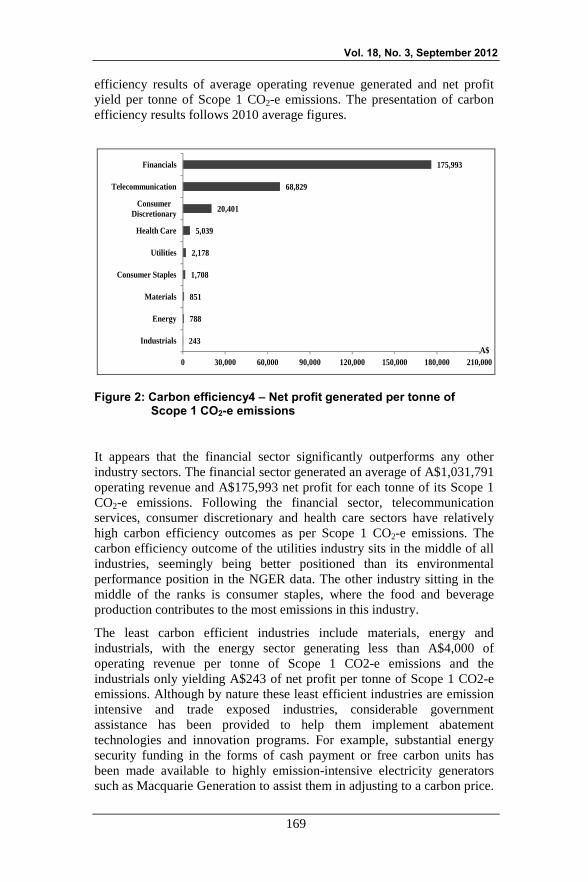
efficiency results of average operating revenue generated and net profit yield per tonne of Scope 1 CO2-e emissions. The presentation of carbon efficiency results follows 2010 average figures.
243
788
851
1,708
2,178
5,039
20,401
68,829
175,993
0 30,000 60,000 90,000 120,000 150,000 180,000 210,000
Industrials
Energy
Materials
Consumer Staples
Utilities
Health Care
Consumer Discretionary
Telecommunication
Financials
A$
Figure 2: Carbon efficiency4 – Net profit generated per tonne of Scope 1 CO2-e emissions
It appears that the financial sector significantly outperforms any other industry sectors. The financial sector generated an average of A$1,031,791 operating revenue and A$175,993 net profit for each tonne of its Scope 1 CO2-e emissions. Following the financial sector, telecommunication services, consumer discretionary and health care sectors have relatively high carbon efficiency outcomes as per Scope 1 CO2-e emissions. The carbon efficiency outcome of the utilities industry sits in the middle of all industries, seemingly being better positioned than its environmental performance position in the NGER data. The other industry sitting in the middle of the ranks is consumer staples, where the food and beverage production contributes to the most emissions in this industry.
The least carbon efficient industries include materials, energy and industrials, with the energy sector generating less than A$4,000 of operating revenue per tonne of Scope 1 CO2-e emissions and the industrials only yielding A$243 of net profit per tonne of Scope 1 CO2-e emissions. Although by nature these least efficient industries are emission intensive and trade exposed industries, considerable government assistance has been provided to help them implement abatement technologies and innovation programs. For example, substantial energy security funding in the forms of cash payment or free carbon units has been made available to highly emission-intensive electricity generators such as Macquarie Generation to assist them in adjusting to a carbon price.

Journal of the Asia-Pacific Centre for Environmental Accountability
170
However, the results show that this is still an area needing significant improvement. If tonnes of greenhouse gas emitted while producing oil or cement have only added a few thousand dollars to corporate value, yet heavy pollution is emitted while burning diesel oil in trucks have only yielded a few hundred dollars return on shareholders’ equity investment, the way carbon efficiency is managed in these industries is questionable. Given that Scope 1 CO2-e emissions are mostly direct results of production activities and these energy intensive industries are mostly resource suppliers or deliverers, lack of improvement in cleaner production and using cleaner fuels may largely contribute to these low carbon efficiency outcomes.
Figure 3 reports the operating revenue generated per tonne of Scope 2 CO2-e emissions while Figure 4 focuses on net profit earned per tonne of Scope 2 CO2-e emissions.
15,066
18,021
20,989
58,748
62,270
94,107
179,929
374,529
514,670
0 100,000 200,000 300,000 400,000 500,000 600,000
Consumer Staples
Telecommunication
Consumer Discretionary
Health Care
Financials
Utilities
Energy
Materials
Industrials
A$
Figure 3: Carbon efficiency2 – Operating revenue generated per tonne
of Scope 2 CO2-e emissions

Vol. 18, No. 3, September 2012
171
523
895
1,117
1,127
2,850
2,931
7,229
20,880
47,492
0 5,000 10,000 15,000 20,000 25,000 30,000 35,000 40,000 45,000 50,000
Consumer Staples
Financials
Consumer Discretionary
Industrials
Telecommunication
Health Care
Materials
Utilities
Energy
A$
Figure 4: Carbon efficiency5 – Net profit generated per tonne of
Scope 2 CO2-e emissions
In contrast to the carbon efficiency results for Scope 1 CO2-e emissions, the carbon efficiency outcomes for Scope 2 CO2-e emissions reveal a completely different picture. The previous higher performers, such as financials, telecommunication services, health care, consumer discretionary, all move down the list, while the previous worst performers, such as materials, energy and industrials, have generated much higher operating revenue and net profit per tonne of Scope 2 CO2-e emissions. The net profit yield per tonne of Scope 2 CO2-e emissions in the financial sector is A$895/tonne, only slightly better than the lowest profit yield in consumer staples. The carbon efficiency outcome based on revenue measurement in utilities follows the highest performance in industrials, materials and energy, and utilities’ carbon efficiency based on the profit measurement becomes the second best.
The changed pattern may reflect, to some extent, the nature of the industry sector. It is acknowledged that emission-intensive industries, such as materials, energy and utilities, are more likely to create revenue and profit while being associated with Scope 1 emissions. In contrast, non-emission-intensive industries, such as financials and consumer discretionary, are associated with creating value while producing Scope 2 emissions. In comparison with Scope 2 emissions, Scope 1 emissions are larger and more directly linked to value creation activities of corporations. Scope 1 emissions have always been the focus of government regulation and policy. For example, the Australian Government’s Climate Change Plan 2011 (Commonwealth of Australia 2011) requires that only facilities with direct (Scope 1) greenhouse gas emissions of 25,000 tonnes a year or above will be liable under the carbon pricing scheme. Clearly, emission or energy intensive industries will be most heavily impacted by the scheme.
Journal of the Asia-Pacific Centre for Environmental Accountability
172
Based on the carbon efficiency outcomes in Figures 3 and 4, attention is directed to two issues. First, poor carbon efficiency outcomes for Scope 2 emissions in non-emission-intensive industries are largely overlooked in current climate change policy. As Scope 2 emissions are usually smaller and indirectly related to main corporate value creation activities, it is anticipated that non-emission-intensive industries, mainly Scope 2 emitters, should achieve much higher eco-efficiency outputs than their counterparts which are mainly Scope 1 emitters. The evidence gathered in this study, shows that this assumption is incorrect. As discussed previously, the financial sector yielded only A$895 of net profit for each tonne of Scope 2 CO2-e emitted, the consumer discretionary sector achieving just over A$1,000/tonne. It is questionable if tonnes of greenhouse gas emission caused by electricity, heating or cooling consumption while providing financial or consumer services have only generated a few hundred dollars return on shareholders’ equity investment. A recent study in the US (Ackerman & Stanton 2011) shows that one tonne of CO2-e emissions could produce up to US$893 (A$8554) of economic damage and the study estimates that by 2050 these costs could rise up to US$1,550 (A$1,484)/tonne. In this regard, it seems to be equally important that non-emission-intensive industries should significantly improve their eco-efficiency outputs and government policy should be in place to encourage such improvement.
Second, the relationship between Scope 1 and Scope 2 emissions and its implications for carbon footprint management are not considered in current policy making. It is recognised that Scope 2 emissions are part of Scope 1 emissions because Scope 2 emissions are related to consumption of gas, electricity, heat or steam which are generated/produced by Scope 1 emitters. However, demand from consumption largely determines the generation/production level. The ever-growing demands for energy and resources speed up production of energy and resources. The key area of current carbon policy focus is on production and emission limitation in production processes rather than consumption. Under the carbon pricing mechanism, Scope 1 emitters have to bear the major costs of carbon pollution, although part of such costs may eventually be absorbed by consumers. It has been increasingly accepted that no matter how strict regulation of production is, important environmental problems will remain as many problems are closely related to consumption and lifestyles but do not result directly from dangerous or inefficient production processes (Murphy 2001; Sanne 2002). Therefore, achieving sustainability needs an integration of environmental considerations into energy consumption practices rather than simply enforcing technological changes in production processes. The poor carbon efficiency outcomes in non-emission intensive industries (Scope 2 emitters) seem not only to be sending warning signals to managers in these industries to improve integrated performance even 4 US$1 = A$0.9577 as of 19 September 2012

Vol. 18, No. 3, September 2012
173
though their carbon footprints are indirect and less visible, but also provide implications to government policy makers that a shift of policy from production/supply focused to consumption/demand focused is needed.
120
338
418
525
1,485
2,390
3,439
4,099
11,720
0 2,000 4,000 6,000 8,000 10,000 12,000 14,000
Energy
Materials
Utilities
Industrials
Consumer Staples
Health Care
Consumer Discretionary
Telecommunication
Financials
A$
Figure 5: Carbon efficiency3 – Operating revenue generated per GJ of energy consumption
13
34
36
50
51
108
217
648
1,701
0 200 400 600 800 1,000 1,200 1,400 1,600 1,800
Industrials
Materials
Utilities
Energy
Consumer Staples
Health Care
Consumer Discretionary
Telecommunication
Financials
A$
Figure 6: Carbon efficiency6 – Net profit generated per GJ of energy
consumption
The last set of carbon efficiency results focus on energy consumption. Figure 5 reports operating revenue generated per gigajoule (GJ) of energy

Journal of the Asia-Pacific Centre for Environmental Accountability
174
consumption and Figure 6 reports net profit per GJ of energy consumption.
As total energy consumption is consistent with total emissions (from both Scope 1 and Scope 2 emitters) and a greater proportion of total emissions are Scope 1 emissions, the carbon efficiency results for total energy consumption are in line with those for Scope 1 emissions. That is, non-direct emission intensive industries outperform most direct emission intensive industries. For example, the financial sector created A$11,720 of revenue and A$1,701 of net profit per GJ of energy consumption, followed by telecommunication, consumer discretionary and health care. In contrast, energy created only A$120 of revenue and industrials yielded A$13 of net profit per GJ of energy usage.
Table 3: Paired samples comparison of carbon efficiency between 2009 and 2010
Eco-efficiency indicators t-stat Sig.
Operating revenue/Scope 1 CO2-e emissions -.760 .449 Net profit/Scope 1 CO2-e emissions 2.042 .043* Operating revenue/Scope 2 CO2-e emissions -.046 .964 Net profit/Scope 2 CO2-e emissions .309 .758 Operating revenue/energy consumption -.741 .460 Net profit/energy consumption 2.582 .011* N=155
* 2-tailed, p< 0.05
Table 3 reports the results of paired sample comparison for carbon efficiency outcomes between the 2008-09 and 2009-10 financial years.
The results in Table 3 highlight three things that are worth discussion and exploration. First, there are statistically significant improvements of carbon efficiency for net profit yield per tonne of Scope 1 CO2-e emission (t = 2.042, p = 0.043) and net profit yield per GJ of energy consumption (t = 2.582, p = 0.011). This is on one level a plausible outcome suggesting the reporting requirement is enabling the change in direct emission reduction. Emission-intensive industries are purposely targeted and receive considerable attention from the media, environmental lobby groups and the broader community. The name and shame disclosure policy is demonstrated to work for heavy emitters who fear the heightened attention due to being listed as a bad performer (Stephan, 2002, p. 196). With carbon pricing coming into effect and heavy emitters pay more, this positive trend is expected to continue.

Vol. 18, No. 3, September 2012
175
Second, the contrasting result is that net profit yield with Scope 2 emissions has not shown any significant improvement. Non-emission-intensive industries make significant contributions to Scope 2 emissions because of their use of energy. However, current reporting requirement is not driving the real move in these industries. Although substantial government grants have been made available to support energy saving and efficiency (e.g. the NSW government has provided financial support for a series of energy saving and efficiency training programs since 2007), companies seem reluctant to make significant changes and improve energy efficiency. Lack of focus or criticism on carbon performance of Scope 2 emitting companies may be part of the reason for such stagnation. This may again reinforce the issue in managing Scope 2 emissions and missing policies at the moment to encourage the reduction of Scope 2 emissions for non-emission-intensive industries.
Lastly, the inconsistent results between revenue and profit measures of carbon efficiency are of interest and deserve attention. It is noted that none of the revenue-based efficiency measures are statistically significant and the negative t-stats suggest a downward trend of carbon efficiency from 2009 to 2010. One possible explanation is that the significant improvements in profit-based efficiency measures for direct emissions are largely attributed to the significant increase of earnings in 2010 after the financial crisis in 2008-09. In this regard, the improvement of carbon efficiency is managed through improving financial performance not the actual improvement in environmental performance.
6. Conclusion
Economic performance and environmental performance, in this case carbon performance, are often managed separately in business practice and examined separately in research. A recent call made by the King III Commission in South Africa (Institute of Directors in Southern Africa 2009) has made integration (performance and reporting) a much needed area for research. Using economic value and profit generated relative to carbon emissions generated as the carbon efficiency measurement this study explores carbon efficiency of registered corporations under Australian NGER.
The findings show that carbon efficiency results vary significantly between industries and between different scopes of emissions. Environmentally sensitive industries (i.e. emission and energy intensive industries) such as materials, energy, utilities and industrials achieved relatively high carbon efficiency results for Scope 2 CO2-e emissions, but low carbon efficiency performance for Scope 1 CO2-e emissions and total energy consumption. A changed pattern was found in non-environmentally sensitive industries (i.e. non-emission and energy intensive industries) such as financials, telecommunication and consumer discretionary, where

Journal of the Asia-Pacific Centre for Environmental Accountability
176
the carbon efficiency outcomes for Scope 1 CO2-e emissions and energy consumption were relatively high but carbon efficiency for Scope 2 CO2-e emissions was low. These results seem not completely in line with the environmental performance reflected in the NGER as worst performers all appear to be environmentally sensitive corporations.
While the finding of poor carbon efficiency performance for direct emissions in environmentally sensitive industries supports current government policies to encourage clean production and clean fuels, the unexpected poor carbon efficiency outcomes for indirect emissions in non-sensitive industries highlights the failure in policies to encourage carbon efficiency improvement in these industries. As non-environmentally sensitive industries are perceived to be less bound by a social contract to gain or maintain legitimacy (Deegan 2002; O’Donovan 2002), their environmental performance is less regulated by government and management of carbon efficiency outputs in these industries is less likely to be on the business agenda.
The comparison of carbon efficiency outcomes in 2008-09 and 2009-10 reporting years indicates that there has not been much significant change in corporate carbon efficiency management after the mandatory disclosure requirements. Although the NGER requirements seem to have triggered the improvement in net profit yield per tonne of Scope 1 CO2-e emissions and per GJ of energy consumption, net profit yield with Scope 2 emissions remains unchanged. This again suggests a policy change is needed to encourage the reduction of Scope 2 emissions for non-environmentally sensitive industries.
References Ackerman, F & Stanton, E 2011, Climate risks and carbon prices: revising the social cost of carbon, Environment Institute-US, Somerville, MA, Stockholm.
Al-Tuwaijri, S, Christensen, T & Hughes II, K 2004, ‘The relations among environmental disclosure, environmental performance, and economic performance: a simultaneous equations approach’, Accounting, Organizations and Society, vol. 29, no. 5-6, pp. 447-471.
Burritt, R & Saka, C 2006, ‘Environmental management accounting applications and eco-efficiency: case studies from Japan’, Journal of Cleaner Production, vol. 14, no. 14, pp. 1262-1275.
Burritt, R & Schaltegger, S 2001, ‘On the interrelationship between eco- efficiency and operational budgeting’, Environmental Management and Health, vol. 2, pp. 158-174.
Cerin, P 2002, ‘Communication in corporate environmental reports’, Corporate Social Responsibility and Environmental Management, vol. 9, pp. 46-66.

Vol. 18, No. 3, September 2012
177
Cho, C & Patten, D 2007, ‘The role of environmental disclosures as tools of legitimacy: a research note’, Accounting, Organizations and Society, vol. 32, no. 7-8, pp. 639-647.
Ciroth, A 2009, ‘Cost data quality considerations for eco-efficiency measures’, Ecological Economics, vol. 68, no. 6, pp. 1583-1590.
Clarkson, P, Li, Y, Richardson, G & Vasvari, F 2008, ‘Revisiting the relation between environmental performance and environmental disclosure: an empirical analysis’, Accounting, Organizations and Society, vol. 33, no. 4-5, pp. 303-327.
Commonwealth of Australia 2011, Securing a clean energy future – the Australian Government’s climate change plan, Australian Government, Canberra.
Deegan, C & Gordon, B 1996, ‘A study of the environmental disclosure practices of Australian corporations’, Accounting and Business Research, vol. 26, no. 3, pp. 187-199.
Deegan, C 2002, ‘The legitimising effect of social and environmental disclosures – a theoretical foundation’, Accounting, Auditing & Accountability Journal, vol. 15, no. 3, pp. 282-311.
Deegan, C, Rankin, M & Tobin, J 2002, ‘An examination of the corporate social and environmental disclosures of BHP from 1983-1997 – a test of legitimacy theory’, Accounting, Auditing & Accountability Journal, vol. 15, no. 3, pp. 312-343.
Delmas, M, Montes-Sancho, M & Shimshack, J 2010, ‘Information disclosure policies: evidence from the electricity industry’, Economic Inquiry, vol. 48, no. 2, pp. 483-498.
Derwall, J, Guenster, N & Koedijk, K 2005, ‘The eco-efficiency premium puzzle’, Financial Analysts Journal, vol. 61, no. 2, pp. 51-63.
Dowling, J & Pfeffer, J 1975, ‘Organizational legitimacy: social values and organizational behaviour’, Pacific Sociological Review, vol. 18, no. 1, pp. 122-136.
Eccles, R & Krzus, M 2010, One report: integrated reporting for a sustainable strategy, John Wiley & Sons, Inc., Hoboken, New Jersey.
Ehrenfeld, J 2005, ‘Eco-efficiency – philosophy, theory, and tools’, Journal of Industrial Ecology, vol. 9, no. 4, pp. 6-8.
Erkko, S, Melanen, M & Mickwitz, P 2005, ‘Eco-efficiency in the Finnish EMAS reports – a buzz word?’, Journal of Cleaner Production, vol. 13, no. 8, pp. 799-813.
Falck, O & Heblich, S 2007, ‘Corporate social responsibility: doing well by doing good’, Business Horizons, vol. 50, no. 3, pp. 247-254.

Journal of the Asia-Pacific Centre for Environmental Accountability
178
Freedman, M & Wasley, C 1990, ‘The association between environmental performance and environmental disclosure in annual reports and 10Ks’, Advances in Public Interest Accounting, vol. 3, pp.183-193.
Frost, G & Wilmshurst, T 2000, ‘The adoption of environment-related management accounting: an analysis of corporate environmental sensitivity’, Accounting Forum, vol. 24, no. 4, pp. 344-365.
Hahn, T, Figge, F, Liesen, A & Barkemeyer, R 2010 ‘Opportunity cost based analysis of corporate eco-efficiency: a methodology and its application to the CO2-efficiency of German companies’, Journal of Environmental Management, vol. 91, no.10, pp. 1997-2007.
Hopkins, M 2005, ‘Criticism of the corporate social responsibility movement’, in R Mullerat (eds), Corporate social responsibility: the corporate governance of the 21st century, Kluwer Law, The Hague, Netherlands.
Hubbard, G 2009, Unsustainable reporting, Royal Institution of Great Britain, London, viewed 3 August 2012, <http://www.corporateregister.com/crra/2008-ceremony/media/ UnsustainableReporting.pdf>.
Ingram, R & Frazier, K 1980, ‘Environmental performance and corporate disclosure’, Journal of Accounting Research, vol. 18, no. 2, pp. 614-622.
Institute of Directors in Southern Africa 2009, King code of governance for South Africa 2009, Johannesburg, viewed 2 March 2012, <http://www.ecgi.org/codes/documents/king3.pdf>.
Kiernan, M 2007, ‘Universal owners and ESG: leaving money on the table?’, Corporate Governance – An International Review, vol. 15, no. 3, pp. 478-485.
Konar, S & Cohen, MA 2001, ‘Does the market value environmental performance?’, Review of Economics and Statistics, vol. 83, no. 2, pp. 2814-2890.
Korhonen, J & Seager, T 2008, ‘Beyond eco-efficiency: a resilience perspective’, Business Strategy and the Environment, vol. 17, pp. 411-419.
KPMG 2008, International survey of corporate responsibility reporting 2008, KPMG International.
KPMG 2010, Integrated reporting: closing the loop of strategy, KPMG International.
Liu, X, Yu, Q, Fujitsuka, T, Liu, B, Bi, J & Shishime, T 2010, ‘Functional mechanisms of mandatory corporate environmental disclosure: an empirical study in China’, Journal of Cleaner Production, vol. 18, no. 8, pp. 823-832.

Vol. 18, No. 3, September 2012
179
Lo, SF & Sheu, HJ 2007, ‘Is corporate sustainability a value-increasing strategy for business?’, Corporate Governance – An International Review, vol. 15, no. 2, pp. 345-358.
Macquarie Generation 2011, Carbon Tax Impact, news released in July, 2011, viewed 5 March 2012, <http://www.macgen.com.au/News/News-Items/2011/Carbon-Tax-impact.aspx?iframe=true&innerWidth=718&innerHeight=500>
Mobus, J 2005, ‘Mandatory environmental disclosures in a legitimacy theory context’, Accounting, Auditing & Accountability Journal, vol. 18, no. 4, pp. 492-517.
Murphy, J 2001, ‘From production to consumption: environmental policy in the European union’, in M Cohen & J Murphy (eds), Exploring sustainable consumption: environmental policy and the social sciences, Elsevier Science, Oxford, pp. 39-60.
O’Donovan, G 2002, ‘Environmental disclosures in the annual report: extending the applicability and the predictive power of legitimacy theory’, Accounting, Auditing & Accountability Journal, Vol. 15, no. 3, pp. 344-371.
Owen, D 1990, ‘Towards a theory of social investment: a review essay’, Accounting, Organizations and Society, vol. 15, no. 4, pp. 249-265.
Patten, D 2002, ‘The relation between environmental performance and environmental disclosure: a research note’, Accounting, Organizations and Society, vol. 27, no. 8, pp. 763-773.
Porter, M & van der Linde, C 1995, ‘Green and competitive: ending the stalemate’, Harvard Business Review, September-October, pp. 120-135.
Porter, M & Kramer, M 2006, ‘The link between competitive advantage and corporate social responsibility’, Harvard Business Review, December, pp. 1-15.
Sanne, C 2002, ‘Willing consumers - or locked-in? Policies for a sustainable consumption’, Ecological Economics, vol. 42, no. 1-2, pp. 273-287.
Schaltegger, S & Wagner, M (ed.) 2006, Managing the business case for sustainability: the integration of social, environmental and economic performance, Greenleaf Publishing, Sheffield.
Schaltegger, S & Burritt, R 2000, Contemporary environmental accounting: issues, concepts and practice, Greenleaf Publishing, Sheffield.
Schnietz, K & Epstein, M 2005, ‘Exploring the financial value of a reputation for corporate social responsibility during a crisis’, Corporate Reputation Review, vol. 7, no. 4, pp. 327-345.
Journal of the Asia-Pacific Centre for Environmental Accountability
180
Seeger, M & Hipfel, S 2007, ‘Legal versus ethical arguments: contexts for corporate social responsibility’, in G Cheney, J Roper, & S May (eds), The debate over corporate social responsibility, Oxford University Press, New York. pp. 155-166.
Spicer, B 1978, ‘Investors, corporate social performance, and information disclosure: an empirical study’, The Accounting Review, vol. 53, no. 1, pp. 94-111.
Stephan, M 2002, ‘Environmental information disclosure programs: they work but why?’, Social Science Quarterly, vol. 83, no. 1, pp. 190-205.
Waddock, S & Graves, S 1997, ‘The corporate social performance-financial performance link’, Strategic Management Journal, vol. 18, no. 4, pp. 303-319.
Wahba, H 2008, ‘Does the market value corporate environmental responsibility? An empirical examination’, Corporate Social Responsibility and Environmental Management, vol. 15, no. 2, pp. 89-99.
World Business Council for Sustainable Development (WBCSD) 2000, Eco-efficiency: creating more value with less impact, viewed 3 September 2012, <http://www.wbcsd.org/web/publications/eco_efficiency_creating_more_value.pdf>.

Vol. 18, No. 3, September 2012
181
Corporate sustainability accounting: beyond unfreezing
Dimitar ZVEZDOV Centre for Sustainability Management Leuphana University Lüneburg Germany Email: [email protected] Abstract
The adoption of sustainability accounting practices has hardly been examined to date. To facilitate companies in dealing with sustainability issues, an understanding of the challenges in the adoption of sustainability accounting practices needs to be gained. This empirical paper conducts a qualitative analysis on related developments, based on research data collected in 16 companies in the UK and Germany. The paper adopts a change management perspective to identify obstacles in the adoption of sustainability accounting practices and groups these in three stages – unfreezing, moving and refreezing. The analysis clearly classifies the companies to the three stages proposed. Most companies are located in the unfreezing stage, because of the complex challenges identified in overcoming this stage. In consequence, the challenges beyond unfreezing have yet to be addressed. The insights gained shed light on challenges in the process of adopting sustainability accounting practices and contribute to accelerating their adoption.
Keywords
Sustainability accounting, change, progress, unfreezing
1. Sustainability accounting: supporting corporate sustainability management
Corporate sustainability has become a topical issue in various fields of management research such as innovation (Brown & Ulgiati 2002), strategy (Frow, Marginson & Ogden 2005), and management control (Henri & Journeault 2010); and has also gained importance in practice (e.g. Schaltegger, Gibassier & Zvezdov 2011). For the purposes of this paper, corporate sustainability management is considered to comprise the explicit consideration of social and environmental issues in order to improve the performance of the company and enable it to contribute to the development of society and economy in general (Schaltegger & Burritt 2005).
Recent research provides evidence that tackling sustainability issues can contribute towards the long term success of companies (e.g. Wang, Choi

Journal of the Asia-Pacific Centre for Environmental Accountability
182
& Li 2008). Yet, addressing these issues poses various challenges to managers, who struggle to develop an understanding of the linkages between sustainability management and financial performance (e.g. Schaltegger & Wagner 2006). Furthermore, successful corporate management not only needs to understand existing linkages but also how to create new ones. This is where sustainability information can play a decisive role. Corporate sustainability accounting has been identified as one approach to generating, providing, and using such information (Schaltegger & Burritt 2010).
Corporate sustainability accounting, earlier referred to as social or environmental accounting, has been widely discussed in a growing body of literature (Burritt & Schaltegger 2010; Parker 2005; Schaltegger, Gibassier & Zvezdov 2011). Two streams of environmental, and later on, sustainability accounting literature have been distinguished (Schaltegger & Burritt 2010). The critical social accounting perspective has questioned the contribution of management accounting to sustainable development (e.g. Gray 2010). The management approach to sustainability accounting, on the other hand, has been developing the discipline to support corporate sustainability management (Burritt & Schaltegger 2010). In its latter interpretation, sustainability accounting has been attributed numerous functions – from being an empty buzz word, through an umbrella term, to a holistic approach towards measuring and managing sustainability performance (Schaltegger & Burritt 2010, p. 379).
Engaging with sustainability accounting poses numerous challenges beyond the technical aspects of accounting, such as understanding how such activities can contribute to improving performance and overcoming resistance. Thus, to facilitate the adoption of sustainability accounting practices, a broader understanding of the adoption process and related challenges is required.
Based on an analysis of the data collected in 16 companies with good sustainability reputations, the following paper depicts the adoption of sustainability accounting practice, thereby pointing out current and upcoming challenges that management has to consider for the successful adoption of such activities.
The paper is structured as follows. The following section outlines the status of dissemination of corporate sustainability accounting and highlights the need for better understanding of the challenges in adopting sustainability accounting practices. Section 3 gives an overview of the research approach adopted in investigating the above research question. Section 4 presents the results and discusses the findings. The concluding section points out the importance of the findings with regard to the transfer of knowledge in the field and highlights the need for further research.

Vol. 18, No. 3, September 2012
183
2. Adoption of sustainability accounting in the context of change
2.1 Perpetual change in management accounting thinking
Change has been recognised as the normal condition of business (Hopwood 1990). Perpetual change in management accounting has been documented throughout more than a century of modern management accounting history (e.g. Burns & Scapens 2000; Burns & Vaivio 2001; Parker & Ritson 2011). The dynamics of accounting change in terms of new practices, routines, institutions, power and politics have been investigated (e.g. Burns 2000). One conclusion drawn by this through research is that within – as well as beyond – the accounting context, change has been used as synonym for progress (Siti-Nabiha & Scapens 2005). Therefore, investigating the progress in accounting in the light of corporate sustainability is of increasing relevance for supporting informed decision-making.
2.2 Sustainability accounting as innovation
Initially popularised by Rogers (1962, 2003) diffusion of innovations has been a topical field in explaining how, why, and at what rate new ideas and technology spread through cultures. Rogers (1962) proposes five innovation adoption categories: innovators, early adopters, early majority, late majority, and laggards. This model has been further developed in identifying innovation success in the business context (Abrahamson 1991, 1996).
Several authors have described the diffusion of (sustainability) accounting practice based on this notion (e.g. Firth 1996; Schaltegger & Burritt 2010). Numerous case studies on the implementation of environmental accounting have been produced (e.g. Burritt, Herzig & Tadeo 2009; Larrinaga-Gonzalez & Bebbington 2001; Schaltegger, Viere & Zvezdov 2012). These serve as an indication of the diffusion of sustainability accounting practice.
Although research in the field has been on the agenda for over four decades (e.g. Gray 2001), the latter of two of which adopted a managerial perspective (Schaltegger, Gibassier & Zvezdov 2011), the empirical evidence in the field has been mainly based on case studies (Schaltegger, Gibassier & Zvezdov 2011). Few studies have captured and analysed the adoption of sustainability accounting in practice (Bennett, Schaltegger & Zvezdov 2011). Therefore, this paper focuses on the progress of sustainability accounting adoption in companies.
2.3 Mapping out progress in sustainability accounting
Numerous theoretical approaches have been applied to observe and describe change in organisational and accounting practice. Kezar (2001)
Journal of the Asia-Pacific Centre for Environmental Accountability
184
proposes six main categories of theories of change that assist in understanding, describing, and developing insights about the organisational change process: (a) evolutionary, (b) teleological, (c) life cycle, (d) dialectical, (e) social cognition, and (f) cultural. This contribution observes corporate practice from the life-cycle perspective of Lewin’s change model (Lewin 1947), whereby a three-stage model of unfreezing, moving and refreezing is proposed. Although over 60 years have passed, his model is still discussed (e.g. Fernandez & Rainey 2006; Ong & Wang 2011; Schein 1996) and applied widely (e.g. Andrews & Chompusri 2005; Bargal 2006; Goodman & Truss 2006; Ho 2000; Kotter & Schlessinger 2008; Sauser & Sauser 2002), also in the field of management information (e.g. Cooper & Zmund 1990; Grover et al. 1995; Ginzberg 1978). In addition to its popularity, this framework also provides a neat and simple measure of progress. In particular, the latter aspect allows a relatively straightforward categorisation of available data and thus suits the needs of this research adequately.
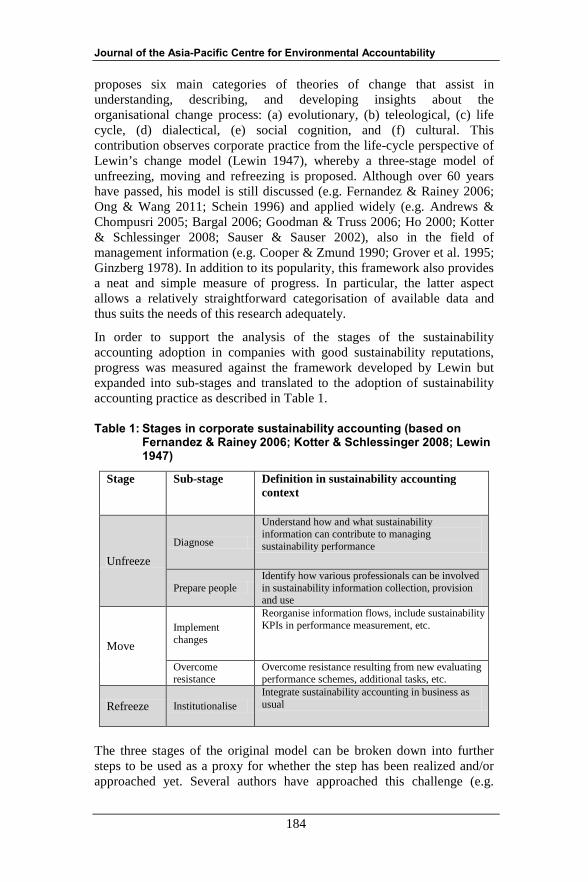
In order to support the analysis of the stages of the sustainability accounting adoption in companies with good sustainability reputations, progress was measured against the framework developed by Lewin but expanded into sub-stages and translated to the adoption of sustainability accounting practice as described in Table 1.
Table 1: Stages in corporate sustainability accounting (based on Fernandez & Rainey 2006; Kotter & Schlessinger 2008; Lewin 1947)
Stage Sub-stage Definition in sustainability accounting context
Unfreeze Diagnose
Understand how and what sustainability information can contribute to managing sustainability performance
Prepare people Identify how various professionals can be involved in sustainability information collection, provision and use
Move Implement changes
Reorganise information flows, include sustainability KPIs in performance measurement, etc.
Overcome resistance
Overcome resistance resulting from new evaluating performance schemes, additional tasks, etc.
Refreeze Institutionalise Integrate sustainability accounting in business as usual
The three stages of the original model can be broken down into further steps to be used as a proxy for whether the step has been realized and/or approached yet. Several authors have approached this challenge (e.g.

Vol. 18, No. 3, September 2012
185
Fernandez & Rainey 2006; Kotter & Schlessinger 2008), proposing the above five intermediate steps.
Diagnosing the situation not only requires the realization that the status quo of practice is no longer a suitable approach to managing corporate performance but also requires understanding of how and what sustainability information can contribute to managing sustainability performance (e.g. Schaltegger & Burritt 2000). This arises from the fact that sustainability information can vary greatly (Burritt, Hahn & Schaltegger 2002), depending on the needs of its users (Schaltegger & Burritt 2000). Diagnosing also requires that examples are produced to point out the linkages between sustainability management and corporate (financial) performance (e.g. Klassen & McLaughlin 1996; Schaltegger & Wagner 2006).
The challenges of preparing people arise from several perspectives. On the one hand, how various professionals can be involved in sustainability information collection, provision and use needs to be identified. To date, the collection, provision and use of sustainability information have, however, not been subject to extensive research (e.g. Burritt, Schaltegger & Zvezdov 2011). Thus companies are forced to approach the issue on a trial-and-error basis.
Implementing change in sustainability information management is related to numerous operational challenges. Among these are reorganizing information flows (Schaltegger & Burritt 2000), designing and implementing sustainability KPIs for performance measurement (Adams & Frost 2008; Schaltegger 2011), and assigning responsibilities (Bennett, Schaltegger & Zvezdov 2012). In particular, in times of information overload (Edmunds & Morris 2000; Eppler & Mengis 2010), it is necessary that the benefit of this information for performance evaluation and decision-making is higher than the resources invested in adopting sustainability accounting practices.
Overcoming resistance has been subject to research within (Hoffman & Bazerman 2007; Kemp, Schot & Hoogma 2007) and outside (Hong & Kim 2002; Poon & Wagner 2001) sustainability management literature. In the management accounting context, resistance has been observed to result from new performance evaluation schemes, additional tasks, etc. (Scapens & Roberts 1993) and to become more apparent after the first wave of enthusiasm has subsided. Furthermore, resistance can also emerge from higher-level management, when their performance is re-evaluated based on the achievement of sustainability key performance indicators (Woodburn 2004).
Institutionalising corporate sustainability accounting falls into the third stage of Lewin’s model and thus can be seen as the most advanced stage of development. It can be characterised with the integration of sustainability accounting in business as usual. From a practitioner’s

Journal of the Asia-Pacific Centre for Environmental Accountability
186
perspective that could mean no separated team in charge of sustainability information is needed. Instead, such a team is leaner and focuses its efforts on supporting the activity rather than being in complete charge of it.
3. Research background and data
3.1 Data collection In order to explore the corporate practice of sustainability accounting, a research project was set up and conducted in 2009 and 2010, whereby 58 face-to-face interviews with respondents in 16 British and German-based companies took place. One of the objectives of the project was to explore the current stage of development in corporate sustainability accounting in leading companies. Critical aspects of the development and adoption of sustainability accounting practices were expected to be revealed through the focus on companies with good sustainability performance. To qualify as suitable participants in the project, companies had to have a good reputation in the area of sustainability, i.e. they had to (i) have received an award for their sustainability performance or (ii) have been included in sustainability rankings such as Dow Jones Sustainability Index. In addition, (iii) companies had to have an extensive sustainability report that conforms with GRI guidelines.
The lack of research on the practice of sustainability accounting motivated an exploratory research approach to generate indicative findings that could both inform practice elsewhere and indicate potential areas for further research. Sustainability accounting practice was thus examined without a former development of hypotheses. Thus, the focus was on identifying aspects which had previously been neglected, such as the type of information, the methods of data collection and preparation, and the actors involved. Subsequent topics emerged such as the development of corporate practice.
The data was collected in semi-structured interviews. To encourage open communication, the interviews were not recorded. Initial interviews were held in each company with the sustainability manager, whereby subsequent interviewees, providers or users of sustainability information, were identified. For the purpose of data triangulation, corporate data and publicly available information such as reports were used. Further data triangulation was achieved by using (i) the interviewee’s perception of their own role, (ii) subsequent interviewees’ perceptions of earlier interviewees’ roles in each company, and (iii) factual information such as internal documents describing internal responsibilities and tasks.
3.2 Data analysis The data was analysed in terms of the identified stages of development. Based on the data obtained during the interviews and triangulated with

Vol. 18, No. 3, September 2012
187
other available information, each of the five stages in Table 1 was analysed based on four steps, namely whether an issue (a) has been recognised, (b) recognised but not dealt with, (c) recognised and dealt with, and (d) recognised and dealt with successfully. Although the four steps can constitute an iterative process, i.e. once a certain step is concluded, it may need to be revised in the future, the unit of analysis was the whole process of sustainability accounting. For example, some companies reported they had initially implemented changes in their information management system to provide only cost-relevant information. However, with the increasing understanding of sustainability issues over time, the importance of additional considerations became apparent. This in turn required that related information also be collected requiring re-diagnosis of the situation (see Section 4).
The results presented in sections 4.2 to 4.4 are supported by qualitative data gathered in each of the interviews that informs the analysis of the challenges in each stage. In order to qualify as relevant, the narrated explanations and statements had to have been made by at least 1/3 of the interviewees.
4. Results and interpretation
4.1 Where do sustainability pioneers stand?
In order to have experience with sustainability accounting practice, companies chosen for examination were expected to have a good sustainability reputation. Numerous challenges with sustainability accounting had been faced and, in many cases, resolved. Through constant comparison, however, differences in the stage of progress became apparent. Table 2 presents these differences based on Lewin’s modified framework.
Each stage of engagement with sustainability accounting presents a different set of challenges for management. Some companies appear to be more advanced in their sustainability accounting practices than others. In turn, different foci of efforts become apparent, depending on what stage the company has reached: a company that has just started looking into sustainability accounting is more focused on identifying relevant performance indicators, figuring out efficient ways of producing the required information and/or looking for ways to make sense of existing sustainability information. More advanced companies, on the other hand, address challenges such as trying to move from project-based activities to a systematic approach to sustainability accounting, in an attempt to secure long-term resources.

Journal of the Asia-Pacific Centre for Environmental Accountability
188
Table 2: Results based on 58 interviews in 16 leading UK and German-based companies.
Stages of engagement with sustainability accounting
Unfreezing Changing Refreezing
Company Diagnose Prepare people
Implement changes
Overcome resistance
Institutionalise
Company A ✔ ● ○
Company B ✔ ✔ ✔ ✔ ●
Company C ✔ ● ○
Company D ✔ ● ○
Company E ✔ ✔ ✔ ● ●
Company F ✔ ✔ ● ●
Company G ✔ ✔ ●
Company H ✔ ✔ ●
Company I ✔ ✔ ✔ ✔ ●
Company J ✔ ● ○
Company K ✔ ✔ ✔ ● ○
Company L ✔ ✔ ●
Company M ✔ ● ○
Company N ● ●
Company O ✔ ✔ ✔ ●
Company P ✔ ✔ ✔
Legend: (no sign): the issue has not been recognised as such yet; ○ (an empty circle): issue has been realised but not dealt with yet; ● (a filled circle): issue has been deal with; ✔ (a check mark): a solution has been found and applied successfully.
The above presentation of the results allows several interesting observations to be made. Probably the most straightforward one is the fact that a measurable variance in sustainability accounting practice

Vol. 18, No. 3, September 2012
189
development could be captured, despite the fact that a fairly homogeneous population (sustainability leaders) was investigated. Nevertheless, the results show that even among this group, major dissimilarities can be observed.
Second, the collected evidence suggests that the unfreezing stage has been approached and largely tackled in this group. This observation is hardly surprising, given the good sustainability reputation of the sample companies, based on which they were chosen to be involved in the project. It can in turn be expected that the vast majority of companies will be approaching challenges related to this stage, as they are behind the leaders in terms of adoption of sustainability accounting practices.
Third, the movement phase appears to have been successfully approached by only few companies, although almost the complete sample appears to have recognised the need to approach related issues. This suggests that major effort has now been concentrated on that stage, which is in fact of rather technical nature, as argued in Section 4.2.
Last but not least, the process of institutionalizing sustainability accounting could not be observed to have taken place. In fact, evidence of approaching issues related to this stage was collected in only three of the 16 companies. This can be supported by the previous observation that the majority of the companies researched appear to be dealing with the ‘moving’ phase, therefore effort can be expected to be concentrated there.
Resting on the above observation that different companies are at different stages and thus focus on different challenges, two key points can be made. First, support needs to be provided in dealing with the challenges in each of the stages. Second, the challenges faced by the most advanced companies are likely to be faced by the other companies as they advance. Therefore, greater effort is required to provide support in the final stage, institutionalising sustainability accounting. The rest of this section presents examples of the challenges faced in the companies researched and discusses these in accordance with Lewin’s change management model.
4.2 Challenges in unfreezing
In the unfreezing phase, the importance of a clear understanding of the needs of the sustainability accounting was highlighted. Several interviewees shared their experience of having difficulty engaging with sustainability accounting as the purpose of the activities was not clear outside the sustainability department. Many other professionals, who were to be involved later on such as information providers, could not see the benefit of such activities to business and considered them to be in competition with their formally agreed objectives.
The involvement of senior management in particular was also identified as crucial in the stage of planning sustainability accounting adoption. Partly due to the perception of the often conflicting nature of sustainability

Journal of the Asia-Pacific Centre for Environmental Accountability
190
management with short-term financial performance, senior management support was in numerous cases reported to be only partially granted. The involvement of senior management was characterized as essential in allocating sufficient resources, motivating people and even reconsidering core business activities.
The need for effective communication that informs various internal stakeholders of the reasons for the change (e.g. for what purpose information needs to be collected), the benefits of successful implementation (what is in it for the company and for that particular person who needs to be involved) was also reported. Interviewees expressed their positive experience with making clear the details of the change so they can be clearly communicated to answer questions such as ‘When?’ ‘Where?’ ‘Who is in charge?’ ‘Who is involved?’ ‘How much will it cost?’
Securing resources was revealed to be another challenge at the unfreezing stage. For example, as the involvement of various departments is needed, it needs to be made sure that capacities for the required tasks are available within these departments. In the sample companies this was not always the case, thus hampering the advancement of sustainability accounting. The concern was also expressed that people were less eager to get engaged if they did not see the long term establishment of such activities.
The need to develop the process in a way that benefits management is also important for the planning change sub-stage. This challenge was reported to have been dealt with by defining measurable stakeholder aims, creating a business case for their achievement (and continuously updating it), and monitoring assumptions, risks, dependencies, costs, return on investment, and cultural issues affecting the progress of the associated work. Providing personal counselling to alleviate any change-related fears was also mentioned as an important factor to consider when planning change to existing management accounting systems.
Preparing employees to be involved in sustainability information flows was identified as a critical factor. Several reasons for this criticality were provided by interviewees. First, employee support was considered indispensable, as they are often the only providers of certain information. For instance, specific detailed information on material consumption was not available in purchasing or bookkeeping, but had a major contribution towards saving resources, once it was provided by a production manager who was aware of the existence and/or relevance of such information. Furthermore, employee involvement was also reported to be essential as employees are familiar with the content behind the information they provide. An example for such a situation from the companies researched was the provision of information on major water consuming activities in production, with major saving potential being neglected as the workers operating the machines had not initially been involved in the water-saving project. Last but not least, it was considered important that all of the

Vol. 18, No. 3, September 2012
191
people involved be informed of what the information they are going to provide will be used for. This was observed to have the positive effect of people being actively involved and contributing with their specific expertise rather than ‘merely ticking the box’.
On the positive side, engaging people in sustainability information provision seems less challenging compared to other tasks. Interviewees in higher management positions expressed their feeling that it was in fact easier to motivate people to engage in sustainability accounting than in other projects. This was explained with sustainability issues not being considered in the sole interest of the company, but also as a contribution to society, future generations and the natural environment.
4.3 Challenges in moving
The next stage of Lewin’s model – moving –was also observed to present a set of issues to be addressed. To start off, devising effective education, training and/or skill-upgrading schemes for the organisation were reported to have been successful in the companies where it was applied. People who were more familiar with the objectives of a company-wide sustainability accounting were reportedly less likely to exercise resistance by not engaging or engaging only as much as required, thereby not effectively using up potential for improvement.
The implementation of changes was also observed to be particularly critical in terms of securing available resources as the operational aspects of development have been documented to be very demanding. As an example of this challenge, two of the companies reported they were experiencing difficulties in computational power, once the volume of sustainability information had grown substantially. This observation reveals the priority of sustainability management in those companies, given the availability of computational power for other (non-sustainability related) activities in those companies.
The frequency of data and information generation was mentioned as a further important aspect to consider. On the one hand, regular data generation, collection and use were expected and/or reported to increase the efficiency of the process. On the other hand, as identified by Burritt, Hahn & Schaltegger (2002), limiting the scope of the system to such information rendered it unable to take into consideration other decision situations.
The implementation of changes also revealed that information flows need to be designed in view of potential providers, managers, and users of the thus generated information. In several of the researched companies, involving departments not only in the provision of information but also in its use was reported to foster improvement. The explanation for this observation was that these professionals also recognisably benefitted from the innovation, e.g. by meeting other (non-sustainability related) goals.

Journal of the Asia-Pacific Centre for Environmental Accountability
192
Aligning sustainability accounting objectives with the overall strategic direction of the organisation was also observed to facilitate countering employee resistance. For example, monitoring the implementation and fine-tuning plans and activities to fit the specific requirements of the project was recognised as an effective method of dealing with sustainability accounting related change, whenever discrepancies between the objectives of sustainability accounting and other (already established) activities and objectives occurred.
4.4 Challenges in refreezing
The final stage of the change process model, ‘refreezing’, aims to re-establish stability of the newly adopted sustainability accounting activities. The measures in this stage aim to take people and systems from a state of being in transition to a stable and productive state. In practice, refreezing can be a lengthy process as transitions seldom stop cleanly. As Table 2 reveals, only a few companies in the sample have addressed challenges in the refreezing stage.
In two companies, this stage was compared with a tug-of-war game, an exercise of relative power, because the process of engaging with sustainability accounting involves numerous and varied stakeholders. Building change into the formal systems and structures was seen as one way of exercising this power. By formalising related activities and integrating them in regular top management agenda, one manager reported the transition in his company had been successful.
Another technique for institutionalising sustainability accounting change identified was ensuring there is no way back, such as, for example hiring new staff, rather than delegating tasks to existing people. Interviewees reported that employing new personnel, lowered resistance to sustainability activities and raised the costs of cutting them back. However, as described in Section 2.3, evidence that such positions need to be spread throughout the company departments rather than being concentrated in a centralised structure was provided. Formal long-term commitments, e.g. to reduce carbon emissions, were another good justification to plan long term sustainability accounting activities and thus formalise them.
Several interviewees indicated that showing people that the new sustainability accounting practices lead to improved sustainability performance, signals their permanency. Showing people these practices were permanent was reported to motivate people to engage with related sustainability accounting activities.
Finally, building sustainability accounting practice into the social fabric was reported to facilitate the institutionalisation of change. Delivering regular internal and external reports, connecting departments, and

Vol. 18, No. 3, September 2012
193
introducing titles such as ‘head of carbon accounting’ conveyed these activities are needed.
4.5 Perpetual change in sustainability accounting practice
Sustainability accounting practice is constantly evolving. In consequence, the unfreezing-change-refreezing process is iterative and tentative, as the next change is already in sight before the current one is finalised. As a result, in practice refreezing does not necessarily need to be achieved, thereby facilitating the next unfreezing.
An example of one drawback of refreezing is that, as awareness of environmental issues and their impact on corporate performance grew, companies established systems to capture, manage, and use related information. Later on, as awareness of certain social issues arose, such as child and forced labour, systems to report such information externally were developed. Thus, some of the companies researched have been through all stages of change in developing and implementing systems to deal with these issues.
5. Conclusion
This study draws on change management literature to identify stages of development with regards to sustainability accounting activities. The results of this exploratory study of adoption of sustainability accounting practice in 16 companies indicate that the majority of the companies, despite being selected to represent sustainability leaders, have only successfully been able to address “unfreezing” challenges. The study thus contributes to facilitating the adoption of sustainability accounting practices by identifying the need to pay attention to challenges such as involving senior management, communicating activities with employees, and securing resources.
With the increasing number of companies demonstrating sustainability engagement, sustainability leaders and followers exhibit different stages of progress with regard to adoption of sustainability accounting practices. Accordingly, each company may face different challenges for businesses in the next step to take in engaging with sustainability accounting for the aforementioned reasons. Against this background, important considerations in tackling this challenge are presented.
Interpretation of the results of the study is limited by the nature of the data collection, which is limited to companies in the UK and Germany. This provides opportunity to extend the research to companies operating in other companies. Also, the sample size restricts the generalizability of the results, which could be extended to cover additional industries. A third limitation arises from the decision made by the researches not to use voice recorders as a part of the data gathering process.

Journal of the Asia-Pacific Centre for Environmental Accountability
194
Further research is needed to identify additional obstacles systematically, and more importantly, to identify which of these obstacles play an important role in corporate practice. Based on the above results, subsequent research in the strategies and approaches to overcoming these challenges is needed. Also, subsequent research can identify further specific aspects that need to be considered in the change process as well as examples of good practice.
The results focus on sustainability leaders. This can help later adopters to overcome related problems and challenges. These conclusions provide a basis for managers to consider in adopting sustainability accounting practices.
References
Abrahamson, E 1991, ‘Managerial fads and fashions: the diffusion and rejection of innovations’, Academy of Management Review, vol. 16, no. 3, pp. 586–612.
Abrahamson, E 1996, ‘Management fashion’, Academy of Management Review, vol. 21, no. 1, pp. 254–285.
Adams, CA & Frost, GR 2008, ‘Integrating sustainability reporting into management practices’, Accounting Forum, vol. 32, no. 4, pp. 288–302.
Andrews, T & Chompusri, N 2005, ‘Temporal dynamics of crossvergence: institutionalizing MNC integration strategies in post-crisis ASEAN’, Asia Pacific Journal of Management, vol. 22, no. 1, pp. 5–22.
Bargal, D 2006, ‘Personal and intellectual influences leading to Lewin’s paradigm of action research. Towards the 60th anniversary of Lewin’s ‘Action research and minority problems’ (1946)’, Action Research, vol. 4, no. 4, pp. 367–388.
Bennett, M, Schaltegger, S & Zvezdov, D 2012, The practice of corporate sustainability accounting, ICAEW, London.
Brown, MT & Ulgiati, S 2002, ‘Emergy evaluations and environmental loading of electricity production systems’, Journal of Cleaner Production, vol. 10, no. 4, pp. 321–334.
Burns, J & Scapens, RW 2000, ‘Conceptualizing management accounting change: an institutional framework’, Management Accounting Research, vol. 11, no. 1, pp. 3–25.
Burns, J & Vaivio, J 2001, ‘Management accounting change’, Management Accounting Research, vol. 12, no. 4, pp. 389–402.
Burns, J 2000, ‘The dynamics of accounting change. Inter-play between new practices, routines, institutions, power and politics’, Accounting, Auditing & Accountability Journal, vol. 13, no. 5, pp. 566–596.

Vol. 18, No. 3, September 2012
195
Burritt, RL & Schaltegger, S 2010, ‘Sustainability accounting and reporting: fad or trend?’, Accounting, Auditing & Accountability Journal, vol. 23, no. 7, pp. 829–846.
Burritt, RL, Hahn, T & Schaltegger, S 2002, ‘Towards a comprehensive framework for environmental management accounting. Links between business actors and environmental management accounting tools’, Australian Accounting Review, vol. 12, no. 2, pp. 39–50.
Burritt, RL, Herzig, C & Tadeo, BD 2009, ‘Environmental management accounting for cleaner production: the case of a Philippine rice mill’, Journal of Cleaner Production, vol. 17, no. 4, pp. 431–439.
Burritt, RL, Schaltegger, S & Zvezdov, D 2011, ‘Carbon management accounting: explaining practice in leading German companies’, Australian Accounting Review, vol. 56, no. 1, pp. 80–98.
Cooper, RB & Zmund, RW 1990, ‘Information technology implementation research: a technological diffusion approach’, Management Science, vol. 36, no. 2, pp. 123–139.
Edmunds, A & Morris, A 2000, ‘The problem of information overload in business organisations: a review of the literature’, International Journal of Information Management, vol. 20, no. 1, pp. 17–28.
Eppler, MJ & Mengis, J 2010, ‘The concept of information overload: a review of literature from organization science, accounting, marketing, MIS, and related disciplines’, The Information Society, vol. 20, no. 5, pp. 325–344.
Fernandez, S & Rainey, HG 2006, ‘Managing successful organizational change in the public sector’, Public Administration Review, vol. 66, no. 2, pp. 168–176.
Firth, M 1996, ‘The diffusion of managerial accounting procedures in the People's Republic of China and the influence of foreign partnered joint ventures’, Accounting, Organizations and Society, vol. 21, no. 7–8, pp. 629–654.
Frow, N, Marginson, D & Ogden, S 2005, ‘Encouraging strategic behaviour while maintaining management control: multi-functional project teams, budgets, and the negotiation of shared accountabilities in contemporary enterprises’, Management Accounting Research, vol. 16, no. 3, pp. 269–292.
Ginzberg, MJ 1978, ‘Steps towards more effective implementation of MS and MIS’, Interfaces, vol. 8, no. 3, pp. 57–63.
Goodman, J & Truss, C 2006, ‘The medium and the message: communicating effectively during a major change initiative’, Journal of Change Management, vol. 4, no. 3, pp. 217–228.

Journal of the Asia-Pacific Centre for Environmental Accountability
196
Gray, RH 2001, ‘Thirty years of social accounting, reporting and auditing: what (if anything) have we learnt?’, Business Ethics: A European View, vol. 10, no. 1, pp. 9–15.
Gray, RH 2010, ‘Is accounting for sustainability actually accounting for sustainability… and how would we know? An exploration of narratives of organisations and the planet’, Accounting, Organizations and Society, vol. 35, no. 1, pp. 47–62.
Grover, V, Jeong, SR, Kettinger, WJ & Teng, JTC 1995, ‘The implementation of business process reengineering’, Journal of Management Information Systems, vol. 12, no. 1, pp. 109–144.
Henri, J-F & Journeault, M. 2010, ‘Eco-control. The influence of management control systems on environmental and economic performance’, Accounting, Organizations and Society, vol. 35, no. 1, 63–80.
Ho, ASP 2000, ‘A conceptual change approach to staff development: a model for programme design’, International Journal for Academic Development, vol. 5, no. 1, pp. 30–41.
Hoffman, AJ & Bazerman, MH 2007, ‘Changing practice on sustainability: understanding and overcoming the organizational and psychological barriers to action’, in S Sharma, M Starik & B Husted (eds), Organizations and the sustainability mosaic, Edward Elgar, Cheltenham, pp. 84–105.
Hong, K-K & Kim, Y-G 2002, ‘The critical success factors for ERP implementation: an organizational fit perspective’, Information & Management, vol. 40, no. 1, pp. 25–40.
Hopwood, AG 1990, ‘Accounting and organisation change’, Accounting, Auditing & Accountability Journal, vol. 3, no. 1, pp. 7–17.
Kemp, R, Schot, J & Hoogma, R 2007, ‘Regime shifts to sustainability through processes of niche formation: the approach of strategic niche management’, Technology Analysis & Strategic Management, vol. 10, no. 2, pp. 175–198.
Kezar, AJ 2001, Understanding and facilitating organizational change in the 21st century, John Wiley & Sons, Inc., New York.
Klassen, RD & McLaughlin, CP 1996, ‘The impact of environmental management on firm performance’, Management Science, vol. 42, no. 8, pp. 1199–1214.
Kotter, JP & Schlessinger, LA 2008, ‘Choosing strategies for change’, Harvard Business Review, vol. July-August, pp. 2-11.
Larrinaga-Gonzalez, C & Bebbington, J 2001, ‘Accounting change or institutional appropriation? A case study of the implementation of
Vol. 18, No. 3, September 2012
197
environmental accounting’, Critical Perspectives on Accounting, vol. 12, no. 3, pp. 269–292.
Lewin, K 1947, ‘Group discussion on social change’, in TM Newcomb & EL Hartley (eds), Readings in social psychology, Holt, Rinehart and Winston, New York, pp. 340–344.
Ong, C & Wang, S 2011, ‘E-service and organizational change: a process model’, Journal of Electronic Commerce in Organizations, vol. 9, no. 3, pp. 39–51.
Parker, LD & Ritson, PA 2011, ‘Accounting's latent classicism: revisiting classical management origins’, Abacus, vol. 47, no. 2, pp. 234–265.
Parker, LD 2005, ‘Social and environmental accountability research: a view from the commentary box’, Accounting, Auditing & Accountability Journal, vol.18, no. 6, pp. 842–860.
Poon, P & Wagner, C 2001, ‘Critical success factors revisited: success and failure cases of information systems for senior executives’, Decision Support Systems, vol. 30, no. 4, pp. 393–418.
Rogers, EM 1962, Diffusion of innovation, Free Press, New York.
Rogers, EM 2003, Diffusion of innovation, 5th edn, Free Press, New York.
Sauser Jr, WI, & Sauser, LD 2002, ‘Changing the way we manage change’, Advanced Management Journal, vol. 67, no. 4, pp. 34–39.
Scapens, RW & Roberts, J 1993, ‘Accounting and control: a case study of resistance to accounting change’, Management Accounting Research, vol. 4, no. 1, pp. 1–32.
Schaltegger, S, Gibassier, D & Zvezdov, D 2011, Environmental management accounting – A bibliometric literature review, CSM, Lüneburg.
Schaltegger, S & Burritt, RL 2000, Contemporary environmental accounting: issues, concept and practice, Greenleaf, Sheffield.
Schaltegger, S & Burritt, R. (2005), ‘Corporate Sustainability’, in H Folmer & T Tietenberg (eds), The International Yearbook of Environmental and Resource Economics, Edward Elgar, Cheltenham, pp. 185–232.
Schaltegger, S & Burritt, RL 2010, ‘Sustainability accounting for companies: catchphrase or decision support for business leaders?’, Journal of World Business, vol.45, no. 4, pp. 375–384.
Schaltegger, S & Wagner, M 2006, Managing the business case for sustainability. The integration of social, environmental and economic performance, Greenleaf, Sheffield.
Journal of the Asia-Pacific Centre for Environmental Accountability
198
Schaltegger, S 2011, ‘Sustainability as a driver for corporate economic success. Consequences for the development of sustainability management control’, Society and Economy, vol. 33, no. 1, pp. 15–28.
Schaltegger, S, Viere, T & Zvezdov, D 2012, ‘Tapping environmental accounting potentials of beer brewing. Information needs for successful cleaner production’, Journal of Cleaner Production, vol. 29–30, pp. 1–10.
Schein, EH 1996, ‘Kurt Lewin's change theory in the field and in the classroom: notes toward a model of managed learning’, Systemic Practice and Action Research, vol. 9, no. 1, pp. 27–47.
Siti-Nabiha, AK & Scapens, RW 2005, ‘Stability and change: an institutionalist study of management accounting change’, Accounting, Auditing & Accountability Journal, vol. 18, no. 1, pp. 44–73.
Wang, H, Choi, J & Li, J 2008, ‘Too little or too much? Untangling the relationship between corporate philanthropy and firm financial performance’, Organization Science, vol. 19, no. 1, pp. 143–159.
Woodburn, D 2004, ‘Engaging marketing in performance measurement’, Measuring Business Excellence, vol. 8, no. 4, pp. 63–72.

Vol. 18, No. 3, September 2012
199
Environment Extra!
Sustainability Accounting Standards Board founded in USA http://www.accountingeducation.com/index.cfm?page=newsdetails&id=152141 New Nonprofit Organization will establish Industry-Specific Standards for the Disclosure of Material Non-Financial Information San Francisco, California, October 4, 2012 – The Sustainability Accounting Standards Board™ (SASB)™ has been founded to fill a current void in corporate reporting by quantifying the value of corporate non-financial information. SASB will develop and publicly distribute comprehensive, industry-specific sustainability accounting standards for the benefit of companies, investors, and the public. As markets have evolved, so too have the needs for standards and accountability. The creation of the Securities and Exchange Commission (SEC) in 1934 and the adoption of the Financial Accounting Standards Board (FASB) in 1973 have been instrumental to financial reporting. Today, SASB has been formed to continue that evolution by incorporating sustainability metrics into standardized reporting, providing investors more reliable information. “SASB will be the U.S. voice for material non-financial issues and how to recognize and account for them as part of corporate reporting,” said Dr. Jean Rogers, SASB Executive Director. “The standards we develop will promote sustainable value creation and ultimately enhance the competitiveness of all U.S. industries on the most pressing challenges facing industry and society today.” As its first initiative, SASB is producing a Materiality Map™ that weights the priority of sustainability issues by industry across 10 sectors, which is useful for asset allocation strategies and understanding exposure to certain kinds of environmental, social, and governance (ESG) risk. For issues deemed most material in each industry through an evidence-based approach, SASB will develop key performance indicators unique to each of 89 industries suitable for disclosure in the Form 10-K, thereby facilitating comparable corporate reporting. Bloomberg, an early supporter of SASB, will also collaborate in developing the Materiality Map™. “The impact that financial reporting standards have had on the capital markets is obviously profound. We wouldn’t have the capital markets that we have today in terms of scope, depth and liquidity if investors didn’t have credible information for financial reporting,” said Harvard Business School Professor Robert Eccles, founding chairman of SASB.

Journal of the Asia-Pacific Centre for Environmental Accountability
200
“Transparency is equally important for non-financial reporting, and that is at the core of SASB’s mission.” “Good information is essential for creating trust in the capital markets. We have financial fundamentals - now we need sustainability fundamentals,” said Dan Doctoroff, CEO, Bloomberg L.P. “SASB will create the standards that will enable investors to have a more complete view of risks and opportunities in a form that can be compared and benchmarked and have valuable analytics built on them.” “Since 1973, the Financial Accounting Standards Board (FASB) has developed and improved standards for financial accounting and reporting. Now, nearly 40 years later, I am delighted to see SASB being established, which will complement FASB’s work by specifying the language and accounting mechanisms for material nonfinancial impacts,” said Aulana Peters, former SEC Commissioner. Who Benefits from SASB? Various stakeholders will gain from SASB’s sustainability accounting standards. COMPANIES will be better able to communicate their ESG performance on the issues most material to their sector and strategy, will develop a better understanding of the relationship between financial and nonfinancial performance, will be better able to manage ESG risks and opportunities and will save time and expense on ESG reporting. INVESTORS will enjoy a complete view of risks and opportunities of issuers, and be able to weight portfolios according to sustainability risks. Investors will finally be able to compare peer performance on material ESG issues, and understand the relative positioning of companies with respect to future challenges. ANALYSTS will be better able to integrate ESG issues in determining their positive and negative impact on future cash flows, and thus company valuations. INFORMATION BROKERS will be able to provide more complete data sets for their customers who want this information for analysis. ACCOUNTING FIRMS will be able to provide more complete assurance of companies’ reporting on ESG performance. STOCK EXCHANGES can consider new minimum listing requirements and creation of sector-based ESG indices.

Vol. 18, No. 3, September 2012
201
NGOs will be able to use this additional information to engage with companies in a more meaningful way. THE SEC will strengthen its mission of protecting investors and be able to provide guidance on disclosure of material issues by industry. THE PUBLIC will benefit as companies compete to improve sustainability performance, creating a race to the top. About SASB The Sustainability Accounting Standards Board (SASB) is an independent 501(c)3 organization that will establish and maintain industry tailored key performance indicators for use in disclosing material sustainability issues for the benefit of investors, corporations, and the public. SASB was founded by Jean Rogers, Ph.D.; Steve Lydenberg, Partner, Strategic Vision of Domini Social Investments and founding director of the Initiative for Responsible Investment at Harvard University; and Robert Eccles, Ph.D., of Harvard Business School. For more information about SASB, visit www.sasb.org, or follow us on YouTube, Twitter or LinkedIn. Media Contacts Sarah Leiseca 202-354-8284 [email protected] Jennifer Mitchell 650-868-2616 [email protected]
CSR disclosure - hard to live up to
Fortnum's to investigate claims of cruelty made in undercover film at foie gras farms
http://m.guardian.co.uk/world/2012/sep/30/fortnum-geese-claims-foie-gras?cat=world&type=article
30 September 2012, Jamie Doward, The Observer, The Guardian
One of the country's most prestigious stores has pledged to investigate claims of animal mistreatment at farms linked to a company that has supplied it with foie gras.
Activists from Peta, People for the Ethical Treatment of Animals, filmed undercover at two French geese farms that supply the firm that has sold the delicacy to Fortnum & Mason in Piccadilly, London.

Journal of the Asia-Pacific Centre for Environmental Accountability
202
The two farms belong to a co-operative that uses an abattoir where Peta investigators also filmed. Peta claims the footage, seen by the Observer and which Fortnum's is reviewing, suggests some of the birds were killed without being stunned first, in contravention of French law. The footage also suggests that birds are force-fed to the point of being unable to move freely.
Fortnum & Mason declined to identify the two farms belonging to the co-operative, which it says supply its own brand of foie gras, for fear of reprisals from animal rights activists, but it insists it visits them regularly to ensure its high standards of welfare are met.
However, the store has until recently sold another brand of foie gras that, according to a representative from the co-operative, captured on video by Peta, can come from any of the 24 farms. It appears that the store, which boasts two royal warrants, removed the brand from its shelves when it became aware Peta had infiltrated the farms.
One of the farms infiltrated by Peta featured in a promotional video in which Fortnum's previous managing director, Beverley Aspinall, highlighted the store's stringent welfare standards. Footage taken at the farm shows blood dripping from an injured bird.
The Peta footage also appears to show a bird at another farm unable to stand as a result of force-feeding, contrary to assurances provided in Fortnums' corporate social responsibility policy.
According to its website, Fortnum's insists “we will never allow our birds to reach a stage where they can't support their own weight and move around freely”.
Footage from the abattoir appears to show that some geese are not properly stunned and continue to lift their heads for some time after their throats are cut. French regulations state that “the stunning of animals before slaughter is mandatory before killing”.
Peta intends to release the footage on the internet with a voiceover from Sir Roger Moore, a critic of foie gras production. “We are imploring all Fortnum & Mason customers to keep out of the store until it joins Selfridges, Harvey Nichols, Waitrose and others in refusing to sell foie gras, or 'torture in a tin',” a Peta spokesman said.
The row between Peta and Fortnum's is the latest battle in a long campaign by the animal rights group to stop the store selling foie gras. The product, which is produced by force-feeding geese so their livers expand, is prized by gourmets.
However, in blogs several gourmets have defended the store's right to sell the delicacy and say it has gone to great lengths to ensure the food is produced to the most humane standards.

Vol. 18, No. 3, September 2012
203
Peta's campaign against Fortnum's comes at a time when foie gras production is under scrutiny. California has banned the sale of foie gras, while the UK catering company Compass Group, which supplies Michelin-star restaurants and Whitehall departments, has dropped the product from its menus.
Last year, in response to complaints from Peta about its sale of foie gras, Fortnum's was ordered by Westminster trading standards to amend misleading statements in its corporate social responsibility that suggested all of its meat met the highest welfare standards.
A Fortnum's spokesman said: “Fortnum & Mason maintains rigorous quality control procedures and would expect all of its suppliers to adhere to our gold standard production requirements.”
The spokesman stressed it had not yet been able to prove or disprove Peta's allegations.
“We are acutely aware of our reputation as one of the world's leading purveyors of quality foods and have subsequently instructed the appropriate individuals within the business to look into the allegations. However, it's important we do not pre-empt that process in light of the questions that we continue to have regarding the footage in question.”
WWF's 2050 criteria report calls on finance sector to align with credible standards
http://www.isealalliance.org/online-community/news/wwfs-2050-criteria-report-calls-on-finance-sector-to-align-with-credible-standards
27 September 2012, Jason LaChappelle, ISEAL Alliance
WWF has unveiled The 2050 Criteria, a guide to responsible investment in agricultural, forestry and seafood commodities. The report is intended to serve as a blueprint for financial institutions to support sustainable supply chains and access commodities in a responsible manner, primarily through the use of credible standards and certification programmes.
In recent years WWF has focused much attention on transforming the markets and supply chains of high demand commodities that generate some of the largest impacts on biodiversity, land use, water and local communities. The 2050 Criteria provide one of the first comprehensive guides for investors to become allies in ensuring that soft commodities such as sugarcane, palm oil, bioenergy, beef and seafood are developed sustainably.

Journal of the Asia-Pacific Centre for Environmental Accountability
204
“A critical success factor for achieving sustainability on Earth involves aligning financiers, producers, and buyers around credible certification and performance criteria for major agricultural, forest, and seafood commodities,” concludes WWF.
The report offers some sobering statistics about the state of the world’s resources as we head toward 2050. While population growth and expanding consumer bases accelerate demand for food, fuel and fiber products, unprecedented volatility and resource scarcity have also become the norm. The report estimates that over the next four decades humanity must produce more food than we have in the last 8,000 years of agriculture combined, yet unsustainable practices are undermining the planet’s ability to meet these needs. Agriculture, says WWF, is the world’s largest user of chemicals, the largest source of water pollution and is responsible for 85% of global deforestation.
The report distils the major social and environmental risks of producing the commodities we've become hungriest for, and outlines key performance criteria for minimizing impacts on environment and society. For each commodity, WWF identifies the leading third-party certifications that best meet the performance criteria, in whole or in part – depending on the availability of effective and high-quality standards for each commodity.
Along with its focus on the content of a standard and the social and environmental practices it promotes, WWF also defines credibility in terms of ISEAL membership and compliance with the Codes of Good Practice, reinforcing the critical importance of factors such as transparency and multi-stakeholder process. The report provides a state-of-play in each commodity area, assessing how certification is evolving and the potential for effective, ISEAL-compliant standards to develop and transform supply chains.
While international consensus has emerged around the importance ESG (environmental, social and governance) risk monitoring and the unacceptability of financing deforestation, irresponsible fishing and destructive land change, the WWF finds that public compacts have not translated into concrete action in the financial sector. By aligning with credible standards and adopting them as part of their investment requirements or performance targets for companies and other players, financial institutions can play a leading role in affecting the sustainability of operations on the ground.
Says WWF’s Jason Clay, “the [owners and managers of global financial assets] hold influence over the actions of firms and markets... indeed, financial institutions must play an essential part in ensuring the long-term sustainability of our most basic markets—food, fuel, and fibre—for the billions who depend on them.”

Vol. 18, No. 3, September 2012
205
As a novel and comprehensive guide for informing the decision making of investors, the 2050 Criteria illustrate the importance of the finance sector in helping to scale up the penetration and impact of certification in these crucial commodities.
Financing solar - helping the herder in Mongolia
http://www.worldbank.org/en/news/2012/09/20/solar-power-lights-up-future-for-mongolian-herders?cid=EXT_TWBN_D_EXT
20 September 2012, The World Bank
About a quarter of Mongolia’s 2.8 million people are nomadic herders of yaks, cattle, sheep, goats and camels who live in gers — as their traditional tent dwellings are known — on the country’s vast steppes. It is a simple life that has endured for centuries. Until recently, it was also a life without electricity.
That has changed for about 100,000 herder families, whose daily lives have been transformed by off-grid solar home systems which generate enough power for lights, televisions, radios, mobile phone charging and small appliances.
The herders have gained access to solar power through a program launched by the Mongolian government with support from the World Bank and the Government of the Netherlands. Thanks to the National 100,000 Solar Ger Electrification Program, over half a million men, women and children, covering half the rural population of Mongolia and 70 percent of herders, now have access to modern electricity
“We are proud to be part of this effort, which means 500,000 people, or half the rural population of Mongolia, have electricity through portable and affordable solar home systems,” said Pamela Cox, World Bank Regional Vice President for East Asia and Pacific in her first visit to the country. “Now, children can study at night, families can watch TV and recharge cell phones, enabling them to connect to the world while maintaining their nomadic lifestyles. This is one of many innovative ideas that we are putting to work on the ground to make growth more inclusive.”
“A few years ago, country herders managed with candles and lanterns. The change in life between then and now is like night and day,” said herder Baatar Khandaa. “I believe that the quality of life in the countryside and the city are now about the same.”
Families can now relax and spend time together at night under electric lights. Children can learn by reading and from watching television. Herders often tune in to radio and television weather reports that help

Journal of the Asia-Pacific Centre for Environmental Accountability
206
them manage their livestock, and use mobile phones to find out about market prices for wool and cashmere.
The program provided portable solar home systems adapted to herders’ nomadic way of life. Herders can easily set them up and dismantle them when they relocate. The project employed a balanced approach to pricing the systems, where herders purchased the solar home systems, albeit with a subsidy that covered about half the costs. It made the systems affordable to herders while helping to expand sales.
It was a particular challenge reaching remote herders living in the vast rural countryside. In response, the project established 50 privately-owned solar home system sales and service centers spread across Mongolia. Their staff were trained to promote and sell certified solar home systems so that herders could buy with confidence. They were also trained to repair and maintain the units – vital to sustaining the benefits of the program. To extend their reach, the sales and service centers partnered with an existing network of village administrators located in 342 villages. This effective public-private partnership helped the project sell solar home systems in every remote corner of the country.
With tens of thousands of customers now demanding solar home systems, the sales and service centers are seeing an increase in their sales of radios, televisions, kettles and other small appliances that newly-electrified households want to buy as well.
“The key was to build on the government’s existing efforts”, said Migara Jayawardena, Senior Energy Specialist at the World Bank. “Good practices and lessons from other successful renewable energy and rural electrification projects from countries such as China, Bangladesh and Sri Lanka were customized to meet Mongolia’s unique circumstances.”
“A few years ago, country herders managed with candles and lanterns. The change in life between then and now is like night and day. I believe that the quality of life in the countryside and the city are now about the same.”
Baatar Khandaa, herder
Mongolia has found off-grid electrification with solar power to be a viable approach to serving a nomadic rural population that is scattered across a vast territory of over 1.5 million square km. The program has supplied 100,146 solar home systems, while also developing a sustainable supply chain of local businesses that will help achieve the government’s goal of universal rural electrification by 2020.
“Solar home systems have become commonplace,” said D. Zorigt, Mongolia’s Minister of Mineral Resources and Energy during the period from 2008 to 2012 when the project was under implementation.
The project, entitled Renewable Energy and Rural Electricity Access (REAP) was funded by a $3.5 million grant from the International

Vol. 18, No. 3, September 2012
207
Development Association (IDA) – the Bank’s Fund for the Poorest – a $3.5 million grant from the Global Environment Facility (GEF), and a $6 million grant from the Government of the Netherlands, with implementation support provided by the Asia Sustainable and Alternative Energy Program (ASTAE) – a multi-donor trust fund program administered by the World Bank.
Boston Consulting Group helps society through business model
http://rogerburritt.wordpress.com/2012/09/30/does-the-boston-consulting-group-care-about-society/
30 September 2012, Professor Roger Burritt, Sustainability, Governance, and Accounting
The Boston Consulting Group is known throughout the world for the Boston Box, a simple schematic for identifying products in categories representing their growth potential and market share. It helps oil the wheels of capitalism. Is there anyone who has not heard of stars, cash cows, question marks and dogs?
The Group is large – 77 offices in 42 countries; it is a private not public company; it advises on business strategy; and for several years it has conveyed a message that it is also ‘Making a difference’ for society.
The 2012 publication details Boston Consulting Group partnerships and projects for impact in the social sector. The methods developed and used to solve business problems are applied to solving social problems at community, regional and global levels.
Focus is on the environment, poverty and hunger, public health, education, community and economic development, arts and culture, volunteerism and corporate social responsibility. In 2010 and 2011 the Group completed 400 assignments in these areas working with 175 partners ranging from non-government organisations, foundations, governments and businesses. For example there are estimated to be nearly 1 billion hungry people in the world and just one area of Boston Consulting Group’s partnership is with the World Food Programme, Save the Children International and other organisation working on reducing such poverty.
For many people education and associated growth in awareness is the necessary means through which problems can gradually be addressed and so it is of great interest that Boston Consulting Group has added to its focal partnerships in 2012 both education and sustainability. Teach for All and WWF are two partnerships concerned. At a local level involvement ranges from working with indigenous organisations in Australia to support

Journal of the Asia-Pacific Centre for Environmental Accountability
208
education reform, to teaching business skills to high school students in Europe and Asia through the BCG business@school program.
The social impact of initiatives is measured in terms of financial value creation to enable comparison of social projects that save lives with those that improve lives when the financial resources available are limited and choice has to be made.
Some may wince at the notion of a global consulting firm assisting with the development of business skills for students at school even when the notion of sustainability is in mind. But in a world where over 750 million people do not have access to safe drinking water and 2.5 billion people do not have access to safe sanitation facilities awareness of the pragmatics of a business case for improvements in the face of limited financial resources as espoused by the Boston Consulting Group can only help.
The Centre for Accounting, Governance and Sustainability at the University of South Australia continues to support pragmatic research and projects which contribute to solutions with a social impact such as attracting greater numbers of indigenous people into accounting where education is a key to equality.
Indonesian mining - corruption cost or facilitation payment?
http://mobile.reuters.com/article/idUSBRE8900C820121001?irpc=932
1 October 2012, Fergus Jensen and Neil Chatterjee, Reuters
Jakarta (Reuters) - One evening in late September, Peter Wesser and his club of veteran minerals explorers met at Jakarta's Hotel Kristal to swap stories and exchange news. Beer and roast beef were on the menu - on the agenda was trying to figure out how to stay in business.
For decades explorers have enjoyed a place on the cutting edge of the country's mining boom as they scoured the earth for fresh mineral deposits, a process that can take years and cost hundreds of millions of dollars before payback.
But now they complain that new rules aimed at boosting state revenue from natural resources have slashed investment in mineral prospecting and could threaten the entire $93 billion sector.
“Exploration is by nature optimistic,” said Wesser, 73, an Indonesian, born to Dutch parents, with decades of mining experience. “The government doesn't understand the importance of exploration ... Mining without exploration is an industry that goes downhill.”

Vol. 18, No. 3, September 2012
209
The explorers are not the only ones struggling with the impact of the regulations that have caused industry-wide uncertainty in Indonesia, compounding the effects of a global commodities downturn.
Small miners in particular have been hit, leading to mine closures and lay-offs in regions such as Sulawesi Island, with some resorting to bribing central government officials to continue to export, according to interviews with four mining executives.
An analysis of official data shows the rules have also caused a slump in exports of ore, leading key buyer China to seek supplies from elsewhere.
The government of President Susilo Bambang Yudhoyono is reforming the minerals sector in a plan to propel the G20 country into a global top-10 economy by 2025.
Mining already contributes 12 percent to GDP, and Indonesia is a world leader in nickel ore, thermal coal and refined tin exports, while bauxite exports have spiked in recent years.
“If we do not begin the efforts to increase mining added value, we will be economically colonized forever,” said Deputy Energy and Mineral Resources Minister Rudi Rubiandini.
The regulations restrict the export of raw ores, force foreign miners to divest over half their assets after 10 years of production and require domestic processing of ore by 2014.
Surge then plunge The most dramatic effect of the new rules has been on mineral exports, which surged as companies fought to beat a May 6 export tax deadline and plunged thereafter.
In August Chinese imports of nickel ore from Indonesia dropped 39 percent to 1.48 million tonnes, following steep falls in July and June, Chinese data shows. China's imports from the Philippines nearly doubled over the same period.
Nowhere is the human impact of the slide more visible than in the remote mining communities of Sulawesi, an island east of Borneo and the country's main source of nickel.
Prior to the regulations coming into force in May up to a dozen ships could be seen standing off the port of Kolaka, waiting to collect nickel ore as fleets of trucks scooped mud from nearby hills and transported it down to the docks.
Now the rudimentary ports stand idle and only security guards patrol the abandoned piles of mud. Workers in Sulawesi said the situation for miners was worse now than in 2009 when the global financial crisis hit commodity exports worldwide.

Journal of the Asia-Pacific Centre for Environmental Accountability
210
The plight of Rasiun, a father-of-three, illustrates the impact on miners. The former fisherman and farmer sold his land to miner Prima Nusa Sentosa, who offered him $5 a day to pull tarpaulins over ore to protect it from rain.
When the mine closed because of the new regulations he lost his job, but mining pollution has stained the sea red and made it impossible to go back to fishing.
“We thought we could change our fate with the company. Our land is now owned by the company and run-off from the company has flowed into the sea, so now we are unemployed,” he said, adding he was “half-dead” with worry over how he would feed his family.
World-class discoveries Thousands of firms are affected by the laws and there is a backlog at the mining ministry in Jakarta as many seek the license, quota and recommendations needed to resume exports.
To cut red tape it helps to pay the ministry between $500,000 and $1.5 million, said a senior mining executive, who declined to be identified. Three other executives at different mining firms also said bribes were required.
“Miners have to get a recommendation from the Energy and Mineral Resources Ministry. What does the word 'recommendation' mean here? You can work that out by yourself,” said Juanforti Silalahi, a spokesman for miners' union Spartan.
The mining ministry denies there is corruption in the permit process.
The new regulations do not apply to miners who hold older Contracts of Work (CoW), including some of the most prominent industry names such as the Indonesian units of Freeport McMoRan Copper & Gold Inc (FCX.N), Newmont Mining Corp (NEM.N) and Vale (INCO.JK).
They also do not apply to coal producers, although for both groups the rules have caused unease that the government's regulatory drive will extend to them through higher royalties.
It is not clear whether the export slump, which coincides with a general downturn that has lopped about a quarter off iron ore and thermal coal prices this year and halted major mining investments in Australia, is a blip or part of a realignment that will hurt mining for a generation.
As they ate and drank at the Jakarta hotel, the members of the Forum for Exploration and Mineral Development were pessimistic about their business, which is crucial for long-term industry growth.
Wesser's last firm, Oxindo, a copper explorer owned by Chinese mining group MMG (1208.HK), closed its Jakarta office in September, one of five members of the group to quit since May.

Vol. 18, No. 3, September 2012
211
“There will be no more world-class discoveries in Indonesia,” said forum head Malcolm Baillie, about a country that is home to a mine with the world's biggest gold reserves.
(Additional reporting by Michael Taylor and Yayat Supriatna in Jakarta and Sonali Paul in Melbourne; Writing by Matthew Bigg; Editing by Alex Richardson)

Journal of the Asia-Pacific Centre for Environmental Accountability
212
Call for papers
7th Asia Pacific Interdisciplinary Research in Accounting (APIRA) Conference
26 – 28 July 2013, Kobe, Japan
Date to remember: Deadline for submissions: 31 January 2013
http://www.apira2013.org/about/
This interdisciplinary accounting conference is dedicated to the advancement of accounting knowledge and practice. It provides a platform to discuss the interaction between accounting/auditing and their social, economic, institutional and political environments.
Conference sessions and papers will critique contemporary theory and practice, examine historical and interdisciplinary dimensions of accounting, debate policy alternatives, and explore new perspectives for understanding and change in the accounting discipline.
Researchers interested in contributing to the conference should send papers for review and selection no later than January 31, 2013.
Social and Environmental Accountability Journal 34(1), April 2014
Special Issue on Carbon Accounting: The Contribution of Social and Environmental Accounting to the Debate
Special Issue Editor: Carlos Larrinaga, Universidad de Burgos
Date to remember: Deadline for submissions: 28 February 2013
Anthropogenic induced global climate change (GCC) raises a diversity of questions in the domains of organisations, markets and policymaking. Accounting has a pivotal role in the process of developing metrics of greenhouse gases (GHG) emissions which enable interventions in different markets and policymaking areas. Scholars from disciplines such as economics, sociology or geography have revealed the contentious nature of carbon accounting, in all its guises, and there is a growing body of literature in social and environmental accounting. There is, however, still

Vol. 18, No. 3, September 2012
213
room for a contribution to broader debates on carbon accounting by, following the editorial policy of SEAJ, developing new literature drawing not only on accounting, but also on accountability, reporting and auditing practice, research, theory and teaching in the field of GCC.
This special issue invites papers that intend to move the social and environmental accounting literature in the direction of making a more ambitious contribution to broader debates about carbon accounting. In line with the editorial policy of SEAJ, methodology and character of papers is purposefully open, and shorter papers as well as directness, clarity, policy-relevance and novelty are sought in the contributions to this special issue. Topics that might be considered for publication in this special issue include, but are not limited to the following:
• Reviews of different literatures on carbon accounting, identifying potential intersections with and unique contributions of social and environmental accounting
• Explorations of different scales and forms of entity for which carbon accounting has been attempted (for example, nation state, regionally, organisationally and by products) and the intersections between these scales
• Reflections on any regionally interesting GCC issues (such as accounting for the supply of carbon credits in developing world contexts or the operation of particular carbon accountability regimes)
• Controversies around the use and commensurability of uniform metrics to account for GCC and GHG emissions
• Explorations of how different metrics of GCC and GHG emissions are mobilized for the intervention in markets and policymaking areas
• Aspects of financial and non-financial carbon reporting, including compliance with public/private disclosure requirements and the vicissitudes of financial carbon accounting standardization
• The interplay between carbon accounting and the compulsory and voluntary schemes for emission rights trading
• Verification/assurance of carbon accounting and reporting (including exploration of the claims for ‘carbon neutrality’)
Authors interested in contributing to this Special Issue of SEAJ should follow the “Notes for SEAJ Contributors” and submit their manuscripts for review to: [email protected] no later than 28th February 2013. Contact: Carlos Larrinaga, Universidad de Burgos Email: [email protected]

Journal of the Asia-Pacific Centre for Environmental Accountability
214
Journal of Accounting & Organizational Change, Volume 8, Issue 2
Special issue on the Balanced Scorecard
Guest editors Dr Hanne Nørreklit, Professor of Management Control, Norwegian School of Economics and Business Administration, Bergen, Norge, Office: +47 5595 9000, e-mail: [email protected]
Falconer Mitchell, Professor of Accounting, Edinburgh University, Business School, Edinburgh, UK, Office: +44 (0)131 650 8340, e-mail: [email protected]
Dates to remember: Deadline for submissions: 30 November 2012 Authors will be notified by 31 March 2013 on the acceptance or rejection of their manuscripts. Deadline for final revisions (where needed): 31 October 2013 Accepted papers will be published in 2014 (Issue 3).
The Balanced Scorecard (BSC) has been a high profile performance measurement concept over the last two decades. Worldwide consultancy companies are selling the BSC concept and many companies have adopted a performance measurement framework labelled the balanced scorecard. Also, many research articles have been published on issues related to the BSC concept. However, the success of the BSC has been mixed. In particular, some of the good examples of BSC have faced serious problems. In addition, although it has been advocated as a feed forward mechanism, it was not able to forewarn of the financial crisis. Furthermore, during the years the conceptual framework of the BSC has changed and moved into different businesses and organizations. This raises issues such as, what are the key features of a good BSC? How do we know that the changes are an improvement? What drives the changes? Finally, the BSC has been advocated for various purposes. However, how well a BSC framework addresses its intended purposes remains unknown. There has been little insight into the unintended economic and social implications of a BSC, i.e. does it have dysfunctional implications? Does it solve new types of purposes? and does it favourites some types of social groups? This special issue of Journal of Accounting & Organizational Change calls for papers providing penetrating insights into the features of the BSC technique and its organizational and social implications.
Addressing the aim of the issue, all types of research methods can be feasible. However, we consider conceptual analytical approaches and case studies as particular important to get a more penetrating insight into the

Vol. 18, No. 3, September 2012
215
matter. We invite papers from scholars across disciplines on the following issues:
• the balanced scorecard and profitability; • what happens to the good examples of the balanced scorecard; • the balanced score card and the financial crisis; • balanced scorecards in banks; • what drives the changes in the technical features of the BSC?; • the quality of the design qualities of the BSC; • relationships between non-financial and financial measures in the
BSC; • the balanced scorecard vs other performance measurement
packages; • the social impact of the balanced scorecard; • adoption and diffusion of balanced scorecard; • why did companies abandon BSC?; and • what makes a BSC a success?
These themes are only indicative. Papers on other themes with relevance to understanding the design qualities, the functioning, and the organizational and social role of the balanced scorecard are welcomed. Enquiries re this special issue should be sent to Dr Hanne Nørreklit. Manuscripts must be submitted via online using the submission site at: http://mc.manuscriptcentral.com/jaoc
Supply Chain Management: An International Journal
Special Issue on Managing and Measuring Sustainability Performance of Supply Chains
Special Issue Editors: Professor Dr Stefan Schaltegger, CSM Leuphana University, Lüneburg, Germany Professor Roger L Burritt, CAGS, University of South Australia, Australia
Date to remember: Deadline for submissions: 4 February 2013
The sustainability of supply chains and their management by organizations are of growing significance to businesses keen to gain a competitive advantage, or to industries which are risk sensitive to the environment or social issues. Yet, with the exception of sustainability assessments in pilot studies, research-based life cycle assessments, selected certification of green products, or demonstration cases,

Journal of the Asia-Pacific Centre for Environmental Accountability
216
companies have largely struggled with or ignored the management and measurement of sustainability performance over their whole supply chains. Sustainability issues in supply chains, however, have become an important topic in procurement, innovation management and marketing. The rationale for this special issue is that sustainability issues in supply chains act as a catalyst for researching the links between consequences of adopting sustainability as a strategic goal and performance management, accounting, auditing and management control.
The need in focal companies and suppliers to gather data, make information available, and generate knowledge for decision making has never been stronger than in emerging areas such as the measurement and management of the social and environmental performance of suppliers and complete supply chains. In the process of globalization with high levels of specialization and outsourcing the reliable performance measurement and effective management for sustainability of supply chains has been shown as essential for very different industries, either dealing with high reputational risk issues such as child or forced labour or for the market success of businesses offering particularly sustainable products and services. The increasing demand for the certification of sustainable products and services furthermore emphasizes the need for reliable sustainability performance measurement and management approaches. Whereas some focal companies emphasize supplier audit and selection, others implement a supplier development and training strategy of sustainable supply chain management; both with different roles and consequences for establishing information management systems, accounting, management control, auditing and reporting. Subsequently, thought leadership for policy and practice is needed to develop further frameworks and tools for information and performance managers to participate in and contribute effectively to sustainable development. Academics and practitioners will want to demonstrate best practice and business progress in environmental and resource management, as well as responsible corporate social activities and share this leading-edge practice. To have global reach, information systems managers, accountants, auditors, controllers and reporting specialists will need to contribute to a sustainable future for developed and emerging nations in relation to sustainable supply chains and the associated possibilities for society, nature, business and industry.
