journal of theoretical biology - ladhyx · cavitation photosynthesis biomechanics abstract water...
TRANSCRIPT

Journal of Theoretical Biology 398 (2016) 20–31
Contents lists available at ScienceDirect
Journal of Theoretical Biology
http://d0022-51
n CorrE-m1 Pr
Metz, Fr
journal homepage: www.elsevier.com/locate/yjtbi
Turgidity-dependent petiole flexibility enables efficient water useby a tree subjected to water stress
David Gonzalez-Rodriguez a,n,1, Paul-Henry Cournède b, Emmanuel de Langre a
a Hydrodynamics Laboratory (LadHyX), École Polytechnique, 91128 Palaiseau, Franceb MAS Laboratory, École Centrale Paris, 92160 Châtenay-Malabry, France
H I G H L I G H T S
� A multiphysics model of the role of wilting in the tree response to water stress is proposed.
� The model couples petiole mechanics, thermal energy balance, and xylem hydraulics.� Turgidity-dependent petiole flexibility can significantly reduce the risk of cavitation.� Petiole flexibility increases water use efficiency under water stress.a r t i c l e i n f o
Article history:Received 27 August 2015Received in revised form25 February 2016Accepted 5 March 2016Available online 15 March 2016
Keywords:Water stressDroughtWiltingLeafTurgor pressureCavitationPhotosynthesisBiomechanics
x.doi.org/10.1016/j.jtbi.2016.03.01193/& 2016 Elsevier Ltd. All rights reserved.
esponding author.ail address: [email protected] (D. Gonzalesent address: Laboratory LCP-A2MC, Universance.
a b s t r a c t
Water stress is a major cause of tree mortality. In response to drought, leaves wilt due to an increase inpetiole flexibility. We present an analytical model coupling petiole mechanics, thermal balance, andxylem hydraulics to investigate the role of petiole flexibility in protecting a tree from water stress. Ourmodel suggests that turgidity-dependent petiole flexibility can significantly attenuate the minimal xylempressure and thus reduce the risk of cavitation. Moreover, we show that petiole flexibility increases wateruse efficiency by trees under water stress.
& 2016 Elsevier Ltd. All rights reserved.
1. Introduction
Drought is a major cause of tree mortality, whose incidence isrising due to climate change (Allen et al., 2010). While the pro-cesses by which drought kills trees remain an issue of ongoingdebate and study, McDowell et al. (2008) advanced two dominantmechanisms of drought-induced tree mortality: carbon starvationand hydraulic failure. Carbon starvation arises from the reductionof photosynthetic carbon assimilation during water stress. Ifdrought lasts for a sufficiently long time, the carbon reservesstored by the tree will be exhausted and metabolism will be
ez-Rodriguez).ité de Lorraine - Metz, 57070
impaired. Carbon starvation thus inhibits tree growth and rendersthe tree more susceptible to insect attacks and to pathogens(McDowell et al., 2008). Hydraulic failure involves xylem cavita-tion, which can significantly reduce the tree's hydraulic con-ductivity and impair sap flow. Hydraulic failure usually occursduring a particularly severe drought episode that generates verynegative hydraulic pressures in the xylem.
As conceptualized by several authors (McDowell et al., 2008;Sade et al., 2012), isohydric and anisohydric trees exhibit twodifferent strategies in response to water stress. Isohydric treesattenuate variations of their leaf water potential, notably by reg-ulating stomatal aperture, thus reducing transpiration and pro-tecting themselves from cavitation. However, stomatal closure inisohydric trees also reduces photosynthetic carbon assimilation,thus increasing their vulnerability to carbon starvation. In contrast,anisohydric trees regulate stomatal conductance and leaf water

D. Gonzalez-Rodriguez et al. / Journal of Theoretical Biology 398 (2016) 20–31 21
potential less markedly, potentially making them more prone tocavitation.
Under water stress, tree leaves experience wilting. Indeed,wilting is a visual indicator of water stress and of the likelihood oftree survival (Engelbrecht et al., 2007). Leaf wilting is caused bythe reduction of turgor pressure, which induces a decrease of thepetiole's elastic modulus (Nilsson et al., 1958). Several experi-mental studies have suggested that leaf wilting may protectagainst water stress. In an experiment with tropical forest treeswhose leafs were either mechanically constrained to remain attheir turgid orientation or let free to wilt, Chiariello et al. (1987)showed that leaf wilting increases water use efficiency (the ratio ofcarbon assimilation to water loss by transpiration) by 15–60%.Moreover, Zhang et al. (2010) showed that leaf wilting, whiledecreasing photosynthesis in the short term, protects leaves fromdamage by excessive light irradiation, thus preserving higherphotosynthetic rates in the long term.
In this paper we investigate the role of petiole flexibility inprotecting a tree from water stress. It is emphasized that by theshortcut petiole flexibility we refer to the mechanism by which thepetiole's elastic modulus decreases with decreasing turgor pres-sure, thus inducing leaf wilting. Whereas the conceptual frame-work we present is extensible to a variety of plants, in this paperwe specifically focus on trees, since we account only for turgidity-dependent flexibility of leaf petioles, but not of stems or laminae.In the following we present an analytical model coupling petiolemechanics, heat exchange in the leaf, and tree hydraulics. Westudy two paradigms of stomatal response to water stress, corre-sponding to isohydric and anisohydric behaviors. Our modelallows us to investigate how petiole flexibility modulates xylempressure and photosynthetic assimilation in a tree subjected towater stress.
2. Model
We consider an idealized tree whose leaves are located at thetop of a single vertical trunk of height h. As represented in Fig. 1,we consider two model geometries: a uniform foliage (Fig. 1A),where all N leaves have identical inclination, or a distributedfoliage (Fig. 1B), where we define a probability distribution of thebranch and leaf inclination angles, as discussed in Section 2.6. The
Fig. 1. (A) Sketch of the uniform foliage model showing the parameters defining the braninsets show polar plots of the corresponding BIADs (branch inclination angle distributiolines), as in Tadrist et al. (2014). (For interpretation of the references to color in this fig
leaves are connected to the trunk by flexible petioles, whoseelastic modulus depends on the turgor pressure. We model thefollowing coupled physical phenomena: (1) thermal energy bal-ance in the leaves, which determines the leaf temperature, T ðiÞ
l ;(2) transpiration from leaves, which determines the total tran-spiration flow rate, QT; (3) the hydrodynamics of sap ascent in thexylem, which determines the turgor pressure in the petioles, pt;and (4) the solid mechanics of a petiole, which determines theleaf's angle of inclination with respect to the vertical direction, ϕðiÞ.The superindex ðiÞ, used in some of the model variables, refers toleaf iAf1;2; :::Ng. It denotes variables that, in the distributed foli-age model, take different values for different leaves. For a list ofparameters and variables used in the model, the reader is referredto Tables 1 and 2.
In each of the following subsections, we start from rathergeneral equations describing each of the four key physical pro-cesses involved. We introduce a number of assumptions that allowus to simplify the governing equations. In Section 3, we will applythe simplified equations to study the tree response to water stressfor several cases: uniform or distributed foliage, constant or vari-able stomatal opening, and rigid or flexible petioles.
2.1. Thermal energy balance in the leaf
The leaf energy balance equation is (e.g., Nobel, 2005; Leighet al., 2012):
tlCldT ðiÞ
ldt
¼Q rad�αðT ðiÞl �TaÞ�
LρqðiÞT;lAl
: ð1Þ
This equation states that the change in thermal energy in the leafequals the balance between the radiative energy flux (first term onthe right-hand side, Q rad), the convective energy flux (secondterm), and the evaporative energy flux (third term). Here tl is theleaf thickness, Cl is the thermal capacity of the leaf (J m3 K�1), Ta
and T ðiÞl are respectively the air and leaf temperatures, L is the
latent heat for evaporation of water (J kg�1), ρ is the water density,qðiÞT;l is the flow rate of transpiration through leaf i (m3 s�1), and Al
is the leaf surface area. The heat transfer coefficient is given byα¼Nu k=d, where k¼0.026 W m�1 K�1 is the thermal con-ductivity of air, d is the diameter of the leaf (defined as the dia-meter of the largest circle that can be inscribed within the leafsurface), and Nu is the Nusselt number, which represents the heat
ch, leaf, and sun inclination angles. (B) Sketch of the distributed foliage model. Thens, brown dashed lines) and LIADs (leaf inclination angle distributions, green solidure caption, the reader is referred to the web version of this paper.)

Table 1Typical values of the dimensional parameters for a tree, obtained from Nobel (2005) and Leigh et al. (2012).
Parameter Symbol Reference value Variability range
Leaf visible light absorptance aV 0.6 0.4–0.6Leaf infrared absorptance aIR 0.96 0.94–0.98Leaf infrared emissivity eIR 0.96 0.94–0.98Reflectance of the surroundings r 0.2 0.10–0.30Direct zenithal solar radiation S0 900 W m�2 500–1100Stefan–Boltzmann constant σ 5:67� 10�8 W m�2 K�1 N/A
Effective temperature of the sky Tsky 250 K 220–270Effective temperature of surroundings Tsurr 300 K 290–315Air temperature Ta 300 K 290–315Relative air humidity H 0.50 0.30–0.70Wind speed uwind 1 m s�1 0.3–10Leaf inscribed diameter d 0.10 m 0.05–0.30Leaf surface area Al 10�2 m2
2:5� 10�3– 0:09Number of leaves N 105 5� 104–106
Tree height h 20 m 10–30Latent heat of evaporation L 2:26� 106 J kg�1 N/A
Molar volume of water Vmw 18� 10�6 m3 (mol H20)�1 N/A
Maximum stomatal conductance g1 0.1 (mol vapor) m�2 s�1 0.01–0.5Total flow resistance RX 1010 Pa s m�3 109–1011
Turgor pressure at EG ¼ 1 pð0Þt 2� 105 Pa 105–4� 105
Petiole's osmotic pressure Π 1:1� 106 Pa 105–2� 106
Soil water potential Ψ s �3� 105 Pa �2� 106
Table 2Variables used in the model.
Symbol Meaning SI units
gs Stomatal conductance (mol vapor) m�2 s�1
g Nondimensional stomatal conductancept Turgor pressure in the petioles Pap t Nondimensional turgor pressure in the
petiolesQT Total transpiration flow rate m3/s
qðiÞT;lTranspiration flow rate through leaf i m3/s
q ðiÞT;l
Nondimensional transpiration flow ratethrough leaf i
T ðiÞl
Temperature of leaf i K
ΔTðiÞ Nondimensional leaf-to-air temperature dif-
ference for leaf i
wðiÞl
Humidity at leaf i mol H2O/mol air
Δw ðiÞ Nondimensional leaf-to-air humidity differ-ence for leaf i
θðiÞ Branch inclination angle for leaf i rad
ϕðiÞ Inclination angle of leaf i rad
D. Gonzalez-Rodriguez et al. / Journal of Theoretical Biology 398 (2016) 20–3122
transfer increase due to flow convection. Determination of Nudepends on whether heat convection is forced (governed by thewind) or free (governed by air buoyancy). Wind-dominated heatconvection requires a Reynolds number larger than about 3000,which is almost ubiquitously attained in trees (for a d¼10 cm leaf,Re¼ 3000 already for the very low wind speed of 0.5 m/s). For thisreason, in our model we assume forced convection, thus taking(Incropera and De Witt, 1985; Leigh et al., 2012):
Nu¼ 0:60Re1=2 for Rer104
0:032Re4=5þ9:2 for Re4104:
(ð2Þ
The radiative flux is (e.g., Nobel, 2005; Leigh et al., 2012):
Q rad ¼ aVS0 cos ðϕSÞ j sin ðϕðiÞ �ϕSÞj þr� �
þaIRσ T4skyþT4
surr
� ��2eIRσ T ðiÞ
l
� �4; ð3Þ
where the three terms on the right-hand side correspondrespectively to the direct and reflected solar radiation on the leaf,the infrared radiation absorbed by the leaf, and the infrared
radiation emitted by the leaf. Here, aV and aIR are respectively theleaf absorptances at visible and infrared wavelengths respectively,r is the reflectance of the surroundings, S0 is the direct solarradiation at full zenithal sunlight, ϕðiÞ is the leaf inclination angle,ϕS is the solar azimuthal angle, with ϕS ¼ 0 if the sun is at thezenith and ϕS ¼ π=2 if it is at the horizon, σ is the Stefan–Boltz-mann constant ðσ ¼ 5:67� 10�8 W m�2 K�4Þ, Tsky and Tsurr arerespectively the effective temperatures of the sky and the sur-roundings, and eIR is the leaf emissivity at infrared wavelengths.Eq. (3) assumes that the leaf is at some height above ground, andthus that the direct solar radiation is incident only on the topsurface of the leaf, the reflected and diffusive visible and infraredradiations only on the bottom surface, and that the emittedinfrared radiation emanates from both leaf surfaces, hence thefactor of 2 in front of the last term (Leigh et al., 2012). In this paperwe represent the direct solar radiation by the first term in Eq. (3)by assuming an idealized two-dimensional tree oriented so thatthe sun trajectory and the deformed petiole shape are both con-tained on the plane of symmetry of the leaves. We also disregardself-shading effects within the tree crown.
Since T ðiÞl is usually close to Ta, in our derivation we linearize
Eq. (3) by approximating
2eIR T ðiÞl
� �4� 2eIRT
4aþ8eIRT
3a ðT ðiÞ
l �TaÞ: ð4Þ
In order to simplify the model's calculations, we only keepthe leading-order terms in the infrared radiation term. The con-served terms are all of leading-order, since the typical magnitudeof 2eIRT
4a is comparable to the magnitude of the direct radiation,
aVS0, and the magnitude of 8eIRT3a ðT ðiÞ
l �TaÞ is comparable to that ofαðTa�T ðiÞ
l Þ in Eq. (1). Terms of order ðT ðiÞl �TaÞ2 can however be
neglected in our leading-order approximation.We can estimate the typical time scale involved in Eq. (1) by
balancing the time-dependent term on the left-hand side with thetypical magnitude of the net radiation, on the order of10–1000 W=m2. Assuming tl � 0:5 mm, Cl � 2:5 MJ m�2 K�1
(Leigh et al., 2012), and a typical leaf temperature variationΔT ðiÞ
l � 10 K, we obtain a typical time scale on the order of sec-onds, which is much smaller than our time scales of interest(hours to days). We can thus assume steady state ðdT ðiÞ
l =dt ¼ 0Þ.With our approximation given by Eq. (4), Eq. (1) then yields the

D. Gonzalez-Rodriguez et al. / Journal of Theoretical Biology 398 (2016) 20–31 23
following approximate expression for the leaf temperature, whichwe have derived by assuming a two-dimensional tree:
T ðiÞl ¼ Taþ 1
αþ8eIRσT3a
aVS0 cos ðϕSÞ j sin ðϕðiÞ �ϕSÞj þr� �
�LρqðiÞT;lAl
þQ
" #; ð5Þ
where Q � aIRσðT4skyþT4
surrÞ�2eIRσT4a takes a constant value in our
calculation.
2.2. Transpiration in the leaf
Following Buckley (2005), we assume that the transpirationflux from the leaf can be written as the product of the stomatalconductance, gs ðmol m�2 s�1Þ, and the humidity differencebetween leaf i and the air, wðiÞ
l �wa ðmol H2O=mol airÞ. Thus, thetranspiration flux through leaf i is
qðiÞT;l ¼ VmwAlgs wðiÞl �wa
� �; ð6Þ
where Vmw ¼ 18� 10�6 m3=mol is the molar volume of water.Note that wa ¼H wsatðTaÞ, where H is the relative air humidity andwsatðTaÞ is the water vapor saturation humidity at air temperature.We also assume that the humidity in the leaf corresponds to watervapor saturation at the leaf temperature, i.e., wðiÞ
l ¼wsatðT ¼ T ðiÞl Þ.
The relationship between water saturation and temperature (e.g.,Nobel, 2005) can be fitted by a quadratic polynomial:
wl � aTT2l �bTT lþcT; ð7Þ
where, with T l in K and wl in mol H2O/mol air, the dimensionalcoefficients are aT ¼ 6:2398� 10�5, bT ¼ 3:5216� 10�2, andcT ¼ 4:9830. This fitting has been obtained for 288:15rT lr323:15 K (15–50 1C), with a maximum relative error in wl of 18%.In the calculation that follows, it will be more convenient to use apolynomial fitting of T l as a function of wl:
T l � �aw2l þbwlþc: ð8Þ
By expressing T l in K and wl in mol H2O/mol air, the dimensionalvalues a¼2966, b¼722, and c¼277 yield a fitting with a max-imum error of 2.2 K in the range 0:012rwlr0:12.
The stomatal conductance is assumed to depend on the leafwater potential through a logistic function similar to the oneproposed by Tuzet et al., 2003:
gs ¼ g0þg11
1þesðΨ r �Ψ lÞ; ð9Þ
where Ψ l is the leaf water potential (Pa) and Ψ r is a referencepotential. Eq. (9) indicates that at high water potential ðΨ l⪢Ψ rÞ,stomatal conductance is equal to g0þg1 ("open stomata"),whereas at low water potential ðΨ l⪡0Þ stomatal conductance isequal to g0 ("closed stomata"). The sensitivity parameter s (Pa�1)controls the abruptness of the transition between the “open” and“closed” states. By modulating the value of Ψ r we can modelanisohydric behavior ðΨ l⪢Ψ rÞ or isohydric behavior ðΨ l �Ψ rÞ.
2.3. Hydrodynamics of the xylem
We assume that the flow rate in the xylem is set by the tran-spiration rate in the leaves, QT ¼
PNi ¼ 1 q
ðiÞT;l, where N is the number
of leaves in the tree. We neglect phloem flow of limited effect onthe physical couplings discussed in this paper We disregardchanges in water storage in the soil surrounding the roots, whichshould be taken into account when describing the tree responseover time scales of several days to weeks (Tuzet and Perrier, 2008),whereas here we focus on the tree response to water stress over ashorter time scale of hours to days. We also disregard water sto-rage in the plant. Thus, the results presented here describe waterstress upon exhaustion of available reserves in tissue storage. Withthese simplifications, head loss between the soil and the petiole
yields:
Ψ l ¼Ψ s�RxQT; ð10Þwhere Ψ s is the water potential of the soil and Rx is the globalhydraulic resistance of the soil, roots, and xylem. Ψ l is assumed torepresent both leaf and petiole water potential, thus disregardinghead losses through the petiole and leaf veins. If the hydraulicresistance of the petiole was significant, and without changing ourmodel's conclusions, we could readily reinterpret our equations byconsidering that petiole hydraulic resistance is included in Rx andthat we express the petiole rigidity (Eq. (14)) in terms of thehydraulic pressure at the leaf. Without matrix wetting effects, theleaf water potential is
Ψ l ¼ pt�Πþρgh; ð11Þwhere pt is the turgor pressure (relative to the atmosphericpressure),Π is the osmotic pressure, here assumed constant, and his the height of the tree. Combining Eqs. (10) and (11) yields:
pt ¼Ψ s�RxQT�ρghþΠ: ð12Þ
2.4. Leaf inclination
We describe the inclination of a leaf by applying the expressiondeduced by Tadrist et al. (2014) to the case of a leaf deflected by itsown weight (we neglect the wind effect on leaf inclination):
ϕðiÞ ¼ jθðiÞ j þπEG1þEG
" #sgnðθðiÞÞ; ð13Þ
where ϕðiÞ is the angle of leaf i with the vertical direction (ϕðiÞ ¼ 0for a leaf pointing towards the sky and ϕðiÞ ¼ π=2 for a horizontalleaf, see Fig. 1); θðiÞ is the angle of the petiole at the branching withthe vertical direction; and EG ¼ΛLmg=ðEIÞ is the elasto-gravitynumber, with Λ being the arm of the leaf's weight,mg, L the lengthof the petiole, and EI the bending rigidity of the petiole. Eq. (13) isan approximate solution of the elastic beam equation assumingΛ=L⪡1 and ψ � π; the reader is referred to Tadrist et al. (2014) fordetails (in practice, Eq. (13) remains reasonably accurate forψ4π=3). The elastic modulus E depends on turgor pressure(Nilsson et al., 1958; Niklas and Spatz, 2012). Niklas and Spatz(2012) considered a spherical cell and suggested a relationshipthat can be written in the form E¼ E0þγpt, where E0 and γ areconstants. Without loss of generality we can assume E0 ¼ 0, sincewe are free to redefine the zero absolute pressure at the point ofcomplete wilting (E¼0). Thus, if pt40, we can write:
EG ¼ pð0Þt
pt; ð14Þ
where pð0Þt is the turgor pressure that yields EG ¼ 1. Note that, ifptr0, then ϕ¼ π and the leaf points vertically downwards(complete wilting).
Combining Eqs. (13) and (14) leads to:
ϕðiÞ ¼jθðiÞ jptþπpð0Þt
ptþpð0Þt
" #sgnðθðiÞÞ if pt40;
π sgnðθðiÞÞ if ptr0:
8>><>>: ð15Þ
2.5. Nondimensionalization
The problem is governed by Eqs. (5), (6) (12) and (15). The fourunknowns are the leaf-to-air temperature difference, ΔT ðiÞ ¼T ðiÞl �Ta, the leaf transpiration flux, qðiÞT;l, the turgor pressure, pt, and
the leaf inclination angle, ϕðiÞ. Moreover, Eqs. (5) and (6) arecoupled via the auxiliary variable ΔwðiÞ ¼wðiÞ
l �wa (the leaf-to-airhumidity difference), which is related to ΔT ðiÞ through Eq. (7).
D. Gonzalez-Rodriguez et al. / Journal of Theoretical Biology 398 (2016) 20–3124
To nondimensionalize the problem, we choose pð0Þt (the turgorpressure yielding EG ¼ 1) as the unit pressure, ΔT0 � aVS0=ðαþ8eIRσT3
a Þ (the leaf-to-air temperature difference due to direct solarradiation) as the unit temperature difference, Δw0 �wsatðT l ¼ Ta
þΔT0Þ�wa (the leaf-to-air humidity difference corresponding tothe unit temperature difference ΔT0) as the unit humidity differ-ence. We thus define the following nondimensional variables:
ΔTðiÞ �ΔT ðiÞ
ΔT0ð16Þ
Δw ðiÞ �ΔwðiÞ
Δw0ð17Þ
qðiÞT;l �
qðiÞT;lNVmwAlg1Δw0
ð18Þ
pt �ptpð0Þt
; ð19Þ
plus the variable ϕðiÞ, which is already nondimensional.The normalized governing equations are:
ΔTðiÞ ¼ j sin ðϕðiÞ �ϕSÞj cos ϕSþr cos ϕSþQ �CLgΔw ðiÞ ð20Þ
qT ¼gPN
i ¼ 1Δw ðiÞ
Nð21Þ
pt ¼ Ψ eff �CgqT ð22Þ
ϕðiÞ ¼πþjθðiÞ j pt
1þ pt
" #sgnðθðiÞÞ if pt40
π sgnðθðiÞÞ if ptr0:
8>><>>: ð23Þ
The normalized equations contain the following nondimensionalcoefficients:
Ψ eff �Ψ sþΠ�ρgh
pð0Þt
ð24Þ
Q � QaVS0
ð25Þ
Cg � RXNVmwAlg1Δw0
pð0Þt
ð26Þ
CL �LρVmwg1Δw0
aVS0: ð27Þ
The meaning of these four nondimensional coefficients is thefollowing. Ψ eff represents the available soil water potential, rela-tive to the pressure needed to keep the petiole turgid. Q repre-sents the ratio of indirect radiation on the leaf (independent of itsinclination) to the direct radiation (dependent on the leaf and suninclinations). Cg represents the importance of water potential lossdue to flow along the xylem, relative again to the pressure neededto keep the petiole turgid; this coefficient is directly proportionalto the stomatal conductance gs. CL represents the importance ofthe evaporation term in the energy balance, compared to the solarradiation term. Considering typical parameter values for a treeobtained from the literature (see Table 1), one deduces that CL, Ψ ,Q , and Cg are all of order 1 (larger than 0.1 and smaller than 10).This result indicates that all physical phenomena accounted for bythe model are of comparable quantitative importance. Thus, for a
tree characterized by the parameter values in Table 1, none ofthese physical phenomena can be neglected.
An auxiliary equation, derived from Eq. (8), relates ΔTðiÞ
withΔwðiÞ:
ΔTðiÞ � � aðΔwðiÞÞ2þ bΔw ðiÞ � c; ð28Þ
with a ¼ aðΔw0Þ2=ΔT0, b ¼ ðb�2awaÞΔw0=ΔT0, and c ¼ ½bwað1� HÞ=H�aw2
a ð1�H2Þ=H2�=ΔT0, where H¼wa=wsatðT ¼ TaÞ is thefraction of saturation humidity in the air.
Finally, the stomatal conductance (Eq. (9)) is normalized toyield
g ¼ G0þ1
1þeSðΨ r � p tÞ; ð29Þ
where g � gs=g1, G0 � g0=g1, S� spð0Þt , and Ψ r � ðΨ rþΠÞ=pð0Þt .The problem can be reduced to a system of equations for the
variables pt and ϕðiÞ:
pt ¼ Ψ eff �Cggffiffiffia
p α0�1N
XNi ¼ 1
ffiffiffiffiffiffiffiffiffiffiffiffiffiffiffiffiffiffiffiffiffiffiffiffiffiffiffiffiffiffiffiffiffiffiffiffiffiffiffiffiffiffiffiffiffiffiffiffiffiffiffiffiffiffiffiffiffiffiffiffiffiffiffiffiffiffiffiffiffiffiffiffiffiffiffiffiffiffiffiffiffiffiffiffiffiffiffiffiffiffiα20�ðcþQ Þ� cos ðϕSÞðj sin ðϕðiÞ �ϕSÞj þrÞ
q" #
ð30Þ
ϕðiÞ ¼πþjθðiÞ j pt
1þ pt
" #sgnðθðiÞÞ if pt40
π sgnðθðiÞÞ if ptr0;
8>><>>: ð31Þ
where α0 � ðbþCLÞ=ð2ffiffiffia
pÞ, and g is given by Eq. (29).
2.6. Branch and leaf inclination angle distributions
In the following we will consider two representations of thetree geometry. First, we will consider a uniform foliage model(Fig. 1A) where all N leaves of the tree have identical inclinations(i.e., same θðiÞ and thus same ϕðiÞ). In this uniform foliage model,Eqs. (30) and (31) reduce to a system of two equations with twounknowns, pt and ϕ.
Second, we will consider a distributed foliage model (Fig. 1B),where a single trunk is connected to N leaves with differentinclinations. Such a geometry is characterized by the branchinclination angle distribution (BIAD). Strictly speaking, our modeltree does not have branches, and the BIAD actually refers to thebranching angle at which the petiole stems from the trunk. TheBIAD can be represented by a polar plot (brown dashed curve inthe inset of Fig. 1B), where the distance from the origin to thecurve, measured along a given radius, is proportional to fθ, theprobability that a given tree branch is oriented in the direction ofthat radius. As discussed by Tadrist et al. (2014), a realisticdescription of a tree BIAD is provided by a Gaussian distribution ofthe form:
f θðθÞ ¼ Aθe�ðj θ j �μθ Þ2=ð2σ2
θÞ; ð32Þwhere μθ and σθ are the mean and standard deviation, and Aθ is aconstant. As studied by Tadrist et al. (2014), petiole flexibility andleaf weight cause leaves to have a larger inclination than branchesdo. In a distributed foliage model, leaf geometry is characterizedby a leaf inclination angle distribution (LIAD, green solid curve inthe inset of Fig. 1B) different than the BIAD. If the BIAD is known,one can apply Eq. (31) to the different leaves to deduce the LIAD. Inthis way, the BIAD in Eq. (32) yields the following LIAD:
fϕðϕÞ ¼Aϕe
�ðjϕj �mθÞ2=ð2s2ϕÞ if ϕminr jϕjrπ0 otherwise;
(ð33Þ
D. Gonzalez-Rodriguez et al. / Journal of Theoretical Biology 398 (2016) 20–31 25
where mϕ � ðπþ pt μθÞ=ð1þ ptÞ, sϕ � σθ pt=ð1þ ptÞ, ϕmin �π=ð1þ ptÞ, and
Aϕ ¼ 1sϕ
ffiffiffiffi2π
r1
erfπ�μθσθ
ffiffiffi2
p !
þerfμθ
σθffiffiffi2
p !" #: ð34Þ
3. Results and discussion
We start this part by discussing the results obtained for theuniform foliage model. In Section 3.1 we study how petiole flex-ibility affects the minimal pressure attained in a tree and thus therisk of cavitation. Cavitation is a progressive phenomenon, wherexylem conductance decreases progressively with decreasing xylempressure, as described by the so-called xylem vulnerability curve(Cochard, 2006). Here we do not consider the tree vulnerabilitycurve, but rather we describe cavitation by the pressure thresholdfor the onset of xylem embolism. In Section 3.2 we investigate theimpact of parameter uncertainty on the results by performing aSobol sensitivity analysis of the uniform foliage model. Next, inSection 3.3, we repeat the study of petiole flexibility effects in themore realistic distributed foliage model. In Section 3.4 we intro-duce active stomatal closure to model isohydric and anisohydrictree strategies. For a specific water stress level, we study howthese two strategies, combined with petiole flexibility, affectphotosynthesis and cavitation. Finally, in Section 3.5 we investi-gate a range of water stress levels and a range of sensitivities ofpetiole flexibility to changes in turgor pressure, in order to
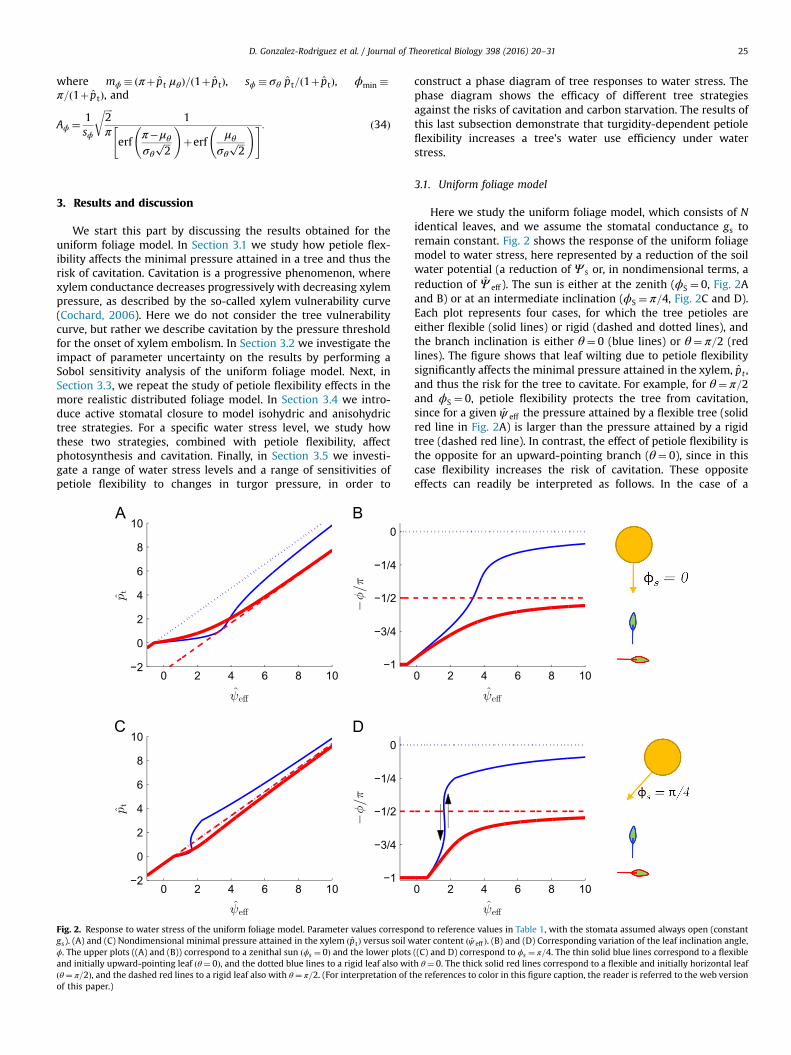
Fig. 2. Response to water stress of the uniform foliage model. Parameter values correspogs). (A) and (C) Nondimensional minimal pressure attained in the xylem ðptÞ versus soil wϕ. The upper plots ((A) and (B)) correspond to a zenithal sun ðϕs ¼ 0Þ and the lower plotsand initially upward-pointing leaf ðθ¼ 0Þ, and the dotted blue lines to a rigid leaf also witðθ¼ π=2Þ, and the dashed red lines to a rigid leaf also with θ¼ π=2. (For interpretation of tof this paper.)
construct a phase diagram of tree responses to water stress. Thephase diagram shows the efficacy of different tree strategiesagainst the risks of cavitation and carbon starvation. The results ofthis last subsection demonstrate that turgidity-dependent petioleflexibility increases a tree's water use efficiency under waterstress.
3.1. Uniform foliage model
Here we study the uniform foliage model, which consists of Nidentical leaves, and we assume the stomatal conductance gs toremain constant. Fig. 2 shows the response of the uniform foliagemodel to water stress, here represented by a reduction of the soilwater potential (a reduction of Ψ s or, in nondimensional terms, areduction of Ψ eff ). The sun is either at the zenith (ϕS ¼ 0, Fig. 2Aand B) or at an intermediate inclination (ϕS ¼ π=4, Fig. 2C and D).Each plot represents four cases, for which the tree petioles areeither flexible (solid lines) or rigid (dashed and dotted lines), andthe branch inclination is either θ¼ 0 (blue lines) or θ¼ π=2 (redlines). The figure shows that leaf wilting due to petiole flexibilitysignificantly affects the minimal pressure attained in the xylem, pt ,and thus the risk for the tree to cavitate. For example, for θ¼ π=2and ϕS ¼ 0, petiole flexibility protects the tree from cavitation,since for a given ψ eff the pressure attained by a flexible tree (solidred line in Fig. 2A) is larger than the pressure attained by a rigidtree (dashed red line). In contrast, the effect of petiole flexibility isthe opposite for an upward-pointing branch (θ¼ 0), since in thiscase flexibility increases the risk of cavitation. These oppositeeffects can readily be interpreted as follows. In the case of a
nd to reference values in Table 1, with the stomata assumed always open (constantater content ðψ eff Þ. (B) and (D) Corresponding variation of the leaf inclination angle,((C) and D) correspond to ϕs ¼ π=4. The thin solid blue lines correspond to a flexibleh θ¼ 0. The thick solid red lines correspond to a flexible and initially horizontal leafhe references to color in this figure caption, the reader is referred to the web version

D. Gonzalez-Rodriguez et al. / Journal of Theoretical Biology 398 (2016) 20–3126
horizontal branch ðθ¼ π=2Þ, flexibility reduces the sun irradiationon the leaf. Thus, transpiration through the leaf and head lossalong the xylem decrease, and the minimal pressure attained inthe xylem is less pronounced than for a rigid petiole. For anupward-pointing branch ðθ¼ 0Þ, however, flexibility increases sunirradiation onto the leaf, thus increasing transpiration and makingthe minimal xylem pressure more negative.
Fig. 2B and D shows the evolution of the leaf inclination angleas a function of water stress. Interestingly, the leaf inclinationangle can increase steeply for a small reduction of soil watercontent, for example for the case of θ¼ 0 and ϕS ¼ π=4 (solid blueline in Fig. 2B and D). It is noted that the curve has a slight S shape,which is indicative of hysteresis (represented by the black arrows):if the soil is drying, the water content at which the leaf wilts isΨ eff � 1:60, smaller than the soil water content required for theleaf to recover turgidity upon soil rehydration ðΨ eff � 1:66Þ. Phy-sically, this hysteresis loop is due to the leaf avoiding an inclinationnormal to solar irradiation. Hysteretic effects between dehydrationand rehydration have been experimentally observed in plants andattributed to elastic hysteresis in cell tissue response to turgorpressure (Murphy and Ortega, 1996). Here, we identify a newmechanism of dehydration–rehydration hysteresis, arising from aninterplay between the leaf and the sun inclination angles.
3.2. Sensitivity analysis
We next consider how the uncertainty in the model parametersmay impact the model's results discussed above. Fig. 3 shows theresult of a Sobol sensitivity analysis (e.g., Saltelli et al., 2004) of theuniform foliage model, in terms of the dimensional parameters. Thegoal of this analysis is to determine how the variance in the cal-culated turgor pressure, pt, can be attributed to the variances of themodel's dimensional parameters (listed along the abscissa of Fig. 3).We perform a Monte Carlo experiment consisting of 104 realiza-tions, in which the model parameters take random values that areuniformly distributed within their ranges of variation (Table 1).Fig. 3 shows two types of variance decomposition indices: first-order Sobol indices (light blue bars in the figure), which representthe fraction of the variance of the output due to the variation of asingle parameter (but averaged over variations in all the otherparameters); and total-order Sobol indices (dark red bars in thefigure), which represent the fraction of the variance of the outputdue to the variation of a given parameter, alone and in interactionwith other input variables. As a consequence of their definitions, thesum of first-order Sobol indices (rightmost light blue bar) is smallerthan 1, since it disregards the fraction of the variances resulting
Fig. 3. Sobol sensitivity analysis of the uniform foliage model. The range of varia-bility in the input parameters is listed in Table 1. The light blue bars correspond tofirst-order Sobol indices and the dark red bars to total-order Sobol indices. The sumof total-order Sobol indices is 2.8 (note that the height of the corresponding bar isnot fully shown in the figure, truncated at height 1). (For interpretation of thereferences to color in this figure caption, the reader is referred to the web version ofthis paper.)
from their interactions, whereas the sum of total-order indices(rightmost dark red bar, truncated) is larger than 1, since theinteraction terms are counted multiple times. Sobol indices arecalculated by applying the modified Homma–Saltelli method pro-posed by Wu et al. (2012). The figure indicates that the model ishighly nonlinear, since the variance is dominated by parameterinteractions (i.e., the total Sobol indices are significantly larger thanthe first-order indices). The model is particularly sensitive to leafand sun inclinations, as it is intuitively expected, as well as to heatexchange parameters (aV, S0, Tsky, Tsurr), to certain hydraulic para-meters (gs and RX), and to petiole flexibility ðpð0Þt Þ. The model ishowever rather insensitive to tree height (h) and to air humidity(H), within the assumed range of variability of these parameters. Itis noted that the variance decomposition method of Sobol usedhere strictly applies to independent parameters only. Therefore, weshould interpret these results as merely an indication on themathematical dependence of the outputs on the parameters, sincesome of our parameters do not vary independently in reality. Forexample, hydraulic resistance RX is expected to depend on treeheight h, and thus the model is indirectly sensitive to h through itssensitivity to RX.
3.3. Distributed foliage model
To represent a tree more realistically than the uniform foliagemodel does, we next account for the diversity of branch orienta-tions, which we represent by a Gaussian branch inclination angledistribution (BIAD). We continue to assume that all leaf petiolesare located at the upper end of a common xylem, and thus thevalue of pt remains common to them all. Fig. 4A shows the non-dimensional turgor pressure as a function of the nondimensionalsoil water content, assuming a zenithal sun ðϕS ¼ 0Þ and a BIAD ofmean μθ ¼ π=4 and standard deviation σθ ¼ π=8, which are valuesrepresentative of real trees (Tadrist et al., 2014). The solid line inthe figure represents the response of a flexible tree. The dashedline represents a rigid tree for which the leaf inclination angle
Fig. 4. Response to water stress of a tree with normally distributed branch incli-nation angles (μθ ¼ π=4, σθ ¼ π=8). Parameter values correspond to reference valuesin Table 1, with the stomata assumed always open (constant gs) and the sun at thezenith ðϕS ¼ 0Þ. (A) Nondimensional minimal pressure attained in the xylem ðptÞversus soil water content ðψ eff Þ for flexible petioles (solid line) or rigid petioles(dashed line). The dotted line indicates a rigid tree that keeps the leaf inclinationangles corresponding to ψ eff ¼ 5, a well-watered condition. The double-pointingarrow indicates the protection against water stress due to petiole flexibility. (B)Polar representation of the evolution of the leaf inclination angle distribution withincreasing water stress. The dashed black curve corresponds to an infinite ψ eff . Thethickest blue line, thick red line, thin magenta line, and thinnest green line cor-respond respectively to ψ eff ¼ 10, 5, 3, and 1. (For interpretation of the references tocolor in this figure caption, the reader is referred to the web version of this paper.)

D. Gonzalez-Rodriguez et al. / Journal of Theoretical Biology 398 (2016) 20–31 27
distribution (LIAD) is identical to the BIAD. Thus, the solid line andthe dashed line are asymptotically identical as Ψ eff-1. Thedotted line represents a rigid tree whose LIAD is identical to that ofthe flexible tree at Ψ eff ¼ 0, which dimensionally corresponds to awell watered condition ðΨ s ¼ 0:1 MPaÞ. Thus, the gap between thedotted and the solid lines (double-pointing arrow) measures theprotection from cavitation by petiole flexibility. In dimensionalterms, this protection by flexibility corresponds to a reduction inthe soil water potential for tree cavitation of about 0.5 MPa. Fig. 4Bshows the evolution of the LIAD with decreasing soil water con-tent. It illustrates how, as the leaves wilt, the LIAD's standarddeviation decreases. Indeed, at complete wilting, all leaves reachthe same inclination ðϕ¼ πÞ.
3.4. Effect of water stress on photosynthesis
At this point we introduce two paradigms of tree response towater stress: a tree can let leaf water potential fluctuate (aniso-hydric behavior) or it can regulate stomatal opening to keep arelatively constant leaf water potential (isohydric tree). To modelthese two idealized tree responses, and unlike the constant valueof gs assumed in the simulations above, in the following we con-sider that stomatal opening varies with leaf water potential, asdescribed by Eq. (9). As discussed above, the choice of Ψ r inEq. (9) allows us to represent either anisohydric or isohydricbehavior. Fig. 5 represents the variation of gs for two differentchoices of Ψ r, which in the following correspond to our modelisohydric tree (blue line) and to our model anisohydric tree (redline). The gray region in Fig. 5 indicates the typical range of var-iation of soil water potential considered in the following. It isnoted that only the isohydric tree significantly regulates stomatalopening over this range.
In what follows, we will investigate not only the risk of cavi-tation due to water stress, but also the effect of water stress onphotosynthetic carbon assimilation. To compute carbon assimila-tion, we use the model of Farquhar et al. (1980). A summary of themodel's equations is presented in Appendix A. For the sake ofclarity, in the following the model results will be presented indimensional form. In order to account for daily photosynthesis
Fig. 5. Dependence of the stomatal conductance, gs, on the leaf water potential, Ψ l ,for two stomatal parameter sets, that we call isohydric (Ψ r ¼ �1 MPa, thick lightblue line) and anisohydric (Ψ r ¼ �2 MPa; thin dark red line). For both cases, thesensitivity parameter is taken as s¼ 5� 10�6 Pa�1, and the closed and open sto-matal conductances as g0 ¼ 0:01 mol m�2 s�1 and g1 ¼ 0:1 mol m�2 s�1 respec-tively. The shaded gray region is indicative of the interval of leaf water potentialsthat are experienced during moderate water stress. (For interpretation of thereferences to color in this figure caption, the reader is referred to the web version ofthis paper.)
variations, we will now consider the evolution of the sun incli-nation over a given day. For simplicity, a light time of 12 h isassumed, and all parameters other than the sun inclination areassumed constant over the 24-h day.
Fig. 6 shows model results over a day assuming a BIAD of meanμθ ¼ π=4 and standard deviation σθ ¼ π=8. The figure representsthe cases of a isohydric and of an anisohydric tree (blue and redlines respectively), which have either flexible or rigid petioles(solid and dashed lines respectively). It is noted that, since we havenot considered an explicit dependence of stomatal conductance onsolar irradiation, our model does not reproduce stomatal closure atnighttime (see Fig. 6B). The isohydric tree responds to peak waterstress at midday by closing the stomata (Fig. 6B), whereas theanisohydric tree responds by a more pronounced wilting (Fig. 6A).This result is consistent with observations of trees transientlywilting at midday, and rapidly recovering afterward (Chiariello etal., 1987). Fig. 6C shows that two strategies, stomatal control inisohydric trees and flexibility in anisohydric trees, are equallyeffective in limiting the minimal xylem pressure and thus the riskof cavitation, whereas the flexibility strategy of anisohydric trees ismore efficient in terms of photosynthetic assimilation, as shown inFig. 6D. The reader may find surprising that, in the isohydric case,the flexible tree attains a slightly lower pressure than the rigid tree(solid and dashed light blue lines in Fig. 6B). The reason is that inthis example we chose μθ ¼ π=4 which, due to leaf weight, rendersthe leaf inclinations of the flexible tree closer to π=2 than for therigid tree, and thus more exposed to solar irradiation. This lattereffect is of limited quantitative importance, since it does not affectthe minimal pressure attained at midday, critical for cavitation,and moreover it remains small when compared to the other effectsdescribed above. In conclusion, importantly, our model resultsindicate that petiole flexibility offers a useful mechanism of treeprotection against water stress. The efficiency of this protectivemechanism is comparable to that attained by active control ofstomatal opening.
3.5. Effect of water use strategies on the risks of cavitation andcarbon starvation
In this final results section, we conduct a more systematicexploration of the efficiency of protection against water stressprovided by turgidity-dependent petiole flexibility. In essence, theresults discussed in what follows show that, under conditions ofwater stress, turgidity-dependent flexible petioles systematicallyprovide higher water use efficiency than rigid petioles, as illu-strated by the rapid raising of the flexible-petiole solid curves inFig. 8 as compared with the sensibly flatter rigid-petiole dashedcurves in the same figure. Moreover, due to the biochemistry of C3
photosynthesis, a well-tuned flexible-petiole leaf can yield a largercarbon assimilation than a rigid horizontal leaf. This result isgraphically represented by the solid color lines in Fig. 7B over-taking the daily CO2 assimilation of the dashed black line, whichrepresents the rigid horizontal leaf. In the remaining of this sectionwe discuss these last results in more detail.
In Fig. 6, we considered only one particular value of petioleflexibility ðpð0Þt ¼ 104 PaÞ and of soil water potentialðψ s ¼ �0:75 MPaÞ. In Fig. 7, we explore the response of an iso-hydric tree (plot A) and of an anisohydric tree (plot B) to a sys-tematic variation of these two parameters, pð0Þt and ψ s. In thephase diagrams of Fig. 7, the tree state is represented by its dailyphotosynthetic assimilation (horizontal axis) and by the minimalpressure attained at the xylem over the day (vertical axis), thusquantifying the two main water stress risks. Thin solid lines ofdifferent colors correspond to different tree flexibilities; moreprecisely, the parameter that is varied between different color
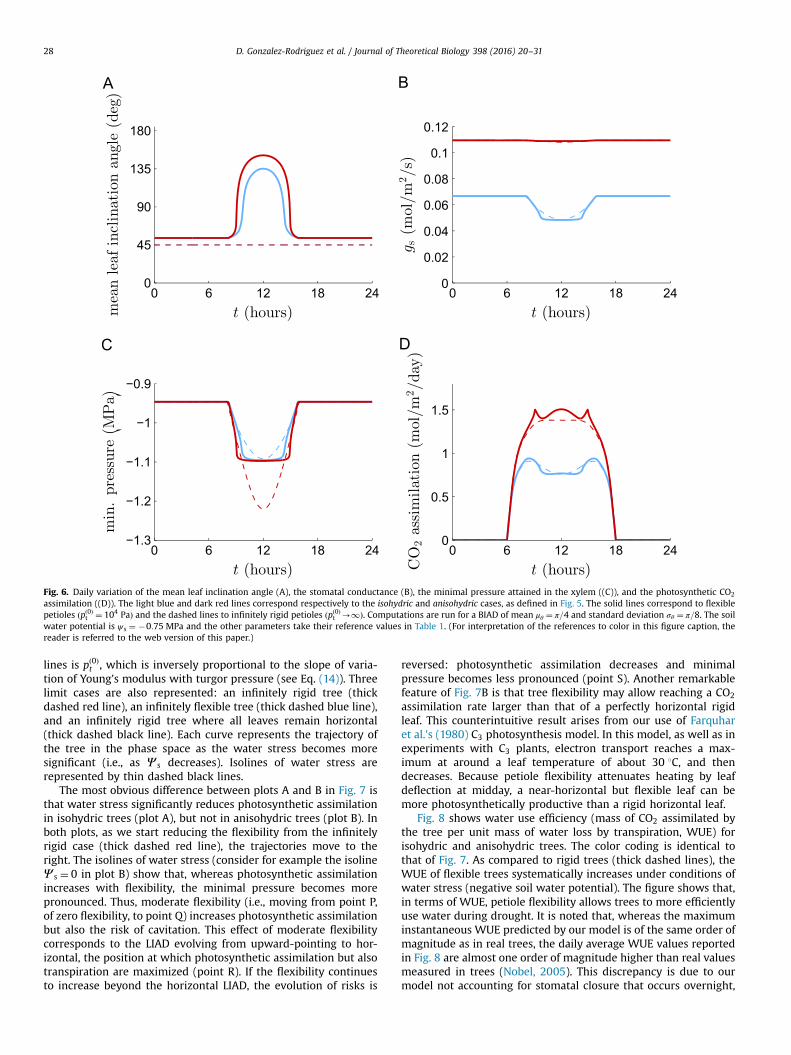
Fig. 6. Daily variation of the mean leaf inclination angle (A), the stomatal conductance (B), the minimal pressure attained in the xylem ((C)), and the photosynthetic CO2
assimilation ((D)). The light blue and dark red lines correspond respectively to the isohydric and anisohydric cases, as defined in Fig. 5. The solid lines correspond to flexiblepetioles ðpð0Þt ¼ 104 PaÞ and the dashed lines to infinitely rigid petioles ðpð0Þt -1Þ. Computations are run for a BIAD of mean μθ ¼ π=4 and standard deviation σθ ¼ π=8. The soilwater potential is ψ s ¼ �0:75 MPa and the other parameters take their reference values in Table 1. (For interpretation of the references to color in this figure caption, thereader is referred to the web version of this paper.)
D. Gonzalez-Rodriguez et al. / Journal of Theoretical Biology 398 (2016) 20–3128
lines is pð0Þt , which is inversely proportional to the slope of varia-tion of Young's modulus with turgor pressure (see Eq. (14)). Threelimit cases are also represented: an infinitely rigid tree (thickdashed red line), an infinitely flexible tree (thick dashed blue line),and an infinitely rigid tree where all leaves remain horizontal(thick dashed black line). Each curve represents the trajectory ofthe tree in the phase space as the water stress becomes moresignificant (i.e., as Ψ s decreases). Isolines of water stress arerepresented by thin dashed black lines.
The most obvious difference between plots A and B in Fig. 7 isthat water stress significantly reduces photosynthetic assimilationin isohydric trees (plot A), but not in anisohydric trees (plot B). Inboth plots, as we start reducing the flexibility from the infinitelyrigid case (thick dashed red line), the trajectories move to theright. The isolines of water stress (consider for example the isolineΨ s ¼ 0 in plot B) show that, whereas photosynthetic assimilationincreases with flexibility, the minimal pressure becomes morepronounced. Thus, moderate flexibility (i.e., moving from point P,of zero flexibility, to point Q) increases photosynthetic assimilationbut also the risk of cavitation. This effect of moderate flexibilitycorresponds to the LIAD evolving from upward-pointing to hor-izontal, the position at which photosynthetic assimilation but alsotranspiration are maximized (point R). If the flexibility continuesto increase beyond the horizontal LIAD, the evolution of risks is
reversed: photosynthetic assimilation decreases and minimalpressure becomes less pronounced (point S). Another remarkablefeature of Fig. 7B is that tree flexibility may allow reaching a CO2
assimilation rate larger than that of a perfectly horizontal rigidleaf. This counterintuitive result arises from our use of Farquharet al.'s (1980) C3 photosynthesis model. In this model, as well as inexperiments with C3 plants, electron transport reaches a max-imum at around a leaf temperature of about 30 1C, and thendecreases. Because petiole flexibility attenuates heating by leafdeflection at midday, a near-horizontal but flexible leaf can bemore photosynthetically productive than a rigid horizontal leaf.
Fig. 8 shows water use efficiency (mass of CO2 assimilated bythe tree per unit mass of water loss by transpiration, WUE) forisohydric and anisohydric trees. The color coding is identical tothat of Fig. 7. As compared to rigid trees (thick dashed lines), theWUE of flexible trees systematically increases under conditions ofwater stress (negative soil water potential). The figure shows that,in terms of WUE, petiole flexibility allows trees to more efficientlyuse water during drought. It is noted that, whereas the maximuminstantaneous WUE predicted by our model is of the same order ofmagnitude as in real trees, the daily average WUE values reportedin Fig. 8 are almost one order of magnitude higher than real valuesmeasured in trees (Nobel, 2005). This discrepancy is due to ourmodel not accounting for stomatal closure that occurs overnight,
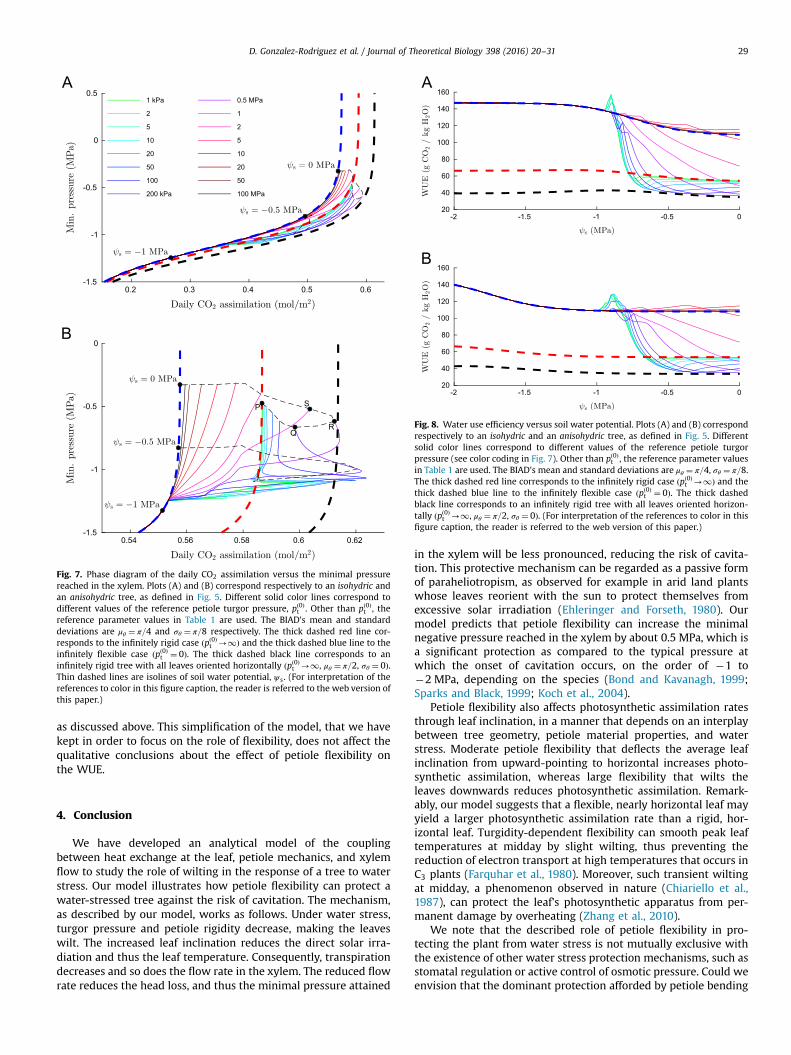
Fig. 7. Phase diagram of the daily CO2 assimilation versus the minimal pressurereached in the xylem. Plots (A) and (B) correspond respectively to an isohydric andan anisohydric tree, as defined in Fig. 5. Different solid color lines correspond todifferent values of the reference petiole turgor pressure, pð0Þt . Other than pð0Þt , thereference parameter values in Table 1 are used. The BIAD's mean and standarddeviations are μθ ¼ π=4 and σθ ¼ π=8 respectively. The thick dashed red line cor-responds to the infinitely rigid case ðpð0Þt -1Þ and the thick dashed blue line to theinfinitely flexible case ðpð0Þt ¼ 0Þ. The thick dashed black line corresponds to aninfinitely rigid tree with all leaves oriented horizontally ðpð0Þt -1, μθ ¼ π=2, σθ ¼ 0Þ.Thin dashed lines are isolines of soil water potential, ψ s. (For interpretation of thereferences to color in this figure caption, the reader is referred to the web version ofthis paper.)
Fig. 8. Water use efficiency versus soil water potential. Plots (A) and (B) correspondrespectively to an isohydric and an anisohydric tree, as defined in Fig. 5. Differentsolid color lines correspond to different values of the reference petiole turgorpressure (see color coding in Fig. 7). Other than pð0Þt , the reference parameter valuesin Table 1 are used. The BIAD's mean and standard deviations are μθ ¼ π=4, σθ ¼ π=8.The thick dashed red line corresponds to the infinitely rigid case ðpð0Þt -1Þ and thethick dashed blue line to the infinitely flexible case ðpð0Þt ¼ 0Þ. The thick dashedblack line corresponds to an infinitely rigid tree with all leaves oriented horizon-tally ðpð0Þt -1, μθ ¼ π=2, σθ ¼ 0Þ. (For interpretation of the references to color in thisfigure caption, the reader is referred to the web version of this paper.)
D. Gonzalez-Rodriguez et al. / Journal of Theoretical Biology 398 (2016) 20–31 29
as discussed above. This simplification of the model, that we havekept in order to focus on the role of flexibility, does not affect thequalitative conclusions about the effect of petiole flexibility onthe WUE.
4. Conclusion
We have developed an analytical model of the couplingbetween heat exchange at the leaf, petiole mechanics, and xylemflow to study the role of wilting in the response of a tree to waterstress. Our model illustrates how petiole flexibility can protect awater-stressed tree against the risk of cavitation. The mechanism,as described by our model, works as follows. Under water stress,turgor pressure and petiole rigidity decrease, making the leaveswilt. The increased leaf inclination reduces the direct solar irra-diation and thus the leaf temperature. Consequently, transpirationdecreases and so does the flow rate in the xylem. The reduced flowrate reduces the head loss, and thus the minimal pressure attained
in the xylem will be less pronounced, reducing the risk of cavita-tion. This protective mechanism can be regarded as a passive formof paraheliotropism, as observed for example in arid land plantswhose leaves reorient with the sun to protect themselves fromexcessive solar irradiation (Ehleringer and Forseth, 1980). Ourmodel predicts that petiole flexibility can increase the minimalnegative pressure reached in the xylem by about 0.5 MPa, which isa significant protection as compared to the typical pressure atwhich the onset of cavitation occurs, on the order of �1 to�2 MPa, depending on the species (Bond and Kavanagh, 1999;Sparks and Black, 1999; Koch et al., 2004).
Petiole flexibility also affects photosynthetic assimilation ratesthrough leaf inclination, in a manner that depends on an interplaybetween tree geometry, petiole material properties, and waterstress. Moderate petiole flexibility that deflects the average leafinclination from upward-pointing to horizontal increases photo-synthetic assimilation, whereas large flexibility that wilts theleaves downwards reduces photosynthetic assimilation. Remark-ably, our model suggests that a flexible, nearly horizontal leaf mayyield a larger photosynthetic assimilation rate than a rigid, hor-izontal leaf. Turgidity-dependent flexibility can smooth peak leaftemperatures at midday by slight wilting, thus preventing thereduction of electron transport at high temperatures that occurs inC3 plants (Farquhar et al., 1980). Moreover, such transient wiltingat midday, a phenomenon observed in nature (Chiariello et al.,1987), can protect the leaf's photosynthetic apparatus from per-manent damage by overheating (Zhang et al., 2010).
We note that the described role of petiole flexibility in pro-tecting the plant from water stress is not mutually exclusive withthe existence of other water stress protection mechanisms, such asstomatal regulation or active control of osmotic pressure. Could weenvision that the dominant protection afforded by petiole bending
D. Gonzalez-Rodriguez et al. / Journal of Theoretical Biology 398 (2016) 20–3130
arises through a different mechanism than reducing solar irra-diation to the leaves? One alternative would be that petiolebending reduced hydrodynamic conductance, thus attenuating theminimal pressure under drought. The importance of thismechanism could be evaluated experimentally, by studying flowthrough an isolated petiole subjected to an imposed deflection. Asimilar experiment has recently been conducted by Lopez et al.(2014), who measured the flux through a segment of tree branchunder deflection. They concluded that mechanical strain does notaffect hydraulic conductivity.
In this paper we have studied the two paradigmatic cases of anisohydric tree (which decreases stomatal opening under waterstress) and an idealized anisohydric tree (where stomatal openingis largely insensitive to water stress). We have shown that, formoderate water stress, petiole flexibility in an anisohydric tree canprovide comparable protection against the risk of cavitation asstomatal closure does in an isohydric tree. Moreover, anisohy-dricity yields a larger photosynthetic assimilation rate than iso-hydricity. Both for isohydric and anisohydric trees, our modelindicates that turgidity-dependent petiole flexibility significantlyincreases water use efficiency under water stress. These modelpredictions could be experimentally tested by using a setupsimilar to that of Chiariello et al. (1987), where tree leaves aresupported by wires, thus preventing inclination changes. Bymeasuring upper xylem pressure (Balling and Zimmermann, 1990;Wei et al., 2001) in free versus supported leaf configurations, onecould establish the role of petiole flexibility in limiting the mini-mal pressure in a water-stressed tree.
Whereas this paper specifically focused on trees, the conceptspresented here are extensible to other plants by accounting notonly for petiole flexibility but also for stem flexibility. Weemphasize that the central results presented in this paper, whichindicate an important role of turgidity-dependent flexibility inprotecting the plant against water stress, appear robust. Indeed,our conclusions, first deduced for a uniformly oriented foliagemodel, remained valid when considering distributed foliageangles, indicating that the effect of the flexibility-based protectionmechanism does not vanish out when averaging among differentleaf inclinations. Similarly, we expect our results to qualitativelyremain valid if some of the simplifying hypotheses are relaxed.Thus, our model can be generalized to three-dimensional geo-metries by considering a 3D leaf orientation angle distribution. In3D, the wilting movement will not necessarily be coplanar withthe sun trajectory but, as in 2D, 3D wilting will protect the leaffrom excessive solar irradiation. The current model neglects self-shading, and it is thus directly relevant to monolayer trees, but itcan be generalized to account for self-shading in multilayer treesby modeling light–canopy interactions (see for instance Chelle andAndrieu, 2007). The anticipated robustness of our central resultsrelies on the universality of the underlying mechanism: regardlessof geometrical complexity and of the existence of additional pro-cesses not included in our model, in most plants a reduction ofturgor pressure will increase leaf inclination angles, thus reducingleaf exposition to the sun and protecting the plant.
Acknowledgments
The authors thank the members of the Institut de Modélisationdes Systèmes Vivants (IMSV) of University Paris-Saclay, and spe-cially Andrée Tuzet, for valuable suggestions and discussions. Wethank Loïc Tadrist for insightful discussions during the develop-ment of the model and Miguel Piñeirua as well as two anonymousreviewers for their careful reading of the manuscript and their
suggestions to improve it. The first author was funded through theGrant ANR-11-IDEX-0003-02 of the IMSV project, in the frame-work of the IDEX “Paris-Saclay”.
Appendix A. Equations of the photosynthesis model
This appendix summarizes the equations of the photosynthesismodel of Farquhar et al. (1980), as they are presented by Tuzetet al. (2003). The goal is to calculate the rate of CO2 assimilation,given by
A¼minðV c;V jÞ�Rd; ðA:1Þ
where Vc and V j are the assimilation rates limited by Rubisco andby RuBP respectively. In our calculation we neglect Rd, the rate ofCO2 evolution from processes other than photorespiration.
V c is obtained from
Vc ¼ V l;maxci�Γn
ciþKcð1þoi=KoÞ; ðA:2Þ
where oi ¼ 0:210 mol=mol and
V l;max ¼V refl;max expfðEaV=RTref Þð1�Tref=T lÞg
1þexpfðST l�EdVÞ=RT lg; ðA:3Þ
with V refl;max ¼ 10�4 mol=ðm2 sÞ, EaV ¼ 58 520 J=mol, EdV ¼ 220 000
J=mol, S¼ 700 J=ðmol KÞ, Tref ¼ 293:2 K, R¼ 8:31 J=ðmol KÞ, and T l
being the leaf temperature. Kc and Ko are computed from thefollowing expression, where x stands for either c or o:
Kx ¼ Kx;ref expEx
RTref1�Tref
T l
� �� �; ðA:4Þ
with Ko;ref ¼ 0:256 mol=mol, Kc;ref ¼ 3:02� 10�4 mol=mol,Eo ¼ 36 000 J=mol, and Ec ¼ 59 430 J=mol. Γn, the CO2 compensa-tion point in the absence of day respiration, is obtained from
Γn ¼ γ0 1þγ1 T l�Trefð Þþγ2ðT l�Tref Þ2h i
; ðA:5Þ
with γ0 ¼ 2:8� 10�5 mol=mol, γ1 ¼ 5:09� 10�2 K�1, andγ2 ¼ 1:0� 10�3 K�2.
V j is obtained from
V j ¼J4
ðci�ΓnÞðciþ2ΓnÞ
; ðA:6Þ
where J is obtained from
ΘJ2�ðαQphotþ Jl;maxÞJþαQphot Jl;max ¼ 0; ðA:7Þ
where α¼ 0:2 andΘ¼ 0:9 Qphot is the absorbed photon irradiance,which we assume proportional to the visible radiation received bythe leaf:
Qphot ¼ λQaVS0 cos ðϕSÞf sin ½minðmaxðsignðϕÞðϕ�ϕSÞ;0Þ;πÞ�þrg;ðA:8Þ
where λQ � 4:6� 10�6 mol=J is the fraction of visible radiationuseful for photosynthesis.
The remaining unknown in the above equations is ci, the CO2
concentration in the stomatal cavity. To compute ci, we impose
A¼ gCO2ðcv�ciÞ; ðA:9Þwhere gCO2 ¼ gs=1:6 and cv � 4� 10�4 mol=mol is the atmo-spheric CO2 concentration. It is noted that Eq. (A.9) neglects theboundary layer resistance to CO2 diffusion, which is assumedlimited by stomatal conductance. Eqs. (A.1) and (A.9) constitute asystem of two equations, from which the values of the twounknowns, ci and A, can be obtained.
D. Gonzalez-Rodriguez et al. / Journal of Theoretical Biology 398 (2016) 20–31 31
References
Allen, C.D., Macalady, A.K., Chenchouni, H., Bachelet, D., McDowell, N., Vennetier,M., Kitzberger, R., Rigling, A., Breshears, D.D., Hogg, E.H., Gonzalez, P., Fensham,R., Zhang, Z., Castro, J., Demidova, N., Lim, J.-H., Allard, G., Running, S.W.,Semerci, A., Cobb, N., 2010. A global overview of drought and heat-induced treemortality reveals emerging climate change risks for forests. For. Ecol. Manag.259, 660–684.
Balling, A., Zimmermann, U., 1990. Comparative measurements of the xylempressure of Nicotiana plants by means of the pressure bomb and pressureprobe. Planta 182, 325–338.
Bond, B.J., Kavanagh, K.L., 1999. Stomatal behavior of four woody species in relationto leaf-specific hydraulic conductance and threshold water potential. TreePhysiol. 19, 503–510.
Buckley, T., 2005. The control of stomata by water balance. New Phytol. 168,275–292.
Chelle, M., Andrieu, B., 2007. Functional–Structural Plant Modelling in Crop Pro-duction Modeling Light Environment of Virtual Plants. Springer, Amsterdam,Netherlands, pp. 75–89 (Chapter 7).
Chiariello, N.R., Field, C.B., Mooney, H.A., 1987. Midday wilting in a tropical pioneertree. Funct. Ecol. 1, 3–11.
Cochard, H., 2006. Cavitation in trees. C. R. Phys. 7, 1018–1026.Ehleringer, J., Forseth, I., 1980. Solar tracking by plants. Science 210, 1094–1098.Engelbrecht, B.M.J., Tyree, M.T., Kursar, T.A., 2007. Visual assessment of wilting as a
measure of leaf water potential and seedling drought survival. J. Trop. Ecol. 23,497–500.
Farquhar, G.D., von Caemmerer, S., Berry, J.A., 1980. A biochemical model of pho-tosynthetic CO2 assimilation in leaves of C3 species. Planta 149, 78–90.
Incropera, F.P., De Witt, D.P., 1985. Fundamentals of Heat and Mass Transfer, 2ndedition. John Wiley & Sons, Hoboken, New Jersey, USA.
Koch, G.W., Sillett, S.C., Jennings, G.M., Davis, S.D., 2004. The limits to tree height.Nature 428, 851–854.
Leigh, A., Sevanto, S., Ball, M.C., Close, J.D., Ellsworth, D.S., Knight, C.A., Nicotra, A.B.,Vogel, S., 2012. Do thick leaves avoid thermal damage in critically low windspeeds? New Phytol. 194, 477–487.
Lopez, R., Badel, E., Peraudeau, S., Leblanc-Fournier, N., Beaujard, F., Julien, J.-L.,Cochard, H., Moulia, B., 2014. Tree shoot bending generates hydraulic pressurepulses: a new long-distance signal?. J. Exp. Bot. 65, 1997–2008.
McDowell, N., Pockman, W.T., Allen, C.D., Breshears, D.D., Cobb, N., Kolb, T., Plaut, J.,Sperry, J., West, A., Williams, D.G., Yepez, E.A., 2008. Mechanisms of plant
survival and mortality during drought: why do some plants survive whileothers succumb to drought?. New Phytol. 178, 719–739.
Murphy, R., Ortega, J.K.E., 1996. A study of the stationary volumetric elastic mod-ulus during dehydration and rehydration of stems of pea seedlings. PlantPhysiol. 110, 1309–1316.
Niklas, K.J., Spatz, H.-C., 2012. Plant Physics. The University of Chicago Press, Chi-cago, Illinois, United States.
Nilsson, S.B., Hertz, C.H., Falk, S., 1958. On the relation between turgor pressure andtissue rigidity. II Theoretical calculations on model systems. Physiol. Plant. 11,818–837.
Nobel, P.S., 2005. Physicochemical and Environmental Plant Physiology. ElsevierAcademic Press, Amsterdam, Netherlands.
Sade, N., Gebremedhin, A., Moshelion, M., 2012. Risk-taking plants: anisohydricbehavior as a stress-resistance trait. Plant Signal Behav. 7, 767–770.
Saltelli, A., Tarantola, S., Campolongo, F., Ratto, M., 2004. Sensitivity Analysis inPractice. Wiley, Hoboken, New Jersey, United States.
Sparks, J.P., Black, A., 1999. Regulation of water loss in populations of Populus tri-chocarpa: the role of stomatal control in preventing xylem cavitation. TreePhysiol. 19, 453–459.
Tadrist, L., Saudreau, M., de Langre, E., 2014. Wind and gravity mechanical effects onleaf inclination angles. J. Theor. Biol. 341, 9–16.
Tuzet, A., Perrier, A., 2008. Modeling the dynamics of water flow through plants,role of capacitance in stomatal conductance, and plant water relations. In:Response of Crops to Limited Water: Understanding and Modeling Water StressEffects on Plant Growth Processes. American Society of Agronomy, Madison,Wisconsin, United States, pp. 145–164 (Chapter 5).
Tuzet, A., Perrier, A., Leuning, R., 2003. A coupled model of stomatal conductance,photosynthesis and transpiration. Plant Cell Environ. 26, 1097–1116.
Wei, C., Steudle, E., Tyree, M.T., Lintilhac, P.M., 2001. The essentials of direct xylempressure measurement. Plant Cell Environ. 24, 549–555.
Wu, Q.-L., Cournède, P.-H., Mathieu, A., 2012. An efficient computational method forglobal sensitivity analysis and its application to tree growth modelling. Reliab.Eng. Syst. Saf. 107, 35–43.
Zhang, Y.-L., Zhang, H.-Z., Du, M.-W., Li, W., Luo, H.-H., Chow, W.-S., Zhang, W.-F.,2010. Leaf wilting movement can protect water-stressed cotton (Gossypiumhirsutum L.) plants against photoinhibition of photosynthesis and maintaincarbon assimilation in the field. J. Plant Biol. 53, 52–60.