journal of weather modification - volume 45 · 26 journal of weather modification volume 47 ~...
TRANSCRIPT

JOURNAL OF WEATHER MODIFICATION26 VOLUME 47
~ SCIENTIFIC PAPERS ~
A CASE STUDY OF CLOUD SEEDING TO REDUCE HAIL DAMAGE
Andrew DetwilerDepartment of Physics, and Atmospheric and Environmental Sciences Program
South Dakota School of Mines and TechnologyRapid City, S.D.
ABSTRACT: A large tornadic, hail-producing, supercellular thunderstorm developed in northwest Kansas on the afternoon of 29 June 2000. This storm was observed by a net-work of polarimetric radars that were being used for research by the Severe Thunderstorm Electrification and Precipitation Study (STEPS). The storm of interest was seeded by the Western Kansas Weather Modification Program (WKWMP) for more than two hours as it transitioned from multicellular to supercellular mode, produced an EF-2 tornado and copious amounts of hail (with diameters up to 4.5 cm) for over one and one-half hours. Published studies based on the research radars’ observations provide a time history of this storm’s hail production in terms of volume containing hail, graupel, and other precipitation types, as well as volume containing significant updraft. Using these analyses, it is shown that the storm invigorated, and the volume of the storm containing hail increased dramati-cally shortly after seeding began. It is not known how the storm would have developed, or the size and quantity of the hail that would have been produced, had it not been seeded. It is suggested that a large sample of similar supercellular storms, both seeded and unseeded, be analyzed by polarimetric radar-based techniques in order to better understand the impact of seeding on hail development. Such analysis could be done inexpensively using National Weather Service (NWS) radar data.
1. INTRODUCTION
Beginning in the late 1940’s, among the earli-est applications of cloud seeding with glacio-genic agents was seeding to mitigate hail damage (Byers, 1974). Conceptual models for hail dam-age mitigation by cloud seeding, and the cloud seeding techniques themselves, have evolved over the last half-century, but still basically in-volve dispersing glaciogenic materials into either the bases or tops of feeder clouds in newly de-veloping portions of a storm complex with hopes of modifying storm evolution in such a way that less damaging hail develops. In the northern High Plains region of the United States, statistical stud-ies have compared hail damage in areas in which aircraft seeding was conducted, to hail damage in neighboring areas that were not seeded (Miller et al. 1975, Smith et al. 1997). These studies sug-gest that on a seasonal basis there can be roughly
45% lower monetary losses due to hail damage to crops in seeded areas, compared to unseeded ar-eas, using seeding strategies implemented in the 1970’s and later in these regions.
Hail production by storms is highly variable. Some of this variability and complexity is reviewed in Foote (1985). He classifies a broad spectrum of storm types according to both dynamic and mi-crophysical processes thought to be critical to hail production. One storm may produce copious amounts of hail damage while another storm in the same region, similar in character according to available visual and radar observations, may produce much less hail damage. The heaviest hail fall is typically restricted to narrow swaths less than a mile wide and perhaps several miles long. Some swaths may cross populated areas and cause highly visible damage, while similar ones may cross areas where there are fewer ob-

DETWILERAPRIL 2015 27
~ SCIENTIFIC PAPERS ~
servers, structures, or vegetation susceptible to damage. Observations sufficient to quantify hail production by a large population of storms are not routinely available. Crop insurance records are very difficult to obtain for use in studies like those conducted by Miller et al. (1975) and Smith et al. (1997) as insurance companies regard them as proprietary information.
The addition of polarimetric capability to the National Weather Service (NWS) WSR 88-D weather radar network in the United States, along with advances in the use of polarimetric radar to map regions in storms where hail exists, presents the opportunity to use routine radar observations to do analyses of hail production in storms over the United States that only a decade ago required specialized research radars. In principle, a large number of storms can be analyzed efficiently using archived polarimetric WSR 88-D data, in-cluding output from standard hydrometeor identi-fication algorithms (Straka et al. 2000, Park et al. 2009), and other radar-based parameters or com-binations of parameters correlated with hail pres-ence and size. Using these quantities the charac-teristics of hail in storms that were seeded can be compared in a quantitative manner to those in similar storms in the same region in a similar me-teorological setting that were not seeded.
We present below polarimetric radar-based ob-servations of hail in a large supercellular thunder-storm that was seeded using silver iodide (AgI) smoke generators and dry ice pellets by five air-craft during the Western Kansas Weather Modifi-cation Program (WKWMP). This storm occurred in northwestern Kansas on June 29, 2000. It was observed by an extensive array of observing sys-tems assembled for the Severe Thunderstorm Electrification and Precipitation Study (STEPS)(Lang et al., 2004). The primary goal of the WK-WMP is to decrease hail damage using cloud seeding with glaciogenic agents. These opera-tions are based on the hypothesis that such seed-
ing reduces damaging hail via the beneficial com-petition process (Smith and Beer, 2000). Analysis of polarimetric radar observations will show that the storm intensified and hail production rapidly increased after seeding operations began. From the analysis it is not possible to confidently at-tribute the increase in hail production to seeding or to one or several other influences on the storm, such as changing near-storm environment, inter-action with outflows from neighboring storms, etc. However, analyses like this one on a popula-tion of seeded and unseeded storms will be useful for a more thorough study of the effects of glacio-genic seeding on hail production by supercellular thunderstorms.
2. OBSERVATIONS
2.1 Western Kansas Weather Modification Program
The WKWMP began operations in 1975 and has covered various areas of western Kansas up to the present. In 2000 there were two operational areas, one served by a radar and several aircraft based in Colby (northwest Kansas), and the other by sev-eral aircraft in Lakin and other airports in west central Kansas, supported by a radar in Lakin (see Figure 1). When large storms having long dura-tions were present, such as the storms observed on this day, aircraft based at several different airports could be deployed on the same storm or storm complex. A project meteorologist at the ra-dar in Colby helped direct pilots toward bases of updrafts in flanking cells where they ignited their AgI generators and pyrotechnic flares at altitudes from 5-8,000 ft. MSL. One twin-engine aircraft was available to drop dry ice pellets into rising flanking convective turrets from 16-18,000 ft. MSL. Flight tracks and seeding equipment opera-tion statistics are compiled for each flight, along with a record of waypoints associated with each seeding run.

JOURNAL OF WEATHER MODIFICATION28 VOLUME 47
~ SCIENTIFIC PAPERS ~
2.2 Severe Thunderstorm Electricity and Precipitation Study
STEPS operations are discussed in Lang et al. (2004). A network consisting of three 10-cm-wavelength Doppler radars, two of them polari-metric, was used to observe storms propagating through northeastern Colorado and northwestern Kansas. These included the CSU-CHILL po-larimetric Doppler research radar operated by Colorado State University, the Spol polarimet-ric Doppler radar operated by the National Cen-ter for Atmospheric Research (NCAR), and the WSR-88D operational Doppler radar at the site of the Goodland NWS offi ce. A mobile mesonet of automobile-borne instrumentation, a mobile
Figure 1: A reproduction from Smith and Beer (2000) showing the operational areas for the WKWMP in 2000.
In 2000, the WKWMP used a variety of airborne glaciogenic seeding systems (Smith and Beers, 2000). Carly-type wing-tip generators were used to burn an acetone solution containing 2% AgI along with unspecifi ed amounts of NaI and C6H4Cl2 (paradichlorobenzene). The rate at which the solution was burned produced 2.8 g/min AgI complexed with NaCl . They also employed burn-in-place 120 g pyrotechnic fl ares that released AgI aerosol when ignited while held in under-wing racks. Some fl ares were manufactured by Weather Modifi cation Group, Inc. (near Calgary, AB, Canada) and others by Concho Cartridge (San Angelo, TX). The twin-engine cloud-top seeder had a system for dispersing dry ice pellets at the rate of 5 lbs/min (2.3 kg/min).

DETWILERAPRIL 2015 29
~ SCIENTIFIC PAPERS ~
1977, for discussions of characteristics of super-cellular storms.) A weaker left-moving cell split away from the main cell at this time. The main cell maintained a quasi-steady reflectivity struc-ture for several hours during the remainder of its lifetime. Hail reports associated with this storm came in to the Goodland NWS office through 0108 UT on 30 June. The storm still contained re-gions with radar reflectivities exceeding 60 dBZ at 0300 UT on 30 June as it moved southeastward from a position south of Colby, Kansas, after sunset. At this time it merged with an even larger storm to the northeast that was moving southward and the combined storm evolved into a mesoscale convective system (MCS) that propagated south-eastward across Kansas overnight, developing a distinct bow echo feature. (See Maddox, 1980, for description of mesoscale convective systems.) Wind gusts as high as 80 mph (129 km/hr.) were reported overnight associated with this MCS. The MCS finally decayed before sunrise near the southeast corner of Kansas.
A reflectivity swath diagram (see Figure 2) shows the footprint of highest radar reflectivities ob-served over a given point during the lifetime of the storm as it passed through the STEPS region. The organization into supercellular form and the turn to the right occurred at about 2325 UT. An EF-2 tornado was reported under the storm at this time. Hail to 4.5 cm diameter was observed at the surface for the next one and one-half hours. There were 31 crop insurance hail claims filed within the target seeding area on this day (Smith and Beers, 2000). In terms of hail damage, there were six other days in the northern target area in 2000 with more claims.
balloon-sounding team with rawinsondes capable of electrical as well as thermodynamic observa-tions, additional thermodynamic and wind sound-ings, and an instrumented armored aircraft also probed regions of the storms and storm environ-ment. Much of the STEPS observational record is maintained in field project archives at the NCAR Earth Observing Laboratory (See http://data.eol.ucar.edu/codiac/projs?STEPS and http://data.eol.ucar.edu/master_lists/generated/t28/dataset_list.html#category-230). The discussion below fo-cuses on radar observations.
2.3 Meteorological Setting
A large storm began to develop in northeastern Colorado in the mid-afternoon of 29 June 2000. Tessendorf et al. (2005) and Wiens et al. (2005) provide a summary of regional meteorology and overall storm evolution. The storm began as a group of several smaller cells forming along a surface boundary with support from a short-wave aloft. Initial radar echoes were noted at 2130 UT in northeast Colorado, north of Burlington and moving eastward. Surface temperatures reached 29oC with dew points near 20oC in the region at this time. The wind was veering from south near the surface to northwest aloft. Convective Avail-able Potential Energy (CAPE) in the region was estimated to be between 1500 and 2000 J/kg based on project soundings. This storm moved east-ward into Kansas and two cells began to domi-nate. Large (> 2 cm) hail was first reported on the ground at 2235 UT north of Goodland, KS. Larger hail (>4.5 cm) was first reported at the surface at 2307 UT. At 2325 UT the storm organized into a distinctly supercellular radar reflectivity structure and turned to the south southeast. (See Marwitz, 1972, Browning and Foote, 1976, and Browning,

JOURNAL OF WEATHER MODIFICATION30 VOLUME 47
~ SCIENTIFIC PAPERS ~
0
5
10
15
20
25
30
35
40
45
50
55
60
65
70
dBZ
KGLD 06/29/2000 21:30:40--01:15:03 UT
Figure 2: A Hovemuller-type diagram showing maximum reflectivity observed over any location between 2130 UT on 29 June and 0115 UT on 30 June, 2000 in the region of interest based on observations of the NWS WSR-88-D KGLD radar at Goodland, KS. State and county borders are shown, with Colorado to the west, Nebraska to the north, and most of the diagram covering northwestern Kansas. The reflectivity pat-tern indicates the movement of the storm of interest over this time period. Axes are labeled in distance from the radar. The color scale for equivalent reflectivity is indicated on the right.
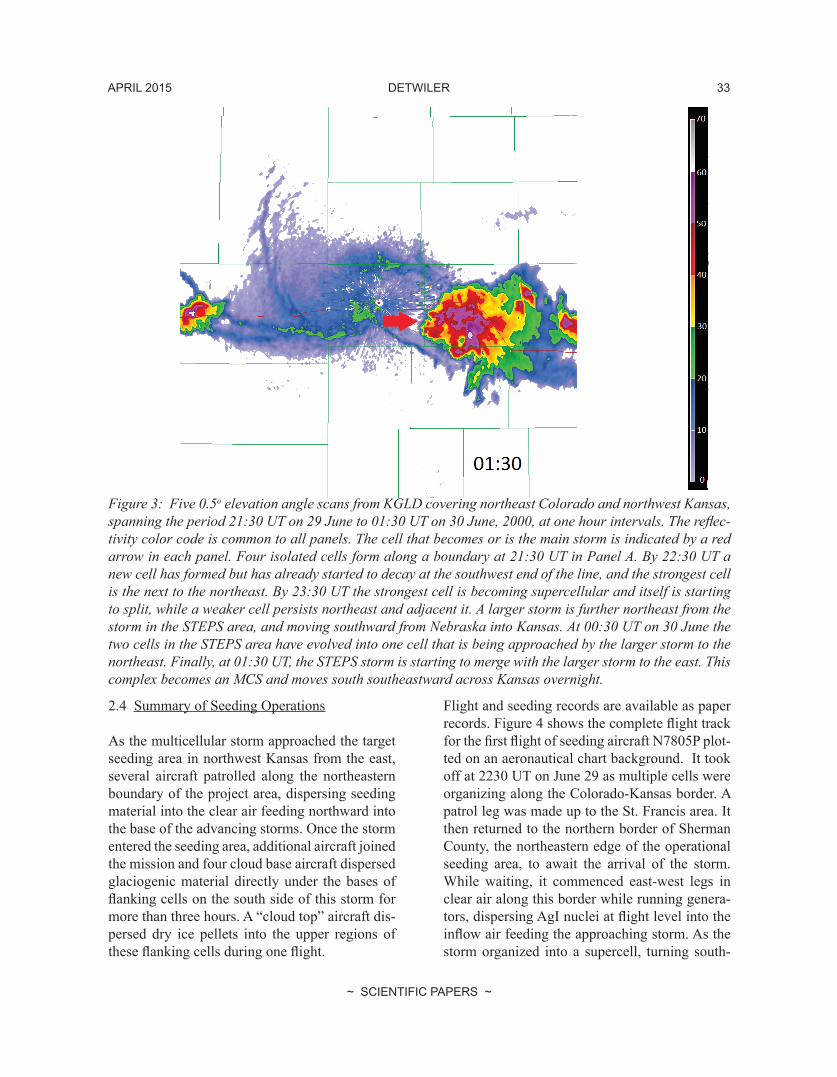
A series of radar plan-position-indicator (PPI) images in Figure 3 from the NWS WSR-88D at Goodland, KS (KGLD) depict the movement of the storm from a regional perspective. In its early development the storm had an evolving multicel-lular structure. The storm maintained a quasi-steady reflectivity structure from the time of the turn to the south southeast around 2325 UT, for
the next several hours. During this time new cells formed on the southern flank and merged into the main storm body. Following the period covered in Figure 3, the storm eventually merged with the larger storm to the east, formed an MCS, and crossed the state of Kansas overnight, as de-scribed above.

DETWILERAPRIL 2015 31
~ SCIENTIFIC PAPERS ~

JOURNAL OF WEATHER MODIFICATION32 VOLUME 47
~ SCIENTIFIC PAPERS ~
DETWILERAPRIL 2015 33
~ SCIENTIFIC PAPERS ~
Figure 3: Five 0.5o elevation angle scans from KGLD covering northeast Colorado and northwest Kansas, spanning the period 21:30 UT on 29 June to 01:30 UT on 30 June, 2000, at one hour intervals. The refl ec-tivity color code is common to all panels. The cell that becomes or is the main storm is indicated by a red arrow in each panel. Four isolated cells form along a boundary at 21:30 UT in Panel A. By 22:30 UT a new cell has formed but has already started to decay at the southwest end of the line, and the strongest cell is the next to the northeast. By 23:30 UT the strongest cell is becoming supercellular and itself is starting to split, while a weaker cell persists northeast and adjacent it. A larger storm is further northeast from the storm in the STEPS area, and moving southward from Nebraska into Kansas. At 00:30 UT on 30 June the two cells in the STEPS area have evolved into one cell that is being approached by the larger storm to the northeast. Finally, at 01:30 UT, the STEPS storm is starting to merge with the larger storm to the east. This complex becomes an MCS and moves south southeastward across Kansas overnight.
2.4 Summary of Seeding Operations
As the multicellular storm approached the target seeding area in northwest Kansas from the east, several aircraft patrolled along the northeastern boundary of the project area, dispersing seeding material into the clear air feeding northward into the base of the advancing storms. Once the storm entered the seeding area, additional aircraft joined the mission and four cloud base aircraft dispersed glaciogenic material directly under the bases of fl anking cells on the south side of this storm for more than three hours. A “cloud top” aircraft dis-persed dry ice pellets into the upper regions of these fl anking cells during one fl ight.
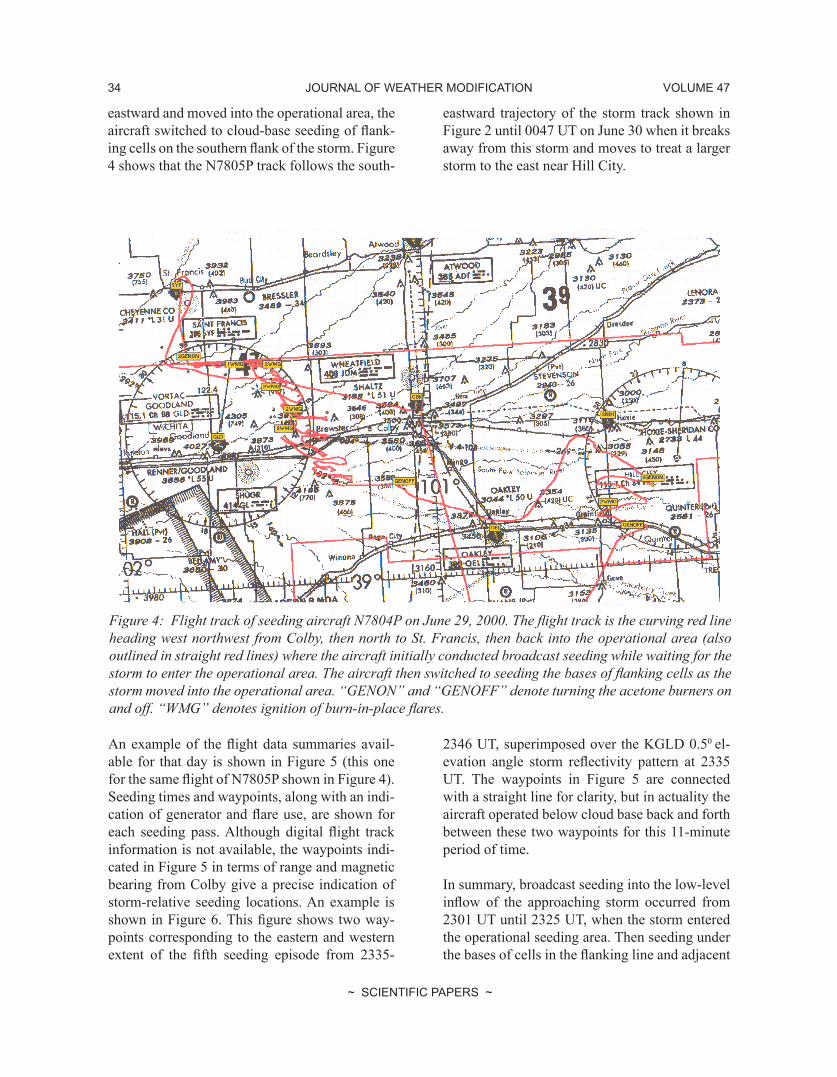
Flight and seeding records are available as paper records. Figure 4 shows the complete fl ight track for the fi rst fl ight of seeding aircraft N7805P plot-ted on an aeronautical chart background. It took off at 2230 UT on June 29 as multiple cells were organizing along the Colorado-Kansas border. A patrol leg was made up to the St. Francis area. It then returned to the northern border of Sherman County, the northeastern edge of the operational seeding area, to await the arrival of the storm. While waiting, it commenced east-west legs in clear air along this border while running genera-tors, dispersing AgI nuclei at fl ight level into the infl ow air feeding the approaching storm. As the storm organized into a supercell, turning south-
JOURNAL OF WEATHER MODIFICATION34 VOLUME 47
~ SCIENTIFIC PAPERS ~
Figure 4: Flight track of seeding aircraft N7804P on June 29, 2000. The flight track is the curving red line heading west northwest from Colby, then north to St. Francis, then back into the operational area (also outlined in straight red lines) where the aircraft initially conducted broadcast seeding while waiting for the storm to enter the operational area. The aircraft then switched to seeding the bases of flanking cells as the storm moved into the operational area. “GENON” and “GENOFF” denote turning the acetone burners on and off. “WMG” denotes ignition of burn-in-place flares.
eastward and moved into the operational area, the aircraft switched to cloud-base seeding of flank-ing cells on the southern flank of the storm. Figure 4 shows that the N7805P track follows the south-
eastward trajectory of the storm track shown in Figure 2 until 0047 UT on June 30 when it breaks away from this storm and moves to treat a larger storm to the east near Hill City.
An example of the flight data summaries avail-able for that day is shown in Figure 5 (this one for the same flight of N7805P shown in Figure 4). Seeding times and waypoints, along with an indi-cation of generator and flare use, are shown for each seeding pass. Although digital flight track information is not available, the waypoints indi-cated in Figure 5 in terms of range and magnetic bearing from Colby give a precise indication of storm-relative seeding locations. An example is shown in Figure 6. This figure shows two way-points corresponding to the eastern and western extent of the fifth seeding episode from 2335-
2346 UT, superimposed over the KGLD 0.50 el-evation angle storm reflectivity pattern at 2335 UT. The waypoints in Figure 5 are connected with a straight line for clarity, but in actuality the aircraft operated below cloud base back and forth between these two waypoints for this 11-minute period of time.
In summary, broadcast seeding into the low-level inflow of the approaching storm occurred from 2301 UT until 2325 UT, when the storm entered the operational seeding area. Then seeding under the bases of cells in the flanking line and adjacent

DETWILERAPRIL 2015 35
~ SCIENTIFIC PAPERS ~
Figure 5: Flight summary for the first flight of N7805P on June 29, 2000. Times are in Central Daylight Time. This graph was reproduced for a clearer copy.
for the entire treatment of this storm. In addi-tion, 50.8 kg of dry ice pellets were dropped into tops of flanking cells between 2352 and 0045 UT. Waypoints for all aircraft were overlaid on low-level KGLD PPI’s, in the format of Figure 6. These plots (not shown) confirm that cloud base and cloud top seeding operations were focused on the flanking/feeder cells, as specified by the beneficial competition hypothesis and WKWMP operational procedures.
We now consider hail production by this storm.
AIRCRAFT: PROJ. FLIGHT# 38 SEEDING FLIGHT # 15
ENGINE START: ENGINE STOP: 2106 TIME: 3.7 HOURSYEAR: MONTH: JUNE DAY: 29
HAIL RAIN COMB. OBS. PILOT(S):Note: All times use the 24-hour Clock (CDT) X X LaFontaine / Rogers
ALT. VERT.
START STOP TOTAL 40 gm (KFT) TEMP VELOC.(CDT) (CDT) (MIN) (deg. / n.m.) 2.8 Gen Mins (grams) WMG-1 RS-3 RS-3 MSL ( C ) (ft/min) Hail Rain
X 1741 1741 0 275 / 25 0 0 0.0 5.0 28 0 Iced Out, No Bases, Rain shaft North of
X 1751 1751 0 290 / 37 0 0 0.0 8.5 17 900 St. Frances, Bases at 9.5
0 X 1801 1807 6 275 / 34 2 12 33.6 8.5 17 900 X Broadcast seeding
1 X 1807 1812 5 280 / 24 2 10 28.0 5.5 24 0 X
2 X 1812 1819 7 275 / 34 2 14 39.2 5.5 24 0 X
3 X 1819 1830 11 283 / 22 2 22 61.6 5.5 24 0 X
4 X 1830 1832 2 281 / 22 2 4 11.2 5.5 24 0 X
5 X 1832 1835 3 278 / 25 2 6 16.8 1 5.5 24 0 X Funnel cloud
6 X 1835 1846 11 279 / 25 2 22 61.6 2 5.5 24 0 X Tornado
7 X 1846 1853 7 276 / 21 2 14 39.2 2 5.5 24 1200+ X Tornado disapated
8 X 1853 1859 6 270 / 21 2 12 33.6 9.5 15 1500 X Lowered base, Rain shaft
9 X 1859 1907 8 265 / 20 2 16 44.8 9.5 15 1500 X Big Scud Low and Fast moving/dvfping
10 X 1907 1924 17 259 / 19 2 34 95.2 2 8.5 20 1000 X
11 X 1924 1935 11 251 / 21 2 22 61.6 2 8.5 20 1000 X
12 X 1935 1945 10 228 / 16 2 20 56.0 8.5 20 1200 X
13 X 1945 1947 2 204 / 13 2 4 11.2 8.5 20 1200 X
X 1947 1947 0 185 / 12 0 0 0.0 8.5 20 1200 X
X 2002 2010 8 098 / 24 2 16 44.8 5.5 20 1000 X Shelf
X 2010 2017 7 105 / 38 2 14 39.2 2 5.5 20 1000 X
X 2017 2025 8 109 / 29 2 16 44.8 5.5 20 1000 X
X 2025 2032 7 115 / 32 1 7 19.6 5.5 20 1000 X Left Generator empty
X 2032 2032 0 117 / 37 0 0 0.0 5.5 20 1000 Right Generator empty
0000 0 / 0 0.0
Total Generator Time: 265 Minutes
Seeding Output: 742.0 grams Agl
Seeding Period: 136 Minutes NOTE: This is the total time of seeding: if breaks occur, you must add times of all seeding periods to obtain a total.
Total No. Flares Burned: 11 Flares
WMG-1 11 Flares NOTE: When seeding with WMG-1 or RS-3 flares (only) use a stop time as 6 minutes after the start time.
Concho RS-3/120 0 Flares Page 1 of 1 Pages
Concho RS-3/40 0 Flares
SEEDING
PURPOSE REMARKS
1725
N7805P
2000
FLIGHT SUMMARY*WESTERN KANSAS WEATHER MODIFICATION PROGRAM
(Agl in Acetone Solution, Pyrotechnics)
FLARES120 gm
Type of Flight(Check only 1)
Colby (CBK)
Position From No. of Wing Gens
& Seeding Rate (g/min)ISOLD LINE
CLOUD TYPE SEEDING TIME
to the main body of the storm occurred from 2325 UT June 29 – 0130 UT June 30. Dispersal of dry ice into tops of flanking cells was conducted from 2352 UT June29 – 0045 UT June 30. The seed-ing operations were conducted aggressively with five aircraft in an attempt to modify precipita-tion evolution in feeder cells and the main storm into which these cells merged. Smith and Beers (2000) report that there were 21 flight hours of seeding. There were 3068 grams of AgI dispersed into the storm by wing-tip generators, and 4560 grams dispersed by burning flares between 2300 UT on the 29th and 0200 UT on the 30th. Figure 7 displays to AgI released in half-hour intervals

JOURNAL OF WEATHER MODIFICATION36 VOLUME 47
~ SCIENTIFIC PAPERS ~
Figure 6: A portion of the 0.5o elevation angle scan of KGLD showing waypoints at the ends of the fifth seeding flight segment of aircraft N7805P from 2335 – 2346 UT on June 29, 2000. The two waypoints are connected by a straight red line. Storm-relative low-level inflow is from the south.
Figure 7: Histogram display of half-hourly amounts of AgI dispersed by WKWMP seeding aircraft into the storm of interest in this study. The vertical dotted line indicates the time the storm turned to the right and became supercellular. Starting with 00 UT on June 30 hours have 24 added to them.

DETWILERAPRIL 2015 37
~ SCIENTIFIC PAPERS ~
2.5 Polarimetric Radar Mapping of Hail
Tessendorf et al. (2005) and Wiens et al. (2005) used polarimetric and Doppler radar observa-tions from the three STEPS radars to analyze the evolution of circulations, reflectivity patterns, and hydrometeor type spatial distribution in this storm. In order to do so, they interpolated radar observations to a Cartesian grid with 0.5 km unit cell size.
Figure 8, based on data extracted from Figure 5 in Wiens et al. (2005) shows the total volume oc-cupied by the storm, represented as the volume occupied by radar reflectivity greater than 0 dBZ, and the volume within the storm containing hail. Hail was identified using a fuzzy-logic-based hy-drometeor identification scheme adapted from Liu and Chandrasekar (2000) and Straka et al. (2000). See Tessendorf et al. (2005) for details. There is a dramatic increase in both storm and hail volumes beginning near 2325 UT when the
storm intensified, organized into a supercell, pro-duced a tornado, and turned rightward. This also was the time when 30 minutes of broadcast seed-ing by two aircraft ended, and three additional aircraft joined the operation to conduct coordi-nated cloud base and cloud top seeding of flank-ing cells over the next two hours. Tessendorf et al. (2005), in their Figures 13 and 14, show that prior to 2325 UT hail was found in these storms predominantly near cloud base. They also show that storm updrafts during the subsequent rapid intensification phase increased dramatically with peak magnitudes reached at altitudes above 9 km MSL. By 2345 UT, 15 minutes after cloud base seeding began and this intensification and reorga-nization occurred, much larger volumes contain-ing hail were observed. Hail was identified in the storm as high as 10 km MSL. After 0000 UT hail was found distributed through the entire vertical extent of the storm, but occupying decreasing volumes at each level as time progressed.
Figure 8: Volume in units of 103 km3 of regions of storm with Z > 0 dBZ (solid line with + symbols) and containing small or large hail as identified using a polarimetric radar hydrometeor identification algorithm (dashed line with triangle symbols). To better discern trends, hail volume is multiplied by 10x. Data have been re-plotted based on analysis of Figure 5 in Wiens et al. (2005). Glaciogenic seeding began at 2301 UT. Starting with 00 UT on June 30 hours have 24 added to them.
JOURNAL OF WEATHER MODIFICATION38 VOLUME 47
~ SCIENTIFIC PAPERS ~
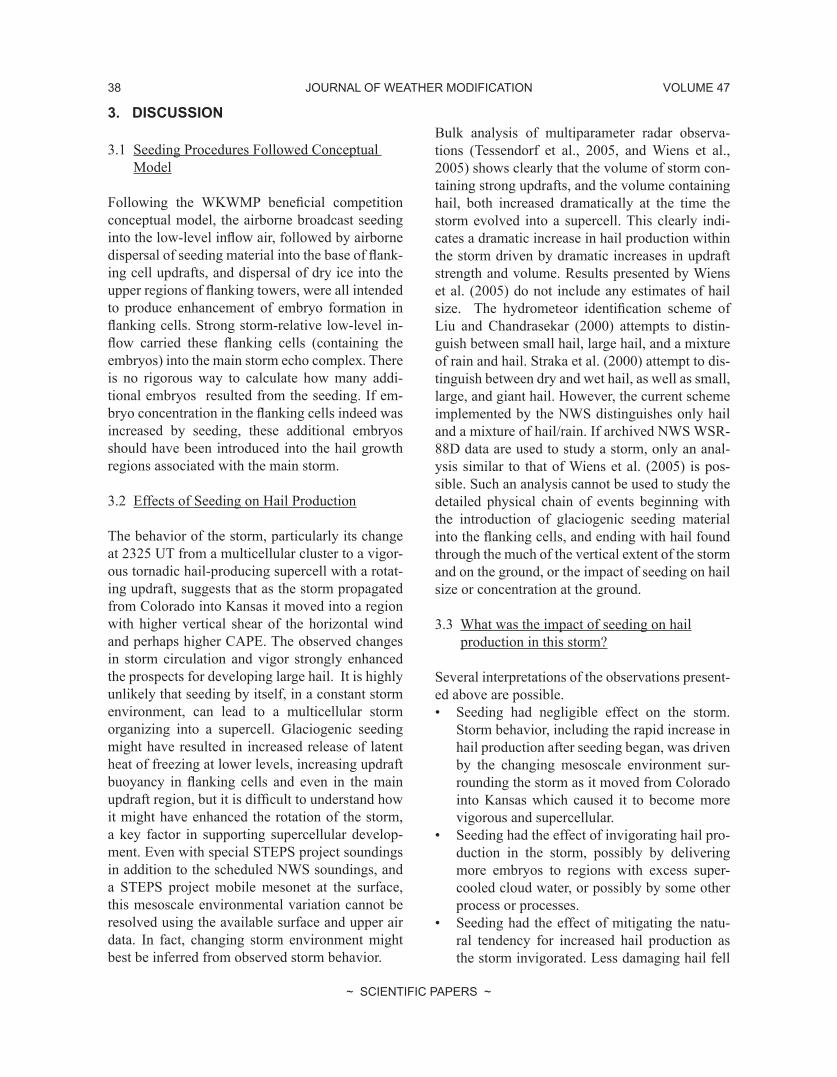
3. DISCUSSION
3.1 Seeding Procedures Followed Conceptual Model
Following the WKWMP beneficial competition conceptual model, the airborne broadcast seeding into the low-level inflow air, followed by airborne dispersal of seeding material into the base of flank-ing cell updrafts, and dispersal of dry ice into the upper regions of flanking towers, were all intended to produce enhancement of embryo formation in flanking cells. Strong storm-relative low-level in-flow carried these flanking cells (containing the embryos) into the main storm echo complex. There is no rigorous way to calculate how many addi-tional embryos resulted from the seeding. If em-bryo concentration in the flanking cells indeed was increased by seeding, these additional embryos should have been introduced into the hail growth regions associated with the main storm.
3.2 Effects of Seeding on Hail Production
The behavior of the storm, particularly its change at 2325 UT from a multicellular cluster to a vigor-ous tornadic hail-producing supercell with a rotat-ing updraft, suggests that as the storm propagated from Colorado into Kansas it moved into a region with higher vertical shear of the horizontal wind and perhaps higher CAPE. The observed changes in storm circulation and vigor strongly enhanced the prospects for developing large hail. It is highly unlikely that seeding by itself, in a constant storm environment, can lead to a multicellular storm organizing into a supercell. Glaciogenic seeding might have resulted in increased release of latent heat of freezing at lower levels, increasing updraft buoyancy in flanking cells and even in the main updraft region, but it is difficult to understand how it might have enhanced the rotation of the storm, a key factor in supporting supercellular develop-ment. Even with special STEPS project soundings in addition to the scheduled NWS soundings, and a STEPS project mobile mesonet at the surface, this mesoscale environmental variation cannot be resolved using the available surface and upper air data. In fact, changing storm environment might best be inferred from observed storm behavior.
Bulk analysis of multiparameter radar observa-tions (Tessendorf et al., 2005, and Wiens et al., 2005) shows clearly that the volume of storm con-taining strong updrafts, and the volume containing hail, both increased dramatically at the time the storm evolved into a supercell. This clearly indi-cates a dramatic increase in hail production within the storm driven by dramatic increases in updraft strength and volume. Results presented by Wiens et al. (2005) do not include any estimates of hail size. The hydrometeor identification scheme of Liu and Chandrasekar (2000) attempts to distin-guish between small hail, large hail, and a mixture of rain and hail. Straka et al. (2000) attempt to dis-tinguish between dry and wet hail, as well as small, large, and giant hail. However, the current scheme implemented by the NWS distinguishes only hail and a mixture of hail/rain. If archived NWS WSR-88D data are used to study a storm, only an anal-ysis similar to that of Wiens et al. (2005) is pos-sible. Such an analysis cannot be used to study the detailed physical chain of events beginning with the introduction of glaciogenic seeding material into the flanking cells, and ending with hail found through the much of the vertical extent of the storm and on the ground, or the impact of seeding on hail size or concentration at the ground.
3.3 What was the impact of seeding on hail production in this storm?
Several interpretations of the observations present-ed above are possible. • Seeding had negligible effect on the storm.
Storm behavior, including the rapid increase in hail production after seeding began, was driven by the changing mesoscale environment sur-rounding the storm as it moved from Colorado into Kansas which caused it to become more vigorous and supercellular.
• Seeding had the effect of invigorating hail pro-duction in the storm, possibly by delivering more embryos to regions with excess super-cooled cloud water, or possibly by some other process or processes.
• Seeding had the effect of mitigating the natu-ral tendency for increased hail production as the storm invigorated. Less damaging hail fell
DETWILERAPRIL 2015 39
~ SCIENTIFIC PAPERS ~
from the storm than would have fallen if there had been no seeding. If there had been no seeding there would have been more and/or larger hail from this storm, and more hail in-surance claims.
It is difficult to establish one interpretation as clearly superior to the others, based only on ob-servations of this one storm and generally under-stood aspects of storm behavior. If one had obser-vations like these from a large sample of similar storms, some seeded, and some not, it might be possible to distinguish whether seeding (on aver-age) has significant influence on hail production from storms similar to this one. With the network of operational WSR-88D polarimetric Dop-pler radars, analyses much like those conducted by Tessendorf, Wiens, and colleagues, could be implemented in regions where weather modifi-cation operations are conducted. A large data set could be compiled from freely available opera-tional data. Polarimetric radar observations could be used to compute time series of volumes of storms containing hail, graupel, etc. for a popula-tion of storms, some seeded, some not. Statistics on these quantities could be compiled for a large number of storms as part of hail suppression op-erational programs. Statistical tests for significant differences in hail volumes between seeded and unseeded storms could be performed using these data. With a large enough population of cases, the effects of factors other than seeding will average out, and it may be possible to isolate an effect due to seeding.
Work by Liu and Chandrasekar (2000) and Straka et al. (2000) suggests that finer discrimination be-tween hail sizes and distinction between wet/dry hail is possible with polarimetric radar data. Area covered by radar indication of hail in the base scan, and time of coverage, also may be explored as a perhaps more relevant metric for comparing hail production between storms.
It is unfortunate that one of the longest running hail suppression programs in the United States, the North Dakota Cloud Modification Project (NDCMP), is conducted in an area with poor ra-dar coverage by the operational WSR-88D net-
work. Texas, where the only other long-running hail suppression operations in the United States are conducted, has better coverage. Operational polarimetric radar data is not available near Cal-gary where the Alberta Hail Suppression Project is conducted.
The number of cases needed to statistically verify a hail reduction due to seeding depends on the magnitude of the reduction. This number was estimated for the National Hail Research Experi-ment (NHRE), conducted in northeastern Colo-rado in the early to mid-1970’s, by Foote and Knight (1979). The NHRE was designed based on preliminary statistical studies suggesting that a randomized experiment with 75 cases could verify a 40% reduction in a metric of hail damage at the 5% significance level. In the northeastern Colorado area where this experiment was con-ducted, it was estimated that five years would be needed to accumulate a sample of this size. In an operational program covering a similar area, one might assume that a storm sample of roughly 75 cases containing roughly equal numbers of seeded and unseeded storms would be required to show a reduction of this magnitude in some mea-sure of hail on the ground. In most project areas in North America (e.g. Alberta, North Dakota, and Texas), it could take from 5 to 10 years to acquire a sufficient sample of storm observations with good radar coverage. If unseeded storms forming in similar mesoscale meteorological en-vironments outside of the project area can be used to compare to seeded storms in the project area, a smaller number of years might be required to obtain a sufficiently large sample. Further study is needed to verify which meteorological param-eters are the best ones to be used to define “simi-lar” environments. A good starting set would be the environmental parameters used by convective weather forecasters to determine the likelihood of hail, such as CAPE, shear, helicity, cloud-base height, wet-bulb zero, etc.
Another consideration is that not all storms will be “perfectly” seeded. Due to logistical and now-casting limitations, seeding is likely to be more effective in some cases than in others at introduc-ing seeding material into the desired locations in

JOURNAL OF WEATHER MODIFICATION40 VOLUME 47
~ SCIENTIFIC PAPERS ~
flanking cells. This variability in operational ef-fectiveness could further extend the time needed to resolve a seeding effect.
4. CONCLUSIONS
• Due to the chaotic dynamical nature of large convective storms, with many physical pro-cesses interacting in non-linear ways, one cannot draw firm conclusions about the over-all effects of cloud seeding on hail production from just one case. A large number of cases, both seeded and unseeded, need to be studied and results analyzed.
• Polarimetric radar data can provide quantita-tive information on hail occurrence in storms. The volume of a storm containing hail is one metric. An example of one analysis based on this metric is taken from the work of Tessen-dorf et al. (2005) and Wiens et al. (2005), in which the bulk storm volumes containing hail, and other radar-derived storm characteristics over the storm’s lifetime, are analyzed to characterize storm hail production in a seeded thunderstorm. Other metrics may prove more useful and should be investigated.
• Once an analysis procedure is established, it will be possible to analyze development of hail in a large number of storms inexpensive-ly using operational polarimetric radar data and automated computational procedures. Statistical tests for differences in hail produc-tion between populations of seeded and un-seeded storms can then be conducted.
5. ACKNOWLEDGEMENTS
The author is grateful for assistance provided by Sarah Tessendorf (now at NCAR) and Kyle Wiens (now at Los Alamos National Laboratory). WKWMP operational records were provided by David Beers. Diane Coe at the Kansas Water Of-fice assisted in obtaining a copy of the 2000 WK-WMP annual report.
6. REFERENCES
Browning, K. A., 1977: The structure and mecha-nisms of hailstorms. Hail: A Review of Hail Sci-ence and Hail Suppression. Meteor. Monographs, 16, 38, 1-43.
Browning, K. A., and G. B. Foote, 1976: Airflow and hail growth in supercell storms and some im-plications for hail suppression. Q. J. R. Meteorol. Soc., 102, 499-533.
Byers, H. R., 1974: History of Weather Modifica-tion. In Weather and Climate Modification, W. N. Hess, ed. Wiley and Sons, NY. pp.3-44.
Foote, G. B., 1985: Aspects of cumulonimbus classification relevant to the hail problem. J. Rech. Atmos., 19, 61-74.
Foote, G. B., and C. A. Knight, 1979: Results of a randomized hail suppression experiment in northeast Colorado. Part I. Design and conduct of the experiment. J. Appl. Meteor., 18, 1526-1537.
Lang, T. J., L. J. Miller, M. Weisman, S. A. Rut-ledge, L. J. Barker, V. N. Bringi, V. Chandrasekar, A. Detwiler, N. Doesken, J. Helsdon, C. Knight, P. Krehbiel, W. A. Lyons, D. MacGorman, E. Ras-mussen, W. Rison, W. D. Rust, and R. J. Thomas. 2004. The Severe Thunderstorm Electrification and Precipitation Study. Bulletin of the American Meteorological Society, 85:1107-+.
Liu, H., and V. Chandrasekar, 2000: Classifica-tion of hydrometeors based on polarimetric radar measurements: Development of fuzzy logic and neuro-fuzzy systems and in situ verification. J. Atmos. Ocean. Technol., 17, 140-164.
Maddox, R. A., 1980: Mesoscale convective complexes. Bull. Amer. Meteor. Soc., 61, 1374-1387.

DETWILERAPRIL 2015 41
~ SCIENTIFIC PAPERS ~
Marwitz, J. D., 1972: The structure and motion of severe hailstorms, Part I: Supercell storms. J. Appl. Meteor., 11, 166-179.
Miller, J. R., E. I. Boyd, R. A. Schleusener, and A. S. Dennis. 1975. Hail Suppression Data from Western North Dakota, 1969–1972. Journal of Applied Meteorology 14:755-762.
Park, H. S., A. V. Ryzhkov, D. S. Zrnić, and K.E. Kim. 2009. The Hydrometeor Classification Al-gorithm for the Polarimetric WSR-88D: Descrip-tion and Application to an MCS. Weather and Forecasting 24:730-748.
Smith, C.D., and D. Beer, 2000. Final Report Western Kansas Weather Modification Program 2000. 55 pp. Available from the Kansas State Water Office, 901 S. Kansas Avenue, Topeka, KS 66612. http://www.kwo.org .
Smith, P. L., L. R. Johnson, D. L. Priegnitz, B. A. Boe, and P. W. Mielke. 1997. An Exploratory Analysis of Crop Hail Insurance Data for Evi-dence of Cloud Seeding Effects in North Dakota. J.Appl. Meteor. 36:463-473.
Straka, J. M., D. S. Zrnic, and A. V. Ryzhkov. 2000. Bulk hydrometeor classification and quan-tification using polarimetric radar data: Synthesis of relations. J. Appl. Meteor. 39:1341-1372.
Tessendorf, S. A., L. J. Miller, K. C. Wiens and S. A. Rutledge, 2005: The 29 June 2000 supercell observed during STEPS. Part I: Kinematics and microphysics. J. Atmos. Sci., 62, 4127- 4150.Wiens, K. C., S. A. Rutledge and S. A. Tessend-orf, 2005: The 29 June 2000 supercell observed during STEPS. Part II: Lightning and charge structure. J. Atmos. Sci., 62, 4151- 4177.