journal replication foci dynamics: replication patterns ... · the major determinant of sequential...
TRANSCRIPT

Replication foci dynamics: replication patternsare modulated by S-phase checkpoint kinasesin fission yeast
Peter Meister1,2, Angela Taddei1,3,Aaron Ponti1, Giuseppe Baldacci2,4
and Susan M Gasser1,4,*1Friedrich Miescher Institute for Biomedical Research, Basel,Switzerland, 2UMR2027, CNRS/Institut Curie, Batiment 110, CentreUniversitaire, Orsay Cedex, France and 3UMR218, CNRS/Institut Curie,26 rue d’Ulm, Paris, France
Although the molecular enzymology of DNA replication
is well characterised, how and why it occurs in discrete
nuclear foci is unclear. Using fission yeast, we show that
replication takes place in a limited number of replication
foci, whose distribution changes with progression through
S phase. These sites define replication factories which
contain on average 14 replication forks. We show for the
first time that entire foci are mobile, able both to fuse and
re-segregate. These foci form distinguishable patterns dur-
ing S phase, whose succession is reproducible, defining
early-, mid- and late-S phase. In wild-type cells, this same
temporal sequence can be detected in the presence of
hydroxyurea (HU), despite the reduced rate of replication.
In cells lacking the intra-S checkpoint kinase Cds1, repli-
cation factories dismantle on HU. Intriguingly, even in the
absence of DNA damage, the replication foci in cds1 cells
assume a novel distribution that is not present in wild-type
cells, arguing that Cds1 kinase activity contributes to the
spatio-temporal organisation of replication during normal
cell growth.
The EMBO Journal (2007) 26, 1315–1326. doi:10.1038/
sj.emboj.7601538; Published online 15 February 2007
Subject Categories: cell cycle; genomic & computational
biology
Keywords: nuclear organisation; replication foci; replication
timing; S-phase checkpoint
Introduction
In animal cells, DNA replication takes place in discrete sub-
nuclear domains, called replication foci. During progression
through S phase, these foci undergo reproducible changes in
size, number and position. At the beginning of mammalian S
phase, replication occurs in numerous small foci throughout
the nucleus, whereas in cells approaching G2 phase, a limited
number of large foci are observed clustered at the nuclear
envelope or around the nucleolus (for a review, see Gilbert,
2001). These observations led to the conclusion that replica-
tion is both temporally and spatially organised in metazoan
cells.
Several attempts have been made to establish the molecu-
lar basis of replication foci (Cook, 2001). Replication foci
have been shown to contain DNA polymerases, replication
accessory factors and nascent DNA from several replication
forks; moreover they resist solubilisation by high salt or other
chaotropes (Tubo and Berezney, 1987). The average number
of replication forks per focus in cultured metazoan cells
ranges from 12 to 40, possibly reflecting variations in cell
type and culture conditions (Berezney et al, 2000; Cook,
2001). Such observations led to the notion of a replication
factory in which clustered forks are coordinately processed.
Although the functional significance of fork juxtaposition
has never been tested directly, it is thought to provide a
means to duplicate chromatin states: specific types of chro-
matin would replicate in specialised replication factories
found at temporally and spatially distinct sites (Gilbert,
2001; Taddei et al, 2004). Quality control during DNA replica-
tion is also critically important for cell division, and the
spatial juxtaposition of replisomes may help coordinate the
sensing of DNA damage, the activation of checkpoints or
even repair factor recruitment.
Improved imaging and tagging techniques have recently
shown that replication foci are conserved from metazoans
to budding yeast (Pasero et al, 1997; Lengronne et al, 2001;
Meister et al, 2005; Kitamura et al, 2006). Nonetheless, to
date, there have been no reports of temporally regulated
patterns of replication foci for a single-celled eukaryote, and
the factors that establish and modulate their patterning
remain unknown (Gilbert, 2001; Taddei et al, 2004).
The spatial appearance of replication foci is likely to be
determined by two general features of the genome: chromatin
organisation and replication timing. These in turn are thought
to either influence or result from transcription. In support of
this, a good, but not absolute, correlation of transcriptionally
active chromatin with early replication has been reported for
complex organisms such as flies (Schubeler et al, 2002),
particularly when transcriptional activity is integrated over
B180 kb (MacAlpine et al, 2004). Similarly, genome-wide
analyses in human cells showed that early replicating zones
overlap with transcriptionally active GC-rich isochors, which
span megabases (Jeon et al, 2005; reviewed in Schwaiger and
Schubeler, 2006). Not surprisingly, these large-scale correla-
tions fail when one analyses the smaller eukaryotic genomes
of budding and fission yeast. A thorough genome-wide study
of DNA replication in budding yeast revealed no global
correlation between transcriptional activity and replication
timing (Raghuraman et al, 2001). Nonetheless, the binding of
general chromatin repressors, such as the Silent Information
Regulatory complex, did suppress or delay origin firingReceived: 21 August 2006; accepted: 11 December 2006; publishedonline: 15 February 2007
*Corresponding author. Friedrich Miescher Institute for BiomedicalResearch, Maulbeerstrasse 66, 4058 Basel, Switzerland.Tel.: þ 41 61 697 7255; Fax þ 41 61 697 6862;E-mail: [email protected] authors contributed equally to this work
The EMBO Journal (2007) 26, 1315–1326 | & 2007 European Molecular Biology Organization | All Rights Reserved 0261-4189/07
www.embojournal.org
&2007 European Molecular Biology Organization The EMBO Journal VOL 26 | NO 5 | 2007
EMBO
THE
EMBOJOURNAL
THE
EMBOJOURNAL
1315

locally, for example near telomeres (Ferguson and Fangman,
1992; Stevenson and Gottschling, 1999; Zappulla et al, 2002).
In apparent contrast, centromeric heterochromatin in fission
yeast was found to replicate early, although telomeres repli-
cated late (Kim et al, 2003). Given this lack of coherence, it
appears that something other than transcriptional activity is
the major determinant of sequential initiation events.
Intra-S checkpoints are an additional mechanism impli-
cated in the regulation of origin firing. Checkpoint controls
were shown to prevent the initiation of late-firing origins and
to be help maintain the integrity of stalled replication com-
plexes under conditions of replicational stress (Santocanale
and Diffley, 1998; Dimitrova and Gilbert, 2000; Shechter and
Gautier, 2005; Feng et al, 2006). This mechanism was exten-
sively explored in budding yeast, where both the checkpoint
kinase Mec1, Rad53 and the Dbf4/Cdc7 kinase participate in
late origin control (reviewed in Duncker and Brown, 2003;
Raveendranathan et al, 2006). Moreover, in a rad53 mutant,
late origins were reported to fire earlier than in wild-type
cells, even during an unperturbed S phase (Shirahige et al,
1998), although this was a contested result.
In this study, we show that DNA replication factories are
present in the unicellular eukaryote Schizosaccharomyces
pombe. These replication factories display reproducible
spatial and temporal patterns throughout S phase, showing
specific localisation relative to the nucleolus and the nuclear
periphery. Detailed analysis of the dynamics of replication
factories indicated that the succession of patterns arises
mainly from the de novo appearance and disappearance of
foci, although foci are highly mobile and able to both fuse
and split. We find that replication focal patterns progress
even in the presence of hydroxyurea (HU), reflecting a
systematic, yet very slow succession of origin firing events.
However, this was not observed in the intra-S checkpoint
mutant cds1, in which replication factories rapidly dismantle
in the presence of HU. Surprisingly, we found that even in an
unperturbed S phase the pattern of replication foci formation
was altered in cells lacking the intra-S checkpoint kinase
Cds1. Our data, thus, argue that intra-S checkpoint kinases
participate in the regulation of origin firing, contributing to
defined temporal patterns of replication.
Results
A system to study the organisation of replication in
living fission yeast
To analyse the spatial organisation of DNA replication in
living fission yeast, we generated a strain expressing the well-
characterised replication marker PCNA fused to GFP. The
tagged PCNA protein was expressed from endogenous PCNA
promoter and integrated at the ura4 locus on chromosome III.
The fusion protein was present at about 70% (76%) of the
untagged endogenous PCNA level (Figure 1A, lane 4), and
had no effect on cell growth or resistance to genotoxic
treatment (UV, gamma irradiation, HU or MMS; data not
shown). Such strains appeared indistinguishable from wild-
type strains. On the other hand, when we disrupted the wild-
type pcn1 gene in the EGFP-PCNA expressing haploids, we
observed an increased sensitivity to UV irradiation, even
though the growth rates and DNA damage checkpoints
were normal, and cells were not hypersensitive to HU,
MMS or g irradiation (data not shown). We conclude that
EGFP-PCNA efficiently complements PCNA for replicative
functions, yet it may hinder repair of UV-induced lesions
when expressed alone. For this reason, only haploids expres-
sing both the endogenous and the fused proteins were used
in the experiments described below.
As wild-type PCNA is found as a homotrimeric complex
that can slide along DNA duplexes, we next confirmed that
the fusion protein was able to trimerise. In vitro cross-linking
experiments were previously used to demonstrate that re-
combinant PCNA purified from Escherichia coli is able to
form trimers (Piard et al, 1998). We used the same procedure
to test PCNA oligomerisation into dimeric and trimeric com-
plexes in the soluble fraction of wild-type S. pombe protein
extracts (Figure 1A, lanes 2 and 3). In cells expressing both
EGFP-PCNA and endogenous PCNA, EGS-crosslinking pro-
duced seven bands with molecular weights corresponding to
all possible dimeric and trimeric complexes (Figure 1A, lanes
5 and 6). Finally, we used an in situ chromatin binding assay
(Kearsey et al, 2000), in which GFP-tagged unfixed spher-
oplasts are washed with a non-ionic detergent and visualised
by fluorescence microscopy: tightly bound chromatin pro-
teins are retained, whereas soluble proteins are washed away.
In this experiment, the bulk of EGFP-PCNA, like PCNA, was
chromatin-bound exclusively during S phase (Supplementary
Figure 1). Together, these results argue that in the presence of
endogenous PCNA, EGFP-PCNA behaved like the wild-type
protein, rendering it a useful marker for replication in living
cells.
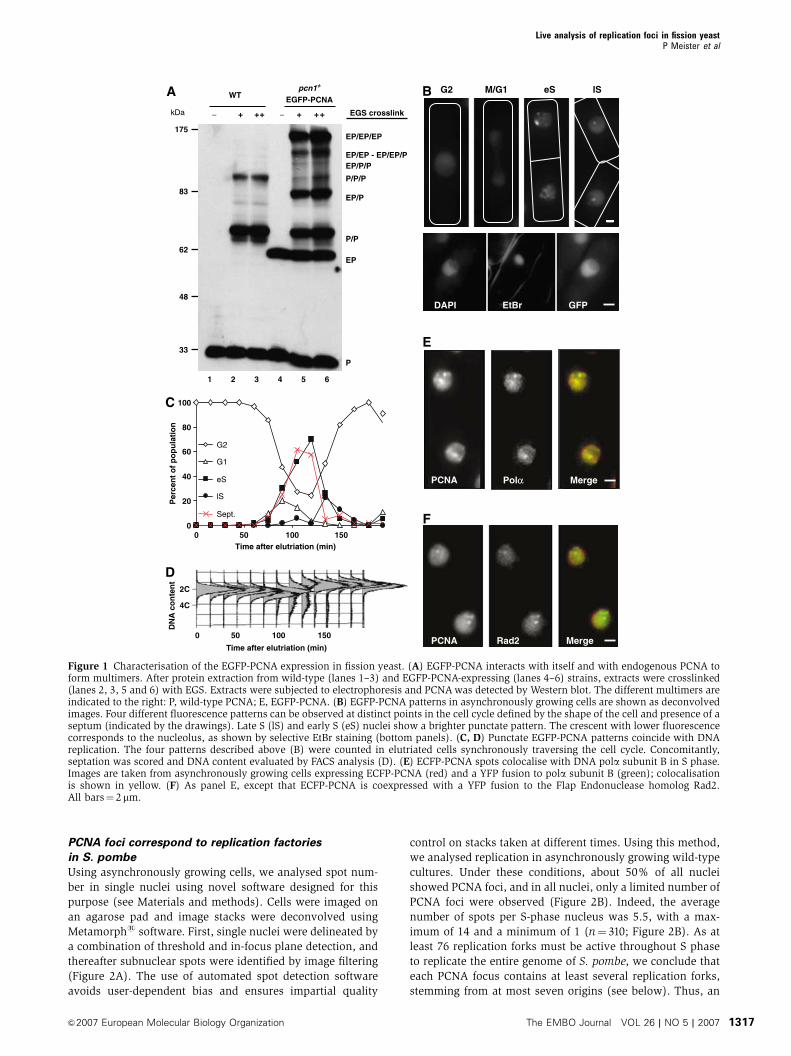
Replication-specific PCNA foci in fission yeast
The fusion protein EGFP-PCNA is exclusively nuclear, occu-
pying primarily the non-nucleolar part of the fission yeast
nucleus (Figure 1B; and data not shown). PCNA fluorescence
was diffuse during the M, G1 and G2 phases of the cell cycle,
but became punctate in early S phase, which was identified
by the cell’s binucleate septated morphology (Figure 1B, eS).
Similarly, foci were observed in very small mononucleated
cells (late S phase or lS, Figure 1B), whereas cells expressing
an unrelated YFP-lacI fusion protein, or another GFP-fusion
protein, did not give a punctate fluorescence pattern at any
stage of the cell cycle (Meister et al, 2003).
The sequential appearance of focal patterns was confirmed
on a cell population synchronised by elutriation. Starting
from a G2-phase population, cells were imaged every
15 min and DNA content was monitored by FACS (Figure
1C and D). G1 and eS cells appeared simultaneously and
rapidly, and a strong correlation could be drawn between
entry into S phase, septation and the appearance of PCNA
foci. The lS pattern, on the other hand, correlated with
the termination of DNA replication as determined by FACS
profiling (Figure 1D).
To confirm that the S-phase PCNA pattern reflects replica-
tion foci, we tagged the second subunit of DNA polymerase a(pola) with YFP. This fusion had no effect on cell growth
or sensitivity to classical DNA damaging agents (data not
shown). Using high-resolution microscopy, we could show
that YFP-pola colocalised with ECFP-PCNA (Figure 1E).
Similar results were obtained with Rad2, the flap endo-
nuclease FEN1 homologue (Figure 1F). We conclude that
the foci formed by fluorescently-tagged PCNA are indeed sites
of genomic DNA replication.
Live analysis of replication foci in fission yeastP Meister et al
The EMBO Journal VOL 26 | NO 5 | 2007 &2007 European Molecular Biology Organization1316
PCNA foci correspond to replication factories
in S. pombe
Using asynchronously growing cells, we analysed spot num-
ber in single nuclei using novel software designed for this
purpose (see Materials and methods). Cells were imaged on
an agarose pad and image stacks were deconvolved using
Metamorphs software. First, single nuclei were delineated by
a combination of threshold and in-focus plane detection, and
thereafter subnuclear spots were identified by image filtering
(Figure 2A). The use of automated spot detection software
avoids user-dependent bias and ensures impartial quality
control on stacks taken at different times. Using this method,
we analysed replication in asynchronously growing wild-type
cultures. Under these conditions, about 50% of all nuclei
showed PCNA foci, and in all nuclei, only a limited number of
PCNA foci were observed (Figure 2B). Indeed, the average
number of spots per S-phase nucleus was 5.5, with a max-
imum of 14 and a minimum of 1 (n¼ 310; Figure 2B). As at
least 76 replication forks must be active throughout S phase
to replicate the entire genome of S. pombe, we conclude that
each PCNA focus contains at least several replication forks,
stemming from at most seven origins (see below). Thus, an
EGS crosslink− + ++ − + + +
WTpcn1+
EGFP-PCNA
1 2 3 4 5 6
kDa
0
20
40
60
80
100
0 50 100 150Time after elutriation (min)
Per
cen
t o
f p
op
ula
tio
n
G2
G1
eS
lS
Sept.
Time after elutriation (min)
0 50 100 150
DN
A c
on
ten
t
2C
4C
DAPI EtBr GFP
PCNA Polα Merge
PCNA Rad2 Merge
175
83
62
48
33
EP/EP/EP
EP/EP - EP/EP/PEP/P/P
P/P/P
EP/P
P/P
P
EP
M/G1 lSG2 eSA B
C
D
F
E
Figure 1 Characterisation of the EGFP-PCNA expression in fission yeast. (A) EGFP-PCNA interacts with itself and with endogenous PCNA toform multimers. After protein extraction from wild-type (lanes 1–3) and EGFP-PCNA-expressing (lanes 4–6) strains, extracts were crosslinked(lanes 2, 3, 5 and 6) with EGS. Extracts were subjected to electrophoresis and PCNA was detected by Western blot. The different multimers areindicated to the right: P, wild-type PCNA; E, EGFP-PCNA. (B) EGFP-PCNA patterns in asynchronously growing cells are shown as deconvolvedimages. Four different fluorescence patterns can be observed at distinct points in the cell cycle defined by the shape of the cell and presence of aseptum (indicated by the drawings). Late S (lS) and early S (eS) nuclei show a brighter punctate pattern. The crescent with lower fluorescencecorresponds to the nucleolus, as shown by selective EtBr staining (bottom panels). (C, D) Punctate EGFP-PCNA patterns coincide with DNAreplication. The four patterns described above (B) were counted in elutriated cells synchronously traversing the cell cycle. Concomitantly,septation was scored and DNA content evaluated by FACS analysis (D). (E) ECFP-PCNA spots colocalise with DNA pola subunit B in S phase.Images are taken from asynchronously growing cells expressing ECFP-PCNA (red) and a YFP fusion to pola subunit B (green); colocalisationis shown in yellow. (F) As panel E, except that ECFP-PCNA is coexpressed with a YFP fusion to the Flap Endonuclease homolog Rad2.All bars¼ 2mm.
Live analysis of replication foci in fission yeastP Meister et al
&2007 European Molecular Biology Organization The EMBO Journal VOL 26 | NO 5 | 2007 1317

S-phase-specific formation of replication factories also occurs
in fission yeast.
Spatio-temporal organisation of DNA replication
in S. pombe
As discussed above, higher eukaryotic replication foci are
found in distinct patterns that occur in a reproducible
sequence during S phase (reviewed in Cook, 2001; Gilbert
2001). To characterise possible replication patterns in fission
yeast, we took 3D images of exponentially growing cell
cultures and attempted to classify replicating nuclei by their
patterns of PCNA foci. We classified 350 nuclei from two
independent experiments, taking deconvolved images with
maximal resolution at a single time point.
We could identify four distinct patterns, labelled a to d
(Figure 3A). In pattern a, replication foci appeared in the
extranucleolar region of the nucleus, but did not pervade the
entire extranucleolar region (Figure 3A, pattern a). This
pattern was present in about 20% of replicating nuclei. In
pattern b, representing 40% of the replicating cells, the entire
extranucleolar space was filled with PCNA foci. Pattern c,
found in 25% of the replicating cells (Figure 3A, pattern c),
showed large replication foci at the edge of the nucleolus and
a small number of bright spots in the rest of the nucleus.
Finally, in pattern d, only a few bright spots located at the
edges of the nucleolus were observed.
To ascertain whether these patterns were temporally or-
dered, we performed time-lapse analysis by recording asyn-
chronously growing cells during an entire S phase at 221C.
Cells were imaged every 4 min to avoid bleaching and arte-
facts owing to fluorescence excitation. Indeed, we confirmed
that repetitive exposure to 475 nm light at 4 min intervals and
growth in a closed observation chamber had almost no effect
on subsequent cell division; cell-cycle duration was similar
with or without fluorescence excitation (data not shown).
Time-lapse series were temporally aligned with respect to
the appearance of PCNA spots. After alignment, a strikingly
reproducible succession of patterns a to d can be observed for
different cells (Figure 3B and Supplementary Movie 1). The
relative proportions of the four patterns scored in a sequential
analysis of S phase were quite similar to the proportions
scored in the asynchronous culture (data not shown). The
last pattern (d) is particularly striking as all cells ended S
phase with bright PCNA spots in or around the nucleolus
(encircled, Figure 3B).
The number of PCNA foci were scored for the different
patterns observed during time-lapse recordings through S
phase. As the z resolution of these images is lower than in
single time-point capture and automated spot counting, these
were counted manually. Results were nonetheless very simi-
lar to those obtained by either automated or manual counting
on asynchronous cultures. Soon after the onset of S phase
and the appearance of PCNA spots, that is, in patterns a and
b, the numbers of foci are relatively high (averaging 7–9;
Figure 3C). As patterns c and d appear, the number of
replication factories decreases progressively reaching on
average only two perinucleolar spots in pattern d. Similar
distributions were obtained from asynchronously growing
cells that were independently categorised by their spatial
pattern prior to counting foci (Supplementary Figure 2). We
conclude that the number and localisation of replication
factories varies in a reproducible manner during S phase in
fission yeast, reminiscent of the spatial and temporal regula-
tion observed in higher eukaryotes (Taddei et al, 2004).
Dynamics of individual replication factories
To study replication foci dynamics, cells were imaged at high
frequency in 3D as they progressed through S phase (every
6 s). Although the small size and large number of replication
Deconvoluted stack
Filtered stack
In focus spot Out of focus spot
z= 0.0 µm 0.2 µm 0.4 µm
1.4 µm1.2 µm1.0 µm0.8 µm
0.6 µm
0
2
4
6
8
10
12
14
16
18
20
1 2 3 4 5 6 7 8 9 10 11 12 13 14 15 16Spots per nucleus
Per
cen
t o
f S
-ph
ase
nu
clei
1 µm
0.4 µm0.2 µm0.0 µm
1.4 µm1.2 µm1.0 µm0.8 µm
0.6 µm
A
B
Figure 2 Replication occurs in a low number of replicationfactories. (A) Example of EGFP-PCNA spot detection in a singleS-phase nucleus showing six spots. The original deconvolved stackis first filtered before spot detection by local maxima detection (in3D). Spots are checked after detection by an overlay of spot positionon the original stacks. (B) Replication foci number in an asynchro-nously growing population of EGFP-PCNA expressing S. pombecells using automated spot detection.
Live analysis of replication foci in fission yeastP Meister et al
The EMBO Journal VOL 26 | NO 5 | 2007 &2007 European Molecular Biology Organization1318

factories in patterns a and b precluded frame-by-frame spot
tracking, the movies of early replicating nuclei show that the
replication factories are highly mobile (see Supplementary
Movie 2). The mid-to-late-S-phase replication factories could
be tracked because of their larger size and smaller number. To
visualise replication factories in time, each time-point stack
was first projected along the z-axis. These projected frames
were then grouped to create a ‘time’ stack in which each
plane is one timepoint. This stack is then projected horizon-
tally along the time axis, forming a kymograph (Figure 4A).
Kymographs showed that single replication foci were able to
traverse the nuclear radius in less than 1.5 min (Figure 4B,
white arrowheads). Because different foci moved in indepen-
dent directions at the same time, such that their paths
occasionally cross each other (Figure 4), focus movement
cannot be accounted for by nuclear rotation. As further
confirmation of this, we monitored EGFP-PCNA movement
in S-phase cells treated with thiabendazole (TBZ), which
depolymerises cytoplasmic microtubules and eliminates nu-
clear rotation. Replication factory movement in not inhibited
by the presence of TBZ (Supplementary Movie 4) and quan-
tification of focus mobility shows that the radii of constraint
are reduced by only 20%, indicating that the movement
of replication foci is primarily due to their own displace-
ment rather than general nuclear rotation (Supplementary
Figure 4).
By comparing the average mobility of 20 mid-to-late-S-
phase replication factories with the dynamics of a lacop-
–8′
0′
8′
16′
24′
32′
40′
48′
56′
64′
72′
80′
88′
a
b
c
d
20% 40% 25% 15%Proportion of S-phase nuclei
a b c dA B
2
4
6
8
10
–20 –10 0 10 20 30 40 50 60 70 80 90
Time after replication on set (min at 22°C)
Nu
mb
er o
fre
plic
atio
n f
acto
ries
a b c dPatternC
Figure 3 Spatio-temporal organisation of replication foci. (A) Four successive replication factories pattern based on EGFP-PCNA fluorescencecan be observed during S phase (a–d) as described in the text. The nucleolus forms a subnuclear domain as indicated. Bar¼ 2 mm. (B) Selectedimages from time-lapse microscopy (see Supplementary Movie 1) of EGFP-PCNA expressing fission yeast cells grown at 221C. Patternsuccession in four live cells is shown during an entire S phase, synchronised relative to initial PCNA foci appearance. The patterns a–d are seento arise in sequential order. Bar¼ 2mm. (C) The number of replication factories was scored at 4-min intervals extracted from time-lapse imagingthroughout an entire S phase (n¼ 6).
Live analysis of replication foci in fission yeastP Meister et al
&2007 European Molecular Biology Organization The EMBO Journal VOL 26 | NO 5 | 2007 1319

tagged gene (Straight et al, 1996), we found that single loci
have a slightly higher Dmax, but have the same spatial
constraints as EGFP-PCNA-tagged replication foci
(Figure 4C). The MSD curves further indicated that the
mobility of a tagged DNA locus decreases in G2 phase as
compared with S phase (Figure 4C; see Discussion).
Mammalian DNA replication patterns are thought to pro-
gress through sequential patterns of replication foci by
de novo assembly, rather than by shifting their position
(Sporbert et al, 2002). A similar de novo assembly and
disappearance of replication foci can be observed in fission
yeast. In Figure 4B, we show an example of the transition
from pattern c to d, coincident with the disappearance of
a replication factory. Moreover, time-lapse imaging allowed
us to show that fission yeast replication factories also fuse
(Figure 4F) and split into two distinct and smaller replication
foci, before later merging again, phenomena that were
not previously reported (Figure 4G; see Supplementary
Movie 3). Such dynamics are likely to be facilitated by the
large degree of mobility scored for replication foci (see MSD
curves).
Replication factories patterns during HU treatment
We next asked to what degree replication factory patterns and
their transitions require normal replication rates. To impair
the progression of DNA synthesis, we used concentrations of
HU ranging from 12 to 50 mM. Asynchronously growing cells
treated with different concentrations of HU were observed
immediately after its addition. No replication factory break-
down was observed at any concentration (data not shown),
consistent with ChIP studies in budding yeast that show DNA
polymerase persistence at HU-arrested forks for up to 1 h
(Cobb et al, 2003). The number of cells with PCNA spots
increased with time, as cells entered S phase (compare 0, 2
and 4 h; Figure 5A), indicating that replication factories are
not disassembled, despite a significant reduction in DNA
replication rates. By 4 h most wild-type cells accumulate
with an early S-phase pattern, presumably because cells
MS
D (
µm2 )
0
0.2
0 50 100 150 200
Genomic locusG2
Genomic locusS
0
0.2
0 50 100 150 200
Genomic locus
Replication factories
∆t (s)
Appearance
Disappearance
Fusion
FusionDivision
30 s
Z Y Y Y Y
X X X
t
t
Z-projection
Z-stacks
n time points Projection
Projected time stacks
around t -axis
Deconvoluted
A
B
D
E
F
G
C
Figure 4 In vivo dynamics of EGFP-PCNA-tagged replication factories. (A) A scheme for the construction of individual kymograph is shown:each 3D image stack taken at 6-s intervals, fluorescence is deconvolved, then z-projected. Time stacks are built from z-projections andprojected around t axis. (B) Kymograph over 10 min of an individual fission yeast nucleus showing the EGFP-PCNA transition from pattern c–dat 301C. Large movements can be observed (arrows) for individual replication factories (see Supplementary movies 2 and 3). (C) MSD analysison aligned nuclei compares the movement of individual EGFP-PCNA spots (diamonds, n¼ 20) with that of a lacO-tagged late replicatinggenomic locus (ars2.1; (Kim and Huberman, 2001), squares, n¼ 6). In the upper graph, we see that the MSD plateau of a genomic locus andof replicating foci are similar, and we calculate a radius of constraint for each as 0.65mm (Gartenberg et al, 2004). The diffusion coefficient(Dmax) reflects the initial slope of the curve, indicating that replication factories diffuse less rapidly. The lower panel compares the samegenomic locus in G2- and S-phase cells, indicating a significant restriction in the radius of constraint in G2 phase. (D, E) Enlargementsof kymographs of fission yeast nuclei in mid-S phase show the appearance (D) or disappearance (E) of an individual replication factory(arrows). (F) As panel D, but showing the merging of replication factories (arrows). (G) As panel E, but showing division and mergingof one replication factory (arrows).
Live analysis of replication foci in fission yeastP Meister et al
The EMBO Journal VOL 26 | NO 5 | 2007 &2007 European Molecular Biology Organization1320
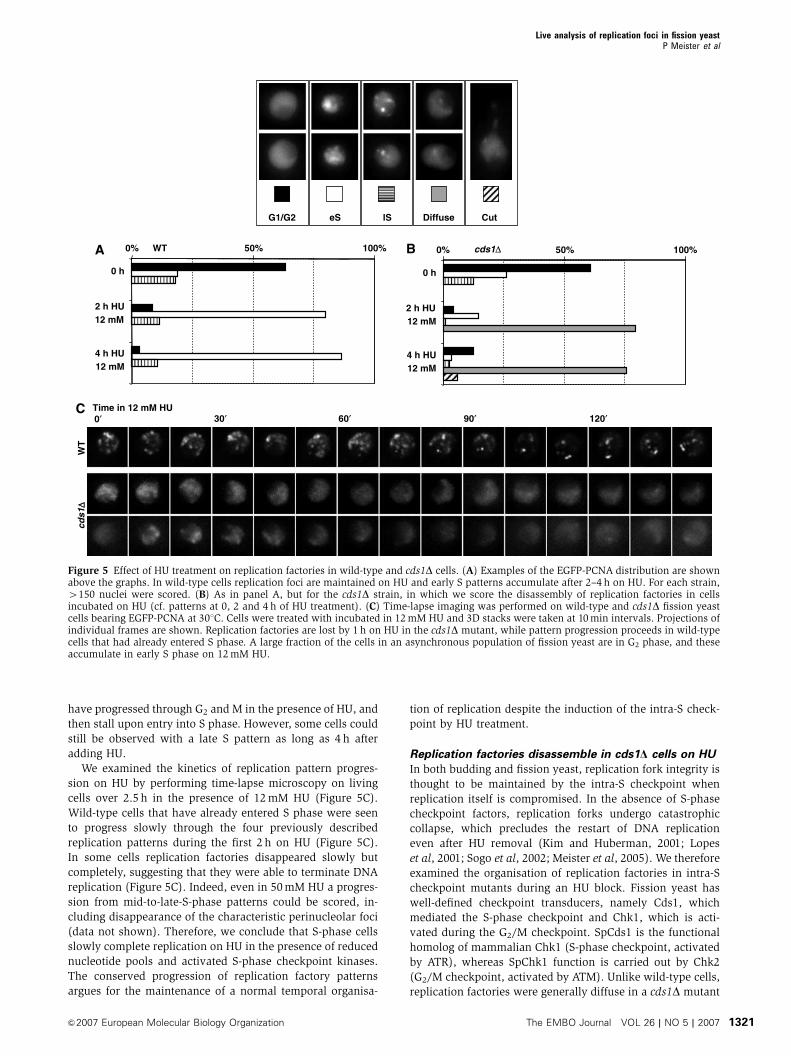
have progressed through G2 and M in the presence of HU, and
then stall upon entry into S phase. However, some cells could
still be observed with a late S pattern as long as 4 h after
adding HU.
We examined the kinetics of replication pattern progres-
sion on HU by performing time-lapse microscopy on living
cells over 2.5 h in the presence of 12 mM HU (Figure 5C).
Wild-type cells that have already entered S phase were seen
to progress slowly through the four previously described
replication patterns during the first 2 h on HU (Figure 5C).
In some cells replication factories disappeared slowly but
completely, suggesting that they were able to terminate DNA
replication (Figure 5C). Indeed, even in 50 mM HU a progres-
sion from mid-to-late-S-phase patterns could be scored, in-
cluding disappearance of the characteristic perinucleolar foci
(data not shown). Therefore, we conclude that S-phase cells
slowly complete replication on HU in the presence of reduced
nucleotide pools and activated S-phase checkpoint kinases.
The conserved progression of replication factory patterns
argues for the maintenance of a normal temporal organisa-
tion of replication despite the induction of the intra-S check-
point by HU treatment.
Replication factories disassemble in cds1D cells on HU
In both budding and fission yeast, replication fork integrity is
thought to be maintained by the intra-S checkpoint when
replication itself is compromised. In the absence of S-phase
checkpoint factors, replication forks undergo catastrophic
collapse, which precludes the restart of DNA replication
even after HU removal (Kim and Huberman, 2001; Lopes
et al, 2001; Sogo et al, 2002; Meister et al, 2005). We therefore
examined the organisation of replication factories in intra-S
checkpoint mutants during an HU block. Fission yeast has
well-defined checkpoint transducers, namely Cds1, which
mediated the S-phase checkpoint and Chk1, which is acti-
vated during the G2/M checkpoint. SpCds1 is the functional
homolog of mammalian Chk1 (S-phase checkpoint, activated
by ATR), whereas SpChk1 function is carried out by Chk2
(G2/M checkpoint, activated by ATM). Unlike wild-type cells,
replication factories were generally diffuse in a cds1D mutant
cds1
∆∆
G1/G2 eS lS Diffuse Cut
0′ 120′90′60′30′
WT
Time in 12 mM HU
2 h HU12 mM
4 h HU12 mM
0 h
WT0% 50% 100%A
C
cds1∆
2 h HU12 mM
4 h HU12 mM
0 h
0% 50% 100%B
Figure 5 Effect of HU treatment on replication factories in wild-type and cds1D cells. (A) Examples of the EGFP-PCNA distribution are shownabove the graphs. In wild-type cells replication foci are maintained on HU and early S patterns accumulate after 2–4 h on HU. For each strain,4150 nuclei were scored. (B) As in panel A, but for the cds1D strain, in which we score the disassembly of replication factories in cellsincubated on HU (cf. patterns at 0, 2 and 4 h of HU treatment). (C) Time-lapse imaging was performed on wild-type and cds1D fission yeastcells bearing EGFP-PCNA at 301C. Cells were treated with incubated in 12 mM HU and 3D stacks were taken at 10 min intervals. Projections ofindividual frames are shown. Replication factories are lost by 1 h on HU in the cds1D mutant, while pattern progression proceeds in wild-typecells that had already entered S phase. A large fraction of the cells in an asynchronous population of fission yeast are in G2 phase, and theseaccumulate in early S phase on 12 mM HU.
Live analysis of replication foci in fission yeastP Meister et al
&2007 European Molecular Biology Organization The EMBO Journal VOL 26 | NO 5 | 2007 1321

strain after 4 h on HU, and distinct patterns were rarely
observed (compare 0, 2, and 4 h; Figure 5B). In many cells,
replication factories disappeared completely, without passing
first through the late replication pattern (Figure 5B, 4 h).
Further analysis using time-lapse recordings showed that
pattern progression did not occur and that PCNA foci became
dismantled within an hour after HU addition (Figure 5C,
cds1D). Cells were then blocked in a G2-like phase with no
visible replication factories, and ultimately underwent mito-
tic catastrophe (cut phenotype, Figure 5B). These observa-
tions are consistent with studies in budding yeast, in which
the loss of functional replication forks and MCM association
are observed when rad53 mutants are treated with HU (Cobb
et al, 2005). Similar fork collapse was observed in cds1 fission
yeast cells treated with HU (Meister et al, 2005).
A novel replication pattern in S-phase checkpoint
mutants
We next analysed the effect of checkpoint gene deletion on
pattern organisation and replication factory number during
an unperturbed S phase. Asynchronous cells bearing full
deletions of checkpoint kinase genes and expressing EGFP-
PCNA were imaged, and patterns were identified within
individual nuclei of S-phase cells.
In both wild-type and chk1D fission yeast cells the four
standard patterns of replication foci were found to be present
in similar proportions (Figure 6A and B). In contrast, in cells
lacking cds1, we observe a novel pattern of replication foci
(n, Figure 6A and B). Notably, in 35% of the replicating cds1
cells PCNA foci appeared at the same time both in the
nucleolus and in non-nucleolar nucleoplasm, a phenomenon
that arose in o2% of a wild-type population. Similarly, in
strains lacking Rad3, the S. pombe ATR kinase, this new
pattern was scored in B10% of replicating cells (Figure 6B).
As rad3D cells have been shown to accumulate DNA
damage, as monitored by the colocalisation of Rad22-YFP
with PCNA in foci, PCNA foci cannot be unambiguously
attributed to replication in this strain (Noguchi et al, 2004;
Meister et al, 2005). On the other hand, cds1D cells showed
very few spontaneous Rad22-YFP foci, making it unlikely that
the appearance of the new PCNA pattern resulted from the
processing of DNA damage. This suggests that the cds1
mutation specifically interferes in the temporal organisation
of origin firing. To see if the kinase activity of Cds1 was
required for wild-type pattern repartition, we performed a
similar analysis of replication foci patterns in a strain bearing
a point mutation in the Cds1 active site (Boddy et al, 2000).
The kinase-dead mutant also produced pattern ‘n’ in 25% of
na b c d
100%0% 20% 40% 60% 80%
WT
cds1∆
rad3∆
chk1∆
cds1 KD
2 µm
2826242220181614121086420
2826242220181614121086420
585654525048464442403836343230
48464442403836343230
WT
cds1∆
A B
C
Figure 6 Loss of intra-S phase checkpoint kinase activity influences replication factory patterns in asynchronously growing cells. (A) The fourstandard replication foci patterns a–d are shown with a sketch of their relationship to the nucleolus. A new pattern (n) can be observed incds1D asynchronously growing cells in the absence of HU, as shown here. (B) Proportions of the different patterns from panel A, relative to thetotal number of nuclei harbouring PCNA foci in asynchronously growing cultures in the absence of HU. The striped bar indicates theappearance of a novel pattern n in checkpoint mutants. (C) Time-lapse imaging of EGFP-PCNA expressing wild-type and cds1D fission yeastcells was performed throughout S phase at 1-min intervals at 301C. Arrows represent the appearance of nucleolar replication foci in cellsbearing numerous non-nucleolar foci.
Live analysis of replication foci in fission yeastP Meister et al
The EMBO Journal VOL 26 | NO 5 | 2007 &2007 European Molecular Biology Organization1322

replicating nuclei, as opposed to o2% in a wild type strain
(Figure 6B). This argues that Cds1 kinase activity is essential
for the patterning of replication foci during an unchallenged
S phase.
The clear qualitative differences between replication foci in
wild-type or G2/M checkpoint mutant (chk1) and the intra-S
checkpoint mutants, led us to perform a quantitative analysis
of foci in these strains. Using the software described above,
we counted EGFP-PCNA foci in replicating nuclei of the
cds1D and control strains. In the intra-S phase kinase mutant,
we saw a 15% drop in the average number of foci throughout
S phase (t-test; P¼ 0.002), which was not the case for chk1Dmutants (P¼ 0.3; data not shown). We compared the dis-
tributions of foci number per nucleus pooled for each strain
from all phases of S-phase and found that wild-type and
cds1D distributions were significantly different (Kolmogorov–
Smirnov test; P¼ 2�10�5; Supplementary Figure 3).
Finally, we used time-lapse microscopy to confirm that the
novel pattern of foci appeared during an unperturbed S phase
in cds1D mutant cells. Cells were imaged at 301C every
minute, and shortly after entry into S phase, the new focal
pattern, which combines intranucleolar foci with numerous
non-nucleolar factories, could be observed (arrows in
Figure 6C, cds1D). We could not detect this pattern in time-
lapse imaging of wild-type cells at any point in S phase
(Figure 6C, WT). Thus, replication focal patterns change in
both a qualitative and quantitative manner in the cds1 intra-S
checkpoint mutant, arguing that the kinase modulates either
directly or indirectly both the spatial and temporal organisa-
tion of DNA replication foci.
Discussion
Replication factories in a unicellular eukaryote
Many studies have examined the organisation of replication
factories in mammalian cells using DNA labelling, immuno-
fluorescence and GFP technology, although what controls
their number and intranuclear distribution remains unknown
(reviewed by Berezney et al, 2000; Gilbert, 2001). Indeed, it is
well established that PCNA forms foci at sites of active DNA
replication based on colocalisation with BrdU pulse-labeled
DNA. Using a functional EGFP-PCNA fusion, we present the
first kinetic analysis of replication factories tracked in living
yeast cells over time, allowing us to make a number of novel
observations about the spatial organisation of replication.
First, we find that in fission yeast S-phase-specific DNA
replication occurs in discrete subnuclear foci, which are
present in a limited number. This argues that multiple forks
must assemble at these sites. In a random S-phase population
we scored on average 5.5 replication foci per nucleus, with
a maximum of 14. Given that the fission yeast genome
has 13.8 Mbp, we calculate that 76 active forks would be
needed to replicate the entire genome during a 60-min
S phase at 301C, assuming a progression rate of 3 kb min�1
(Raghuraman et al, 2001). Thus, with B5.5 foci per nucleus,
an average factory would contain 14 replication forks, initiat-
ing from seven bidirectional origins. If origins are spaced at
20–30 kb (Feng et al, 2006; Patel et al, 2006), then each focus
represents B250 kb of coordinately replicated DNA. The
estimated number of 14 replication forks per focus is remark-
ably similar to that calculated for mammalian cells (Ma et al,
1998), and the large size of coordinately replicated domains
is also similar to that found in flies. These values may
therefore reflect structural limitations on the number of
forks tolerated by a replication factory.
Replication is organised in space and time
As in mammalian cells, S. pombe replication foci assume
spatially distinct patterns that are temporally ordered, and
distinguishable by size and number of foci, subnuclear dis-
tribution, as well as their order of appearance (Figure 2).
Time-lapse microscopy shows that nucleoplasmic, non-
nucleolar foci appear first in early S phase in wild-type cells
(pattern a), increasing in number to form pattern b. By late
S phase, the number of foci drops, and the remaining foci
concentrate within the nucleolus or at the nucleolar periph-
ery (pattern c). Finally, S phase ends reproducibly with 1–2
large spots at the nucleolar border (pattern d). In a recent
study, only B10% of fission yeast origins were found to be
late firing (Heichinger et al, 2006). These late replication
origins were mainly subtelomeric, in agreement with a pre-
vious study which scored telomeres as very late replicating
using 2D gel analysis (Kim and Huberman, 2001). We also
detect a significant level of colocalisation of late foci with
Taz1 (data not shown).
The sensitivity with which one detects replicating DNA
genome-wide depends critically on the method employed.
When labelled nucleotides ratio is used, the detection scale
can only range from 1 to 2 (Heichinger et al, 2006). If origin
firing is stochastic as indicated by single DNA molecule
analysis (Patel et al, 2006), the background of non-firing
origins will reduce the sensitivity of detection. As here we
analyse replication on a single-cell level, stochastic events
can be readily scored. This sensitivity is further enhanced by
the presence of multiple PCNA molecules at each replication
fork. It is remarkable that even if the firing of a given origin is
a stochastic event, replication patterns are reproducible,
suggesting that chromatin regions maintain a robust replica-
tion timing derived from the stochastic firing of multiple
potential origins contained therein.
Replication factories move
We show here for the first time that replication factories move
in a diffusive manner and that they occasionally fuse or
segregate. This contrasts with reports on mammalian cells,
which argue that replication factories are nearly immobile
(Sporbert et al, 2002). Indeed, changes in foci positions in
mammalian cell nuclei are thought to depend entirely on the
progression of replication forks; FRAP experiments suggest
that replication factors are detached from the DNA before
reloading (Sporbert et al, 2002). In yeast, we monitor replica-
tion factories that can cross half of the nucleus in less than
30 s, without changing intensity. This makes it very unlikely
that their movement reflects a progressive reloading of
PCNA. We see that the radius of constraint of replication
focus movement is similar to that of a tagged genomic locus,
arguing that replication itself is not the source of movement.
Instead, this mobility could reflect the absence of nuclear
lamins and an internal nuclear substructure (Taddei et al,
2004). However, as the high-resolution dynamics of replica-
tion foci has not been studied in mammalian cells, one
cannot exclude that such movements also exist in higher
eukaryotes.
Live analysis of replication foci in fission yeastP Meister et al
&2007 European Molecular Biology Organization The EMBO Journal VOL 26 | NO 5 | 2007 1323

Replication factory stability upon nucleotide depletion
requires an intra-S checkpoint
When wild-type cells were treated with hydroxyurea, the
PCNA foci did not change significantly, providing a visual
demonstration that replication forks are maintained under
these conditions. Even more importantly, despite the activa-
tion of a checkpoint response, the temporal succession
of replication patterns was maintained on HU, although
patterns progress at a much slower rate. This is consistent
with recent studies in budding yeast (Feng et al, 2006;
Raveendranathan et al, 2006), which argue for a slow pro-
gression of replication forks in the presence of HU. This
phenomenon was also reported for fission yeast based on
FACS analysis (Kim and Huberman, 2001). Here, we extend
their conclusion by showing that growth in the presence of
low HU concentrations does not alter the spatio-temporal
ordering of origin firing, despite a dramatic extension in the
time it takes to complete S phase.
We also analysed the effect of HU on replication factories
in strains lacking an active intra-S phase checkpoint kinase
Cds1. No pattern succession was observed in this mutant:
PCNA foci accumulated throughout the nucleoplasm and
then progressively disappeared after 1 h. Cells were then
blocked in a G2-like phase and ultimately underwent mitotic
catastrophe (Figure 5). This is consistent with the major
structural changes of replication forks observed in this
mutant during an HU block (Meister et al, 2005). The arrest
of replication by HU in a budding yeast rad53 mutant has been
shown to induce the loss of the replicative helicase MCM,
leading subsequently to fork collapse (Cobb et al, 2005; Feng
et al, 2006). Thus, the loss of replication foci we observe may
well reflect the loss of functional replication forks altogether.
The effect of HU on origin firing in checkpoint mutants has
been recently analysed in fission yeast using an assay that
detects ssDNA. This study argues that 39% of the origins are
suppressed by Cds1 in the presence of HU (Feng et al, 2006).
Increased origin firing followed by rapid collapse would not
be detectable by our assay, although we are able to score
a global loss of functional replication forks.
Intra-S phase checkpoint as a ‘rheostat’ for initiating
forks
In the absence of any external insult such as HU, we observed
that checkpoint mutants, and most notably those lacking the
Cds1 kinase, have a novel pattern of replication factories: foci
were observed simultaneously in the nucleoplasm and in or
near the nucleolus. This was essentially never seen in wild-
type cells. This new pattern appeared to be an overlap of late-
and early-replication patterns, as if the early and the mid-to-
late-S-phase patterns were superimposed, even though the
number of foci per nucleus averaged over the entire S phase
did not vary significantly (Figure 6). This new pattern was
present both in a cds1D strain and in a kinase-dead cds1 point
mutant. We can rule out that the abnormal focal pattern
reflects repair events, as the cds1D cells suffer only a minor
increase of DNA damage during a normal S phase, as judged
by the appearance of Rad22 foci (Meister et al, 2005). We do
not propose that the cds1D pattern reflects a complete loss of
regulated origin timing, but rather an altered efficiency of
firing combined with impaired fork progression, such that
early and late patterns overlap. As the observed change in
pattern occurred in unchallenged cells, the intra-S checkpoint
kinases must be at least partially active during normal
S-phase progression.
One signal for checkpoint activation during normal
S phase could be the presence of an excessive amount of
single-stranded DNA (ssDNA). Recent work has shown that
the intra-S phase checkpoint response requires a threshold
level of stalled forks for activation, suggesting that the total
amount of nuclear ssDNA may be integrated to promote a
checkpoint response, possibly owing to the titration of RFA
(Shimada et al, 2002). During an unchallenged S phase, the
purpose of the intra-S checkpoint could be to avoid the firing
of too many origins, which could itself lead to nucleotide
exhaustion and unwanted fork stalling (Shechter and Gautier,
2005). In this model, the most readily unwound or activated
origins would fire first at the beginning of S phase until a
critical threshold of ssDNA is reached. This might trigger
a low-level S-phase checkpoint kinase activity, that in turn
would inhibit subsequent origin firing. Supporting this
model, S-phase checkpoint activity in the absence of DNA
damage has been monitored in Xenopus egg extracts and in
human cell lines (Miao et al, 2003; Marheineke and Hyrien,
2004; Shechter et al, 2004; Sorensen et al, 2004). This ssDNA
feedback system would be self-regulatory in nature: once
early replicons reach completion, ssDNA levels should de-
crease and relieve checkpoint activation, allowing late origins
to fire. In this way, checkpoint kinases would help limit the
concomitant firing of an excessive number of replication
origins, preventing fork stalling and chromosome breakage.
In this model, the key difference between early and late firing
origins is their propensity to initiate replication, which may
be determined by other factors such as chromatin structure
(reviewed in Schwaiger and Schubeler, 2006). This second
chromatin-based control may explain why we observe a
persistence of the very late focal pattern in the cds1D mutant.
In summary, we describe here, the spatio-temporal orga-
nisation of replication in a genetically tractable organism, and
show that mutations in the intra-S phase checkpoint kinase
gene cds1 alter the visible pattern of replication foci. These
mutations do not, however, eliminate focus formation.
Importantly, the system provides the means to identify and
characterise factors responsible for the spatial organisation
of genomic replication.
Materials and methods
S. pombe strains and culture conditionsAll constructs used in this study are derived from previouslydescribed strains (Meister et al, 2003, 2005), except strainsexpressing Rad2-YFP and Pola subunit B fused to YFP. A list of allstrains used in this study is in Supplementary data. Cells werecultured at 301C in rich medium unless otherwise indicated (YE;Moreno et al, 1991) and HU was used at a 12 or 50 mM finalconcentration (US Biologicals).
EGS crosslink of total extractsCells cultured in rich medium were collected by centrifugation,washed in water and broken with glass beads in 60ml lysis buffer(50 mM Tris–HCl pH 8, 150 mM NaCl, 1 mM EDTA, 1 mMb-mercaptoethanol, 50 mM NaF, 1 mM Na3VO4, 0.1% NP-40 and10% glycerol). The EGS (ethylene glycol-bis(succinic acidn-hydroxysuccinimide ester) (Sigma Chemicals, St Louis, MO)crosslinking method was used as previously described (Piard et al,1998). A 40mg volume of total extract was incubated for 5 min in50 mM EGS, 20 mM NaPO4 pH 7.5 and 0.15 M NaCl at rt. Reactionswere quenched with 50 mM Tris pH 7.5. After boiling in samplebuffer, 10 mg were loaded on a 15–8% gradient acrylamide gel,
Live analysis of replication foci in fission yeastP Meister et al
The EMBO Journal VOL 26 | NO 5 | 2007 &2007 European Molecular Biology Organization1324

followed by Western blotting with a PVDF membrane and anti-PCNA (PC10; Santa Cruz Biotechnology, Santa Cruz, CA).
FACS stainingEthanol-fixed cells were treated as previously described. DNA wasstained with propidium iodide at a final concentration of 4 mg/ml.Flow sorting was performed on a BDFacsCalibur.
Imaging of cellsGFP-PCNA expressing cells were imaged either on agarose (stillimages) or in a lectin-coated Ludin chamber (Griffonia simplifoliafor movies). Imaging was performed on an Olympus IX70microscope with a CoolSnapHQ cooled CCD camera and aTillVision polychrome II monochromator as light source. Usually21-plane stacks were used for still images, with a step size rangingfrom 0.2 to 0.45mm. Imaging was done either at room temperaturefor single-stack acquisition or whole S phase time-lapse acquisition(4-min intervals, Figures 1–3 and 5), whereas a temperature-controlled chamber was used for rapid 6 s interval acquisition(Figures 4 and 6; Life Imaging Services, Reinach, CH). Imageprocessing and deconvolution were performed using Metamorph(Universal Imaging) and ImageJ (NIH). Final statistical analysis wasperformed using R (Ihaka and Gentleman, 1996). MSD is describedin Supplementary data.
Spot counting on individual nucleiThe spot-detection algorithm developed for this paper is based onKruizinga and Petkov (2000), but is extended to 3D. In brief, thesignal is convolved with a finite, discrete 3D Difference of Gaussians(DoG) kernel, whose frequency cut-off is calculated from theexpected, sampled spot diameter. The result of convolution is half-wave rectified to set all negative responses to the filter to 0. A 3D
local maximum operator is then run on the result of rectificationand all returned local maxima are recorded as spot candidates. As alarge fraction of all local maxima is due to noise (and partially to thefinite support of the DoG kernel), we define a real spot as an outlierof the observed intensity distribution of noise-induced localmaxima. To limit the computation overhead, all the steps of thealgorithm are limited to a small volume around each of the nucleicontaining sufficient background to allow a robust intensitydiscrimination. Segmentation of the nuclei is the first step of thealgorithm and uses a modified isovalue algorithm. Statisticallysignificant spots are assigned to the nucleus containing them forfurther statistics. The algorithm for spot counting is part of a largersoftware package written in house: Qu. Qu is written in theMATLAB programming language (The MathWorks, Inc, Natick,MA), and can be obtained upon request.
Supplementary dataSupplementary data are available at The EMBO Journal Online(http://www.embojournal.org).
Acknowledgements
We thank the Baldacci and Gasser Laboratories and D Schubeler forhelpful discussions and critical reading of the manuscript. Thiswork was supported in part by an EMBO short-term Fellowship toPM, by the ARC grant 3471 to GB and by the Institut Curie PIC. PMreceived support from the French MRT and the Association pour laRecherche sur le Cancer (ARC). The Gasser Laboratory is supportedby the Swiss NCCR program ‘Frontiers in Genetics’, Oncosuisse andthe Novartis Research Foundation.
References
Berezney R, Dubey DD, Huberman JA (2000) Heterogeneity ofeukaryotic replicons, replicon clusters, and replication foci.Chromosoma 108: 471–484
Boddy MN, Lopez-Girona A, Shanahan P, Interthal H, Heyer WD,Russell P (2000) Damage tolerance protein Mus81 associates withthe FHA1 domain of checkpoint kinase Cds1. Mol Cell Biol 20:8758–8766
Cobb JA, Bjergbaek L, Shimada K, Frei C, Gasser SM (2003) DNApolymerase stabilization at stalled replication forks requires Mec1and the RecQ helicase Sgs1. EMBO J 22: 4325–4336
Cobb JA, Schleker T, Rojas V, Bjergbaek L, Tercero JA, Gasser SM(2005) Replisome instability, fork collapse, and gross chromoso-mal rearrangements arise synergistically from Mec1 kinase andRecQ helicase mutations. Genes Dev 19: 3055–3069
Cook PR (2001) Principles of Nuclear Structure and Function.Wilmington, Delaware, USA: Wiley-Liss Inc
Dimitrova DS, Gilbert DM (2000) Temporally coordinated assemblyand disassembly of replication factories in the absence of DNAsynthesis. Nat Cell Biol 2: 686–694
Duncker BP, Brown GW (2003) Cdc7 kinases (DDKs) and check-point responses: lessons from two yeasts. Mutat Res 532: 21–27
Feng W, Collingwood D, Boeck ME, Fox LA, Alvino GM, FangmanWL, Raghuraman MK, Brewer BJ (2006) Genomic mapping ofsingle-stranded DNA in hydroxyurea-challenged yeasts identifiesorigins of replication. Nat Cell Biol 8: 148–155
Ferguson BM, Fangman WL (1992) A position effect on the time ofreplication origin activation in yeast. Cell 68: 333–339
Gartenberg MR, Neumann FR, Laroche T, Blaszczyk M, Gasser SM(2004) Sir-mediated repression can occur independently of chro-mosomal and subnuclear contexts. Cell 119: 955–967
Gilbert DM (2001) Making sense of eukaryotic DNA replicationorigins. Science 294: 96–100
Heichinger C, Penkett CJ, Bahler J, Nurse P (2006) Genome-widecharacterization of fission yeast DNA replication origins. EMBO J25: 5171–5179
Ihaka R, Gentleman R (1996) R: A language and environment forstatistical computing. J Comput Graph Stat 5: 299–314
Jeon Y, Bekiranov S, Karnani N, Kapranov P, Ghosh S, MacAlpine D,Lee C, Hwang DS, Gingeras TR, Dutta A (2005) Temporal profile
of replication of human chromosomes. Proc Natl Acad Sci USA102: 6419–6424
Kearsey SE, Montgomery S, Labib K, Lindner K (2000)Chromatin binding of the fission yeast replication factor mcm4occurs during anaphase and requires ORC and cdc18. EMBO J 19:1681–1690
Kim SM, Dubey DD, Huberman JA (2003) Early-replicating hetero-chromatin. Genes Dev 17: 330–335
Kim SM, Huberman JA (2001) Regulation of replication timing infission yeast. EMBO J 20: 6115–6126
Kitamura E, Blow JJ, Tanaka TU (2006) Live-cell imaging revealsreplication of individual replicons in eukaryotic replication fac-tories. Cell 125: 1297–1308
Kruizinga P, Petkov N (2000) Computational model of dot-patternselective cells. Biol Cybern 83: 313–325
Lengronne A, Pasero P, Bensimon A, Schwob E (2001) Monitoring Sphase progression globally and locally using BrdU incorporationin TK(+) yeast strains. Nucleic Acids Res 29: 1433–1442
Lopes M, Cotta-Ramusino C, Pellicioli A, Liberi G, Plevani P, Muzi-Falconi M, Newlon CS, Foiani M (2001) The DNA replicationcheckpoint response stabilizes stalled replication forks. Nature412: 557–561
Ma H, Samarabandu J, Devdhar RS, Acharya R, Cheng PC, Meng C,Berezney R (1998) Spatial and temporal dynamics of DNAreplication sites in mammalian cells. J Cell Biol 143: 1415–1425
MacAlpine DM, Rodriguez HK, Bell SP (2004) Coordination ofreplication and transcription along a Drosophila chromosome.Genes Dev 18: 3094–3105
Marheineke K, Hyrien O (2004) Control of replication origin densityand firing time in Xenopus egg extracts: role of a caffeine-sensitive, ATR-dependent checkpoint. J Biol Chem 279:28071–28081
Meister P, Poidevin M, Francesconi S, Tratner I, Zarzov P, Baldacci G(2003) Nuclear factories for signalling and repairing DNA doublestrand breaks in living fission yeast. Nucleic Acids Res 31:5064–5073
Meister P, Taddei A, Vernis L, Poidevin M, Gasser SM, Baldacci G(2005) Temporal separation of replication and recombinationrequires the intra-S checkpoint. J Cell Biol 168: 537–544
Live analysis of replication foci in fission yeastP Meister et al
&2007 European Molecular Biology Organization The EMBO Journal VOL 26 | NO 5 | 2007 1325
Miao H, Seiler JA, Burhans WC (2003) Regulation of cellular andSV40 virus origins of replication by Chk1-dependent intrinsic andUVC radiation-induced checkpoints. J Biol Chem 278: 4295–4304
Moreno S, Klar A, Nurse P (1991) Molecular genetic analysis offission yeast Schizosaccharomyces pombe. Methods Enzymol 194:795–823
Noguchi E, Noguchi C, McDonald WH, Yates III JR, Russell P (2004)Swi1 and swi3 are components of a replication fork protectioncomplex in fission yeast. Mol Cell Biol 24: 8342–8355
Pasero P, Braguglia D, Gasser SM (1997) ORC-dependent and origin-specific initiation of DNA replication at defined foci in isolatedyeast nuclei. Genes Dev 11: 1504–1518
Patel PK, Arcangioli B, Baker SP, Bensimon A, Rhind N (2006) DNAreplication origins fire stochastically in fission yeast. Mol Biol Cell17: 308–316
Piard K, Baldacci G, Tratner I (1998) Single point mutationslocated outside the inter-monomer domains abolish trimerizationof Schizosaccharomyces pombe PCNA. Nucleic Acids Res 26:2598–2605
Raghuraman MK, Winzeler EA, Collingwood D, Hunt S, Wodicka L,Conway A, Lockhart DJ, Davis RW, Brewer BJ, Fangman WL(2001) Replication dynamics of the yeast genome. Science 294:115–121
Raveendranathan M, Chattopadhyay S, Bolon YT, Haworth J, ClarkeDJ, Bielinsky AK (2006) Genome-wide replication profiles ofS-phase checkpoint mutants reveal fragile sites in yeast.EMBO J 25: 3627–3639
Santocanale C, Diffley JF (1998) A Mec1- and Rad53-dependentcheckpoint controls late-firing origins of DNA replication. Nature395: 615–618
Schubeler D, Scalzo D, Kooperberg C, van Steensel B, Delrow J,Groudine M (2002) Genome-wide DNA replication profile forDrosophila melanogaster: a link between transcription and repli-cation timing. Nat Genet 32: 438–442
Schwaiger M, Schubeler D (2006) A question of timing: emerginglinks between transcription and replication. Curr Opin Genet Dev16: 177–183
Shechter D, Costanzo V, Gautier J (2004) ATR and ATM regulate thetiming of DNA replication origin firing. Nat Cell Biol 6: 648–655
Shechter D, Gautier J (2005) ATM and ATR check in on origins: adynamic model for origin selection and activation. Cell Cycle 4:235–238
Shimada K, Pasero P, Gasser SM (2002) ORC and the intra-S-phasecheckpoint: a threshold regulates Rad53p activation in S phase.Genes Dev 16: 3236–3252
Shirahige K, Hori Y, Shiraishi K, Yamashita M, Takahashi K, ObuseC, Tsurimoto T, Yoshikawa H (1998) Regulation of DNA-replica-tion origins during cell-cycle progression. Nature 395: 618–621
Sogo JM, Lopes M, Foiani M (2002) Fork reversal and ssDNAaccumulation at stalled replication forks owing to checkpointdefects. Science 297: 599–602
Sorensen CS, Syljuasen RG, Lukas J, Bartek J (2004) ATR, Claspinand the Rad9–Rad1–Hus1 complex regulate Chk1 and Cdc25A inthe absence of DNA damage. Cell Cycle 3: 941–945
Sporbert A, Gahl A, Ankerhold R, Leonhardt H, Cardoso MC (2002)DNA polymerase clamp shows little turnover at establishedreplication sites but sequential de novo assembly at adjacentorigin clusters. Mol Cell 10: 1355–1365
Stevenson JB, Gottschling DE (1999) Telomeric chromatin modu-lates replication timing near chromosome ends. Genes Dev 13:146–151
Straight AF, Belmont AS, Robinett CC, Murray AW (1996) GFPtagging of budding yeast chromosomes reveals that protein-protein interactions can mediate sister chromatid cohesion. CurrBiol 6: 1599–1608
Taddei A, Hediger F, Neumann FR, Gasser SM (2004) The functionof nuclear architecture: a genetic approach. Annu Rev Genet 38:305–345
Tubo RA, Berezney R (1987) Identification of 100 and 150 S DNApolymerase alpha-primase megacomplexes solubilized from thenuclear matrix of regenerating rat liver. J Biol Chem 262: 5857–5865
Zappulla DC, Sternglanz R, Leatherwood J (2002) Control ofreplication timing by a transcriptional silencer. Curr Biol 12:869–875
Live analysis of replication foci in fission yeastP Meister et al
The EMBO Journal VOL 26 | NO 5 | 2007 &2007 European Molecular Biology Organization1326