j.p. morgan global cash management survey 2009. morgan asset management global cash management...
TRANSCRIPT
J.P. Morgan Global CashManagement Survey 2009

4 Introduction
5 Executive summary
6 The respondents
7 Banking relationships
9 Treasury function
10 Investments
12 Criteria for investing surplus cash
16 Investment timing
17 Cash and liquidity concentration
19 Debt position
20 The future of cash and treasury management
21 Conclusion
J.P. Morgan Asset Management Global Cash Management Survey 2009 3
Contents

J.P. Morgan Asset Management Global Cash Management Survey 2009 – Introduction 4
We launched the J.P. Morgan Global Cash Management Survey back in 1999 so that we couldidentify and comment upon the cash management preferences of corporate treasurers aroundthe world. In the subsequent ten years it has grown into one of the most comprehensive andinformative annual examinations of the corporate cash management industry.
The survey’s ongoing success owes much to our partnership, since 2002, with the Association ofCorporate Treasurers (ACT). The ACT’s valuable advice and support continues to help us reachout to the broad global community of corporate treasurers, while ensuring the widest possibledistribution of the results. More recently the survey has also benefited from the endorsement ofthe European Association of Corporate Treasurers and, for the first time in 2009, the Associationof Corporate Treasurers Singapore.
This latest survey (our eleventh edition) was conducted by online questionnaire between July andSeptember 2009 and attracted an impressive response rate, with a record 334 treasurers fromacross Europe, the US and Asia providing feedback. The survey has once again also capturedviews from treasurers representing organisations of all sizes, from small-caps to leadingmultinationals.
Indeed, the wide geographical spread and broad industry coverage achieved in this year’s surveymakes it one of the most comprehensive to date. At the same time, with all of the responsesreceived in the run up to the first anniversary of the collapse of Lehman Brothers, the reportshows in detail how the global banking crisis and subsequent economic downturn has impactedthe cash management strategies and policies of corporate treasurers worldwide.
As always, I’d like to thank everyone who took the time to answer our questionnaire. As you cansee from the results, your contributions have helped provide an interesting and valuablesnapshot of the global treasury function. This year, for the first time, those treasurers whocompleted the survey were also given the opportunity to receive an advance copy of the findingsas well as a customised report showing their responses compared to peers in their particularindustry. We believe these customised results will serve as a valuable benchmarking tool forthose participants who completed the survey.
I hope you find this year’s J.P. Morgan Global Cash Management Survey a useful referenceresource. If you require further information please visit our website where past survey resultsare available for download www.jpmgloballiquidity.com
Robert DeutschHead of Global LiquidityJ.P. Morgan Asset Management
Introduction

J.P. Morgan Asset Management Global Cash Management Survey 2009 – Executive summary 5
The international banking crisis and global recession have had a clear impact on this year’s survey.
Firstly, the combination of tighter credit conditions and economic downturn has placed severe
liquidity constraints on many companies around the world. As a result, there has been a clear
attempt by treasurers to manage cash more skilfully and more efficiently in order to avoid potential
cash flow difficulties.
Secondly, recent high profile banking failures and ongoing concerns over the health of the global
financial system has resulted in treasurers placing unprecedented scrutiny on the financial strength of
the institutions they deal with. Counterparty risks have been reduced wherever possible, the number
of banking relationships and the nature of the services used have changed (either by choice or forced
by the withdrawal of lenders from local markets), while treasurers with surplus cash to invest have
been tightening policy guidelines and seeking out only the highest quality products, even at the
expense of yield.
These trends towards risk reduction, greater efficiency and increased liquidity have been identified
throughout the survey. Below is a summary of the key findings:
– Banking relationships are increasing – another increase in the number of banking relationships
(particularly in Asia) suggests that some treasurers have diversified counterparty risk, while
others may have been forced to use more banks for the services they require in the wake of the
global financial crisis.
– Treasurers are taking a more strategic role – difficult trading conditions, the weak economic
backdrop and a lack of available credit lines are creating a greater focus on cash flow forecasting
and liquidity.
– Bank deposits are still favoured by EMEA and Asian treasurers – Most surplus cash is allocated
to bank deposits across EMEA and Asia despite several recent high profile banking failures and a
drop in banking credit ratings. Meanwhile, the percentage of treasurers permitted by their
guidelines to invest in pooled funds has dropped. This is surprising as demand for triple-A rated
money market funds has been strong through the financial crisis, but perhaps reflects to some
degree the concerns of continental European treasurers about the quality of riskier European
cash funds that do not maintain a stable NAV.
– American treasurers favour money market funds – US respondents continue to make much
higher allocations to money market funds and lower allocations to bank deposits than in Europe
and Asia.
– Treasurers are sacrificing yield for higher credit ratings – the survey suggests treasurers are
seeking higher minimum credit ratings when investing in pooled funds, direct investments and
even bank deposits. In return for this reduction in risk, treasurers have generally reduced their
return expectations over the last year.
– De-risking theme set to continue – future concerns for treasurers are dominated by worries over
liquidity, counterparty risk and cash flow forecasting. These concerns suggest that nervousness
and uncertainty will continue to impact the cash management industry for some time to come.
Executivesummary

J.P. Morgan Asset Management Global Cash Management Survey 2009 – The respondents 6
The respondents1 Number of respondents
This year’s survey attracted a record 334 qualifying responses from treasurers representingcompanies from across the industrial spectrum. For the first time, respondents to the surveywere offered the chance to receive customised survey results comparing their responses tothose given by other treasurers in their particular industry.
Country where surplus cash is managedThe survey maintained a broad global focus, with treasurers responding on behalf of cashmanagement offices located across North America, Europe and Asia. As in 2008, the largestpercentage of respondents were located in the US (25%), followed by the UK (22%). Overall,10% of respondents were located in Asia.
Market capitalisationAs always, the survey strives to capture the views of treasurers from organisations of all sizes,from small-caps to leading multinationals. This year the respondents were well balancedacross the market cap spectrum, with 25% of respondent companies having a marketcapitalisation of less than USD 500m, while 31% were valued at more than USD 5 billion.
Top 5 countries
%
Singapore 4
Benelux 8
Germany 12
UK 22
USA 25
25
29
21
23
45
48
44
35
31
23
35
42
Total
North America
EMEA
Asia
%
Under USD 500m USD 501m - 5bn Over USD 5bn
All market capitalisations have been fairly represented in this year’s survey
J.P. Morgan Asset Management Global Cash Management Survey 2009 – Banking relationships 7
32 31 31
50
2224 23
13
45 45 46
38
Total EMEA North America Asia
%
Increased Decreased Remained the same
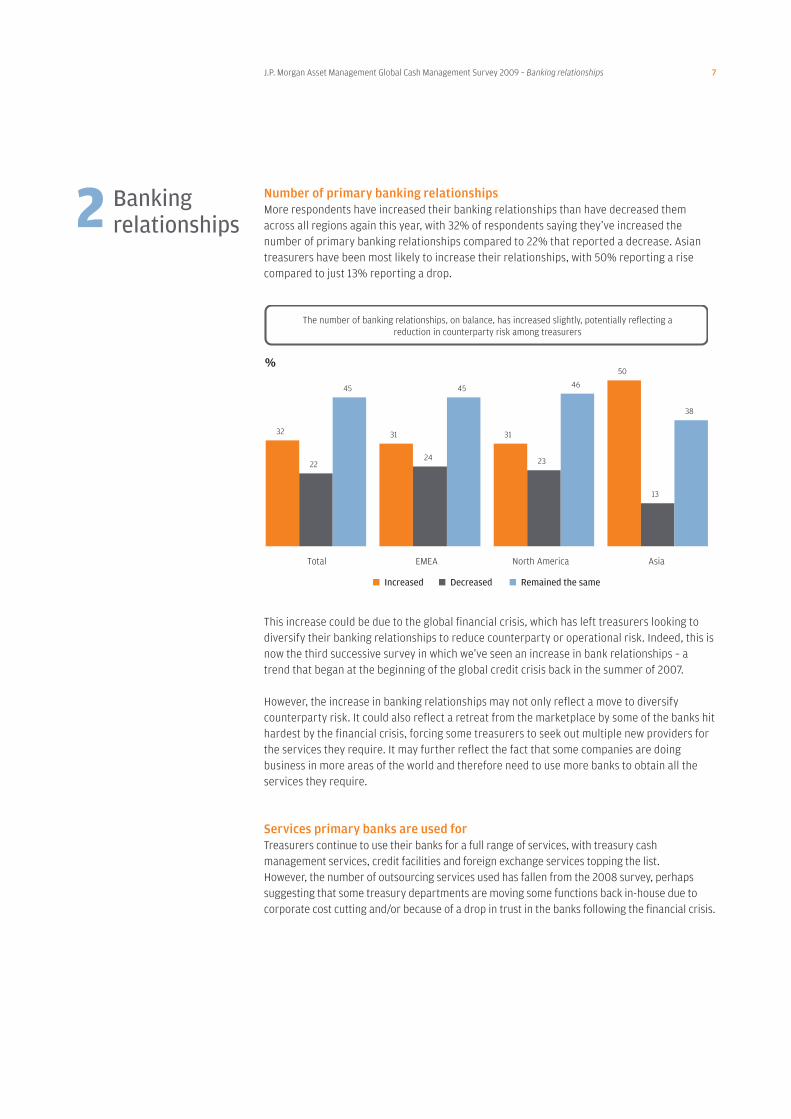
The number of banking relationships, on balance, has increased slightly, potentially reflecting areduction in counterparty risk among treasurers
Number of primary banking relationshipsMore respondents have increased their banking relationships than have decreased themacross all regions again this year, with 32% of respondents saying they’ve increased thenumber of primary banking relationships compared to 22% that reported a decrease. Asiantreasurers have been most likely to increase their relationships, with 50% reporting a risecompared to just 13% reporting a drop.
This increase could be due to the global financial crisis, which has left treasurers looking todiversify their banking relationships to reduce counterparty or operational risk. Indeed, this isnow the third successive survey in which we’ve seen an increase in bank relationships – atrend that began at the beginning of the global credit crisis back in the summer of 2007.
However, the increase in banking relationships may not only reflect a move to diversifycounterparty risk. It could also reflect a retreat from the marketplace by some of the banks hithardest by the financial crisis, forcing some treasurers to seek out multiple new providers forthe services they require. It may further reflect the fact that some companies are doingbusiness in more areas of the world and therefore need to use more banks to obtain all theservices they require.
Services primary banks are used forTreasurers continue to use their banks for a full range of services, with treasury cashmanagement services, credit facilities and foreign exchange services topping the list. However, the number of outsourcing services used has fallen from the 2008 survey, perhapssuggesting that some treasury departments are moving some functions back in-house due tocorporate cost cutting and/or because of a drop in trust in the banks following the financial crisis.
2 Bankingrelationships

93
80
79
51
38
37
30
26
25
15
10
8
94
78
78
48
47
41
40
33
30
17
14
10
Treasury CashManagement services
Credit facilities
Foreign exchange services
Derivative transactions
Trade finance
Consultancy/Advisoryservices
Asset management
Custodian services(Security Settlement)
Risk Management
Trust services
Pension
Insurance
%
Primary Bank 2009Primary Bank 2008
The number of services used with primary bank has fallen over the past year – In 2009 the average number was 4.9 vs. 5.3 in 2008.
This suggests a move to a more specialised banking service
J.P. Morgan Asset Management Global Cash Management Survey 2009 – Banking relationships 8
Bank selection criteriaTrust is clearly a major factor in the selection of banking service providers, with the quality ofcustomer service ranking top once again this year. Reputation and brand ranks much lower,but it is possible that many treasurers see customer service as a key attribute for the buildingof trust.
The desire to reduce risk is also reflected in the criteria used by treasurers to select theirbanking partners, with a bank’s financial strength ranked almost as important as the quality ofcustomer service provided.
59
57
55
32
31
25
18
9
8
Quality of customer serviceand support
Financial Strength of bank
Provision of credit facilities
Provision of full range ofcommercial banking services
Breadth of TreasuryManagement capabilities
Strong local presence
Quality of technology/Internet services
Global investmentcapabilities
Reputation / brand
%
Provision of a full range of services is now more important
than breadth of treasury management
capabilities
The quality of customer service remains the most important attribute when choosing a bank, however for 2009 the new code Financial strength of bank is a close second

J.P. Morgan Asset Management Global Cash Management Survey 2009 – Treasury function 9
Cash management structureThe survey suggests that the role of treasurer is becoming more strategic, with increasingimportance now placed on finding a secure home for surplus cash and ensuring adequateliquidity and cash flow rather than achieving an enhanced yield.
The added importance of the treasury role reflects the continued move towards greater globalcash management structures, with 66% of respondents currently using either a global structureor global oversight. In the future this proportion is expected to rise to 81%.
The events of the last two years have highlighted how critical it is for treasurers to haveimmediate access to information including cash balances, counterparty exposures and foreigncurrency exposure across their entire firm.
Areas of importance for the treasury departmentAnother important change in attitude identified by this year’s survey is the growing importanceof cash flow forecasting. In fact, cash flow forecasting is now the most important area for globaltreasury departments, overtaking cash management, which was the most important in 2008.
The difficult economic environment has placed cash flow constraints on many companies, withalmost half of respondents saying that they have less surplus cash this year than in 2008. As aresult, it is more important than ever for treasurers to be able to accurately forecast futurecash flows to avoid potential liquidity issues.
3 Treasuryfunction
Globally
Global oversight with regional autonomy Regionally
Regional oversight with local autonomy Local autonomy
32%
11%
10%
34%
13%
Now Future
Global or Global with Regional Autonomy are the favoured structures for cash management and are predicted to grow in the future
48%
6%
7%
33%
6%
72
62
40
35
34
31
11
Cash flow forecasting
Cash management (e.g. cash concentration, liquidity management)
Information management and systems
Control issues (e.g. compliance with policies &procedures, corporate governance, investment policy)
Risk management
Cash investment
Accounting and audit
%
Cash flow forecasting received the most mentions, cash management was the previous most important area and is now second
J.P. Morgan Asset Management Global Cash Management Survey 2009 – Investments 10
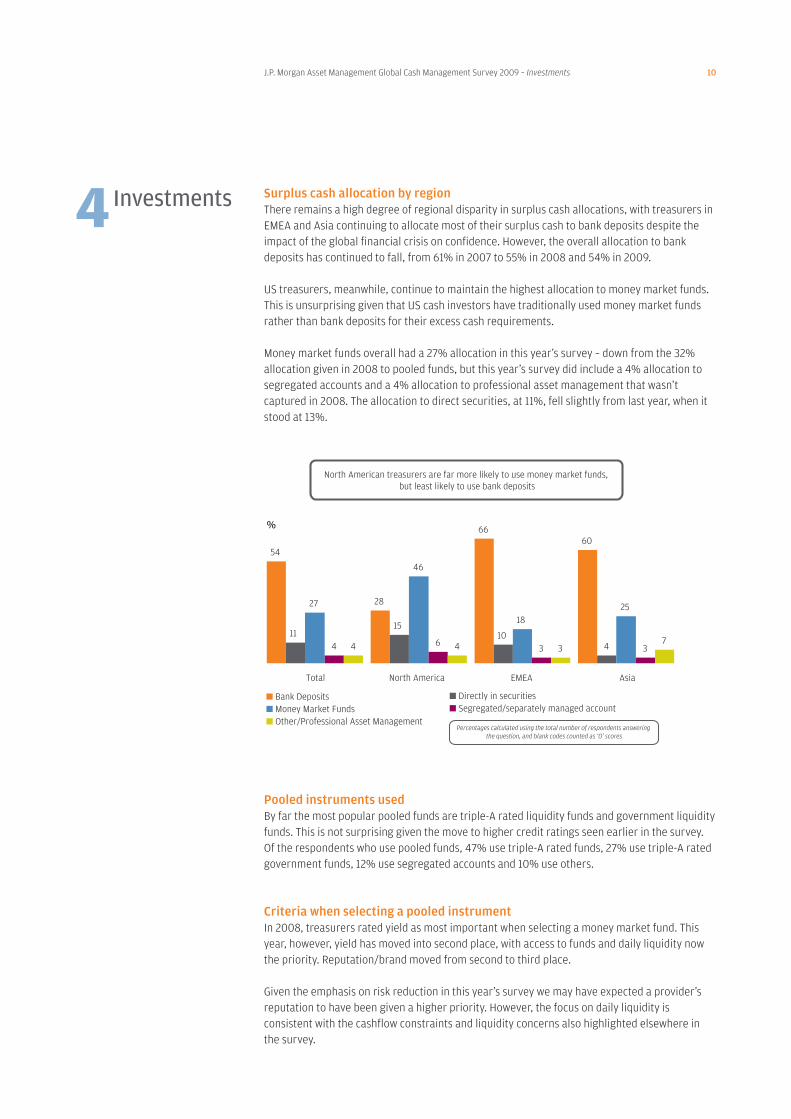
Surplus cash allocation by regionThere remains a high degree of regional disparity in surplus cash allocations, with treasurers inEMEA and Asia continuing to allocate most of their surplus cash to bank deposits despite theimpact of the global financial crisis on confidence. However, the overall allocation to bankdeposits has continued to fall, from 61% in 2007 to 55% in 2008 and 54% in 2009.
US treasurers, meanwhile, continue to maintain the highest allocation to money market funds.This is unsurprising given that US cash investors have traditionally used money market fundsrather than bank deposits for their excess cash requirements.
Money market funds overall had a 27% allocation in this year’s survey – down from the 32%allocation given in 2008 to pooled funds, but this year’s survey did include a 4% allocation tosegregated accounts and a 4% allocation to professional asset management that wasn’tcaptured in 2008. The allocation to direct securities, at 11%, fell slightly from last year, when itstood at 13%.
Pooled instruments usedBy far the most popular pooled funds are triple-A rated liquidity funds and government liquidityfunds. This is not surprising given the move to higher credit ratings seen earlier in the survey.Of the respondents who use pooled funds, 47% use triple-A rated funds, 27% use triple-A ratedgovernment funds, 12% use segregated accounts and 10% use others.
Criteria when selecting a pooled instrumentIn 2008, treasurers rated yield as most important when selecting a money market fund. Thisyear, however, yield has moved into second place, with access to funds and daily liquidity nowthe priority. Reputation/brand moved from second to third place.
Given the emphasis on risk reduction in this year’s survey we may have expected a provider’sreputation to have been given a higher priority. However, the focus on daily liquidity isconsistent with the cashflow constraints and liquidity concerns also highlighted elsewhere inthe survey.
54
28
6660
1510
4
27
46
1825
4 63344 3
711
Total North America EMEA Asia
%
Bank Deposits Directly in securitiesMoney Market Funds Segregated/separately managed accountOther/Professional Asset Management
Percentages calculated using the total number of respondents answering the question, and blank codes counted as ‘0’ scores
North American treasurers are far more likely to use money market funds, but least likely to use bank deposits
4 Investments

J.P. Morgan Asset Management Global Cash Management Survey 2009 – Investments 11
Reasons for not using pooled fundsFor treasurers who do not currently use pooled funds and are not planning to do so in thefuture, the main reason continues to be a preference to manage cash directly. This is true forboth triple-A rated money market funds and other pooled vehicles. In both cases, the secondmost commonly cited reason is that the treasurer’s investment guidelines do not allow them toinvest in these vehicles.
Money market instruments used/considered for useIn 2008, commercial paper was the most commonly used instrument among those who investdirectly in money market securities. In 2009, commercial paper has fallen into third place,reflecting the drying up of liquidity in this market after the collapse of Lehman Brothers butalso due to credit quality concerns and changes to investment policies.
Another significant change is that in 2008, the percentage of respondents considering usingmost instruments outstripped those who were already using them. This year, if respondents arenot already using instruments, they are less likely to be considering adding them in the future.This potentially reflects the derisking trend.
%AAA Rated
Money Market Funds Separately
Managed Accounts Other Funds
Reputation/brand 39 37 32
Yield 44 37 43
Bank relationship 34 31 31
Depth of resources (e.g. credit & analysts) 8 14 10
Fees 25 29 29
Size/importance of liquidity business 13 10 12
Cut-off time 14 9 8
Access to funds/daily liquidity 45 31 34
Size of fund 23 16 18
Quality of customer service 5 7 6
Education and training 1 3 1
Transparency 19 18 21
Yield in 2008 was most important but in 2009 it is second important to access to fund / daily liquidity in AAA rated MMF – a new area of importance for this year’s survey
22 22
15
9 8 86 6 5
2 2 2
13
16 16
7 7
10
7
11
75
7
1
Currently use Considered for use
Certificate of deposit
Short dated Govt. bonds
Commercial paper
Floating rate notes
Longer dated bonds (12+ months)
Short dated corporate
bonds
Medium term notes
Repurchase agreements
Assetbacked
securities
Credit linked notes
Taxstructured/
exempt investments
Money market
deposits/ funds
Security 2009 Mean % allocated
Certificate of deposit 42%
Short dated Govt. bonds
39%
Commercial paper 28%
J.P. Morgan Asset Management Global Cash Management Survey 2009 – Criteria for investing surplus cash 12
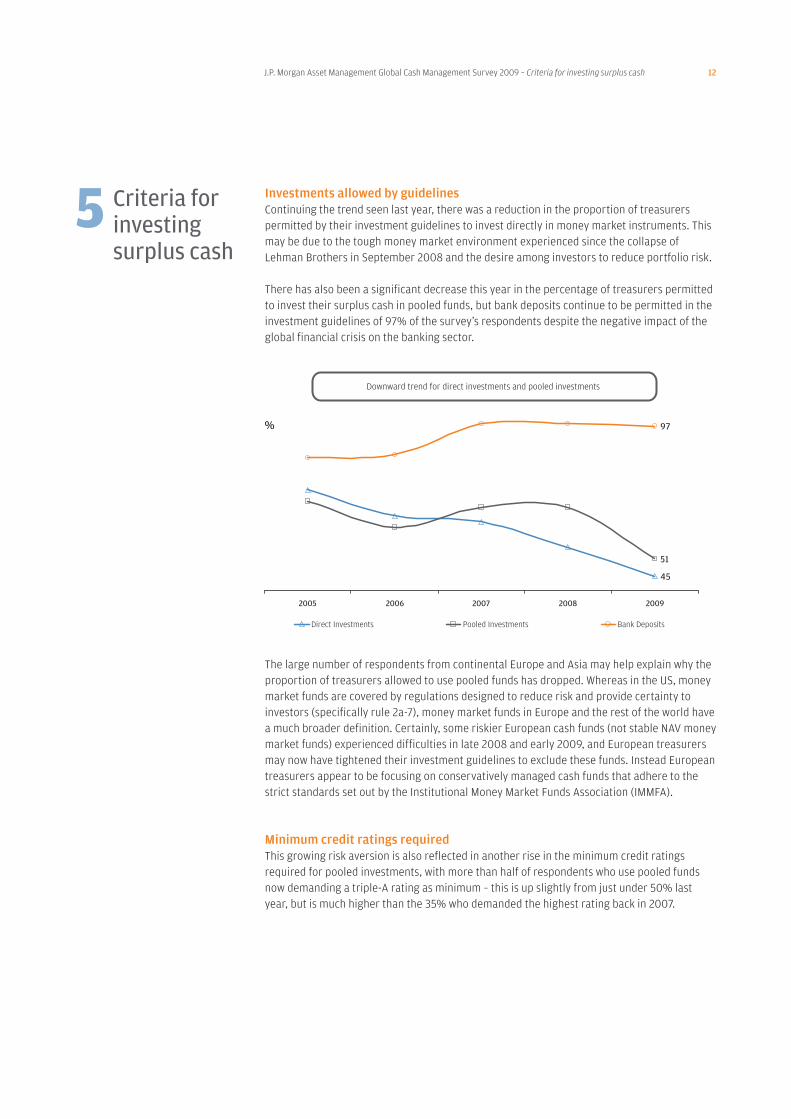
Investments allowed by guidelinesContinuing the trend seen last year, there was a reduction in the proportion of treasurerspermitted by their investment guidelines to invest directly in money market instruments. Thismay be due to the tough money market environment experienced since the collapse ofLehman Brothers in September 2008 and the desire among investors to reduce portfolio risk.
There has also been a significant decrease this year in the percentage of treasurers permittedto invest their surplus cash in pooled funds, but bank deposits continue to be permitted in theinvestment guidelines of 97% of the survey’s respondents despite the negative impact of theglobal financial crisis on the banking sector.
The large number of respondents from continental Europe and Asia may help explain why theproportion of treasurers allowed to use pooled funds has dropped. Whereas in the US, moneymarket funds are covered by regulations designed to reduce risk and provide certainty toinvestors (specifically rule 2a-7), money market funds in Europe and the rest of the world havea much broader definition. Certainly, some riskier European cash funds (not stable NAV moneymarket funds) experienced difficulties in late 2008 and early 2009, and European treasurersmay now have tightened their investment guidelines to exclude these funds. Instead Europeantreasurers appear to be focusing on conservatively managed cash funds that adhere to thestrict standards set out by the Institutional Money Market Funds Association (IMMFA).
Minimum credit ratings requiredThis growing risk aversion is also reflected in another rise in the minimum credit ratingsrequired for pooled investments, with more than half of respondents who use pooled fundsnow demanding a triple-A rating as minimum – this is up slightly from just under 50% lastyear, but is much higher than the 35% who demanded the highest rating back in 2007.
45
51
97
2005 2006 2007 2008 2009
Direct Investments Pooled Investments Bank Deposits
%
Downward trend for direct investments and pooled investments
5 Criteria forinvesting surplus cash

J.P. Morgan Asset Management Global Cash Management Survey 2009 – Criteria for investing surplus cash 13
This trend suggests that those treasurers who are permitted to use pooled funds are demandingthe highest quality funds, such as stable NAV triple-A rated money market funds covered byIMMFA’s code of practice in Europe and by the US Securities and Exchange Commission’s rule 2a-7.
We have similarly seen a slight move up the credit scale in direct investments, perhaps due toan increase in demand for the safety provided by government securities due to liquidityproblems encountered in the short-term funding markets.
Interestingly, there has been another slight move up the credit rating scale for bank deposits,with more than 20% of respondents now demanding that their bank has a triple-A rating asminimum. This is interesting given that there is still only one triple-A rated bank to choosefrom – Rabobank.
Treasurers may also be considering banks that have government guarantees to be triple-Arated but that may be a risky strategy as government guarantee programmes are not allcreated equal and some support programmes have already started to be withdrawn.
Ratings allowed by investment guidelinesStandard & Poor’s and Moody’s are the most popular ratings agencies once again fortreasurers looking to assess the credit ratings of potential investments. Standard & Poor’s has marginally gained ground at Moody’s expense over the past year.
0
10
20
30
40
50
60
%
Direct securities
Pooled investments
Bank Deposits
AAA AA+ AA AA- A+ A A- BBB+ BBB BBB-
The requirement for AAA ratings increased slightly this year for Pooled investments
72
40
72
2 2
20
41
68
5 2
21
73
45
76
5 2
16
69
%
Moody's Fitch S&P DBRS Egan-Jones No ratingrequired
Direct Securities
Pooled Investments
Bank Deposits
Moody’s has dropped in popularity rating compared to 2008 and is now tied with S&P – S&P’s rise in popularity could be due to the recent publicity gained in restructuring operating procedures

J.P. Morgan Asset Management Global Cash Management Survey 2009 – Criteria for investing surplus cash 14
Target returns of short dated surplus cashReflecting the desire for higher credit ratings, treasurers have this year moderated theirreturn expectations for their cash investments. More respondents now expect returns in linewith Libor rather than Libor + for both bank deposits and direct investments (a reversal fromlast year).
Furthermore, while as many pooled fund investors are looking for Libor + returns as thoselooking for Libor (27% of respondents for both), there has been a clear reduction inexpectations from last year when 40% of pooled fund investors said they expected a Libor +return compared to just 14% for Libor.
Investment period and cash balanceThe desire to reduce risk and to maintain maximum levels of liquidity can be seen clearly inthe average amount of time that treasurers tend to invest their surplus cash, with mostrespondents (59%) investing their short-term operating cash overnight. A significant numberof respondents also invest their reserve cash (17%) and strategic cash (15%) for no longer thanone night.
The fact that so many respondents are only prepared to invest surplus cash overnight, evenfor medium-term and longer-term reserves, could suggest the following:
1. Treasurers are holding onto higher cash balances to mitigate the need for external funding.
2. Cash flow forecasting is not trusted enough to allow treasurers to invest for longer periods.
Both of these factors are particularly true in the current uncertain economic environmentwhere a lack of credit availability and volatile cash flows make liquidity a key concern forfinance directors.
The desire of so many treasurers to maintain overnight liquidity may also account for the dropin the use of pooled funds within investment guidelines seen earlier, with a large number oftreasurers (particularly those based in Europe and Asia) perhaps still not aware that moneymarket funds can provide fast access to their cash should they need it.
27
33
11 11 10
4 5
27
1216
85 5
2125
1915
12
4 4
27
%
LIBOR + LIBOR LIBID EONIA Fed FundRate
iMoneyNetaverage
Other
Direct Securities Pooled Investments Bank Deposits
Decrease in expectation for all three investment types in LIBOR+ but an increase in expectation in LIBOR, possibly due to reassessing benchmarks in the current economic climate

J.P. Morgan Asset Management Global Cash Management Survey 2009 – Criteria for investing surplus cash 15
Areas willing to take risk when seeking a higher yieldMost treasurers said they are not currently prepared to take any additional risk to boost yieldfrom their cash investments. But among those that are prepared to increase risk, the mostpopular way to boost yield is to take more duration risk.
Changes in approach to risk Worries over counterparty risk and credit quality come through clearly from the responses,with 55% of treasurers saying they have changed their investment policy as a result of thecredit crisis and 45% saying they no longer rely so heavily on credit ratings.
The most striking change is a large increase in counterparty limits for all types of investment.As would be expected given the flight to quality seen over the last year, nearly all treasurers(91%) have increased their limits to government securities. But there has also been awholesale increase in counterparty limits to banks, money market funds and directinvestments, which is more surprising given the desire expressed elsewhere in the survey toreduce risk.
However, the increase in counterparty limits to banks is probably due to two factors:
1. Companies are holding record levels of liquidity and are therefore comfortable to use fewerlarge banks for their surplus cash investments. Therefore, counterparty limits to thesebanks have increased.
2. There are now fewer banks doing business in many markets, forcing treasurers to raise theamount they can invest with the banks that remain open for business. For example,consolidation in the financial industry has reduced the number of available counterparties – for example J.P. Morgan and Bear Stearns, Bank of America and Merrill Lynch, RBS and
ABN Amro.
Similarly, with many treasurers now holding larger cash balances, it may be the case that theyfeel more comfortable increasing the amount of money they are prepared to allocate toselected money market funds, particularly those with larger cash balances.
Respondents are most likely to be willing to take duration risk for a higher yield
19
12
8
6
6
65
Duration risk
Credit risk
Liquidity risk
Foreign exchange risk
Structured products
Not prepared to takeadditional risk
%

J.P. Morgan Asset Management Global Cash Management Survey 2009 – Investment timing 16
As in previous years, most respondents favour late morning cut-off times for sterling, euro and US dollar positions. Cut-off times for all three currencies also have a smaller peak in the afternoon.
0
5
10
15
20
25
Before09:00
09:00-09:59
10:00-10:59
11:00-11:59
12:00-12:59
13:00-13:59
14:00-14:59
15:00-15:59
16:00-16:59
After17:00
GBP EUR USD
As seen in previous surveys, most
respondents use late morning cut-off times
6 Investmenttiming

J.P. Morgan Asset Management Global Cash Management Survey 2009 – Cash and liquidity concentration 17
Currency of surplus cashUS dollar holdings dominate, reflecting the high proportion of respondents from the US, aswell as the tendency of respondents in other countries to hold their cash either in their localcurrency or in US dollars.
Reasons for choice of cash locationThe most significant drivers of choice of cash location continue to be tax and then clearingservices & cut-off times.
7 Cash andliquidityconcentration
66
60
33
4 3 2 1
15
%
USD EUR GBP JPY RMB SGD HKD Other
50
50
43
41
37
37
35
6
Tax
Clearing services and cut-off times
Clearing services and cut-off times and Tax continue to be the main drivers
Regulatory/Central bank reporting
Staff location
Customer service
Time zone
Access to other markets (e.g. foreign exchange)
Other
%
J.P. Morgan Asset Management Global Cash Management Survey 2009 – Cash and liquidity concentration 18
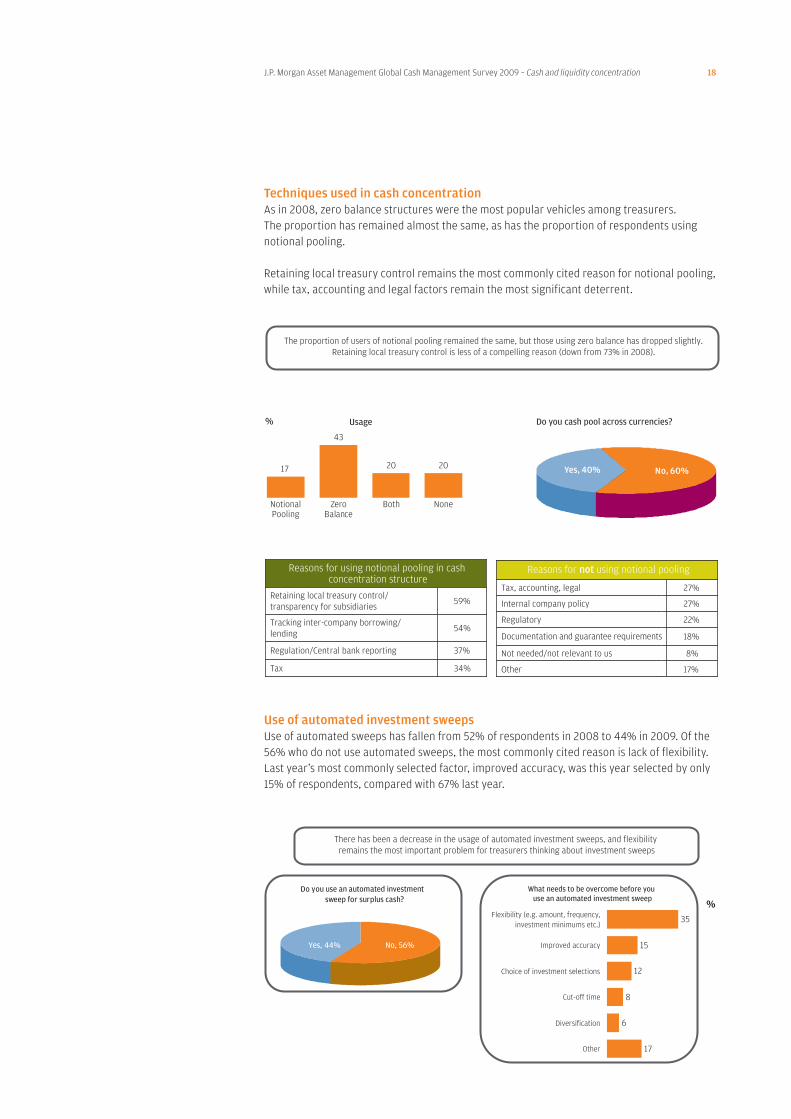
Techniques used in cash concentrationAs in 2008, zero balance structures were the most popular vehicles among treasurers. The proportion has remained almost the same, as has the proportion of respondents usingnotional pooling.
Retaining local treasury control remains the most commonly cited reason for notional pooling,while tax, accounting and legal factors remain the most significant deterrent.
Use of automated investment sweepsUse of automated sweeps has fallen from 52% of respondents in 2008 to 44% in 2009. Of the56% who do not use automated sweeps, the most commonly cited reason is lack of flexibility.Last year’s most commonly selected factor, improved accuracy, was this year selected by only15% of respondents, compared with 67% last year.
17
43
20 20
%
Reasons for using notional pooling in cash concentration structure
Retaining local treasury control/ transparency for subsidiaries
59%
Tracking inter-company borrowing/ lending
54%
Regulation/Central bank reporting 37%
Tax 34%
Reasons for not using notional pooling
Tax, accounting, legal 27%
Internal company policy 27%
Regulatory 22%
Documentation and guarantee requirements 18%
Not needed/not relevant to us 8%
Other 17%
The proportion of users of notional pooling remained the same, but those using zero balance has dropped slightly. Retaining local treasury control is less of a compelling reason (down from 73% in 2008).
Usage Do you cash pool across currencies?
Yes, 40% No, 60%
NotionalPooling
Zero Balance
Both None
35
15
12
8
6
17
Flexibility (e.g. amount, frequency,investment minimums etc.)
Improved accuracy
Choice of investment selections
Cut-off time
Diversification
Other
%Do you use an automated investment
sweep for surplus cash?
No, 56%
What needs to be overcome before you use an automated investment sweep
Yes, 44%
There has been a decrease in the usage of automated investment sweeps, and flexibility remains the most important problem for treasurers thinking about investment sweeps

J.P. Morgan Asset Management Global Cash Management Survey 2009 – Debt position 19
Borrower46%
Depositor54%
Both0%
Expectation of net borrowings in 12 months time
33 3928
More Less Same
Methods used to borrow funds
Variable rate bank debt 59%
Bank overdraft 58%
Fixed term bank debt 52%
Inter-company loan 48%
Bond issuance 29%
Private placement 20%
Commercial paper programme 20%
Factoring 18%
Secured loans 18%
Asset backed loans 15%
MTN programme 12%
Other 14%
Less net borrowing is expected over the next 12 months compared to 2008,
whereas the methods used to borrow will be
After several years of stability, cash positions changed significantly in 2008, with only 28% oftreasurers saying their companies were net borrowers, compared with 40% in 2007. Thisyear’s survey saw a reversion to the trend, with 46% of respondents now net borrowers,perhaps reflecting an easing in credit market conditions compared to last year’s survey.
The increase in borrowers may also reflect the fact that some companies took the opportunity tolock in some debt at very low market rates early in 2009, before credit spreads began to tighten.
In general treasurers expect to borrow less in 12 months than they are now, possibly indicatinga more upbeat outlook for the economy and for corporate profits. However, methods used toborrow remain heavily biased towards the banks, suggesting conditions could be difficult iftreasurers need to borrow more than they expect in the next 12 months, with bank lendingremaining tight.
8Debt position

J.P. Morgan Asset Management Global Cash Management Survey 2009 – The future of cash and treasury management 20
Concerns in the treasury department At the end of the survey we asked respondents to comment on the key concerns they haveabout their treasury departments in the future. Perhaps unsurprisingly, liquidity concernshave moved to the top of the list of concerns this year, reflecting the severe dislocation ofcredit markets, corporate cash flow constraints and the high profile banking failures that havebeen experienced since the 2008 survey was compiled. Similarly, counterparty risk was citedas the second biggest future concern.
However, longer-term concerns continue to be mentioned by a significant number oftreasurers, with funding rule changes, regulatory changes, M&A activity and pension risk allfeaturing in the list of treasurers’ key worries as we head into 2010.
9The future of cash andtreasurymanagement
71
68
60
56
54
34
33
29
25
22
16
11
9
8
3
Liquidity
Counterparty risk
Accurate cash forecasting
FX risk
Available credit
Credit risk
Interest rate risk
Funding – rules, risk and cost
Reporting
Changing regulatory environment
Regulatory environment
Commodity risk
M&A activity
Pension risk
Other
%
Position Attribute
1 FX Risk
2 Credit Crisis
3 Reporting
4 Liquidity
5 Commodity Risk
2008 Attribute ranking
Liquidity has becomemuch more prominent as a
concern for Treasurers
Counterparty risk is close behind liquidity as a key concern

J.P. Morgan Asset Management Global Cash Management Survey 2009 – Conclusion 21
The J.P. Morgan Global Cash Management Survey 2009 has once again taken the pulse oftreasurers around the world. This year’s findings suggest that risk aversion remains high andthat nervousness continues to stalk financial markets. As a result, treasurers have continuedto reduce counterparty risk wherever possible, maintain higher levels of liquidity and focusmore than ever on credit quality.
Yet we’ve also seen treasurers take on an increasingly strategic role as the financial crisis hashighlighted the need to keep a tight control on costs and reduce the need for reliance onexternal sources of finance. As a result the survey reveals that treasurers are continuing toinnovate and make use of a full range of tools to help them carry out their cash managementduties as effectively and efficiently as possible.
Conclusion


The opinions expressed are those held by J.P. Morgan Asset Management at the time of going to print and are subject to change. This material should not be considered by therecipient as a recommendation relating to the buying or selling of investments. This material does not contain sufficient information to support an investment decision andinvestors should ensure that they obtain all available relevant information before making any investment.
Telephone lines are recorded to ensure compliance with our legal and regulatory obligations and internal policies. J.P. Morgan Asset Management is the brand for the assetmanagement business of JPMorgan Chase & Co. and its affiliates worldwide. The above communication is issued by the following entities: in the United Kingdom by JPMorganAsset Management (UK) Limited which is regulated by the Financial Services Authority. Registered in England No. 01161446. Registered address: 125 London Wall, LondonEC2Y 5AJ; in other EU jurisdictions by JPMorgan Asset Management (Europe) S.àr.l. Issued in Switzerland by J.P. Morgan (Suisse) AG, which is regulated by the Federal BankingCommission; in Hong Kong by JPMorgan Funds (Asia) Limited, which is regulated by the Securities and Futures Commission; in Singapore by JF Asset Management (Singapore)Limited, which is regulated by the Monetary Authority of Singapore; in Japan by JPMorgan Securities Japan Limited which is regulated by the Financial Services Agency and inthe United States by J.P. Morgan Investment Management Inc., which is regulated by the Securities and Exchange Commission.
© JPMorgan Chase & Co., January 2009
LV – JPM3246 12/09
Global Liquidity - EMEAKathleen HughesFinsbury Dials20 Finsbury StreetLondon EC2Y 9AQUnited Kingdom
Tel: + 44 20 7742 6059
Global Liquidity - USRobert White245 Park AvenueNew York10167-0001United States
Tel: + 1 212 648 2552
Global Liquidity - AsiaTravis Spence8 Connaught RoadCentralHong Kong
Tel: + 852 2800 2808
www.jpmgloballiquidity.com