jpmorgan global convertibles income fund limited · at the time of writing, the ... robin dunmall...
TRANSCRIPT

JPMorgan Global ConvertiblesIncome Fund Limited Half Year Report & Financial Statements for the six months ended 31st December 2017

The CompanyThe Company is a closed-ended investment company,incorporated and registered in Guernsey, whose shares arelisted on the London Stock Exchange. It is a non-cellularcompany and has been declared by the Guernsey FinancialServices Commission to be a registered closed-ended collectiveinvestment scheme. The assets of the Company are managed byJPMorgan Funds Limited (the ‘Manager’). The Manager hasdelegated the management of the portfolio to JPMorgan AssetManagement (UK) Limited (‘JPMAM’ or ‘Investment Manager’).
Investment ObjectiveThe Company will aim to provide investors with a dividendincome, combined with the potential for long term capitalgrowth, from investing in a globally diversified portfolio ofconvertible securities.
Investment PolicyThe Company will invest in a globally diversified portfolio ofconvertible securities and other suitable instruments exhibitingconvertible or exchangeable characteristics.
BenchmarkThe Company’s benchmark is the Bloomberg Barclays GlobalConvertibles Credit/Rate Sensitive Index (hedged into sterling)for reference purposes but it is not benchmark-driven in itsasset allocation.
Share CapitalAt 31st December 2017, the Company’s share capital comprised216,841,795 ordinary shares of 1p each, including 42,950,028shares held in Treasury.
Continuation VoteIn accordance with the Company’s articles of incorporation, theDirectors are required to propose a resolution at the 2018Annual General Meeting that the Company continues itsbusiness as a closed-ended collective investment scheme and atevery third Annual General Meeting thereafter.
Management Company and Company SecretaryThe Company employs JPMF as its Alternative Investment FundManager and Company Secretary.
AdministratorThe Company employs J.P. Morgan Adminstration Services(Guernsey) Limited (the ‘Administrator’) as its administrator.
Financial Conduct Authority (‘FCA’) regulation of‘non-mainstream pooled investments’ and MiFID II‘complex instruments’The Company currently conducts its affairs so that the sharesissued by the Company can be recommended by IndependentFinancial Advisers to ordinary retail investors in accordancewith the FCA’s rules in relation to non-mainstream pooledinvestment products and intends to continue to do so for theforeseeable future.
The shares are excluded from the FCA’s restrictions which applyto non-mainstream investment products because they areshares in an investment company, which if it were domiciled inthe United Kingdom, would currently qualify as an investmenttrust. The Company’s shares are not classified as ‘complexinstruments’ under the FCA’s revised ‘appropriateness’ criteriaadopted in the implementation of MiFID II.
Association of Investment Companies (‘AIC’)The Company is a member of the AIC.
WebsiteThe Company’s website, which can be found atwww.jpmconvertiblesincome.co.uk, includes useful informationon the Company, such as daily prices, factsheets and willinclude current and historic half year and annual reports.
Features

1
Contents
HALF YEAR PERFORMANCE
2 Total Returns
ABOUT THE COMPANY
3 Chairman’s Statement
5 Investment Managers’ Report
INVESTMENT REVIEW
7 Portfolio Analyses
8 Portfolio Disclosure
FINANCIAL STATEMENTS
10 Statement of Comprehensive Income
11 Statement of Changes in Equity
12 Statement of Financial Position
13 Statement of Cash Flows
14 Notes to the Financial Statements
SHAREHOLDER INFORMATION
17 Interim Management Report
18 Glossary of Terms and Alternative Performance
Measures (‘APMs’)
21 Information about the Company

2 JPMORGAN GLOBAL CONVERTIBLES INCOME FUND LIMITED. HALF YEAR REPORT & FINANCIAL STATEMENTS 2017
Half Year Performance
TOTAL RETURNS (INCLUDES DIVIDENDS REINVESTED) TO 31ST DECEMBER 2017
2.25pDividend3
Financial Data31st December 30th June %
2017 2017 change
Net assets (£’000) 175,563 185,820 –5.5Ordinary shares in issue (excluding shares held in Treasury) 173,891,767 184,191,791 –5.5Net asset value per share 101.0p 100.9p +0.15
Share price 97.0p 99.0p -2.06
Share price discount to net asset value per share 4.0% 1.9%Net cash 5.6% 0.4%Ongoing charges 0.99% 0.99%
1 Source: Morningstar.2 Source: J.P. Morgan/Morningstar, using cum-income net asset value per share.3 Represents the 2018 first interim dividend paid in January 2018 and the second interim dividend declared on 22nd February 2018 and payable on 29th March 2018.4 Based on the share price as at 31st December 2017.5 This return excludes dividends reinvested. Including dividends reinvested the return would be +1.2%.6 This return excludes dividends reinvested. Including dividends reinvested the return would be +0.2%.
A glossary of terms and alternative performance measures is provided on page 18.
4.6%Trailing 12 month dividend yield4
+0.2%Return to shareholders1
+1.2%Return on net assets2

3
About the Company
CHAIRMAN’S STATEMENT
Investment PerformanceIn the first half of the Company’s financial year ended 31st December 2017 the total returnon the Company’s net assets was +1.2%, compared with –0.03% for the Company’s referenceindex, the Bloomberg Barclays Global Convertibles Credit Rate Sensitive Index (hedged intosterling). The total return to shareholders was 0.2%, as the discount of the share price to netasset value (‘NAV’) widened over the six month period from 1.9% to 4.0%. One of theadvantages of investing in bond–like convertibles is their relatively low volatility and this hasbeen demonstrated recently: as volatility increased significantly, equity market indices saw alarge spike, far greater than the volatility in the Company’s own share price.
In their report which follows, the Investment Managers provide more detail on the market,the Company’s portfolio and their view on the outlook.
DividendsThe Company’s objective is to provide investors with an attractive and consistent levelof dividend income together with the potential for some modest capital growth insterling terms over the medium term. During the half year ended 31st December 2017 afirst quarterly dividend of 1.125 pence per share was declared and paid. A second quarterlydividend of 1.125 pence per share was declared on 22nd February 2018, to be paid on29th March 2018 to shareholders on the register on 2nd March 2018.
In the absence of unforeseen circumstances, the Board will seek to maintain the targetedannual dividend of 4.5 pence per share, resulting in a yield of 4.6% on the share priceprevailing at the end of the period. While interest rates may rise in 2018, the predicted riselooks muted and the Company’s yield is attractive, particularly when compared to manyother income generating vehicles which have a significantly higher risk profile.
Managing the DiscountAs I explained in my statement in the 2017 Annual Report, in May last year the Boardintroduced a revised discount control policy under which it intended to seek to ensure thatthe Company’s share price remained close to NAV such that, under normal marketconditions, the Company’s shares traded within a range of a 2% discount to a 2% premiumto the Company’s cum income NAV per share. This would be achieved primarily through theuse of share buybacks and/or share issuance as necessary.
The Company has implemented the revised policy which has resulted in a tightening of thediscount and we will actively continue to do so. Since the Board’s announcement on 30thMay 2017, the Company’s shares have traded at an average discount of 2.1%, but finishedthe year at a discount of 4.0%. The average discount for the prior half year to31st December 2016 was 5.9%. At the time of writing, the discount is 2.5%. During the sixmonths the Company bought back into Treasury a total of 10,300,024 shares, representing5.6% of the shares in issue at the start of the Company’s financial year. Since the half yearend, the Company has repurchased a further 7,474,387 shares into Treasury.

4 JPMORGAN GLOBAL CONVERTIBLES INCOME FUND LIMITED. HALF YEAR REPORT & FINANCIAL STATEMENTS 2017
About the Company continued
CHAIRMAN’S STATEMENT CONTINUED
Investment Management TeamAs announced on 15th February 2018, Antony Vallee, the Company’s lead InvestmentManager, has left JPMAM to pursue other opportunities. The existing investmentmanagement team of Natalia Bucci and Robin Dunmall has been augmented by the additionof Paul Levene, who joined JPMAM in 2015. Paul has over 18 years’ relevant experience andwe welcome his appointment. We expect his contribution, alongside that of Natalia Bucci,Robin Dunmall and the convertible bond team at JPMAM will position the Company well forthe future. On behalf of the Board, I would like to thank Antony Vallee for his substantialcontribution in managing the Company’s portfolio since its launch in 2013.
Continuation VoteIn accordance with the Company’s articles of incorporation, the Company will put anordinary resolution to shareholders at the Annual General Meeting (‘AGM’) to be held inGuernsey on 4th December 2018 proposing that the Company continues its business asa closed-ended collective investment scheme for a further three years. The Boardunderstands that it is not practical for most shareholders to attend the AGM. Therefore wewill arrange an informal briefing for shareholders in London in the autumn, which we hopeas many shareholders as possible will be able to attend.
Simon Miller
Chairman 9th March 2018

5
INVESTMENT MANAGERS’ REPORT
Performance ReviewIn the six months to 31st December 2017, the Company’s portfolio generated a positive netasset value (‘NAV’) total return of 1.2%. While positive in absolute terms, we weredisappointed not to capture more of the performance of global equity markets. To thisregard, we note that the equity performance of convertible issuers in general continued tolag broader equity indices over the period, and that this was even more pronounced forconvertibles with a positive yield. To the extent that this is reflective of the broaderunderperformance of value stocks, we take comfort that convertibles could benefit froma reversal of this trend.
Throughout the period, the continued strength in global economic data has helped pushequity markets higher and supported credit spreads, which currently sit at historically tightlevels. The portfolio benefited from these forces, while the impact of rising yields wasmuted. In addition, the recovery in commodity markets had a positive impact, with themovement higher in the oil price benefiting our yield-focused Energy names as creditspreads tightened in the space. Indeed, the energy and basic materials sectors were thebiggest contributors to performance over the period.
The addition of Asset Swapped Convertible Option Transactions (‘ASCOTs’) to the portfolioduring the first half of 2017 also had a beneficial impact on the Company’s NAVperformance, enabling the Company to participate in the strong performance of Japaneseequity markets. The exposure to diversified chemicals company Mitsubishi ChemicalHoldings Corporation was particularly profitable as the stock rallied by more than 30% inthe period.
Performance was negatively impacted by the Company’s exposure to UK constructionservices company Carillion, which was hit during the period by a profits warning andconcerns regarding a potential breach of covenants. The Company’s exposure to Carillionwas ultimately sold after the end of the period following the announcement that it was beingforced into a liquidation process.
Portfolio ReviewThe Company’s portfolio continued to run higher levels of equity sensitivity over the period,having been raised in late 2016 to levels commensurate with the earlier period of theCompany’s existence. We maintained this level of equity sensitivity in the latter half of 2017,driven by our continued belief that balanced convertibles offering a combination of equityparticipation and downside protection through their fixed income characteristics presenta more attractive opportunity in the current environment than bond-like convertibles withgreater exposure to a potential widening of credit spreads.
The flexibility that the Board have provided to us to manage the portfolio with a focus ontotal return has enabled us to add balanced exposure to high quality names such as Germanchemicals distributor Brenntag and UK supermarket J Sainsbury. We consider such additionsto improve the portfolio’s average credit quality while increasing its ability to participate inequity market performance. Such positioning reflects our preference for more defensivenames during periods where credit looks to be close to fully valued. However, we note thatall new positions have been instigated at positive yield levels, ensuring that the portfolioretains its core focus on income and yield generation.
The sector composition of the portfolio was also adjusted over the period, with the mostnotable change being the reduction in our exposure to the real estate sector. Havingpreviously been the largest allocation within the portfolio, this was reduced in order toreflect the increasing likelihood that interest rates were set to rise meaningfully from here.
Source: J.P. Morgan Asset Management. These estimated portfolioand sub-category returns have been calculated using an internalJ.P. Morgan Asset Management analytical model, and should beconsidered as indicative only. ‘Performance’ figures represent totalreturn calculations in local currency; ‘Contribution’ is the estimatedtotal contribution to portfolio returns. Pricing sources used tocalculate returns are a composite of counterparty-provided pricinginputs. Equity effect = impact of underlying equity performance;Credit effect = impact of changes to input credit spreads; Interestrate effect = impact of changes in risk-free rate; Time decay effect =amortisation of option premium paid to maturity date; Income effect= coupon income; Valuations and Other = Residual, including changesin discount to theoretical value and fees. Prem/Disc effect = Whenthe market price of the Company shares is worth less than the NAVper share, then the Company is said to be trading at a discount. Whenthe market price of the Company shares is worth more than the NAVper share, then the Company is said to be trading at a premium.
6 JPMORGAN GLOBAL CONVERTIBLES INCOME FUND LIMITED. HALF YEAR REPORT & FINANCIAL STATEMENTS 2017
About the Company continued
INVESTMENT MANAGERS’ REPORT CONTINUED
In particular, exposure to US real estate investment trusts (‘REITs’) VEREIT, Extra SpaceStorage and Spirit Realty Capital was sold, along with British Land. In their place, we addedexposure to US investment companies Goldman Sachs BDC and TPG Speciality Lending.We believe that both combine a high quality portfolio, well-regarded management andexposure to US middle market companies that we believe will benefit from a reinvigoratedUS economy.
Use of the Company’s gearing facility was relaxed towards the end of the period, to theextent that the Company ended the period with a positive cash position. We consider this tobe prudent in light of the fact that the overall equity sensitivity of the portfolio remains athigher levels, but would seek to redeploy the facility in the event of a widening in creditspreads or convertible-specific valuations that we considered to provide an attractiveopportunity for the Company.
OutlookDespite our continued emphasis on protecting the portfolio from a widening of creditspreads from tight levels, we remain firmly of the view that both equity and credit marketsare likely to remain broadly supported by continued economic strength. In particular,despite being further along its economic cycle than most other developed economies, webelieve the US remains some way from recession. Nevertheless, we do expect to face morevolatility in 2018 than we have seen recently, and consider the comparatively conservativecredit positioning of the portfolio to be prudent against such a backdrop.
Ultimately, we believe the continued strength of the economy is likely to push interest rateshigher from current levels. This would be particularly likely if evidence were to emerge of asustained increase in inflation, which has remained stubbornly low thus far. If such anincrease in interest rates is managed carefully, as every indication from the US FederalReserve suggests it will be, we consider both the economy and equity markets to besufficiently robust to withstand it. Nevertheless, such a move would likely lead to anextended increase in market volatility. An increase in market volatility could be a positivedevelopment for convertibles if the long-term equity market trend remains supportive, sincethe embedded optionality within the asset class will become more valuable.
We continue to believe that equity markets are better placed than bond markets to performin the current economic context. It is for this reason that we retain both our preference forbalanced convertibles and our conviction that convertibles should perform well relative tonon-convertible fixed income in the coming quarters. While the portfolio yield has trendedslightly lower over recent months, being 3.8% as at 15th February 2018, we believe that thisis appropriate in light of the tightness of credit spreads and the portfolio’s increased abilityto participate in equity market upside.
Investment Management Team ChangesIt was announced on 15th February 2018 that Antony Vallee, one of the Company’sInvestment Managers, had decided to leave J.P. Morgan Asset Management to pursue otheropportunities. Concurrently, the investment management team was augmented by theaddition of Paul Levene, who has over 18 years’ relevant experience and has supported theCompany’s investment process as a fundamental research analyst since 2015.
Natalia BucciRobin DunmallPaul LeveneInvestment Managers 9th March 2018

7
Investment Review
PORTFOLIO ANALYSES
Sector 31st December 30th June 2017 2017 Portfolio Portfolio %1 %1
Energy 14.2 13.1Real Estate 12.6 18.3Software & Services 9.3 8.8Diversified Financials 8.8 8.7Banks 8.4 7.7Technology Hardware & Equipment 7.5 6.4Capital Goods 6.8 8.8Transportation 5.7 6.0Materials 4.8 7.3Semiconductors & Semiconductor Equipment 3.9 2.8Retailing 3.7 3.5Health Care Equipment & Services 3.7 3.7Telecommunication Services 2.1 1.8Food & Staples Retailing 2.1 —Utilities 1.6 1.8Pharmaceuticals Biotech & Life Sciences 1.4 0.7Consumer Durables & Apparel2 1.4 —Media 1.0 —Automobiles & Components 1.0 —Consumer Services2 — 0.6Food Beverage & Tobacco — —
Total 100.0 100.0
1 Based on total portfolio of £165.8m (30th June 2017: £185.0m).2 GoPro 3.50% 15/04/2022 was reclassified from Consumer Services in the prior period to Consumer Durables & Apparel in the current period.
Geographic§
United North Developed 31st December Kingdom America Europe Asia Australia Africa 2017 Portfolio % % % % % % %1
Convertibles 13.8 38.6 11.7 19.2 1.0 3.0 87.3Bonds 1.7 1.7 — — — — 3.4Preference — 8.3 — 1.0 — — 9.3
Total 15.5 48.6 11.7 20.2 1.0 3.0 100.0§
United North Developed 30th June Kingdom America Europe Asia Australia Africa 2017 Portfolio % % % % % % %1
Convertibles 14.3 36.8 16.1 18.9 0.9 2.8 89.8Bonds 1.5 2.8 0.2 — — — 4.5Preference — 5.7 — — — — 5.7
Total 15.8 45.3 16.3 18.9 0.9 2.8 100.01 Based on total portfolio of £165.8m (30th June 2017: £185.0m).

8 JPMORGAN GLOBAL CONVERTIBLES INCOME FUND LIMITED. HALF YEAR REPORT & FINANCIAL STATEMENTS 2017
Investment Review continued
Holding asa percentage
No. Investment of portfolio Region Country Currency Sector Rating
1 Brait 2.75% 18/09/2020 3.0% Africa South Africa GBP Diversified Financials NR
2 Weatherford International 5.88% 01/07/2021 2.6% America United States USD Energy B–
3 Helical Bar Jersey 4.00% 17/06/2019 2.4% Europe United Kingdom GBP Real Estate NR
4 Finisar 0.50% 15/12/2036 2.4% America United States USD Technology Hardware & Equipment NR
5 Ensco Jersey Finance 3.00% 31/01/2024 2.3% America United States USD Energy BB–
6 TPK Holding 0.00% 08/04/2020 2.3% Asia Taiwan USD Technology Hardware & Equipment NR
7 Zhen Ding Technology Holding 2.2% Asia Taiwan USD Technology Hardware & Equipment NR
0.00% 26/06/2019
8 Aabar Investments 0.50% 27/03/2020 2.2% Europe Italy EUR Banks NR
9 St Modwen Properties Securities Jersey 2.2% Europe United Kingdom GBP Real Estate NR
2.88% 06/03/2019
10 J Sainsbury 1.25% 21/11/2019 2.1% Europe United Kingdom GBP Food & Staples Retailing NR
11 Remgro Jersey GBP 2.63% 22/03/2021 2.1% Europe United Kingdom GBP Health Care Equipment & NR
Services
12 PB Issuer No. 4 3.25% 03/07/2021 2.1% Asia Hong Kong USD Transportation NR
13 DP World 1.75% 19/06/2024 2.0% Asia United Arab USD Transportation BBB
Emirates
14 Larsen & Toubro 0.68% 22/10/2019 1.9% Asia India USD Capital Goods NR
15 Twitter 1.00% 15/09/2021 1.9% America United States USD Software & Services BB–
16 FireEye 1.63% 01/06/2035 1.9% America United States USD Software & Services NR
17 Redwood Trust, REIT 4.63% 15/04/2018 1.9% America United States USD Real Estate NR
18 Wayfair 0.38% 01/09/2022 1.7% America United States USD Retailing NR
19 Tullow Oil 6.00% 01/11/2020 1.7% Europe United Kingdom USD Energy CCC
20 Bank of America Preference 0.00% 1.6% America United States USD Banks BB+
21 Hercules Capital 4.38% 01/02/2022 1.6% America United States USD Diversified Financials BBB–
22 Nuance Communications 1.50% 01/11/2035 1.6% America United States USD Software & Services BB–
23 Wells Fargo Preference 0.00% 1.6% America United States USD Banks BBB
24 Nabors Industries 0.75% 15/01/2024 1.6% America Bermuda USD Energy BB–
25 Premier Oil Finance Jersey 2.50% 31/05/2022 1.5% Europe United Kingdom USD Energy NR
26 GS Engineering & Construction 4.50% 21/07/2021 1.3% Asia South Korea USD Capital Goods NR
27 BW Group 1.75% 10/09/2019 1.3% Europe Norway USD Energy BB+
28 China Overseas Finance Investment Cayman 1.2% Asia Hong Kong USD Real Estate NR
V 0.00% 05/01/2023
29 CapitaLand 1.95% 17/10/2023 1.2% Asia Singapore SGD Real Estate NR
30 TCP Capital 5.25% 15/12/2019 1.2% America United States USD Diversified Financials BBB–
31 TPG Specialty Lending 4.50% 01/08/2022 1.2% America United States USD Diversified Financials BBB–
32 SunPower 0.88% 01/06/2021 1.2% America United States USD Semiconductors & Semiconductor NR
Equip
33 Abigrove 0.00% 16/02/2022 1.1% Europe Russia USD Materials BBB–
34 Intu Jersey, REIT 2.50% 04/10/2018 1.1% Europe United Kingdom GBP Real Estate NR
35 FMG Resources August 2006 5.13% 15/05/2024 1.1% America United States USD Materials BB
36 Scorpio Tankers 2.38% 01/07/2019 1.1% America United States USD Energy NR
37 Yandex 1.13% 15/12/2018 1.1% Europe Russia USD Software & Services NR
38 Mebuki Financial Group 0.00% 24/04/2019 1.1% Asia Japan USD Banks A
39 Hess Preference 0.00% 1.1% America United States USD Energy NR
40 America Movil 5.50% 17/09/2018 1.1% Europe Netherlands EUR Telecommunication Services A–
41 Intu Jersey 2, REIT 2.88% 01/11/2022 1.1% Europe United Kingdom GBP Real Estate NR
42 OCI 3.88% 25/09/2018 1.1% Europe Netherlands EUR Materials NR
PORTFOLIO DISCLOSUREAT 31ST DECEMBER 2017

9
Holding asa percentage
No. Investment of portfolio Region Country Currency Sector Rating
43 Cypress Semiconductor 2.00% 01/02/2023 1.1% America United States USD Semiconductors & Semiconductor Equip B+
44 Sacyr 4.00% 08/05/2019 1.1% Europe Spain EUR Capital Goods NR
45 BlackRock Capital Investment 5.00% 1.0% America United States USD Diversified Financials BBB–
15/06/2022
46 Brenntag Finance 1.88% 02/12/2022 1.0% Europe Germany USD Capital Goods BBB–
47 Macquarie Infrastructure 2.00% 01/10/2023 1.0% America United States USD Transportation BBB–
48 SolarCity 1.63% 01/11/2019 1.0% America United States USD Automobiles & Components NR
49 Becton Dickinson Preference 0.00% 1.0% America United States USD Health Care Equipment & Services BB+
50 DISH Network 2.38% 15/03/2024 1.0% America United States USD Media B–
51 IAC FinanceCo 0.88% 01/10/2022 1.0% America United States USD Software & Services NR
52 Cromwell SPV Finance, REIT 2.00% 1.0% Australia Australia EUR Real Estate BB+
04/02/2020
53 Chesapeake Energy 5.50% 15/09/2026 1.0% America United States USD Energy NR
54 Mandatory Exchangeable Trust 1.0% Asia China USD Telecommunication Services NR
Preference 0.00%
55 Veeco Instruments 2.70% 15/01/2023 1.0% America United States USD Semiconductors & Semiconductor Equip NR
56 Pandora Media 1.75% 01/12/2020 1.0% America United States USD Software & Services NR
57 First Abu Dhabi Bank 1.00% 12/03/2018 1.0% Asia United Arab USD Banks AA–
Emirates
58 Baosteel Hong Kong Investment 0.00% 0.9% Asia Hong Kong USD Banks NR
01/12/2018
59 Harvest International 0.00% 21/11/2022 0.9% Asia Hong Kong HKD Consumer Durables & Apparel NR
60 Salzgitter Finance 0.00% 05/06/2022 0.9% Europe Germany EUR Materials NR
61 Allergan Preference 0.00% 0.9% America United States USD Pharmaceuticals Biotech & Life Sciences NR
62 NextEra Energy Preference 0.00% 0.8% America United States USD Utilities BBB
63 NRG Yield 3.50% 01/02/2019 0.8% America United States USD Utilities BB
64 Stanley Black & Decker Preference 0.00% 0.8% America United States USD Capital Goods BBB+
65 Goldman Sachs BDC 4.50% 01/04/2022 0.8% America United States USD Diversified Financials BBB–
66 Weibo 1.25% 15/11/2022 0.8% America Cayman Islands USD Software & Services NR
67 Carillion Finance Jersey 2.50% 19/12/2019 0.7% Europe United Kingdom GBP Capital Goods NR
68 NantHealth 5.50% 15/12/2021 0.6% America United States USD Health Care Equipment & Services NR
69 GNC Holdings 1.50% 15/08/2020 0.6% America United States USD Retailing BB
70 Liberty Interactive 3.75% 15/02/2030 0.6% America United States USD Retailing B
71 Asia View 1.50% 08/08/2019 0.6% Asia Hong Kong USD Transportation NR
72 Liberty Interactive 4.00% 15/11/2029 0.6% America United States USD Retailing B
73 BE Semiconductor Industries 0.50% 0.6% Europe Netherlands EUR Semiconductors & Semiconductor Equip NR
06/12/2024
74 Volcan Holdings 4.13% 11/04/2020 0.6% Europe United Kingdom GBP Materials NR
75 Western Digital 10.50% 01/04/2024 0.6% America United States USD Technology Hardware & Equipment BB
76 Shui On Development Holding, 0.5% Asia Hong Kong USD Real Estate NR
FRN 7.50%Perpetual
77 Teva Pharmaceutical Industries 0.5% America United States USD Pharmaceuticals Biotech & Life Sciences NR
Preference 0.00%
78 GoPro 3.50% 15/04/2022 0.5% America United States USD Consumer Durables & Apparel NR
79 Maisons du Monde 0.13% 06/12/2023 0.2% Europe France EUR Retailing NR
100.0%
Note: Rating describes the most conservative rating published by an external reputable credit rating agency. Where a security is described as not rated, no external rating isavailable. These securities are subject to an internal credit analysis and rating procedure.
10 JPMORGAN GLOBAL CONVERTIBLES INCOME FUND LIMITED. HALF YEAR REPORT & FINANCIAL STATEMENTS 2017
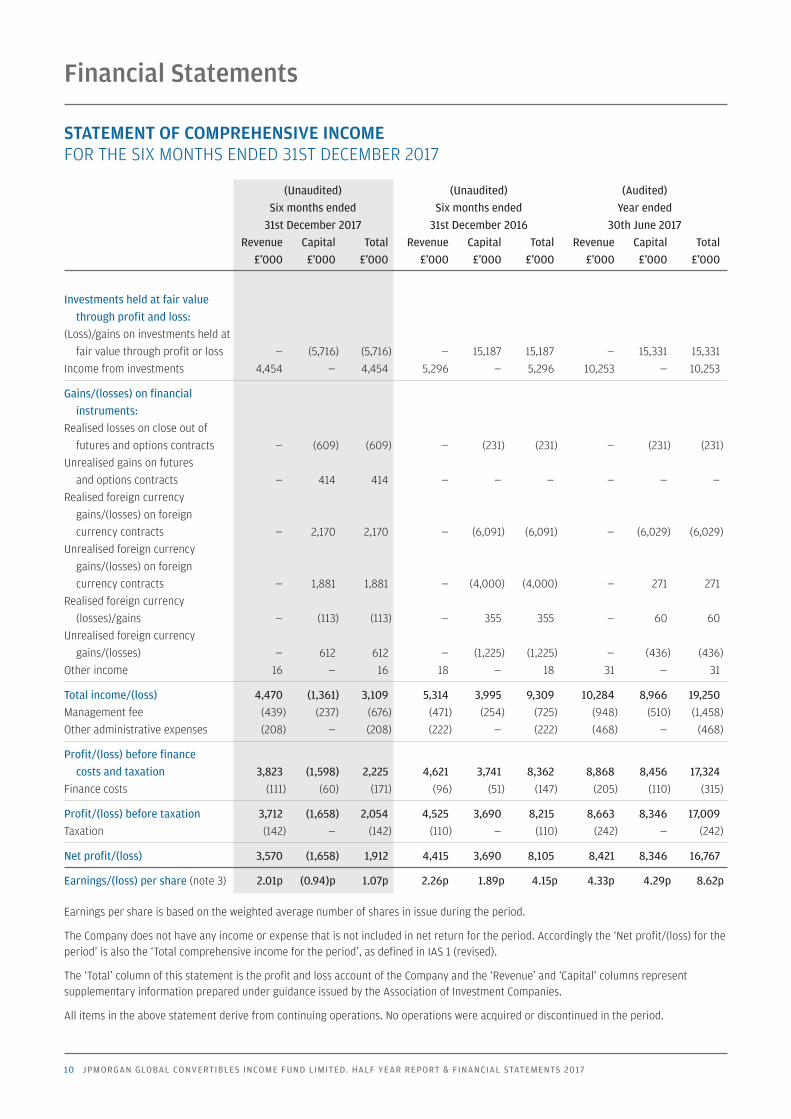
STATEMENT OF COMPREHENSIVE INCOME FOR THE SIX MONTHS ENDED 31ST DECEMBER 2017
(Unaudited) (Unaudited) (Audited)Six months ended Six months ended Year ended31st December 2017 31st December 2016 30th June 2017
Revenue Capital Total Revenue Capital Total Revenue Capital Total£’000 £’000 £’000 £’000 £’000 £’000 £’000 £’000 £’000
Investments held at fair value through profit and loss:
(Loss)/gains on investments held at fair value through profit or loss — (5,716) (5,716) — 15,187 15,187 — 15,331 15,331
Income from investments 4,454 — 4,454 5,296 — 5,296 10,253 — 10,253
Gains/(losses) on financial instruments:
Realised losses on close out of futures and options contracts — (609) (609) — (231) (231) — (231) (231)
Unrealised gains on futures and options contracts — 414 414 — — — — — —
Realised foreign currencygains/(losses) on foreigncurrency contracts — 2,170 2,170 — (6,091) (6,091) — (6,029) (6,029)
Unrealised foreign currency gains/(losses) on foreign currency contracts — 1,881 1,881 — (4,000) (4,000) — 271 271
Realised foreign currency (losses)/gains — (113) (113) — 355 355 — 60 60
Unrealised foreign currencygains/(losses) — 612 612 — (1,225) (1,225) — (436) (436)
Other income 16 — 16 18 — 18 31 — 31
Total income/(loss) 4,470 (1,361) 3,109 5,314 3,995 9,309 10,284 8,966 19,250Management fee (439) (237) (676) (471) (254) (725) (948) (510) (1,458)Other administrative expenses (208) — (208) (222) — (222) (468) — (468)
Profit/(loss) before finance costs and taxation 3,823 (1,598) 2,225 4,621 3,741 8,362 8,868 8,456 17,324
Finance costs (111) (60) (171) (96) (51) (147) (205) (110) (315)
Profit/(loss) before taxation 3,712 (1,658) 2,054 4,525 3,690 8,215 8,663 8,346 17,009Taxation (142) — (142) (110) — (110) (242) — (242)
Net profit/(loss) 3,570 (1,658) 1,912 4,415 3,690 8,105 8,421 8,346 16,767
Earnings/(loss) per share (note 3) 2.01p (0.94)p 1.07p 2.26p 1.89p 4.15p 4.33p 4.29p 8.62p
Earnings per share is based on the weighted average number of shares in issue during the period.
The Company does not have any income or expense that is not included in net return for the period. Accordingly the ‘Net profit/(loss) for theperiod’ is also the ‘Total comprehensive income for the period’, as defined in IAS 1 (revised).
The ‘Total’ column of this statement is the profit and loss account of the Company and the ‘Revenue’ and ‘Capital’ columns representsupplementary information prepared under guidance issued by the Association of Investment Companies.
All items in the above statement derive from continuing operations. No operations were acquired or discontinued in the period.
Financial Statements

11
STATEMENT OF CHANGES IN EQUITY FOR THE SIX MONTHS ENDED 31ST DECEMBER 2017
Share Capital Revenue capital reserve reserve Total £’000 £’000 £’000 £’000
Six months ended 31st December 2017 (Unaudited)At 30th June 2017 217,368 (31,271) (277) 185,820Repurchase of shares into Treasury — (10,182) — (10,182)Net (loss)/profit for the period — (1,658) 3,570 1,912 Dividends paid in the period (note 4) — — (1,987) (1,987)
At 31st December 2017 217,368 (43,111) 1,306 175,563
Six months ended 31st December 2016 (Unaudited)At 30th June 2016 217,368 (28,794) 64 188,638 Repurchase of shares into Treasury — (104) — (104)Net profit for the period — 3,690 4,415 8,105 Dividends paid in the period (note 4) — — (4,390) (4,390)
At 31st December 2016 217,368 (25,208) 89 192,249
Year ended 30th June 2017 (Audited)At 30th June 2016 217,368 (28,794) 64 188,638 Repurchase of shares into Treasury — (10,823) — (10,823)Net profit for the year — 8,346 8,421 16,767 Dividends paid in the year (note 4) — — (8,762) (8,762)
At 30th June 2017 217,368 (31,271) (277) 185,820

12 JPMORGAN GLOBAL CONVERTIBLES INCOME FUND LIMITED. HALF YEAR REPORT & FINANCIAL STATEMENTS 2017
STATEMENT OF FINANCIAL POSITIONAT 31ST DECEMBER 2017
(Unaudited) (Unaudited) (Audited) 31st December 2017 31st December 2016 30th June 2017 £’000 £’000 £’000
Non current assets Investments held at fair value through profit or loss 165,753 202,866 185,007
Current assetsDerivative financial assets 4,805 130 763Trade and other receivables 952 1,291 1,702Cash and cash equivalents 19,308 8,445 16,683
25,065 9,866 19,148Current liabilitiesDerivative financial liabilities (80) (4,130) (492)Trade and other payables (15,175) (16,353) (2,446)
Net current assets/(liabilities) 9,810 (10,617) 16,210
Total assets less current liabilities 175,563 192,249 201,217Non current liabilitiesLoans payable — — (15,397)
Net assets 175,563 192,249 185,820
Amounts attributable to equity holders Share capital 217,368 217,368 217,368Capital reserve (43,111) (25,208) (31,271)Revenue reserve 1,306 89 (277)
Total equity shareholders’ funds 175,563 192,249 185,820
Net asset value per share (note 5) 101.0p 98.6p 100.9p
Financial Statements continued
13
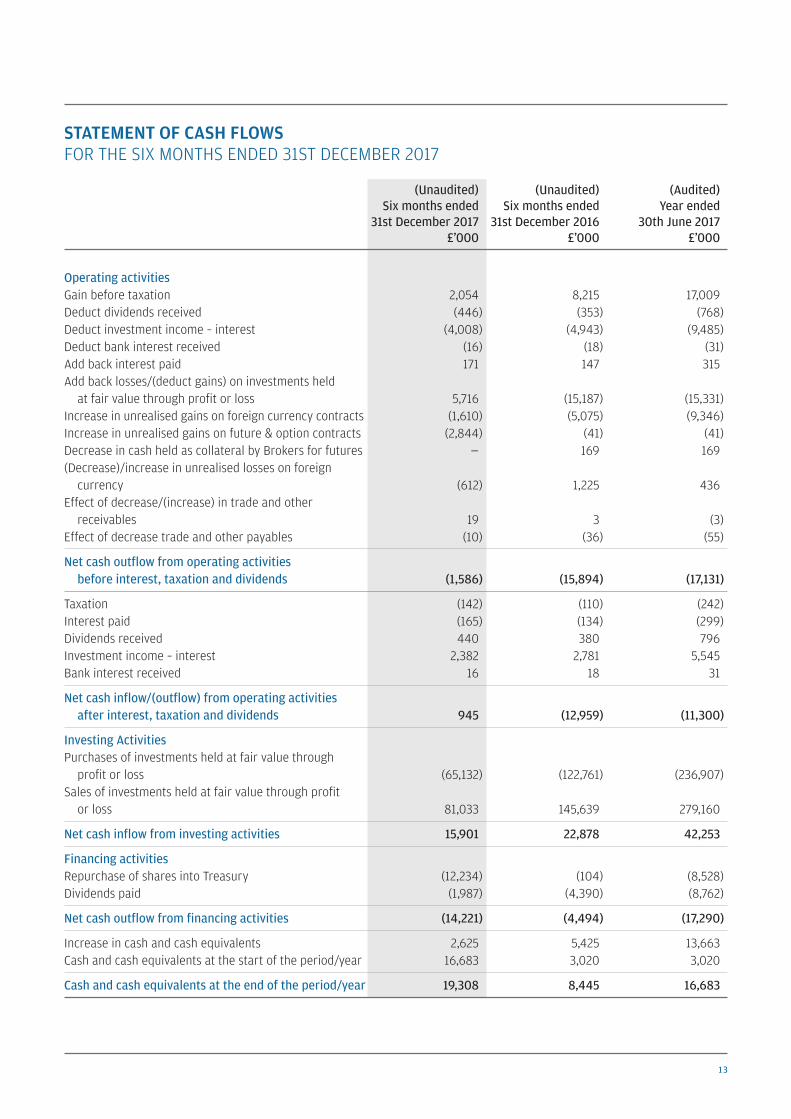
STATEMENT OF CASH FLOWS FOR THE SIX MONTHS ENDED 31ST DECEMBER 2017
(Unaudited) (Unaudited) (Audited) Six months ended Six months ended Year ended 31st December 2017 31st December 2016 30th June 2017 £’000 £’000 £’000
Operating activitiesGain before taxation 2,054 8,215 17,009Deduct dividends received (446) (353) (768)Deduct investment income – interest (4,008) (4,943) (9,485)Deduct bank interest received (16) (18) (31)Add back interest paid 171 147 315Add back losses/(deduct gains) on investments held
at fair value through profit or loss 5,716 (15,187) (15,331)Increase in unrealised gains on foreign currency contracts (1,610) (5,075) (9,346)Increase in unrealised gains on future & option contracts (2,844) (41) (41)Decrease in cash held as collateral by Brokers for futures — 169 169(Decrease)/increase in unrealised losses on foreign
currency (612) 1,225 436Effect of decrease/(increase) in trade and other
receivables 19 3 (3)Effect of decrease trade and other payables (10) (36) (55)
Net cash outflow from operating activities before interest, taxation and dividends (1,586) (15,894) (17,131)
Taxation (142) (110) (242)Interest paid (165) (134) (299)Dividends received 440 380 796 Investment income – interest 2,382 2,781 5,545 Bank interest received 16 18 31
Net cash inflow/(outflow) from operating activities after interest, taxation and dividends 945 (12,959) (11,300)
Investing ActivitiesPurchases of investments held at fair value through
profit or loss (65,132) (122,761) (236,907)Sales of investments held at fair value through profit
or loss 81,033 145,639 279,160
Net cash inflow from investing activities 15,901 22,878 42,253
Financing activitiesRepurchase of shares into Treasury (12,234) (104) (8,528)Dividends paid (1,987) (4,390) (8,762)
Net cash outflow from financing activities (14,221) (4,494) (17,290)
Increase in cash and cash equivalents 2,625 5,425 13,663Cash and cash equivalents at the start of the period/year 16,683 3,020 3,020
Cash and cash equivalents at the end of the period/year 19,308 8,445 16,683
14 JPMORGAN GLOBAL CONVERTIBLES INCOME FUND LIMITED. HALF YEAR REPORT & FINANCIAL STATEMENTS 2017
Financial Statements continued
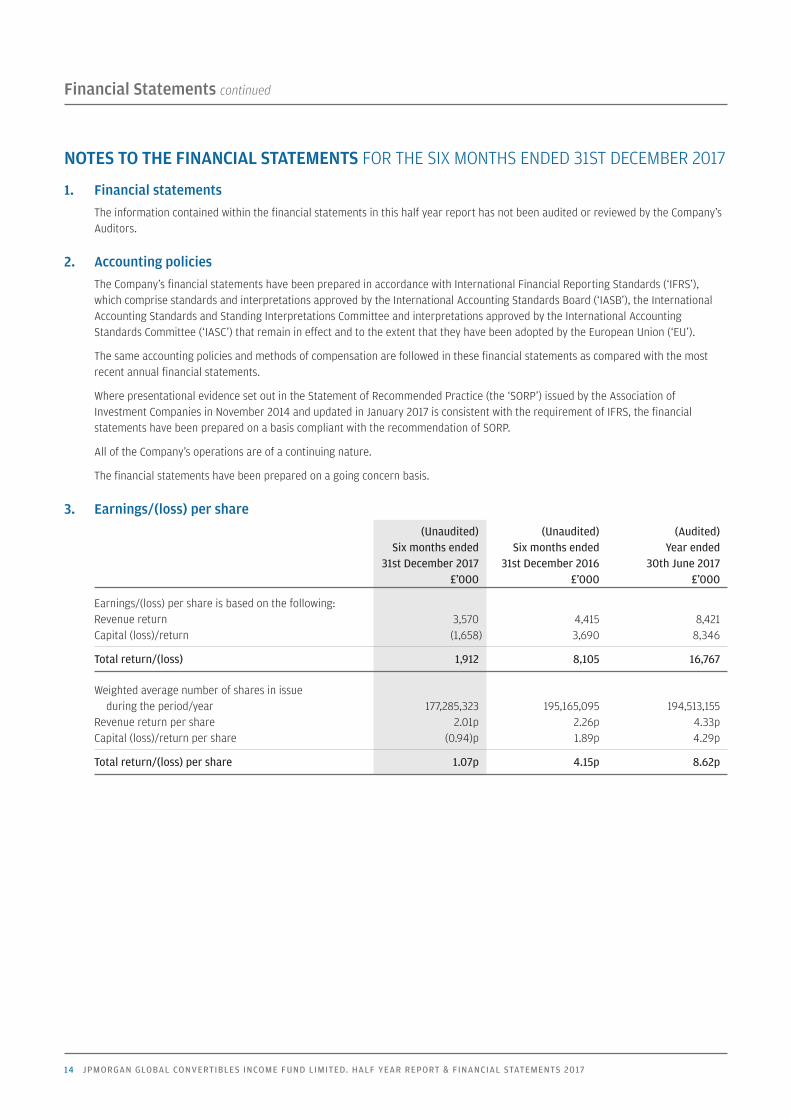
NOTES TO THE FINANCIAL STATEMENTS FOR THE SIX MONTHS ENDED 31ST DECEMBER 2017
1. Financial statementsThe information contained within the financial statements in this half year report has not been audited or reviewed by the Company’sAuditors.
2. Accounting policiesThe Company’s financial statements have been prepared in accordance with International Financial Reporting Standards (‘IFRS’),which comprise standards and interpretations approved by the International Accounting Standards Board (‘IASB’), the InternationalAccounting Standards and Standing Interpretations Committee and interpretations approved by the International AccountingStandards Committee (‘IASC’) that remain in effect and to the extent that they have been adopted by the European Union (‘EU’).
The same accounting policies and methods of compensation are followed in these financial statements as compared with the mostrecent annual financial statements.
Where presentational evidence set out in the Statement of Recommended Practice (the ‘SORP’) issued by the Association ofInvestment Companies in November 2014 and updated in January 2017 is consistent with the requirement of IFRS, the financialstatements have been prepared on a basis compliant with the recommendation of SORP.
All of the Company’s operations are of a continuing nature.
The financial statements have been prepared on a going concern basis.
3. Earnings/(loss) per share (Unaudited) (Unaudited) (Audited) Six months ended Six months ended Year ended 31st December 2017 31st December 2016 30th June 2017 £’000 £’000 £’000
Earnings/(loss) per share is based on the following:Revenue return 3,570 4,415 8,421Capital (loss)/return (1,658) 3,690 8,346
Total return/(loss) 1,912 8,105 16,767
Weighted average number of shares in issue during the period/year 177,285,323 195,165,095 194,513,155
Revenue return per share 2.01p 2.26p 4.33pCapital (loss)/return per share (0.94)p 1.89p 4.29p
Total return/(loss) per share 1.07p 4.15p 8.62p

15
4. Dividend paid (Unaudited) (Unaudited) (Audited) Six months ended Six months ended Year ended 31st December 2017 31st December 2016 30th June 2017 £’000 £’000 £’000
2017 fourth interim dividend 1.125p (2016: 1.125p) 1,987 2,196 2,1962017 first interim dividend of 1.125p — 2,194 2,1952017 second interim dividend of 1.125p — — 2,1952017 third interim dividend of 1.125p — — 2,176
Total dividends paid in the period/year 1,987 4,390 8,762
A first interim dividend of 1.125p per share, has been paid on 12th January 2018 in respect of the six months ended 31st December2017, costing £1,969,000.
5. Net asset value per share (Unaudited) (Unaudited) (Audited) 31st December 2017 31st December 2016 30th June 2017
Net assets (£’000) 175,563 192,249 185,820Number of shares in issue 173,891,767 195,072,770 184,191,791Net asset value per share 101.0p 98.6p 100.9p
6. Disclosures regarding financial instruments measured at fair valueThe disclosures required by the IFRS 13: ‘Fair Value Measurement’ are given below. The Company’s financial instruments within thescope of IFRS 13 that are held at fair value comprise its investment portfolio and derivative contracts.
The investments are categorised into a hierarchy consisting of the following three levels:
Level 1 – valued using unadjusted quoted prices in active markets for identical assets and liabilities.
Level 2 – valued by reference to valuation techniques using other observable inputs not included within Level 1.
Level 3 – valued by reference to valuation techniques using unobservable inputs.
Categorisation within the hierarchy has been determined on the basis of the lowest level input that is significant to the fair valuemeasurement of the relevant asset.
The recognition and measurement policies for financial instruments measured at fair value are consistent with those disclosed in thelast annual financial statements.

16 JPMORGAN GLOBAL CONVERTIBLES INCOME FUND LIMITED. HALF YEAR REPORT & FINANCIAL STATEMENTS 2017
Financial Statements continued
6. Disclosures regarding financial instruments measured at fair value continuedThe following tables set out the fair value measurements using the IFRS 13 hierarchy at the relevant period/year end:
31st December 2017 Level 1 Level 2 Level 3 Total £’000 £’000 £’000 £’000
Financial assets held at fair value through profit or lossInvestments: – Bonds 5,573 — — 5,573 – Convertibles 144,702 — — 144,702 – Convertible preference 15,478 — — 15,478
Total investments 165,753 — — 165,753
Derivative financial instruments:– Forward foreign currency contracts — 1,961 — 1,961 – Option contracts — 274 — 274 – ASCOTs1 — 2,570 — 2,570
Total 165,753 4,805 — 170,558
Financial liabilities held at fair value through profit or loss– Forward foreign currency contracts — (80) — (80)
Total — (80) — (80)
1 Asset Swapped Convertible Option Transaction.
30th June 2017 Level 1 Level 2 Level 3 Total £’000 £’000 £’000 £’000
Financial assets held at fair value through profit or lossInvestments: – Bonds 8,572 — — 8,572– Convertibles 165,932 — — 165,932– Convertible preference 10,503 — — 10,503
Total investments 185,007 — — 185,007
Derivative financial instruments:– Forward foreign currency contracts — 763 — 763
Total 185,007 763 — 185,770
Financial liabilities held at fair value through profit or loss– Forward foreign currency contracts — (492) — (492)
Total — (492) — (492)
The Company’s policy for determining transfers between levels is to ascertain the listing status at each period and for each investmentand determine if any changes have occurred that would necessitate a transfer.
There have been no transfers between Levels 1, 2 or 3 during the year.
NOTES TO THE FINANCIAL STATEMENTS CONTINUED

17
The Company is required to make the following disclosures in itsinterim report.
Principal Risks and UncertaintiesThe principal risks and uncertainties faced by the Company fall intothe following broad categories: investment and strategy; foreigncurrency; accounting; corporate governance and shareholderrelations; operational and financial. Information on each of theseareas is given in the Business Review within the 2017 Annual Reportand Accounts.
Related Party TransactionsDuring the half year to 31st December 2017, no new agreementswere entered into with related parties which have materiallyaffected the financial position or the performance of the Company.
Going ConcernThe Directors believe, having considered the Company’s investmentobjectives, risk management policies, capital management policiesand procedures, nature of the portfolio and expenditure projections,that the Company has adequate resources, an appropriate financialstructure and suitable management arrangements in place tocontinue in operational existence for the foreseeable future and,more specifically, that there are no material uncertaintiespertaining to the Company that would prevent its ability to continuein such operation existence for at least 12 months from the date ofthe approval of this half yearly financial report. For these reasons,they consider there is reasonable evidence to adopt the goingconcern basis in preparing the accounts.
Directors’ ResponsibilitiesThe Board of Directors confirms that, to the best of its knowledge:
(i) the condensed set of financial statements contained within theinterim financial report has been prepared in accordance withInternational Accounting Standard 34 ‘Interim FinancialReporting’ and gives a true and fair view of the state of affairsof the Company and of the assets, liabilities, financial positionand net return of the Company, as at 31st December 2017, asrequired by the UK Listing Authority Disclosure andTransparency Rules 4.2.4R; and
(ii) the interim report includes a fair review of the informationrequired by 4.2.7R (important events that have occurred sinceinception, their impact on these financial statements anda description of the principal risks facing the Company) and4.2.8R (related party transactions since inception that havematerially affected the financial position or performance of theCompany) of the UK Listing Authority Disclosure andTransparency Rules.
In order to provide these confirmations, and in preparing thesefinancial statements, the Directors are required to:
• select suitable accounting policies and then apply themconsistently;
• make judgements and accounting estimates that arereasonable and prudent;
• state whether applicable accounting standards have beenfollowed, subject to any material departures disclosed andexplained in the financial statements; and
• prepare the financial statements on the going concern basisunless it is inappropriate to presume that the Company willcontinue in business;
and the Directors confirm that they have done so.
For and on behalf of the Board
Simon MillerChairman 9th March 2018
INTERIM MANAGEMENT REPORT
Shareholder Information

18 JPMORGAN GLOBAL CONVERTIBLES INCOME FUND LIMITED. HALF YEAR REPORT & FINANCIAL STATEMENTS 2017
GLOSSARY OF TERMS AND ALTERNATIVE PERFORMANCE MEASURES (‘APMS’)
Return to shareholders (APM)Total return to the shareholder, on a last traded price to last traded price basis, assuming that all dividends received were reinvested,without transaction costs, into the shares of the Company at the time the shares were quoted ex-dividend.
Six months endedTotal return calculation Page 31st December 2017
Opening share price as at 30th June 2017 2 99.0pClosing share price as at 31st December 2017 2 97.0p (a)
Total dividend adjustment factor1 1.019189 (b)
Adjusted closing share price (c = a x b) 99.2p (c)
Total return to shareholder 0.2%
Return on Net Assets (APM)Total return on net asset value (‘NAV’) per share, on a bid value to bid value basis, assuming that all dividends paid out by the Company werereinvested, into the shares of the Company at the NAV per share at the time the shares were quoted ex-dividend.
Six months endedTotal return calculation Page 31st December 2017
Opening cum-income NAV per share as at 30th June 2017 2 100.9p
Closing cum-income NAV per share as at 31st December 2017 2 101.0p(–) the 2018 1st interim dividend of 1.125p declared but not paid pre 31st December 2017 2 (1.13)p
Adjusted closing cum-income NAV per share as at 31st December 2017 99.9p (a)
Total dividend adjustment factor2 1.022562 (b)
Adjusted closing cum-income NAV per share (c = a x b) 102.1p (c)
Total return on net assets 1.2%
1 The dividend adjustment factor is calculated on the assumption that the dividends paid out by the Company are reinvested into the shares of the Company at the last traded pricequoted at the ex-dividend date.
2 The dividend adjustment factor is calculated on the assumption that the dividends paid out by the Company are reinvested into the shares of the Company at the cum-income NAVat the ex-dividend date.
Benchmark returnTotal return on the benchmark, on a closing-market value to closing-market value basis, assuming that all dividends received werereinvested in the shares of the underlying companies at the time the shares were quoted ex-dividend.
The benchmark is a recognised index of stocks which should not be taken as wholly representative of the Company’s investment universe.The Company’s investment strategy does not follow or ‘track’ this index and consequently, there may be some divergence between theCompany’s performance and that of the benchmark.
Gearing/Net Cash (APM)Gearing represents the excess amount above shareholder’s funds of total investments, expressed as a percentage of the shareholders’ funds.If the amount calculated is negative, this is shown as a ‘net cash’ position. 31st December 2017 30th June 2017Gearing calculation Page £’000 £’000
Investments held at fair value through profit or loss 12 165,753 185,007 (a)
Net assets 12 175,563 185,820 (b)
Gearing/(net cash) (c = a / b – 1) (5.6)% (0.4)% (c)
Shareholder Information continued
19
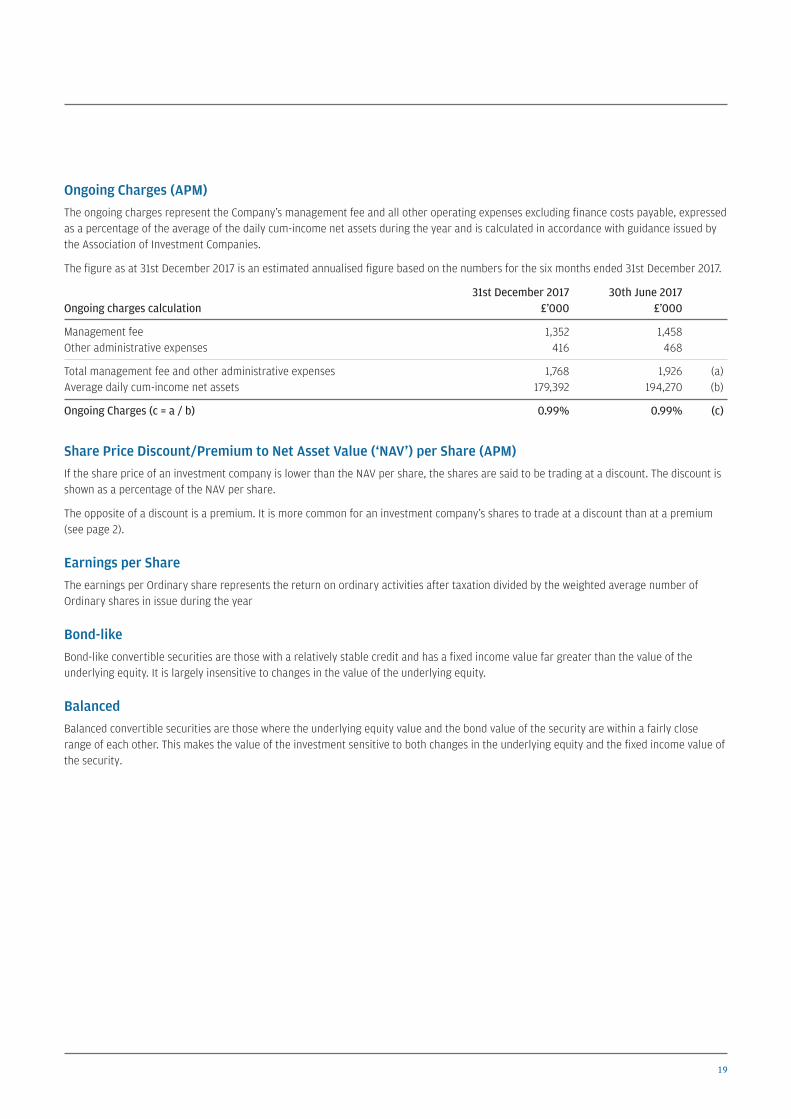
Ongoing Charges (APM)The ongoing charges represent the Company’s management fee and all other operating expenses excluding finance costs payable, expressedas a percentage of the average of the daily cum-income net assets during the year and is calculated in accordance with guidance issued bythe Association of Investment Companies.
The figure as at 31st December 2017 is an estimated annualised figure based on the numbers for the six months ended 31st December 2017.
31st December 2017 30th June 2017Ongoing charges calculation £’000 £’000
Management fee 1,352 1,458 Other administrative expenses 416 468
Total management fee and other administrative expenses 1,768 1,926 (a)Average daily cum-income net assets 179,392 194,270 (b)
Ongoing Charges (c = a / b) 0.99% 0.99% (c)
Share Price Discount/Premium to Net Asset Value (‘NAV’) per Share (APM)If the share price of an investment company is lower than the NAV per share, the shares are said to be trading at a discount. The discount isshown as a percentage of the NAV per share.
The opposite of a discount is a premium. It is more common for an investment company’s shares to trade at a discount than at a premium(see page 2).
Earnings per ShareThe earnings per Ordinary share represents the return on ordinary activities after taxation divided by the weighted average number ofOrdinary shares in issue during the year
Bond-likeBond-like convertible securities are those with a relatively stable credit and has a fixed income value far greater than the value of theunderlying equity. It is largely insensitive to changes in the value of the underlying equity.
BalancedBalanced convertible securities are those where the underlying equity value and the bond value of the security are within a fairly closerange of each other. This makes the value of the investment sensitive to both changes in the underlying equity and the fixed income value ofthe security.

20 JPMORGAN GLOBAL CONVERTIBLES INCOME FUND LIMITED. HALF YEAR REPORT & FINANCIAL STATEMENTS 2017
Shareholder Information continued
Avoid investment fraud1 Reject cold calls
If you’ve received unsolicited contact about an investment opportunity, chances are it’s a high risk investment or a scam. You should treat the call with extreme caution. The safest thing to do is to hang up.
2 Check the FCA Warning List The FCA Warning List is a list of �rms and individuals we know are operating without our authorisation.
3 Get impartial advice Think about getting impartial �nancial advice before you hand over any money. Seek advice from someone unconnected to the �rm that has approached you.
Report a ScamIf you suspect that you have been approached by fraudsters please tell the FCA using the reporting form at www.fca.org.uk/consumers/report-scam-unauthorised-�rm. You can also call the FCA Consumer Helpline on 0800 111 6768
If you have lost money to investment fraud, you should report it to Action Fraud on 0300 123 2040 or online at www.actionfraud.police.uk
Find out more at www.fca.org.uk/scamsmart
Investment scams are designed to look like genuine investmentsSpot the warning signs
Have you been:
• contacted out of the blue• promised tempting returns
and told the investment is safe• called repeatedly, or• told the offer is only available
for a limited time?
If so, you might have been contacted by fraudsters. Remember: if it sounds too good to be true,
it probably is!
Be ScamSmart
WHERE TO BUY J.P. MORGAN INVESTMENT TRUSTS
You can invest in a J.P. Morgan investment trust through the following:
1. Directly from J.P. MorganInvestment AccountThe Company’s shares are available in the J.P. Morgan InvestmentAccount, which facilitates both regular monthly investments andoccasional lump sum investments in the Company’s ordinary shares.Shareholders who would like information on the Investment Accountshould call J.P. Morgan Asset Management free on 0800 20 40 20 orvisit its website at am.jpmorgan.co.uk/investor
Stocks & Shares Individual Savings Accounts (ISA)The Company’s shares are eligible investments within a J.P. MorganISA. For the 2017/18 tax year, from 6th April 2017 and ending 5th April2018, the total ISA allowance is £20,000. The shares are also availablein a J.P. Morgan Junior ISA. Details are available from J.P. Morgan AssetManagement free on 0800 20 40 20 or via its website atam.jpmorgan.co.uk/investor
2. Via a third party provider Third party providers include:
Please note this list is not exhaustive and the availability of individualtrusts may vary depending on the provider. These websites are thirdparty sites and J.P. Morgan Asset Management does not endorse orrecommend any. Please observe each site’s privacy and cookie policiesas well as their platform charges structure.
3. Through a professional adviserProfessional advisers are usually able to access the products of all thecompanies in the market and can help you find an investment thatsuits your individual circumstances. An adviser will let you know thefee for their service before you go ahead. You can find an adviser atunbiased.co.uk
You may also buy investment trusts through stockbrokers, wealthmanagers and banks.
To familiarise yourself with the Financial Conduct Authority (FCA)adviser charging and commission rules, visit fca.org.uk
AJ BellAlliance Trust SavingsBarclays StockbrokersBestinvestCharles Stanley DirectFundsNetwork
Hargreaves LansdownInteractive InvestorJames BrearleyJames HaySelftradeThe Share Centre
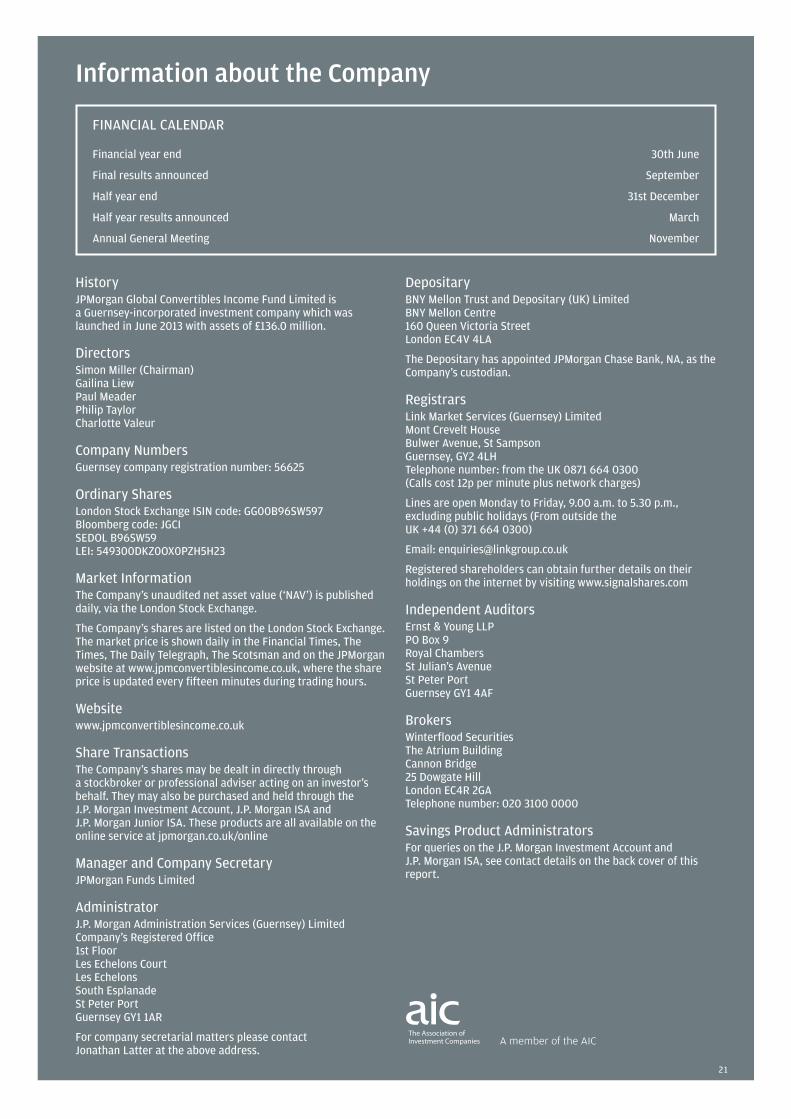
HistoryJPMorgan Global Convertibles Income Fund Limited isa Guernsey-incorporated investment company which waslaunched in June 2013 with assets of £136.0 million.
DirectorsSimon Miller (Chairman)Gailina LiewPaul MeaderPhilip Taylor Charlotte Valeur
Company NumbersGuernsey company registration number: 56625
Ordinary SharesLondon Stock Exchange ISIN code: GG00B96SW597Bloomberg code: JGCISEDOL B96SW59LEI: 549300DKZ0OX0PZH5H23
Market InformationThe Company’s unaudited net asset value (‘NAV’) is publisheddaily, via the London Stock Exchange.
The Company’s shares are listed on the London Stock Exchange.The market price is shown daily in the Financial Times, TheTimes, The Daily Telegraph, The Scotsman and on the JPMorganwebsite at www.jpmconvertiblesincome.co.uk, where the shareprice is updated every fifteen minutes during trading hours.
Websitewww.jpmconvertiblesincome.co.uk
Share TransactionsThe Company’s shares may be dealt in directly througha stockbroker or professional adviser acting on an investor’sbehalf. They may also be purchased and held through theJ.P. Morgan Investment Account, J.P. Morgan ISA andJ.P. Morgan Junior ISA. These products are all available on theonline service at jpmorgan.co.uk/online
Manager and Company SecretaryJPMorgan Funds Limited
AdministratorJ.P. Morgan Administration Services (Guernsey) LimitedCompany’s Registered Office1st FloorLes Echelons CourtLes EchelonsSouth EsplanadeSt Peter PortGuernsey GY1 1AR
For company secretarial matters please contactJonathan Latter at the above address.
DepositaryBNY Mellon Trust and Depositary (UK) LimitedBNY Mellon Centre160 Queen Victoria StreetLondon EC4V 4LA
The Depositary has appointed JPMorgan Chase Bank, NA, as theCompany’s custodian.
RegistrarsLink Market Services (Guernsey) LimitedMont Crevelt HouseBulwer Avenue, St SampsonGuernsey, GY2 4LHTelephone number: from the UK 0871 664 0300(Calls cost 12p per minute plus network charges)
Lines are open Monday to Friday, 9.00 a.m. to 5.30 p.m.,excluding public holidays (From outside the UK +44 (0) 371 664 0300)
Email: [email protected]
Registered shareholders can obtain further details on theirholdings on the internet by visiting www.signalshares.com
Independent AuditorsErnst & Young LLPPO Box 9Royal ChambersSt Julian’s AvenueSt Peter PortGuernsey GY1 4AF
BrokersWinterflood SecuritiesThe Atrium Building Cannon Bridge25 Dowgate HillLondon EC4R 2GATelephone number: 020 3100 0000
Savings Product AdministratorsFor queries on the J.P. Morgan Investment Account andJ.P. Morgan ISA, see contact details on the back cover of thisreport.
Information about the Company
FINANCIAL CALENDAR
Financial year end 30th June
Final results announced September
Half year end 31st December
Half year results announced March
Annual General Meeting November
A member of the AIC
21

GB I113 03/18
www.jpmconvertiblesincome.co.uk
Telephone calls may be recorded and monitored for security and training purposes.
J.P. MORGAN HELPLINE
Freephone 0800 20 40 20 or +44 (0) 1268 444470.Telephone lines are open Monday to Friday, 9am to 5.30pm.