jte - v26n1 - complete issue - virginia tech · journal of technology education vol. 26 no. 1, fall...
TRANSCRIPT

Journal of Technology Education Vol. 26 No. 1, Fall 2014
-1-
Contents Articles 2 Exploring the Proposition of a Joint Conference Between State Science,
and Technology and Engineering Education Associations Tyler S. Love & Thomas Loveland 22 Identifying Perceptions That Contribute to the Development of
Successful Project Lead the Way Pre-Engineering Programs in Utah Keith McMullin & Edward Reeve 47 Advancing STEM Career and Learning Through Civic Engagement Yichun Xie 64 Technology and Engineering Education Accommodation Service
Profile: An Ex Post Facto Research Design Jeremy V. Ernst & Thomas O. Williams Jr. 75 Building a Framework for Engineering Design Experiences in High
School Cameron D. Denson & Matthew Lammi 88 A Comparative Analysis of Spatial Visualization Ability and Drafting
Models for Industrial and Technology Education Students Petros Katsioloudis, Vukica Jovanovic, & Mildred Jones Book Review 102 Open Educational Resources: Innovation, Research and Practice
Raidell Avello-Martínez Miscellany 104 Scope of the JTE Editorial Review Process Manuscript Submission Guidelines Subscription Information JTE Co-sponsors and Membership Information JTE Editorial Review Board Electronic Access to the JTE

Journal of Technology Education Vol. 26 No. 1, Fall 2014
-2-
Exploring the Proposition of a Joint Conference Between State Science, and Technology and
Engineering Education Associations
One of the key sessions presented at the co-located 2012 Mississippi Valley Technology Teacher Education Conference (MVTTEC) and Southeast Technology Education Conference (STEC) held in Nashville, Tennessee was Perspectives of the Future of Technology Education Professional Associations (Busby, 2012). Three reasons affecting declining conference attendance were highlighted: demographics, technology, and the economy. Professional teacher association conferences are a yearly gathering of members, whether at the state, national or international level. Joint or collaborative conferences occur when more than one professional association decides to join forces with another association to hold a combined conference. The organizations make these decisions at the board level and in conjunction with other organizations with similar or overlapping content. In 2013, the boards of the Technology and Engineering Educator Association of Maryland (TEEAM) and the Maryland Association of Science Teachers (MAST) decided to hold a joint annual professional development conference after years of declining attendance (Figure 1) and low vendor participation (Figure 2). The overlapping content shared by the two organizations was Science, Technology, Engineering, and Mathematics or STEM, and their intersecting mission was to promote and deliver STEM to Maryland students. The result of this decision was an increase in overall attendance and a 30 percent increase in total vendor participation.
Why do professional associations find themselves in this situation of declining interest in conferences and what should they do about it? What are professional associations doing in other states? What benefits accrue to attendees at joint conferences? The answers to these questions can help provide guidance to professional teacher associations in more than just the fields of science, and technology and engineering (T&E) education. Tyler S. Love ([email protected]) is a Doctoral Candidate in the Integrative STEM Education Program at Virginia Tech. Thomas Loveland ([email protected]) is Coordinator of Graduate Studies in the Department of Technology at the University of Maryland Eastern Shore.

Journal of Technology Education Vol. 26 No. 1, Fall 2014
-3-
Figure 1. Summary of past Maryland Association of Science Teachers (MAST) and Technology and Engineering Educators Association of Maryland (TEEAM) conference attendance. Note: In 2010 MAST held their annual conference as part of the National Science Teachers Association (NSTA)’s area conference in Baltimore, therefore there was no way to extract a valid MAST attendance number for this year. For the 2013 joint conference, attendees were given the option to purchase an annual membership to MAST, TEEAM, both, or none of the associations during registration.
Figure 2. Summary of past MAST and TEEAM conference vendors participating. In 2010, neither MAST nor TEEAM solicited vendors for their conferences.
71
26 125 124 100 95
35
116
80 69 40
0255075
100125150175200225250
2009 2010 2011 2012 2013
Atte
ndan
ce
Year
Conference Attendance
MAST
TEEAM
BOTH
NONE
30
15
0 14 14
10 10 9
0
10
20
30
2009 2010 2011 2012 2013
Vend
ers
Year
Conference Vendors Participation
MAST
TEEAM
JOINT

Journal of Technology Education Vol. 26 No. 1, Fall 2014
-4-
Background and Purpose Professional teacher associations at the national and state level were formed
to provide a means for teachers to network with other professionals, share resources and knowledge, increase professional development for members, broaden the impact in the field, and increase influence in society (Arendale et al., 2009; Paino & Briskin, 2012). The International Technology and Engineering Educators Association (ITEEA), American Association for the Advancement of Science (AAAS), National Science Teachers Association (NSTA), and the National Council for Teachers of Mathematics (NCTM) are national associations linked to STEM education. At the state level, teacher organizations like TEEAM and MAST represent content teachers and promote their fields statewide. Activities by professional associations may include a statewide central office, legislative lobbying, yearly or monthly publications, workshops, and an annual state professional development conference.
Professional development conferences include general business meetings, committee meetings, awards events, workshops, vendor showcase, and opportunities for attendees to network. Conferences provide attendees many benefits including the opportunity to listen to other experts, present research and classroom applications, get involved in the organization, and access resources (Hickson, 2006). Bell (2009) discusses two components of social support from conference attendance: affective and instrumental. Affective support occurs from meeting colleagues and friends while sharing a positive experience. Instrumental support occurs from learning new instructional strategies and processes from attending workshops, visiting vendors, and discussing technological solutions with other attendees in formal and informal settings. Cherrstrom (2012) emphasizes the ability of attendees to advance their content knowledge, skills, and careers. For new attendees, a greater understanding of the depth and breadth in the content field often results. The level of benefit received is tied to whether the participation is that of a spectator, consumer, or constructor. At the highest level, constructor, the attendee identifies conference connections and maximizes their experience.
McAlister (2012) researched members of the Mississippi Valley Technology Teacher Education Conference (MVTTEC) and found that benefits of professional conference attendance were grouped in three areas: ability to gain information while staying up-to-date, making personal and professional connections, and valuing the opportunity for discussion and exchange of new ideas. Hickson (2006) elaborated on these ideas by discussing the concept of a contagion effect. Attendees who present at conference sessions or panels become more excited and enthusiastic about doing research. These experiences in younger attendees can have a positive relationship on their future productivity as publishers of research. With so many documented benefits, professional organization conferences should be overflowing with attendees. Is this the case?

Journal of Technology Education Vol. 26 No. 1, Fall 2014
-5-
Attendance at national and state professional conferences has been trending down for some time. One of the main reasons is the cost of attendance which may include registration, travel, overnight accommodations, meals, and special conference costs (McAlister, 2013). For many teachers and teacher educators, the source of travel funding at the departmental level is drying up (Arendale et al., 2009, Bell, 2009, Cherrstrom, 2012, Hickson, 2006). In addition, at the state level, professional association conferences may be scheduled on the state in-service date. Many school districts opt to hold their own in-service training in county, thereby blocking teachers from going to their state content conferences.
The authors surveyed state technology and engineering education professional association presidents, who indicated declining enrollments and economic efficiency as a main reason for considering what form of professional development conference to organize. Twenty presidents from an identified list of 40 state technology education associations responded to the survey. Ten of the 20 state association presidents indicated that they are currently holding joint conferences with other content areas of career and technical education, STEM, manufacturing and engineering, agriculture education, or graphics and communications. Reasons for joint professional development conferences included increased attendance, commonality of issues, overlapping content, and mutual dependence for survival. One concern raised was how to equitably distribute conference income.
Joint or collaborative professional conferences between associations have resulted from these points. At the national level, every three years the MVTTEC holds a co-located conference with the STEC. The MVTTEC was traditionally organized around the states touching the Mississippi River and the STEC organization was located in the southeastern United States. Declining attendance and the need for economic efficiencies prompted both organizations to begin co-located conferences.
District supervisors from science and technology and engineering education who attended the combined MAST and TEEAM conference in Maryland indicated that the inclusion of engineering design standards in the Next Generation Science Standards (NGSS, 2013) and national emphasis on the Common Core State Standards (CCSS, 2012) made for increased collaboration and discussion by teachers and supervisors. An anonymous science supervisor in attendance stated:
There's an engineering piece in the NGSS that a lot of science teachers I don't think feel as comfortable with. I think it puts us with people who are much more comfortable with that and allows us to really naturally collaborate the way STEM educators can (personal communication, October 18, 2013).

Journal of Technology Education Vol. 26 No. 1, Fall 2014
-6-
Statement of the Problem State teacher associations may consider holding collaborative professional
development conferences with other associations. Information about the economic benefits of co-joining conferences is clear. What is not clear is whether there are other benefits of professional development in a collaborative environment among state associations. The following research questions helped guide the study to focus on this issue. Research Questions
RQ1: How do Maryland Science and Technology and Engineering (T&E) education teachers and administrators/supervisors perceive the value of a joint conference?
RQ2: To what extent do science and T&E education professionals (teachers and administrators/supervisors) attend conference sessions outside of their field?
RQ3: As the result of a joint conference, do science and T&E education professionals report an identifiable difference in understanding and application of content within and outside of their content fields?
RQ4: What perceptions do Maryland science and T&E professionals have regarding the value of joint conferences at the national level?
Study Participants
Participation in the study was open to anyone whom attended the first annual MAST/TEEAM joint conference in October 2013. Specifically, the participants were K-12 teachers, supervisors, and vendors from a variety of STEM disciplines, mostly science and technology and engineering education. Of the 172 individuals that attended the conference, 76 teachers, administrators, and supervisors, as well as 23 vendors voluntarily participated in the surveys. There were also 14 individuals that voluntarily participated in interviews. This conference sample was chosen based on the unique collaborative environment created by holding a joint conference for the first time between the science education and the technology and engineering education professional associations in Maryland. Table 1 and Table 2 provide general demographic information collected about the attendees, vendors, and interviewees. From the 76 survey responses, nine self-identified as “other” or “multiple” content areas were eliminated from the data set to ensure a clean distinction between science and T&E professionals. This resulted in a total of 67 attendee responses to analyze. The majority of science (62%) and T&E attendees (55%) that participated in the study were between the ages of 31-50 (Generation X), while the Baby Boomer generation (51 and above) made up the next largest portion of responses, and Generation Y (21-30) had the least amount of responses. Both the majority of science (55%) and T&E (70%) responses were predominantly professionals working at the high school level, and most were

Journal of Technology Education Vol. 26 No. 1, Fall 2014
-7-
teachers of science (89%) or T&E (67%). Among the entire sample, the mean number of years that attendees reported working in science and technology and engineering education was approximately 14. Within the past 3 years, 23% of the participants had attended a MAST conference and 27% had attended a TEEAM conference. Table 1 Science Attendee Survey Demographics
Age Range
n – (%) Position n – (%) Grade Level n – (%)
21-30 7 – (16%) Teacher 39 – (89%) Elementary 11 – (13%) 31-50 28 – (62%) Administrator/
Supervisor 5 – (11%) Middle School 27 – (32%)
51+ 10 – (22%) High School 46 – (55%) Note. The grade level column refers to the grades taught by teachers, and supervised by administrators. Table 2
Technology and Engineering Attendee Survey Demographics Age
Range n – (%) Position n – (%) Grade Level n – (%)
21-30 2 – (9%) Teacher 18 – (67%) Elementary 0 – (0%) 31-50 12 – (55%) Administrator/
Supervisor 4 – (33%) Middle School 7 – (30%)
51+ 8 – (36%) High School 16 – (70%) Note. The grade level column refers to the grades taught by teachers, and supervised by administrators.
Individuals were purposefully selected for face-to-face interviews based on their content area to ensure a good breadth of disciplines represented. The interviews were conducted at the conference with two science teachers, three T&E teachers, three science administrators/supervisors, three T&E administrators/supervisors, two science vendors, and one T&E education vendor.
Methodology Permission to collect data at the first annual MAST/TEEAM conference
was granted by the MAST and TEEAM conference board committees. Approval to use the retrospective pretest instrument (called pre-posttest instrument for this study) was obtained from Jeff Allen, and approval to conduct research using human subjects was obtained from the Institutional Review Board at Virginia Tech. The research design employed a convergent, sequential mixed methods design (Creswell & Plano-Clark, 2011) with mixing occurring only at the analysis phase. This method was used because it allowed the researchers to better understand the perceptions of teachers, administrators, and vendors regarding joint conferences by triangulating quantitative survey data

Journal of Technology Education Vol. 26 No. 1, Fall 2014
-8-
with rich, in-depth detail from qualitative interviews (Creswell & Plano-Clark, 2011; Tillotson & Young, 2013).
Items in the retrospective pre-posttest survey instrument developed by Allen and Nimon (2007) were adapted by adding the words “science education” or “technology and engineering education” to address research questions 1 and 3, and examine attendees’ perceptions of a joint STEM conference. A panel of state and county supervisors, college faculty, and veteran teachers from MAST and TEEAM reviewed the instrument before it was disseminated to conference attendees. Allen and Nimon (2007) demonstrated that the instrument’s scale and subscales for assessing conferences through a retrospective method had strong reliability scores with alphas ranging from 0.788 to 0.970. Also, it is applicable to STEM education conferences, “Because this instrument was designed to be content neutral, its application extends across disciplines” (p. 38). The survey instrument consisted of 25 questions (8 demographic and 17 conference evaluations) and on average took participants 10 minutes to complete. It was comprised mainly of questions in multiple-choice format, along with questions utilizing a five-point Likert scale to measure the perceived learning gains derived from the difference in retrospectively reported pre to post-conference scores. Additionally there were a few questions allowing the opportunity for participants to explain their multiple-choice selection. Of the 17 survey questions, six measured reaction to the conference, six measured post-conference gains, and five measured perceptions about joint conferences. It was administered using Qualtrics, and solicited to attendees with a flyer displaying the survey link as well as a QR code when they registered at the conference site. This yielded 92 responses from the 172 attendees, 16 which were eliminated due to incompletion, and nine identified as multiple or other content areas were also removed from the data set to ensure two distinct groups (science and T&E professionals) could be identified to best examine the research questions relative to the scope of this study (investigating differences in perceived learning gains among science and T&E professionals as a result of a joint conference). This was not deemed to have a substantial impact on the findings due to the small sample (n=9) of professionals who identified as multiple or other content areas. The final result was a 39% response rate (67/172), which was considered to be fairly strong based on Nulty’s (2008) analysis of online response rates.
Cronbach’s Alpha was used to evaluate the reliability of the adapted instrument as Allen and Nimon (2007) determined the reliability of the original instrument. The alpha for the entire adapted instrument was determined to be 0.919, with alpha values for the conference reaction items resulting in 0.868. The retrospective conference learning questions produced an alpha of 0.773, while the post conference learning questions elicited an alpha of 0.900. These alpha scores determined that the instrument was reliable to use for assessing learning that resulted from this conference.
Journal of Technology Education Vol. 26 No. 1, Fall 2014
-9-
Research Questions 2 and 4 were evaluated through supplemental questioning of participants. During the conference one of the researchers used purposeful sampling to ensure a good mix of teachers, administrators/supervisors, and vendors from science and T&E education for the interviews. The interviews were recorded and emergent themes from each were discussed among the researchers to build consensus. After the quantitative analysis was completed, the researchers mixed the qualitative interview responses with the quantitative data to provide more detailed explanations that were not elicited from the survey responses alone.
The mixing of data collected from attendee surveys, vendor surveys, attendee and vendor interviews, conference registration, and a survey of presidents from state professional T&E education associations strengthened the findings of the study, and could contribute to future research examining the validity of the instrument. All of these data collection methods were mixed after analyzing them separately, and they all displayed similar results regarding joint conferences and collaboration among science and T&E education professional associations. The individual analysis and mixing of these various data collection methods are described in the following section.
Data Analysis and Findings
Quantitative Data Analysis
It was determined that a Wilcoxon matched pairs test was best suited for the data analysis in this study since the researchers could not guarantee a normally distributed sample was used in relation to the entire population of science and T&E professionals in Maryland. A test examining Cohen’s d for a post hoc matched pairs Wilcoxon test was conducted using the G*Power software, and used to analyze the power of the sample size obtained from the retrospective pre-posttest. From this power analysis it was indicated that the test as administered with 67 participants, would have a strong d (0.87) (Prajapati, Dunne, & Armstrong, 2010) and it was acceptable to continue data analysis procedures by conducting Wilcoxon tests. Wilcoxon hypotheses tests were conducted using SPSS to determine if there were statistical differences between teachers’ and administrators’/supervisors’ perceptions, and science and T&E professionals’ perceptions of a joint conference. These tests were also conducted to examine the differences between science and T&E educators’ understanding of science and T&E content, ability to demonstrate comprehension of science and T&E content, and ability to apply science and T&E content. The differences between pre and post scores were calculated from participant responses, and then paired with other difference scores either within or outside of the professionals’ content fields. For example, reported differences of science professionals’ understanding of science content were analyzed for significantly different gains from T&E professionals’ reported differences in understanding

Journal of Technology Education Vol. 26 No. 1, Fall 2014
-10-
of T&E content (both within their content fields). In addition, perceived gains in science professionals’ understanding of T&E content and T&E professionals’ understanding of science content (outside of their content fields) were analyzed. This analysis process was conducted for all questions examining overall conference perceptions and differences in post-conference gains. The critical alpha value was set at 0.05 for these tests.
The first evaluated null hypothesis was: There is no difference in perceptions of a joint conference between teachers and administrators/supervisors. This hypothesis was evaluated in Table 3 using a Wilcoxon matched pairs test. The p-value (0.705) was determined to be greater than 0.05, therefore the null hypothesis failed to be rejected. The analysis of data suggests that there is no statistically significant difference between teachers’ and administrators’/supervisors’ perceptions of a joint conference; however, they both favorably rated the conference a four on a five point Likert-type scale. Table 3 Wilcoxon Matched Pairs Test for Difference Over Time on Perception of a Joint Conference Between Positions Group n Median IQR Test Stat. p Teachers 57 4.0 1 -0.378 0.705 Administrators/ Supervisors
9 4.0 0.5
The second null hypothesis which investigated the perceptions between
science and T&E professionals regarding a joint conference was: There is no difference in perceptions of a joint conference between science and T&E education professionals. Again a Wilcoxon matched pairs test was used to analyze the data (Table 4). Since the analysis of science and T&E professionals’ perceptions of a joint conference resulted in a p-value (0.130) above 0.05, the null hypothesis failed to be rejected. Despite both professional groups again reporting high median scores (4), it was determined that there was no statistical difference between science and T&E professionals’ perceptions of a joint conference. Once more, professionals from both groups identified a consistent level of perceived benefit from the conference. Table 4 Wilcoxon Matched Pairs Test for Difference Over Time on Perception of a Joint Conference Between Content Areas Group n Median IQR Test Stat. p Science 45 4.0 1 -1.513 0.130 T&E 22 4.0 0

Journal of Technology Education Vol. 26 No. 1, Fall 2014
-11-
The second research question was developed by the researchers as a supplemental question and added to the retrospective survey instrument. It identified that overall 40 percent (27/67) of conference attendees attended sessions primarily in their content area, 54 percent (36/67) attended mixed sessions, and six percent (4/67) attended sessions primarily out of their content area. Both science and T&E professionals primarily attended mixed sessions, however T&E professionals were more willing to attend sessions that were mixed or outside of their content area (14/22, 64%) than science professionals (25/44, 57%) as displayed in Figure 3.
Figure 3. Responses from science and T&E attendees regarding what types of sessions they attended in relation to their content area.
To investigate the third research question of whether science and T&E education professionals reported an identifiable difference in perception of understanding and the application of content within and outside of their fields, three different null hypotheses were tested with Wilcoxon matched pairs tests. The first null hypothesis was: Science and T&E professionals do not report significant differences among increased understanding of the content within and outside of their fields from attending the joint conference. In Table 5 the p-value of differences among science and T&E professionals’ understanding of content within their content fields (0.034) signify that there is a statistically significant difference between each groups’ perceived gains in understanding of content within of their field, failing to reject the null hypothesis. Further analysis of the professional groups (Table 6) did not report a statistically significant difference in gains (0.257) regarding understanding of content outside of their fields.
19
24
1
8 11
3
0
5
10
15
20
25
In Content Area Mixed Outside ContentArea
Content Area of Sessions Attended
Science
T&E

Journal of Technology Education Vol. 26 No. 1, Fall 2014
-12-
Therefore, in regards to understanding of content outside of their fields, the null hypothesis was not rejected. While analyses of the professional groups only reported significantly different gains in understanding content within their fields, an identifiable difference was seen between the pre and post median scores for both professional groups outside of their content fields.
Table 5 Wilcoxon Matched Pairs Test for Difference Over Time on Perceived Understanding of Content Within Their Content Fields Group n Pre Median Post Median IQR Test Stat. p Science 44 4.0 4.0 0 -2.121 0.034 T&E 21 4.0 4.0 1 Table 6 Wilcoxon Matched Pairs Test for Difference Over Time on Perceived Understanding of Content Outside of Their Content Fields Group n Pre Median Post Median IQR Test Stat. p Science 44 3.0 4.0 1 -1.134 0.257 T&E 21 3.0 4.0 1
Two more hypotheses were generated to explore whether science and T&E
education professionals reported an identifiable difference in their perceived ability to demonstrate comprehension and application of content. These are different than the previous hypothesis which analyzed the perceived understanding of pure content. The second null hypothesis was: Science and T&E teachers do not report significant differences in increased ability to demonstrate comprehension of content within and outside of their fields from attending the joint conference. The ability to demonstrate comprehension of content may be exhibited through methods such as verbal questioning or standardized testing. Table 7 displays the analysis of data indicating a statistically significant difference reported by the groups of science and T&E professionals’ perceived ability to demonstrate comprehension of content within their fields (0.014), again rejecting the null hypothesis. In addition to the significant difference, T&E professionals’ pre and post median scores showed an increase, while the scores of science professionals remained constant. An analysis of the responses of the professional groups in Table 8 indicated no statistically significant (0.796) difference outside of their fields, causing the researchers to fail to the reject the null hypothesis regarding differences in the ability of both groups to demonstrate comprehension of content outside of their fields. Unlike the analysis within their fields, there was no identifiable difference among pre and post median scores outside of the content field for either professional group as a result of the joint conference.

Journal of Technology Education Vol. 26 No. 1, Fall 2014
-13-
Table 7 Wilcoxon Matched Pairs Test for Difference Over Time on Perceived Ability to Demonstrate Comprehension of Content Within Their Content Fields Group n Pre Median Post Median IQR Test Stat. p Science 44 4.0 4.0 0 -2.449 0.014 T&E 21 4.0 5.0 1 Table 8 Wilcoxon Matched Pairs Test for Difference Over Time on Perceived Ability to Demonstrate Comprehension of Content Outside Their Content Fields Group n Pre Median Post Median IQR Test Stat. p Science 44 3.0 3.0 1 -0.258 0.796 T&E 21 3.0 3.0 1
The final hypothesis investigating research question three examined the
reported ability of science and T&E professionals to apply science or T&E content. This hypothesis differed from the previous two in its examination of science and T&E professionals’ perceptions of how well they could apply content, within and outside of their field, to situations or problems in their classroom such as labs or engineering design activities. It was tested with the following null hypothesis: Science and T&E teachers do not indicate significant differences of increased abilities to apply content within and outside of their field. Analyses of responses (Tables 9 and 10) indicate there were no statistically significant differences between perceived ability of either professional group to apply content within (0.705) and outside of (0.739) their fields to a problem, leading the researchers to fail to reject the null hypothesis. It should be noted that despite the analyses of responses from both professional groups not reporting significant differences among their perceived ability to apply content within and outside of their fields, both analyses revealed identifiable differences in pre and post median gains for both groups. The analyses reported an increase in T&E professionals’ perceived ability to apply content within their field, and an increase in science professionals’ perceived ability to apply content outside of their field.
Table 9 Wilcoxon Matched Pairs Test for Difference Over Time on Perceived Ability to Apply Content Within Their Content Fields to a Problem Group n Pre Median Post Median IQR Test Stat. p Science 42 4.0 4.0 1 -0.378 0.705 T&E 21 4.0 4.5 1

Journal of Technology Education Vol. 26 No. 1, Fall 2014
-14-
Table 10 Wilcoxon Matched Pairs Test for Difference Over Time on Perceived Ability to Apply Content Outside of Their Content Fields to a Problem Group n Pre Median Post Median IQR Test Stat. p Science 42 3.0 4.0 1 -0.333 0.739 T&E 21 4.0 4.0 1
The analyses of this data for the third research question suggests that
science and T&E professionals indicated statistically significant differences in their gains regarding understanding of content and ability to demonstrate comprehension of content within their fields. Despite the analyses of professional groups not showing a statistically significant difference in all areas, the analyses did reveal gains between the pre and post conference median scores in many categories. This supports the finding of a collective benefit from the various topics attended within and outside of their fields (Figure 3) between both groups of participants who attended the conference. Additionally, the reported gains in understanding and application of T&E knowledge by science professionals suggests that they may have been more focused on new directives to implement engineering content and practices mandated by the NGSS.
The fourth research question was included at the end of retrospective survey by the researchers as a supplemental question. It identified that overall 86 percent (56/65) of conference attendees would like to see a joint conference held between NSTA and ITEEA. This support for a joint conference was exhibited by both science and T&E professionals (Figure 4). Participants were asked to suggest other professional associations to hold a joint conference with using an open text field, of which attendees suggested the National Council of Teachers of Mathematics (NCTM) most frequently (7), followed by the American Association of Physics Teachers (AAPT) (3), NASA (2), the American Chemical Society (ACS) (2), and Technology Student Association (TSA) (1).

Journal of Technology Education Vol. 26 No. 1, Fall 2014
-15-
Figure 4. Responses from science and T&E attendees of whether or not they would like to see a joint conference held on a national level between NSTA and ITEEA.
Limitations There are certain limitations to consider in regards to the instrumentation
and statistical analysis of this study. Although Allen and Nimon (2007)’s retrospective pretest was not validated, they did find it to be a reliable method to obtain quantitative data regarding professional development conferences. This instrument provided a viable method for efficiently collecting data on a professional development conference. Despite the researchers efforts to stay as true as possible to the content of Allen and Nimon’s (2007) original instrument, they used it to evaluate attendees’ perceptions of the overall conference as opposed to each individual conference session as Allen and Nimon applied it. The questions were adapted to reflect this focus on the overall conference perceptions of science and T&E content. A limitation of using this methodology is that one session (especially the final session attended) may have had undue influence on an attendee’s overall conference perception, skewing the reported median scores.
Another limitation of the adapted instrument was that participants were asked to self-report their perceptions as opposed to measuring them through observation or performance evaluations. Participants may have felt inclined to report gains in their perceptions for various reasons (e.g., bias to show personal growth at a conference through reporting gains), which the researchers attempted to remove by reminding participants that there were no consequences for responding. The retrospective pretest has been described as a useful but
38
18
5 4
0
5
10
15
20
25
30
35
40
Science T&E
Resp
onse
s
Answer
Yes
No

Journal of Technology Education Vol. 26 No. 1, Fall 2014
-16-
imperfect tool (Lamb, 2005) as seen in this study. Allen and Nimon (2007) caution that it can be successful in measuring learning and improvement gains when time and resources are limited.
While the results of this study are not generalizable to the entire nation, they do represent a reasonable sample of teachers from Maryland that implement STEM content and practices within their curricula like many other STEM education teachers across the United States. The results of this population can still be helpful for other state and national STEM education associations discussing the idea of a joint conference. Qualitative Data Analysis
As mentioned previously, face-to-face interviews were conducted with an evenly distributed mix of professionals at the conference. These interview responses were transcribed and coded by the researchers. The codes were analyzed and collapsed into the following corresponding themes (Figure 5) that emerged across the interviews: Support, Size Concerns, and Retaining Identity. These themes are described in detail below.
Figure 5. Themes and concerns that emerged from the attendee and vendor interviews regarding a joint conference.
Joint Conference
Support
Retaining Identity
Size Concerns

Journal of Technology Education Vol. 26 No. 1, Fall 2014
-17-
• Support - The majority of the interviewees supported the concept of a joint conference. The supervisors, administrators, and vendors expressed overwhelming support for a joint conference for numerous reasons. One of the most prominent reasons given was to provide a well-rounded professional development experience to integrate multiple STEM concepts across content areas, or as one supervisor explained, “This was a much richer conference. I believe that science, technology, and engineering went together long before the NGSS went into place. Now it's even more important with the NGSS that we work together.” Another supervisor discussed the collaboration that they saw occurring just in one of the sessions, “Half of the participants were science, half were some type of tech ed or engineering teachers and it was really great to just hear how through their lens they would incorporate certain engineering concepts and in our lens we would incorporate certain science concepts so I really liked that.”
• Size Concerns – Various types of professionals voiced their caution about having a joint conference that is too large in size. They felt that the current conference was small enough to interact with professionals outside of their content area, and still be able to attend an ample amount of sessions from both disciplines. One interviewee expressed concerns with not being able to attend all of the sessions they want at a larger national joint conference, and losing the personal connection associated with smaller state conferences, “ITEEA is such a big conference that I think it would be beneficial for science and technology education to have their own conference because I would want to go to almost every science session and want to go to every ITEEA session and miss out on the ones that I really want to see.” This also shows the amount of interest that this T&E professional has for attending both science and T&E presentations.
• Retaining Identity – Science professionals had no objections to a joint conference with other T&E associations, and welcomed it to address the engineering content in the NGSS. However, T&E professionals expressed concerns that there was too much focus on engineering and NGSS at the conference, “It’s very science based which is fine because of the new standards but again I think there needs to be some higher level technical engineering career courses or sessions.” Another T&E teacher interviewed also expressed their concern that there was too much emphasis being placed on science and engineering, and not enough sessions geared toward technology education like past conferences. They believed that this was threatening T&E education’s identity and could potentially lead to science subsuming T&E education, “It seems to be extremely focused on science as far as what I've seen for technology education has been miniscule. It seems to be that we're kind of riding on coattails is my impression.” The goal of collaboration yet still retaining our identity is a difficult balance and must be carefully considered when planning a joint conference.

Journal of Technology Education Vol. 26 No. 1, Fall 2014
-18-
In addition to attendees being surveyed, the attendee survey instrument was adapted to develop a survey tool for the vendors. The vendor survey was administered via paper and consisted of six multiple-choice questions with room for explanation on two of them. This method yielded a 77% response rate (23/30) which is considered high for paper surveys (Nulty, 2008). Six interview questions were also created by the researchers to elicit more detailed responses and aid in the analysis of the survey findings. Vendors’ responses were overwhelmingly positive, citing the increased number and variety of visitors to their booths as one advantage. An advantage for the associations running the conference as a result of the increased number of vendors was additional table rental fees. Even participants commented on the benefit of having a variety of science, technology, and engineering vendor booths to expose them to teaching aids outside of their content area of which they were not previously aware. These positive responses from the vendor surveys and interviews contributed to the data analysis from the attendee surveys and interviews, helping to examine the reasons that a joint conference was favored.
Discussion and Implications
In this article the authors collected numerous forms of data to better understand the perceptions of a joint conference from the various stakeholders. From the detailed survey and interview responses, the researchers found that administrators/supervisors had fewer reservations in regards to holding a joint conference. One reason for this may due to the multiple STEM related content areas that the administrators and supervisors represented. Administrators expressed in the interviews that a joint conference allows professionals to attend a richer conference where they can gather resources on a greater variety of topics to share at their school. Also from these data collection methods, the analyses of science and T&E participants at this conference indicated differences in perceived understanding of content and ability to demonstrate comprehension of content within their fields. Analyses further indicated pre and post median score gains in perceived understanding of content outside of their fields for both groups of professionals. These analyses also revealed T&E professionals’ identifiable gains in pre and post median scores for their ability to demonstrate comprehension of and apply content within their field; whereas science professionals’ median scores for ability to apply content outside of their field increased as a result of the joint conference. This may suggest that science professionals benefited most from the hands-on T&E presentations at the conference that helped inform teachers how to teach STEM concepts through engineering design.
Using the interviews to examine these phenomena more closely, it can be concluded that one reason for science professionals’ focus on T&E topics was the recent release of the Next Generation Science Standards (NGSS), which called for engineering content and practices to be taught within science

Journal of Technology Education Vol. 26 No. 1, Fall 2014
-19-
curricula. Almost all science professionals interviewed mentioned the NGSS and a focus on learning more about teaching engineering, however T&E educators had a broader view. They were not as concerned with the NGSS, and were more interested in learning how to better integrate numerous STEM concepts in their curricula as supported with their increased median scores in various areas both within and outside of their field. This impetus to learn solely about one topic may be more profound among science professionals due to state testing requirements which T&E professionals’ jobs are not directly impacted by.
The National Academy of Engineering (NAE) and National Research Council (NRC) (2014) reports that in order to increase the academic integration of STEM content, effective implementation will occur through professional development, professional learning communities, and partnering between STEM educators working in and outside of schools. There is a misconception that joint conferences are only advantageous for economic reasons. The findings from the surveys and interviews indicate that science and T&E professionals value a joint conference for the increased quality and diversity of presentations, along with the increased attendance and breadth of professionals with whom they can collaborate with during and outside of the conference. These results indicate that teachers and administrators are taking advantage of the reasons for professional association conferences: networking, sharing resources and knowledge, increased professional development, and broadened impact in their field (Arendale et al., 2009; Paino & Briskin, 2012).
State technology and engineering education association presidents indicated that half of state associations are currently holding joint conferences with 60% planning joint conferences in the near future. The value that professionals saw in melding of content and interests was also representative of the memberships purchased at the time of registration. When given the option of purchasing a membership for one association (MAST or TEAAM) or both associations, 26 percent (26/101) of the conference attendees who purchased a membership, purchased one for both associations. From an economic standpoint this would cost more money, but attendees found it professionally valuable to become a member of both associations. This indicates that attendees value a joint conference for its professional benefits.
The findings from this study should be considered when state and national STEM education associations are investigating ways to provide richer professional development for its members. When asked if they would be in favor of a joint conference between ITEEA and NSTA, 81 percent (18/22) of T&E professionals and of 88 percent (38/43) of science professionals said they would like to see it happen. This overwhelming response from both parties signifies that each association offers professional development expertise from areas which T&E (e.g., engineering) and science (e.g., biology, medical technologies, physics) each benefit to deliver more integrative curricula and enhance student learning. To maintain a reasonably sized conference, ITEEA

Journal of Technology Education Vol. 26 No. 1, Fall 2014
-20-
and NSTA or ASEE may consider holding a joint regional or area conference. Providing adequate professional development for STEM professionals to work collaboratively is critical for preparing STEM literate students for the 21st century.
Conclusion Many state, regional, and national science and T&E professional
associations have considered holding joint conferences but until now did not have the data to make an informed decision. This research suggests that with the convergent paths of science and T&E education and the release of the NGSS, a change to joint professional development conferences is warranted. Teachers, administrators, and supervisors value the professional development received from a science and T&E education joint conference, and analyses indicated collective gains within and outside of their content area in numerous criterion.
If T&E educators are expected to be integrators of STEM and collaborate with other content areas (ITEA/ITEEA, 2000/2002/2007, p. 8), then the profession needs to provide its members with collaborative opportunities such as joint professional development conferences. Conducting a joint conference does not come without cautions though as expressed by some of the participants. For a successful joint professional development conference, T&E must be careful to provide a conference that is of reasonable size while still maintaining its identity. T&E education faces a critical crossroad – does it continue to operate its conferences in isolation or does it collaborate them with other professional associations? Science professionals from this study indicated that they are in need of professional development to deliver engineering content and practices. The findings from this study also suggest that they benefited from the collaboration with T&E educators sharing their expertise to deliver engineering content. If T&E education does not take the initiative to provide its engineering professional development expertise to other content areas, than it may miss out on a key opportunity on which other content areas and professional associations may capitalize.
References Allen, J. M., & Nimon, K. (2007). Retrospective pretest: A practical technique
for professional development evaluation. Journal of Industrial Teacher Education, 44(3), 27-42.
Arendale, D., Barrow, H., Carpenter, K., Hodges, R., McGrath, J., Newell, P., & Norton, J. (2009). Position paper: Creating a new professional association. Journal of Developmental Education, 33(1), 28-35.
Bell, B. J. (2009). Conference attendance patterns of outdoor orientation program staff at four-year colleges in the United States. Journal of Experiential Education, 31(3), 405-409.
Busby, J. R. (2012, November). Perspectives of the future of technology education professional associations. Symposium conducted at the 99th

Journal of Technology Education Vol. 26 No. 1, Fall 2014
-21-
Mississippi Valley Technology Teacher Education Conference, Nashville, TN.
Cherrstrom, C. A. (2012). Making Connections: Attending Professional Conferences. Adult Learning, 23(3), 148.
Common Core State Standards Initiative (CCSS). (2012). Common core state standards initiative: Preparing America’s students for college & career. Retrieved from http://www.corestandards.org/
Creswell, J. W., & Plano Clark, V. L. (2011). Designing and conducting mixed methods research. 2nd Edition. Thousand Oaks, CA: Sage.
Hickson, I. (2006). Raising the Question #4 Why Bother Attending Conferences? Communication Education, 55(4), 464-468.
International Technology Education Association (ITEA/ITEEA). (2000/2002/2007). Standards for technological literacy: Content for the study of technology. Reston, VA: Author.
Lamb, T. (2005). The retrospective pretest: An imperfect but useful tool. The Evaluation Exchange, 11(2), 18. Retrieved from http://www.hfrp.org/var/hfrp/storage/original/application/d6517d4c8da2c9f1fb3dffe3e8b68ce4.pdf
McAlister, B. (2013, November). The history, legacy, and future of the Mississippi valley conference. Paper presented at the 100th Mississippi Valley Technology Teacher Education Conference, Chicago, IL.
McAlister, B. (2012, November). The future of the Mississippi Valley Technology Teacher Education Conference: A survey of the membership. Paper presented at the 99th Mississippi Valley Technology Teacher Education Conference, Nashville, TN.
NGSS Lead States (2013). Next generation science standards: For states, by states. Washington, DC: National Academies Press.
National Academy of Engineering (NAE) and National Research Council (NRC). (2014). STEM integration in K-12 education: Status, prospects, and an agenda for research. Washington, DC: The National Academies Press.
Nulty, D. D. (2008). The adequacy of response rates to online and paper surveys: What can be done? Assessment & Evaluation in Higher Education, 33(3), 301-314. doi:10.1080/02602930701293231
Paino, M., & Briskin, J. (2012). Emerging professionals committee: A commitment to the future-The development of the NSPI/ISPI historical timeline. Performance Improvement, 51(6), 32-37.
Prajapati, B., Dunne, M., & Armstrong, R. (2010). Sample size estimation and statistical power analyses online article peer reviewed: The latest clinical article to appear online. Optometry Today, 50(14), 41-50.
Tillotson, J. W., & Young, M. J. (2013). The IMPPACT project: A model for studying how preservice program experiences influence science teachers’ beliefs and practices. International Journal of Education in Mathematics, Science and Technology, 1(3), 148-161.

Journal of Technology Education Vol. 26 No. 1, Fall 2014
-22-
Identifying Perceptions That Contribute to the Development of Successful Project Lead the Way
Pre-Engineering Programs in Utah An educational crisis has been reported from many scholarly platforms for
the last quarter century. The United States is faced with the challenge of providing a secondary science, technology, engineering, and math (STEM) education, especially in secondary pre-engineering, that will lead its students to the fulfillment of academic and domestic success. In Rising Above the Gathering Storm, the National Academy of Sciences, National Academy of Engineering, and the Institute of Medicine (2007) concluded:
We owe our current prosperity, security, and good health to the investments of past generations, and we are obligated to renew those commitments in education, research and innovation policies to ensure that the American people continue to benefit from the remarkable opportunities provided by the rapid development of the global economy and its not inconsiderable underpinning in science and technology. (p. 13)
This report and others suggested that the United States is losing its global competitive edge in the fields of engineering, science, and technology because the U.S. educational system cannot, in its present state, take on the challenge of educating our children to the standards of the future. A follow-up report five years later showed that some improvement had been made, but reaffirmed the importance of change in STEM curriculums across the nation (National Academy of Sciences, National Academy of Engineering, & Institute of Medicine, 2010).
In the report The Knowledge Economy: Is the United States Losing Its Competitive Edge? assembled by the Task Force on the Future of American Innovation (2005), they advocated,
Federal support of science and engineering research in universities and national laboratories has been key to America’s prosperity for more than half a century. A robust educational system to support and train the best U.S. scientists and engineers and to attract outstanding students from other nations is essential for producing a world-class workforce and enabling the R&D enterprise it underpins. But in recent years federal investments in the physical sciences, math and engineering have not kept pace with the demands of a knowledge economy, declining sharply as a percentage of the gross domestic product. (p. 1)
Keith McMullin ([email protected]) is a Project Lead the Way teacher at Uintah School District in Vernal, Utah. Edward Reeve ([email protected]) is a Professor in Technology and Engineering Education, School of Applied Sciences, Technology, and Education, Utah State University.

Journal of Technology Education Vol. 26 No. 1, Fall 2014
-23-
Educational reform is paramount in defining our goals for the future and in reaching those goals both in secondary education institutions and in our nation. The educational crisis addressed in this research is characterized by K–12 public education not producing students who have the necessary skills or inclination to be successful in college and university engineering programs across the nation. A problem exists with a shortage of engineers in the nation (Johnston, 2001). Public and educational leaders are calling for change in secondary pre-engineering education. Jackson (2004) stated:
There is a quiet crisis building in the United States—a crisis that could jeopardize the nation’s pre-eminence and well-being. The crisis has been mounting gradually, but inexorably, over several decades. If permitted to continue unmitigated, it could reverse the global leadership Americans currently enjoy. The crisis stems from the gap between the nation’s growing need for scientists, engineers, and other technically skilled workers, and its production of them (p. 1).
A serious shortfall is represented by the gap in our national scientific and technical capabilities. Ignoring this gap may lead to perilous times in our nation’s future.
Secondary Pre-Engineering Trend in the United States
To help close the gap in engineering personnel, secondary pre-engineering programs have been implemented in over 4,000 schools in 50 states (National Academy of Engineering and National Research Council, 2009). With this much growth, the perception of pre-engineering programs by school officials and the public seems to be that these programs are really meeting the needs of today’s youth and should be considered for implementation in secondary public schools whenever possible.
For the last 30 years we have increased educational efforts and have tried exhaustively to get the latest innovations and policies into place. In the 1960s, a lot of funding went into national curriculum efforts, open-plan schools, and individual instruction, followed in the 1970s by a period of stagnation, regrouping, and recovery (Fullan, 1993). Fullan went on to explain that somewhere along the way, it seems we forgot that one of the main purposes of education is to prepare young people for the workplace. Secondary public schools traditionally have been slow to understand, change, and meet the challenges of the modern-day workplace. Another possible reason for implementing pre-engineering courses is that they reflect the modern-day workplace.
Today, there are many programs available for public schools to participate in pre-engineering. In the report, Engineering in K–12 Education: Understanding the Status and Improving the Prospects, the National Academy of Engineering and National Research Council (2009) cited over 30 pre-engineering programs. Table 1 shows a list of the larger programs along with

Journal of Technology Education Vol. 26 No. 1, Fall 2014
-24-
their participation to provide understanding of the diffusion of pre-engineering programs in the United States. Table 1 A Brief List of U.S. Pre-Engineering Programs and Their School Participation
Curriculum Participation
Project Lead the Way The PLTW curriculum is used in all 50 states and the District of Columbia in 2,700 schools (2,000 high schools and 700 middle schools). About 600 high schools have completed PLTW’s program certification process, and 34 middle schools have been recognized by PLTW’s “School of Excellence Recognition program.”
Materials World Modules
This curriculum has been used in about 500 schools in 48 states by some 35,000 middle school and high school students.
Infinity Project The high school course has been used in 350 schools in 37 states and some schools in several other countries. A new set of middle school modules is being used in 20 schools in Texas.
Designing for Tomorrow
This curriculum, developed by Ford Partnership for Advanced Studies, is used in more than 300 schools in 26 states.
A World in Motion This curriculum is used in all 50 states and in 10 Canadian provinces. More than 65,000 AWIM kits have been shipped to more than 16,000 schools since 1990.
Engineering is Elementary
This curriculum is used in about 850 schools in 46 states and the District of Columbia. Approximately 1 million students have been exposed to the EiE curriculum.
Note. These data are presented as reported by the curriculum developers.

Journal of Technology Education Vol. 26 No. 1, Fall 2014
-25-
Of the programs cited in this list, Project Lead the Way (PLTW) is by far the largest. In a recent press release, PLTW announced that it had been nationally recognized as one of just four high-quality STEM programs that are immediately scalable on a national level (Project Lead the Way [PLTW], 2013). Of the four programs selected, PLTW is the only in-school STEM curricular program for elementary, middle, and high school students and the only program offering a comprehensive professional development model for teachers. There are other programs, such as Materials World Modules and the Infinity Project, that do have some momentum, but they are not as big as the PLTW program. PLTW is now in all 50 states with over 4,700 participating secondary schools serving over 400,000 students (PLTW, 2013). It is one of the premier pre-engineering programs in the nation. However, even with its diffusion and growth, PLTW is relatively new in the United States, and nascent research is just now yielding precursory findings on its impact on public education.
Utah Pre-Engineering Education: The Project Lead the Way Curriculum One of the purposes of PLTW is to provide a complete curriculum with a
scope and sequence for students to follow in secondary pre-engineering. The PLTW pre-engineering program at the secondary school level consists of curricula for three tiers of education. The first tier includes two foundation courses, introduction to engineering design (IED) and principles of engineering (POE). After successful completion of the tier one courses, students may then take one or more of the tier two specialization courses, which include digital electronics (DE), aerospace engineering (AE), biotechnical engineering (BE), civil engineering and architecture (CEA), and computer integrated manufacturing (CIM). The last course in the program is the tier-three capstone course, engineering design and development (EDD). In addition to providing curriculum for the classes, PLTW contracts with the school to provide program support and training for teachers and counselors.
Utah has offered PLTW classes in their public schools since 1999. Presently PLTW classes are offered in over 28 different Utah schools in 10 districts serving over 2,100 students. However, some of the districts offer PLTW classes in a central school setting where many schools are represented with only one program being taught.
The PLTW curriculum emphasizes the nature of engineering and presents an engineering educational track. It teaches students and teachers how to engage in the field of engineering. The PLTW (2009) curriculum philosophy included having students:
• work as a contributing member of or lead a team; • use appropriate written and/or visual mediums to communicate with a
wide variety of audiences; • participate in public speaking; • listen to the needs and ideas of others;

Journal of Technology Education Vol. 26 No. 1, Fall 2014
-26-
• understand the potential impact their ideas and products may have on society;
• use problem solving methods and skills; • manage time, resources, and projects; • participate in researching ideas and concepts including data collection and
analysis; • go beyond the classroom for answers; and • be better prepared for success in two- and four-year college programs.
This philosophy seems to enable students to succeed inthe workforce or the university. PLTW classes also have students thinking outside the box to engineer solutions for today’s problems, meaning that students may offer engineered solutions that are sometimes more efficient, cheaper, more practical, and possibly have less environmental consequence. With this philosophy, PLTW hopes to close the gap between education and the workplace.
A critical component of PLTW is its teacher training, which was developed to provide the most intensive and comprehensive professional development for teachers becoming part of PLTW (2009). Teachers gain access to PLTW curriculum only after completing approved PLTW in-service training. The various curriculums use a variety of labs and multi-media presentations, including PowerPoint, to make the lessons both standard and easy to use. PLTW is a nonprofit organization. Its major stated goals are to: (a) increase the number of young people who pursue engineering and engineering technology programs requiring a 4- or 2-year college degree, (b) provide clear standards and expectations for student success in the program, (c) provide leadership and support that will produce continuous improvement and innovation in the program, (d) provide equitable opportunities for all academically qualified students without regard to gender or ethnic origin, (e) reduce the future college attrition rate with 4- and 2-year engineering and engineering technology programs, and (f) contribute to continuing national prosperity.
PLTW also attempts to attract a higher percentage of middle grade point average students into their classes to introduce them to the field of engineering instead of limiting student participation to the academic top. Their can-do philosophy suggests that students who thought they had no aptitude for engineering fields of occupation may find success in the PLTW program and learn that they could possibly pursue an engineering field of occupation.
PLTW involves universities in its quest to strengthen the pipeline connection between secondary schools and universities. At some colleges and universities, PLTW classes are offered for concurrent enrollment. Students are usually required to pass an end-of-course exam before credit is granted. The credit received by students at universities and colleges is usually basic, which could fill the role of elective courses.
Schools planning to offer four or more high school PLTW courses are eligible for PLTW certification and may begin the process for certification at the

Journal of Technology Education Vol. 26 No. 1, Fall 2014
-27-
end of the second year. The purpose of certification is to ensure implementation of a high quality PLTW program and to verify college credit eligibility for select PLTW courses. The benefits of certification include the opportunity: (a) “to receive college-level recognition such as college credit, scholarships, and admissions preference;” (b) for PLTW teachers “to become Master Teachers and receive benefits such as compensation for professional development” and the opportunity “to field test new curriculum;” (c) for schools to apply for Model School status; (d) for schools to receive additional funding; and (e) to have “greater visibility for the program within the school and community” (PLTW, 2012).
Counselors of schools implementing PLTW are also required, by the PLTW contract with the school, to attend PLTW workshops. Counselor training plays a major role in the PLTW concept. PLTW utilizes affiliate universities to provide teacher and counselor training for schools that have the PLTW program. University affiliations have changed in Utah since the program was first established. The PLTW workshops provide counselors with (a) an understanding of how to best implement PLTW in their school, (b) knowledge of the benefits that PLTW provides for students, and (c) methods of advising students who are interested in enrolling in the PLTW program.
Studies about Pre-Engineering and PLTW Studies about PLTW and its impacts in schools have been limited in scope.
However, a recently developed instrument that can be used to assess pre-engineering programs shows promise that more research will be conducted to investigate pre-engineering programs. For example, the Engineering Education Beliefs and Expectations Instrument (EEBEI) was developed by Nathan, Tran, Atwood, Prevost, and Phelps in 2010 to: (a) develop an instrument to measure “teachers’ beliefs and expectations about pre-college engineering instruction,” (b) measure teachers views and “identify differences that exist among teachers with different training,” and (c) “examine teachers’ decisions in advising fictional students” (p. 409). Research using the EEBEI, and the EEBEI-T for teachers has shown, “High school STEM teachers report their instruction was influenced by students’ interest, family background, and prior academic achievement” (Nathan et al., 2010, p. 409). The study also discussed that in a comparison between PLTW and non-PLTW teachers, the latter are of the opinion that engineering students must demonstrate high abilities in math and science, but PLTW teachers tend to integrate the math and science skills into the project or activity at hand while they are teaching. Although socioeconomic status (SES) was not reported as a factor that influenced their teaching, it did influence situational decision-making tasks (Nathan et al., 2010). This research indicates that interest, family background, and prior academic achievement are factors that may be tested in this study to see if CTE directors, school administrators, and teachers in Utah agree or disagree on their merit.

Journal of Technology Education Vol. 26 No. 1, Fall 2014
-28-
The EEBEI-T was also administered to high school guidance counselors in another study (Nathan, Atwood, Prevost, & Tran, 2011), which found that advising was shaped by student performance. Guidance counselors tend not to use students’ culture, home or ethnic backgrounds to inform course selection advising, and guidance counselors overwhelmingly advised students from all four vignettes in the study to enroll in pre-engineering courses (Nathan et al., 2011). Counselors play a major role in students enrolling in PLTW classes and thus are included as a population to be surveyed in this study to find out what they perceive as factors that contribute to successful PLTW programs.
In a quasi-experimental study using the EEBEI-T to measure how professional development changed high school STEM teachers’ beliefs about engineering education, Nathan, Atwood, Prevost, Phelps, and Tran (2011), reported that with regards to which students should enroll in engineering, expectations for engineering learning, and predicting career success of pre-engineering was generally favorable among students who had a high SES through survey logistics even though SES was not a directly tested factor. This study also indicated that nascent PLTW teachers were more likely to increase STEM integration over time into their curriculum, which indicates that math and science were incorporated into the curriculum on a need-to-know basis in order to complete the project. This could also be a factor of their comfort level as they develop mastery over their subject. This research indicates that professional development is a factor that needs to be assessed in this study because teachers need to know how math and science are to be used in their teaching to aid in student’s retention of math and science concepts.
A study on PLTW conducted in Indiana found that principals presented obstacles when trying to implement PLTW programs because of their tendency to categorize them as traditional technology education classes (Shields, 2007). Perceptions held by administrators and teachers may be different, creating implementation and maintenance problems with the program and hindering success. Rating factors from the perceptions of program success between administrators and teachers and reasons why PLTW is successful is paramount for testing success factors in this study in Utah.
Secondary education public school administrators and teachers from across the nation are realizing that their schools could provide pre-engineering programs that allow students to investigate their strengths and interests in engineering and engineering technology (Thilmany, 2003). According to Dearing and Daugherty (2004), leaders from both secondary technology education and college-level engineering have called for changes in the high school curriculum to address the need to sufficiently prepare high school graduates for post-secondary progress related to engineering and technology. School districts across the nation are implementing pre-engineering courses into their curriculum. As schools infuse these pre-engineering programs, leaders and teachers in technology education are debating the virtues of pre-engineering

Journal of Technology Education Vol. 26 No. 1, Fall 2014
-29-
education (Lewis, 2004). Student interest in engineering and engineering technology could be factors that contribute to program success and should be part of this study.
Other studies in Indiana have indicated that technology education teachers have embraced pre-engineering education as a valuable component of technology education (Rogers, 2006). Rogers went on to say that technology education teachers from Indiana also view the pre-engineering curriculum as favorable in developing technological literacy. Rogers and Rogers (2005) concluded that the forward provided by William A. Wulf, president of the National Academy of Engineering, in the Standards for Technological Literacy: Content for the Study of Technology provided clear evidence that pre-engineering has become a component of the technology education discipline.
Secondary schools have experienced a rise in the engagement of pre-engineering programs (Douglas, Iversen, & Kalyandurg, 2004). There has also been an increase in the development of engineering-focused curriculum for Grades 9–12 (Dearing & Daugherty, 2004), which gives reason to evaluate the impact of secondary engineering-focused programs on student learning. Indeed,
as these programs continue to grow, there is a need to build a strong base of rigorous research to provide educated and specific feedback on how to improve existing curricula and build a cohesive research agenda on engineering reasoning development in the K-12 grade spectrum. (Kelly, Brenner, & Pieper, 2010, p. 8) Research on PLTW is limited, and the research that has been conducted
makes it clear that more research needs to be done, especially on a state-by-state basis, to discover and evaluate the elements of successful pre-engineering programs. The research available usually concentrates on the teaching methods that PLTW brings to schools and focuses on the success of student achievement using those methods.
Little research is available in states like Utah, which have only a limited number of PLTW programs and PLTW-certified schools. There is a need to do research in states that do not have large PLTW programs to see if PLTW programs in those states are successful and why.
Purpose of the Study The purpose of this study was to examine PLTW program success by
identifying controllable factors, which may be considered at the time of PLTW program initiation or program evaluation. Achieving this purpose will include creating a theoretical framework for identifying and implementing successful pre-engineering programs in Utah secondary public schools. Examining these controllable factors may lead to stronger success of the program upon implementation or improvement of existing programs, making them more successful by manipulation of these factors.
Journal of Technology Education Vol. 26 No. 1, Fall 2014
-30-
Method This research used a mixed method design. Both quantitative and qualitative
research methods were utilized to answer the research questions. This research was divided into two phases, and both phases employed the aspects of qualitative and quantitative inquiry. Prior to the study the instruments were pilot tested in two adjacent states to test the instruments for content, validity, and reliability. Feedback from participants was used to make necessary improvements.
Phase I of the study used an interview process to question all career and technical education (CTE) directors (N = 10) in the state of Utah that have PLTW programs in their districts. In the interview questions, CTE directors were asked to identify goals or reasons for implementing PLTW in their schools, they were also asked about their perceptions and information related to how they view successful programs. Phase I of this study sought to answer the following research questions.
• Research Question 1: What do CTE directors in Utah perceive as the goals or reasons that the PLTW program was originally implemented into their districts?
• Research Question 2: What do CTE directors in Utah that have the PLTW program in their districts perceive about how their PLTW programs are presently meeting implementation goals in serving public education?
• Research Question 3: How do CTE directors in Utah that have the PLTW program in their districts define what success means in their PLTW programs?
• Research Question 4: What do CTE directors in Utah that have the PLTW program in their districts perceive the factors are that contribute to their PLTW program success?
The interview questions were designed to generate a list of possible factors that may contribute to the success of PLTW programs. This list was used to add, eliminate, or adjust questions on the survey instrument used in Phase II of the study.
Phase II of the study polled all PLTW teachers in the state (N = 33) and a counselor (N = 29) and school administrator (N = 29) from each PLTW school who had the most responsibility for PLTW in their school. The poll had the same questions for each group and was conducted using an internet-based questionnaire about the credibility of the factors identified primarily in Phase I of the study. The data collected in CTE directors’ interviews (Phase I) and the data collected for surveyed populations was compared to define the characteristics associated with perceptions of successful PLTW programs. The research questions addressed in Phase II were as follows:
• Research Question 5: What factors do teachers who teach PLTW in Utah believe contribute to developing, implementing, and sustaining a

Journal of Technology Education Vol. 26 No. 1, Fall 2014
-31-
successful PLTW program? • Research Question 6: What factors do Utah administrators who oversee
PLTW programs believe contribute to developing, implementing, and sustaining successful PLTW programs?
• Research Question 7: What factors do counselors in Utah schools that offer PLTW classes believe contribute to developing, implementing, and sustaining a successful PLTW program?
The questionnaires used closed-ended questions with an ordinal scale to ask the opinion of each of the factors presented in the questions. At the end of each question was a comment box so the participant could express reasons why their answer was selected if they choose. Using methods suggested by Nardi (2003) in his book, Doing Survey Research, to construct survey items. The following is an example of a question using the possible factor of student environment:
1. Classes in the PLTW program use a hands-on technological environment with computers and lab equipment as one of its key teaching elements. In your opinion, how many of the students taking PLTW classes in your school primarily take the class in order to take advantage of this type of learning?
More than 75% Most (between 50% and 75% of the students) Some (between 25% and 50% of the students) Few (Less than 25% of the students)
Please feel free to comment on this question
Factors contributing to PLTW program success as suggested by CTE directors, conversation with state administrators and dissertation committee members, and interaction with PLTW that were addressed in Phase II of the study included:
• The students’ interest in the subject matter. • The students’ family influences. • The students’ influence from peers. • The teacher’s competencies or charisma for making the class appealing. • The type of credit received for the PLTW class. • The classroom setting where students could be attracted by a problem-
solving technological environment. • Guidance received from a counselor, especially if the counselor has had
the PLTW training. • Students not informed about the PLTW courses. • Concurrent enrollment where students may opt for college credit.

Journal of Technology Education Vol. 26 No. 1, Fall 2014
-32-
• College preparation where students take advantage of PLTW classes to better understand the rigors of a competitive collegiate environment.
• Improvement of student prerequisites, meaning that students achieve better in STEM classes.
• The credentials of the teacher, which may provide better instruction and possibly give the class a more sophisticated theoretical engineering framework.
• Teacher preparation time is insufficient to provide the quality of instruction needed.
In Phase I of this study that interviewed CTE directors, two overarching themes for program success emerged. The first concluded that mechanisms had to be in place that promoted adequate student enrollment. The second was that students were expected to achieve academically. Phase I of the study addressed research questions one through four. Research Question #1
The first research question asked of the CTE directors was: What do CTE directors in Utah perceive as the goals or reasons that the PLTW program was originally implemented into their districts? The findings revealed in Figure 1 show that CTE directors believe that the PLTW programs in their schools were established to introduce a high quality secondary pre-engineering program that included professional development to help teachers with state-of-the-art techniques in teaching engineering concepts for students that had an aptitude for achieving academically. They also wanted a program that gave students an outlet in engineering and technology education where students could participate in a pathway that could lead to a career in engineering or engineering technology by forming partnerships between schools, industry, and the community. Implementers wanted a program that coincided with the national and economic trends affecting education that was compatible with math and science where it could possibly help boost core test scores.
In this study, the CTE directors believed PLTW was implemented for many reasons. It is interesting to note that the most common reason was to “improve teacher training by providing professional development.” It appears that this reason may have been selected first because the directors value quality teaching. Also, this is in keeping with recent efforts in Utah aimed at improving teaching by providing professional development to implement the Utah State Common Core Curriculum in STEM subjects. In the CTE director’s interviews, it was mentioned by several directors that new programs implemented by schools in their district should provide extensive training for teachers. Another reason for training teachers could be that CTE directors believe that the methods of instruction need to change. Traditional “stand-and-deliver” may need to be replaced with more discovery—project-based educational methods of instruction. The findings also showed three other strong reasons for PLTW
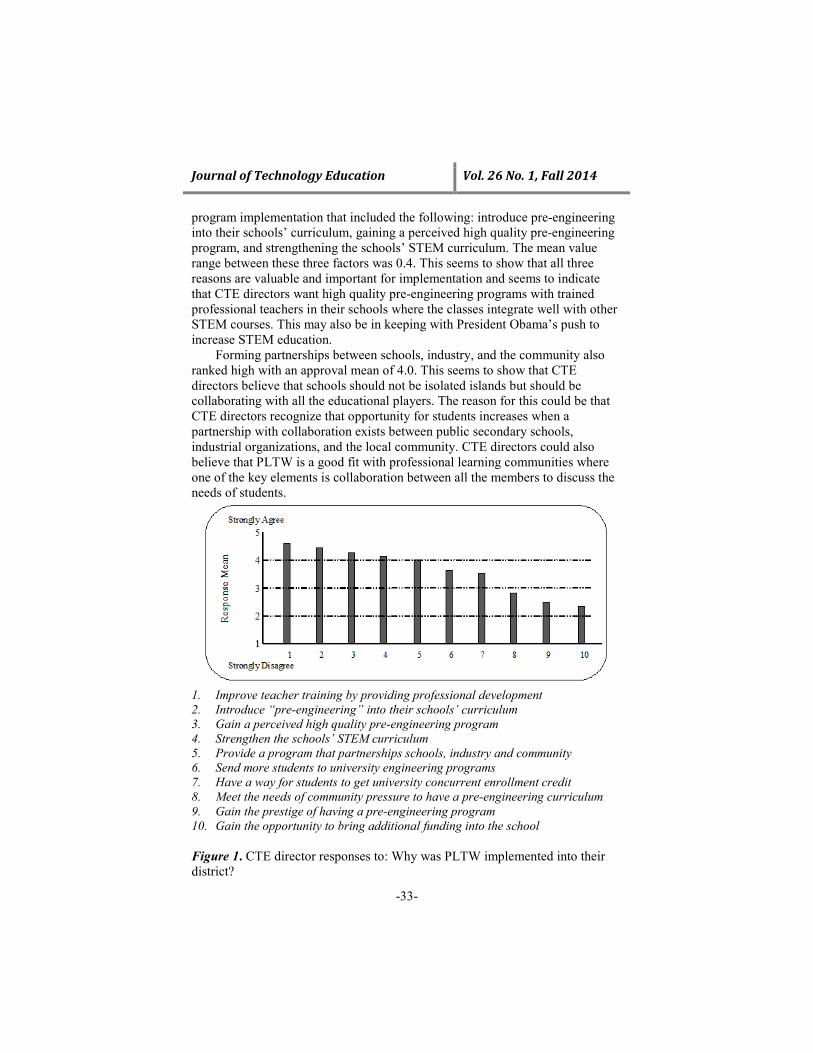
Journal of Technology Education Vol. 26 No. 1, Fall 2014
-33-
program implementation that included the following: introduce pre-engineering into their schools’ curriculum, gaining a perceived high quality pre-engineering program, and strengthening the schools’ STEM curriculum. The mean value range between these three factors was 0.4. This seems to show that all three reasons are valuable and important for implementation and seems to indicate that CTE directors want high quality pre-engineering programs with trained professional teachers in their schools where the classes integrate well with other STEM courses. This may also be in keeping with President Obama’s push to increase STEM education.
Forming partnerships between schools, industry, and the community also ranked high with an approval mean of 4.0. This seems to show that CTE directors believe that schools should not be isolated islands but should be collaborating with all the educational players. The reason for this could be that CTE directors recognize that opportunity for students increases when a partnership with collaboration exists between public secondary schools, industrial organizations, and the local community. CTE directors could also believe that PLTW is a good fit with professional learning communities where one of the key elements is collaboration between all the members to discuss the needs of students.
1. Improve teacher training by providing professional development 2. Introduce “pre-engineering” into their schools’ curriculum 3. Gain a perceived high quality pre-engineering program 4. Strengthen the schools’ STEM curriculum 5. Provide a program that partnerships schools, industry and community 6. Send more students to university engineering programs 7. Have a way for students to get university concurrent enrollment credit 8. Meet the needs of community pressure to have a pre-engineering curriculum 9. Gain the prestige of having a pre-engineering program 10. Gain the opportunity to bring additional funding into the school
Figure 1. CTE director responses to: Why was PLTW implemented into their district?
Journal of Technology Education Vol. 26 No. 1, Fall 2014
-34-
Despite believing these are still positive reasons for implementing PLTW
programs, CTE directors did not seem to think that sending more students to university engineering programs and having a way for students to get university concurrent enrollment ranked quite as high as the aforementioned reasons. The reason for this could be that CTE directors are very concerned with the education that students are receiving in their schools, which is more important than contributing to the university engineering student pipeline. Another reason for the ranking of these two reasons could be that although receiving university credit and informing students of university engineering programs is one of the reasons for implementation, they may be tend to think of it as an autonomous part of any high-quality program.
It was also noted among the reasons given in the interview’s probing questions that community pressure, prestige, and bringing additional funding into the school were not reasons for implementing PLTW. The reason for this could be that CTE directors want the focus of building quality programs, and those reasons do not directly relate to that. Research Question #2
The second research question asked of CTE directors was: What do CTE directors in Utah, that have the PLTW program in their districts perceive about how their PLTW programs are presently meeting implementation goals in serving public education? The findings revealed that the overall majority (7 out of 10) of the directors felt like PLTW was doing a good job in meeting the goals set at the time of implementation. The other three schools had issues with instructors, administrators, or other domestic issues inhibiting program success.
One interesting finding was about the PLTW organization itself. Originally the PLTW organization wanted schools to become certified and pressured schools to offer enough PLTW classes to meet this expectation. But, in the director interviews, it was noted that PLTW seems to have backed off this position. Perhaps PLTW realized that smaller schools may not be able to sustain all the classes and therefore offered more support to schools that offer just one or two classes to students without the intention of becoming certified. Research Question #3
The third research question asked of CTE directors was: How do CTE directors in Utah that have the PLTW program in their districts define what success means in their PLTW programs? All CTE directors interviewed either agreed or strongly agreed that successful PLTW programs have the following characteristics:
1. The ability to attract students and maintain adequate enrollment. 2. The ability to promote student achievement. 3. The perception of having met the goals of implementation.

Journal of Technology Education Vol. 26 No. 1, Fall 2014
-35-
4. The program has met the present educational goals. 5. The program produces desirable student outcomes. 6. The program creates good public relations. 7. The program platform brings to the school a way to develop
partnerships between school, community, and industry. Research Question #4
The fourth research question asked of CTE directors was: What do CTE directors in Utah that have the PLTW program in their districts perceive the factors are that contribute to their PLTW program success? Figure 2 lists 12 different factors mentioned by all CTE directors that are required for program success. However, two directors not agree that teacher credentials were important, and one director did not agree that providing university credit was important. From this list it can be seen that having quality people facilitate the program ranks in the highest two places on the list. CTE directors seem to believe that providing quality teachers and knowledgeable counselors are paramount in making the program successful. They are the people who are in the trenches interacting with the students. The reason for this may be that if students do not have positive interactions between teachers and counselors, enrollments may drop. The reputation of the class may be such that students do not take a PLTW class initially, or they do not sign up for more than one class in the program. Also, if there is not harmony between teachers, counselors, and students, then achievement in the class may not be as high, making the class or program less successful. Directors want to provide a teacher who is personable with students and has the right credentials.
CTE directors felt that if students could count PLTW classes towards required math and science courses, more students may sign up for the classes. The feeling from the interviews was that students use sufficient amounts of math and science in PLTW classes, so they should count for required credit. Perhaps directors believe that students would prefer learning in the PLTW classroom environment as opposed to the traditional math or science classroom setting. The PLTW class Principles of Engineering can have a science credit attached to it if the teacher has a science endorsement from the USOE. But, this is currently the only class that may carry a required credit. Maybe the future of required classes is to make sure sufficient math and science topics are included into PLTW classes to generate required credit.
The environment and method of instruction can influence learning. CTE directors believe that one of the reasons PLTW may be successful in their schools is because of how the classes are taught. Perhaps the learning environment and the projects, along with the style of instructional presentation in PLTW classes, may be more conducive to learning in today’s technical world. The use of a high-tech learning environment to facilitate collaborative learning may help students better achieve. Providing adequate funding for these

Journal of Technology Education Vol. 26 No. 1, Fall 2014
-36-
classroom settings was also mentioned as a factor for PLTW program success. In reviewing these factors, all the directors noted that one strong factor in
program success was to sufficiently inform students about the program and what its classes offer so good choices can be made according to the needs of the students. In order to do this, a concerted effort must be made to get information about the program out to family members, students’ peers, counselors, teachers, and the students themselves. The directors also considered the counselor training provided by PLTW a credible factor for program success in guiding students into the program. This was important to make sure the “right kids” signed up for the program and that students had enough room in their schedules to take the PLTW classes. Counselors can also aid in screening students to make sure students entering the program appear to have a high interest in the subject matter, which ranked eighth in the success factor list.
Figure 2. CTE director responses to: What factors contribute to a successful PLTW program?
Phase II: Research Questions 5, 6, and 7
Phase II of the study addressed research questions five through seven and involved collecting data from the three groups of respondents that included teachers, counselors, and school administrators. The same question was asked of each group and tailored to that group. The question asked was: What factors do (teachers, counselors, or school administrators) in Utah schools that offer PLTW classes believe contribute to developing, implementing, and sustaining successful PLTW programs? To answer this question, a questionnaire was developed and administered using an Internet-based survey system (i.e. SurveyMonkey).
To answer this research question, the group was asked their opinions about why PLTW is successful. The response rates shown for the group in Figure 3 indicates that three of the strongest factors necessary for a successful PLTW program include supportive school administrators, supportive counselors, and dynamic teachers. The group tended to support each other’s efforts. The

Journal of Technology Education Vol. 26 No. 1, Fall 2014
-37-
questionnaire findings also support the findings from Phase I of this study in which all the CTE directors interviewed indicated that the right teacher was instrumental to the programs’ success.
Figure 3 also shows that PLTW is perceived as being successful because of high-quality curriculum and because their programs are meeting the implementation expectations and goals. Teachers had a mean response near 3.0, which is neutral, when asked if programs were successful because of their association with the state affiliate university. However, there was a difference between the teachers’ mean and the administrators and counselors mean to this question. It seems that teachers think that the affiliate university has been less of a contributing program success factor than administrators or counselors. Perhaps this is because teachers are more closely involved with students’ outcomes and are more apt at measuring teacher professional development impact on students.
1. PLTW is successful because of a supportive administrator 2. PLTW is successful because of a supportive counselor 3. PLTW is successful because of a dynamic teacher 4. PLTW is successful because it has high quality curriculum 5. PLTW is successful because it is meeting the goals of implementation 6. Utah’s PLTW affiliate university has adequately met our program needs
Figure 3. Response rates as to why PLTW is successful
Part of research questions five through seven was to ask the group what
they believed were goals for implementing PLTW into their districts. The number one answer with 42 (82.3%) answering this way was to provide a career pathway for students. The next highest response with 36 (70.6%) was to provide students with more opportunity in engineering related education. From these answers, it appears that the group in agreement that PLTW gives students pathways in engineering education that are important for their futures.

Journal of Technology Education Vol. 26 No. 1, Fall 2014
-38-
Sufficient student enrollment in PLTW classes has been perceived to be an indicator of program success. The questionnaires asked the group about why students enroll in PLTW classes. To facilitate discussion concerning the findings in this part of the questionnaire, the questions were broken into two sections according to the two different types of responses used. The first section consists of four questions, which were answered by selecting the degree in which the respondents agreed or disagreed with a given statement. The second section consists of 10 questions, which were answered by choosing the percentage of students they thought best represented the question asked. The group response rate means for the first section of questions are shown in Figure 4, and group response rate means for the second section of questions are shown in Figure 5.
In Figure 4, it can be seen that the group agreed that student enrollment in PLTW classes would increase if the state would offer more math and science credit for taking the class. At present a science credit may be granted for taking the PLTW course Principles of Engineering, as long as requirements are met. Because PLTW uses extensive math and science in their curriculum, students might take more PLTW classes to obtain these credits. This also coincides with students having room in their schedule to take PLTW classes. Sometimes students do not have the room in their schedules to participate in all the PLTW program classes because of the required classes they have to take, released time for seminary, or other non-credit classes. If space in their schedules could be opened up, more students might participate in PLTW classes.
1. Enrollment may increase if the state offered more math and science
credit 2. Enrollment may increase if students were better informed about the
program 3. Enrollment may increase if students had more room in their schedules 4. Counselors play a major role in students taking multiple PLTW classes
Figure 4. Enrollment factors for PLTW classes

Journal of Technology Education Vol. 26 No. 1, Fall 2014
-39-
The group also agreed that enrollments in PLTW classes would increase if students were better informed about the course content. This coincides with CTE director beliefs. During their interview one director said, “despite hanging posters in the halls, advertising through school channels and the Internet, and informing counselors, there were still students in the school who had no idea that the PLTW program existed or what it was about.” The belief is that students need to be told and retold until they understand what is available through whatever channels can be utilized. Counselors also play a role in informing students and directing them in scheduling. This, of course, is what counselors do, but PLTW formally trains counselors on the aspects of the PLTW program so that they can pass the information on to students. The training is required and is perceived to be helpful with enrollments in PLTW classes. One interesting note is that the teacher mean was closer to 3.0 (neither agree nor disagree) and the administrator mean was above 4.0 (agree) in response to the question about counselors playing a role in students taking multiple PLTW classes. The difference of opinion may be because teachers do not see how counselors interact with students as much as administrators do. Also, administrators may understand the counseling role better than teachers.
It can be seen in Figure 5 that group (i.e., teachers, counselor, and administrators) believed students were taking PLTW classes because they were genuinely interested in the subject and that they wanted to take advantage of the hands-on learning technological environment where students learn by doing and collaborating with others. These were the two top reasons in this section of questions that the group believed students enrolled for in PLTW classes. The means between teachers, administrators, and counselors suggests that generally they believed that “most” (between 50% and 75%) of the students took PLTW classes for these reasons. Teachers however did tend to select the response that “some” (between 25% and 50%) students enrolled in PLTW classes because of the learning environment more than counselors and administrators did. Perhaps in teaching those classes teachers believe that the PLTW environment and method of teaching is not as strong a reason for students to enroll in the class as administrators and counselors may think.

Journal of Technology Education Vol. 26 No. 1, Fall 2014
-40-
1. Students enroll because they are genuinely interested in the subject 2. Students enroll because of the influence of family members 3. Students enroll because of the influence of a peer 4. Students enroll because they liked the teacher 5. Students enroll to take advantage of the unique learning environment 6. Students enroll initially because of the guidance from a counselor 7. Students enroll for concurrent enrollment receiving college credit 8. Students enroll for college and career preparation 9. Students enroll to improve achievement in math and science classes 10. How many students you believe will complete the PLTW program
Figure 5. Factors that influence the percentage of students that enrolls in PLTW classes
The study examined if the groups believed that students enrolled in PLTW classes because of influence from family and friends, they liked the teacher, guidance they received from a counselor, or possibly for college prep and college credit. For this question the teacher’s mean was lower in the family influence category than administrators and counselors, which suggest that teachers may generally believe that fewer students were in their classes for this reason. Although there was some fluctuation between a mean of 2.5 and 3.5 in the abovementioned categories, participants tended to select the choice that “some” (between 25% and 50%) of the students were taking PLTW classes for these reasons. Although these may be important factors to consider when implementing or improving a PLTW program, they do not appear to be as individually important as other factors. Another interesting note is that in general the group chose that “some” (between 25% and 50%) of the students taking PLTW classes would complete the programs in their schools by completing all the required PLTW classes.
Compared to the other reasons for students to enroll in PLTW classes, the teacher and administrator means suggests that fewer students enroll to increase their proficiency in math and science than any of the other reasons. The

Journal of Technology Education Vol. 26 No. 1, Fall 2014
-41-
counselor mean for this question on the other hand suggests that improvement in math and science is a stronger reason for students to take PLTW classes.
These findings about why students enroll in PLTW classes are very important to this research because the reality of keeping any elective class in the school offerings includes the fact that there must be a high enough enrollment to justify the offering. In some schools students who take the course Principles of Engineering may receive a science credit, but the rest of the PLTW classes in the program are elective. These findings seem to indicate that in order for students to want to sign up for a PLTW class they have to fully understand the program and what the classes will teach them. Students may be informed through many different ways as shown in the findings. These different ways must be utilized by program facilitators to attract students into the program. Elective classes have the difficult task of making the class enjoyable for students while still maintaining standards for the grades that are given. A successful PLTW program does depend on facilitators understanding how students receive information concerning PLTW classes and that the information they receive is accurate about what these classes can do for them.
The last section of the questionnaires had questions that asked the group their opinions about factors that enhance student achievement in PLTW classes. Figure 6 shows the responses for the five questions asked of the teachers, administrators, and counselors. The mean for the first questions responses shows that teachers and administrators agree and that counselors strongly agree that student achievement is enhanced if students have pre-existing knowledge in math, science, and technology when they begin a PLTW class. Because of the nature of a pre-engineering class, it makes sense that the more academic skills in math and science that a student possesses the more success they will have in the class. The respondent’s means also indicate that they agree that students’ achievement is enhanced because of the teacher training provided by PLTW. Teacher and counselor training helps insure that students understand what membership in PLTW classes entails and that they will receive instruction the way it was intended to be presented. As mentioned before, a qualified teacher is considered critical in PLTW program success. It is reasonable that a good teacher-training program will help teachers become better at their craft.
Both the administrator and counselor means indicate that they agree that the partnerships PLTW forms between school, industry, and the community also aid in enhancing student achievement and that student achievement is enhanced because of counselor training. However, in both of these questions the teacher mean suggests that they are more neutral, choosing neither agree nor disagree with the statement. This could be because administrators and counselors better understand that student participation in the PLTW program could lead to gainful employment or placement in an educational pathway that could lead to a college degree in engineering, but teachers do not fully understand how these two factors will help their students to be more successful in life. With collaboration

Journal of Technology Education Vol. 26 No. 1, Fall 2014
-42-
between these entities, student understanding of how the program fits in their life could be more evident.
1. Student achievement is enhanced because of pre-existing student knowledge 2. Student achievement is enhanced because of PLTW teacher training 3. Student achievement is enhanced because students are motivated to do well
on end of course exams 4. Student achievement is enhanced because of partnerships formed between
the school, industry, and community 5. Student achievement is enhanced because of counselor training
Figure 6. Part IV: Questionnaire response rates.
Recommendations for Implementation or Restructuring PLTW Courses This research is useful as it provides information to help facilitate the
implementation of successful PLTW programs or improve existing programs. The following recommendations should be considered when implementing or improving a PLTW program.
1. Utilize a dynamic teacher—It was mentioned multiple times in this study by CTE directors and school administrators how important hiring the right teacher is. They indicated that the right PLTW teacher is willing to go the extra mile to make sure the program satisfies the needs of the program and the students in it, perhaps in public relations, industrial relations, or curriculum preparation. It also meant that the teacher is “genuine” to the students and produces an environment conducive to learning. Directors and school administrators were also supportive of the PLTW teacher training that requires teachers to participate in professional development, which gives them state-of-the-art instructional curriculum and shows them the correct instructional methods. Teacher professional development was thought to enhance student achievement. This research has revealed that teacher training is well thought of and is a valuable part

Journal of Technology Education Vol. 26 No. 1, Fall 2014
-43-
of the PLTW program. Enrollment and achievement have been perceived by the participants in this research to increase because of a dynamic teacher that students like. A successful PLTW program depends on finding the right teacher.
2. Capitalize on student interest—One of the findings from this research was that CTE directors, teachers, school administrators, and counselors agree that students genuinely seem interested in the subject and are thought of as wanting to take advantage of the unique learning environment that PLTW offers. It was generally shown in this research that the people who interact with students such as family members, peers, and counselors do aid in helping students to become interested in the class. Realizing this, all the “players” involved in producing the program should do everything they can to capture the interest of the students by providing information about the PLTW program, the instructional methods used, and what the knowledge learned in the class and the credit generated can do for them.
3. Maintain unity and collaboration among team players—Perceptions of the participants in this research indicate that members of the PLTW partnership team must have unity in their sense of mission and purpose and that they support each other. This team includes the teacher, school administrator, counselor, CTE director, school board members, community members, parents, industry partners, and of course students. This research suggests that if all the players recognize and understand the role that each member plays and that their roles should be a collaborative effort in the production of the program, problems are easier to solve, and program efficiency is increased. Collaboration was perceived by the participants in this research to be one of the keys to program success.
4. Get the word out there and make sure students can readily access information—The CTE directors interviewed in this research revealed that a concerted effort has to be put into advertising. The goal should be for all students in the school to know about the PLTW program and what pre-engineering is about. Students need to know what the outcomes of the program are; they need to know what they get for their effort both in a professional career and for domestic general knowledge. Students should also know who they can contact should they have any questions about a class or the program in general. It has been shown in this research that counselors are perceived to be making a difference in getting kids into the program, especially if they have a good understanding of the program and class expectations. Students also need to be well-informed about the types of credit available to them for taking PLTW classes. Credits can be for high school graduation in both elective and science areas, but the CTE interviews and the questionnaires brought out the perception that students also need to understand they can obtain concurrent university credit as
Journal of Technology Education Vol. 26 No. 1, Fall 2014
-44-
well as what type of university credit that is. 5. Make sure kids understand what PLTW course content is about and can
fit it in their schedule—So often, the students make a class choice on what they read in the school registration catalog. It was shown in this research from the CTE director interviews that considerable effort needs to be put into course descriptions so students get a good sense of what the class they are signing up for is about. The findings also revealed that students have a difficult time fitting all the PLTW classes into their schedule. With all the options students have in secondary education, there needs to be a considerable effort in helping students register. Again, counselors are thought of as being influential in helping students with their class choices so they understand the educational paths they are engaging in.
6. Make sure resources are available—This research revealed through the interviews that the PLTW program is expensive. Before implementing the program, everyone involved needs to understand where the funding is coming from and also that there needs to be a suitable facility to operate the classes in.
References
Dearing, B. M., & Daugherty, M. K. (2004). Delivering engineering content in technology education. The Technology Teacher, 64(3), 8–11.
Douglas, J., Iverson, E., & Kalyandurg, C. (2004). Engineering in the K–12 classroom: An analysis of current practices & guidelines for the future. Washington, DC: The American Society for Engineering Education. Retrieved from http://teachers.egfi-k12.org/wp-content/uploads/2010/01/Engineering_in_the_K-12_Classroom.pdf
Fullan, M. (1993). Change forces: Probing the depths of educational reform. London, United Kingdom: Falmer Press.
Jackson, S. (2004). The quiet crisis: Falling short in producing American scientific and technical talent. San Diego, CA: Building Engineering Science and Talent (BEST). Retrieved from http://www.bestworkforce.org/PDFdocs/Quiet_Crisis.pdf
Johnston, L. (2001, June 18). Engineers look inward to combat growing shortage. Charlotte Business Journal. Retrieved from http://charlotte.bizjournals.com/charlotte/stories/2001/06/18/focus3.html
Kelly T. R., Brenner, D. C., & Pieper, J. T. (2010). Two approaches to engineering desing: Observations in sTEm education. Journal of sTEm Teacher Education, 47(2), 5–40. Retrieved from http://scholar.lib.vt.edu/ejournals/JSTE/v47n2/pdf/kelley.pdf

Journal of Technology Education Vol. 26 No. 1, Fall 2014
-45-
Lewis, T. (2004). A turn to engineering: The continuing struggle of technology education for legitimization as a school subject. Journal of Technology Education, 16(1), 21–39. Retrieved from http://scholar.lib.vt.edu/ejournals/JTE/v16n1/pdf/lewis.pdf
Nardi, P. M. (2003). Doing Survey Research: A guide to quantitative research methods. Boston: Allyn & Bacon.
Nathan, M. J., Atwood, A. K., Prevost, A., Phelps, L. A., & Tran, N. A. (2011). How professional development in project lead the way changes high school STEM teachers’ beliefs about engineering education. Journal of Pre-College Engineering Education Research, 1(1), 15–29. Retrieved from http://docs.lib.purdue.edu/cgi/viewcontent.cgi?article=1027&context=jpeer
Nathan, M. J., Atwood, A. K., Prevost, A., & Tran, N. A. (2011). Guidance counselors’ beliefs and expectations about high school students’ precollege engineering preparation. Proceedings of the 119th Annual American Society of Engineering Education Conference, Vancouver, BC, Canada. Retrieved from http://www.asee.org/public/conferences/1/papers/316/download
Nathan, M. J., Tran, N. A., Atwood, A. K., Prevost, A., & Phelps, L. A. (2010). Beliefs and expectations about engineering preparation exhibited by high school STEM teachers. Journal of Engineering Education, 99(4), 409–426. doi:10.1002/j.2168-9830.2010.tb01071.x
National Academy of Engineering and National Research Council. (2009). Engineering in K–12 education: Understanding the status and improving the prospects. Washington, DC: National Academies Press.
National Academy of Sciences, National Academy of Engineering, & Institute of Medicine. (2007). Rising above the gathering storm: Energizing and employing America for a brighter economic future. Washington, DC: National Academies Press.
National Academy of Sciences, National Academy of Engineering, & Institute of Medicine. (2010). Rising above the gathering storm, revisited: Rapidly approaching category 5. Washington, DC: National Academies Press. Retrieved from http://www.aps.org/policy/reports/upload/rags-revisited.PDF
Project Lead The Way. (2013). PLTW home page. Retrieved from http://www.pltw.org
Project Lead The Way. (2013). PLTW press release. Retrieved from http://www.pltw.org/recent-press-releases/pltw-named-elite-list-stem-organizations
Project Lead The Way. (2012). PLTW certification. Retrieved from https://www.pltw.org/get-involved/register-pltw/program-quality
Project Lead The Way. (2011). An overview of Project Lead The Way. Retrieved from http://www.pltw.org/our-programs/our-programs

Journal of Technology Education Vol. 26 No. 1, Fall 2014
-46-
Project Lead The Way. (2009). Project Lead The Way Goals. Retrieved from http://www.pltw.org/about-us/our-approach
Rogers, G. E. (2006). The effectiveness of project lead the way curricula in developing pre-engineering competencies as perceived by Indiana teachers. Journal of Technology Education, 18(1), 65–77. Retrieved from http://scholar.lib.vt.edu/ejournals/JTE/v18n1/rogers.html
Rogers, S. & Rogers, G. E. (2005) Technology education benefits from the inclusion of pre-engineering education. Journal of Industrial Teacher Education, 42(3), 88–95. Retrieved from http://scholar.lib.vt.edu/ejournals/JITE/v42n3/pdf/srogers.pdf
Shields, C. J. (2007). Barriers to the implementation of project lead the way as perceived by Indiana high school principals. Journal of Industrial Teacher Education, 44(3), 43–70. Retrieved from http://scholar.lib.vt.edu/ejournals/JITE/v44n3/pdf/shields.pdf
Task Force on the Future of American Innovation. (2005). The knowledge economy: Is America losing its competitive edge? Washington, DC: Author. Retrieved from http://cte.ed.gov/nationalinitiatives/gandctools_viewfile.cfm?d=600189
Thilmany, J. (2003, May). Catching them younger. Mechanical Engineering, 125(5), 56–58.
Utah State Office of Education. (2010). Technology and engineering education. Retrieved from http://www.schools.utah.gov/cte/tech.html

Journal of Technology Education Vol. 26 No. 1, Fall 2014
-47-
Advancing STEM Career and Learning Through Civic Engagement
The Mayor's Youth Technology Corps (MYTC)—Creating Safe
Communities through Information Technology Training in Homeland Security Applications (2008–2012)—offered a collaboration of resources, supports, and opportunities for strengthening science, technology, engineering, and mathematics (STEM) education efforts in an underserved community, the City of Detroit. This MYTC project achieved three important goals: (a) creating career pathways for two cohorts of 50 high school students (100 total) in geographical information system (GIS) and information technology in the context of application development concerning homeland security and facility management, (b) providing students with inquiry-based STEM learning opportunities through multiple delivery methods, and (c) enhancing students’ hands-on working experiences by offering internships in City of Detroit organizations. By the end of the MYTC project, around 814 students had participated in various activities sponsored by the project and more than 20 teachers served as lead teachers. Among them, 162 students graduated from the summer institutes; 120 students completed in-class, after-school, or online GIS training courses; 84 students went through a hybrid information assurance course; and 98 students successfully finished their internship assignments. A STEM career goal measure showed that overall interest in having a career in STEM increased 9% throughout the program, and there was an additional 10% increase as a result of the internships.
The MYTC internship program is an important form of student civic engagement and also the highlight of hands-on experiences for the MYTC trainees. The internship is the capstone and a true test of how the MYTC students were trained and whether the students were learning what was designed for them in this project. Moreover, the internship program aimed at advancing the participating students’ motivation toward STEM careers. This paper examines the rationale for selecting the internship as the MYTC project’s capstone and the lessons learned through the internship program implementation. The need for an advanced technology-based internship is discussed in the second section. The research design of how to examine critical factors of the internship implementation is presented in the third section. The outcomes of the internship program is are assessed in the fourth section. The lessons learned and future improvements will be discussed in the final conclusion section. Yichun Xie ([email protected]) is Professor of Geography & Geology and Director of Institute for Geospatial Research and Education at Eastern Michigan University.

Journal of Technology Education Vol. 26 No. 1, Fall 2014
-48-
The Significance of Promoting Student Civic Engagement Through Information Technology Based Internships
The employment situation has been dreadful in the Detroit metropolitan area. “Southeast Michigan, and the State of Michigan as a whole, is currently in the midst of serious structural economic trouble. The region has lost jobs since 2000 especially in the auto manufacturing sector” (Southeast Michigan Council of Governments [SEMCOG], 2008, p. 19). Although this region is recovering from a decade-long deep recession, the recovery will be longer and slower than in the past (SEMCOG, 2012). Moreover, the minority communities have been suffering disproportionally in job loses (Shapiro, Meschede, & Osoro, 2013). Among the total population (617,832) of the City of Detroit, 83.7% are African American (U.S. Census Bureau, 2013). Creating and enhancing resources and exposures to careers in science and technology for 65,632 high school students between the ages of 15 and 19 in Detroit (U.S. Census Bureau, 2013) is an extremely challenging but necessary task.
In order to generate STEM learning motivation and create STEM career opportunities for the urban youth, Eastern Michigan University (EMU), the City of Detroit Information Technology Services (ITS), the City of Detroit Office of Homeland Security and Emergency Management (HSEM), and Detroit Public Schools (DPS) came together and developed the MYTC project based on four considerations: (a) demonstrating to the high school students that there are bright career opportunities in information technology and, in particular, GIS; (b) engaging them with real tasks that were in great demand in their own communities; (c) enabling them to have workplace experiences by providing them with paid internships; and (d) motivating their interests in learning STEM in school and seeking STEM careers in the future. We were awarded a grant Innovative Technology Experience for Students and Teachers (ITEST) program, which is funded by the National Science Foundation (NSF), to implement this design.
At the beginning of the new millennium, information technology (IT) was exploding. Three occupations related to IT were listed among the top ten fastest growing occupations: Employment of network systems and data communication analysts was predicted to grow 57% from 2002 to 2012 (the second fastest); employment of computer software engineers–applications was expected to grow 46%, the eighth fastest; and the employment of computer software engineers–systems software was expected to grow 45%, the ninth fastest (U.S. Department of Labor, Bureau of Labor Statistics, 2004). Moreover, “because the uses for geospatial information technology were so widespread and diverse, the market was growing at an annual rate of almost 35 percent, with the commercial subsection of the market expanding at the rate of 100 percent each year. (Geospatial Information & Technology Association)” (U.S. Department of Labor, Employment and Training Administration, 2010).

Journal of Technology Education Vol. 26 No. 1, Fall 2014
-49-
Geographic information systems (GIS)—and the analytical tools for using these systems wisely—now play a fundamental role in the provision of emergency services, transportation and urban planning, environmental hazard management, resource exploitation, military operations, and the conduct of relief operations. In the years ahead, geographical tools and techniques will be of vital importance to the effort to monitor, analyze, and confront the unprecedented changes that are unfolding on Earth’s surface. (National Research Council, 2010, p. ix)
Geospatial (GIS, global positioning system, and remote sensing) technology, along with nanotechnology and bio-engineering, was cited as one of three emerging industries (Gewin, 2004). Using emerging technologies was found to be an effective approach to facilitate science learning and civic engagement (Green, 2012).
In addition, almost all enterprises were using the Internet to disseminate location-related (geographic) data in map forms using Web GIS (Green, 1997; Rohrer & Swing, 1997; Peng & Tsou, 2003). With the increasing popularity of global on-line mapping web applications (e.g., Google Maps, Microsoft Virtual Earth, Yahoo Maps, ArcGIS Online), Web GIS was part of “business exchange,” and there was an ever-growing volume of literature and public participation (e.g., Carver, 2001; Clark, Monk, & Yool, 2007; Kulo & Bodzin, 2013). Therefore, there was no better time for youth to be part of IT and GIS because the information technology field (including geospatial technology) was expanding at an exponential rate. Career opportunities were virtually unlimited, as was the range of businesses in which computer skills could be utilized. Banking, engineering, film production, forestry, health, homeland security, manufacturing, management consulting, and mining—practically every industry—were now using computers and needed people to manage, use, network, or program them. Technical skills were also very portable, a circumstance that made a career in information technology very attractive to people who liked to experience different cultures. Moreover, computers and the networks that connect them were inescapably part of our lives.
Demonstrating the use of IT and GIS to the urban youth in the underserved community of Detroit was particularly mindful (Xie and Reider, 2014). The cultural dimension of IT and GIS integration in education and society was worth special attention. The applications of IT and GIS tools in education and society could neither be seen apart from their objectives nor be considered apart from the cultural-historical contexts in which the human subjects participated (Leidner & Jarvenpaa, 1995; Kali, 2002; van Eijck & Roth, 2007; Literat, 2013). Above all, IT and GIS were about people sharing information and innovative ideas that eliminated global barriers and helped increase the availability of information to everyone. IT went far beyond standard classroom learning (or formal education). After-school programs or informal education opportunities, alternatively, created environments that could effectively inspire, augment, and
Journal of Technology Education Vol. 26 No. 1, Fall 2014
-50-
reinforce science and technology learning for school children. They were creating the kind of “intentional figured communities” seen as essential in Teresa Perry’s theory of African-American achievement (Perry, 2003).
Second, an important civic engagement component was to involve the students with real tasks that were in great demand in their own communities. GIS, as a unique sector of information technology, was continuously expanding its scope of applications in almost every aspect of our society and increasing its power of problem solving along with the rapid advancement of information. Furthermore, the current economic slowdown and high unemployment made the civic engagement component much more significant, outstanding, and relevant. In 2013, the City of Detroit implemented furlough days in order to solve the budget crisis (Associated Press, 2013). Trained MYTC interns were widely welcomed by the city organizations that hosted them. The internship supervisors in these departments, as well as the department directors, expressed their appreciation to the NSF ITEST program for the funding support to the MYTC project in Detroit. They strongly believed that this support from the NSF ITEST program helped them fulfill not only temporary vacancies but also an important city government mission, providing opportunity of training Detroit youth in technical careers. No doubt, the long-term support from NSF was critical for developing STEM learning and career projects in our communities (Burns, 2013).
Third, the internship program implemented place-based learning to establish natural linkages between technologies and neighborhood socioeconomics (Elder, 1998; Krapfel, 1999; Wessels, 1999). In other words, the project activities were occurring in the students’ milieu (Hunter & Xie, 2001; Henry & Semple, 2012). As students participated in project activities (i.e., learning IT and GIS and applying them in city organizations), they would enhance their STEM learning by becoming community citizens and by helping the hiring agencies to conduct IT- and GIS-related jobs or tasks. Thus, the project provided an opportunity for students to use their own community as a platform for learning, which allowed them to create “a set of building blocks from which to construct a life” (Nabhan & Trimble, 1994, p. 131).
Fourth, the civic engagement—internship—enabled the participating students to have workplace experiences and to earn some stipends through paid internships. Hands-on learning activities inspired a sense of excitement, adventure, and emotional engagement for learning (National Research Council, 2005). Income has been found to be directly correlated to the recruitment and retention of students in STEM programs in urban areas, where income amongst households is relatively low (Dayton, Raby, Stern, & Weisberg, 1992; Neumark & Rothstein, 2005). Thus, “learning with earning” (the paid internship) was intended to motivate students to attend IT and GIS training.
Finally, all of the above activities motivated the students’ interests in learning STEM in schools and seeking STEM careers in the future. A review of

Journal of Technology Education Vol. 26 No. 1, Fall 2014
-51-
the current literature revealed that classroom science engaged only a small percentage of students and involved even fewer low-income, female, or minority students (Tobin, 2005; National Research Council, 2011). Therefore, demonstrating the bright future of STEM careers in IT and GIS, encouraging them to help solve the issues their communities were facing, and enabling them to have workplace experiences were purposefully advancing their interest in STEM careers and learning. In other words, the individuals’ perceptions of their current and imagined future opportunities were serving as motivators and organizers for their current task-related thoughts, attitudes, and behaviors, thus linking current specific plans and actions to future desired goals (Stake &Mares, 2005). As such, workplaces and communities proved to be more optimal places of learning for minority and low-income as well as female students.
Research Design: How to Examine Critical Factors of the Internship
Program During the MYTC project, 115 students completed the required technology
and discipline training for the internship. Among them, 104 were placed as the MYTC interns, and 98 successfully completed their internship assignments in 14 organizations located in the City of Detroit (Table 1). Among numerous factors, we found that the following determinants were critical for successfully implementing the MYTC civic engagement component, the internship: cooperation of key stakeholders, promise of future career, societal satisfaction, provision of service values, technical skill, adequate discipline, and governmental and public support. Under the guidance of the Simpson-Troost Attitude Questionnaire (STAQ), three sets of tests were developed in order to examine these determinants (Simpson & Troost, 1982; Simpson & Oliver, 1985). Good literature reviews about STAQ were provided by Owen et al. (2008) and Liaghatdar, Soltani, and Abedi (2011).

Journal of Technology Education Vol. 26 No. 1, Fall 2014
-52-
Table 1 List of Organizations in the City of Detroit Hosting the MYTC Interns
Intern Hosting Organizations # of Interns
Hosted City Department of Water & Sewage 31 City Fire Department 23 Essential Learning Services 11 DTE Energy 8 City Department of Environmental Affairs 4 City Department of Transportation 4 Detroit Public Schools 4 City Department of Human Resources 4 City Homeland Security & Emergency Management Office 3 City Department of Creative Communications Services 2 Governor's Office in Southeastern Michigan 1 City Department of Health & Wellness Promotion 1 City Information Technology Service 1 City Department of Public Lighting 1
Total 98
The first test was a pre-internship survey of 27 students who were about to start the internship. The survey questions mainly concerned the reasons why they wanted to participate in the MYTC internship program (Figure 1). For the second set of tests, we surveyed the same 27 students at the internship workplaces about their general reflections on their internship experiences. We also surveyed these interns’ supervisors at the hiring agencies (n = 10) about the organizational reflections of the student interns. We compared the two sets of general reflections in Figure 2.

Journal of Technology Education Vol. 26 No. 1, Fall 2014
-53-
Figure 1. Reasons why students wanted to participate in the internship program
Figure 2. General reflections of the internship program from the participating students and agency supervisors

Journal of Technology Education Vol. 26 No. 1, Fall 2014
-54-
As a follow up, we interviewed the same 27 interns and 8 supervisors with
the same set of questions pertaining to specific outcomes of the MYTC internship assignments. The responses from the interns are reported in Figure 3, while the correspondences from the supervisors are reported in Figure 4.
Figure 3. The self-assessment of the internship experience by students
The third evaluation tool was comprised of the pre- and post-intern surveys, which were specifically designed to examine how the internship experience changed the students’ perception about STEM careers (Table 2). The pretest survey was required for all of the MYTC interns when they started their internship assignments at the hiring organizations. The posttest survey was carried out when the MYTC interns completed their assignments.

Journal of Technology Education Vol. 26 No. 1, Fall 2014
-55-
Figure 4. The assessment of students’ internship experience from agency supervisors
Assessment of the Internship Outcomes
Cooperation among key stakeholders was the most important driving factor for the successful execution of a civic engagement project (the MYTC internship program in this case). Education in schools played a significant role in leading students into civic engagement (Kennedy, 2013). Teachers were mentors and facilitators to students’ engagement in civic activities (Lozano, Gutierrez, & Martos, 2013). It was also critical to connect schools with universities and communities for the success of a civic learning project (Vogt, 2013). The social organization was particularly important for expanding minority student participation in civic engagement activities (Farmer, 2006; National Research Council, 2011). These arguments were all confirmed in the MYTC internship program. The active participation of the organizational internship supervisors in the assessment and their positive evaluations of the internship program provided good evidence of the internship success (Figure 2

Journal of Technology Education Vol. 26 No. 1, Fall 2014
-56-
and Figure 4). We found that the shared vision, ownership, resources, and support among local and regional stakeholders guaranteed the success of the MYTC internship program.
From the very beginning of the MYTC project, a formal internship agreement was signed among Eastern Michigan University (EMU), the City of Detroit Information Technology Services (ITS), the City of Detroit Homeland Security and Emergency Management (HSEM), and Detroit Public Schools (DPS). The main points of this cooperation agreement included:
• DPS would designate A. Philip Randolph Career/Technical Center (CTC) as the manager of the MYTC internship program. CTC would select trainees, teach trainees about workplace ethics, process paper work (including the MYTC Internship Agreement, Internship Application Form, Employment Authorization Form, W-9 Form, Parents Consent Form, Liability Release Form, and Intern Transportation Request Form), and monitor internship timesheets;
• EMU and the MYTC project staff team would prepare MYTC trainees with adequate GIS and information technology skills through in-class sessions, afterschool trainings, and online virtual courses as well as provide technical support to MYTC interns at the workplace if needed;
• EMU through the NSF ITEST grant would pay $1,200 per internship for MYTC interns who had adequate GIS skills and workplace ethics and successfully completed workplace assignments with120 hours;
• HSEM would act as the liaison between the MYTC project and City of Detroit departments and organizations to place interns in the City of Detroit; and
• ITS would designate an Internship Coordinator to oversee the internship program, would provide the intern with a letter of completion for future job applications upon an intern's successful completion of the workplace assignments and would, at its discretion, arrange continued employment in a city department or organization.
The promise of future career opportunities was the most attractive incentive for students’ participation in the internship program, confirming the findings of Stake and Mares (2005). More than 83% of the surveyed interns completely agreed that “build my resume” was the top reason for their participation in the internship (Figure 1). The majority of them felt very positive about their workplace experiences (Figure 2, the last row). Eighty percent of them had excellent reflections about “work experience,” “discipline training,” “knowledge gain,” and “career awareness.” In addition, the internship supervisors ranked “career awareness” as their top reflection of the interns’ achievement (Figure 2, the second to last row).
Societal satisfaction was often neglected in the literature concerning the reasons for community support to students’ civil engagement (Grillo, Teixeira, & Wilson, 2010; Zaff, Boyd, Li, Lerner, & Lerner, 2010). We recognized the

Journal of Technology Education Vol. 26 No. 1, Fall 2014
-57-
importance of winning support from the students’ parents and communities. So, we organized bimonthly briefings for teachers, parents, and community leaders, informing them about the progress of the project implementation, including training activities, internship processes, and career opportunities. As a result, we had strong support and high satisfaction from the communities. For instance, the students were strongly encouraged by their parents and teachers to participate in the internship program (Figure 1). The internship supervisors were very positive about the program and contributions of the interns (Figure 4).
The provision of service values was another important factor to gain community support for student civic engagement projects (Prentice, 2007). The majority of the interns were confident about the contributions they made to the hiring organizations. They gave high marks to the interview questions, “I completed useful tasks,” “I added a fresh component,” and “I helped them understand future workers” (Figure 3). Furthermore, their supervisors agreed with them. More than 80% of the supervisors completely agreed that the interns really did complete useful tasks (Figure 4).
Well-trained technical skill was a prerequisite for a student to succeed in a civic engagement project and especially in an information technology based one (Henry & Semple, 2012). However, the consciousness of civic duty and discipline was as important as the technical skill for successfully participating in civic engagement activities (Zaff et al. 2010). In addition to gaining practice using technology skills acquired in the program, the students learned about the workplace culture, including discipline, respect, how to dress, how offices and departments function, and a range of other operational and experiential details not easily communicated in a typical school setting. Notably, both interns and supervisors reflected the equal importance of skill and discipline in their responses to the interview questions (Figure 3 and Figure 4).
Another point we wanted to emphasize was the significance of governmental and public support in the success of the MYTC internship program. The internship program proved one of the most compelling and rewarding components of the MYTC project. The stipends for the interns were paid out of the NSF ITEST grant. Therefore, it was very important to have the NSF ITEST program support in order to carry out the MYTC project in the City of Detroit.
Finally, from the pre- and post-surveys, we assessed how students felt about future careers. When asked, “What kind of job do you expect to be doing when you grow up? (check the ONE job category you would be MOST interested in doing),” changes in different categories suggest that program participation had some impact on their perceptions of their future job aspirations. Students who completed the internships also showed slightly more changes in areas related to STEM skills (Table 2).

Journal of Technology Education Vol. 26 No. 1, Fall 2014
-58-
Table 2 The Pre- and Post-Surveys of the Students’ Career Goals (n = 98)
Survey questions about career goals Pre Post Change Science and Engineering (like scientists, engineers, computer programmers)
18% 28% 10%
Medicine (like nurses, doctors, physical therapists, dentists)
18% 19% 1%
Architecture and Construction (like builders, planners, architects)
4% 4% 0%
Finance (like bank tellers, economists, financial managers, insurance agents)
2% 2% 0%
Agriculture and Natural Resources (like park rangers, farmers, gardeners)
0% 0% 0%
Not Working 0% 0% 0% Business and Marketing (like accountants, file clerks, office managers, and receptionists)
14% 13% -1%
Education and Counseling (like coaches, teachers, librarians, psychologists)
10% 9% -1%
Government, Law, Security (like lawyers, police, inspectors, politicians, postal clerks)
8% 7% -1%
Don’t Know 4% 3% -1% Transportation (like pilot, truck driver, auto mechanic)
2% 1% -1%
Arts, Entertainment, Sports, Communications, and Tourism (like chefs, athletes, artists, singers, fashion designers, travel agents)
12% 10% -2%
Manufacturing and Repair (like forklift operators, welders)
8% 4% -4%
Conclusions and Discussion
Connecting the information technology training (GIS in particular) to paid positions in the form of internships and civic engagement provided not only real-world problem-solving experiences but gave the students a sense of what an actual job looked like and how one should behave, dress, and communicate in the workplace. The program received encouragement from teachers, endorsement from parents, and praise from internship supervisors. The internships provided a tangible end goal for students during their year(s) of engagement, and they always had a sense of where it would lead them.

Journal of Technology Education Vol. 26 No. 1, Fall 2014
-59-
Students of the target population in this underserved urban community had great drive when it became clear to them that the learning materials were relevant and technological and would increase job and career opportunities. In addition, internships provided a critical platform for students to immediately demonstrate and put into use their newfound knowledge, while contributing useful work to the City of Detroit and getting paid for doing it. Furthermore, interns built up resumes, established professional contacts, and gained on-the-job experiences beyond technology. Ideally, a program related to building STEM skills toward career alignment should have an internship component.
We assessed several factors influencing the internship program. Noticeably, the evaluation data from both interns and their workplace supervisors showed that the critical factors for successfully implementing the MYTC internship program were: cooperation of key stakeholders, promise of a future career, societal satisfaction, provision of service values, technical skill, adequate discipline, and governmental and public support.
The internships’ impact on participants’ future perception of STEM careers, as described by the data analysis in the fourth section, was significant. As a result of the internship experiences, a good number of students started seriously thinking about STEM career options in tangible ways, including future study.
However, there are some other lessons we learned from the MYTC project. The scalability of the MYTC civic engagement (the internship) is a challenging question because the stipend for the interns came from a NSF ITEST grant. Therefore, simple adaptation of a similar civic engagement is unlikely in other metropolitan areas. Thus, the scalability of such a project will depend upon local municipal needs and resources to support paid internships, which proved to be an important incentive in the underserved community of Detroit.
A couple of findings are worth further discussion. The MYTC project provided funding to City of Detroit municipal departments and organizations to hire participating students as interns; in turn, students contributed to real-world applications and solutions. Each supervisor reported that the internship provided an extremely cost-effective option to recruit, train, and employ high school and precollege students. Their interest was not so much in getting work done with the payment from someone else as it was in recruiting and training those who might become their future pool of employees. As a result of the serious city deficit experienced in Detroit during the program years, not many municipal departments had funding to support interns beyond the program’s end. Only four interns continued their employment on the city payroll. However, each supervisor interviewed pledged that in different circumstances, they would rush to develop internship programs based on the successes they saw with MYTC. We believe that the municipal and business communities of major cities would find this model viable and rewarding with additional ties to service learning and workforce development. In the future, we need to look into how to build an

Journal of Technology Education Vol. 26 No. 1, Fall 2014
-60-
organizational structure in order to provide sustained financial resources to support students’ participation in civic activities in underserved communities.
Acknowledgement
This paper was supported in part by Innovative Technology Experience for Students and Teachers (ITEST) program of the National Science Foundation (NSF) under Grant No. DRL-0737589. The evaluation data collection and analysis from The Education Design, LLC, was also appreciated. Any opinions, findings, and conclusions or recommendations expressed in this material are those of the author(s) and do not necessarily reflect the views of the National Science Foundation. http://www.nsf.gov/pubs/gpg/nsf04_23/6.jsp
References Associated Press (2013, April 8). Some Detroit city offices closed for furlough day.
Crain's Detroit Business. Retrieved from http://www.crainsdetroit.com/article/20130408/NEWS01/130409884/some-detroit-city-offices-closed-for-furlough-day#.
Burns, W. D. (2013). Some thoughts on the benefits of long-term NSF support: What I would have said if I had time to say it. Science Education and Civic Engagement, 5(1), 5–11. Retrieved from http://seceij.net/seceij/winter13/publishers_note.html
Carver, S. (2001). Public participation using web-based GIS. Environmental and Planning B: Planning and Design, 28, 803–804. doi:10.1068/b2806ed
Clark , A. M., Monk, J., & Yool, S. R. (2007). GIS pedagogy, web-based learning and student achievement. Journal of Geography in Higher Education, 31(2), 225–239. doi:10.1080/03098260601063677
Dayton, C., Raby, M., Stern, D., & Weisberg, A. (1992). The California partnership academies: Remembering the “forgotten half.” The Phi Delta Kappa, 73(7), 539–545.
Elder, J. (1998). Teaching at the edge. In J. Elder (Ed.), Stories in the land: A place-based environmental education anthology (pp. 1–15). Great Barrington, MA: The Orion Society. Retrieved from http://www.orionmagazine.org/i/documents/SIL-complete.pdf
Farmer, G. L. (2006). African American males’ civic engagement: The importance of social organization involvement and friendship diversity. Journal of African American Studies, 10(2), 51–68. doi: 10.1007/s12111-006-1003-6
Gewin, V. (2004). Careers and recruitment: Mapping opportunities. Nature, 427, 376–377. doi:10.1038/nj6972-376a
Green, D. R. (1997). Cartography and the Internet. The Cartographical Journal, 34(1), 23–27. Retrieved from http://www.maneyonline.com/doi/abs/10.1179/caj.1997.34.1.23
Green, D. P. J. (2012). Using emerging technologies to facilitate science learning and civic engagement. Science Education and Civic Engagement, 4(2), 18–33. Retrieved from http://seceij.net/seceij/summer12/using_emerging_.html

Journal of Technology Education Vol. 26 No. 1, Fall 2014
-61-
Grillo, M. C., Teixeira, M. A., &Wilson, D. C. (2010). Residential satisfaction and civic engagement: Understanding the causes of community participation. Social Indicators Research, 97(3), 451–466. doi:10.1007/s11205-009-9511-0
Henry, P., & Semple, H. (2012). Integrating online GIS into the K–12 curricula: Lessons from the development of a collaborative GIS in Michigan. Journal of Geography, 111(1), 3–14. doi:10.1080/00221341.2011.549237
Hunter, B., & Xie, Y. (2001). Data tools for real-world learning. Learning & Leading with Technology, 28(7), 18–24.
Kali, Y. (2002). CILT2000: visualization and modeling. Journal of Science Education and Technology, 11(3), 305–310. doi:10.1023/A:1016089006485
Kennedy, K. J. (2013). Civic learning in the “real world”: schools and community as sites for student engagement. In A. Brunold & B. Ohlmeier (Eds.) School and community interactions: Interface for political and civic education (pp. 13–32). Wiesbaden, Germany: Springer Fachmedien Wiesbaden. doi:10.1007/978-3-531-19477-6_2
Krapfel, P. (1999). Deepening children’s participation through local ecological investigations. In G. A. Smith & D. R. Williams (Eds.) Ecological education in action: On weaving education, culture, and the environment (pp. 47–64). Albany, NY: State University of New York Press.
Kulo, V., & Bodzin, A. (2013). The impact of a geospatial technology-supported energy curriculum on middle school students’ science achievement. Journal of Science Education and Technology 22(1), 25–36. doi:10.1007/s10956-012-9373-0
Leidner, D. E., & Jarvenpaa, S. L. (1995). The use of information technology to enhance management school education: A theoretical view. MIS Quarterly, 19(3), 265–291.
Liaghatdar, M. J., Soltani, A., & Abedi, A. (2011). A validity study of attitudes toward science scale among Iranian secondary school students. International Education Studies, 4(4), 36–46. doi:10.5539/ies.v4n4p36
Literat, I. (2013). Participatory mapping with urban youth: The visual elicitation of socio-spatial research data. Learning, Media and Technology, 38(2), 198–216. doi:10.1080/17439884.2013.782037
Lozano, J. A. M., Gutierrez, M. P., & Martos, S. D. (2013). Education centers and citizenship education: Teachers’ perspectives. In A. Brunold & B. Ohlmeier (Eds.), School and community interactions: Interface for political and civic education (pp. 197–212). Wiesbaden, Germany: Springer Fachmedien Wiesbaden. doi:10.1007/978-3-531-19477-6_12
Nabhan, G. P., & Trimble, S. (1994). The geography of childhood: Why children need wild places. Boston, MA: Beacon Press.
Neumark, D., & Rothstein, D. (2005). Do school-to-work programs help the “forgotten half”? (Working Paper No. 11636). Cambridge, MA: National Bureau of Economic Research. Retrieved from http://www.nber.org/papers/w11636
National Research Council. (2005). America's lab report: Investigations in high school science. Washington, DC: National Academies Press.

Journal of Technology Education Vol. 26 No. 1, Fall 2014
-62-
National Research Council. (2010). Understanding the changing planet: Strategic directions for the geographic sciences. Washington, DC: National Academies Press.
National Research Council. (2011). Expanding underrepresented minority participation: America's science and technology talent at the crossroads. Washington, DC: National Academies Press.
Owen, S. V., Toepperwein, M. A., Marshall, C. E., Lichtenstein, M. J., Blalock, C. L., Liu, Y., . . . Grimes, K. (2008). Finding pearls: Psychometric reevaluation of the Simpson-Troost Attitude Questionnaire (STAQ). Science Education, 92(6), 1076–1095. doi:10.1002/sce.20296
Peng, Z.-R., & Tsou, M.-S. (2003). Internet GIS: Distributed geographic information services for the internet and wireless networks. New York, NY: Wiley.
Perry, T. (2003). Up from the parched earth: Toward a theory of African-American achievement. In T. Perry, C. Steele, & A. Hilliard III (Ed.), Young, gifted, and Black: Promoting high achievement among African-American students (pp. 1–10). Boston, MA: Beacon Press.
Prentice, M. (2007). Service learning and civic engagement. Academic Questions, 20(2), 135–145. doi:10.1007/s12129-007-9005-y
Rohrer, R. M., & Swing, E. (1997). Web-based information visualization. IEEE Computer Graphics and Applications, 17(4), 63–69. doi:10.1109/38.595269
Southeast Michigan Council of Governments. (2008). 2035 forecast for Southeast Michigan: population, households, and jobs for counties, cities, villages, and townships 2005–2035. Retrieved from http://www.thedetroithub.com/site/user/files/2035%20Forecast%20for%20Southeast%20Michigan%20Population,%20Households%20and%20Jobs.pdf
Southeast Michigan Council of Governments. (2012). Retrenchment and renewal: The economic and demographic outlook for Southeast Michigan through 2040. Retrieved from http://library.semcog.org/InmagicGenie/DocumentFolder/RetrenchmentandRenewal.3-12.pdf
Simpson, R. D., & Oliver, J. S. (1985). Attitude toward science and achievement motivation profiles of male and female science students in grades six through ten. Science Education, 69(4), 511–525. doi:10.1002/sce.3730690407
Simpson, R. D., & Troost, K. M. (1982). Influences on commitment and learning of science among adolescent students. Science Education, 66, 763–781. doi:10.1002/sce.3730660511
Stake, J. E., & Mares, K. R. (2005). Evaluating the impact of science-enrichment programs on adolescents’ science motivation and confidence: The splashdown effect. Journal of Research in Science Teaching, 42(4), 359–375. doi:10.1002/tea.20052
Tobin, K. (2005, September). Using science education to expand the agency of urban youth (Keynote address). Paper presented at the second annual symposium on Optimizing Science Achievement for All Students, University of Maryland Institute for Minority Achievement and Urban Education, College

Journal of Technology Education Vol. 26 No. 1, Fall 2014
-63-
Park, MD. Retrieved from https://www.education.umd.edu/mimaue/institute/symposium/2005/Tobin.pdf
U.S. Census Bureau. (2013). ACS demographic and housing estimates: 2007–2011 American community survey 5-year estimates. Retrieved from http://factfinder2.census.gov/faces/tableservices/jsf/pages/productview.xhtml?pid=ACS_11_5YR_DP05
U.S. Department of Labor, Bureau of Labor Statistics. (2004, February 11). BLS releases 2002-12 employment projections (News Release) .Retrieved from http://www.bls.gov/news.release/archives/ecopro_02112004.pdf
U.S. Department of Labor, Employment and Training Administration. (2010). High growth industry profile—Geospatial technology. Retrieved from http://www.doleta.gov/BRG/Indprof/geospatial_profile.cfm.
van Eijck, M., & Roth, W.-M. (2007). Rethinking the role of information technology-based research tools in students’ development of scientific literacy. Journal of Science Education and Technology, 16(3), 225–238. doi:10.1007/s10956-007-9045-7
Vogt, T. C. (2013). University-community links: Connecting universities, schools, and communities through music video production. In A. Brunold & B. Ohlmeier (Eds.) School and community interactions: Interface for political and civic education (pp. 227–236). Wiesbaden, Germany: Springer Fachmedien Wiesbaden. doi:10.1007/978-3-531-19477-6_14
Wessels, T. (1999). Reading the landscape’s history. In C. W. Leslie, J. Tallmadge, & T. Wessels, Into the field: a guide to locally focused teaching (pp. 59–81). Great Barrington, MA: The Orion Society.
Xie, Y., & Reider, D. (2014). Integration of innovative technologies for enhancing students’ motivation for science learning and career. Journal of Science Education and Technology, 23(3), 370–380. doi:10.1007/s10956-013-9469-1
Zaff, J., Boyd, M., Li, Y., Lerner, J. V., & Lerner, R. M. (2010). Active and engaged citizenship: Multi-group and longitudinal factorial analysis of an integrated construct of civic engagement. Journal of Youth and Adolescence, 39(7), 736–750. doi:10.1007/s10964-010-9541-6

Journal of Technology Education Vol. 26 No. 1, Fall 2014
-64-
Technology and Engineering Education Accommodation Service Profile: An Ex Post Facto
Research Design
Technology and engineering educators have an opportunity to serve a vital role in contributing to or assisting in the guidance of educational programming for students qualifying for accommodation services. Specifically, students identified as having categorical disabilities or Limited English Proficiency (LEP) may have transitional goals (Plotner, Trach, & Shogren, 2012), adaptive instructional needs (Fasting, 2010), positive behavior support requirements (Thelen & Klifman, 2011), or other necessary academic accommodations.
The Individuals with Disabilities Education Act (IDEA) identifies 13 different categorical disabilities: (1) autism, (2) deaf-blindness, (3) deafness, (4) emotional disturbance, (5) hearing impairment, (6) intellectual disability, (7) multiple disabilities, (8) orthopedic impairment, (9) other health impairment, (10) specific learning disability, (11) speech or language impairment, (12) traumatic brain injury, or (13) visual impairment (National Dissemination Center for Children with Disabilities, 2012). The IDEA specifies that an individual cannot be identified under a disability service category due to English reading, comprehension, or speech if it is not his or her primary language for communication. However, alternative services are extended to students with LEP until a level of English proficiency is achieved to participate meaningfully in standard educational programming (U.S. Department of Education, Office for Civil Rights, 2005). Similar to students with disabilities, students with LEP have special testing and academic accommodations.
Accommodation services are vast in array for students with categorical disabilities and LEP, but all encompass necessary academic adjustments that are essential to the educational participation of students qualifying for assistance. Academic modifications can include prolonged time on assessments and involve the provision of supplementary supports and aids. Auxiliary support services include “note-takers, readers, recording devices, sign language interpreters, screen-readers, voice recognition and other adaptive software or hardware for computers, and other devices designed to ensure the participation of students with impaired sensory, manual or speaking skills in an institution’s programs and activities” (U.S. Department of Education, Office for Civil Rights, 2011, p. 4).
Jeremy V. Ernst ([email protected]) is an associate professor in the Integrative STEM Education Program at Virginia Tech. Thomas O. Williams Jr. ([email protected]) is an associate professor in the Special Education Program at Virginia Tech.

Journal of Technology Education Vol. 26 No. 1, Fall 2014
-65-
Tavakolian & Howell (2012) note a broader educational subgroup category, at-risk students, which is inclusive of students with disabilities and LEP. At-risk students are described as students who are susceptible to non-continuation of academic studies stemming from both school-based and individual factors. Further, at-risk students have an elevated prospect of academic failure and are from special populations. According to the Carl D. Perkins Career and Technical Education Improvement Act of 2006, special populations, as a student subgroup, are defined as:
• Individuals with categorical disabilities; • Individuals from economically disadvantaged families, including foster
children; • Individuals preparing for non-traditional fields; • Single parents, including single pregnant women; • Displaced homemakers; and • Individuals with limited English proficiency. (p. 7)
Within this article, students referred to as at-risk were from two specific special populations within this group, individuals with disabilities and individuals with limited English proficiency.
“Legislation and the inclusion movement have not just relocated children from self-contained to inclusive classrooms. The movement has had a serious impact on the roles and responsibilities of teachers. General educators are responsible for the performance of growing numbers of diverse students in their classroom” (Green & Casale-Ciannola, 2011, p.12). Teachers in inclusive settings generally support the degree of student access to learning experiences that inclusion requires; however, teachers typically identify themselves as unprepared to deliver instruction to students with disabilities or students requiring educational intervention (Bender, 2008; Bender, 2002; Bender & Shores, 2007). However, outside of disabilities services, the necessary resources and support for these subgroups have not been provided to the level required.
The speculative shift in enrollment patterns of these students is becoming a reality (Green & Casale-Ciannola, 2011), although discipline specific and content area prevalence is largely unreported. Additionally, “for an undetermined reason, students identified as at-risk exhibit tendencies to engage in technology education courses” (Ernst & Moye, 2013, p.11). This elicits the questions: What is the typical service load (number of students taught) of technology and engineering teachers of regarding students with at-risk indicators (specifically, categorical disabilities and LEP)? Also, are there specific course offerings within technology and engineering education that have higher service loads for at-risk students than others?

Journal of Technology Education Vol. 26 No. 1, Fall 2014
-66-
Research Questions The purpose of this study was to determine the normative service capacity
of technology and engineering teachers for students qualifying for accommodation services and to investigate potential service load differences based on course offerings. Using the most currently available Schools and Staffing Survey results, two guiding research questions were explored:
1) What is the typical service load of a technology and engineering educator pertaining to students who qualify for accommodation services (identified as having a categorical disability or classified as having Limited English Proficiency)?
2) Are there differences among specific categorical course offerings within technology and engineering education regarding service load for students who qualify for accommodation services (identified as having a categorical disability or classified as having Limited English Proficiency)?
Research Question 1 was investigated through frequency and proportional accounts of weighted technology and engineering education teacher reports of students with identified categorical disabilities and LEP whom they taught within the duration of a single academic year. Research Question 2 was explored through testing associated investigational hypotheses:
a) There is no difference in service load (categorical disability and LEP) of technology and engineering educators teaching manufacturing technology and construction technology courses.
b) There is no difference in service load (categorical disability and LEP) of technology and engineering educators teaching communication technology and construction technology courses.
c) There is no difference in service load (categorical disability and LEP) of technology and engineering educators teaching communication technology and manufacturing technology courses.
d) There is no difference in service load (categorical disability and LEP) of technology and engineering educators teaching general technology education and construction technology courses.
e) There is no difference in service load (categorical disability and LEP) of technology and engineering educators teaching general technology education and manufacturing technology courses.
f) There is no difference in service load (categorical disability and LEP) of technology and engineering educators teaching general technology education and communication technology courses.
This research examined collective and stratified technology and engineering educator service load regarding students with categorical disabilities and LEP through secondary dataset analysis. The 2007–2008 Schools and Staffing Survey (SASS), administered by the National Center for Education Statistics (NCES), was chosen as the dataset for this this study largely due to the intricacy and size

Journal of Technology Education Vol. 26 No. 1, Fall 2014
-67-
of the information provided. Use of this dataset allowed for weighted identification and analysis between offerings regarding accommodation services of technology and engineering educators from a national perspective.
Instrumentation The SASS is conducted by the NCES “on behalf of the U.S. Department of
Education in order to collect extensive data on American public and private elementary and secondary schools. SASS provides data on the characteristics and qualifications of teachers and principals, teacher hiring practices, professional development, class size, and other conditions in schools across the nation. SASS is a large-scale sample survey of K–12 school districts, schools, teachers, library media centers, and administrators in the United States” (Tourkin et al., 2010, p. 1).
“SASS was designed to produce national, regional, and state estimates for public elementary and secondary schools and related components (e.g., schools, teachers, principals, school districts, and school library media centers); national estimates for [Bureau of Indian Education] BIE-funded and public charter schools and related components (e.g., schools, teachers, principals, and school library media centers); and national, regional, and affiliation strata estimates for the private school sector (e.g., schools, teachers, and principals)” (p. 9). “Therefore, SASS is an excellent resource for analysis and reporting on elementary and secondary educational issues” (p. 1).
The “SASS consisted of five types of questionnaires: a School District Questionnaire, Principal Questionnaires, School Questionnaires, Teacher Questionnaires, and a School Library Media Center Questionnaire” (p. 2). This study used data from the SASS Teacher Questionnaire to address the research questions. Because “the overall objective of SASS is to collect the information necessary for a comprehensive picture of elementary and secondary education” (p. 2), the SASS Teacher Questionnaire component was used “to obtain information about teachers, such as education and training, teaching assignment, certification, workload, and perceptions and attitudes about teaching” (p. 6).
Participant groups for this study were defined as General Technology, Manufacturing Technology, Communication Technology, and Construction Technology teachers. The groups were defined by teacher responses to SASS Question 15: “This school year, what is your MAIN teaching assignment field at THIS school?” Their responses were given a numerical code by SASS interviewers indicating their main teaching subject area. The researchers chose the four codes that corresponded most closely to the target participant groups.
The number of students with categorical disabilities and LEP for each teaching group was examined in this study. To determine the number of students with categorical disabilities, the researchers used teacher responses to SASS Question 13: “Of all the students you teach at this school, how many have an Individualized Education Program (IEP) because they have disabilities or are

Journal of Technology Education Vol. 26 No. 1, Fall 2014
-68-
special education students?” Likewise, to determine the number of students with LEP, the researchers used teacher responses to SASS Question 14: “Of all the students you teach at this school, how many are of Limited English Proficiency? (Students of Limited English Proficiency [LEP] are those whose native or dominant language is other than English and who have sufficient difficulty speaking, reading, writing, or understanding the English language as to deny them the opportunity to learn successfully in an English-speaking-only classroom).”
Methodology The methodology in this study is based upon a similar study (Ernst, Li, &
Williams, 2014) on Engineering Design Graphics, which also used the SASS dataset . This current study consisted of a secondary analysis of the dataset from the SASS administered by the NCES. Initial access was applied for and authorized by the NCES. The access provided a member of the research team at Virginia Tech with designated single-site user admittance of the restricted user data license. Specific protocol and reporting information was submitted and subsequently accepted, and the NCES authorized approval and release. With the SASS dataset, 52,140 instances populate within the weighted SASS results for technology and engineering education. The two research questions for this study were explored through the 52,140 instances within the SASS outcome datasets. For the purpose of analyses, technology and engineering educator results were both categorically merged for an overall profile (Research Question 1) and stratified by offering (Research Question 2). This permitted not only overall service load identification for technology and engineering educators but also the investigation of specific categorical course offerings pertaining to service load identification.
Participants for this study were four identified groups of public school teachers: Communication Technology, Construction Technology, Manufacturing Technology, and General Technology. The primary variables of interest in this study were the number of students with categorical disabilities or LEP served by the participant teacher groups. The number of students with categorical disabilities served was determined by responses from teachers who reported teaching students with recognized disabilities requiring an individualized education program. The number of students identified as having LEP was determined by responses from teachers who reported teaching students who did not speak English as their primary language and who had a limited ability to read, speak, write, or understand English. Data from the SASS items for these groups were extracted and analyzed using descriptive statistics and independent sample t-tests. Independent sample t-tests were conducted to determine if there was a statistically significant difference in the mean number of at-risk students served for teachers who identified their primary teaching assignment as Communication Technology, Construction Technology, Manufacturing Technology, or General Technology in public schools.

Journal of Technology Education Vol. 26 No. 1, Fall 2014
-69-
The t-test for independent samples was selected because each group’s observations were independent and not influenced by the other group’s observations. This resulted in six t-test comparisons between the four teacher groups. Because “SASS was designed to produce national, regional, and state estimates for public elementary and secondary schools and their related components” (Tourkin et al., 2010, p. 9), the reported results were obtained from using a balanced repeated replication procedure utilizing 88 replicate weights as required by SASS for statistical analyses. Descriptive information is provided in Table 1. Table 1 Descriptive Information for Teacher Areas
Const. Tech.
Manuf. Tech.
Comm. Tech.
General Tech.
Total Technology
Weighted Sample
10,130 3,100 8,170 30,740 52,140
Mean Years Experience
12.30 12.69 13.28 15.58 14.41
Male 9,430 2,970 4,520 22,710 39,620 Female 700 130 3,650 8,030 12,510 Mean Categorical
9.78 14.21 10.64 16.87 14.51
Mean LEP 2.90 2.75 3.80 6.66 5.24 Mean Service Load
12.68 16.96 14.44 23.53 19.75
Note. Weighed sample values are rounded to the nearest 10 per IES protocol.
Data Analysis and Findings General Technology teachers, on average, had a higher mean service load
(M = 23.53, SD = 24.53) than Construction Technology (M = 12.68, SD = 13.27), Communication Technology (M = 14.44, SD = 12.13), and Manufacturing Technology (M = 16.96, SD = 16.33). There were statistically significant differences found when comparing General Technology and Construction Technology, t(88) = 3.51, p < .001, and when comparing General Technology and Communication Technology, t(88) = 2.66, p < .009. These results show that General Technology teachers have a higher average number of students with categorical disabilities and LEP when compared to Construction Technology and Communication Technology teachers than would have been expected due to chance. No statistically significant differences were found in any of the other comparisons. Table 2 shows descriptive accounts of the subject areas regarding at-risk students, and Table 3 displays the results from the t-test analyses.

Journal of Technology Education Vol. 26 No. 1, Fall 2014
-70-
Table 2 Subject Area Comparisons for Students At-Risk Subject Area
Weighted N
Mean At-Risk Students Per Teacher
SE (Mean)
Stan. Dev.
Min. Max.
Comm. Tech.
8350 14.44 1.76 12.13 0 95
Const. Tech.
9900 12.68 1.72 13.27 0 69
Manuf. Tech.
3140 16.96 2.75 16.33 0 120
Gen. Tech.
31330 23.53 2.78 24.53 0 140
Note. Weighed sample values are rounded to the nearest 10 per IES protocol. Table 3 Results from t-Test for At-Risk Comparisons
Subject Area Comparison
M
Diff.
SE
Diff.
df
t-value
p
Gen. Tech. − Comm. Tech. 9.09 3.41 88 2.66 0.009*
Gen. Tech. − Const. Tech. 10.859 3.10 88 3.51 0.001*
Gen. Tech. − Manuf. Tech. 6.57 4.18 88 1.57 0.120
Manuf. Tech. − Comm. Tech. 2.51 3.17 88 0.79 0.430
Manuf. Tech. − Const. Tech. 4.27 3.37 88 1.27 0.208
Comm. Tech. − Const. Tech. 1.76 2.22 88 0.79 0.430
*p < .05
Limitations of the Study The SASS instrument results, and therefore this study, are dependent upon
individual responses to target questions and perception-based options. Although cross-referenced for accuracy among items, the results were organized from self-reported/structured interview prompts. Weighted values were applied during analysis of results to control for nonresponse as well as specific participant bias. This process factors established estimates of the population of interest, specifically technology and engineering educators. Additionally, the analyses and findings are based on a single point in time. However, the SASS instrument administration is ongoing with periodic dataset updates.

Journal of Technology Education Vol. 26 No. 1, Fall 2014
-71-
Conclusions The findings of this study offer specific insight pertaining to
accommodation service responsibilities of technology and engineering educators. The restricted use license, granted by NCES, permitted the generation of a population-based profile of service load. Offering a complete spectrum of service load accountability provides an authentic glimpse into not only enrollment patterns and the student population in technology and engineering education but also the breadth of duty for technology and engineering educators. Specifically, the breadth of duty illuminated through this study is the quantity of students with categorical disabilities and LEP whom technology and engineering educators teach and the associated instructional and environmental demands that are necessary for a quality inclusive educational experience.
The analysis of data in this study indicated technology and engineering educator service load ranging from 0 students to 140 students per academic year. Also, based on collective analysis there was a somewhat elevated mean service load (19.75) pertaining to students identified as having categorical disabilities or LEP, which answers Research Question 1: What is the typical service load of a technology and engineering educator pertaining to students who qualify for accommodation services (identified as having a categorical disability or classified as having Limited English Proficiency)?
Significant differences in service load were identified between (a) General Technology Education and Communication Technology and (b) General Technology Education and Construction Technology. This finding corresponds to Research Question 2: Are there differences among specific categorical course offerings within technology and engineering education regarding service load for students who qualify for accommodation services (identified as having a categorical disability or classified as having Limited English Proficiency)?
Recommendations
The makeup of these student populations, including specific subgroup identification, directly factors in instructional decisions, course structures, and even proposed course sequences. Core or “base” educational practices are should be further adapted to academically and socially engage learners to promote robust student experiences and an overall strong educational climate. Instructional approaches, practices, and processes are to be continually evaluated in terms of student receptivity and academic effectiveness. Academic, behavioral, psychological, and social disengagement are cited factors of school detachment (Hammond, Smink & Drew, 2007). The determination of best practices suitable for a specific educational environment and student group largely depends upon learner aspirations, needs, and preferences. These have the potential to greatly vary from course to course as well as from student to student. Given these expectations, there is an expanding knowledge set and skill

Journal of Technology Education Vol. 26 No. 1, Fall 2014
-72-
base for technology and engineering educators concerning accommodation services.
In relation to study follow up and recommendations for research, there are preparatory and retention elements associated with the education of students with disabilities and LEP and at-risk students that merit specific investigation given their prospective impact. Aside from immediate classroom-based factors and implications, there are also educator variables. In addition to general demographic considerations, we also need to consider retention, support, and teacher learning. STEM educator retention is an identifiable issue in current K–12 education. Is this exacerbated by preparedness to educate students with categorical disabilities and LEP or lack thereof? Is this consistent across STEM education disciplines? Are there ample professional development offerings within technology and engineering education, or STEM education in general, specific to the education of students with categorical disabilities and LEP or students at-risk? Additional examination of these questions, within the context of educators of at-risk students and related subgroups, will assist in building a technology and engineering educator profile that professional development providers, professional associations, higher education, and other interested parties may structure to support offerings that are relevant, balanced, and timely.
Considering the established propensity of students with at-risk indicators to engage in technology and engineering education coursework paired with the approximated service load of technology and engineering educator service load for students with categorical disabilities and LEP, there are significant practitioner implications. Among these are abilities to manage, monitor, and adjust instruction; adapt curricula; manage behavior; and create an accessible environment (both physical and instructional). Continued pursuit of teacher learning opportunities to further prepare for effective engagement with students with categorical disabilities and LEP is important in equipping teachers for future progressions of inclusive settings. Finally, collaborative work with special education and English as a second language teachers can assist in providing learner specific accommodations, thus heightening the impact of technology and engineering education for students with at-risk indicators.
References Bender, W. N. (2002). Differentiating instruction for students with learning
disabilities: Best teaching practices for general and special educators. Thousand Oaks, CA: Corwin.
Bender, W. N. (2008). Differentiating instruction for students with learning disabilities: Best teaching practices for general and special educators (2nd
ed.). Thousand Oaks, CA: Corwin. Bender, W. N. & Shores, C. A. (2007). Response to intervention: A practical
guide for teachers. Thousand Oaks, CA: Corwin.

Journal of Technology Education Vol. 26 No. 1, Fall 2014
-73-
Carl D. Perkins Career and Technical Education Improvement Act of 2006, Pub. L. No. 109-270, § 250, 120 Stat. 683 (2006). Retrieved from http://www.gpo.gov/fdsys/pkg/BILLS-109s250enr/pdf/BILLS-109s250enr.pdf
Duvdevany, I. (2001). Parents of adult children with developmental disabilities: Stress, social support and their views of normalization in relation to their attitudes toward their children's employment. International Journal of Rehabilitation Research, 24(3), 227–232.
Ernst, J. V., Li, S., & Williams, T. O. (2014). Secondary engineering design graphics educator service load of students with identified categorical disabilities and limited English proficiency. Engineering Design Graphics Journal, 78(1), 1–10. Retrieved from http://www.edgj.org/index.php/EDGJ/article/viewFile/402/286
Ernst, J. V., & Moye, J. J. (2013). Social adjustment of at-risk technology education students. Journal of Technology Education, 24(2), 2–13.
Fasting, R. B. (2010). Inclusion through the concept of adapted education: A review of the Norwegian challenges. Special Education, 22(1), 179–190.
Green, L. S., & Casale-Ciannola, D. (2011). 40 active learning strategies for the inclusive classroom, grades K–5. Thousand Oaks, CA: Corwin.
Hammond, C., Smink, J., & Drew, S. (2007). Dropout risk factors and exemplary programs: A technical report. Clemson, SC: National Dropout Prevention Center at Clemson University, Communities In Schools, Inc. Retrieved from http://www.dropoutprevention.org/sites/default/files/uploads/major_reports/DropoutRiskFactorsandExemplaryProgramsFINAL5-16-07.pdf
National Dissemination Center for Children with Disabilities. (2012). Categories of disability under IDEA. Washington, DC: Author. Retrieved from http://www.parentcenterhub.org/wp-content/uploads/repo_items/gr3.pdf
Plotner, A., Trach, J., & Shogren, K. (2012). Identifying a transition competency domain structure: Assisting transition planning teams to understand roles and responsibilities of community partners. Rehabilitation Research, Policy & Education, 26(2/3), 255–270.
Tavakolian, H. R., & Howell, N. (2012). Dropout dilemma and interventions. Global Education Journal, 2012(1), 77–81.
Thelen, P., & Klifman, T. (2011). Using daily transition strategies to support all children. YC: Young Children, 66(4), 92–98.
Tourkin, S., Thomas, T., Swaim, N., Cox, S., Parmer, R., Jackson, B., & Zhang, B. (2010). Documentation for the 2007–08 Schools and Staffing Survey (NCES 2010-332). Washington, DC: U.S. Department of Education,.National Center for Education Statistics. Retrieved from http://nces.ed.gov/pubs2010/2010332_1.pdf

Journal of Technology Education Vol. 26 No. 1, Fall 2014
-74-
U.S. Department of Education, Office for Civil Rights. (2005). Questions and answers on the rights of limited-English proficient students. Washington, DC: Author. Retrieved from http://www2.ed.gov/about/offices/list/ocr/qa-ell.html
U.S. Department of Education, Office for Civil Rights. (2011). Transition of students with disabilities to postsecondary education: A guide for high school educators. Washington, DC: Author.

Journal of Technology Education Vol. 26 No. 1, Fall 2014
-75-
Building a Framework for Engineering Design Experiences in High School
Not all students will become engineers or pursue engineering careers after
completing high school but all students can benefit from having engineering design experiences in high school (Wicklein, 2006; Apedoe, Reynolds, Ellefson, & Schunn, 2008; National Academy of Engineering and National Research Council, 2009). The teaching of engineering design at the secondary level can help students develop critical-thinking and teambuilding skills and provides a platform for the integration of science, technology, engineering, and mathematics (STEM) subjects (Wicklein, 2006). Furthermore, the teaching of design in high school settings has several cognitive advantages including developing engineering habits of mind, problem-solving skills, and the development of system thinking skills (Householder & Hailey, 2012). Although researchers and curriculum developers agree on the benefits of introducing engineering design into high school settings, there is a lack of literature proffering a framework or structure for the successful infusion of engineering design experiences in high school settings.
In response to this void in the literature, the National Center for Engineering and Technology Education (NCETE) solicited positions papers from prominent educators in the field outlining a framework for engineering design experiences in high school. NCETE is a National Science Foundation (NSF) funded collaborative network of scholars whose mission is to build capacity in technology education to introduce engineering design and other related concepts to high school students (Hailey, 2005). The inception of NCETE coincided with a paradigm shift in technology education to develop a more engineering-focused curriculum (Wicklein, 2006; Gattie & Wicklein, 2007). This call for a new focus was not without its problems, including addressing professional development needs for in-service and preservice teachers, lack of alignment with state standards, determining authentic engineering design experiences, and assessing the engineering design experience (Householder, 2011). In an effort to address these needs, NCETE invited six positions papers whose results would provide fodder for future conversations regarding engineering design in high school settings. Collectively, their responses provided us with emergent themes that begin to outline a structure to support the infusing of engineering design experiences in high school settings. Cameron D. Denson ([email protected]) and Matthew Lammi ([email protected]) are Assistant Professors in the Technology, Engineering and Design Education Program at North Carolina State University.

Journal of Technology Education Vol. 26 No. 1, Fall 2014
-76-
In putting forth a conceptual framework for engineering design experiences in high school, this article builds upon a synthesis derived from the six position papers referenced above, expanding on their findings through an analysis of the relevant literature. Conclusions drawn from our expanded synthesis build towards a framework for engineering design experiences in high school settings. For our purposes, a framework is defined as a structure that is used to solve complex issues. It is not the goal of this article to attempt the grandiose task of answering all of the pedagogical and curricular questions associated with the infusion of engineering design activities into high school settings. Instead, we endeavor to provide a scaffold that will provide structure and support the introduction and investigation of successful engineering experiences in high school settings. To achieve our goal, we addressed the following areas of argument: (a) situating engineering design in the curriculum, (b) sequencing the engineering design experience, (c) selecting appropriate engineering design challenges, and (d) assessing the engineering design experience. We contend that only after addressing these areas of development that the educational community can begin to provide proper curricula and pedagogical practices needed for the infusion of successful engineering experiences into high school settings.
Situating Engineering Design in the Curriculum Engineering Design in Science Curricula
Recently, there has been a push in the education community for the integration of an engineering design framework into science settings (Sneider, 2011). In 2011, the National Research Council (NRC) disseminated a report suggesting that the updated science standards include “scientific and engineering practices” as one of the featured domains (Quinn, 2012,). Hynes et al. (2011) suggest that infusing engineering design into the high school science curriculum would satisfy the need to provide engineering design with a set of standards to serve as guiding principles for competencies, skills, and knowledge that all students should develop. This is supported by the newly minted Next Generation Science Standards, which include engineering and engineering design as major focal points (National Research Council, 2013). Pedagogically, there is merit to a push for engineering design experiences within high school science classrooms. According to Apedoe, Reynolds, Ellefson, and Schunn (2008), inquiry-based instruction—a staple of science education—provides an ideal milieu to introduce engineering concepts and design-based instruction. Research has provided evidence that inquiry-based instruction not only improves scientific content knowledge but helps develop problem-solving skills as well (Apedoe et al., 2008; Kolodner, 2002; Hmelo, Holton, & Kolodner, 2000).
Including an engineering design framework into high school science settings may provide engineering design with a set of standards; however, it still

Journal of Technology Education Vol. 26 No. 1, Fall 2014
-77-
leaves many pedagogical questions unanswered. There is still a question about who is better prepared to introduce engineering design at the secondary level. It is presumptuous to assume that science teachers are prepared to teach engineering design in their classrooms. By nature, engineering education is an interdisciplinary subject that goes beyond the nuances of inquiry-based learning. Consequently, many science educators are not comfortable with introducing engineering design and engineering concepts in their classrooms. To be successful, the infusing of engineering design experiences in high school settings will have to transcend traditional disciplinary boundaries. Case for Technology Education
Although the science community has moved forward with addressing state standard requirements for engineering design, some may argue that pedagogically, technology educators are better suited to actually teach the engineering design process. Technology educators have vied for the opportunity to introduce engineering design into their classrooms for years, resulting in a refocus of their curriculum, standards, and classroom practices (Daugherty & Custer, 2012; Kelley & Wicklein, 2009; Lewis, 2004). Technology education has, in recent times, shifted its pedagogical focus to feature a more engineering design based approached to instruction (Denson, Kelley, & Wicklein, 2009; Gattie & Wicklein, 2007). In addition, technology educators seem better equipped to handle the hands-on process of engineering design, which often necessitates the use of materials for prototypes and working models (Apedoe et al., 2008). There is still a question of technology educators’ preparedness to teach content that so heavily relies on applied math and science. Though eager to introduce this subject into high school settings (Gattie & Wicklein, 2007), technology educators indicated several barriers to teaching engineering design, including “difficulty in locating and integrating appropriate levels of mathematics and science for engineering design” (Kelley & Wicklein, 2009, p. 45).
There have been suggestions of using an interdisciplinary approach to teach engineering design that would include developing teacher teams that would encompass mathematics, science, and technology educators. This suggestion comes with many logistical challenges that educators and administrators have to this point not adequately addressed. Nonetheless, developing a set of standards that educators can utilize as a guideline for teaching engineering design is a good starting point. Addressing the pedagogical and logistical challenges of introducing engineering design into high school should be the next step. These revelations have direct implications on the need for further professional development for instructors and preservice teachers as well.

Journal of Technology Education Vol. 26 No. 1, Fall 2014
-78-
Sequencing the Engineering Design Experience Whether discussing the learner who evolves from novice to expert problem
solver, or the structure of an engineering design problem that can exist in a well-structured or ill-structured design space, it is clear that the teaching and learning of engineering design problems comprises points on a continuum (Carr & Strobel, 2011). This observation emphasizes the importance of sequencing and correctly identifying the necessary skills and abilities needed to solve ill-structured and well-structured problems. To date, how to properly sequence the engineering design experience is a question that has yet to be adequately addressed in the literature. In contrast to science and mathematics courses, developmental sequences have not been identified in high school engineering education courses (Householder & Hailey, 2012). This is partly due to the nascent state of engineering design in high schools, but it also speaks to the challenge of teaching engineering design to students with varying competencies.
Although some states have established standards that follow a sequential implementation of engineering knowledge and skills across K–12, the learning community still lacks a consensus on the effective sequencing of engineering design based content. Many learning progressions developed by educators for engineering design are based on the assumption that students are exposed to the engineering design process prior to high school (Hynes et al., 2011). This is not a safe assumption. Though most agree with the importance of teaching engineering prior to reaching college (Carr & Strobel, 2011), there is currently a lack of literature documenting what this experience should look like.
Sneider (2011) lays out an intriguing plan for sequencing age-appropriate engineering design challenges starting in the fourth grade. By using the science framework, he addresses the sequencing quandary by using standards-based instruction as guiding principles for an engineering design framework. However, he correctly notes that the specified sequence is not based on research. As we look to develop and select age-appropriate engineering design challenges, researchers and engineering educators will need to work hand-in-hand to develop standards that are age-appropriate for all skill levels of learners. In the interim, researchers and educators can look toward the National Research Council and the National Assessment of Educational Progress (NAEP) for guiding principles to help in identifying age-appropriate knowledge and skill benchmarks. As instructors consider the type of engineering challenges to introduce (open-ended or well-structured), identifying student competencies at certain points on the continuum from novice to expert designer will be key in sequencing the engineering design experience (Jonassen, 2011).
Selecting Engineering Design Challenges When strictly speaking of engineering design as a process and not the
content that accompanies this subject, problem (or project) based learning (PBL) is the most widely accepted pedagogical approach to teaching design

Journal of Technology Education Vol. 26 No. 1, Fall 2014
-79-
(Householder & Hailey, 2012; Dym, Agogino, Eris, Frey, & Leifer, 2005). According to Householder and Hailey (2012), “Engineering design challenges are ill-structured problems that may be approached and resolved using strategies and approaches commonly considered to be engineering practices” (p. 2). With this definition considered, there is still little agreement about what constitutes an appropriate engineering design challenge for high school students. There is some agreement among researchers and instructors about the importance of introducing real-world challenges that appeal to the humane sensibilities of students (Carr & Strobel, 2011; Schunn, 2011; Apedoe et al., 2008). In order to increase motivation and interest in solving engineering challenges, it is recommended that teachers provide students with an opportunity to choose their own challenges and set their own goals (Schunn, 2011). Eisenkraft (2011) even suggests providing opportunities for students to promote their culture or other cultures of interest within the design challenge. Allowing students to pick their own challenges and set their own goals enables them to set standards of excellence and take ownership of their problem.
When developing engineering design challenges, Carr and Strobel (2011) argue that instructors should focus on the intertwinement of real-world problems for high school students. Ideally, engineering design challenges for high school students should be open-ended problems with a plethora of different solutions whereby the students identify the necessary constraints, conduct a needs analysis, and identify their own goals (Hynes et al., 2011). Such an approach would allow students to develop critical-thinking skills, acquire engineering habits of mind, and engage in deeper learning. Unfortunately, studies have shown that, as a result of traditional pedagogy and standards-based curricula, most high school students are ill prepared to solve ill-structured problems (Jonassen, 2011). This finding does not necessarily mean that high school students should not engage in open-ended problems. In fact, high school students should experience both open-ended and well-structured problems throughout their learning progression. Carr and Strobel (2011) make the case that ill-structured and well-structured problems both have a place in engineering education but should be represented by different points on a continuum. So the question is not a dichotomous one of either/or but one of when a particular design problem is appropriate.
When considering the type of engineering design problem to introduce to students, it may behoove instructors to let students identify their own problems. Problem formulation is a central concept in engineering design. Too often, students are given the problem with all of the accompanying constraints and resources. When speaking of designing, Dym, Wesner, and Winner (2003) suggested that “we need to spend more time thinking about how we define the problem, rather than on the solution to a problem” (p. 106). Problem formulation determines the framing of the problem and the solution. Mehalik and Schuun (2006) stated, “The way in which designers construe their task can have an

Journal of Technology Education Vol. 26 No. 1, Fall 2014
-80-
impact on what aspects of a design a designer emphasizes, on what solution paths designers choose, and on which goals and constraints designers meet” (p. 521). Adams, Turns, and Atman (2003) also assert that problem setting is as important as problem solving and proffered a working definition. This definition included: the designers’ broadness of design factors, information gathered, and the time spent in problem setting activities. The results of their study suggest that more advanced designers consider broader factors, gather more varied information, and transition between problem settings frequently. Students can gain a more authentic engineering design experience if they are allowed to formulate the problem themselves (Schön, 1983).
Assessing the Engineering Design Experience One of the most contentious areas of concern when discussing the infusion
of engineering design into high school settings is the issue of assessment. Davis, Gentili, Trevisan, and Calkins (2002) proffer that assessment methods for engineering design have not matriculated to a well-understood and accepted level. There have been many suggestions but no consensus about what the most effective approaches for evaluating student performance are, whether it includes student portfolios, verbal protocol analysis, essay responses, or even asking students closed-ended questions (Dym, 2005). What researchers can agree on is the difficult problem that assessing the engineering design process presents. This difficulty is exacerbated by instructors’ struggle to provide timely and effectual feedback to students on their performance in engineering design challenges (Schunn, 2011). To address this issue, some educators have reasoned that students must take more ownership of their learning experiences, including developing experimental tests and criteria for their designs (Eisenkraft, 2011; Hynes et al., 2011; Jonassen, 2011). Schunn (2011) even suggests that high school students engaged in a design challenge should be able to identify their own constraints, conduct a needs analysis, and identify their goals in an engineering design experience.
In addition to the inordinate amount of time it may take to assess engineering design outcomes, it also remains a very subjective and difficult subject to assess (Bailey & Szabo, 2005). To combat this, Davis et al. (2002) and Trevisan, Davis, Calkins, and Gentili (1999) suggest creating a set of criteria and developing a scoring rubric for students. This can be done in conjunction with the students themselves. In fact, Eisenkraft (2011) argues that students should not only take ownership of their learning experience by choosing their own challenges and goals but also create their own assessment rubric. This will allow students to set their criteria for excellence, with teachers scaffolding their experiences along the way. Hynes et al. (2011) strengthens this argument by suggesting that students are capable of developing their own experimental tests to evaluate solutions.
Journal of Technology Education Vol. 26 No. 1, Fall 2014
-81-
Though it is clear that high school students will have to take on more responsibility in assessing their experience, the current literature fails to provide a clear path toward addressing this problem of balancing the responsibilities of assessment between instructor and student; it also fails to provide any suggestions for dealing with the issue of timely feedback. There is some agreement on the following educational objectives as a way to determine student performance: (a) design process, (b) teamwork, and (c) design communication (Davis, Gentili, Trevisan, & Calkins, 2002; Trevisan, Davis, Calkins, & Gentili, 1999). According to the literature, assessment should focus on the design process and the student teams’ application of this problem-solving method (Bailey & Szabo; Davis et al., 2002; Trevisan et al., 1999). Teamwork serves as a primary tenet of assessment as this approaches authentic real-world experiences of engineers. Finally, students should be assessed on how well they document and justify their design process and on how well they are able to communicate their design and accompanying decisions to their peers or clients.
Teachers considering introducing engineering design into their classrooms may use modeling artifacts as a way to offer tangible deliverables for students. Students encounter modeling during the engineering design process as a by-product of their design experiences (Roth, 1996). For those teaching engineering design and struggling with assessment, modeling artifacts may provide some inroads as an adequate assessment technique (Lammi & Denson, 2013). Throughout the engineering design process, there are artifacts that students create to document their decision making. These artifacts can come in the form of a device, a system, or even a process. To address the issue of timely feedback, instructors can have students deliver a conceptual, graphical, mathematical, and working model before turning in their final design (Lammi & Denson, 2013). As a form of formative and summative assessment, modeling artifacts may help alleviate much of the ambiguity inherent in engineering design problems. In addition to their use as a pedagogical tool, modeling artifacts also help develop students’ higher order thinking skills (National Academy of Engineering and National Research Council, 2009).
Conclusion In this article, we put forth a conceptual framework that will help promote
the successful infusion of engineering design experiences into high school settings. When considering a conceptual framework of engineering design in high school settings, it is important to consider the complex issue at hand. For the purposes of this article, the issue at hand centered on identifying necessary components to support the infusion of engineering design experiences in high school settings. The essential components of this framework include: (a) situating engineering design in the curriculum, (b) sequencing the engineering design experience, (c) selecting appropriate engineering design challenges, and (d) assessing the engineering design experience. Attention to these components

Journal of Technology Education Vol. 26 No. 1, Fall 2014
-82-
will support the teaching of subject matter content and the teaching and learning of critical-thinking skills, engineering habits of mind, problem-solving skills, and systems thinking. Without adequate attention to each of these areas, the infusing of engineering design experiences in high school will be without the necessary structure and curricular support.
Acknowledging the dearth of research focused on engineering design in high school settings, a framework should also support the investigation of engineering design experiences. It must be noted that though this article puts forth a framework for engineering design experiences in high school settings, much of the literature on this matter comes from tertiary settings. More empirical research is needed in high school settings in order to provide empirical evidence to support this or any framework. As research focused on engineering design in high school setting continues to grow, it will serve as the foundation of how engineering design experiences are designed for high school settings. A graphical representation (Figure 1) of our conceptual framework is provided below. As you can see, the four themes presented in this article build upon the foundation of research supporting engineering design experiences in high school. The framework helps supports the teaching of subject matter content while developing engineering habits of mind, problem-solving skills, and critical-thinking skills. Additionally, this framework supports the investigation of engineering design experiences in high school settings.

Journal of Technology Education Vol. 26 No. 1, Fall 2014
-83-
Figure 1. Conceptual framework for infusing engineering design into high school classrooms.
Discussion
For future discussion, it is our assertion that answering the question of age-appropriate sequencing will serve as a key component to the proper development of engineering design challenges and the successful infusion of engineering design experiences in high school. Proper attention to the sequencing of engineering design coursework and astute understanding of the design space will lay the groundwork for investigating successful design experiences. Consequently, more empirical research is needed to identify age-appropriate skills and abilities needed at each grade level in order to properly sequence engineering design experiences.
There are other issues that surround this paradigm shift, and it will take input from the whole learning community to effectively address these questions. If students should have engineering design experiences before high school (Carr

Journal of Technology Education Vol. 26 No. 1, Fall 2014
-84-
& Strobel, 2011) there is a need for collaboration and consensus across the board on the skills and abilities to be taught in experiences prior to high school. If a theory of a spiral curriculum for engineering education is widely accepted for the teaching of engineering design, then it should be considered in the design of curriculum and teaching strategies (DiBiasio, Clark, & Dixon, 1999). Although some states have established standards that follow a sequential implementation of engineering knowledge and skills across K–12, the learning community still lacks the research needed to trumpet effective sequencing of engineering design based content.
There are also procedural questions that still need to be answered before any consensus can be achieved about the proper instruction of engineering design in high school. As an example, Jonassen (2011) asserts that the goal of design is not optimizing but satisficing. This runs contrary to Hynes et al. (2011), who argue that redesign and optimization is an essential guiding principle for engineering design in high school. This dissonance may be the result of incongruence when it comes to defining optimization. Answering this question will go a long way toward the development of appropriate assessment strategies. There is also the growing expectation for students to develop their own experimental tests and grading rubrics (Hynes et al., 2011; Schunn, 2011). Though the literature makes a compelling case for students taking more responsibility for assessing their engineering experiences, it does not account for the time and skills needed for students to be able develop their own rubrics and other assessment tools.
Implications Words like little and more dominate the conversation about research as it
relates to engineering design experiences in high school. This is a testament to the nascent status of engineering design in high school classrooms. As researchers go forward with their investigations of engineering design experiences in high school settings, they should pay special attention to decision making. Decision making and improved decision making seems to be an overarching theme in the design process (Hazelrigg, 1998). According to Jonassen (2011), design problem solving can be represented by a series of decisions made by students. The study of students engaged in the engineering design experience should focus upon how students make decisions during the design process. As we consider how students approach problems and narrow the problem space, it would benefit us to investigate the reasons students make specific decisions.
Because it is still a burgeoning subject area, proper professional development for engineering education must accompany the field’s shift to focus more on engineering design. As the body of literature on engineering design continues to grow, it is important that the creation of professional development for engineering design in high schools reflects findings based on

Journal of Technology Education Vol. 26 No. 1, Fall 2014
-85-
empirical research. The efforts of this framework will be incomplete until more research on engineering design is reflected in the creation and implementation of professional development. For now, educators vying to introduce engineering design can turn to the Next Generation Science Standards for their standards. Curriculum developers and other stakeholders will have to consider the implementation of team teaching to teach engineering design, particularly if professional development efforts continue to fall short of addressing teacher concerns.
Acknowledgement The material presented here is based on work supported by the National Science Foundation under Grant No. ESI-0426421. Any opinions, findings, and conclusions or recommendations expressed in this material are those of the author(s) and do not necessarily reflect the views of the National Science Foundation. We would also like to thank Daniel Householder for his leadership and guidance in creating this document.
References Adams, R. S., Turns, J., & Atman, C. J. (2003). Educating effective engineering
designers: The role of reflective practice. Design studies, 24(3), 275–294. doi:10.1016/S0142-694X(02)00056-X
Apedoe, X. S., Reynolds, B., Ellefson, M. R., & Schunn, C. D. (2008). Bringing engineering design into high school science classrooms: the heating/cooling unit. Journal of Science Education and Technology, 17(5), 454–465. doi:10.1007/s10956-008-9114-6
Bailey, R., & Szabo, Z. (2005). Assessing design student process knowledge. In C. L. Dym (ed.), Proceedings of the Mudd Design Workshop V: Learning and Engineering Design (pp. 508–518). Claremont, CA: Center for Design Education, Harvey Mudd College.
Carr, L., R., & Strobel, J. (2011). Integrating engineering design challenges into secondary STEM education. Retrieved from http://ncete.org/flash/pdfs/Integrating_Engineering_Carr.pdf
Daugherty, J. L., & Custer, R. L. (2012). Secondary level engineering professional development: Content, pedagogy, and challenges. International Journal of Technology and Design Education, 22(1), 51–64. doi:10.1007/s10798-010-9136-2
Davis, D. C., Gentili, K. L., Trevisan, M. S., & Calkins, D. E. (2002). Engineering design assessment processes and scoring scales for program improvement and accountability. Journal of Engineering Education, 91(2), 211–221. doi:10.1002/j.2168-9830.2002.tb00694.x
Denson, C. D., Kelley, T. R., & Wicklein, R. C. (2009). Integrating engineering design into technology education: Georgia's Perspective. Journal of Industrial Teacher Education, 46(1), 81–102. Retrieved from http://scholar.lib.vt.edu/ejournals/JITE/v46n1/pdf/denson.pdf
Journal of Technology Education Vol. 26 No. 1, Fall 2014
-86-
DiBiasio, D., Clark, W. M., & Dixon, A. G. (1999). Evaluation of a spiral curriculum for engineering. Proceedings of the ASEE/IEEE Frontiers in Education Conference, San Juan, Puerto Rico. doi:10.1109/FIE.1999.841657
Dym, C. L., Agogino, A. M., Eris, O., Frey, D. D., & Leifer, L. J. (2005). Engineering design thinking, teaching, and learning. Journal of Engineering Education, 94(1), 104–120. Retrieved from http://digitalcommons.olin.edu/cgi/viewcontent.cgi?article=1021&context=mech_eng_pub
Dym, C. L., Wesner, J. W., & Winner, L. (2003). Social dimensions of engineering design: Observations from Mudd Design Workshop III. Journal of Engineering Education, 92(1), 105–107. doi:10.1002/j.2168-9830.2003.tb00746.x
Eisenkraft, A. (2011). Engineering design challenges in a science curriculum. Retrieved from http://ncete.org/flash/pdfs/Engr_Science_Eisenkraft.pdf
Gattie, D. K., & Wicklein, R. C. (2007). Curricular value and instructional needs for infusing engineering design into K–12 technology education. Journal of Technology Education, 19(1), 6–18. Retrieved from http://scholar.lib.vt.edu/ejournals/JTE/v19n1/pdf/gattie.pdf
Hailey, C., Erekson, T., Becker, K., & Thomas, M. (2005). National Center for Engineering and Technology Education: The overall impact of the NCETE is to strengthen the nation's capacity to deliver effective engineering and technology education in the K–12 schools. The Technology Teacher, 64(5), 23–26.
Hazelrigg, G. A. (1998). A framework for decision-based engineering design. Journal of Mechanical Design, 120(4), 653–658. doi:10.1115/1.2829328
Hmelo, C. E., Holton, D. L., & Kolodner, J. L. (2000). Designing to learn about complex systems. Journal of the Learning Sciences, 9(3), 247–298. doi:10.1207/S15327809JLS0903_2
Householder, D. L. (Ed.). (2011). Engineering design challenges in high school STEM courses: A compilation of invited position papers. Retrieved from http://ncete.org/flash/pdfs/Engr_Design_Challenges_Compilation.pdf
Householder, D. L., & Hailey, C. E. (Eds.). (2012). Incorporating engineering design challenges into STEM courses. Retrieved from http://ncete.org/flash/pdfs/NCETECaucusReport.pdf
Hynes, M., Portsmore, M., Dare, E., Milto, E., Rogers, C., Hammer, D., & Carberry, A. (2011). Infusing engineering design into high school STEM courses. Retrieved from http://ncete.org/flash/pdfs/Infusing_Engineering_Hynes.pdf
Jonassen, D. H. (2011). Design problems for secondary students. Retrieved from http://ncete.org/flash/pdfs/Design_Problems_Jonassen.pdf
Kelley, T. R., & Wicklein, R. C. (2009). Teacher challenges to implement engineering design in secondary technology education (Third article in 3-part series). Journal of Industrial Teacher Education, 46(3), 34–50. Retrieved from http://scholar.lib.vt.edu/ejournals/JITE/v46n3/pdf/kelley.pdf
Kolodner, J. L. (2002). Facilitating the learning of design practices: Lessons learned from an inquiry into science education. Journal of Industrial Teacher Education, 39(3), 9–40. Retrieved from http://scholar.lib.vt.edu/ejournals/JITE/v39n3/kolodner.html

Journal of Technology Education Vol. 26 No. 1, Fall 2014
-87-
Lammi, M. D., & Denson, C. (2013, June). Pre-service teachers’ modeling as a way of thinking in engineering design. Paper presented at the 120th American Society for Engineering Education Annual Conference & Exposition, Atlanta, GA. Retrieved from http://www.asee.org/public/conferences/20/papers/5867/download
Lewis, T. (2004). A turn to engineering: The continuing struggle of technology education for legitimization as a school subject. Journal of Technology Education, 16(1), 21–39. Retrieved from http://scholar.lib.vt.edu/ejournals/JTE/v16n1/lewis.html
Mehalik, M. M., & Schunn, C. D. (2006). What constitutes good design? A review of empirical studies of the design process. International Journal of Engineering Education, 22(3), 519–532.
National Academy of Engineering and National Research Council.. (2009). Engineering in K–12 education: Understanding the status and improving the prospects. Washington, DC: National Academies Press.
National Research Council. (2013). Next generation science standards: For states, by states. Washington, DC: National Academies Press.
Quinn, H. (2012). A framework for K–12 science education. In APS March Meeting Abstracts (Vol. 1, p. 2001).
Roth, W.-M. (1996). Art and artifact of children's designing: A situated cognition perspective. The Journal of the Learning Sciences, 5(2), 129–166.
Schön, D. A. (1983). The reflective practitioner: How Professionals Think in Action. New York, NY: Basic Books.
Schunn, C. (2011). Design principles for high school engineering design challenges: Experiences from high school science classrooms. Retrieved from http://ncete.org/flash/pdfs/Design_Principles_Schunn.pdf
Sneider, C. (2011). A possible pathway for high school science in a STEM world. Retrieved from http://ncete.org/flash/pdfs/Possible_Pathway_Sneider.pdf
Trevisan, M. S., Davis, D. C., Calkins, D. E., & Gentili, K. L. (1999). Designing sound scoring criteria for assessing student performance. Journal of Engineering Education, 88(1), 79–84. doi:10.1002/j.2168-9830.1999.tb00415.x
Wicklein, R. C. (2006). Five good reasons for engineering as the focus for technology education. The Technology Teacher, 65(7), 25–29. Retrieved from http://digitalcommons.usu.edu/cgi/viewcontent.cgi?article=1065&context=ncete_publications

Journal of Technology Education Vol. 26 No. 1, Fall 2014
-88-
A Comparative Analysis of Spatial Visualization Ability and Drafting Models for Industrial and
Technology Education Students
Howard Gardner explained spatial intelligence as one of the basic human intelligences, “the ability to perceive the visual-spatial world accurately and to perform transformations on those perceptions” (as cited in Lieu & Sorby, 2009, p. 3-2). More specifically, spatial visualization is the ability “to imagine the rotation of a depicted object, the folding and unfolding of flat patterns, and the relative changes of positions of objects in space” (Miller & Bertoline, 1991, p. 9). According to Thurstone (1938), this spatial ability is a critical component of intellectual ability. Furthermore, Thurstone (1950) identified seven factors related to human intelligence with three specifically referring to visual orientation in space:
• S1: “The ability to recognize the identity of an object when it is seen from different angles” (p. 518).
• S2: “The ability to imagine the movement or internal displacement among the parts of a configuration” (p. 518).
• S3: “The ability to think about those spatial relations in which the body orientation of the observer is an essential part of the problem” (p. 519).
Spatial vision (or developed spatial reasoning) is known “as the most [fundamental and] rewarding part of engineering graphics instruction” (Contero, Naya, Company, & Saorín, 2006, p. 472). Improving students’ spatial skills is considered to be an important component in technical education, which is typically found in the first-year Technology Education and Industrial Technology curriculum. It is critical that students develop spatial skills early in engineering curriculum in order to ensure success throughout their program and, thus, promote retention (Sorby, 2009).
For this study, the following was the primary research question: Is there a difference in spatial visualization ability, as measured through technical drawings, among the impacts of model types (2D drawing, 3D computer generated drawing, and 3D printed object)? Petros Katsioloudis ([email protected]) is an Associate Professor in the Department of STEM Education and Professional Studies at Old Dominion University. Vukica Jovanovic ([email protected]) is an Assistant Professor in the Department of Engineering Technology at Old Dominion University. Mildred Jones ([email protected]) is a graduate student in the Department of STEM Education and Professional Studies at Old Dominion University.

Journal of Technology Education Vol. 26 No. 1, Fall 2014
-89-
The following hypotheses will be analyzed in an attempt to find a solution to the research question:
H0: There is no difference in spatial visualization ability, as measured through technical drawings, among the impacts of model types (2D drawing, 3D computer generated drawing, and 3D printed object).
HA: There is an identifiable difference in spatial visualization ability, as measured through technical drawings, among the impacts of model types (2D drawing, 3D computer generated drawing, and 3D printed object).
Review of Literature
There has been a great deal of research on what is needed to prepare students for careers in engineering and technology. First and foremost is the basic and critical skill known as spatial ability. Spatial cognition is known as the “underlying mental process that allows an individual to develop spatial abilities” (Miller & Bertoline, 1991, p. 8). Lohman and Kyllonen (1983) identified three major spatial factors used to test the spatial abilities of an individual: spatial relations, spatial orientation, and spatial visualization. We use the following definitions for these three factors:
1. Spatial Relations: “The ability to imagine rotations of 2D and 3D objects as a whole body” (Martín-Dorta, Saorín, & Contero, 2008, p. 506)
2. Spatial Orientation: “The ability to orient oneself physically or mentally in space” (Maier, 1998, p. 71).
3. Spatial Visualization: The “ability to mentally manipulate, rotate, twist, and pictorially invert presented visual stimuli” (Gorska & Sorby, 2008, p. 1).
According to Contero, Naya, Company, & Saorín (2006), visualization skills have a learning outcome “described as the ability to picture three-dimensional shapes in the mind’s eye” (p. 472). It is widely known that spatial visualization skills and mental rotation abilities are critical for technical and engineering professions. According to Norman (1994), a learner’s spatial skills are the most important and significant predictor for success in manipulating objects and interacting with computer-aided design. Recognizing the importance of spatial abilities for engineering and technology fields and the instructional tools used, it is important that students with poor spatial skills improve through appropriate instructional techniques. Sorby (2012), states that “students who have the opportunity to improve their spatial visualization skills demonstrate greater self-efficacy, improved math and science grades and are more likely to persist in engineering” (p. 1).
“Improving the spatial-visualization ability of engineering and technology students is a challenge for educational researchers (Ferguson, Ball, McDaniel, & Anderson, 2008, p. 2). Although research has revealed “that spatial visualization

Journal of Technology Education Vol. 26 No. 1, Fall 2014
-90-
ability can be improved through instructional methods,” there is no “clear consensus on what combination and duration of instructional methods is most beneficial for improving spatial visualization ability” (Ferguson et al., 2008, p. 2). According to Contero et al. (2006), in order to shift from a teacher-centered to a student-centered education paradigm model, there must be a critical analysis of the varying engineering courses included in the curriculum. Furthermore, “teachers of `engineering graphics' should put the emphasis in spatial reasoning, since we do consider it to be a core competence for future engineers” (Contero et al., 2006, p. 471).
Some researchers have suggested that spatial ability can be enhanced and taught through certain instructional designs (Alias, Black, & Gray, 2002; Kwon, 2003; Lajoie, 2003; Potter & van der Merwe, 2001; Woolf, Romoser, Bergeron, & Fisher, 2003). Other researchers have demonstrated that instructions using computer-based 3D visualizations can provide learners with adequate classroom experiences for developing their spatial ability (Kwon, 2003; Woolf et al., 2003). However, few empirical studies have established the causal relationships in greater depth (Wang, Chang, & Li, 2006). Moreover, few studies have explored the effects of two-dimensional versus three-dimensional media representations on the influence of the spatial ability of undergraduate students (Wang, Chang, & Li, 2006). Of the tools applied for improving spatial abilities, “sketching and drawing are … the most frequently used” (Contero et al., 2006, p. 473). According to Alias Black, and Gray (2002), spatial visualization can be improved in engineering students through activities predominantly consisting of free-hand sketching and object manipulation. Assessment of Spatial Abilities. The assessment of spatial abilities is critical to ensure transfer of learning, as is the deployment of appropriate instructional tools for a learner’s development. Assessing a learner’s spatial skills can be done using several instruments. A few of the most common tests are described in the following paragraphs.
Mental Cutting Test. The Mental Cutting Test (MCT), a part of the Special Aptitude Test in Spatial Relations (College Entrance Examination Board [CEEB], 1939), was first developed as a university entrance exam consisting of 25 items with 20 minutes provided for solving. Each problem consists of a 3D criterion figure on the left side of the stated problem, showing an imaginary cutting plane through the image. The learner must choose the correct one resulting from the cross-section from five alternative images (see Figure 1). The MCT measures both spatial visualization and spatial relations.

Journal of Technology Education Vol. 26 No. 1, Fall 2014
-91-
Figure 1. Mental Cutting Test (MCT) example problem (CEEB, 1939).
Differential Aptitude Test. The Differential Aptitude Test is composed of multiple separate tests assessing verbal and numerical reasoning, mechanical reasoning, perceptual ability, spatial relations, abstract reasoning, spelling, and language use. One of these assessments, the Differential Aptitude Test: Space Relations (DAT:SR), specifically measures a learner’s ability to move from 2D to 3D world (Lieu & Sorby, 2009). It consists of 50 items that require the learner to “mentally fold” the 2D pattern and choose the correct 3D object, which would result given the original 2D pattern, from four alternatives (see Figure 2).
Figure 2. Differential Aptitude Test: Space Relations (DAT:SR) example problem (Bennett, Seashore, & Wesman, 1973). Mental Rotation Test. The Mental Rotation Test (MRT) consists of 20 items that require the learner to compare two-dimensional drawings and three-dimensional geometric figures. Developed by Vandenberg & Kuse (1978), the MRT assesses spatial visualization and mental rotation components. Each item on the MRT consists of five line drawings, which includes a geometrical target figure (criterion figure) on the left that is then followed by two reproductions of the target rotated and two distractors. The learner is required to indicate which two of the four represented are the actual rotated replicas of the geometrical target figure on the left (Caissie, Vigneau, & Bors, 2009; Gorska & Sorby, 2008). The learner has a time constraint of 4 minutes for the first 10 items, and after a short break, 4 minutes are given to solve the remaining ten (see Figure 3).

Journal of Technology Education Vol. 26 No. 1, Fall 2014
-92-
Figure 3. Mental Rotation Test (MRT) example problem (Vandenberg & Kuse, 1978). Purdue Spatial Visualization Test: Visualization of Rotations. The Purdue Spatial Visualization Test: Visualization of Rotations (PSVT:R), developed by Guay (1977), presents the learner with a criterion object and a view of the same object after it is rotated. The PSVT:R is one section of the Purdue Spatial Visualization Test that includes three sections (Developments, Rotations, and Views) and consists of 12 questions per section for a total of 36 questions. The PSVT:R consists of 12 questions, each showing an object in two different positions. The first shape is rotated on the X-, Y-, or Z-axis to second shape, which is shown to demonstrate the rotation pattern. Another object is shown accompanied by five different rotated views. The learner is asked to indicate which of the options is the correct view representing the next rotation in the pattern (see Figure 4). In a study conducted by Sorby (2007), the PVST:R was shown to be a significant predictor in the success of learners in engineering design courses.
Figure 4. Purdue Spatial Visualization Test: Rotations (PSVT:R) example problem (Guay, 1977).

Journal of Technology Education Vol. 26 No. 1, Fall 2014
-93-
Methodology A quasi-experimental study was selected as a means to perform the
comparative analysis of spatial visualization ability during the spring semester of 2014. The study was conducted in a materials process course, STEM 231, offered at Old Dominion University as part of the STEM program. The population of the study included the course participants. Because STEM 231 contains several hands-on projects in which instruction through demonstration is common, the researchers felt that the group was appropriate. This course introduced the students to basic content and skills needed to process common materials and produce functional products using woods, metals, plastics, and composite materials. This course also included engineering graphics and visualization techniques used to develop technical drawings and prototypes, emphasizing “hands on” practice using 2D and 3D AutoCAD software in the computer lab along with the various methods of editing, manipulation, visualization, and presentation of technical drawings. The participants from the study are shown in Table 1. Of the 35 students, three were female, and five were African American. A convenience sample was used with near equal distribution of participants between the three groups. Table 1 Research Design Methodology Group Sample Test Model type
Group 1 n1 = 12 MRT Sketch from 2D drawing
Group 2 n2 = 12 MRT Sketch from 3D image
Group 3 n3 = 11 MRT Sketch from 3D object
The students attending the course during the spring semester of 2014 were
divided into three groups according to the section of the course in which they chose to participate in the semester prior to the study. The three groups (n1 = 12, n2 = 12, and n3 = 11), with an overall population of N = 35, were presented with a visual representation of an object (drafting model) and were asked to rotate the model and create a technical drawing of it (see Figure 5). The first group (n1) received a 2D drawing of the block (see Figure 6), the second group (n2) received a 3D PC generated image of the block (see Figure 7), and the third group (n3) received a 3D printed block using a 3D rapid prototyping machine (see Figure 8). In addition, all groups were asked to complete the MRT instrument 2 days prior to the completion of the rotational view technical drawing to identify each student’s level of visual ability and to show that all three groups were close to equal.

Journal of Technology Education Vol. 26 No. 1, Fall 2014
-94-
The MRT is one of the most commonly used instruments for measuring spatial ability (Caissie et al., 2009). Reliability of the instrument has been found satisfactory; test–retest correlation was reported at .83 following an interval of one year or more (Vandenberg & Kuse, 1978). The MRT has been used to measure spatial abilities in relation to graphics and design curricula (Contero et al., 2006; Gorska & Sorby, 2008; Sorby, 2007).
Upon completion of the MRT, the instructor of the course placed the 2D drawing, 3D computer generated image, and 3D printed object in a central location in the classroom (the three groups were positioned in three different rooms) and asked the students to rotate the model in a similar view as seen in Figure 5 and create a new technical drawing (see Figure 5). In this study, all groups were given a different representation of the same block (see Figures 6, 7, 8).
The rubric used to evaluate the correctness of the students’ technical drawings was the same one used to evaluate previous drawings at the beginning of the course and included: (a) right orientation of axis, (b) use of correct proportion, (c) accurate angle used for isometric perspective, (d) appropriate use of visible lines, and (e) appropriate use of drawing space. Maximum score for the technical drawing was six points.
Figure 5. Student example for drawing rotation.

Journal of Technology Education Vol. 26 No. 1, Fall 2014
-95-
Figure 6. 2D drawing.
Figure 7. 3D computer generated drawing.

Journal of Technology Education Vol. 26 No. 1, Fall 2014
-96-
Figure 8. 3D printed object using additive technology.
Data Analysis Analysis of MRT Scores
The first method of data collection involved the completion of the MRT instrument prior to the treatment to show how close all three groups were to equal. A one-way ANOVA was run to compare the mean scores for significant differences. With a mean score of 0.209, there were no significant differences between the three groups as measured by the MRT instrument (as shown in Table 2).
The researchers graded the MRT instrument as described in the guidelines of the MRT creators. A standard paper-and-pencil MRT was conducted to test ability in which the subjects were instructed to look at a drawing of a given object and find the same object within a set of dissimilar objects. The maximum score that can be received on the MRT is 20. As shown in Table 3, n1 had a mean of 17.18, n2 had a mean of 16.10, and n3 had a mean of 17.31.

Journal of Technology Education Vol. 26 No. 1, Fall 2014
-97-
Table 2 MRT Scores ANOVA Table
Sum of Squares
df Mean
Square F Sig.
Between Groups 101.951 2 50.976 1.647 .209
Within Groups 990.459 32 30.952
Total 1092.411 34
Analysis of Technical Drawing
The second method of data collection involved the creation of a rotational view drawing. As shown in Table 4, the group that used the 2D drawing as visual aid (referred to as 2D) had a mean observation score of 4.26. The groups that used the 3D computer generated visual (referred to as 3D PC) and the 3D printed solid block (referred to as 3D Solid) had higher scores of 5.13 and 5.68, respectively. A one-way ANOVA was run to compare the mean scores for significant differences among the three groups. The result of the ANOVA test, as shown in Table 5, was significant: F (2, 32) = 5.27, p < 0.01. The data was dissected further through the use of a post hoc Tukey’s honest significant difference (HSD) test. As shown in Table 6, the post hoc analysis shows statistically significant differences between 3D Solid vs. 3D PC (p = 0.446, d = -0.5), 3D Solid vs. 2D (p = 0.008, d = 1.41), and 3D Solid vs. 2D (p = 0.1, d = 0.87). Table 3 MRT Descriptive Results
Treatment N Mean SD SE
95% Confidence Interval for Mean
Lower Bound Upper Bound
2D 12 17.1875 6.00958 1.73482 13.3692 21.0058
3D PC 12 16.1042 5.20758 1.50330 11.7954 18.4129
3D Solid 11 17.3182 5.43034 1.63731 15.6700 22.9663
Total 35 17.1429 5.66831 0.95812 15.1957 19.0900

Journal of Technology Education Vol. 26 No. 1, Fall 2014
-98-
Table 4 Rotational View Drawing Descriptive Results
Treatment N Mean SD SE
95% Confidence Interval for Mean
Lower Bound Upper Bound
2D 12 4.264 1.4363 0.4146 3.351 5.176
3D PC 12 5.139 0.9740 0.2812 4.520 5.758
3D Solid 11 5.682 0.5294 0.1596 5.326 6.037
Total 35 5.010 1.1854 0.2004 4.602 5.417 Table 5 Rotational View Drawing ANOVA Results Quiz SS df MS F p
Between Groups 11.844 2 5.922 5.274* 0.010
Within Groups 35.930 32 1.123
Total 47.775 34
*Denotes statistical significance Table 6 Rotational View Drawing Tukey HSD Results
Visual Aids (1 vs. 2) Mean Diff. (1-2) SE p
3D Solid vs. 3D PC -0.5429 0.4423 0.446
3D Solid vs. 2D 1.4179 0.4423 0.008
3D PC vs. 2D 0.8750 0.4326 0.123
Discussion
The main purpose of the study was to determine significant positive effects among the use of three different types of drafting models and to identify whether any differences exist towards promotion of spatial visualization ability for students in Industrial Technology and Technology Education courses. In particular, the study compared the use of different types of drafting models (a 3D printed solid object, a 3D computer generated drawing, and a 2D drawing) using a technical drawing activity as the main assessment tool. It was found that the 3D printed solid model and 3D computer generated image both provided

Journal of Technology Education Vol. 26 No. 1, Fall 2014
-99-
statistically significant higher scores than the 2D drawing. These findings are in agreement with a related study using engineering technology instead of industrial technology students, in which Katsioloudis and Jovanovic, (2014) found that students who received treatment via the 3D printed solid model outperformed their peers who received treatment from the other two models, although those findings were not statistically significant. This could indicate that, in both cases, students were better able to comprehend visual data given from 3D solid models over 3D computer generated models or 2D drawings. It should also be noted that when drafting models, students are primarily asked to recreate different views using 2D drawings. Using 3D solid models as visualizations aids for Industrial Technology and Technology Education courses has great potential to improve spatial visualization skills. While conducting the literature review to better focus this research, there appeared to be a lack of research related to drafting models and their ability to enhance spatial visualization ability. This research can help in understanding the optimal type of drafting model to be used in technology education and industrial technology courses, allowing for visualization ability to be enhanced.
With the current status of additive technologies, instructors have the ability to design and built almost any model in a very short amount of time. This small quasi-experimental study provides results related to the commonly used method of 2D visual modeling. Instead, it seems a 3D solid model gives the students a better understanding of the tasks being taught. However, based on the small amount of similar studies, it appears that more research is needed.
Future Plans In order to better understand the ability for 3D solid models to aid student
learning, future plans include, but are not limited to: • Repeating the study to verify the results by using additional types of
drafting models. • Repeating the study using different populations, such as science and
mathematics education students. • Repeating the study by adding additional visual cues during the display
of 3D objects, including shadows, lighting, and size. • Repeating the study by comparing males vs. females because it has
been suggested that males tend to do better on spatial ability tasks than females
References
Alias, M., Black, T. R., & Gray, D. E. (2002). Effect of instructions on spatial visualization ability in civil engineering students. International Educational Journal, 3(1), 1–12. Retrieved from http://www.iejcomparative.org/data/volumes/v3n1.pdf

Journal of Technology Education Vol. 26 No. 1, Fall 2014
-100-
Bennett, G. K., Seashore, H. G., & Wesman, A. G. (1973). Differential aptitude test: Forms S and T. New York, NY: The Psychological Corporation.
Caissie, A. F., Vigneau, F., & Bors, D. A. (2009). What does the Mental Rotations Test measure? An analysis of item difficulty and item characteristics. The Open Psychology Journal, 2, 94–102. doi:10.2174/1874350100902010094
College Entrance Examination Board. (1939). CEEB special aptitude test in spatial relations. New York, NY: Author.
Contero, M., Naya, D., Company, P., & Saorín, J. L. (2006). Learning support tools for developing spatial abilities in engineering design. International Journal of Engineering Education, 22(3), 470–477.
Ferguson, C., Ball, A., McDaniel, W., & Anderson, R. (2008, November). A comparison of instructional methods for improving the spatial-visualization ability of freshman technology seminar students. Paper presented at the 2008 IAJC-IJME International Conference, Nashville, TN. Retrieved from http://ijme.us/cd_08/PDF/37_IT305.pdf
Gorska, R., & Sorby, S. (2008, June). Testing instruments for the assessment of 3-D spatial skills. Paper presented at the ASEE Annual Conference, Pittsburgh, PA.
Guay, R. (1977). Purdue Spatial Visualization Test: Visualization of Rotations. W. Lafayett, IN: Purdue Research Foundation.
Katsioloudis, P., & Jovanovic, V. (2014). Spatial visualization ability and impact of drafting models: A quasi-experimental study. Engineering Design Graphics Journal, 78(2).
Kwon, O. N. (2003). Fostering spatial visualization ability through web-based virtual-reality program and paper-based program. Lecture Notes in Computer Science, 2713, 701–706. doi:10.1007/3-540-45036-X_78
Lajoie, S. P. (2003). Individual differences in spatial ability: Developing technologies to increase strategy awareness and skills. Educational Psychologist, 38(2), 115–125. doi:10.1207/S15326985EP3802_6
Lieu, D. K., & Sorby, S. A. (2009). Visualization, modeling, and graphics for engineering design. Clifton Park, NY: Delmar, Cengage Learning.
Lohman, D. F., & Kyllonen, P. C. (1983). Individual differences in solution strategy on spatial tasks. In R. F. Dillon & R. R. Schmeck (Eds.), Individual Differences in Cognition (Vol. 1, pp. 105–135). New York, NY: Academic Press.
Maier, P. H. (1998). Spatial geometry and spatial ability: How to make solid geometry solid? In E. Osnabrück, K. Cohors-Fresenborg, G. Reiss, G. Toener, & H. Weigand (Eds.), Selected papers from the annual conference of didactics of mathematics 1996 (pp. 63–75). Munich, Germany: Gessellschaft für Didaktik der Mathematik (GDM),.
Martín-Dorta, N., Saorín, J. L., & Contero, M. (2008). Development of a fast remedial course to improve the spatial abilities of engineering students.

Journal of Technology Education Vol. 26 No. 1, Fall 2014
-101-
Journal of Engineering Education, 97(4), 505–513. doi:10.1002/j.2168-9830.2008.tb00996.x
Miller, C. L. & Bertoline, G. R. (1991). Spatial visualization research and theories: Their importance in the development of an engineering and technical design graphics curriculum model. Engineering Design Graphics Journal, 55(3), 5–14.
Norman, K. L. (1994). Spatial visualization—A gateway to computer-based technology. Journal of Special Education Technology, 12(3), 195–206.
Potter, C. & van der Merwe, E. (2001, August). Spatial ability, visual imagery and academic performance in engineering graphics. Paper presented at the International Conference on Engineering Education, Oslo, Norway. Retrieved from http://www.ineer.org/Events/ICEE2001/Proceedings/papers/498.pdf
Sorby, S. A. (2007). Developing 3D spatial skills for engineering students. Australasian Journal of Engineering Education, 13(1), 1–11.
Sorby, S. A. (2009). Educational research in developing 3-D spatial skills for engineering students. International Journal of Science Education, 31(3), 459–480. doi:10.1080/09500690802595839
Sorby, S. A. (2012). ENGAGE strategy research brief: Spatial visualization skills. Retrieved from http://www.wskc.org/documents/281621/307749/ENGAGE+Brief+-+Spatial+Skills.pdf/200fbd8f-41b2-47c3-b9dd-c53eaefdcac0?version=1.0
Thurstone, L. L. (1938). Primary Mental Abilities. Psychometrika Monograph No. 1. Chicago, IL: University of Chicago Press.
Thurstone, L. L. (1950). Some primary abilities in visual thinking. Proceedings of the American Philosophical Society, 94(6), 517–521. Retrieved from http://www.jstor.org/stable/3143593
Vandenberg, S. G., & Kuse, A. R. (1978). Mental rotations, a group test of three-dimensional spatial visualization. Perceptual and Motor Skills, 47(2), 599–604.
Wang, H-C., Chang, C-Y., & Li, T-Y. (2006). The comparative efficacy of 2D- versus 3D-based media design influencing spatial visualization skills. Computers in Human Behavior, 23(4), 1943–1957. doi:10.1016/j.chb.2006.02.004
Woolf, B., Romoser, M., Bergeron, D., & Fisher, D. (2003, July). Tutoring 3-dimensional visual skills: Dynamic adaptation to cognitive level. In Proceedings of the 11th International Conference on Artificial Intelligence in Education, Sydney, Australia.

Journal of Technology Education Vol. 26 No. 1, Fall 2014
-102-
Book Review McGreal, R., Kinuthia, W., & Marshall, S. (Eds.). (2013). Open educational
resources: Innovation, research and practice. Vancouver, Canada: Commonwealth of Learning and Athabasca University. ISBN 978-1-894975-62-9
Internet Links: http://www.col.org/PublicationDocuments/pub_PS_OER-IRP_web.pdf, http://www.col.org/resources/publications/Pages/detail.aspx?PID=446
The open access book, Open Educational Resources: Innovation, Research and Practice, is part of the Perspectives on Open and Distance Learning monograph series published by the UNESCO/Commonwealth of Learning (COL) Chair in Open Educational Resources. This book explores the open educational resources (OER) movement in detail, presenting the significant benefits, theory and practice, and achievements and challenges of OER for the educational community.
Editors Rory McGreal, Wanjira Kinuthia, and Stewart Marshall, along with other contributors (37 contributors in total), offer a comprehensive review to lead “practitioners, researchers, students and others interested in creating, using or studying OER” (p. xxi). The book is a compilation of peer-reviewed papers, presented by many of the most important international experts in the field of OER from five continents, which show the potential for future research on the topic. The 16 chapters are organized into four sections: (a) OER in Academia, (b) OER in Practice, (c) Diffusion of OER, and (d) Producing, Sharing, and Using OER. Each section is comprised of four chapters.
The first section, OER in Academia, shows the ways “in which OER are widening the international community of scholars with shared resources” (p. xxi). Chapter 1 presents the “trend of innovation, experimentation, and the use of technology to provide learning opportunities for large numbers of learners” (p. 6), detailing the Massive Open Online Course (MOOC) core. In Chapter 2, the project at Tecnológico de Monterrey, Mexico “has identified some key factors for the development of a model of effective knowledge transfer using OER” (p. 20). Chapter 3 explores “ways of institutionalising the management of OER” at the University of Cape Town (p. 44). And the project discussed in Chapter 4 aims to “provide pathways for OER learners to obtain credible certification and qualifications from accredited institutions within national education systems inputs” (p. 54). “The lead taken by universities in opening up education by releasing their content has been the major driving force in promoting OER” (p. xxi).
The second section, OER in Practice, “includes case studies and descriptions of specific working OER initiatives on three continents” (p. xxi). Chapter 5 describes “the role of OER in OpenLearn, an initiative of the Open University UK” (p. 63). Chapter 6 “provides an overview of the licensing conditions under which OER are typically made available” and, moreover, “identifies and discusses a number of practical concerns related to the use, distribution and, particularly, remixing and

Journal of Technology Education Vol. 26 No. 1, Fall 2014
-103-
redistribution of materials with differing OER licences” (p. 64). In Chapter 7, the authors relate “the development, processes, implementation, challenges and lessons learned during the African Virtual University (AVU) Multinational Project” (p. 64). Chapter 8 offers “an overview of three European initiatives that aim to support and facilitate open access to both educational resources and educational practices in the field of Science Education” (p. 64).
The third section, Diffusion of OER, explore “thoughts on how different groups approach releasing their content to the world” (p. xxi): “mixing, mashing, re-using and/or repurposing of available educational content” (p. 125). Chapter 9 is a personal reflection “on the beginnings of the OER movement in supporting the development of the OER community, from the first meeting sponsored by UNESCO, which considers access to education to be a fundamental human right” (p. 125). In Chapter 10, the author found “that learners in formal and informal learning contexts do not care about the license as long as the content is available and accessible online” (p. 126). Chapter 11 explores “the technical issues around OER content diffusion” and comment on “the need for developing, adapting and using formal technical specifications to support the diffusion of content over networks” (p. 126). And in Chapter 12, the author stresses “that the ‘ownership’ of the OER movement by the teachers is the critical factor in its success” (p. 126).
The last section, Producing, Sharing, and Using OER, explores the pedagogical, organizational, personal and technical issues that producing organizations and institutions need to address in designing, sharing and using OER. In Chapter 13, the authors “identify the key determinants of teachers’ sharing behavior using social exchange theory” (p. 175). In Chapter 14, contributors “argue that the low level of OER use in many developing countries can be partly attributed to the tendency to regard them as forms of technology that are neutral and value-free” (p. 176). In Chapter 15 the author presents “OER from two perspectives: the person who owns or produces the resource, and the person who requires access to the resource” (p. 176). In Chapter 16, the authors look at “the development of the African Health OER Network and explore how sustainable inter-institutional collaboration can facilitate OER production and sharing” (p. 176).
The contributions in this book describe trends, case studies, and analyses that will help communities to introduce the essential foundations of OER. “Curriculum developers, educational technologists, instructional designers, teachers, researchers, students [and] others involved in creating, studying or using OER: all will find this timely resource useful, informative and inspiring.”
Raidell Avello-Martínez ([email protected]) is Professor Auxiliary at University of Cienfuegos in Cuatro Caminos, Cienfuegos, Cuba.

Journal of Technology Education Vol. 26 No. 1, Fall 2014
-104-
Scope of the JTE The Journal of Technology Education provides a forum for scholarly discussion on topics relating to technology and engineering-related education. Manuscripts should focus on technology and engineering-related education research, philosophy, and theory. In addition, the Journal publishes book reviews, editorials, guest articles, comprehensive literature reviews, and reactions to previously published articles.
Editorial/Review Process Manuscripts that appear in the Articles section have been subjected to a blind review by three or more members of the Editorial Board. This process generally takes from six to eight weeks, at which time authors are promptly notified of the status of their manuscript. Book reviews, editorials, and reactions are reviewed by the Editor.
Manuscript Submission Guidelines One paper copy of each manuscript and an electronic version in Microsoft Word format on a CD, diskette, or other electronic media should be submitted to:
Chris Merrill, JTE Editor Department of Technology Illinois State University 215 Turner Hall Normal, IL 61790-5100
1. Overseas submissions in Microsoft Word format may be sent electronically via the Internet (to [email protected]) to expedite the review process.
2. All manuscripts must be double-spaced and must adhere to the guidelines published in Publication Guidelines of the American Psychological Association (6th Edition). Tables and figures, however, should be imbedded within the text itself rather than at the end of the document.
3. All figures and artwork must be scalable to fit within the JTE page size (4.5” x 7.25” column width and length) and included electronically within the document.
4. Line drawings and graphs must be editable within Microsoft products and in vector rather than raster format when possible.
5. Shading should not be used as a background for illustrations or graphs and within bar graphs. If needed, fill patterns consisting of lines should be used.
6. Manuscripts for articles should generally be 15-20 pages (22,000-36,000 characters in length, with 36,000 characters an absolute maximum). Book reviews, editorials, and reactions should be approximately four to eight manuscript pages (approx. 6,000-12,000 characters).

Journal of Technology Education Vol. 26 No. 1, Fall 2014
-105-
7. Authors for whom English is not the primary language must enlist a native English editor for the manuscript prior to submission. This person and his/her email address must be identified on the title page of the manuscript.
Subscription Information The Journal of Technology Education is published twice annually (Fall and Spring issues). New and renewing subscribers should copy and mail the form below: Name (please print)
Mailing Address (please print)
Email address: Fax: □New Subscription □ Renewal Subscription Make checks payable to: Journal of Technology Education. All checks must be drawn on a US bank.
Regular (USA): $20 Regular (Canada/Overseas): $30 Library (USA): $30 Library (Canada/Overseas): $40 Individual Back Issues (USA): $10 each Individual Back Issues (Canada/Overseas): $15 each
Return remittance along with this form to: Chris Merrill, JTE Editor Department of Technology Illinois State University 215 Turner Hall Normal, IL 61790-5100
JTE Co-Sponsors & Membership Information The International Technology and Engineering Educators Association (ITEEA) is a non-profit educational association concerned with advancing technological literacy. The Association functions at many levels – from international to local – in responding to member concerns. The Council on Technology and Engineering Teacher Education (CTETE), affiliated with the ITEEA, is concerned primarily with technology teacher education issues and activities. For membership information, contact: ITEEA, 1914 Association Drive, Reston, VA 22091 (703) 860-2100.

Journal of Technology Education Vol. 26 No. 1, Fall 2014
-106-
Journal of Technology Education Editor Chris Merrill, Illinois State University Technical Editor Amanda Fain, Illinois State University Previous Editors Mark Sanders, Virginia Polytechnic Institute and State University (1989-1997) James LaPorte, Virginia Polytechnic Institute and State University (1997-2010) Editorial Review Board Vincent Childress, North Carolina Agricultural and Technical University
Rodney Custer, Black Hills State University
Jenny Daugherty, Purdue University
Marc deVries, Delft University of Technology, The Netherlands
Patrick Foster, Central Connecticut State University
W. Tad Foster, Indiana State University
Brenda Gustafson, University of Alberta, Canada
Ronald Hansen, University of Western Ontario, Canada
Christine Hailey, Utah State University
Oenardi Lawanto, Utah State University
Theodore Lewis, University of Trinidad and Tobago
Stephen Petrina, University of British Columbia, Canada
Philip Reed, Old Dominion University
Mary Annette Rose, Ball State University
Kay Stables, Goldsmiths University of London, England
Ken Volk, Masdar Institute of Science and Technology, Abu Dhabi
John Wells, Virginia Polytechnic Institute and State University
John Williams, University of Waikato, Hamilton, New Zealand

Journal of Technology Education Vol. 26 No. 1, Fall 2014
-107-
Electronic Access to the JTE All issues of the Journal of Technology Education may be accessed on the World Wide Web at: http://scholar.lib.vt.edu/ejournals/JTE/ (Note: this URL is case sensitive). The views expressed in this publication are not necessarily those of the Editor or the Editorial Review Board, nor the officers of the Council on Technology and Engineering Teacher Education and the International Technology and Engineering Educators Association.