july 1, 2005 - june 30, 2006 2006 annual report · 2006 annual report 3 department overview the...
TRANSCRIPT
July 1, 2005 - June 30, 2006
2006 Annual Report
Department of Revenue & Regulation
12006 Annual Report
2 Secretary's Report
3 Department Overview
4 Tax Revenues: Collections
6 Tax Revenues: Distribution
8 A History of South Dakota Taxes
9 A Listing of South Dakota Taxes
12 Sales, Use and Contractors’ Excise Taxes
18 Special Taxes
20 Property Taxes
25 Fuel Tax and Motor Vehicle Licensing
27 Audits
28 How SD Compares to Other States
30 Legal Services
32 Insurance Fraud Prevention Unit
34 Division of Insurance
35 Administrative Services
35 Appraiser Certification Program
36 Division of Banking
37 Division of Securities
38 South Dakota Lottery
40 Commission on Gaming
42 Real Estate Commission
43 Petroleum Release Compensation Fund
44 Department Resources
Table of Contents
2 South Dakota Department of Revenue and Regulation
To the Governor, Legislature, andPeople of South Dakota:
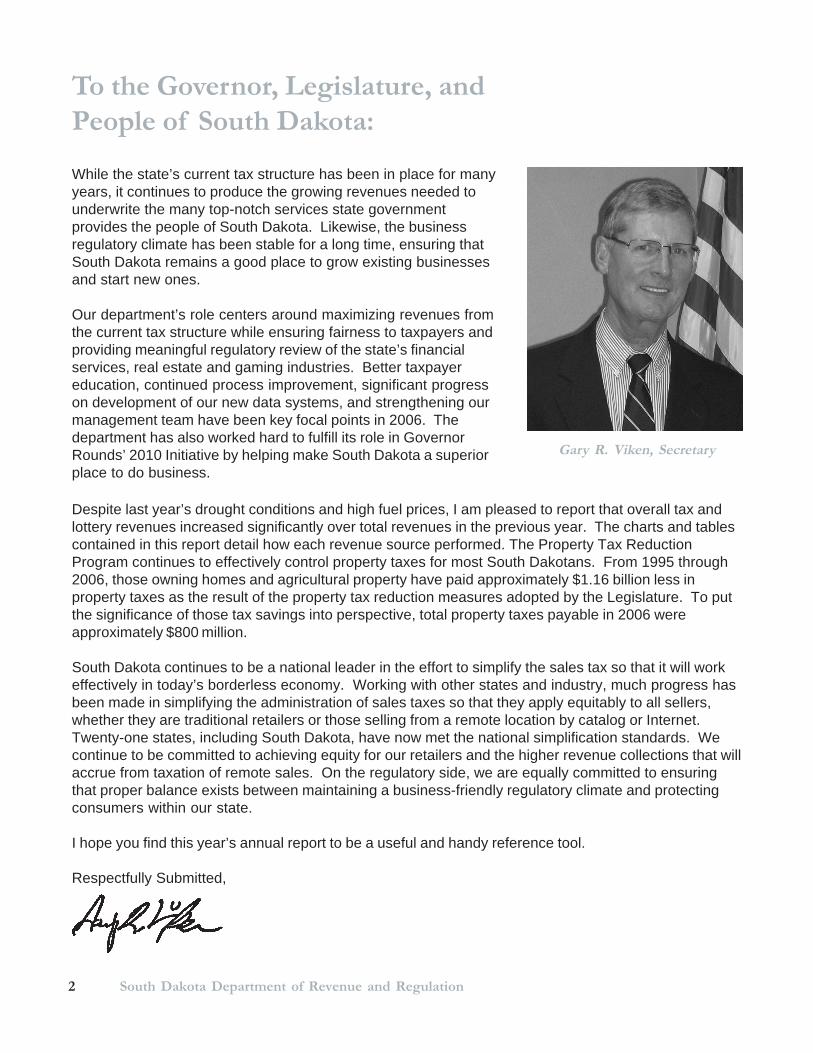
Gary R. Viken, Secretary
While the state’s current tax structure has been in place for manyyears, it continues to produce the growing revenues needed tounderwrite the many top-notch services state governmentprovides the people of South Dakota. Likewise, the businessregulatory climate has been stable for a long time, ensuring thatSouth Dakota remains a good place to grow existing businessesand start new ones.
Our department’s role centers around maximizing revenues fromthe current tax structure while ensuring fairness to taxpayers andproviding meaningful regulatory review of the state’s financialservices, real estate and gaming industries. Better taxpayereducation, continued process improvement, significant progresson development of our new data systems, and strengthening ourmanagement team have been key focal points in 2006. Thedepartment has also worked hard to fulfill its role in GovernorRounds’ 2010 Initiative by helping make South Dakota a superiorplace to do business.
Despite last year’s drought conditions and high fuel prices, I am pleased to report that overall tax andlottery revenues increased significantly over total revenues in the previous year. The charts and tablescontained in this report detail how each revenue source performed. The Property Tax ReductionProgram continues to effectively control property taxes for most South Dakotans. From 1995 through2006, those owning homes and agricultural property have paid approximately $1.16 billion less inproperty taxes as the result of the property tax reduction measures adopted by the Legislature. To putthe significance of those tax savings into perspective, total property taxes payable in 2006 wereapproximately $800 million.
South Dakota continues to be a national leader in the effort to simplify the sales tax so that it will workeffectively in today’s borderless economy. Working with other states and industry, much progress hasbeen made in simplifying the administration of sales taxes so that they apply equitably to all sellers,whether they are traditional retailers or those selling from a remote location by catalog or Internet.Twenty-one states, including South Dakota, have now met the national simplification standards. Wecontinue to be committed to achieving equity for our retailers and the higher revenue collections that willaccrue from taxation of remote sales. On the regulatory side, we are equally committed to ensuringthat proper balance exists between maintaining a business-friendly regulatory climate and protectingconsumers within our state.
I hope you find this year’s annual report to be a useful and handy reference tool.
Respectfully Submitted,
32006 Annual Report
Department Overview
The Department of Revenue and Regulation consists of 11 divisions, 3 boards or commissions, and theOffice of the Secretary. Included in the department are: the Abstractor’s Board of Examiners; Audits;Banking; Business Tax; Division of the Secretariat (includes Administrative Services, AppraiserCertification Program, and Legal Services); Gaming Commission; Insurance; Insurance Fraud Unit;Lottery; Motor Vehicles; Petroleum Release Compensation Fund; Property and Special Taxes; RealEstate Commission; and Securities. The department secretary, division directors and a majority of staffare in Pierre, housed in four locations:
Anderson Building, 445 East Capitol Avenue: Office of the Secretary, Audits, Business Tax, Divisionof the Secretariat, Insurance, Insurance Fraud Unit, Motor Vehicles, Petroleum Release CompensationFund, Property and Special Taxes, and Securities
St. Charles Building, 207 East Capitol Avenue: South Dakota Lottery
Trucano Building, 217 West Missouri Avenue: Banking
221 West Capitol Avenue, Suite 101: Gaming Commission, Real Estate Commission
The department also has six divisional field offices in Aberdeen, Mitchell, Rapid City, Sioux Falls,Watertown, and Yankton as well as employees in Deadwood and North Sioux City.
In fiscal year 2006, 313 full-time employees worked for the Department of Revenue and Regulationadministering, collecting, and distributing the state’s 90 separate types of taxes and fees.Total administrative costs were $64,216,887, of which $889,831 were general fund dollars.
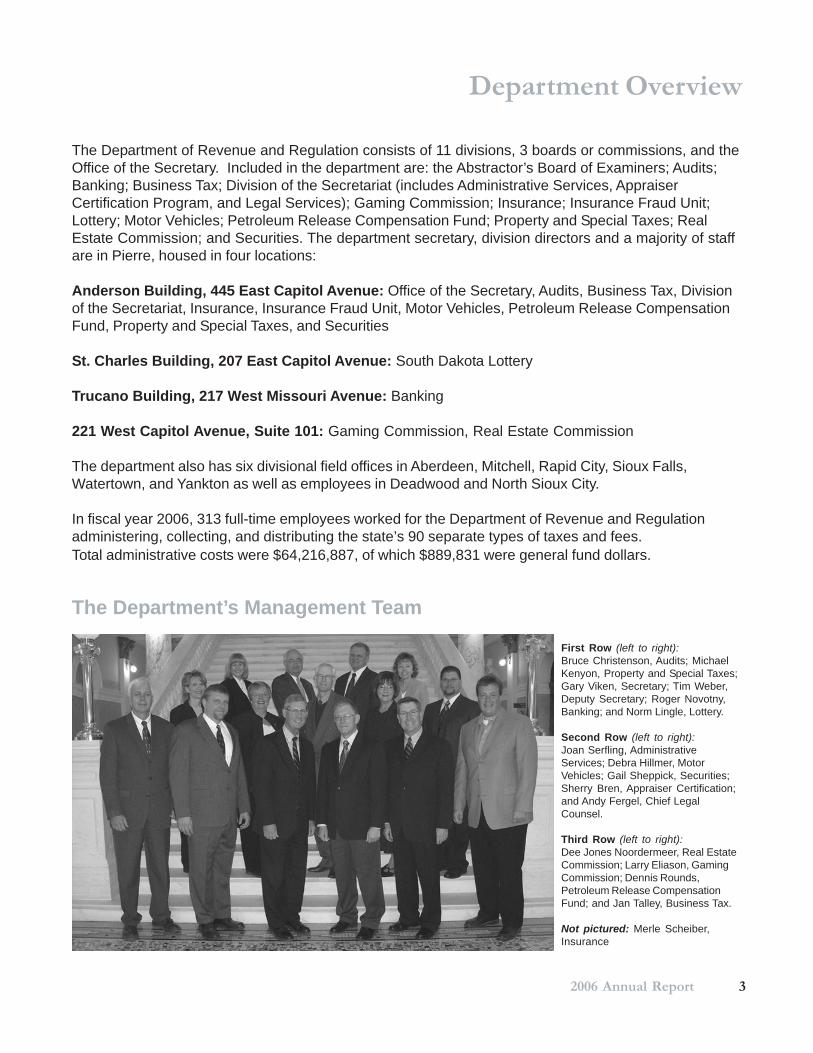
The Department’s Management Team
First Row (left to right):Bruce Christenson, Audits; MichaelKenyon, Property and Special Taxes;Gary Viken, Secretary; Tim Weber,Deputy Secretary; Roger Novotny,Banking; and Norm Lingle, Lottery.
Second Row (left to right):Joan Serfling, AdministrativeServices; Debra Hillmer, MotorVehicles; Gail Sheppick, Securities;Sherry Bren, Appraiser Certification;and Andy Fergel, Chief LegalCounsel.
Third Row (left to right):Dee Jones Noordermeer, Real EstateCommission; Larry Eliason, GamingCommission; Dennis Rounds,Petroleum Release CompensationFund; and Jan Talley, Business Tax.
Not pictured: Merle Scheiber,Insurance
4 South Dakota Department of Revenue and Regulation
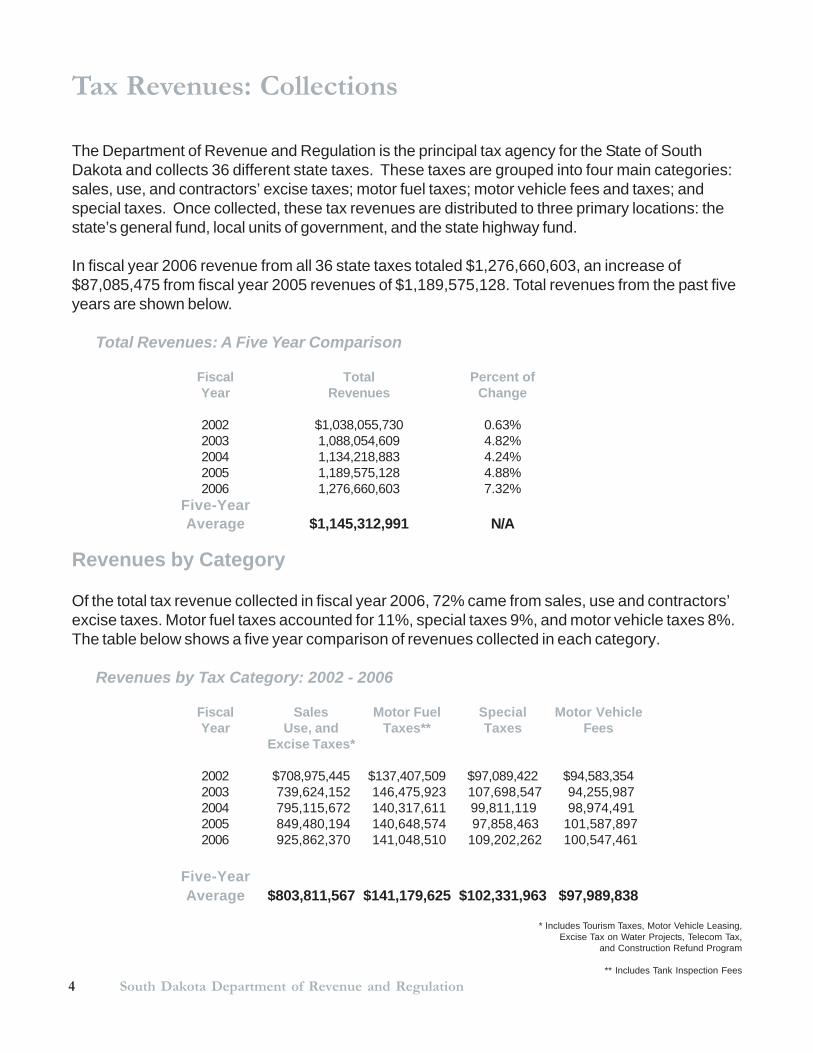
The Department of Revenue and Regulation is the principal tax agency for the State of SouthDakota and collects 36 different state taxes. These taxes are grouped into four main categories:sales, use, and contractors’ excise taxes; motor fuel taxes; motor vehicle fees and taxes; andspecial taxes. Once collected, these tax revenues are distributed to three primary locations: thestate’s general fund, local units of government, and the state highway fund.
In fiscal year 2006 revenue from all 36 state taxes totaled $1,276,660,603, an increase of$87,085,475 from fiscal year 2005 revenues of $1,189,575,128. Total revenues from the past fiveyears are shown below.
Tax Revenues: Collections
Total Revenues: A Five Year Comparison
Fiscal Total Percent ofYear Revenues Change
2002 $1,038,055,730 0.63%2003 1,088,054,609 4.82%2004 1,134,218,883 4.24%2005 1,189,575,128 4.88%2006 1,276,660,603 7.32%
Five-YearAverage $1,145,312,991 N/A
Revenues by Category
Of the total tax revenue collected in fiscal year 2006, 72% came from sales, use and contractors’excise taxes. Motor fuel taxes accounted for 11%, special taxes 9%, and motor vehicle taxes 8%.The table below shows a five year comparison of revenues collected in each category.
Revenues by Tax Category: 2002 - 2006
Fiscal Sales Motor Fuel Special Motor VehicleYear Use, and Taxes** Taxes Fees
Excise Taxes*
2002 $708,975,445 $137,407,509 $97,089,422 $94,583,3542003 739,624,152 146,475,923 107,698,547 94,255,9872004 795,115,672 140,317,611 99,811,119 98,974,4912005 849,480,194 140,648,574 97,858,463 101,587,8972006 925,862,370 141,048,510 109,202,262 100,547,461
Five-YearAverage $803,811,567 $141,179,625 $102,331,963 $97,989,838
* Includes Tourism Taxes, Motor Vehicle Leasing,Excise Tax on Water Projects, Telecom Tax,
and Construction Refund Program
** Includes Tank Inspection Fees
52006 Annual Report
Collections/continued
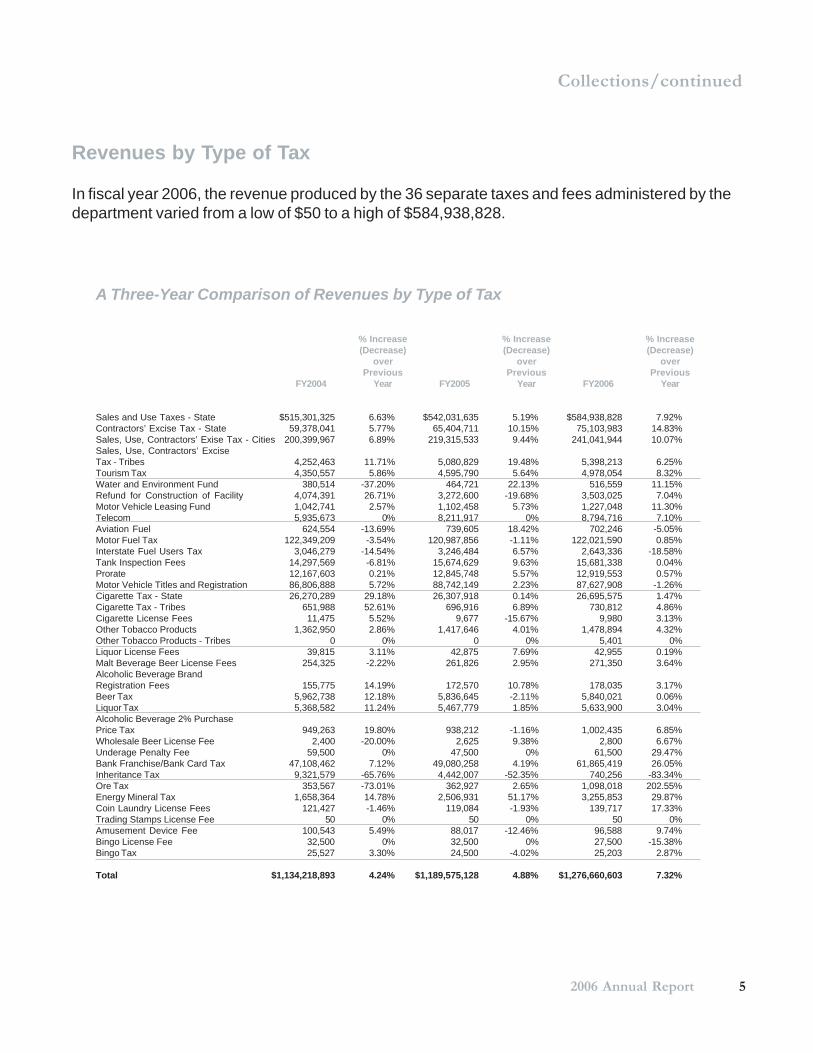
Revenues by Type of Tax
In fiscal year 2006, the revenue produced by the 36 separate taxes and fees administered by thedepartment varied from a low of $50 to a high of $584,938,828.
A Three-Year Comparison of Revenues by Type of Tax
% Increase % Increase % Increase(Decrease) (Decrease) (Decrease)
over over overPrevious Previous Previous
FY2004 Year FY2005 Year FY2006 Year
Sales and Use Taxes - State $515,301,325 6.63% $542,031,635 5.19% $584,938,828 7.92%Contractors’ Excise Tax - State 59,378,041 5.77% 65,404,711 10.15% 75,103,983 14.83%Sales, Use, Contractors’ Exise Tax - Cities 200,399,967 6.89% 219,315,533 9.44% 241,041,944 10.07%Sales, Use, Contractors’ ExciseTax - Tribes 4,252,463 11.71% 5,080,829 19.48% 5,398,213 6.25%Tourism Tax 4,350,557 5.86% 4,595,790 5.64% 4,978,054 8.32%Water and Environment Fund 380,514 -37.20% 464,721 22.13% 516,559 11.15%Refund for Construction of Facility 4,074,391 26.71% 3,272,600 -19.68% 3,503,025 7.04%Motor Vehicle Leasing Fund 1,042,741 2.57% 1,102,458 5.73% 1,227,048 11.30%Telecom 5,935,673 0% 8,211,917 0% 8,794,716 7.10%Aviation Fuel 624,554 -13.69% 739,605 18.42% 702,246 -5.05%Motor Fuel Tax 122,349,209 -3.54% 120,987,856 -1.11% 122,021,590 0.85%Interstate Fuel Users Tax 3,046,279 -14.54% 3,246,484 6.57% 2,643,336 -18.58%Tank Inspection Fees 14,297,569 -6.81% 15,674,629 9.63% 15,681,338 0.04%Prorate 12,167,603 0.21% 12,845,748 5.57% 12,919,553 0.57%Motor Vehicle Titles and Registration 86,806,888 5.72% 88,742,149 2.23% 87,627,908 -1.26%Cigarette Tax - State 26,270,289 29.18% 26,307,918 0.14% 26,695,575 1.47%Cigarette Tax - Tribes 651,988 52.61% 696,916 6.89% 730,812 4.86%Cigarette License Fees 11,475 5.52% 9,677 -15.67% 9,980 3.13%Other Tobacco Products 1,362,950 2.86% 1,417,646 4.01% 1,478,894 4.32%Other Tobacco Products - Tribes 0 0% 0 0% 5,401 0%Liquor License Fees 39,815 3.11% 42,875 7.69% 42,955 0.19%Malt Beverage Beer License Fees 254,325 -2.22% 261,826 2.95% 271,350 3.64%Alcoholic Beverage BrandRegistration Fees 155,775 14.19% 172,570 10.78% 178,035 3.17%Beer Tax 5,962,738 12.18% 5,836,645 -2.11% 5,840,021 0.06%Liquor Tax 5,368,582 11.24% 5,467,779 1.85% 5,633,900 3.04%Alcoholic Beverage 2% PurchasePrice Tax 949,263 19.80% 938,212 -1.16% 1,002,435 6.85%Wholesale Beer License Fee 2,400 -20.00% 2,625 9.38% 2,800 6.67%Underage Penalty Fee 59,500 0% 47,500 0% 61,500 29.47%Bank Franchise/Bank Card Tax 47,108,462 7.12% 49,080,258 4.19% 61,865,419 26.05%Inheritance Tax 9,321,579 -65.76% 4,442,007 -52.35% 740,256 -83.34%Ore Tax 353,567 -73.01% 362,927 2.65% 1,098,018 202.55%Energy Mineral Tax 1,658,364 14.78% 2,506,931 51.17% 3,255,853 29.87%Coin Laundry License Fees 121,427 -1.46% 119,084 -1.93% 139,717 17.33%Trading Stamps License Fee 50 0% 50 0% 50 0%Amusement Device Fee 100,543 5.49% 88,017 -12.46% 96,588 9.74%Bingo License Fee 32,500 0% 32,500 0% 27,500 -15.38%Bingo Tax 25,527 3.30% 24,500 -4.02% 25,203 2.87%
Total $1,134,218,893 4.24% $1,189,575,128 4.88% $1,276,660,603 7.32%
6 South Dakota Department of Revenue and Regulation
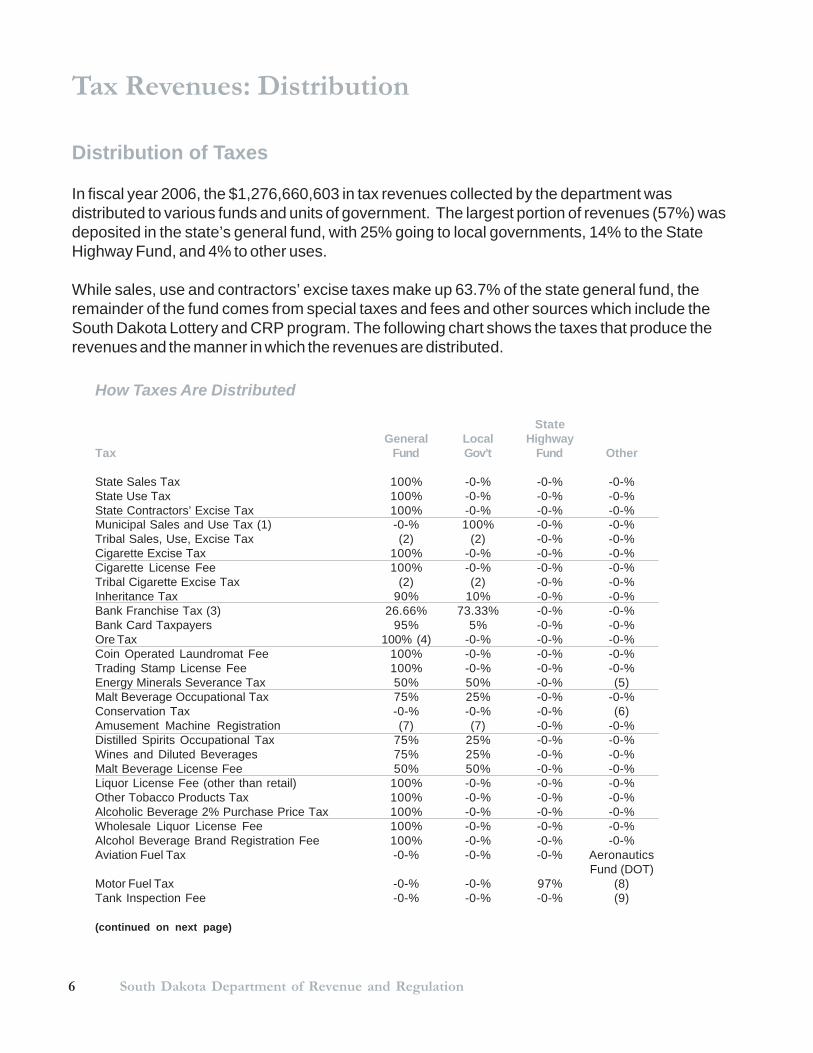
How Taxes Are Distributed
StateGeneral Local Highway
Tax Fund Gov’t Fund Other
State Sales Tax 100% -0-% -0-% -0-%State Use Tax 100% -0-% -0-% -0-%State Contractors’ Excise Tax 100% -0-% -0-% -0-%Municipal Sales and Use Tax (1) -0-% 100% -0-% -0-%Tribal Sales, Use, Excise Tax (2) (2) -0-% -0-%Cigarette Excise Tax 100% -0-% -0-% -0-%Cigarette License Fee 100% -0-% -0-% -0-%Tribal Cigarette Excise Tax (2) (2) -0-% -0-%Inheritance Tax 90% 10% -0-% -0-%Bank Franchise Tax (3) 26.66% 73.33% -0-% -0-%Bank Card Taxpayers 95% 5% -0-% -0-%Ore Tax 100% (4) -0-% -0-% -0-%Coin Operated Laundromat Fee 100% -0-% -0-% -0-%Trading Stamp License Fee 100% -0-% -0-% -0-%Energy Minerals Severance Tax 50% 50% -0-% (5)Malt Beverage Occupational Tax 75% 25% -0-% -0-%Conservation Tax -0-% -0-% -0-% (6)Amusement Machine Registration (7) (7) -0-% -0-%Distilled Spirits Occupational Tax 75% 25% -0-% -0-%Wines and Diluted Beverages 75% 25% -0-% -0-%Malt Beverage License Fee 50% 50% -0-% -0-%Liquor License Fee (other than retail) 100% -0-% -0-% -0-%Other Tobacco Products Tax 100% -0-% -0-% -0-%Alcoholic Beverage 2% Purchase Price Tax 100% -0-% -0-% -0-%Wholesale Liquor License Fee 100% -0-% -0-% -0-%Alcohol Beverage Brand Registration Fee 100% -0-% -0-% -0-%Aviation Fuel Tax -0-% -0-% -0-% Aeronautics
Fund (DOT)Motor Fuel Tax -0-% -0-% 97% (8)Tank Inspection Fee -0-% -0-% -0-% (9)
(continued on next page)
Distribution of Taxes
In fiscal year 2006, the $1,276,660,603 in tax revenues collected by the department wasdistributed to various funds and units of government. The largest portion of revenues (57%) wasdeposited in the state’s general fund, with 25% going to local governments, 14% to the StateHighway Fund, and 4% to other uses.
While sales, use and contractors’ excise taxes make up 63.7% of the state general fund, theremainder of the fund comes from special taxes and fees and other sources which include theSouth Dakota Lottery and CRP program. The following chart shows the taxes that produce therevenues and the manner in which the revenues are distributed.
Tax Revenues: Distribution
72006 Annual Report
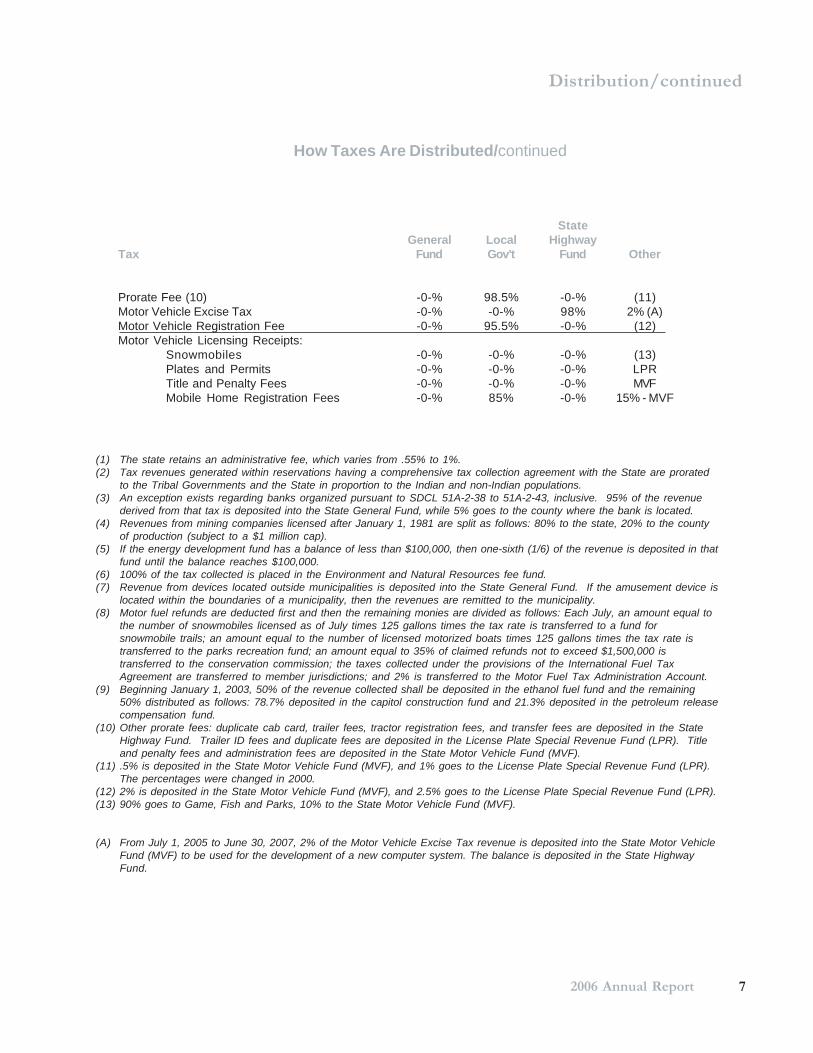
How Taxes Are Distributed/continued
StateGeneral Local Highway
Tax Fund Gov’t Fund Other
Prorate Fee (10) -0-% 98.5% -0-% (11)Motor Vehicle Excise Tax -0-% -0-% 98% 2% (A)Motor Vehicle Registration Fee -0-% 95.5% -0-% (12)Motor Vehicle Licensing Receipts:
Snowmobiles -0-% -0-% -0-% (13)Plates and Permits -0-% -0-% -0-% LPRTitle and Penalty Fees -0-% -0-% -0-% MVFMobile Home Registration Fees -0-% 85% -0-% 15% - MVF
(1) The state retains an administrative fee, which varies from .55% to 1%.(2) Tax revenues generated within reservations having a comprehensive tax collection agreement with the State are prorated
to the Tribal Governments and the State in proportion to the Indian and non-Indian populations.(3) An exception exists regarding banks organized pursuant to SDCL 51A-2-38 to 51A-2-43, inclusive. 95% of the revenue
derived from that tax is deposited into the State General Fund, while 5% goes to the county where the bank is located.(4) Revenues from mining companies licensed after January 1, 1981 are split as follows: 80% to the state, 20% to the county
of production (subject to a $1 million cap).(5) If the energy development fund has a balance of less than $100,000, then one-sixth (1/6) of the revenue is deposited in that
fund until the balance reaches $100,000.(6) 100% of the tax collected is placed in the Environment and Natural Resources fee fund.(7) Revenue from devices located outside municipalities is deposited into the State General Fund. If the amusement device is
located within the boundaries of a municipality, then the revenues are remitted to the municipality.(8) Motor fuel refunds are deducted first and then the remaining monies are divided as follows: Each July, an amount equal to
the number of snowmobiles licensed as of July times 125 gallons times the tax rate is transferred to a fund forsnowmobile trails; an amount equal to the number of licensed motorized boats times 125 gallons times the tax rate istransferred to the parks recreation fund; an amount equal to 35% of claimed refunds not to exceed $1,500,000 istransferred to the conservation commission; the taxes collected under the provisions of the International Fuel TaxAgreement are transferred to member jurisdictions; and 2% is transferred to the Motor Fuel Tax Administration Account.
(9) Beginning January 1, 2003, 50% of the revenue collected shall be deposited in the ethanol fuel fund and the remaining50% distributed as follows: 78.7% deposited in the capitol construction fund and 21.3% deposited in the petroleum releasecompensation fund.
(10) Other prorate fees: duplicate cab card, trailer fees, tractor registration fees, and transfer fees are deposited in the StateHighway Fund. Trailer ID fees and duplicate fees are deposited in the License Plate Special Revenue Fund (LPR). Titleand penalty fees and administration fees are deposited in the State Motor Vehicle Fund (MVF).
(11) .5% is deposited in the State Motor Vehicle Fund (MVF), and 1% goes to the License Plate Special Revenue Fund (LPR).The percentages were changed in 2000.
(12) 2% is deposited in the State Motor Vehicle Fund (MVF), and 2.5% goes to the License Plate Special Revenue Fund (LPR).(13) 90% goes to Game, Fish and Parks, 10% to the State Motor Vehicle Fund (MVF).
(A) From July 1, 2005 to June 30, 2007, 2% of the Motor Vehicle Excise Tax revenue is deposited into the State Motor VehicleFund (MVF) to be used for the development of a new computer system. The balance is deposited in the State HighwayFund.
Distribution/continued
8 South Dakota Department of Revenue and Regulation
A History of South Dakota Taxes
A Chronology of Tax Legislation
The first state tax in South Dakota - an inheritance tax - was enacted by the legislature in 1905.Since that time, there have been a number of major expansions and changes in our tax codes, asevidenced by this chronology of the tax history of South Dakota.
1905 Inheritance Tax2000 Last Major Change: Voters repealed the tax.
1913 License Fees, Non-Commercial1999 Last Major Change: Fees increased on non-commercial vehicles by an average of $12. Motor homefees increased. Travel trailers no longer qualified for ID plates.
1923 Motor Fuel1999 Last Major Change: Tax increased on April 1 from $.18 to $.22 per gallon.
1923 Cigarettes2003 Last Major Change: Increased from $.33 to $.53 per pack of 20 and $.42 to $.67 on packs of 25.
1933 License Fees, Commercial1982 Last Major Change: License fees were restructured.
1935 Alcohol BeverageSpirits - 1987 Last Major Change: $3.80 to $3.93 per gallon. Malt Beverages - 1987 Last Major Change:$8.30 to $8.50 per barrel. Table Wine - 1987 Last Major Change: $.90 to $.93 per gallon.
1935 Sales Tax2004 Last Major Change: Tax repealed on trucking of products and small package delivery companies. Alsoexempted transportation services provided by household moving companies.
1935 Mineral Extraction1994 Last Major Change: Changed from gross yield and net income to gross production ($4.00 per ounce ofsevered gold) and 10% net income.
1937 Motor Vehicle Registration1996 Last Major Change: Changed fees for personalized plates from $75 initial fee plus $10 per year to $25per year with no initial fee.
1939 Bank Franchise2000 Last Major Change: Lowered the net income levels on which the bank franchise tax is based.
1939 Use Tax2004 Last Major Change: Tax repealed on trucking of products and small package delivery companies. Alsoexempted transportation services provided by household moving companies.
1941 Special Fuel1999 Last Major Change: Tax increased on April 1 from $.18 to $.22 per gallon.
1965 Interstate Fuels1995 Last Major Change: Allowed state to enter into agreements for the collection of fuel tax on interstatemotor carriers.
1977 Energy MineralsNo major changes made since implementation.
1979 Contractors’ Excise Tax1995 Last Major Change: Increased the tax rate on utility contracts from 1.5% to 2%.
1988 Tank Inspection Fee1993 Last Major Change: Increased from $.01 per gallon to $.02 per gallon on all petroleum productsintroduced into this state.
1995 Other Tobacco Products Tax1995 Last Major Change: 10% tax imposed on the wholesale purchase price of other tobacco products.
1998 Alcohol Beverage: Cider1998: Cider was added as a category at a rate of $.28 per gallon.
92006 Annual Report
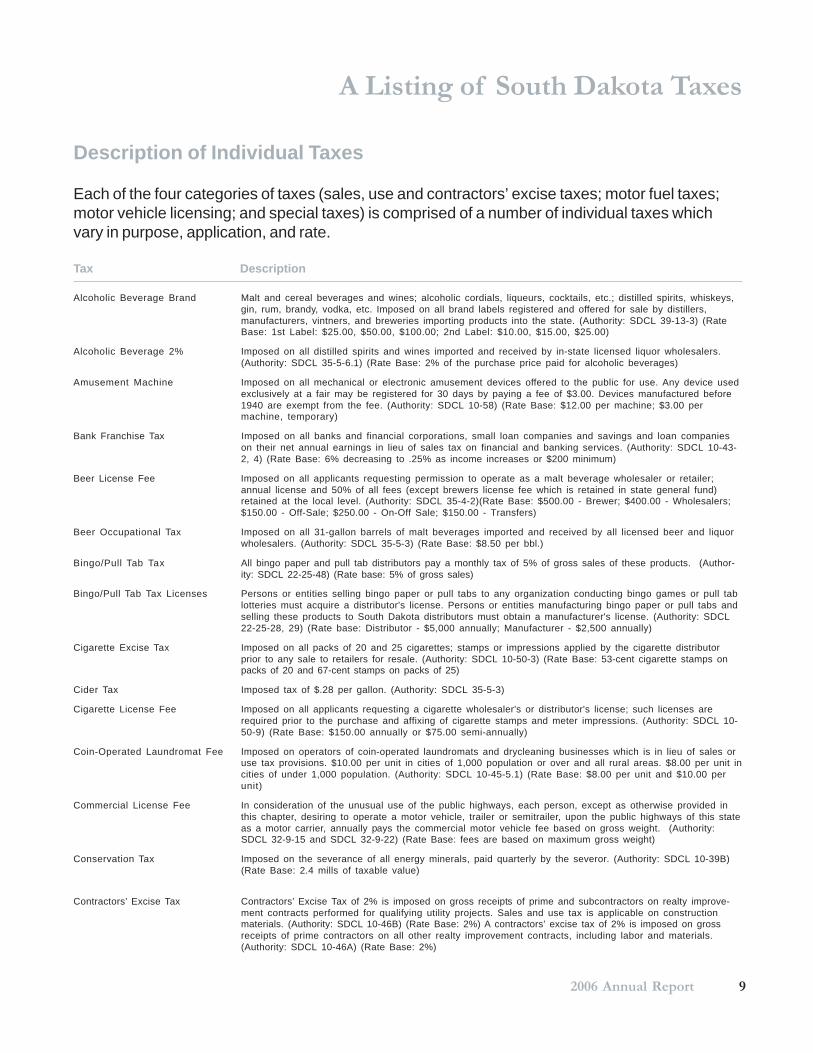
A Listing of South Dakota Taxes
Description of Individual Taxes
Each of the four categories of taxes (sales, use and contractors’ excise taxes; motor fuel taxes;motor vehicle licensing; and special taxes) is comprised of a number of individual taxes whichvary in purpose, application, and rate.
Tax Description
Alcoholic Beverage Brand Malt and cereal beverages and wines; alcoholic cordials, liqueurs, cocktails, etc.; distilled spirits, whiskeys,gin, rum, brandy, vodka, etc. Imposed on all brand labels registered and offered for sale by distillers,manufacturers, vintners, and breweries importing products into the state. (Authority: SDCL 39-13-3) (RateBase: 1st Label: $25.00, $50.00, $100.00; 2nd Label: $10.00, $15.00, $25.00)
Alcoholic Beverage 2% Imposed on all distilled spirits and wines imported and received by in-state licensed liquor wholesalers.(Authority: SDCL 35-5-6.1) (Rate Base: 2% of the purchase price paid for alcoholic beverages)
Amusement Machine Imposed on all mechanical or electronic amusement devices offered to the public for use. Any device usedexclusively at a fair may be registered for 30 days by paying a fee of $3.00. Devices manufactured before1940 are exempt from the fee. (Authority: SDCL 10-58) (Rate Base: $12.00 per machine; $3.00 permachine, temporary)
Bank Franchise Tax Imposed on all banks and financial corporations, small loan companies and savings and loan companieson their net annual earnings in lieu of sales tax on financial and banking services. (Authority: SDCL 10-43-2, 4) (Rate Base: 6% decreasing to .25% as income increases or $200 minimum)
Beer License Fee Imposed on all applicants requesting permission to operate as a malt beverage wholesaler or retailer;annual license and 50% of all fees (except brewers license fee which is retained in state general fund)retained at the local level. (Authority: SDCL 35-4-2)(Rate Base: $500.00 - Brewer; $400.00 - Wholesalers;$150.00 - Off-Sale; $250.00 - On-Off Sale; $150.00 - Transfers)
Beer Occupational Tax Imposed on all 31-gallon barrels of malt beverages imported and received by all licensed beer and liquorwholesalers. (Authority: SDCL 35-5-3) (Rate Base: $8.50 per bbl.)
Bingo/Pull Tab Tax All bingo paper and pull tab distributors pay a monthly tax of 5% of gross sales of these products. (Author-ity: SDCL 22-25-48) (Rate base: 5% of gross sales)
Bingo/Pull Tab Tax Licenses Persons or entities selling bingo paper or pull tabs to any organization conducting bingo games or pull tablotteries must acquire a distributor's license. Persons or entities manufacturing bingo paper or pull tabs andselling these products to South Dakota distributors must obtain a manufacturer's license. (Authority: SDCL22-25-28, 29) (Rate base: Distributor - $5,000 annually; Manufacturer - $2,500 annually)
Cigarette Excise Tax Imposed on all packs of 20 and 25 cigarettes; stamps or impressions applied by the cigarette distributorprior to any sale to retailers for resale. (Authority: SDCL 10-50-3) (Rate Base: 53-cent cigarette stamps onpacks of 20 and 67-cent stamps on packs of 25)
Cider Tax Imposed tax of $.28 per gallon. (Authority: SDCL 35-5-3)
Cigarette License Fee Imposed on all applicants requesting a cigarette wholesaler's or distributor's license; such licenses arerequired prior to the purchase and affixing of cigarette stamps and meter impressions. (Authority: SDCL 10-50-9) (Rate Base: $150.00 annually or $75.00 semi-annually)
Coin-Operated Laundromat Fee Imposed on operators of coin-operated laundromats and drycleaning businesses which is in lieu of sales oruse tax provisions. $10.00 per unit in cities of 1,000 population or over and all rural areas. $8.00 per unit incities of under 1,000 population. (Authority: SDCL 10-45-5.1) (Rate Base: $8.00 per unit and $10.00 perunit)
Commercial License Fee In consideration of the unusual use of the public highways, each person, except as otherwise provided inthis chapter, desiring to operate a motor vehicle, trailer or semitrailer, upon the public highways of this stateas a motor carrier, annually pays the commercial motor vehicle fee based on gross weight. (Authority:SDCL 32-9-15 and SDCL 32-9-22) (Rate Base: fees are based on maximum gross weight)
Conservation Tax Imposed on the severance of all energy minerals, paid quarterly by the severor. (Authority: SDCL 10-39B)(Rate Base: 2.4 mills of taxable value)
Contractors’ Excise Tax Contractors’ Excise Tax of 2% is imposed on gross receipts of prime and subcontractors on realty improve-ment contracts performed for qualifying utility projects. Sales and use tax is applicable on constructionmaterials. (Authority: SDCL 10-46B) (Rate Base: 2%) A contractors’ excise tax of 2% is imposed on grossreceipts of prime contractors on all other realty improvement contracts, including labor and materials.(Authority: SDCL 10-46A) (Rate Base: 2%)
10 South Dakota Department of Revenue and Regulation
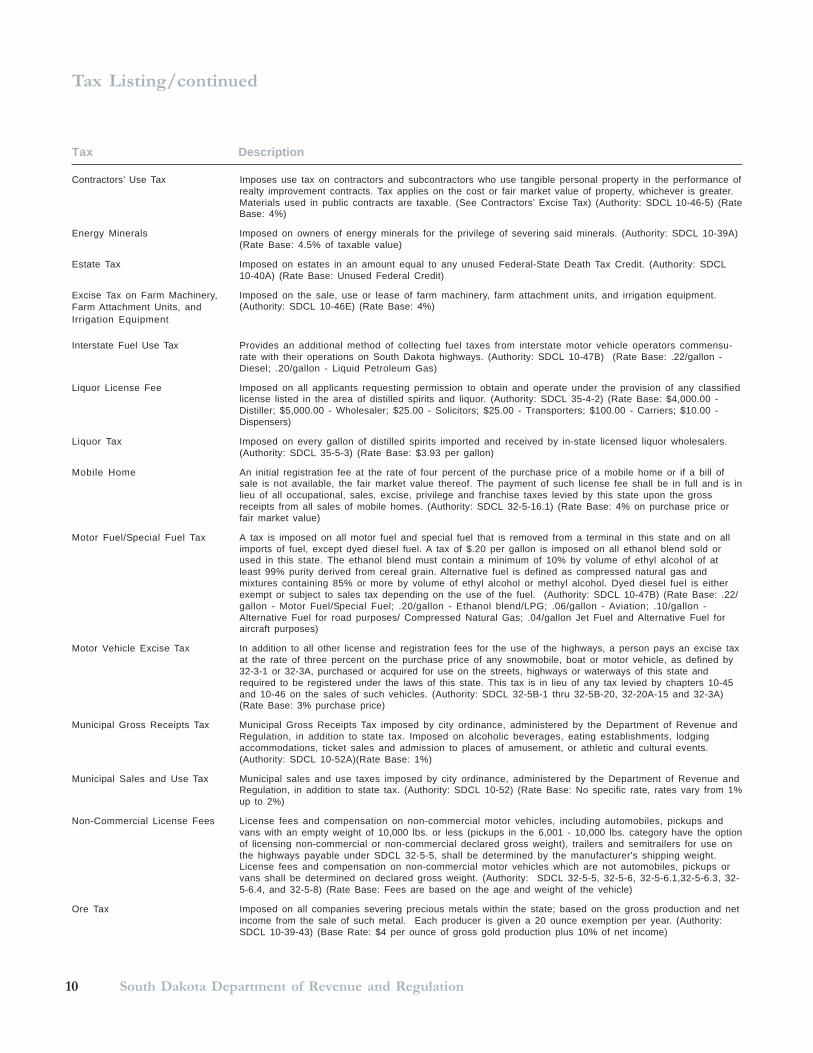
Tax Listing/continued
Tax Description
Contractors’ Use Tax Imposes use tax on contractors and subcontractors who use tangible personal property in the performance ofrealty improvement contracts. Tax applies on the cost or fair market value of property, whichever is greater.Materials used in public contracts are taxable. (See Contractors’ Excise Tax) (Authority: SDCL 10-46-5) (RateBase: 4%)
Energy Minerals Imposed on owners of energy minerals for the privilege of severing said minerals. (Authority: SDCL 10-39A)(Rate Base: 4.5% of taxable value)
Estate Tax Imposed on estates in an amount equal to any unused Federal-State Death Tax Credit. (Authority: SDCL10-40A) (Rate Base: Unused Federal Credit)
Excise Tax on Farm Machinery, Imposed on the sale, use or lease of farm machinery, farm attachment units, and irrigation equipment.(Authority: SDCL 10-46E) (Rate Base: 4%)
Interstate Fuel Use Tax Provides an additional method of collecting fuel taxes from interstate motor vehicle operators commensu-rate with their operations on South Dakota highways. (Authority: SDCL 10-47B) (Rate Base: .22/gallon -Diesel; .20/gallon - Liquid Petroleum Gas)
Liquor License Fee Imposed on all applicants requesting permission to obtain and operate under the provision of any classifiedlicense listed in the area of distilled spirits and liquor. (Authority: SDCL 35-4-2) (Rate Base: $4,000.00 -Distiller; $5,000.00 - Wholesaler; $25.00 - Solicitors; $25.00 - Transporters; $100.00 - Carriers; $10.00 -Dispensers)
Liquor Tax Imposed on every gallon of distilled spirits imported and received by in-state licensed liquor wholesalers.(Authority: SDCL 35-5-3) (Rate Base: $3.93 per gallon)
Mobile Home An initial registration fee at the rate of four percent of the purchase price of a mobile home or if a bill ofsale is not available, the fair market value thereof. The payment of such license fee shall be in full and is inlieu of all occupational, sales, excise, privilege and franchise taxes levied by this state upon the grossreceipts from all sales of mobile homes. (Authority: SDCL 32-5-16.1) (Rate Base: 4% on purchase price orfair market value)
Motor Fuel/Special Fuel Tax A tax is imposed on all motor fuel and special fuel that is removed from a terminal in this state and on allimports of fuel, except dyed diesel fuel. A tax of $.20 per gallon is imposed on all ethanol blend sold orused in this state. The ethanol blend must contain a minimum of 10% by volume of ethyl alcohol of atleast 99% purity derived from cereal grain. Alternative fuel is defined as compressed natural gas andmixtures containing 85% or more by volume of ethyl alcohol or methyl alcohol. Dyed diesel fuel is eitherexempt or subject to sales tax depending on the use of the fuel. (Authority: SDCL 10-47B) (Rate Base: .22/gallon - Motor Fuel/Special Fuel; .20/gallon - Ethanol blend/LPG; .06/gallon - Aviation; .10/gallon -Alternative Fuel for road purposes/ Compressed Natural Gas; .04/gallon Jet Fuel and Alternative Fuel foraircraft purposes)
Motor Vehicle Excise Tax In addition to all other license and registration fees for the use of the highways, a person pays an excise taxat the rate of three percent on the purchase price of any snowmobile, boat or motor vehicle, as defined by32-3-1 or 32-3A, purchased or acquired for use on the streets, highways or waterways of this state andrequired to be registered under the laws of this state. This tax is in lieu of any tax levied by chapters 10-45and 10-46 on the sales of such vehicles. (Authority: SDCL 32-5B-1 thru 32-5B-20, 32-20A-15 and 32-3A)(Rate Base: 3% purchase price)
Municipal Gross Receipts Tax Municipal Gross Receipts Tax imposed by city ordinance, administered by the Department of Revenue andRegulation, in addition to state tax. Imposed on alcoholic beverages, eating establishments, lodgingaccommodations, ticket sales and admission to places of amusement, or athletic and cultural events.(Authority: SDCL 10-52A)(Rate Base: 1%)
Municipal Sales and Use Tax Municipal sales and use taxes imposed by city ordinance, administered by the Department of Revenue andRegulation, in addition to state tax. (Authority: SDCL 10-52) (Rate Base: No specific rate, rates vary from 1%up to 2%)
Non-Commercial License Fees License fees and compensation on non-commercial motor vehicles, including automobiles, pickups andvans with an empty weight of 10,000 lbs. or less (pickups in the 6,001 - 10,000 lbs. category have the optionof licensing non-commercial or non-commercial declared gross weight), trailers and semitrailers for use onthe highways payable under SDCL 32-5-5, shall be determined by the manufacturer's shipping weight.License fees and compensation on non-commercial motor vehicles which are not automobiles, pickups orvans shall be determined on declared gross weight. (Authority: SDCL 32-5-5, 32-5-6, 32-5-6.1,32-5-6.3, 32-5-6.4, and 32-5-8) (Rate Base: Fees are based on the age and weight of the vehicle)
Ore Tax Imposed on all companies severing precious metals within the state; based on the gross production and netincome from the sale of such metal. Each producer is given a 20 ounce exemption per year. (Authority:SDCL 10-39-43) (Base Rate: $4 per ounce of gross gold production plus 10% of net income)
Farm Attachment Units, andIrrigation Equipment
112006 Annual Report
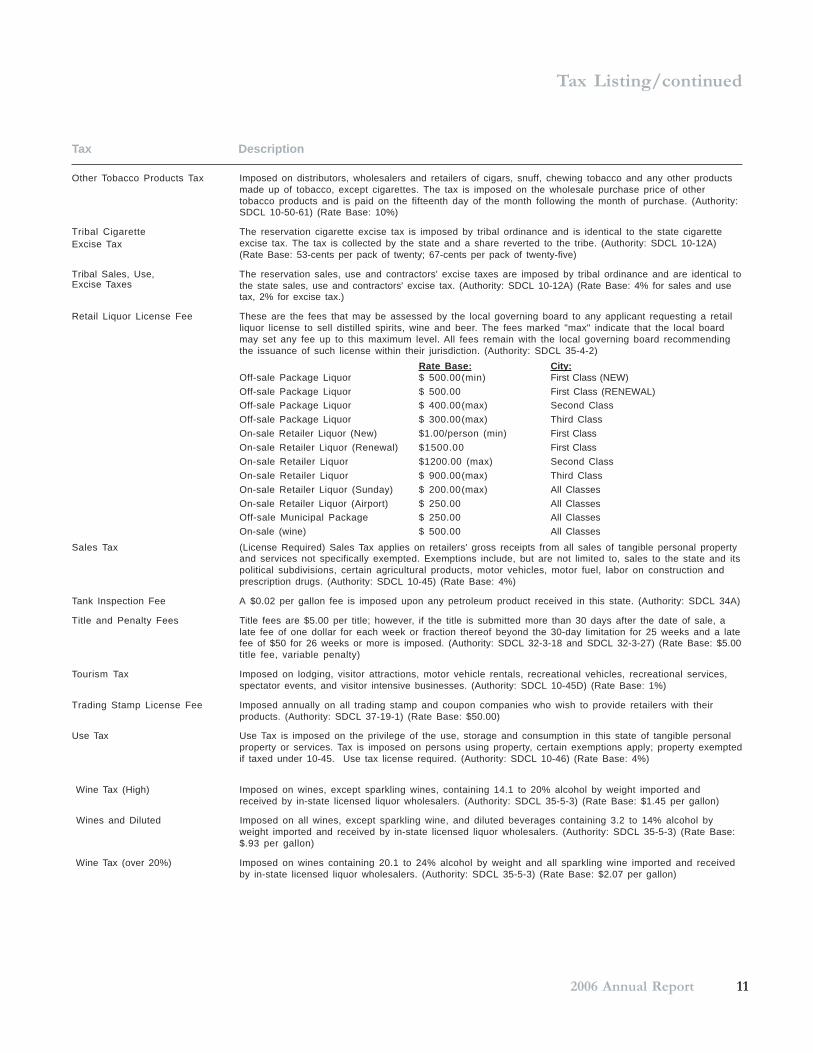
Tax Listing/continued
Excise Tax
Excise Taxes
Tax Description
Other Tobacco Products Tax Imposed on distributors, wholesalers and retailers of cigars, snuff, chewing tobacco and any other productsmade up of tobacco, except cigarettes. The tax is imposed on the wholesale purchase price of othertobacco products and is paid on the fifteenth day of the month following the month of purchase. (Authority:SDCL 10-50-61) (Rate Base: 10%)
Tribal Cigarette The reservation cigarette excise tax is imposed by tribal ordinance and is identical to the state cigaretteexcise tax. The tax is collected by the state and a share reverted to the tribe. (Authority: SDCL 10-12A)(Rate Base: 53-cents per pack of twenty; 67-cents per pack of twenty-five)
Tribal Sales, Use, The reservation sales, use and contractors' excise taxes are imposed by tribal ordinance and are identical tothe state sales, use and contractors' excise tax. (Authority: SDCL 10-12A) (Rate Base: 4% for sales and usetax, 2% for excise tax.)
Retail Liquor License Fee These are the fees that may be assessed by the local governing board to any applicant requesting a retailliquor license to sell distilled spirits, wine and beer. The fees marked "max" indicate that the local boardmay set any fee up to this maximum level. All fees remain with the local governing board recommendingthe issuance of such license within their jurisdiction. (Authority: SDCL 35-4-2)
Rate Base: City:Off-sale Package Liquor $ 500.00(min) First Class (NEW)Off-sale Package Liquor $ 500.00 First Class (RENEWAL)Off-sale Package Liquor $ 400.00(max) Second ClassOff-sale Package Liquor $ 300.00(max) Third ClassOn-sale Retailer Liquor (New) $1.00/person (min) First ClassOn-sale Retailer Liquor (Renewal) $1500.00 First ClassOn-sale Retailer Liquor $1200.00 (max) Second ClassOn-sale Retailer Liquor $ 900.00(max) Third ClassOn-sale Retailer Liquor (Sunday) $ 200.00(max) All ClassesOn-sale Retailer Liquor (Airport) $ 250.00 All ClassesOff-sale Municipal Package $ 250.00 All ClassesOn-sale (wine) $ 500.00 All Classes
Sales Tax (License Required) Sales Tax applies on retailers' gross receipts from all sales of tangible personal propertyand services not specifically exempted. Exemptions include, but are not limited to, sales to the state and itspolitical subdivisions, certain agricultural products, motor vehicles, motor fuel, labor on construction andprescription drugs. (Authority: SDCL 10-45) (Rate Base: 4%)
Tank Inspection Fee A $0.02 per gallon fee is imposed upon any petroleum product received in this state. (Authority: SDCL 34A)
Title and Penalty Fees Title fees are $5.00 per title; however, if the title is submitted more than 30 days after the date of sale, alate fee of one dollar for each week or fraction thereof beyond the 30-day limitation for 25 weeks and a latefee of $50 for 26 weeks or more is imposed. (Authority: SDCL 32-3-18 and SDCL 32-3-27) (Rate Base: $5.00title fee, variable penalty)
Tourism Tax Imposed on lodging, visitor attractions, motor vehicle rentals, recreational vehicles, recreational services,spectator events, and visitor intensive businesses. (Authority: SDCL 10-45D) (Rate Base: 1%)
Trading Stamp License Fee Imposed annually on all trading stamp and coupon companies who wish to provide retailers with theirproducts. (Authority: SDCL 37-19-1) (Rate Base: $50.00)
Use Tax Use Tax is imposed on the privilege of the use, storage and consumption in this state of tangible personalproperty or services. Tax is imposed on persons using property, certain exemptions apply; property exemptedif taxed under 10-45. Use tax license required. (Authority: SDCL 10-46) (Rate Base: 4%)
Wine Tax (High) Imposed on wines, except sparkling wines, containing 14.1 to 20% alcohol by weight imported andreceived by in-state licensed liquor wholesalers. (Authority: SDCL 35-5-3) (Rate Base: $1.45 per gallon)
Wines and Diluted Imposed on all wines, except sparkling wine, and diluted beverages containing 3.2 to 14% alcohol byweight imported and received by in-state licensed liquor wholesalers. (Authority: SDCL 35-5-3) (Rate Base:$.93 per gallon)
Wine Tax (over 20%) Imposed on wines containing 20.1 to 24% alcohol by weight and all sparkling wine imported and receivedby in-state licensed liquor wholesalers. (Authority: SDCL 35-5-3) (Rate Base: $2.07 per gallon)
12 South Dakota Department of Revenue and Regulation
Total State Revenues: Sales, Use and Contractors’ Excise Taxes
The Business Tax Division administers the sales tax, use tax, municipal tax, and contractors’excise tax, as well as the Tribal compact agreement the State has with Indian tribes. The divisionissues licenses to new taxpayers, educates current taxpayers, performs reviews of businesses,handles compliance for licensed and unlicensed businesses, and collects delinquent taxes.It is also the responsibility of the division to administer the construction refund programs. Theseprograms allow businesses to seek a refund of sales, use and contractors’ excise tax or delaypayment of sales and use tax on such projects as large wind farms, new and expandedagricultural facilities, and power facilities.
Total Revenues
Sales, use and contractors’ excise taxes produce the largest portion of the state’s tax revenues,accounting for 71% of the total revenues in fiscal year 2006. These revenues come from over69,000 businesses that currently pay sales, use and contractors’ excise taxes on their productsand services. In fiscal year 2006, sales, use and contractors’ excise taxes in South Dakotatotaled $906,842,968. This included state, city, and taxes collected pursuant to tax collectionagreements with Indian tribes. Following is a ten-year comparison of total state revenues fromthese taxes as well as a percentage breakdown of sales, use and contractors’ excise taxrevenues.
Sales, Use and Contractors’ Excise TaxesBusiness Tax Division - Jan Talley, Director
Fiscal Year Total State Revenues Percent of Change1997 407,559,211 7.04%1998 438,348,560 7.55%1999 455,353,445 3.88%2000 482,182,120 5.89%2001 508,759,868 5.51%2002 517,325,658 1.68%2003 538,895,652 4.17%2004 574,063,634 6.53%2005 607,436,346 5.81%2006 660,042,811 8.66%
Of the $906,842,968 collected, 59% came from the state sales tax; 26% from city sales, useand excise taxes; 8% from state contractors’ excise tax; 6% from state use taxes; and 1% fromtaxes collected pursuant to a tax collection agreement with an Indian tribe.
132006 Annual Report
Sales Tax/continued
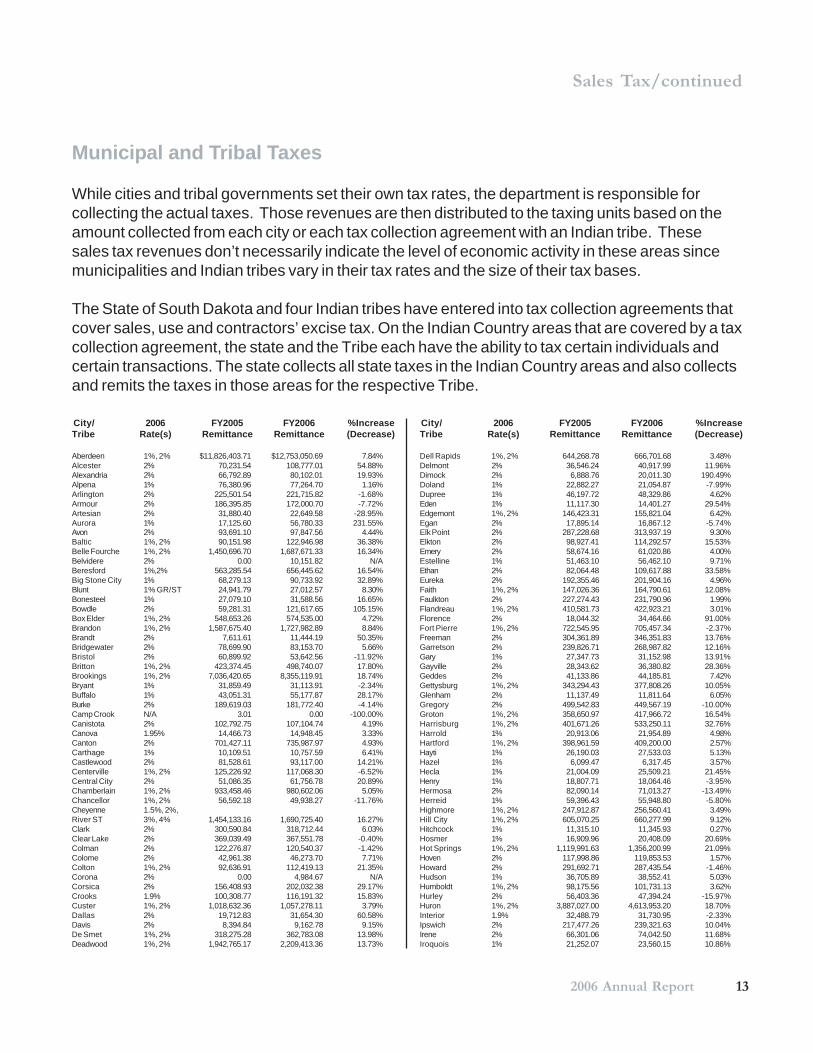
Municipal and Tribal Taxes
While cities and tribal governments set their own tax rates, the department is responsible forcollecting the actual taxes. Those revenues are then distributed to the taxing units based on theamount collected from each city or each tax collection agreement with an Indian tribe. Thesesales tax revenues don’t necessarily indicate the level of economic activity in these areas sincemunicipalities and Indian tribes vary in their tax rates and the size of their tax bases.
The State of South Dakota and four Indian tribes have entered into tax collection agreements thatcover sales, use and contractors’ excise tax. On the Indian Country areas that are covered by a taxcollection agreement, the state and the Tribe each have the ability to tax certain individuals andcertain transactions. The state collects all state taxes in the Indian Country areas and also collectsand remits the taxes in those areas for the respective Tribe.
City/ 2006 FY2005 FY2006 %IncreaseTribe Rate(s) Remittance Remittance (Decrease)
Aberdeen 1%, 2% $11,826,403.71 $12,753,050.69 7.84%Alcester 2% 70,231.54 108,777.01 54.88%Alexandria 2% 66,792.89 80,102.01 19.93%Alpena 1% 76,380.96 77,264.70 1.16%Arlington 2% 225,501.54 221,715.82 -1.68%Armour 2% 186,395.85 172,000.70 -7.72%Artesian 2% 31,880.40 22,649.58 -28.95%Aurora 1% 17,125.60 56,780.33 231.55%Avon 2% 93,691.10 97,847.56 4.44%Baltic 1%, 2% 90,151.98 122,946.98 36.38%Belle Fourche 1%, 2% 1,450,696.70 1,687,671.33 16.34%Belvidere 2% 0.00 10,151.82 N/ABeresford 1%,2% 563,285.54 656,445.62 16.54%Big Stone City 1% 68,279.13 90,733.92 32.89%Blunt 1% GR/ST 24,941.79 27,012.57 8.30%Bonesteel 1% 27,079.10 31,588.56 16.65%Bowdle 2% 59,281.31 121,617.65 105.15%Box Elder 1%, 2% 548,653.26 574,535.00 4.72%Brandon 1%, 2% 1,587,675.40 1,727,982.89 8.84%Brandt 2% 7,611.61 11,444.19 50.35%Bridgewater 2% 78,699.90 83,153.70 5.66%Bristol 2% 60,899.92 53,642.56 -11.92%Britton 1%, 2% 423,374.45 498,740.07 17.80%Brookings 1%, 2% 7,036,420.65 8,355,119.91 18.74%Bryant 1% 31,859.49 31,113.91 -2.34%Buffalo 1% 43,051.31 55,177.87 28.17%Burke 2% 189,619.03 181,772.40 -4.14%Camp Crook N/A 3.01 0.00 -100.00%Canistota 2% 102,792.75 107,104.74 4.19%Canova 1.95% 14,466.73 14,948.45 3.33%Canton 2% 701,427.11 735,987.97 4.93%Carthage 1% 10,109.51 10,757.59 6.41%Castlewood 2% 81,528.61 93,117.00 14.21%Centerville 1%, 2% 125,226.92 117,068.30 -6.52%Central City 2% 51,086.35 61,756.78 20.89%Chamberlain 1%, 2% 933,458.46 980,602.06 5.05%Chancellor 1%, 2% 56,592.18 49,938.27 -11.76%Cheyenne 1.5%, 2%,River ST 3%, 4% 1,454,133.16 1,690,725.40 16.27%Clark 2% 300,590.84 318,712.44 6.03%Clear Lake 2% 369,039.49 367,551.78 -0.40%Colman 2% 122,276.87 120,540.37 -1.42%Colome 2% 42,961.38 46,273.70 7.71%Colton 1%, 2% 92,636.91 112,419.13 21.35%Corona 2% 0.00 4,984.67 N/ACorsica 2% 156,408.93 202,032.38 29.17%Crooks 1.9% 100,308.77 116,191.32 15.83%Custer 1%, 2% 1,018,632.36 1,057,278.11 3.79%Dallas 2% 19,712.83 31,654.30 60.58%Davis 2% 8,394.84 9,162.78 9.15%De Smet 1%, 2% 318,275.28 362,783.08 13.98%Deadwood 1%, 2% 1,942,765.17 2,209,413.36 13.73%
City/ 2006 FY2005 FY2006 %IncreaseTribe Rate(s) Remittance Remittance (Decrease)
Dell Rapids 1%, 2% 644,268.78 666,701.68 3.48%Delmont 2% 36,546.24 40,917.99 11.96%Dimock 2% 6,888.76 20,011.30 190.49%Doland 1% 22,882.27 21,054.87 -7.99%Dupree 1% 46,197.72 48,329.86 4.62%Eden 1% 11,117.30 14,401.27 29.54%Edgemont 1%, 2% 146,423.31 155,821.04 6.42%Egan 2% 17,895.14 16,867.12 -5.74%Elk Point 2% 287,228.68 313,937.19 9.30%Elkton 2% 98,927.41 114,292.57 15.53%Emery 2% 58,674.16 61,020.86 4.00%Estelline 1% 51,463.10 56,462.10 9.71%Ethan 2% 82,064.48 109,617.88 33.58%Eureka 2% 192,355.46 201,904.16 4.96%Faith 1%, 2% 147,026.36 164,790.61 12.08%Faulkton 2% 227,274.43 231,790.96 1.99%Flandreau 1%, 2% 410,581.73 422,923.21 3.01%Florence 2% 18,044.32 34,464.66 91.00%Fort Pierre 1%, 2% 722,545.95 705,457.34 -2.37%Freeman 2% 304,361.89 346,351.83 13.76%Garretson 2% 239,826.71 268,987.82 12.16%Gary 1% 27,347.73 31,152.98 13.91%Gayville 2% 28,343.62 36,380.82 28.36%Geddes 2% 41,133.86 44,185.81 7.42%Gettysburg 1%, 2% 343,294.43 377,808.26 10.05%Glenham 2% 11,137.49 11,811.64 6.05%Gregory 2% 499,542.83 449,567.19 -10.00%Groton 1%, 2% 358,650.97 417,966.72 16.54%Harrisburg 1%, 2% 401,671.26 533,250.11 32.76%Harrold 1% 20,913.06 21,954.89 4.98%Hartford 1%, 2% 398,961.59 409,200.00 2.57%Hayti 1% 26,190.03 27,533.03 5.13%Hazel 1% 6,099.47 6,317.45 3.57%Hecla 1% 21,004.09 25,509.21 21.45%Henry 1% 18,807.71 18,064.46 -3.95%Hermosa 2% 82,090.14 71,013.27 -13.49%Herreid 1% 59,396.43 55,948.80 -5.80%Highmore 1%, 2% 247,912.87 256,560.41 3.49%Hill City 1%, 2% 605,070.25 660,277.99 9.12%Hitchcock 1% 11,315.10 11,345.93 0.27%Hosmer 1% 16,909.96 20,408.09 20.69%Hot Springs 1%, 2% 1,119,991.63 1,356,200.99 21.09%Hoven 2% 117,998.86 119,853.53 1.57%Howard 2% 291,692.71 287,435.54 -1.46%Hudson 1% 36,705.89 38,552.41 5.03%Humboldt 1%, 2% 98,175.56 101,731.13 3.62%Hurley 2% 56,403.36 47,394.24 -15.97%Huron 1%, 2% 3,887,027.00 4,613,953.20 18.70%Interior 1.9% 32,488.79 31,730.95 -2.33%Ipswich 2% 217,477.26 239,321.63 10.04%Irene 2% 66,301.06 74,042.50 11.68%Iroquois 1% 21,252.07 23,560.15 10.86%
14 South Dakota Department of Revenue and Regulation
Sales Tax/continued
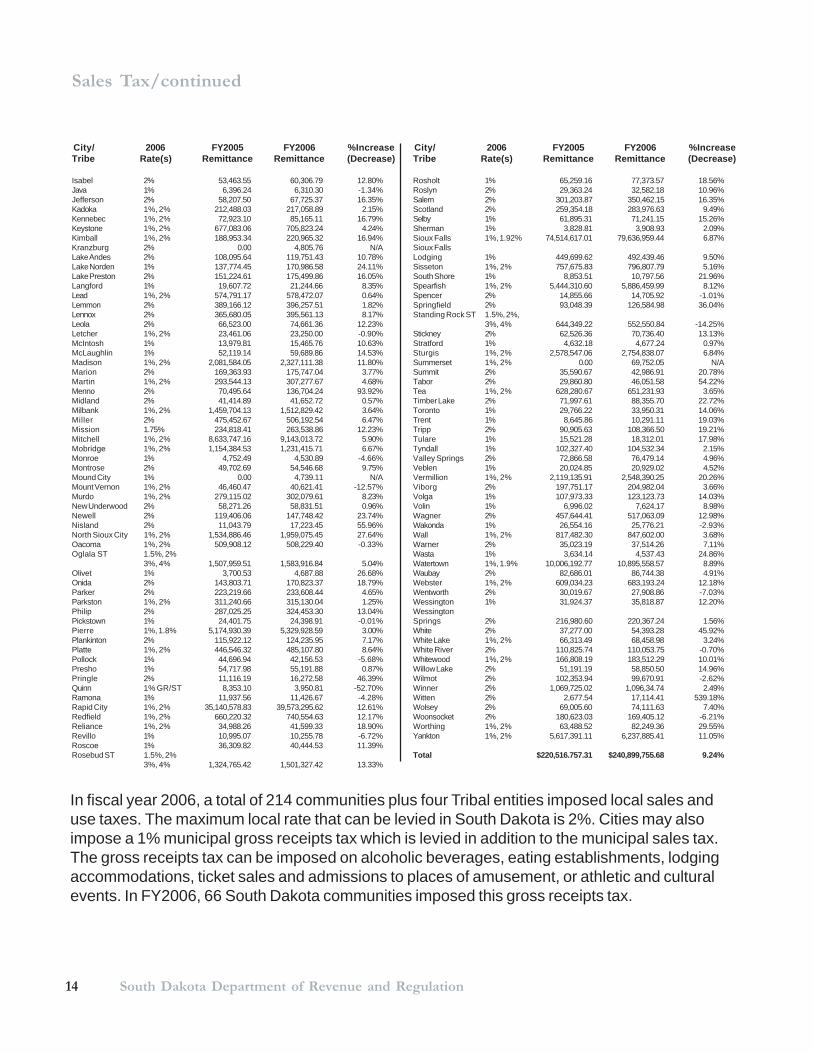
City/ 2006 FY2005 FY2006 %IncreaseTribe Rate(s) Remittance Remittance (Decrease)
Isabel 2% 53,463.55 60,306.79 12.80%Java 1% 6,396.24 6,310.30 -1.34%Jefferson 2% 58,207.50 67,725.37 16.35%Kadoka 1%, 2% 212,488.03 217,058.89 2.15%Kennebec 1%, 2% 72,923.10 85,165.11 16.79%Keystone 1%, 2% 677,083.06 705,823.24 4.24%Kimball 1%, 2% 188,953.34 220,965.32 16.94%Kranzburg 2% 0.00 4,805.76 N/ALake Andes 2% 108,095.64 119,751.43 10.78%Lake Norden 1% 137,774.45 170,986.58 24.11%Lake Preston 2% 151,224.61 175,499.86 16.05%Langford 1% 19,607.72 21,244.66 8.35%Lead 1%, 2% 574,791.17 578,472.07 0.64%Lemmon 2% 389,166.12 396,257.51 1.82%Lennox 2% 365,680.05 395,561.13 8.17%Leola 2% 66,523.00 74,661.36 12.23%Letcher 1%, 2% 23,461.06 23,250.00 -0.90%McIntosh 1% 13,979.81 15,465.76 10.63%McLaughlin 1% 52,119.14 59,689.86 14.53%Madison 1%, 2% 2,081,584.05 2,327,111.38 11.80%Marion 2% 169,363.93 175,747.04 3.77%Martin 1%, 2% 293,544.13 307,277.67 4.68%Menno 2% 70,495.64 136,704.24 93.92%Midland 2% 41,414.89 41,652.72 0.57%Milbank 1%, 2% 1,459,704.13 1,512,829.42 3.64%Miller 2% 475,452.67 506,192.54 6.47%Mission 1.75% 234,818.41 263,538.86 12.23%Mitchell 1%, 2% 8,633,747.16 9,143,013.72 5.90%Mobridge 1%, 2% 1,154,384.53 1,231,415.71 6.67%Monroe 1% 4,752.49 4,530.89 -4.66%Montrose 2% 49,702.69 54,546.68 9.75%Mound City 1% 0.00 4,739.11 N/AMount Vernon 1%, 2% 46,460.47 40,621.41 -12.57%Murdo 1%, 2% 279,115.02 302,079.61 8.23%New Underwood 2% 58,271.26 58,831.51 0.96%Newell 2% 119,406.06 147,748.42 23.74%Nisland 2% 11,043.79 17,223.45 55.96%North Sioux City 1%, 2% 1,534,886.46 1,959,075.45 27.64%Oacoma 1%, 2% 509,908.12 508,229.40 -0.33%Oglala ST 1.5%, 2%
3%, 4% 1,507,959.51 1,583,916.84 5.04%Olivet 1% 3,700.53 4,687.88 26.68%Onida 2% 143,803.71 170,823.37 18.79%Parker 2% 223,219.66 233,608.44 4.65%Parkston 1%, 2% 311,240.66 315,130.04 1.25%Philip 2% 287,025.25 324,453.30 13.04%Pickstown 1% 24,401.75 24,398.91 -0.01%Pierre 1%, 1.8% 5,174,930.39 5,329,928.59 3.00%Plankinton 2% 115,922.12 124,235.95 7.17%Platte 1%, 2% 446,546.32 485,107.80 8.64%Pollock 1% 44,696.94 42,156.53 -5.68%Presho 1% 54,717.98 55,191.88 0.87%Pringle 2% 11,116.19 16,272.58 46.39%Quinn 1% GR/ST 8,353.10 3,950.81 -52.70%Ramona 1% 11,937.56 11,426.67 -4.28%Rapid City 1%, 2% 35,140,578.83 39,573,295.62 12.61%Redfield 1%, 2% 660,220.32 740,554.63 12.17%Reliance 1%, 2% 34,988.26 41,599.33 18.90%Revillo 1% 10,995.07 10,255.78 -6.72%Roscoe 1% 36,309.82 40,444.53 11.39%Rosebud ST 1.5%, 2%
3%, 4% 1,324,765.42 1,501,327.42 13.33%
City/ 2006 FY2005 FY2006 %IncreaseTribe Rate(s) Remittance Remittance (Decrease)
Rosholt 1% 65,259.16 77,373.57 18.56%Roslyn 2% 29,363.24 32,582.18 10.96%Salem 2% 301,203.87 350,462.15 16.35%Scotland 2% 259,354.18 283,976.63 9.49%Selby 1% 61,895.31 71,241.15 15.26%Sherman 1% 3,828.81 3,908.93 2.09%Sioux Falls 1%, 1.92% 74,514,617.01 79,636,959.44 6.87%Sioux FallsLodging 1% 449,699.62 492,439.46 9.50%Sisseton 1%, 2% 757,675.83 796,807.79 5.16%South Shore 1% 8,853.51 10,797.56 21.96%Spearfish 1%, 2% 5,444,310.60 5,886,459.99 8.12%Spencer 2% 14,855.66 14,705.92 -1.01%Springfield 2% 93,048.39 126,584.98 36.04%Standing Rock ST 1.5%, 2%,
3%, 4% 644,349.22 552,550.84 -14.25%Stickney 2% 62,526.36 70,736.40 13.13%Stratford 1% 4,632.18 4,677.24 0.97%Sturgis 1%, 2% 2,578,547.06 2,754,838.07 6.84%Summerset 1%, 2% 0.00 69,752.05 N/ASummit 2% 35,590.67 42,986.91 20.78%Tabor 2% 29,860.80 46,051.58 54.22%Tea 1%, 2% 628,280.67 651,231.93 3.65%Timber Lake 2% 71,997.61 88,355.70 22.72%Toronto 1% 29,766.22 33,950.31 14.06%Trent 1% 8,645.86 10,291.11 19.03%Tripp 2% 90,905.63 108,366.50 19.21%Tulare 1% 15,521.28 18,312.01 17.98%Tyndall 1% 102,327.40 104,532.34 2.15%Valley Springs 2% 72,866.58 76,479.14 4.96%Veblen 1% 20,024.85 20,929.02 4.52%Vermillion 1%, 2% 2,119,135.91 2,548,390.25 20.26%Viborg 2% 197,751.17 204,982.04 3.66%Volga 1% 107,973.33 123,123.73 14.03%Volin 1% 6,996.02 7,624.17 8.98%Wagner 2% 457,644.41 517,063.09 12.98%Wakonda 1% 26,554.16 25,776.21 -2.93%Wall 1%, 2% 817,482.30 847,602.00 3.68%Warner 2% 35,023.19 37,514.26 7.11%Wasta 1% 3,634.14 4,537.43 24.86%Watertown 1%, 1.9% 10,006,192.77 10,895,558.57 8.89%Waubay 2% 82,686.01 86,744.38 4.91%Webster 1%, 2% 609,034.23 683,193.24 12.18%Wentworth 2% 30,019.67 27,908.86 -7.03%Wessington 1% 31,924.37 35,818.87 12.20%WessingtonSprings 2% 216,980.60 220,367.24 1.56%White 2% 37,277.00 54,393.28 45.92%White Lake 1%, 2% 66,313.49 68,458.98 3.24%White River 2% 110,825.74 110,053.75 -0.70%Whitewood 1%, 2% 166,808.19 183,512.29 10.01%Willow Lake 2% 51,191.19 58,850.50 14.96%Wilmot 2% 102,353.94 99,670.91 -2.62%Winner 2% 1,069,725.02 1,096,34.74 2.49%Witten 2% 2,677.54 17,114.41 539.18%Wolsey 2% 69,005.60 74,111.63 7.40%Woonsocket 2% 180,623.03 169,405.12 -6.21%Worthing 1%, 2% 63,488.52 82,249.36 29.55%Yankton 1%, 2% 5,617,391.11 6,237,885.41 11.05%
Total $220,516.757.31 $240,899,755.68 9.24%
In fiscal year 2006, a total of 214 communities plus four Tribal entities imposed local sales anduse taxes. The maximum local rate that can be levied in South Dakota is 2%. Cities may alsoimpose a 1% municipal gross receipts tax which is levied in addition to the municipal sales tax.The gross receipts tax can be imposed on alcoholic beverages, eating establishments, lodgingaccommodations, ticket sales and admissions to places of amusement, or athletic and culturalevents. In FY2006, 66 South Dakota communities imposed this gross receipts tax.
152006 Annual Report
Sales Tax/continued
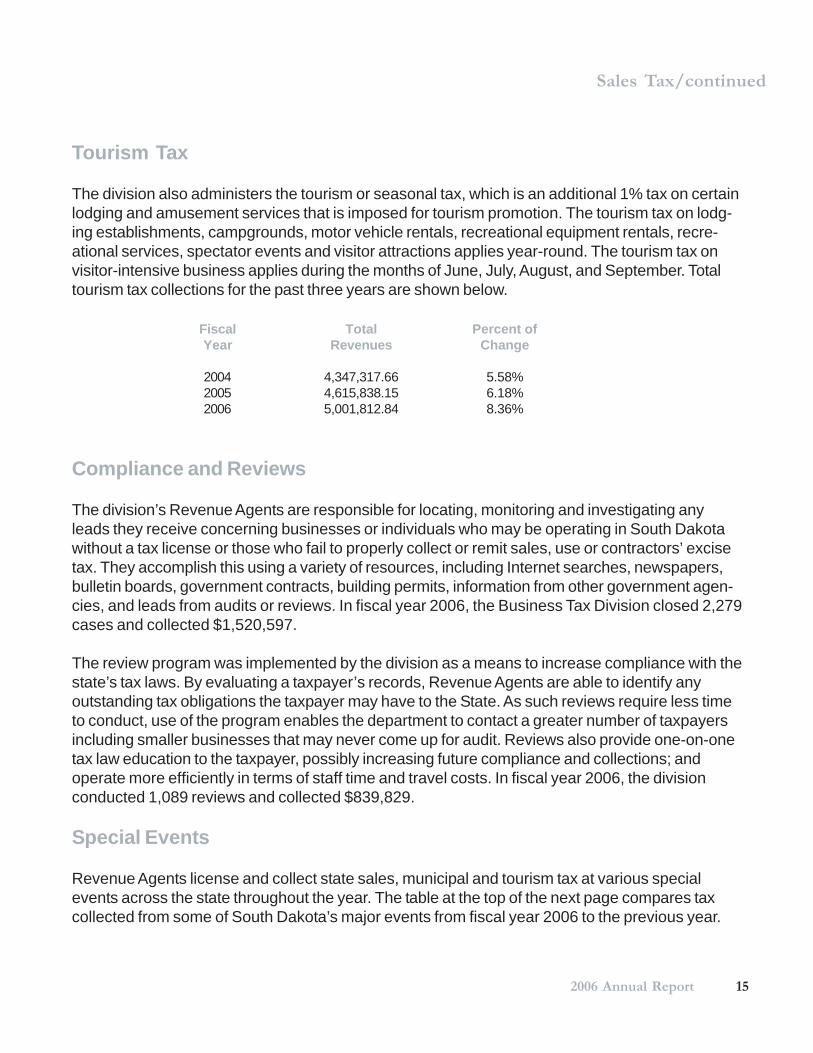
Fiscal Total Percent ofYear Revenues Change
2004 4,347,317.66 5.58%2005 4,615,838.15 6.18%2006 5,001,812.84 8.36%
Tourism Tax
The division also administers the tourism or seasonal tax, which is an additional 1% tax on certainlodging and amusement services that is imposed for tourism promotion. The tourism tax on lodg-ing establishments, campgrounds, motor vehicle rentals, recreational equipment rentals, recre-ational services, spectator events and visitor attractions applies year-round. The tourism tax onvisitor-intensive business applies during the months of June, July, August, and September. Totaltourism tax collections for the past three years are shown below.
Compliance and Reviews
The division’s Revenue Agents are responsible for locating, monitoring and investigating anyleads they receive concerning businesses or individuals who may be operating in South Dakotawithout a tax license or those who fail to properly collect or remit sales, use or contractors’ excisetax. They accomplish this using a variety of resources, including Internet searches, newspapers,bulletin boards, government contracts, building permits, information from other government agen-cies, and leads from audits or reviews. In fiscal year 2006, the Business Tax Division closed 2,279cases and collected $1,520,597.
The review program was implemented by the division as a means to increase compliance with thestate’s tax laws. By evaluating a taxpayer’s records, Revenue Agents are able to identify anyoutstanding tax obligations the taxpayer may have to the State. As such reviews require less timeto conduct, use of the program enables the department to contact a greater number of taxpayersincluding smaller businesses that may never come up for audit. Reviews also provide one-on-onetax law education to the taxpayer, possibly increasing future compliance and collections; andoperate more efficiently in terms of staff time and travel costs. In fiscal year 2006, the divisionconducted 1,089 reviews and collected $839,829.
Special Events
Revenue Agents license and collect state sales, municipal and tourism tax at various specialevents across the state throughout the year. The table at the top of the next page compares taxcollected from some of South Dakota’s major events from fiscal year 2006 to the previous year.
16 South Dakota Department of Revenue and Regulation
Sales Tax/continued
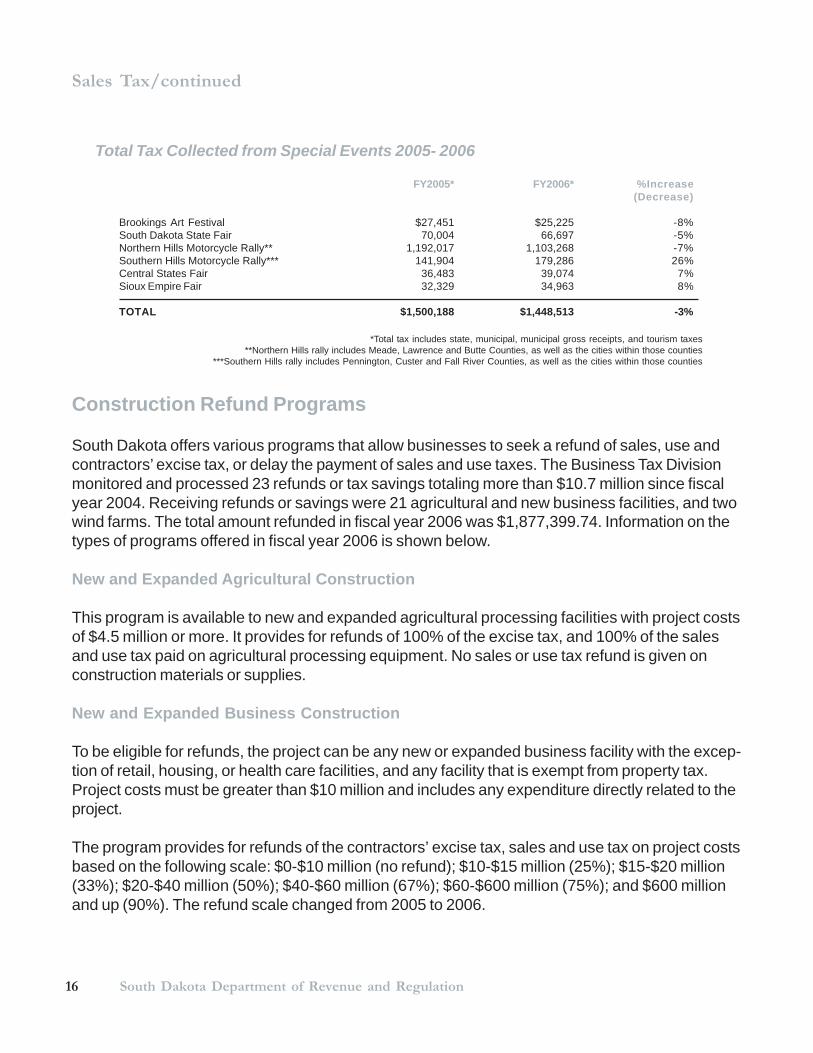
Total Tax Collected from Special Events 2005- 2006
FY2005* FY2006* %Increase(Decrease)
Brookings Art Festival $27,451 $25,225 -8%South Dakota State Fair 70,004 66,697 -5%Northern Hills Motorcycle Rally** 1,192,017 1,103,268 -7%Southern Hills Motorcycle Rally*** 141,904 179,286 26%Central States Fair 36,483 39,074 7%Sioux Empire Fair 32,329 34,963 8%
TOTAL $1,500,188 $1,448,513 -3%
*Total tax includes state, municipal, municipal gross receipts, and tourism taxes**Northern Hills rally includes Meade, Lawrence and Butte Counties, as well as the cities within those counties
***Southern Hills rally includes Pennington, Custer and Fall River Counties, as well as the cities within those counties
Construction Refund Programs
South Dakota offers various programs that allow businesses to seek a refund of sales, use andcontractors’ excise tax, or delay the payment of sales and use taxes. The Business Tax Divisionmonitored and processed 23 refunds or tax savings totaling more than $10.7 million since fiscalyear 2004. Receiving refunds or savings were 21 agricultural and new business facilities, and twowind farms. The total amount refunded in fiscal year 2006 was $1,877,399.74. Information on thetypes of programs offered in fiscal year 2006 is shown below.
New and Expanded Agricultural Construction
This program is available to new and expanded agricultural processing facilities with project costsof $4.5 million or more. It provides for refunds of 100% of the excise tax, and 100% of the salesand use tax paid on agricultural processing equipment. No sales or use tax refund is given onconstruction materials or supplies.
New and Expanded Business Construction
To be eligible for refunds, the project can be any new or expanded business facility with the excep-tion of retail, housing, or health care facilities, and any facility that is exempt from property tax.Project costs must be greater than $10 million and includes any expenditure directly related to theproject.
The program provides for refunds of the contractors’ excise tax, sales and use tax on project costsbased on the following scale: $0-$10 million (no refund); $10-$15 million (25%); $15-$20 million(33%); $20-$40 million (50%); $40-$60 million (67%); $60-$600 million (75%); and $600 millionand up (90%). The refund scale changed from 2005 to 2006.
172006 Annual Report
Sales Tax/continued
Large Wind Farms
New and expanded wind generation facilities producing more than 10 megawatts of electricityqualify for this program. Such projects receive a tax rate reduction with project owners pay 1%excise tax instead of 2%. The owner must pay the tax in four equal installments. No exemption orrefund is given for sales or use tax.
Small Wind Farms
This program is available for new and expanded wind generation facilities that produce 10 mega-watts of electricty or less and have project costs greater than $500,000. It provides for refunds of100% of the excise tax. No exemption or refund is given for sales or use tax.
Streamlined Sales Tax Project
The Streamlined Sales Tax Project is a multi-state effort to design, test and implement a system toradically simplify sales and use tax collection and administration by retailers and states. SouthDakota has been involved in the project since its inception, and is one of its full member states.Full members are those states whose sales tax law and policies are in substantial compliancewith each of the provisions of the Streamlined Sales Tax Agreement (SSTA).
The SSTA was officially implemented on Oct. 1, 2005, and effective that date, retailers canregister to collect or pay sales taxes in the Agreement’s member states through a Web-basedcentralized registration system. Since such registration began, the Business Tax Division hasissued 668 tax licenses.
18 South Dakota Department of Revenue and Regulation
Division Overview
The Division of Special Taxes has three main functions: 1) administering taxes on tobacco, alcohol,banks, estates, minerals, and several small industries; 2) regulating the tobacco and alcoholindustries; and 3) administering the state’s sales and property tax refund program for the elderly anddisabled. Within the last 10 years, revenues from the division have ranged from a high of $112.6million in 1999 to $97.1 million in 2002, the year after voters repealed the inheritance tax. In fiscalyear 2006, revenues in this division showed an increase of $11,343,799 from 2005 with totalcollections of $109,202,262.
Alcohol and Tobacco Regulation
Alcohol Regulation
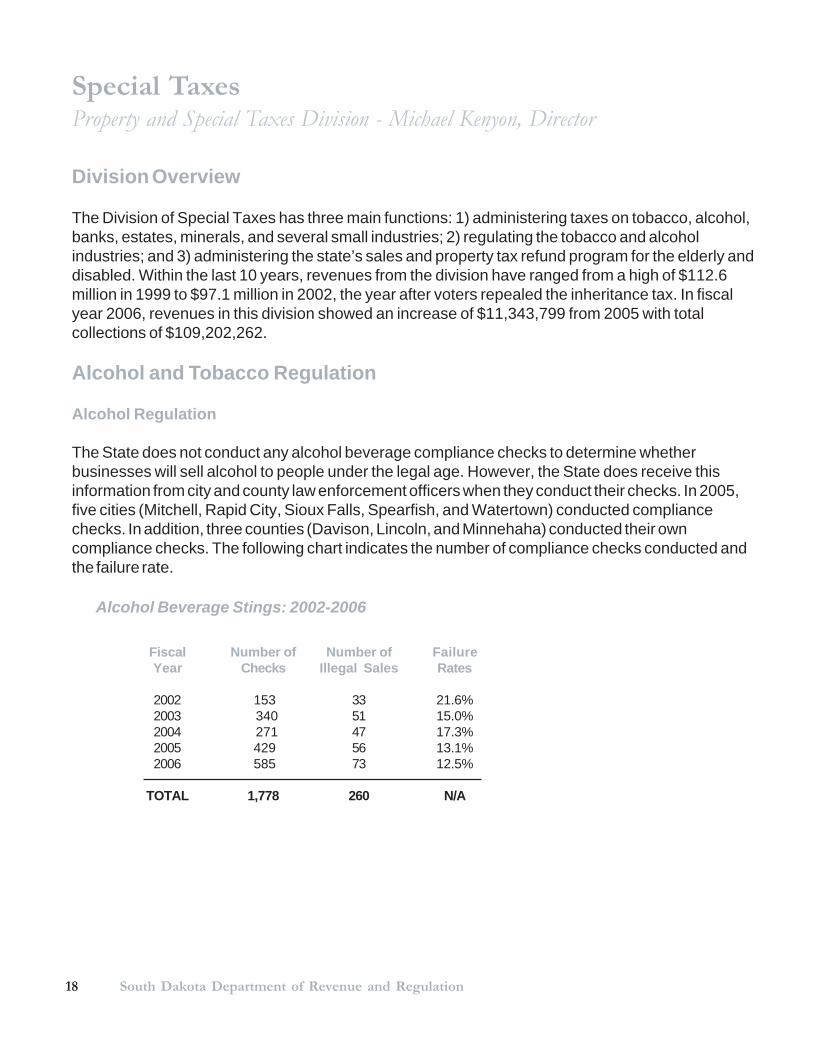
The State does not conduct any alcohol beverage compliance checks to determine whetherbusinesses will sell alcohol to people under the legal age. However, the State does receive thisinformation from city and county law enforcement officers when they conduct their checks. In 2005,five cities (Mitchell, Rapid City, Sioux Falls, Spearfish, and Watertown) conducted compliancechecks. In addition, three counties (Davison, Lincoln, and Minnehaha) conducted their owncompliance checks. The following chart indicates the number of compliance checks conducted andthe failure rate.
Special TaxesProperty and Special Taxes Division - Michael Kenyon, Director
Alcohol Beverage Stings: 2002-2006
Fiscal Number of Number of FailureYear Checks Illegal Sales Rates
2002 153 33 21.6%2003 340 51 15.0%2004 271 47 17.3%2005 429 56 13.1%2006 585 73 12.5%
TOTAL 1,778 260 N/A
192006 Annual Report
Special Taxes/continued
Tobacco Regulation
Federal law requires anyone shipping cigarettes into South Dakota without South Dakota’s taxstamp to notify the Department of Revenue and Regulation. In fiscal year 2006, the departmentmade 325 assessments totaling more than $50,000 against South Dakotans who purchaseduntaxed cigarettes. Over 70% of the assessments have been collected, with nearly $6,000 ofpayments made through an amnesty program.
In addition to assessing consumers of untaxed cigarettes, the department has audited 25 tobaccowholesalers and distributors, and 365 tobacco retailers. These audits ensure the proper amountof tax is being paid, and that only legal cigarettes are sold within the state.
Relief Programs
Seven programs are available to provide sales tax or property tax relief to eligible SouthDakotans. The Special Taxes Division administers the sales and property tax refund program forlow income senior and disabled South Dakotans. The Department of Social Services administersSouth Dakota’s sales tax on food refund program. The remaining five programs are administeredby the counties. Details on some of these programs are shown below.
The sales and property tax refund program provides a cash refund to elderly and disabledSouth Dakotans. In fiscal year 2006, 3,251 elderly and disabled individuals and householdsreceived refunds totaling $556,520. Refund amounts ranged from $46 up to $581.
The assessment freeze for the elderly and disabled program reduces the assessed value ofthe owner’s property for tax purposes. Almost 3,900 South Dakotans received the benefit of thisprogram in 2006. The average benefit was a reduction of over $23,350 to the assessed value ofthe elderly or disabled person’s home.
The paraplegic and paraplegic veterans programs provide a partial or complete exemptionof property taxes. For paraplegics, the benefit ranges from a 25% to 100% reduction of theirproperty taxes, depending on their income. Paraplegic veterans receive a 100% exemption fortheir home, regardless of income. In 2006, 93 veterans received exemptions totaling$10,358,910.
The property tax homestead exemption delays the payment of property taxes. The taxesbecome a lien upon the property and must be repaid, with interest, when the property is sold. Themunicipal property tax reduction program is a voluntary program for cities; currently, only RapidCity participates in the program. The division does not collect statistics for either of theseprograms.
20 South Dakota Department of Revenue and Regulation
Property TaxesProperty and Special Taxes Division - Michael Kenyon, Director
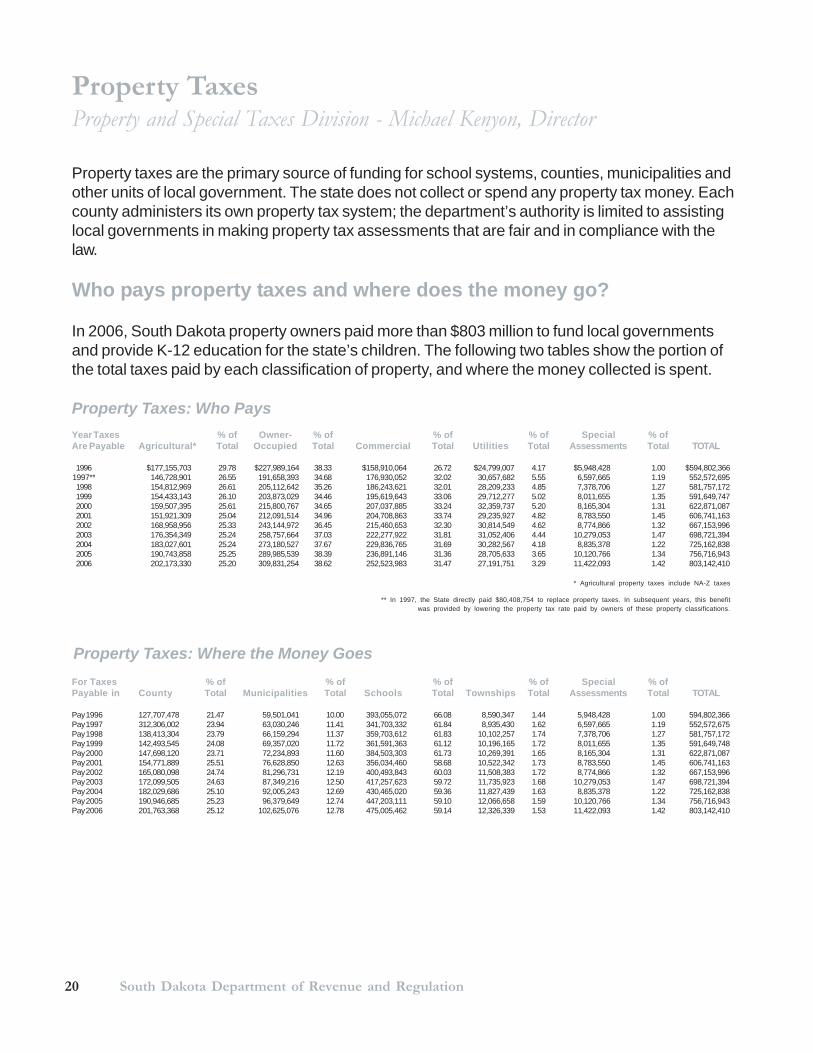
Property taxes are the primary source of funding for school systems, counties, municipalities andother units of local government. The state does not collect or spend any property tax money. Eachcounty administers its own property tax system; the department’s authority is limited to assistinglocal governments in making property tax assessments that are fair and in compliance with thelaw.
Who pays property taxes and where does the money go?
In 2006, South Dakota property owners paid more than $803 million to fund local governmentsand provide K-12 education for the state’s children. The following two tables show the portion ofthe total taxes paid by each classification of property, and where the money collected is spent.
Property Taxes: Who PaysYear Taxes % of Owner- % of % of % of Special % ofAre Payable Agricultural* Total Occupied Total Commercial Total Utilities Total Assessments Total TOTAL
1996 $177,155,703 29.78 $227,989,164 38.33 $158,910,064 26.72 $24,799,007 4.17 $5,948,428 1.00 $594,802,3661997** 146,728,901 26.55 191,658,393 34.68 176,930,052 32.02 30,657,682 5.55 6,597,665 1.19 552,572,6951998 154,812,969 26.61 205,112,642 35.26 186,243,621 32.01 28,209,233 4.85 7,378,706 1.27 581,757,1721999 154,433,143 26.10 203,873,029 34.46 195,619,643 33.06 29,712,277 5.02 8,011,655 1.35 591,649,7472000 159,507,395 25.61 215,800,767 34.65 207,037,885 33.24 32,359,737 5.20 8,165,304 1.31 622,871,0872001 151,921,309 25.04 212,091,514 34.96 204,708,863 33.74 29,235,927 4.82 8,783,550 1.45 606,741,1632002 168,958,956 25.33 243,144,972 36.45 215,460,653 32.30 30,814,549 4.62 8,774,866 1.32 667,153,9962003 176,354,349 25.24 258,757,664 37.03 222,277,922 31.81 31,052,406 4.44 10,279,053 1.47 698,721,3942004 183,027,601 25.24 273,180,527 37.67 229,836,765 31.69 30,282,567 4.18 8,835,378 1.22 725,162,8382005 190,743,858 25.25 289,985,539 38.39 236,891,146 31.36 28,705,633 3.65 10,120,766 1.34 756,716,9432006 202,173,330 25.20 309,831,254 38.62 252,523,983 31.47 27,191,751 3.29 11,422,093 1.42 803,142,410
* Agricultural property taxes include NA-Z taxes
** In 1997, the State directly paid $80,408,754 to replace property taxes. In subsequent years, this benefitwas provided by lowering the property tax rate paid by owners of these property classifications.
Property Taxes: Where the Money GoesFor Taxes % of % of % of % of Special % ofPayable in County Total Municipalities Total Schools Total Townships Total Assessments Total TOTAL
Pay 1996 127,707,478 21.47 59,501,041 10.00 393,055,072 66.08 8,590,347 1.44 5,948,428 1.00 594,802,366Pay 1997 312,306,002 23.94 63,030,246 11.41 341,703,332 61.84 8,935,430 1.62 6,597,665 1.19 552,572,675Pay 1998 138,413,304 23.79 66,159,294 11.37 359,703,612 61.83 10,102,257 1.74 7,378,706 1.27 581,757,172Pay 1999 142,493,545 24.08 69,357,020 11.72 361,591,363 61.12 10,196,165 1.72 8,011,655 1.35 591,649,748Pay 2000 147,698,120 23.71 72,234,893 11.60 384,503,303 61.73 10,269,391 1.65 8,165,304 1.31 622,871,087Pay 2001 154,771,889 25.51 76,628,850 12.63 356,034,460 58.68 10,522,342 1.73 8,783,550 1.45 606,741,163Pay 2002 165,080,098 24.74 81,296,731 12.19 400,493,843 60.03 11,508,383 1.72 8,774,866 1.32 667,153,996Pay 2003 172,099,505 24.63 87,349,216 12.50 417,257,623 59.72 11,735,923 1.68 10,279,053 1.47 698,721,394Pay 2004 182,029,686 25.10 92,005,243 12.69 430,465,020 59.36 11,827,439 1.63 8,835,378 1.22 725,162,838Pay 2005 190,946,685 25.23 96,379,649 12.74 447,203,111 59.10 12,066,658 1.59 10,120,766 1.34 756,716,943Pay 2006 201,763,368 25.12 102,625,076 12.78 475,005,462 59.14 12,326,339 1.53 11,422,093 1.42 803,142,410
212006 Annual Report
Property Taxes/continued
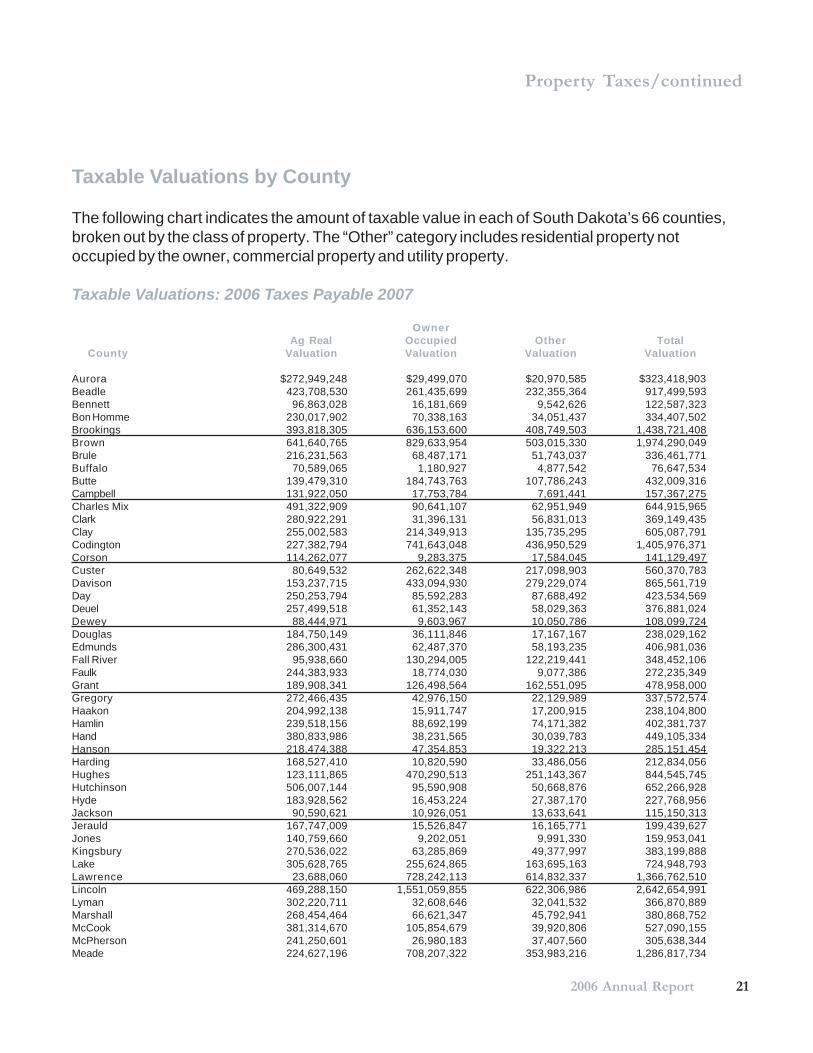
Taxable Valuations by County
The following chart indicates the amount of taxable value in each of South Dakota’s 66 counties,broken out by the class of property. The “Other” category includes residential property notoccupied by the owner, commercial property and utility property.
Taxable Valuations: 2006 Taxes Payable 2007
OwnerAg Real Occupied Other Total
County Valuation Valuation Valuation Valuation
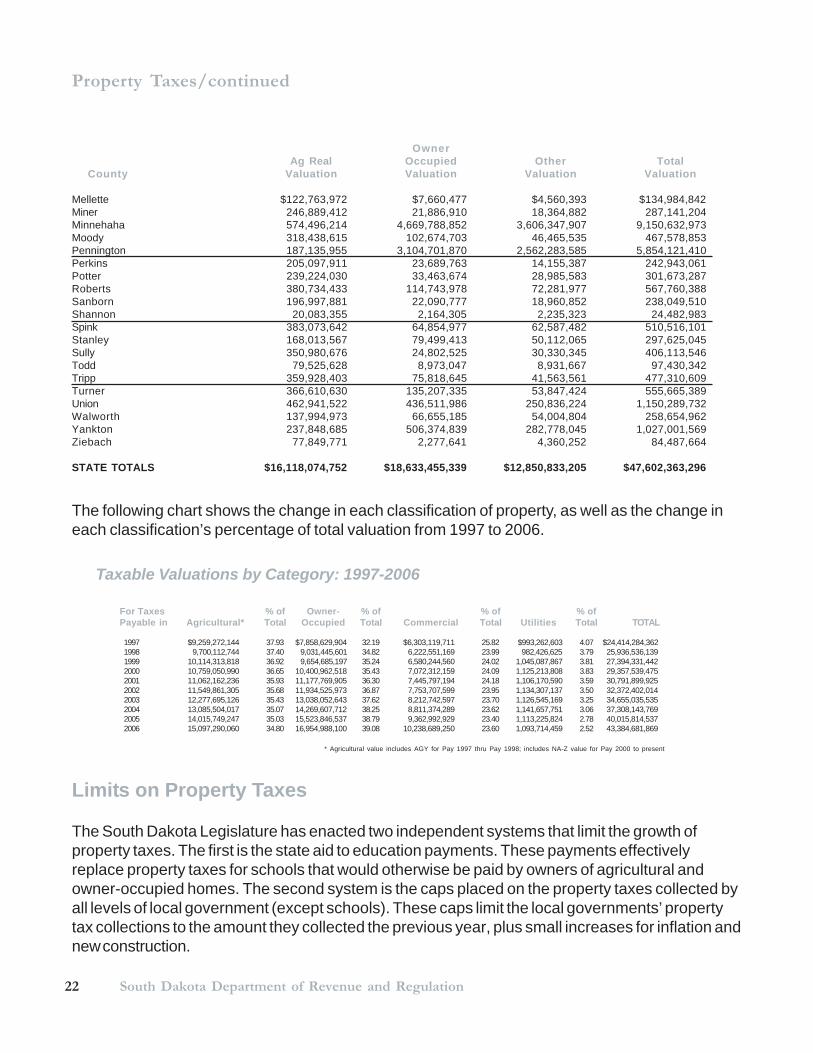
Aurora $272,949,248 $29,499,070 $20,970,585 $323,418,903Beadle 423,708,530 261,435,699 232,355,364 917,499,593Bennett 96,863,028 16,181,669 9,542,626 122,587,323Bon Homme 230,017,902 70,338,163 34,051,437 334,407,502Brookings 393,818,305 636,153,600 408,749,503 1,438,721,408Brown 641,640,765 829,633,954 503,015,330 1,974,290,049Brule 216,231,563 68,487,171 51,743,037 336,461,771Buffalo 70,589,065 1,180,927 4,877,542 76,647,534Butte 139,479,310 184,743,763 107,786,243 432,009,316Campbell 131,922,050 17,753,784 7,691,441 157,367,275Charles Mix 491,322,909 90,641,107 62,951,949 644,915,965Clark 280,922,291 31,396,131 56,831,013 369,149,435Clay 255,002,583 214,349,913 135,735,295 605,087,791Codington 227,382,794 741,643,048 436,950,529 1,405,976,371Corson 114,262,077 9,283,375 17,584,045 141,129,497Custer 80,649,532 262,622,348 217,098,903 560,370,783Davison 153,237,715 433,094,930 279,229,074 865,561,719Day 250,253,794 85,592,283 87,688,492 423,534,569Deuel 257,499,518 61,352,143 58,029,363 376,881,024Dewey 88,444,971 9,603,967 10,050,786 108,099,724Douglas 184,750,149 36,111,846 17,167,167 238,029,162Edmunds 286,300,431 62,487,370 58,193,235 406,981,036Fall River 95,938,660 130,294,005 122,219,441 348,452,106Faulk 244,383,933 18,774,030 9,077,386 272,235,349Grant 189,908,341 126,498,564 162,551,095 478,958,000Gregory 272,466,435 42,976,150 22,129,989 337,572,574Haakon 204,992,138 15,911,747 17,200,915 238,104,800Hamlin 239,518,156 88,692,199 74,171,382 402,381,737Hand 380,833,986 38,231,565 30,039,783 449,105,334Hanson 218,474,388 47,354,853 19,322,213 285,151,454Harding 168,527,410 10,820,590 33,486,056 212,834,056Hughes 123,111,865 470,290,513 251,143,367 844,545,745Hutchinson 506,007,144 95,590,908 50,668,876 652,266,928Hyde 183,928,562 16,453,224 27,387,170 227,768,956Jackson 90,590,621 10,926,051 13,633,641 115,150,313Jerauld 167,747,009 15,526,847 16,165,771 199,439,627Jones 140,759,660 9,202,051 9,991,330 159,953,041Kingsbury 270,536,022 63,285,869 49,377,997 383,199,888Lake 305,628,765 255,624,865 163,695,163 724,948,793Lawrence 23,688,060 728,242,113 614,832,337 1,366,762,510Lincoln 469,288,150 1,551,059,855 622,306,986 2,642,654,991Lyman 302,220,711 32,608,646 32,041,532 366,870,889Marshall 268,454,464 66,621,347 45,792,941 380,868,752McCook 381,314,670 105,854,679 39,920,806 527,090,155McPherson 241,250,601 26,980,183 37,407,560 305,638,344Meade 224,627,196 708,207,322 353,983,216 1,286,817,734
22 South Dakota Department of Revenue and Regulation
Property Taxes/continued
OwnerAg Real Occupied Other Total
County Valuation Valuation Valuation Valuation
Mellette $122,763,972 $7,660,477 $4,560,393 $134,984,842Miner 246,889,412 21,886,910 18,364,882 287,141,204Minnehaha 574,496,214 4,669,788,852 3,606,347,907 9,150,632,973Moody 318,438,615 102,674,703 46,465,535 467,578,853Pennington 187,135,955 3,104,701,870 2,562,283,585 5,854,121,410Perkins 205,097,911 23,689,763 14,155,387 242,943,061Potter 239,224,030 33,463,674 28,985,583 301,673,287Roberts 380,734,433 114,743,978 72,281,977 567,760,388Sanborn 196,997,881 22,090,777 18,960,852 238,049,510Shannon 20,083,355 2,164,305 2,235,323 24,482,983Spink 383,073,642 64,854,977 62,587,482 510,516,101Stanley 168,013,567 79,499,413 50,112,065 297,625,045Sully 350,980,676 24,802,525 30,330,345 406,113,546Todd 79,525,628 8,973,047 8,931,667 97,430,342Tripp 359,928,403 75,818,645 41,563,561 477,310,609Turner 366,610,630 135,207,335 53,847,424 555,665,389Union 462,941,522 436,511,986 250,836,224 1,150,289,732Walworth 137,994,973 66,655,185 54,004,804 258,654,962Yankton 237,848,685 506,374,839 282,778,045 1,027,001,569Ziebach 77,849,771 2,277,641 4,360,252 84,487,664
STATE TOTALS $16,118,074,752 $18,633,455,339 $12,850,833,205 $47,602,363,296
Taxable Valuations by Category: 1997-2006
For Taxes % of Owner- % of % of % ofPayable in Agricultural* Total Occupied Total Commercial Total Utilities Total TOTAL
1997 $9,259,272,144 37.93 $7,858,629,904 32.19 $6,303,119,711 25.82 $993,262,603 4.07 $24,414,284,3621998 9,700,112,744 37.40 9,031,445,601 34.82 6,222,551,169 23.99 982,426,625 3.79 25,936,536,1391999 10,114,313,818 36.92 9,654,685,197 35.24 6,580,244,560 24.02 1,045,087,867 3.81 27,394,331,4422000 10,759,050,990 36.65 10,400,962,518 35.43 7,072,312,159 24.09 1,125,213,808 3.83 29,357,539,4752001 11,062,162,236 35.93 11,177,769,905 36.30 7,445,797,194 24.18 1,106,170,590 3.59 30,791,899,9252002 11,549,861,305 35.68 11,934,525,973 36.87 7,753,707,599 23.95 1,134,307,137 3.50 32,372,402,0142003 12,277,695,126 35.43 13,038,052,643 37.62 8,212,742,597 23.70 1,126,545,169 3.25 34,655,035,5352004 13,085,504,017 35.07 14,269,607,712 38.25 8,811,374,289 23.62 1,141,657,751 3.06 37,308,143,7692005 14,015,749,247 35.03 15,523,846,537 38.79 9,362,992,929 23.40 1,113,225,824 2.78 40,015,814,5372006 15,097,290,060 34.80 16,954,988,100 39.08 10,238,689,250 23.60 1,093,714,459 2.52 43,384,681,869
Limits on Property Taxes
The South Dakota Legislature has enacted two independent systems that limit the growth ofproperty taxes. The first is the state aid to education payments. These payments effectivelyreplace property taxes for schools that would otherwise be paid by owners of agricultural andowner-occupied homes. The second system is the caps placed on the property taxes collected byall levels of local government (except schools). These caps limit the local governments’ propertytax collections to the amount they collected the previous year, plus small increases for inflation andnew construction.
* Agricultural value includes AGY for Pay 1997 thru Pay 1998; includes NA-Z value for Pay 2000 to present
The following chart shows the change in each classification of property, as well as the change ineach classification’s percentage of total valuation from 1997 to 2006.
232006 Annual Report
Property Taxes/continued
State Aid to Education Payments
Agricultural and owner-occupied property owners benefit from the funding for education providedby the state. The state provides an extra $120 million for K-12 education that would otherwisehave to be paid by these property owners. The benefit is provided to the taxpayer through a taxrate reduction for the school general fund levy. The school general fund levy rates for taxespayable in 2007 are set statewide as follows:
Ag $3.03/$1,000 of valueOwner-Occupied $4.76/$1,000 of valueOther $10.19/$1,000 of value
Property Tax Caps
State law limits the amount of property taxes that local governments (counties, cities, townships,fire districts, etc.) can collect from their property owners. Market increases in the value of theproperty within the taxing district automatically decrease the property tax rates upon that propertyto ensure that the caps are not exceeded. Local governments are limited to the amount of propertytaxes they collected last year, plus an increase for inflation based upon the consumer price index(but not more than 3%) and for new construction within the taxing jurisdiction.
An example will illustrate how the property tax caps work. Assume that last year, the total propertyvaluation within a city was $100 million and the city collected $300,000 from property taxes. Tocollect the $300,000, the city assessed property within the city a tax of $3.00/$1,000 of assessedvalue. This year, the consumer price index is 2%, a new subdivision was created within the citywith a total valuation of $1 million, and a hot real estate market increased the value of the existingproperty within the city to $109 million. The city can increase the $300,000 it received from prop-erty taxes last year by 3% (2% for CPI and 1% for the new construction) for a total of $309,000. Toprevent the city from going over the cap, the tax rate applied to the $110 million of property withinthe district (market value of $109 million plus the new $1 million subdivision), the tax rate is auto-matically lowered from last year’s rate of $3.00/$1,000 of value to $2.81/$1,000 of value.
Combined Effect of Tax Caps and State Aid Payments
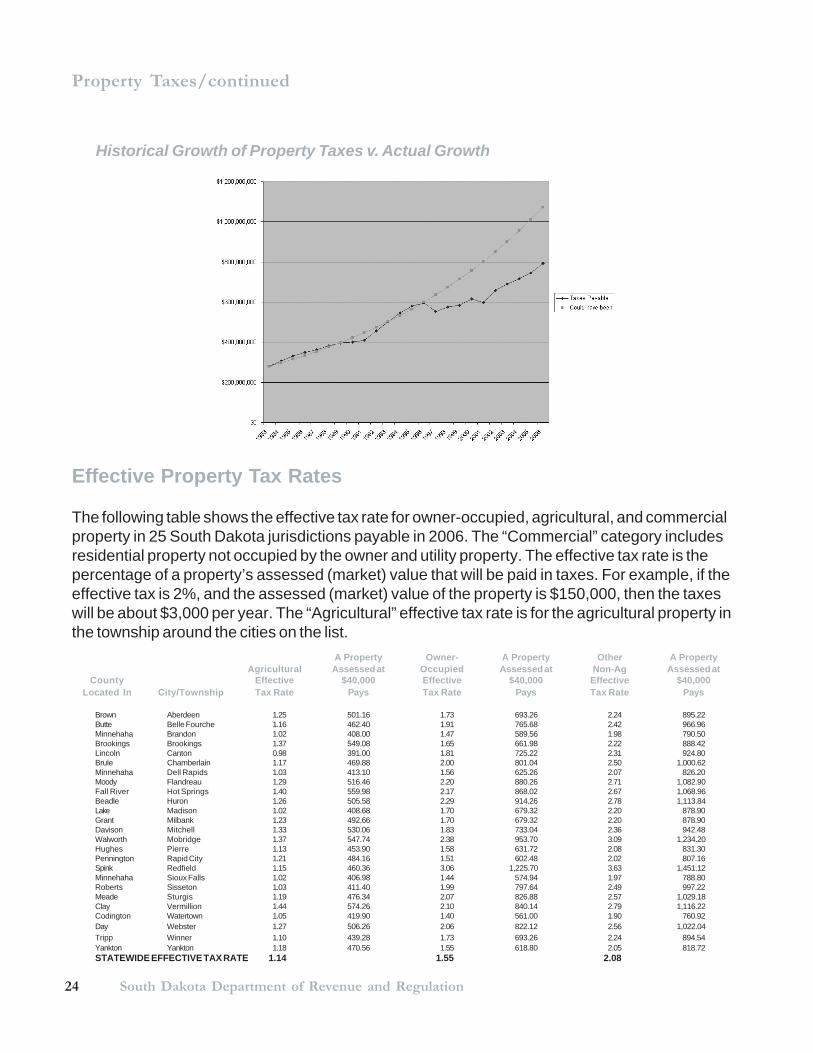
Historically, property taxes have increased at a rate of about 6% per year since 1947. Property taxcaps and state aid to education have significantly slowed this increase. If the historical rate ofproperty tax growth had continued through the 1990’s, current property owners would be payingover $1 billion in property taxes. Instead, property owners are paying a little more than $800million of property taxes. The chart on the top of the next page shows the historical growth ofproperty taxes and the actual growth of property taxes. These programs were implemented in1997.
24 South Dakota Department of Revenue and Regulation
Property Taxes/continued
Historical Growth of Property Taxes v. Actual Growth
Effective Property Tax Rates
The following table shows the effective tax rate for owner-occupied, agricultural, and commercialproperty in 25 South Dakota jurisdictions payable in 2006. The “Commercial” category includesresidential property not occupied by the owner and utility property. The effective tax rate is thepercentage of a property’s assessed (market) value that will be paid in taxes. For example, if theeffective tax is 2%, and the assessed (market) value of the property is $150,000, then the taxeswill be about $3,000 per year. The “Agricultural” effective tax rate is for the agricultural property inthe township around the cities on the list.
A Property Owner- A Property Other A PropertyAgricultural Assessed at Occupied Assessed at Non-Ag Assessed at
County Effective $40,000 Effective $40,000 Effective $40,000Located In City/Township Tax Rate Pays Tax Rate Pays Tax Rate Pays
Brown Aberdeen 1.25 501.16 1.73 693.26 2.24 895.22Butte Belle Fourche 1.16 462.40 1.91 765.68 2.42 966.96Minnehaha Brandon 1.02 408.00 1.47 589.56 1.98 790.50Brookings Brookings 1.37 549.08 1.65 661.98 2.22 888.42Lincoln Canton 0.98 391.00 1.81 725.22 2.31 924.80Brule Chamberlain 1.17 469.88 2.00 801.04 2.50 1,000.62Minnehaha Dell Rapids 1.03 413.10 1.56 625.26 2.07 826.20Moody Flandreau 1.29 516.46 2.20 880.26 2.71 1,082.90Fall River Hot Springs 1.40 559.98 2.17 868.02 2.67 1,068.96Beadle Huron 1.26 505.58 2.29 914.26 2.78 1,113.84Lake Madison 1.02 408.68 1.70 679.32 2.20 878.90Grant Milbank 1.23 492.66 1.70 679.32 2.20 878.90Davison Mitchell 1.33 530.06 1.83 733.04 2.36 942.48Walworth Mobridge 1.37 547.74 2.38 953.70 3.09 1,234.20Hughes Pierre 1.13 453.90 1.58 631.72 2.08 831.30Pennington Rapid City 1.21 484.16 1.51 602.48 2.02 807.16Spink Redfield 1.15 460.36 3.06 1,225.70 3.63 1,451.12Minnehaha Sioux Falls 1.02 406.98 1.44 574.94 1.97 788.80Roberts Sisseton 1.03 411.40 1.99 797.64 2.49 997.22Meade Sturgis 1.19 476.34 2.07 826.88 2.57 1,029.18Clay Vermillion 1.44 574.26 2.10 840.14 2.79 1,116.22Codington Watertown 1.05 419.90 1.40 561.00 1.90 760.92Day Webster 1.27 506.26 2.06 822.12 2.56 1,022.04Tripp Winner 1.10 439.28 1.73 693.26 2.24 894.54Yankton Yankton 1.18 470.56 1.55 618.80 2.05 818.72STATEWIDE EFFECTIVE TAX RATE 1.14 1.55 2.08

252006 Annual Report
Fuel Tax and Motor Vehicle LicensingMotor Vehicles Division - Debra Hillmer, Director
The Division of Motor Vehicles’ responsibilities include motor vehicle excise tax; title and registra-tion; motor fuel tax; special fuel tax; interstate fuel tax; fuel tax refunds; prorate and commerciallicensing; and dealer licensing.
Total Fuel Tax Revenues
Gasoline, ethanol blend, aviation fuel, jet fuel, liquid petroleum gas (LPG), and diesel fuel all fallinto the fuel tax category. In fiscal year 2006, total fuel tax revenues amounted to $141,048,510.Motor fuel (gasoline) and special fuel taxes accounted for 86.5% of the total fuel tax revenues forfiscal year 2006, with 11.1% from tank inspection fees, 1.9% from interstate/IFTA fuel taxes, andthe remaining 0.5% from the aviation fuel tax. The chart below compares South Dakota’s fuel taxrevenues for the past 10 years.
Motor Vehicle Licensing
Commercial registration fees (licensing fees) are levied on intrastate and interstate motor carriersdoing business in the state. The amount of the fee for interstate registration is determined by thepercentage of miles the carrier travels in all the states. Over 98% of the fees are used by localgovernments to maintain public roads. Prorate registration revenues during fiscal year 2006 were$12,919,553. The largest share (57%) was distributed to the local government highway andbridge fund, with 41.5% to the counties, 1% to the license plate fund, and 0.5% to the motorvehicle fund.
26 South Dakota Department of Revenue and Regulation
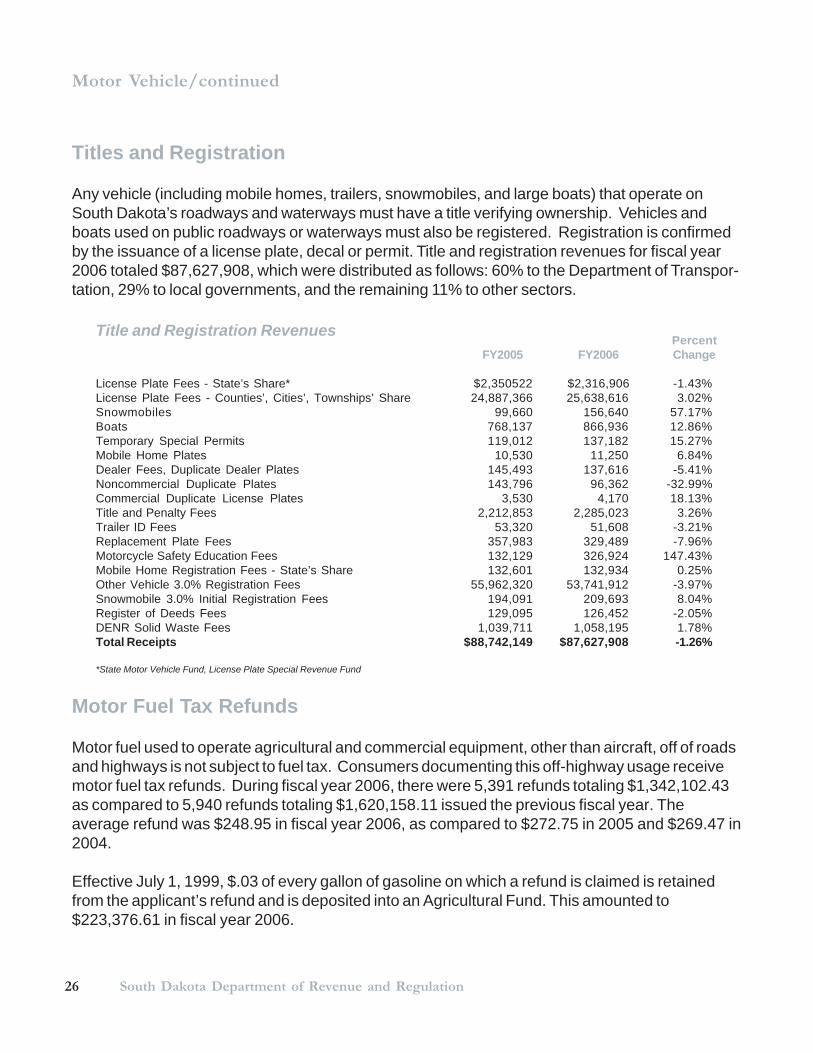
Title and Registration RevenuesPercent
FY2005 FY2006 Change
License Plate Fees - State’s Share* $2,350522 $2,316,906 -1.43%License Plate Fees - Counties’, Cities’, Townships’ Share 24,887,366 25,638,616 3.02%Snowmobiles 99,660 156,640 57.17%Boats 768,137 866,936 12.86%Temporary Special Permits 119,012 137,182 15.27%Mobile Home Plates 10,530 11,250 6.84%Dealer Fees, Duplicate Dealer Plates 145,493 137,616 -5.41%Noncommercial Duplicate Plates 143,796 96,362 -32.99%Commercial Duplicate License Plates 3,530 4,170 18.13%Title and Penalty Fees 2,212,853 2,285,023 3.26%Trailer ID Fees 53,320 51,608 -3.21%Replacement Plate Fees 357,983 329,489 -7.96%Motorcycle Safety Education Fees 132,129 326,924 147.43%Mobile Home Registration Fees - State’s Share 132,601 132,934 0.25%Other Vehicle 3.0% Registration Fees 55,962,320 53,741,912 -3.97%Snowmobile 3.0% Initial Registration Fees 194,091 209,693 8.04%Register of Deeds Fees 129,095 126,452 -2.05%DENR Solid Waste Fees 1,039,711 1,058,195 1.78%Total Receipts $88,742,149 $87,627,908 -1.26%
*State Motor Vehicle Fund, License Plate Special Revenue Fund
Titles and Registration
Any vehicle (including mobile homes, trailers, snowmobiles, and large boats) that operate onSouth Dakota’s roadways and waterways must have a title verifying ownership. Vehicles andboats used on public roadways or waterways must also be registered. Registration is confirmedby the issuance of a license plate, decal or permit. Title and registration revenues for fiscal year2006 totaled $87,627,908, which were distributed as follows: 60% to the Department of Transpor-tation, 29% to local governments, and the remaining 11% to other sectors.
Motor Vehicle/continued
Motor Fuel Tax Refunds
Motor fuel used to operate agricultural and commercial equipment, other than aircraft, off of roadsand highways is not subject to fuel tax. Consumers documenting this off-highway usage receivemotor fuel tax refunds. During fiscal year 2006, there were 5,391 refunds totaling $1,342,102.43as compared to 5,940 refunds totaling $1,620,158.11 issued the previous fiscal year. Theaverage refund was $248.95 in fiscal year 2006, as compared to $272.75 in 2005 and $269.47 in2004.
Effective July 1, 1999, $.03 of every gallon of gasoline on which a refund is claimed is retainedfrom the applicant’s refund and is deposited into an Agricultural Fund. This amounted to$223,376.61 in fiscal year 2006.
272006 Annual Report
.
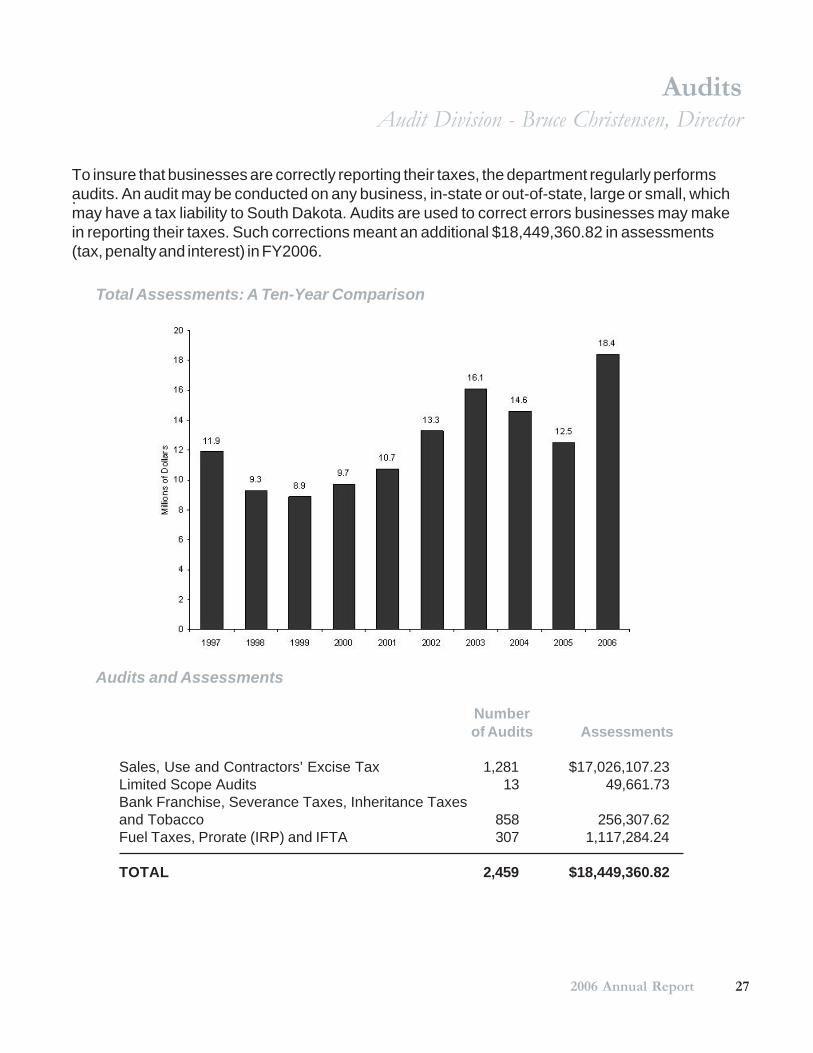
Total Assessments: A Ten-Year Comparison
Audits and Assessments
To insure that businesses are correctly reporting their taxes, the department regularly performsaudits. An audit may be conducted on any business, in-state or out-of-state, large or small, whichmay have a tax liability to South Dakota. Audits are used to correct errors businesses may makein reporting their taxes. Such corrections meant an additional $18,449,360.82 in assessments(tax, penalty and interest) in FY2006.
AuditsAudit Division - Bruce Christensen, Director
Numberof Audits Assessments
Sales, Use and Contractors’ Excise Tax 1,281 $17,026,107.23Limited Scope Audits 13 49,661.73Bank Franchise, Severance Taxes, Inheritance Taxesand Tobacco 858 256,307.62Fuel Taxes, Prorate (IRP) and IFTA 307 1,117,284.24
TOTAL 2,459 $18,449,360.82
28 South Dakota Department of Revenue and Regulation
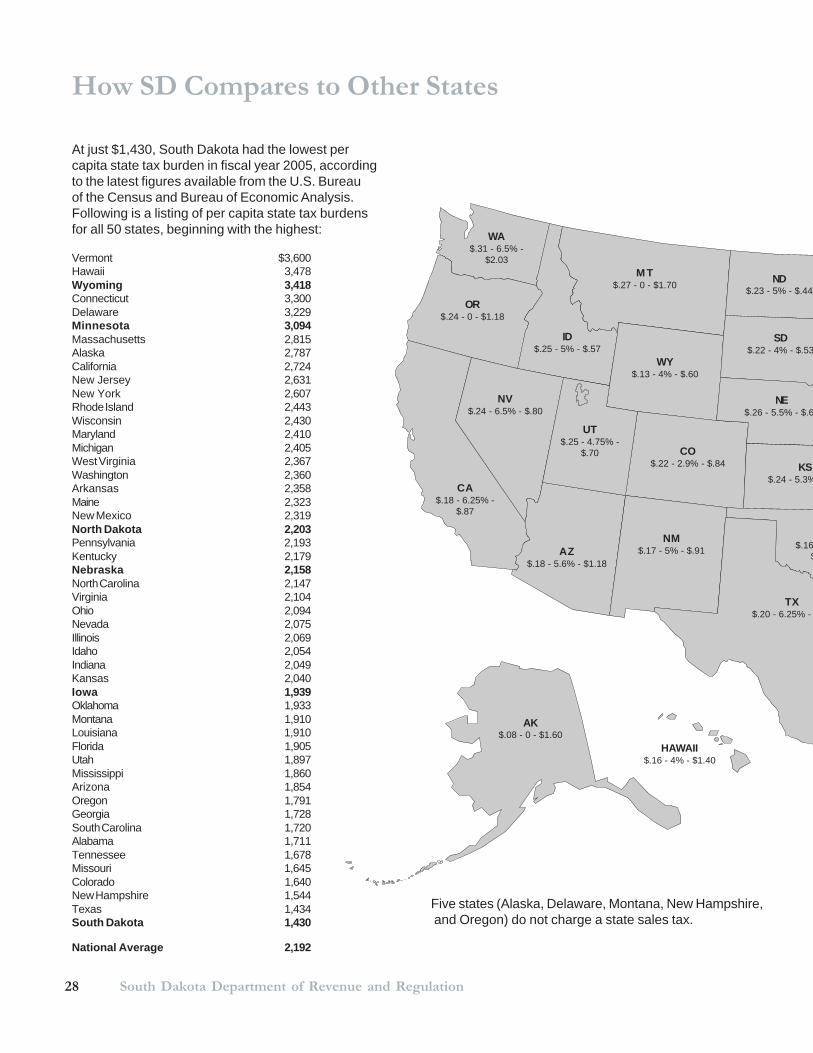
Five states (Alaska, Delaware, Montana, New Hampshire, and Oregon) do not charge a state sales tax.
AK$.08 - 0 - $1.60
HAWAII$.16 - 4% - $1.40
WA$.31 - 6.5% -
$2.03
OR$.24 - 0 - $1.18
CA$.18 - 6.25% -
$.87
NV$.24 - 6.5% - $.80
UT$.25 - 4.75% -
$.70
AZ$.18 - 5.6% - $1.18
NM$.17 - 5% - $.91
TX$.20 - 6.25% -
ID$.25 - 5% - $.57
M T$.27 - 0 - $1.70
WY$.13 - 4% - $.60
CO$.22 - 2.9% - $.84
ND$.23 - 5% - $.44
SD$.22 - 4% - $.53
NE$.26 - 5.5% - $.6
KS$.24 - 5.3%
$.16 $
At just $1,430, South Dakota had the lowest percapita state tax burden in fiscal year 2005, accordingto the latest figures available from the U.S. Bureauof the Census and Bureau of Economic Analysis.Following is a listing of per capita state tax burdensfor all 50 states, beginning with the highest:
Vermont $3,600Hawaii 3,478Wyoming 3,418Connecticut 3,300Delaware 3,229Minnesota 3,094Massachusetts 2,815Alaska 2,787California 2,724New Jersey 2,631New York 2,607Rhode Island 2,443Wisconsin 2,430Maryland 2,410Michigan 2,405West Virginia 2,367Washington 2,360Arkansas 2,358Maine 2,323New Mexico 2,319North Dakota 2,203Pennsylvania 2,193Kentucky 2,179Nebraska 2,158North Carolina 2,147Virginia 2,104Ohio 2,094Nevada 2,075Illinois 2,069Idaho 2,054Indiana 2,049Kansas 2,040Iowa 1,939Oklahoma 1,933Montana 1,910Louisiana 1,910Florida 1,905Utah 1,897Mississippi 1,860Arizona 1,854Oregon 1,791Georgia 1,728South Carolina 1,720Alabama 1,711Tennessee 1,678Missouri 1,645Colorado 1,640New Hampshire 1,544Texas 1,434South Dakota 1,430
National Average 2,192
How SD Compares to Other States
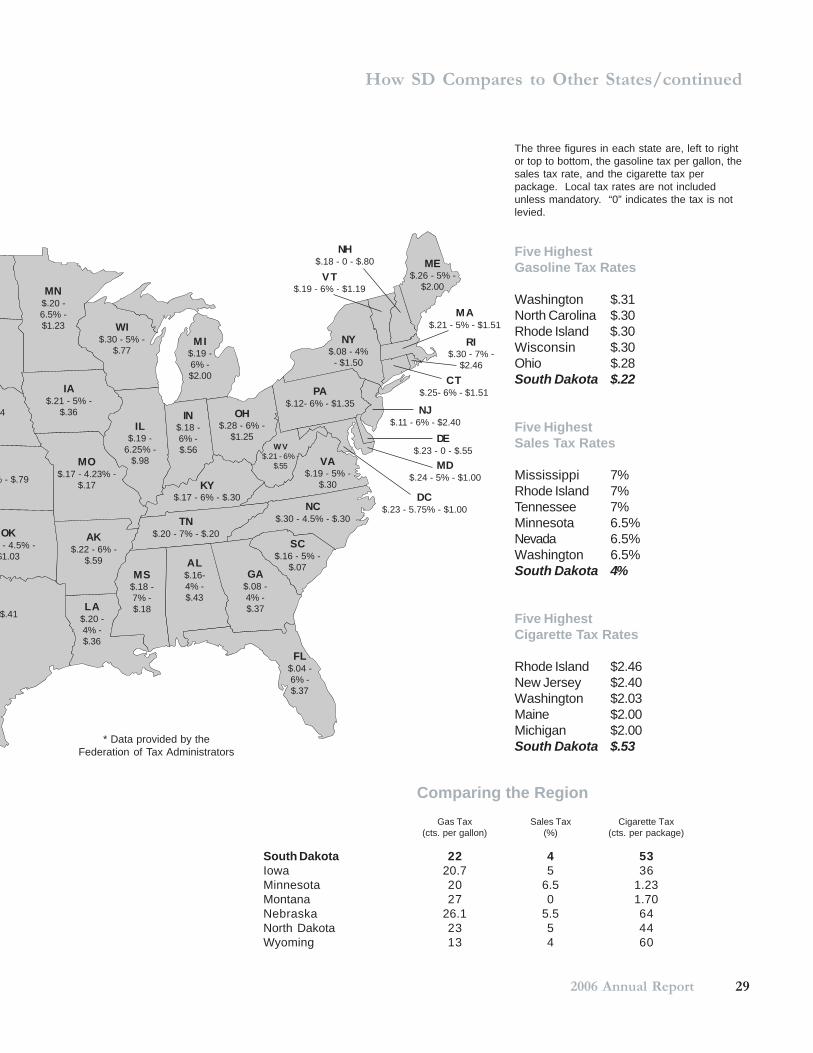
292006 Annual Report
* Data provided by theFederation of Tax Administrators
The three figures in each state are, left to rightor top to bottom, the gasoline tax per gallon, thesales tax rate, and the cigarette tax perpackage. Local tax rates are not includedunless mandatory. “0” indicates the tax is notlevied.
Five HighestGasoline Tax Rates
Washington $.31North Carolina $.30Rhode Island $.30Wisconsin $.30Ohio $.28South Dakota $.22
Five HighestSales Tax Rates
Mississippi 7%Rhode Island 7%Tennessee 7%Minnesota 6.5%Nevada 6.5%Washington 6.5%South Dakota 4%
Five HighestCigarette Tax Rates
Rhode Island $2.46New Jersey $2.40Washington $2.03Maine $2.00Michigan $2.00South Dakota $.53
Comparing the RegionGas Tax Sales Tax Cigarette Tax
(cts. per gallon) (%) (cts. per package)
South Dakota 22 4 53Iowa 20.7 5 36Minnesota 20 6.5 1.23Montana 27 0 1.70Nebraska 26.1 5.5 64North Dakota 23 5 44Wyoming 13 4 60
MN$.20 -6.5% -$1.23
IA$.21 - 5% -
$.36
WI$.30 - 5% -
$.77
MO$.17 - 4.23% -
$.17
AK$.22 - 6% -
$.59
LA$.20 -4% -$.36
MS$.18 -7% -$.18
AL$.16-4% -$.43
GA$.08 -4% -$.37
FL$.04 -6% -$.37
TN$.20 - 7% - $.20
NC$.30 - 4.5% - $.30
KY$.17 - 6% - $.30
PA$.12- 6% - $1.35
NY$.08 - 4%
- $1.50
SC$.16 - 5% -
$.07
VA$.19 - 5% -
$.30
OH$.28 - 6% -
$1.25IL
$.19 -6.25% -
$.98
MI$.19 -6% -$2.00
IN$.18 -6% -$.56 W V
$.21 - 6% -$.55
DC$.23 - 5.75% - $1.00
MD$.24 - 5% - $1.00
DE$.23 - 0 - $.55
VT$.19 - 6% - $1.19
NH$.18 - 0 - $.80
NJ$.11 - 6% - $2.40
CT$.25- 6% - $1.51
RI$.30 - 7% -
$2.46
ME$.26 - 5% -
$2.00
MA$.21 - 5% - $1.51
How SD Compares to Other States/continued
$.41
4
% - $.79
OK- 4.5% -
$1.03
30 South Dakota Department of Revenue and Regulation
Legal ServicesLegal Division - Andrew L. Fergel, Chief Legal Counsel
The Legal Division is comprised of a Chief Legal Counsel, three full-time attorneys, six full-timeSpecial Agents (four dedicated to the Investigative Services Bureau (ISB) and two to theInsurance Fraud Prevention Unit (IFPU)), one full-time Assistant Attorney General, one part-timefraud auditor, and two legal secretaries. In addition to providing routine legal counsel to thedepartment, the legal staff worked on 354 new cases during FY2006. The ISB Special Agentsexamined 131 individuals and businesses, of which 75 were investigated for tax and motorvehicle crimes. The IFPU reviewed or investigated 92 allegations of insurance fraud and referredtwo cases for prosecution. More information on the IFPU can be found in the following pages. TheSupreme Court issued six decisions during the year which affected the department.
Supreme Court Summaries
In the Matter of Steven J. Tinklenberg, 2006 SD 52, 716 NW2d 798. Tinklenberg was aninsurance agent who appealed the Insurance Division’s decision to revoke his license for violationof a repealed statute. The Supreme Court affirmed the department’s decision, holding that 1) asaving statute allowed the Division to seek revocation of license for conduct occurring beforerepeal of the statue, and 2) evidence supported revocation for the agent’s acts of making himselfthe owner and beneficiary of a client’s life insurance policy and giving the insured’s conservatorthe false impression that the insured’s heirs would receive the death benefit.
Meligan v. Dept. of Revenue and Regulation, 2006 SD26, 712 NW2d 12. Meligan, a statecertified general appraiser, appealed the determination of the Department that he made errorsand omissions in an appraisal which constituted violations of the Uniform Standards ofProfessional Appraisal Practice (USPAP) and warranted the 90-day suspension of his appraiserlicense. The Circuit Court reversed the Department’s decision, and the Department appealed.The Supreme Court affirmed in part, reversed in part, and remanded, holding that: 1) theDepartment’s finding that Meligan failed the USPAP by failing to disclose in his appraisal that theproperty had been used as a bed and breakfast was clearly not erroneous; 2) Meligan’s failure todisclose that information was sufficient as a basis for discipline; 3) the Department’s finding thatMeligan failed to disclose that the residence was a 1930’s barn that had been extensivelyremodeled was clearly erroneous; 4) the Department’s finding that Meligan violated the USPAPby failing to disclose that the barn was a three-story structure was clearly not erroneous, but thefinding of inference to mislead was unsupported; 5) the Circuit Court erred when it substituted itsjudgment for that of the Department and held that Meligan’s failure to include intended userprovision in the appraisal, failure to disclose that a comparable was not a sale, listing of aninaccurate address for a comparable, and listing of inaccurate date of sale for anothercomparable did not warrant discipline; 6) the Circuit Court was in error when it set aside acredibility determination that was adverse to the appraiser; 7) sufficient evidence supportedfinding that Meligan failed to include the proper analysis which violated the USPAP; and 8) thelicensing sanction which was based in part on erroneous allegations of the Department, was anabuse of discretion.
312006 Annual Report
Legal Services/continued
Choice Hotels Intern., Inc. v. South Dakota Dept. of Revenue and Regulation, 2006 SD25, 711NW2d 926. Choice Hotels International Inc., a hotel franchisor, sought a review of theDepartment’s decision to issue a certificate of assessment against the company for sales tax ontravel agent commissions collected from franchisees and paid to travel agents, and for unpaidsales tax on fees collected for its customer incentive program. The Supreme Court affirmed inpart, reversed in part, and held that: 1) no sales tax applied to the travel agent commissions, but 2)fees that the franchisor collected from franchisees for its customer incentive program werecollected as part of a service and were subject to sales tax.
Doctor’s Associates, Inc. v. Dept. of Revenue and Regulation, 2006 SD18, 711 NW2d 237.Doctor’s Associates, Inc., a restaurant franchisor, appealed a hearing examiner’s decision thataffirmed the Department’s certificate of assessment concerning a sales tax liability regardingroyalty fees. The Supreme Court affirmed and held that: 1) royalty fees constituted gross receiptsfor the sale of tangible personal property or service and thus were subject to sales tax; 2) thestatute providing that use tax shall be imposed in certain situations on the reasonable value of theservice purchased did not apply; 3) the franchisor was not entitled to a second extension of timeconcerning the submission of further evidence; and 4) for purposes of the statute requiringtaxpayers who are subject to sales tax to keep records of all sales and other pertinent papers anddocuments, a statistical summary was a “pertinent document”, and thus failure to submit thesummary during the audit precluded the admission of the summary.
Dan Nelson Automotive, Inc. v. Viken, 2005 SD109, 706 NW2d 239. Dan Nelson Automotive, acar dealer and financing company, brought declaratory judgment action against the secretary ofthe Department of Revenue and Regulation, seeking a ruling that the excise tax could not belawfully imposed on that portion of the initial price for a vehicle that the dealer did not actuallyreceive when buyers defaulted on installment contracts. The Circuit Court dismissed the case;Dan Nelson Automotive appealed. The Supreme Court reversed and remanded the decision, andheld that: 1) the doctrine of primary jurisdiction did not preclude the Circuit Court’s action; 2) theaction brought against the secretary in his official capacity joined the State; 3) the State was a“person” within the meaning of the Declaratory Judgment Act; and 4) the action was not precludedby sovereign immunity.
State v. Brekke, 2005 SD 31, 694 NW2d 46. The defendent, Lance Brekke, was convicted of 10counts of failure to file contractors’ excise tax returns. He appealed the conviction. The SupremeCourt reversed and remanded, and held that there was no proof or jury instruction with respect tothe defendent’s tax liability, and thus a defect in information was not cured by proof of all of theessential elements of the crime of failure to file a contractors’ excise tax return.
32 South Dakota Department of Revenue and Regulation
Insurance Fraud Prevention UnitA unit of the Legal Division
The Insurance Fraud Prevention Unit (IFPU) was created by the 1999 South Dakota Legislature inresponse to the growing problem of insurance fraud across the state. The Fraud Unit is a certifiedlaw enforcement agency with statewide jurisdiction whose duties include investigating suspectedfraudulent insurance acts; prosecuting fraudulent insurance acts; promoting awareness ofinsurance fraud; and conducting independent studies to determine the extent of fraudulentinsurance acts. It has a staff of four employees, including a Unit Chief, two investigators, and asecretary.
The Unit is funded solely by a $250 assessment against all insurance companies licensed toconduct business within South Dakota. The Fraud Unit places these monies into a dedicated fundfor exclusive use in its efforts to combat insurance fraud. The FY2006 budget for the Fraud Unitwas $296,266, and the amount of money expended by the Unit this fiscal year was $201,884.10.A majority of the funds expended by the Fraud Unit during this period was in support of theinvestigation and prosecution of insurance fraud cases.
Referrals
The investigations conducted by the Fraud Unit are based on referrals from the insurance industry,the general public, law enforcement and other government agencies. When received, the referralsare reviewed by the Unit Chief to determine if an investigation is warranted. If it is, the referral isassigned to an investigator. Persons who want to make a referral concerning suspectedinsurance fraud can call, write or visit the Fraud Unit at 445 East Capitol Avenue, Pierre, SD57501, (605) 773-6325. Referrals can also be made on-line at www.state.sd.us/drr2/reg/insurance/fraud/.
The Unit received 92 referrals in FY2006, down from 103 the previous fiscal year. Of the 92received, 67 came from the insurance industry, 10 from the general public, four from lawenforcement, three from other government agencies, and eight were made anonymously.
Referrals are classified by both suspect type and type of fraud. Of the 92 referrals handled inFY2006, 83 concerned the insured or claimant, seven involved agents or brokers, and theremaining two concerned insurance companies or their representatives. As for type of fraud, the92 referrals were typed as follows: auto insurance (36), workers compensation (20), homeownersinsurance (6), medical/health insurance (4), agent fraud (2), disability insurance (2), falseapplication (2), life insurance (2), commercial insurance (1), and other (17).
332006 Annual Report
Insurance Fraud Prevention Unit/continued
Investigations and Prosecutions
Of the 92 cases referred to the Fraud Unit in FY2006, two were referred for prosecution, 32 wereclosed due to insufficient evidence or other bar to prosecution, five were referred for regulatoryaction, one was referred to other agencies, four involved assisting other agencies, 32 wereclassified and maintained for intelligence purposes only, prosecution was declined in three cases,and 13 remain in an active or inactive investigation status. At the end of FY2006, the Fraud Unithad five cases which were open for more than 12 months. All five cases concern allegations thatconsumers submitted false or exaggerated claims to their insurance company.
As part of its prosecution efforts, the Unit requests that the Courts order fraud perpetrators tomake restitution to their victims. In FY2006, the Fraud Unit recovered or obtained court orders forrestitution in the amount of $533,610.29.
Prevention and Education
One of the primary goals of the South Dakota Insurance Fraud Prevention Unit is to educate thepublic, insurance industry, law enforcement and prosecutors that insurance fraud is a crime andthat it has a negative impact on our insurance rates and society. The Unit accomplishes that goalby associating with professional groups from both the insurance industry and law enforcementcommunity, making public presentations, and providing a variety of resource materials aboutinsurance fraud.
Among the groups the Unit is affiliated with are the National White Collar Crime Center, NationalInsurance Crime Bureau, Mid-States Organized Crime Information Center, South Dakota LawEnforcement Intelligence Network, South Dakota Health Care Fraud Task Force, Senior HealthInsurance Information Network, International Association of Special Investigation Units, SouthDakota States Attorney’s Association, and the National District Attorney’s Association.
In FY2006, Unit staffers made eight formal presentations to the general public, insurance industry,law enforcement, and prosecutors.
As part of its public awareness campaign, the Fraud Unit publishes several pamphlets whichprovide information about what insurance fraud is, why we should care, and how to preventbecoming a victim of insurance fraud. It has also received permission from the National InsuranceCrime Bureau to use their “Indicators of Fraud” checklists and “Fraud Awareness” video series.These resource materials are available upon request.
34 South Dakota Department of Revenue and Regulation
Division of InsuranceMerle Scheiber, Director
FY2006 Performance IndicatorsFY2006 Revenues
Taxes Collected (General Fund) $55,298,267Fees (Insurance Operating Fund):
Admission 99,402Company Renewal 83,770Agent Licensing/Renewal 1,995,280Exam Fees 13,210Miscellaneous and Legal 19,636Retaliatory/Filing 945,915Administrative Penalties 51,978Lists and Labels 6,140Certification Letters 11,920Investment Council Interest 21,417Course Approval 23,875
Subsequent Injury Fund:Sub-Injury Fund Assessment 7,928,214Investment Council Interest 31,660
Continuing Education Fund:Agent Renewal Fees 87,776Investment Council Interest 1,530
Special Collections for Workers Compensation:Policy Fee (Transferred to Dept. of Labor) 265,434Examination Fund (effective 7/1/97) 837,900Investment Council Interest 8,637
Total $67,731,961
Total Licensed/Domestic Companies 1,424/45Domestic Companies Financial Exams 5Company Market Conduct Exams 0Companies Licensed/Approved Mergers 43Agent Licenses Issued 18,823Agent Appointments Issued 54,610Renewed Appointments 138,471Agent Appointment Cancellations 14,000Property/Casualty Filings Reviewed 6,460Life/Health Filings Reviewed 3,862Consumer Complaints Closed 1,087Enforcement/New Open Files 805Enforcement/Closed Files 870Continuing Education:
Agents Paying License Renewal 4,389Agents Exempt 2,404Agents Reporting Completion 4,389Courses Reviewed 955Courses Monitored 7Agent Licenses Cancelled 1,206
Subsequent Injury Fund:New Claims 46Claims Paid 140Dollars Paid $8,198,791
The Division of Insurance regulates and licenses the insurance industry in South Dakota and iscomprised of two main programs: Financial and Licensing, and Regulation.
Duties of the Division include: providing regulatory oversight to protect South Dakota policyhold-ers against financial loss due to inappropriate business practices and/or insolvency of insurancecompanies permitted to operate in South Dakota; licensing resident and non-resident agents andinsurance companies; licensing and registration of other insurance entities; auditing licensees andregistrants for compliance with existing statutes and regulations; reviewing property/casualty/life/health company rates, rules and form filings for compliance; investigating and acting on consumercomplaints; taking appropriate enforcement actions with respect to licensees and registrants; andreviewing and approval of continuing education programs for agents and companies.
352006 Annual Report
Administrative Services DivisionJoan Serfling, Director
Fiscal Year 2006 - Remittance Center
Dollars processed for Revenue and Regulation $803,501,475Dollars processed for other agencies 109,982,180
Total dollars processed $913,483,655
Total documents processed 534,453
Appraiser Certification ProgramSherry Bren, Executive Director
The Administrative Services division manages the department’s physical assets, budgetarydata, collections, computer services, public relations, and training programs. Its purpose is toincrease the efficiency of the operational divisions by providing them with the resources theyneed to meet their goals. The division also manages the department’s Remittance Center inSioux Falls, which processed over $913 million in payments in fiscal year 2006. Other agenciesfor which the Remittance Center collects revenues include Agriculture; Game, Fish and Parks;Social Services; Health; Environment and Natural Resources; Human Services; Unified JudicialSystem; Legislative Audits; and Retirement.
The Appraiser Certification Program was implemented July 1, 1990, pursuant to Congress’enactment of Title XI of the Financial Institutions Reform, Recovery and Enforcement Act(FIRREA). The Program’s mission is to certify, license and register real estate appraisers inSouth Dakota. Responsibilities include examining candidates; issuing certificates; investigat-ing and administering disciplinary actions to persons in violation of the rules, statutes anduniform standards; and approving qualifying and continuing education courses.
Revenues from the program totaled $125,484 for FY2006. From July 1, 2005 to June 30, 2006,the Appraiser Certification Program licensed 33 new appraisers; renewed 361 appraiserlicenses; received 19 upgrade applications; issued 8 new reciprocal licenses; issued 66temporary permits; processed 158 course applications; and received 17 complaints.
36 South Dakota Department of Revenue and Regulation
Division of BankingRoger Novotny, Director
A Four-Year Comparison of Revenues by Category
FY2003 FY2004 FY2005 FY2006
Bank Examination Fee $438,026 $556,441 $728,275 $975,137Trust Company Examination Fee 21,239 0 19,016 6,099License Fees 193,350 339,580 407,932 619,170Trust Company Supervision Fee 0 0 79,584 64,571Investment Council Interest 39,270 18,401 13,542 1,796Miscellaneous** 3,495 7,548 25,648 202,002Trust Company Charter Fees* 20,000 5,000 5,000 0
Totals $715,380 $926,970 $1,278,997 $1,868,775*Deposited in General Funds
** Includes $155,000 Ameriquest Mortgage Settlement restricted funds
Performance Indicators: FY2003 - FY2006
The Division of Banking charters and examines state banks and trust companies, and licensesmoney lenders, mortgage lenders, mortgage brokers, and money order issuers. The five-memberState Banking Commission has rule-making authority and acts on applications submitted for new,expanded, or relocated bank and trust charters. The Division has a staff of 12 bank examiners,two consumer license specialists, one support position, a deputy director, and the director.
Revenues generated by the Division of Banking (with the exception of the Trust Company CharterFee) is deposited in the Banking Special Revenue Fund to self-fund the cost of supervision andregulation. These revenues come from six sources: Bank Examination Fee; Trust CompanyExamination Fee; Trust Company Supervision Fee; License Application and Renewal Fees;Investment Council Interest, and Miscellaneous (which includes funds transferred to the Divisionfrom application fees to cover administrative, review and processing costs other than the expenseof holding hearings for changes in banks and trust companies).
FY2003 FY2004 FY2005 FY2006
Applications Before the Commission 16 20 18 13Banks Examined 29 38 26 26Trust Companies Examined 8 5 9 6Licenses Issued or Renewed 922 652 702 913State-chartered banks 75 72 71 70State-chartered trust companies 19 22 21 19Bank Assets $9,728,372,000 $10,130,289,000 $11,248,156,000 $13,225,732,000Trust Assets $13,711,290,000 $15,367,625,000 $24,810,448,000 $34,669,887,000
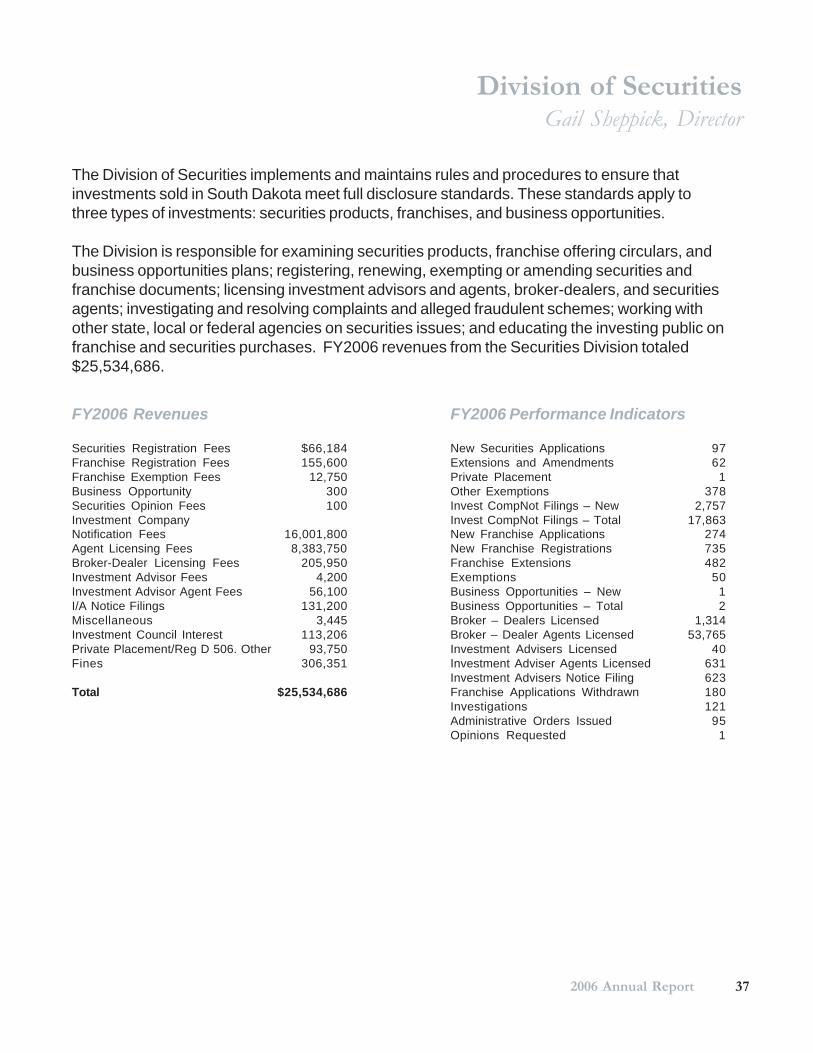
372006 Annual Report
Division of SecuritiesGail Sheppick, Director
FY2006 Revenues
Securities Registration Fees $66,184Franchise Registration Fees 155,600Franchise Exemption Fees 12,750Business Opportunity 300Securities Opinion Fees 100Investment CompanyNotification Fees 16,001,800Agent Licensing Fees 8,383,750Broker-Dealer Licensing Fees 205,950Investment Advisor Fees 4,200Investment Advisor Agent Fees 56,100I/A Notice Filings 131,200Miscellaneous 3,445Investment Council Interest 113,206Private Placement/Reg D 506. Other 93,750Fines 306,351
Total $25,534,686
FY2006 Performance Indicators
New Securities Applications 97Extensions and Amendments 62Private Placement 1Other Exemptions 378Invest CompNot Filings – New 2,757Invest CompNot Filings – Total 17,863New Franchise Applications 274New Franchise Registrations 735Franchise Extensions 482Exemptions 50Business Opportunities – New 1Business Opportunities – Total 2Broker – Dealers Licensed 1,314Broker – Dealer Agents Licensed 53,765Investment Advisers Licensed 40Investment Adviser Agents Licensed 631Investment Advisers Notice Filing 623Franchise Applications Withdrawn 180Investigations 121Administrative Orders Issued 95Opinions Requested 1
The Division of Securities implements and maintains rules and procedures to ensure thatinvestments sold in South Dakota meet full disclosure standards. These standards apply tothree types of investments: securities products, franchises, and business opportunities.
The Division is responsible for examining securities products, franchise offering circulars, andbusiness opportunities plans; registering, renewing, exempting or amending securities andfranchise documents; licensing investment advisors and agents, broker-dealers, and securitiesagents; investigating and resolving complaints and alleged fraudulent schemes; working withother state, local or federal agencies on securities issues; and educating the investing public onfranchise and securities purchases. FY2006 revenues from the Securities Division totaled$25,534,686.
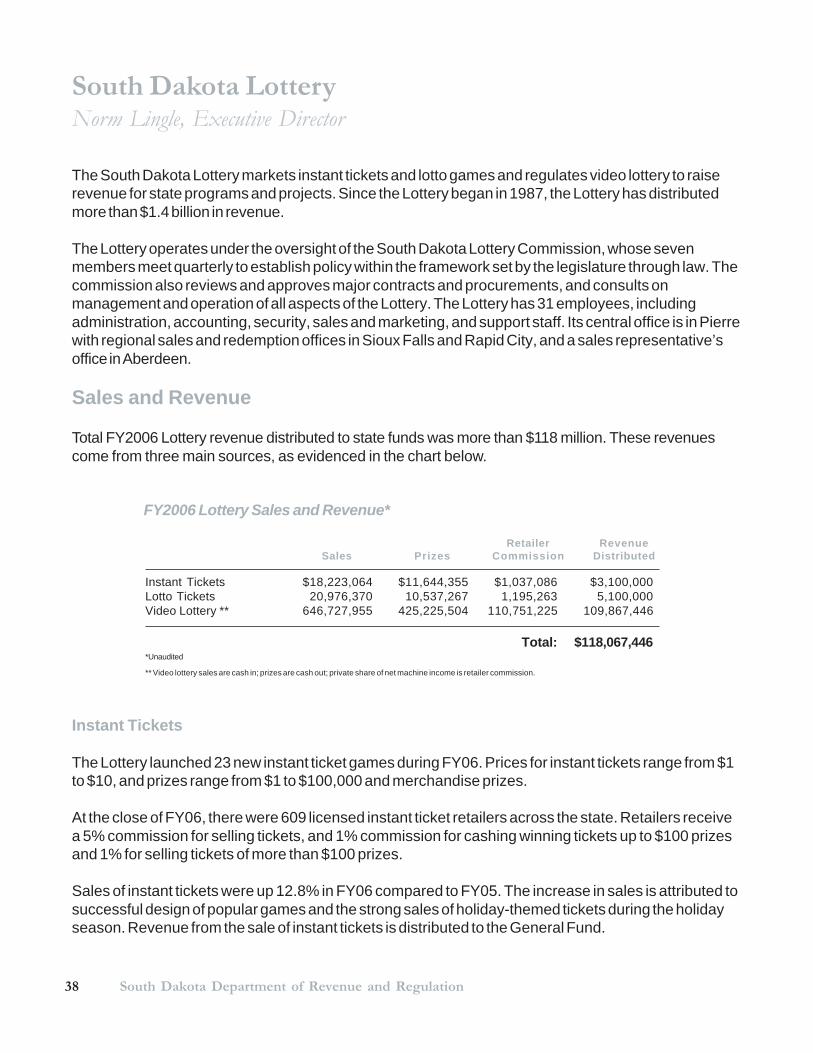
38 South Dakota Department of Revenue and Regulation
South Dakota LotteryNorm Lingle, Executive Director
FY2006 Lottery Sales and Revenue*
Instant Tickets
The Lottery launched 23 new instant ticket games during FY06. Prices for instant tickets range from $1to $10, and prizes range from $1 to $100,000 and merchandise prizes.
At the close of FY06, there were 609 licensed instant ticket retailers across the state. Retailers receivea 5% commission for selling tickets, and 1% commission for cashing winning tickets up to $100 prizesand 1% for selling tickets of more than $100 prizes.
Sales of instant tickets were up 12.8% in FY06 compared to FY05. The increase in sales is attributed tosuccessful design of popular games and the strong sales of holiday-themed tickets during the holidayseason. Revenue from the sale of instant tickets is distributed to the General Fund.
The South Dakota Lottery markets instant tickets and lotto games and regulates video lottery to raiserevenue for state programs and projects. Since the Lottery began in 1987, the Lottery has distributedmore than $1.4 billion in revenue.
The Lottery operates under the oversight of the South Dakota Lottery Commission, whose sevenmembers meet quarterly to establish policy within the framework set by the legislature through law. Thecommission also reviews and approves major contracts and procurements, and consults onmanagement and operation of all aspects of the Lottery. The Lottery has 31 employees, includingadministration, accounting, security, sales and marketing, and support staff. Its central office is in Pierrewith regional sales and redemption offices in Sioux Falls and Rapid City, and a sales representative’soffice in Aberdeen.
Sales and Revenue
Total FY2006 Lottery revenue distributed to state funds was more than $118 million. These revenuescome from three main sources, as evidenced in the chart below.
Retailer RevenueSales Prizes Commission Distributed
Instant Tickets $18,223,064 $11,644,355 $1,037,086 $3,100,000Lotto Tickets 20,976,370 10,537,267 1,195,263 5,100,000Video Lottery ** 646,727,955 425,225,504 110,751,225 109,867,446
Total: $118,067,446*Unaudited
** Video lottery sales are cash in; prizes are cash out; private share of net machine income is retailer commission.
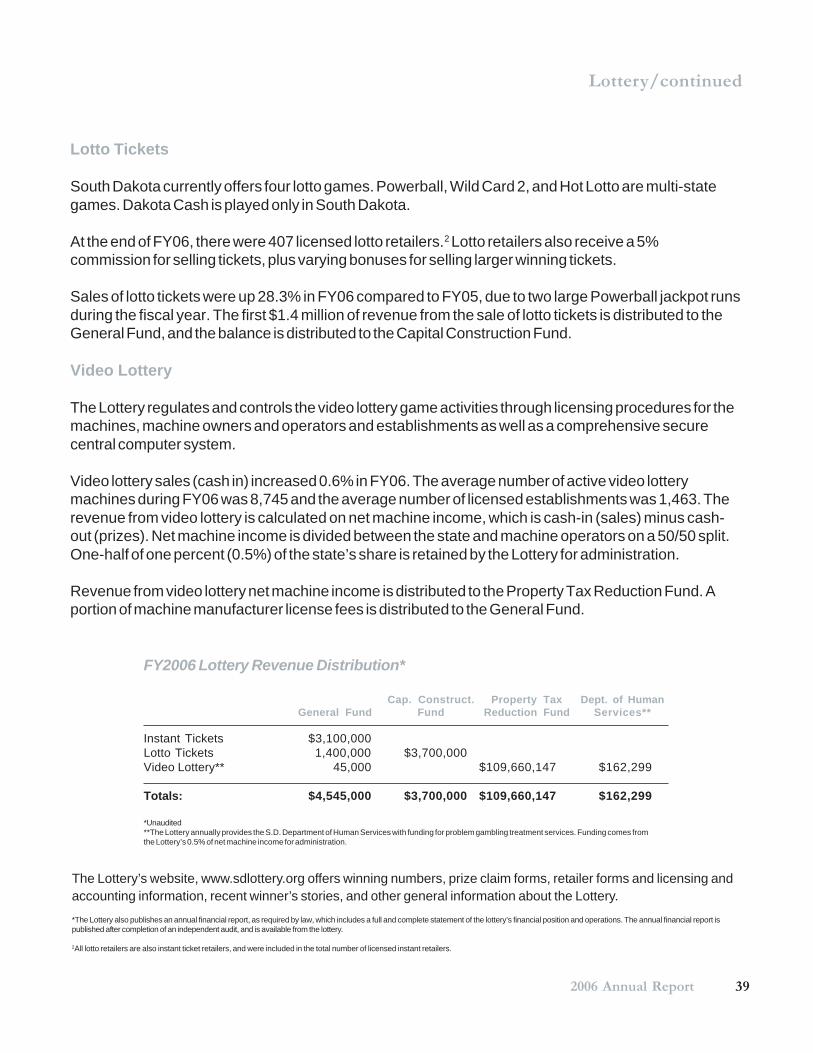
392006 Annual Report
Lottery/continued
FY2006 Lottery Revenue Distribution*
Cap. Construct. Property Tax Dept. of HumanGeneral Fund Fund Reduction Fund Services**
Instant Tickets $3,100,000Lotto Tickets 1,400,000 $3,700,000Video Lottery** 45,000 $109,660,147 $162,299
Totals: $4,545,000 $3,700,000 $109,660,147 $162,299
*Unaudited**The Lottery annually provides the S.D. Department of Human Services with funding for problem gambling treatment services. Funding comes fromthe Lottery’s 0.5% of net machine income for administration.
Lotto Tickets
South Dakota currently offers four lotto games. Powerball, Wild Card 2, and Hot Lotto are multi-stategames. Dakota Cash is played only in South Dakota.
At the end of FY06, there were 407 licensed lotto retailers.2 Lotto retailers also receive a 5%commission for selling tickets, plus varying bonuses for selling larger winning tickets.
Sales of lotto tickets were up 28.3% in FY06 compared to FY05, due to two large Powerball jackpot runsduring the fiscal year. The first $1.4 million of revenue from the sale of lotto tickets is distributed to theGeneral Fund, and the balance is distributed to the Capital Construction Fund.
Video Lottery
The Lottery regulates and controls the video lottery game activities through licensing procedures for themachines, machine owners and operators and establishments as well as a comprehensive securecentral computer system.
Video lottery sales (cash in) increased 0.6% in FY06. The average number of active video lotterymachines during FY06 was 8,745 and the average number of licensed establishments was 1,463. Therevenue from video lottery is calculated on net machine income, which is cash-in (sales) minus cash-out (prizes). Net machine income is divided between the state and machine operators on a 50/50 split.One-half of one percent (0.5%) of the state’s share is retained by the Lottery for administration.
Revenue from video lottery net machine income is distributed to the Property Tax Reduction Fund. Aportion of machine manufacturer license fees is distributed to the General Fund.
The Lottery’s website, www.sdlottery.org offers winning numbers, prize claim forms, retailer forms and licensing andaccounting information, recent winner’s stories, and other general information about the Lottery.*The Lottery also publishes an annual financial report, as required by law, which includes a full and complete statement of the lottery’s financial position and operations. The annual financial report ispublished after completion of an independent audit, and is available from the lottery.
2All lotto retailers are also instant ticket retailers, and were included in the total number of licensed instant retailers.
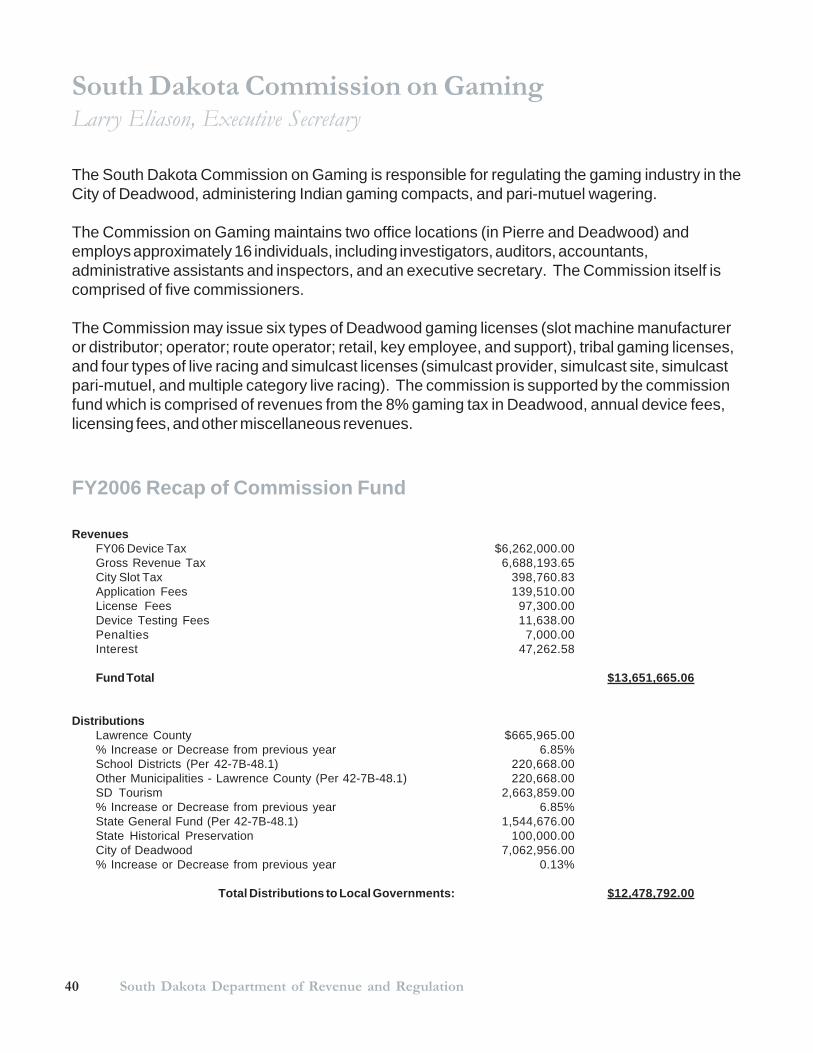
40 South Dakota Department of Revenue and Regulation
South Dakota Commission on GamingLarry Eliason, Executive Secretary
FY2006 Recap of Commission Fund
The South Dakota Commission on Gaming is responsible for regulating the gaming industry in theCity of Deadwood, administering Indian gaming compacts, and pari-mutuel wagering.
The Commission on Gaming maintains two office locations (in Pierre and Deadwood) andemploys approximately 16 individuals, including investigators, auditors, accountants,administrative assistants and inspectors, and an executive secretary. The Commission itself iscomprised of five commissioners.
The Commission may issue six types of Deadwood gaming licenses (slot machine manufactureror distributor; operator; route operator; retail, key employee, and support), tribal gaming licenses,and four types of live racing and simulcast licenses (simulcast provider, simulcast site, simulcastpari-mutuel, and multiple category live racing). The commission is supported by the commissionfund which is comprised of revenues from the 8% gaming tax in Deadwood, annual device fees,licensing fees, and other miscellaneous revenues.
RevenuesFY06 Device Tax $6,262,000.00Gross Revenue Tax 6,688,193.65City Slot Tax 398,760.83Application Fees 139,510.00License Fees 97,300.00Device Testing Fees 11,638.00Penalties 7,000.00Interest 47,262.58
Fund Total $13,651,665.06
DistributionsLawrence County $665,965.00% Increase or Decrease from previous year 6.85%School Districts (Per 42-7B-48.1) 220,668.00Other Municipalities - Lawrence County (Per 42-7B-48.1) 220,668.00SD Tourism 2,663,859.00% Increase or Decrease from previous year 6.85%State General Fund (Per 42-7B-48.1) 1,544,676.00State Historical Preservation 100,000.00City of Deadwood 7,062,956.00% Increase or Decrease from previous year 0.13%
Total Distributions to Local Governments: $12,478,792.00
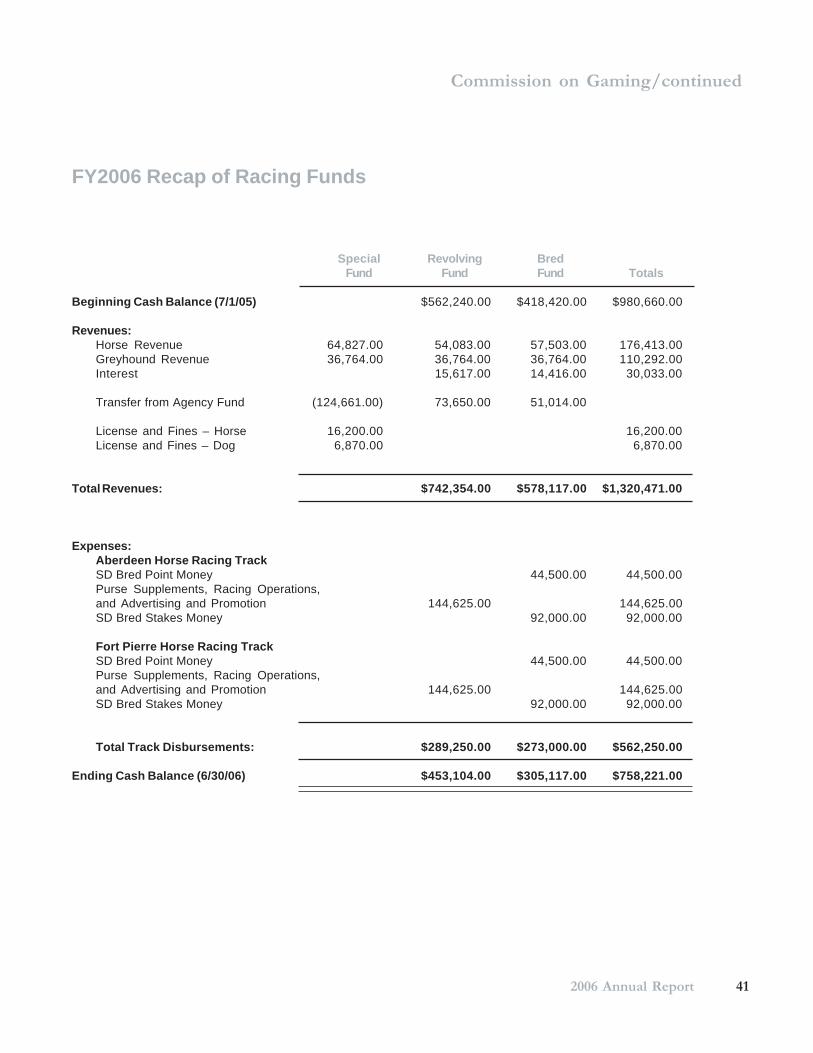
412006 Annual Report
Commission on Gaming/continued
FY2006 Recap of Racing Funds
Special Revolving BredFund Fund Fund Totals
Beginning Cash Balance (7/1/05) $562,240.00 $418,420.00 $980,660.00
Revenues:Horse Revenue 64,827.00 54,083.00 57,503.00 176,413.00Greyhound Revenue 36,764.00 36,764.00 36,764.00 110,292.00Interest 15,617.00 14,416.00 30,033.00
Transfer from Agency Fund (124,661.00) 73,650.00 51,014.00
License and Fines – Horse 16,200.00 16,200.00License and Fines – Dog 6,870.00 6,870.00
Total Revenues: $742,354.00 $578,117.00 $1,320,471.00
Expenses:Aberdeen Horse Racing TrackSD Bred Point Money 44,500.00 44,500.00Purse Supplements, Racing Operations,and Advertising and Promotion 144,625.00 144,625.00SD Bred Stakes Money 92,000.00 92,000.00
Fort Pierre Horse Racing TrackSD Bred Point Money 44,500.00 44,500.00Purse Supplements, Racing Operations,and Advertising and Promotion 144,625.00 144,625.00SD Bred Stakes Money 92,000.00 92,000.00
Total Track Disbursements: $289,250.00 $273,000.00 $562,250.00
Ending Cash Balance (6/30/06) $453,104.00 $305,117.00 $758,221.00
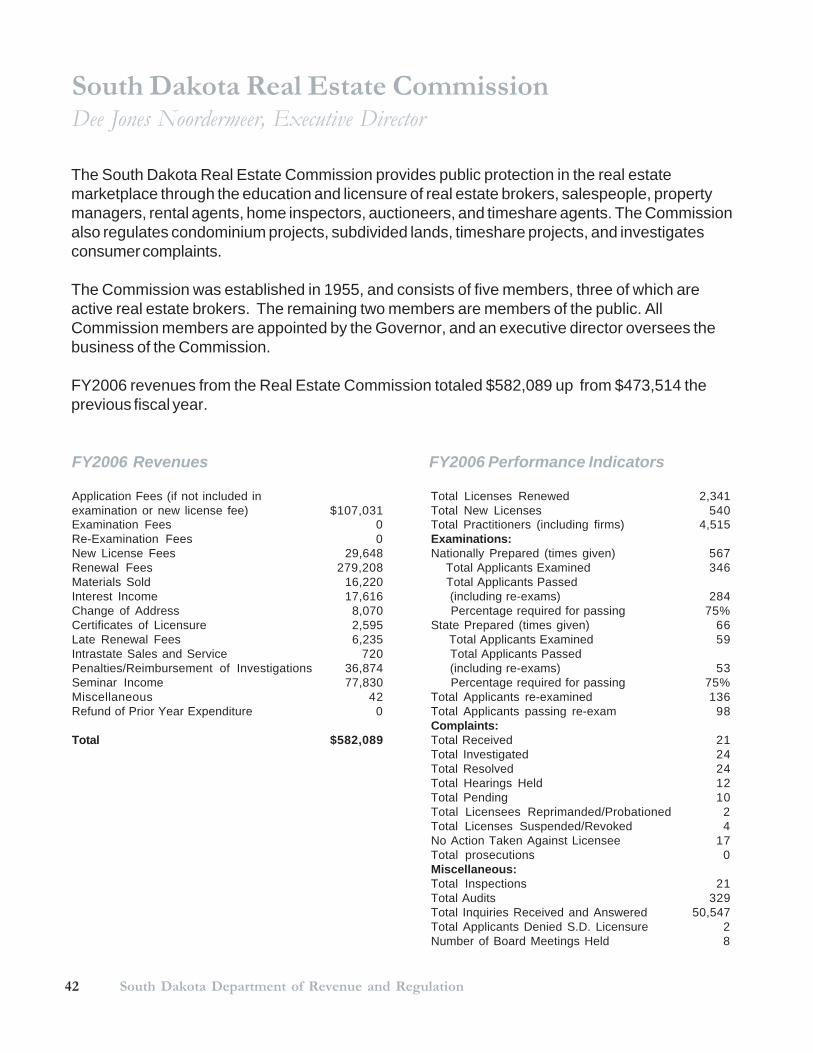
42 South Dakota Department of Revenue and Regulation
FY2006 Revenues FY2006 Performance Indicators
Application Fees (if not included inexamination or new license fee) $107,031Examination Fees 0Re-Examination Fees 0New License Fees 29,648Renewal Fees 279,208Materials Sold 16,220Interest Income 17,616Change of Address 8,070Certificates of Licensure 2,595Late Renewal Fees 6,235Intrastate Sales and Service 720Penalties/Reimbursement of Investigations 36,874Seminar Income 77,830Miscellaneous 42Refund of Prior Year Expenditure 0
Total $582,089
Total Licenses Renewed 2,341Total New Licenses 540Total Practitioners (including firms) 4,515Examinations:Nationally Prepared (times given) 567 Total Applicants Examined 346 Total Applicants Passed (including re-exams) 284 Percentage required for passing 75%State Prepared (times given) 66 Total Applicants Examined 59 Total Applicants Passed (including re-exams) 53 Percentage required for passing 75%Total Applicants re-examined 136Total Applicants passing re-exam 98Complaints:Total Received 21Total Investigated 24Total Resolved 24Total Hearings Held 12Total Pending 10Total Licensees Reprimanded/Probationed 2Total Licenses Suspended/Revoked 4No Action Taken Against Licensee 17Total prosecutions 0Miscellaneous:Total Inspections 21Total Audits 329Total Inquiries Received and Answered 50,547Total Applicants Denied S.D. Licensure 2Number of Board Meetings Held 8
South Dakota Real Estate CommissionDee Jones Noordermeer, Executive Director
The South Dakota Real Estate Commission provides public protection in the real estatemarketplace through the education and licensure of real estate brokers, salespeople, propertymanagers, rental agents, home inspectors, auctioneers, and timeshare agents. The Commissionalso regulates condominium projects, subdivided lands, timeshare projects, and investigatesconsumer complaints.
The Commission was established in 1955, and consists of five members, three of which areactive real estate brokers. The remaining two members are members of the public. AllCommission members are appointed by the Governor, and an executive director oversees thebusiness of the Commission.
FY2006 revenues from the Real Estate Commission totaled $582,089 up from $473,514 theprevious fiscal year.
432006 Annual Report
Petroleum Release Compensation FundDennis Rounds, Director
Established under the Petroleum Inspection and Release Compensation Act of 1988, the PetroleumRelease Compensation Fund (PRCF) is a state-operated program that can financially assist petroleumtank owners with the cleanup of petroleum releases. The PRCF has been approved by theEnvironmental Protection Agency as an acceptable mechanism for the petroleum tank owners in SouthDakota to demonstrate financial responsibility as required by both federal and state law. The PRCF isconsidered a full-coverage program and regulated petroleum tank owners are not required to haveadditional insurance.
The program’s revenue source is a $0.02 per gallon tank inspection fee. The PRCF receives 10.65% ofthe revenues collected or about $1.6 million per year; the remainder goes to the Ethanol Fuel Fund andthe Capital Construction Fund.
The PRCF continues to fulfill the mandatory environmental financial assurance requirements forregulated petroleum tank owners in South Dakota as required by the U.S. Environmental ProtectionAgency (EPA). The PRCF is approved by the EPA for both environmental cleanup and third-partyliability coverage, and has been designated as a model program.
FY06 Payments
The total amount paid by the PRCF in fiscal year 2006 was $782,462. Of that amount, $505,269constituted reimbursement payments made for cleanups at regular petroleum release sites. In addition,$277,193 was paid for cleanups under the abandoned tank removal program.
FY06 Statistics
There were 167 responsible parties reimbursed in 2006; 274 pay requests (claims paid); 56 newregular petroleum release cases initiated; and 38 abandoned tank program cases initiated.
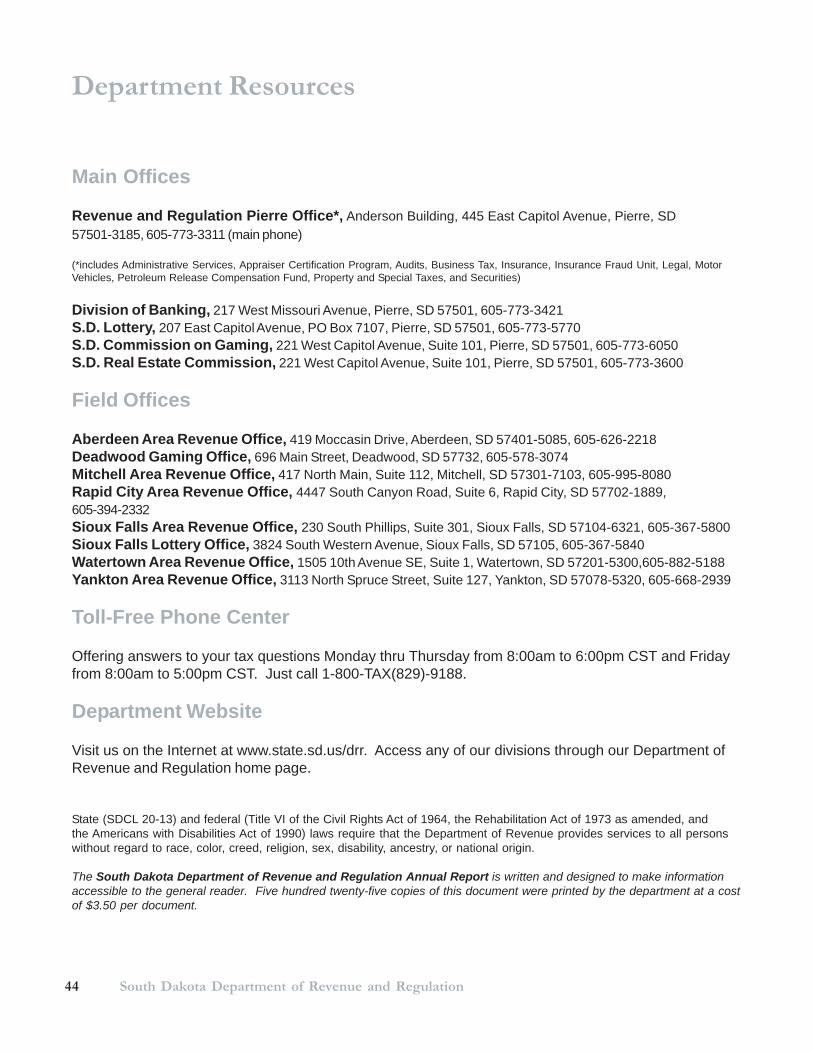
44 South Dakota Department of Revenue and Regulation
State (SDCL 20-13) and federal (Title VI of the Civil Rights Act of 1964, the Rehabilitation Act of 1973 as amended, andthe Americans with Disabilities Act of 1990) laws require that the Department of Revenue provides services to all personswithout regard to race, color, creed, religion, sex, disability, ancestry, or national origin.
The South Dakota Department of Revenue and Regulation Annual Report is written and designed to make informationaccessible to the general reader. Five hundred twenty-five copies of this document were printed by the department at a costof $3.50 per document.
Department Resources
Main Offices
Revenue and Regulation Pierre Office*, Anderson Building, 445 East Capitol Avenue, Pierre, SD57501-3185, 605-773-3311 (main phone)
(*includes Administrative Services, Appraiser Certification Program, Audits, Business Tax, Insurance, Insurance Fraud Unit, Legal, MotorVehicles, Petroleum Release Compensation Fund, Property and Special Taxes, and Securities)
Division of Banking, 217 West Missouri Avenue, Pierre, SD 57501, 605-773-3421S.D. Lottery, 207 East Capitol Avenue, PO Box 7107, Pierre, SD 57501, 605-773-5770S.D. Commission on Gaming, 221 West Capitol Avenue, Suite 101, Pierre, SD 57501, 605-773-6050S.D. Real Estate Commission, 221 West Capitol Avenue, Suite 101, Pierre, SD 57501, 605-773-3600
Field Offices
Aberdeen Area Revenue Office, 419 Moccasin Drive, Aberdeen, SD 57401-5085, 605-626-2218Deadwood Gaming Office, 696 Main Street, Deadwood, SD 57732, 605-578-3074Mitchell Area Revenue Office, 417 North Main, Suite 112, Mitchell, SD 57301-7103, 605-995-8080Rapid City Area Revenue Office, 4447 South Canyon Road, Suite 6, Rapid City, SD 57702-1889,605-394-2332Sioux Falls Area Revenue Office, 230 South Phillips, Suite 301, Sioux Falls, SD 57104-6321, 605-367-5800Sioux Falls Lottery Office, 3824 South Western Avenue, Sioux Falls, SD 57105, 605-367-5840Watertown Area Revenue Office, 1505 10th Avenue SE, Suite 1, Watertown, SD 57201-5300,605-882-5188Yankton Area Revenue Office, 3113 North Spruce Street, Suite 127, Yankton, SD 57078-5320, 605-668-2939
Toll-Free Phone Center
Offering answers to your tax questions Monday thru Thursday from 8:00am to 6:00pm CST and Fridayfrom 8:00am to 5:00pm CST. Just call 1-800-TAX(829)-9188.
Department Website
Visit us on the Internet at www.state.sd.us/drr. Access any of our divisions through our Department ofRevenue and Regulation home page.