july 20, 2012 orlando, florida · 7/20/2012 · hotel real estate cycle ... lake buena vista...
TRANSCRIPT

July 20, 2012 Orlando, Florida
1

John Lancet, MAI ◦ Director/Partner
◦ HVS Miami
2

Look back at past performance and where we stand in the hotel real estate cycle
Present our 5-year forecast of U.S. supply, demand,
occupancy, and average rate change
Present Metro Orlando performance forecasts Overview of recent national transaction trends and hotel
brand transaction trends Valuation parameters, discount rates, and cap rates
3

2009 represented a peak year for the increase in supply additions, registering a 2.8% increase over 2008, and adding a record131,000 rooms
This increase was on the heels of an increase in 108,000 rooms in 2008
Thus, during 2008 and 2009, over 5% supply growth was realized
From 2010 through 2011, total supply increased 2.2% representing another 104,000 rooms added during these 2 years
4

All time high in supply – over 4.8 million rooms in 2011
(000) A
vail
able
Ro
om
Nig
hts
5

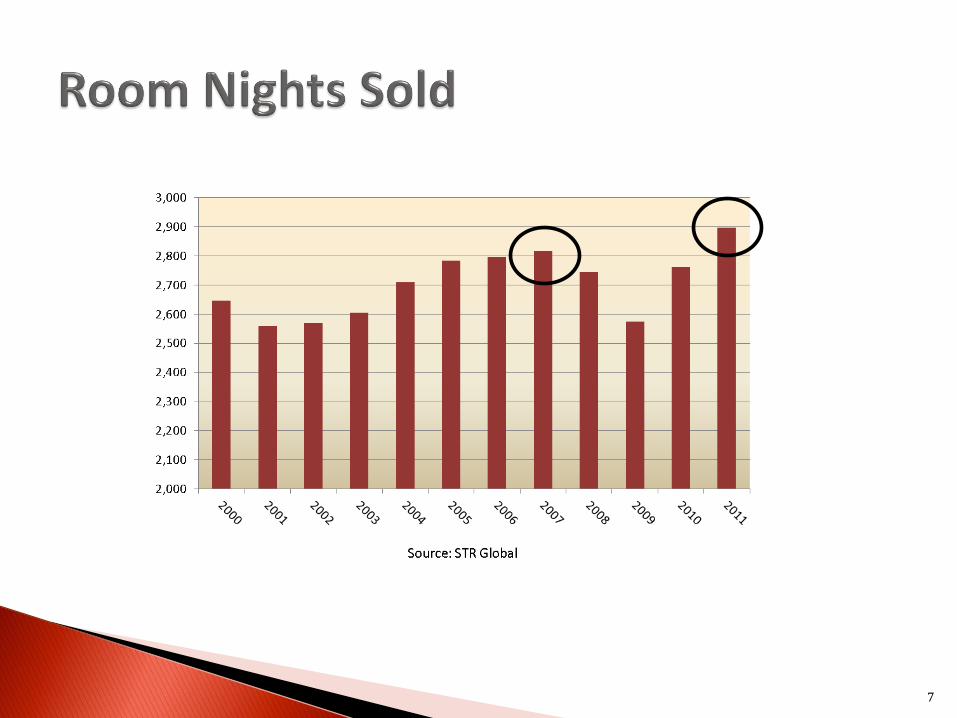
Demand declined 2.5% in 2008 and another 6.2% in 2009
U.S. Lodging Industry experienced a rapid demand recovery in 2010 and 2011, increasing 7.3% and 4.9% respectively
Total Room nights sold in 2011 reached all time high (surpassing 2007 levels) at 2.897 million
6
7

◦ Occupancy in 2011: 60.1%
◦ Compares closely to 12 year average: 60.3%
8

9

◦ Average rate peaked in 2008 at
$107.40, before dropping 8.5% to just over $98 in 2009 ◦ Average rate remained at $98 in 2010
◦ Average rate increased 3.7% in 2011 to
just under $102 and roughly $6.00 off the prior peak
10

11

Average rate increased 3.7% in 2011
% C
han
ge
5.4%
-1.2% -1.2%
0.2%
4.2%
5.8% 7.5%
6.6%
2.9%
-8.5
3.7%
12

After a 16.7% decline in RevPAR in 2009, RevPAR increased 5.5% in 2010 and another 8.2% in 2011
RevPAR for 2011 at $61.07 approached the 2006 level $(61.76)
HVS forecasts National RevPAR to exceed 2007 high of $65.53 in 2013, reaching $69.77
13

14

15

HVS forecasts the following annual increases in room night supply:
2012 0.4%
2013 0.5%
2014 1.0%
2015 1.5%
2016 1.5%
Year end 2016 hotel supply estimated at 5.065 million rooms
16

(000)
17

HVS forecasts the following annual increases in room night demand:
2012 2.3% 2013 2.5% 2014 2.0% 2015 1.5% 2016 1.5%
Year end 2016 forecast to equal 3.191 million room nights sold
Thus the % increase in demand will be greater than the % increase in supply for 2012, 2013, 2014
National occupancy forecast at 63% from 2014 through 2016, at historical high levels
18

(000)
19

20

HVS forecasts the following annual increases in National ADR:
2012 4.75% 2013 5.00% 2014 4.75% 2015 4.00% 2016 3.00%
ADR forecast at $106.51 in 2012, about $1 less than 2008 record high of $107.40.
ADR will surpass previous peak and the $110 peak in 2013.
HVS forecast ADR increasing to $125.49 by year end 2016.
21

Average Rate to surpass previous peak and the $110 mark in 2013
22

HVS forecasts the following RevPAR increases: 2012 6.7% 2013 7.1% 2014 5.8% 2015 4.0% 2016 3.0%
RevPAR will hit $69.77 in 2013 and exceed the 2007
record
RevPAR growth will be healthy from 2012 to 2015
Year end 2016 RevPAR forecast at $79.06
23

24

2012: ◦ Supply additions minimal at 0.4%
◦ Demand expands by 2.3%
◦ Occupancy improves by 1.8% to end year at 61.2%
◦ Average Rate leads at 4.75% growth to end year at
$106.51
◦ RevPAR increase of 6.7% to end year at $65.16
25

Minimal to modest annual increases in supply ranging from 0.5% to 1.5%
Occupancies stay at 62.4% to 63.04% between 2013 and 2016
Respectable annual increase in ADR, ranging from 4% to 5%, from 2013 to 2016 will drive healthy annual increases in RevPAR of 4% to 7% between 2013 and 2016
Overall, 2013 through 2016 should be good performance years for the hotel industry
26

Orlando Regional Outlook
27

Orlando North: Altamonte Springs, Sanford, Winter Park, some North Orlando
Orlando Central: Downtown, from West Orlando (Winter Garden, Ocoee) to East Orlando (UCF) along State Road 50 (Colonial Drive)
Orlando South: South Orange Blossom Trail, Airport International (I-Drive): Universal Studios south to SeaWorld and
also includes Hilton Bonnet Creek/Waldorf-Astoria Lake Buena Vista (LBV): All LBV hotels, including Marriott World
Center, Hyatt Regency Grand Cypress and Caribe Royale; includes Walt Disney World Swan and Dolphin, but does not include all other Walt Disney World owned and operated hotel properties
Kissimmee West: Zip code 34747; South of Disney along I-4 and the western portion of U.S.192
Kissimmee East: All other zip codes in Osceola County, including the eastern portion of U.S. 192 Kissimmee and St. Cloud.
28 Source: Copyright 2012 Smith Travel Research, All Rights Reserved

Excluding Disney, the Orlando hotel supply has grown from 67,000 rooms in 2006 to 77,000 rooms (current)
Disney has approximately 21,841 rooms but does not report performance metrics
Thus, total combined hotel supply for Orlando equals approximately 92,000 rooms
29

Orlando supply additions initiated during the boom years (06-08) resulted in the following annual increases in supply, which were not always aligned with the annual % change in demand
30
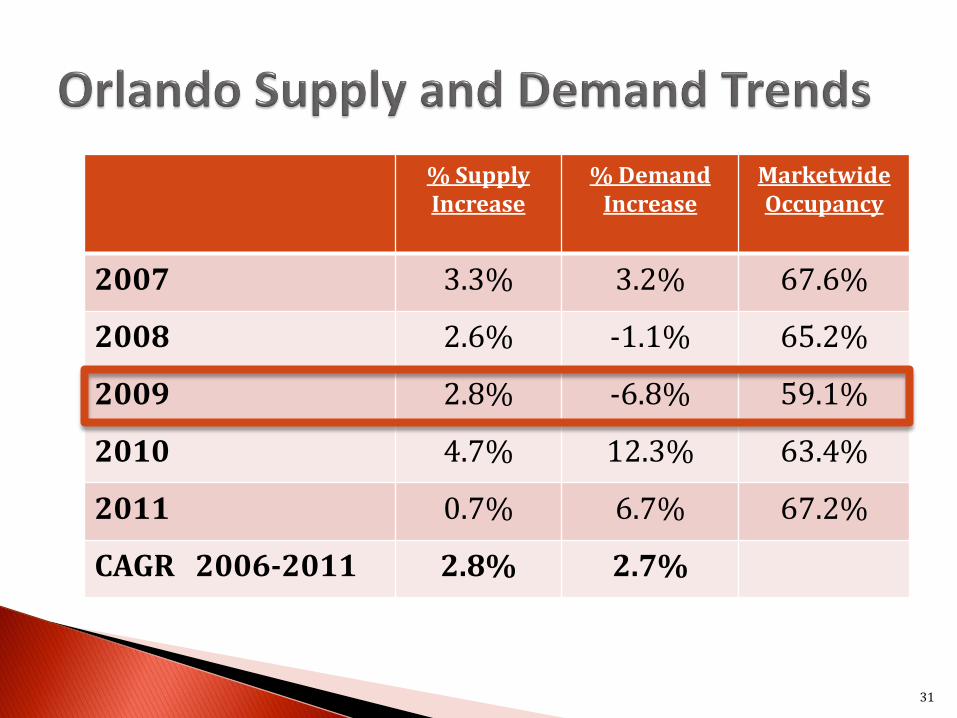
31
% Supply Increase
% Demand Increase
Marketwide Occupancy
2007 3.3% 3.2% 67.6%
2008 2.6% -1.1% 65.2%
2009 2.8% -6.8% 59.1%
2010 4.7% 12.3% 63.4%
2011 0.7% 6.7% 67.2%
CAGR 2006-2011 2.8% 2.7%

RevPAR for 2011 was $68.56 which is still below 2006 RevPAR of $73.98 and the peak RevPAR of $76.93 in 2007
2012 YTD (5 month) RevPAR of $81.71 is 5.3% above YTD 2011. Year end 2012 RevPAR is expected to be in the low $70’s
Year end 2012 ADR forecast at $105 to $106 which is still 7% to 8% less than the peak of $114 in 2008. Future % increases in ADR are not expected to exceed the national trend.
Return to peak occupancy levels had been fueled by the 2011 record of 55.1 million total visitors, with 56.4 million forecasted for 2012
32

33
40
45
50
55
60
65
70
75
80
2006 2007 2008 2009 2010 2011
Occupancy
Lake Buena Vista Orlando South International Drive
Orlando Central Orlando North Kissimmee West
Kissimmee East

34
50
55
60
65
70
75
80
85
May 2011 May 2012
Occupancy - Year to Date May
Lake Buena Vista Orlando South International Drive Orlando Central
Orlando North Kissimmee West Kissimmee East

35
$40
$50
$60
$70
$80
$90
$100
$110
$120
$130
2006 2007 2008 2009 2010 2011
Average Rate
Lake Buena Vista Orlando South International Drive Orlando Central
Orlando North Kissimmee West Kissimmee East

36
$40
$50
$60
$70
$80
$90
$100
$110
$120
$130
May 2011 May 2012
Average Rate - Year to Date May
Lake Buena Vista Orlando South International Drive Orlando Central
Orlando North Kissimmee West Kissimmee East

37
$20
$30
$40
$50
$60
$70
$80
$90
$100
2006 2007 2008 2009 2010 2011
RevPAR
Lake Buena Vista Orlando South International Drive
Orlando Central Orlando North Kissimmee West
Kissimmee East

38
$20
$30
$40
$50
$60
$70
$80
$90
$100
May 2011 May 2012
RevPAR- Year to Date May
Lake Buena Vista Orlando South International Drive Orlando Central
Orlando North Kissimmee West Kissimmee East

39

40

41

42

43
Hotel Transaction Trends by Brand

80,000
100,000
120,000
140,000
160,000
180,000
2004 2005 2006 2007 2008 2010 2011
Average Annual Price/Room
44

50,000
80,000
110,000
140,000
170,000
200,000
230,000
2004 2005 2006 2007 2008 2009 2010 2011
Average Annual Price/Room
45
46
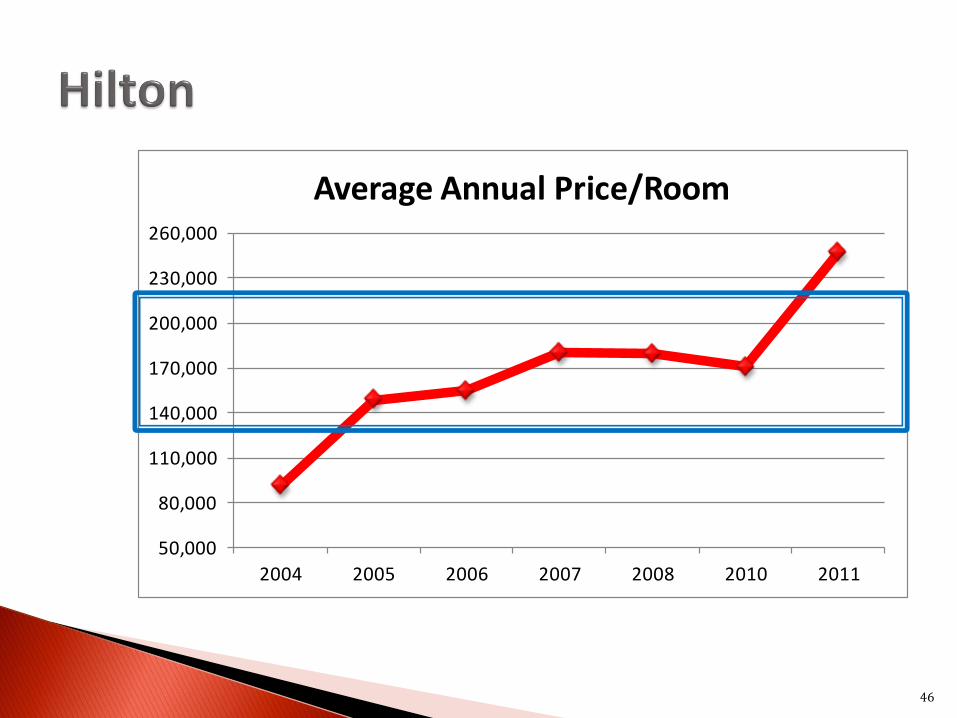
50,000
80,000
110,000
140,000
170,000
200,000
230,000
260,000
2004 2005 2006 2007 2008 2010 2011
Average Annual Price/Room
47
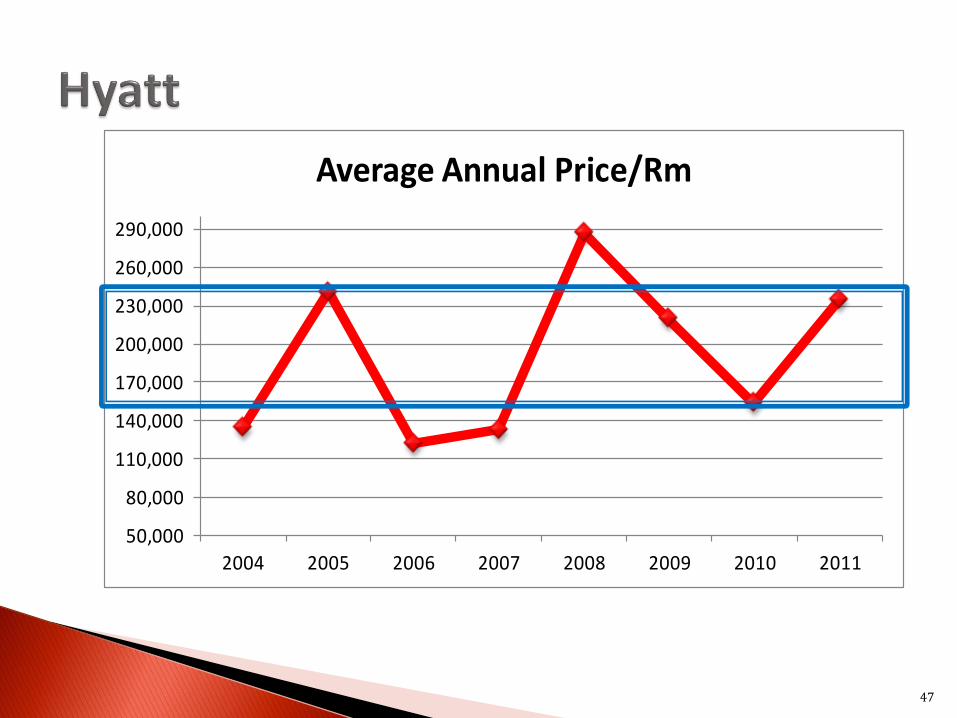
50,000
80,000
110,000
140,000
170,000
200,000
230,000
260,000
290,000
2004 2005 2006 2007 2008 2009 2010 2011
Average Annual Price/Rm

48
50,000
100,000
150,000
200,000
250,000
300,000
350,000
400,000
450,000
2005 2006 2007 2008 2010 2011
Average Annual Price/Room

49
$122,523
$146,374 $150,800
$175,446
$234,182
$0
$50,000
$100,000
$150,000
$200,000
$250,000
Sheraton Hilton Marriott Hyatt Westin
Average Sale Price/Room 2004-2011

50
$50,000
$60,000
$70,000
$80,000
$90,000
$100,000
2004 2005 2006 2007 2008 2009 2010 2011
Average Annual Price Paid/Room

$50,000
$60,000
$70,000
$80,000
$90,000
$100,000
$110,000
$120,000
$130,000
2004 2005 2006 2007 2008 2009 2010 2011
Average Annual Price/Room
51

52
$50,000
$70,000
$90,000
$110,000
$130,000
$150,000
$170,000
$190,000
2004 2005 2006 2007 2008 2009 2010 2011
Average Annual Price/Room

53
$50,000
$70,000
$90,000
$110,000
$130,000
$150,000
$170,000
$190,000
2004 2005 2006 2007 2008 2009 2010 2011
Average Annual Price/Room

54
$80,449
$99,694
$127,430$135,944
$0
$20,000
$40,000
$60,000
$80,000
$100,000
$120,000
$140,000
$160,000
Holiday Inn Express
Hampton Inn Courtyard Hilton Garden Inn
Average Sale Price/Room 2004-2011

55

11.4
15.9
5.4 6.3
12.3
18.3
7.0 8.0
13.6
21.2
7.5 9.1
0
5
10
15
20
25
Unlevered Discount Rate
Equity Yield Cap Rate Historical NOI
Cap Rate Projected Year One NOI
Full Service Select Service Limited Service
Source: HVS

Current U.S. lending parameters for hotels relative to senior debt position:
◦ LTV Ratios 55.0% - 65.0%
◦ Interest Rates 5.0% - 7.5%
◦ Debt Yield Ratio 11.0% - 12.0%

Assets Terminal Cap Overall
Property Yield Equity Yield
Highest Tier (higher barrier to entry- product type/location/quality – top 3% of assets) – TROPHY TYPE
7.0% - 8.0% 9.0% - 9.5% 13.0% - 15.0%
High Quality – not top 3% of hotel assets 8.0% - 9.0% 9.5% - 11.0% 15.0% - 17.0%
Middle Quality 9.0% - 11.0% 11.5% -13.0% 17.0% - 18.0%
Lower Quality 11.0% - 13.0% 13.5% - 16.0% 19.0% - 22.0%
58

59