june 13th june 14th - home | public...
TRANSCRIPT
Newport Beach El Segundo
June 13th June 14th
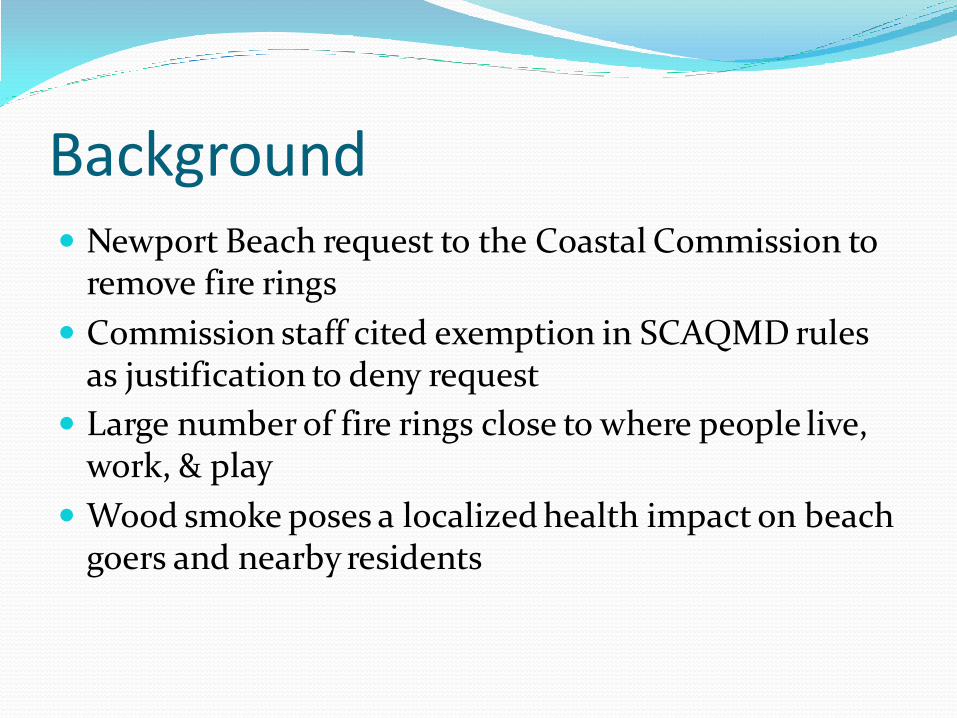
Background Newport Beach request to the Coastal Commission to
remove fire rings
Commission staff cited exemption in SCAQMD rules as justification to deny request
Large number of fire rings close to where people live, work, & play
Wood smoke poses a localized health impact on beach goers and nearby residents
3
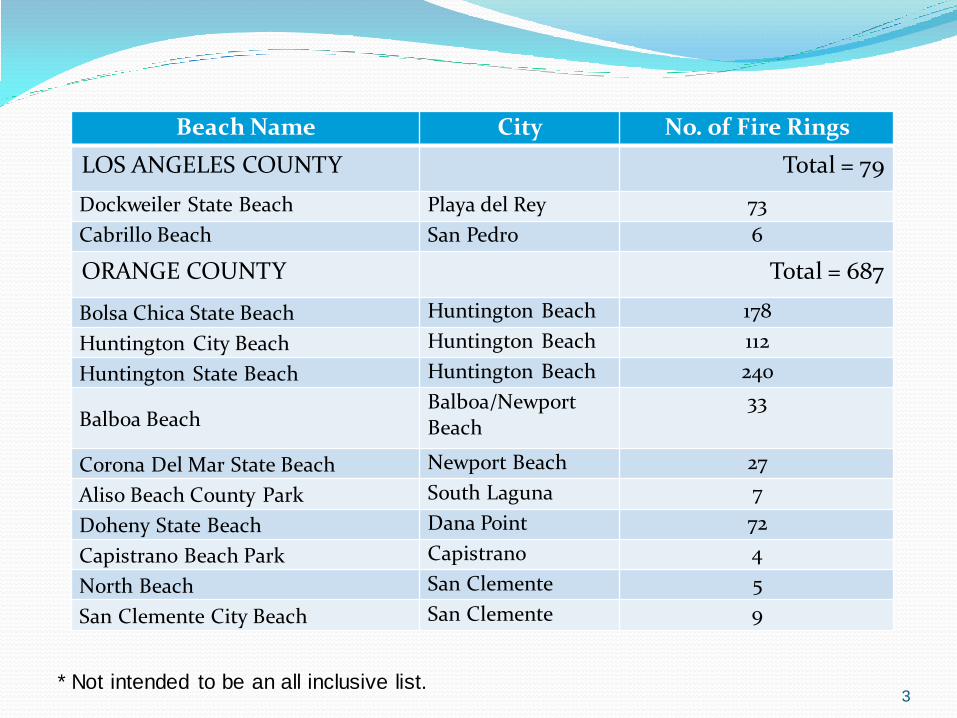
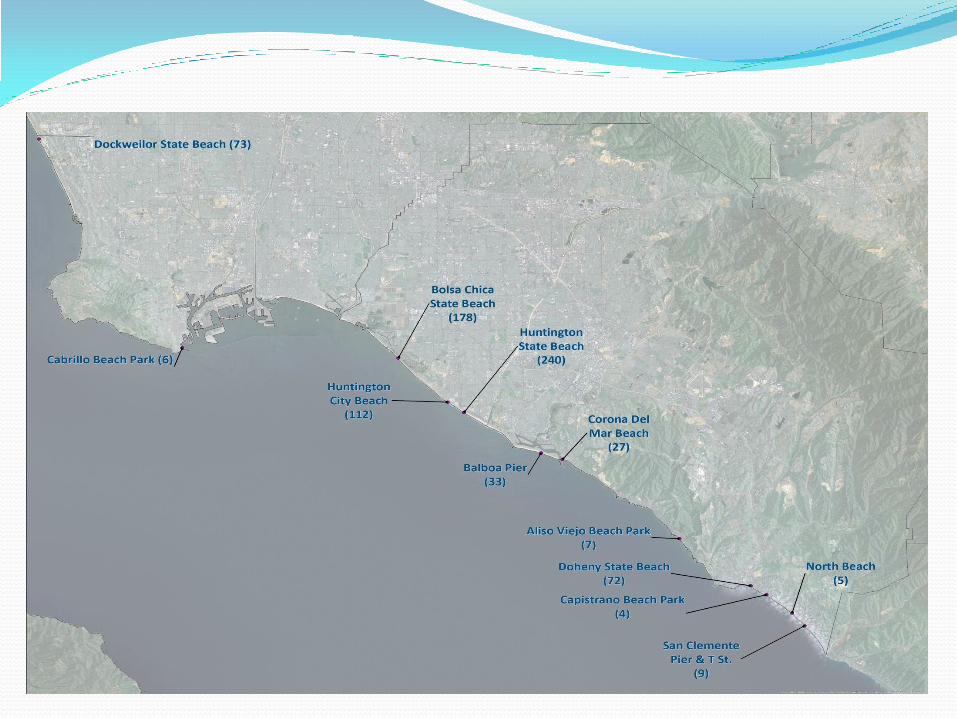
Beach Name City No. of Fire Rings
LOS ANGELES COUNTY Total = 79
Dockweiler State Beach Playa del Rey 73
Cabrillo Beach San Pedro 6
ORANGE COUNTY Total = 687
Bolsa Chica State Beach Huntington Beach 178
Huntington City Beach Huntington Beach 112
Huntington State Beach Huntington Beach 240
Balboa Beach Balboa/Newport Beach
33
Corona Del Mar State Beach Newport Beach 27
Aliso Beach County Park South Laguna 7
Doheny State Beach Dana Point 72
Capistrano Beach Park Capistrano 4
North Beach San Clemente 5
San Clemente City Beach San Clemente 9
* Not intended to be an all inclusive list.
Agency Positions on Wood Smoke
California Air Resources Board
Wood smoke a serious threat to public health
Aggravates lung and heart disease
Can cause 10% increase in children's hospital admissions for respiratory symptoms
U.S. Environmental Protection Agency
Wood smoke can affect everyone
Children, persons with existing health conditions most vulnerable
Health risks can be reduced by switching to gaseous fuels
PM Health Guidance National Ambient Air Quality Standards for PM2.5:
Annual Average: 12 mg/m3
24 Hour Average: 35 mg/m3
Guidance for Public Health Officials for Wildfire Smoke
Recommended protective measures based upon shorter term PM exposure
Includes Time frames as short as 1 to 3 hours
for both PM2.5 and PM10: 89 - 138 mg/m3 - Unhealthy for Sensitive Groups (USG)
139 - 351 mg/m3 - Unhealthy – “consider canceling public events, based on public health and travel considerations”
352 - 526 mg/m3 - Very Unhealthy
Lipsett, Michael and Barbara Materna, Wildfire Smoke A Guide for Public Health Officials, 2008.
Beach Fire Pit Emissions Assessed the emissions of a single fire ring for
one evening
One fire event assumed to burn 2 bundles of wood (approx. 32 lbs total)
Assumed CARB fireplace emission factor
Compared emissions to that of an average on-road 2013 Heavy Duty Diesel Vehicle (HDDV)
One fire pit in one evening estimated to emit as much PM2.5 as one Heavy-Duty Diesel Truck driving 564 miles
SCAQMD Monitoring Studies Purpose
Assess potential for human exposure to wood smoke from beach fires
Approach
Deploy a combination of monitoring technologies and sampling strategies
Other Considerations
Shifting meteorology, variable activity levels, technology limitations
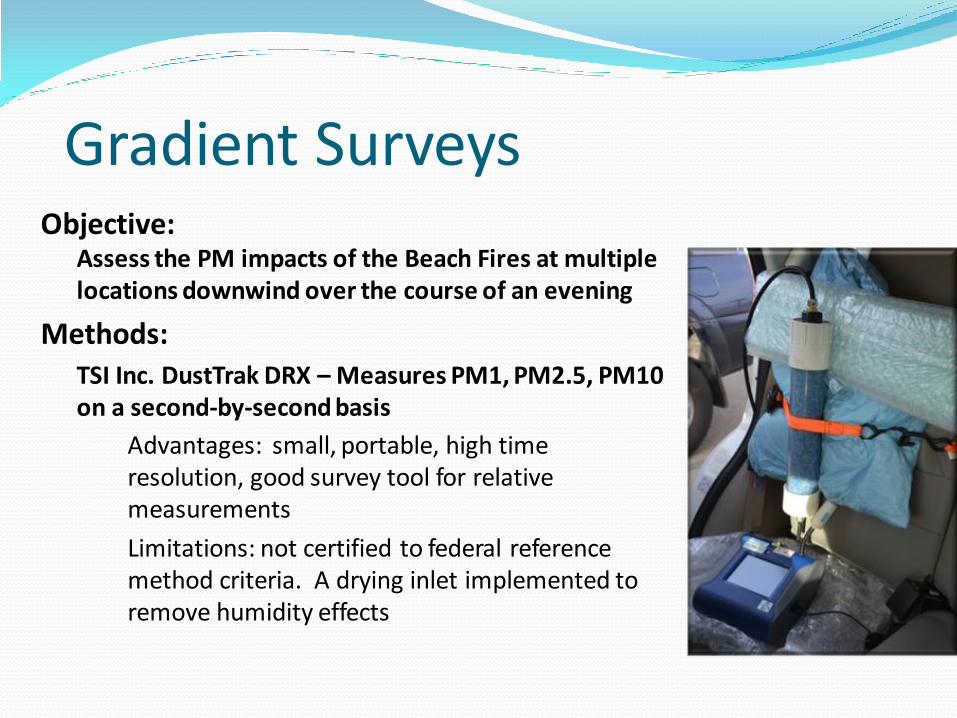
Gradient Surveys Objective:
Assess the PM impacts of the Beach Fires at multiple locations downwind over the course of an evening
Methods:
TSI Inc. DustTrak DRX – Measures PM1, PM2.5, PM10 on a second-by-second basis
Advantages: small, portable, high time resolution, good survey tool for relative measurements
Limitations: not certified to federal reference method criteria. A drying inlet implemented to remove humidity effects
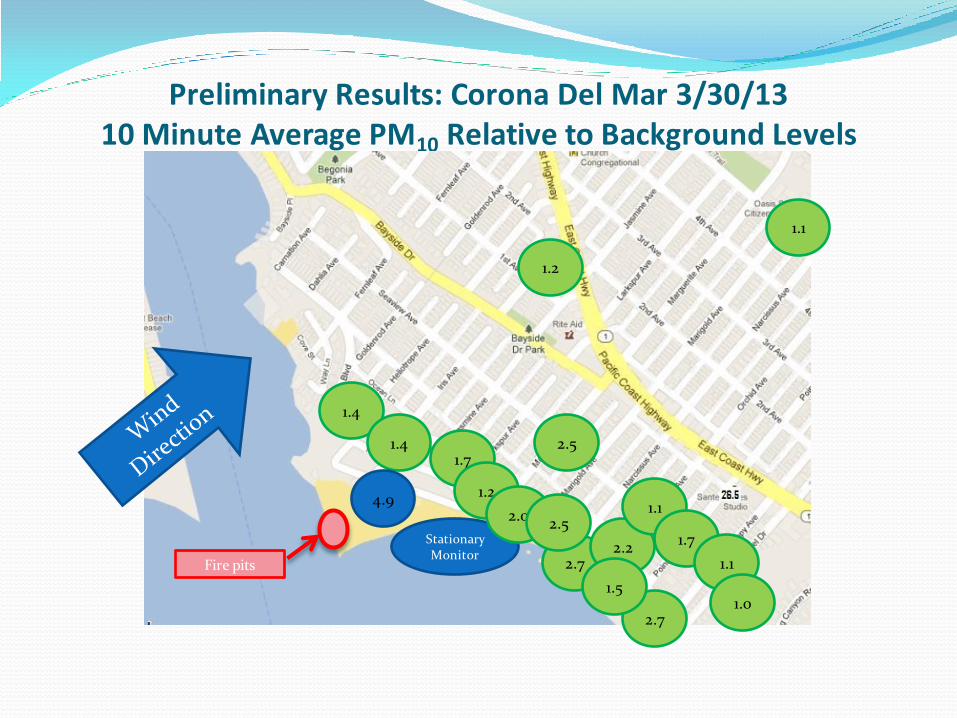
Preliminary Results: Corona Del Mar 3/30/13 10 Minute Average PM10 Relative to Background Levels
Ratios to Lowest Observe Measurement
Fire pits
Stationary Monitor
1.4
1.4
1.2
1.1
2.5
2.7 2.2
2.7
1.5
1.1
1.7
1.1
1.0
1.7
1.2
2.0 2.5
4.9
4.9
3.7
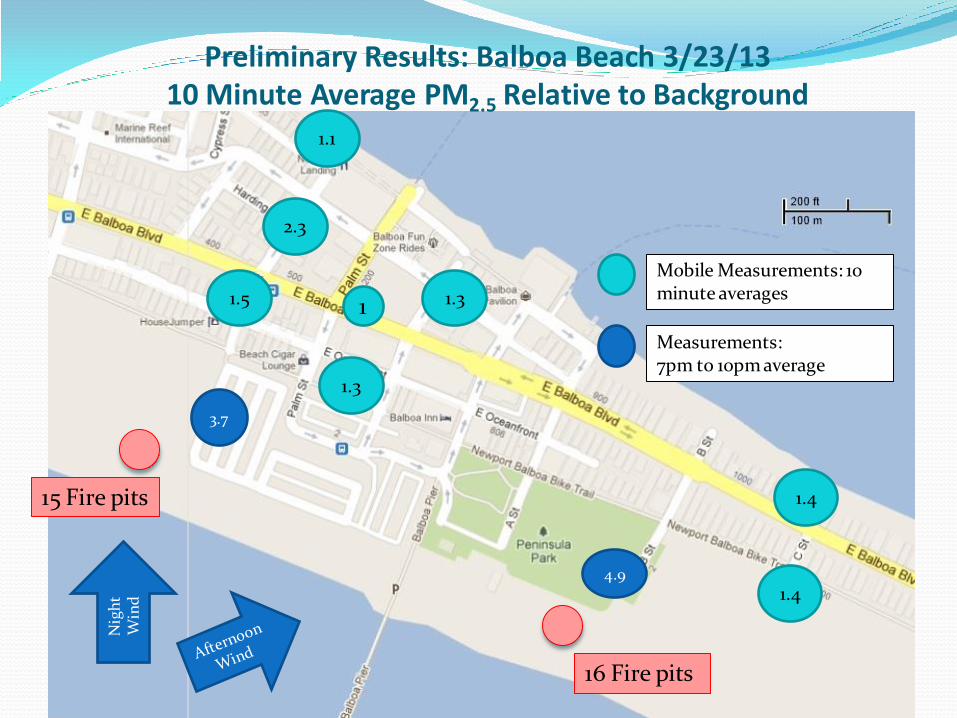
15 Fire pits
16 Fire pits
1
2.3
Nig
ht
Win
d
1.1
1.5 1.3
1.3
1.4
1.4
Mobile Measurements: 10 minute averages
Measurements: 7pm to 10pm average
Preliminary Results: Balboa Beach 3/23/13 10 Minute Average PM2.5 Relative to Background
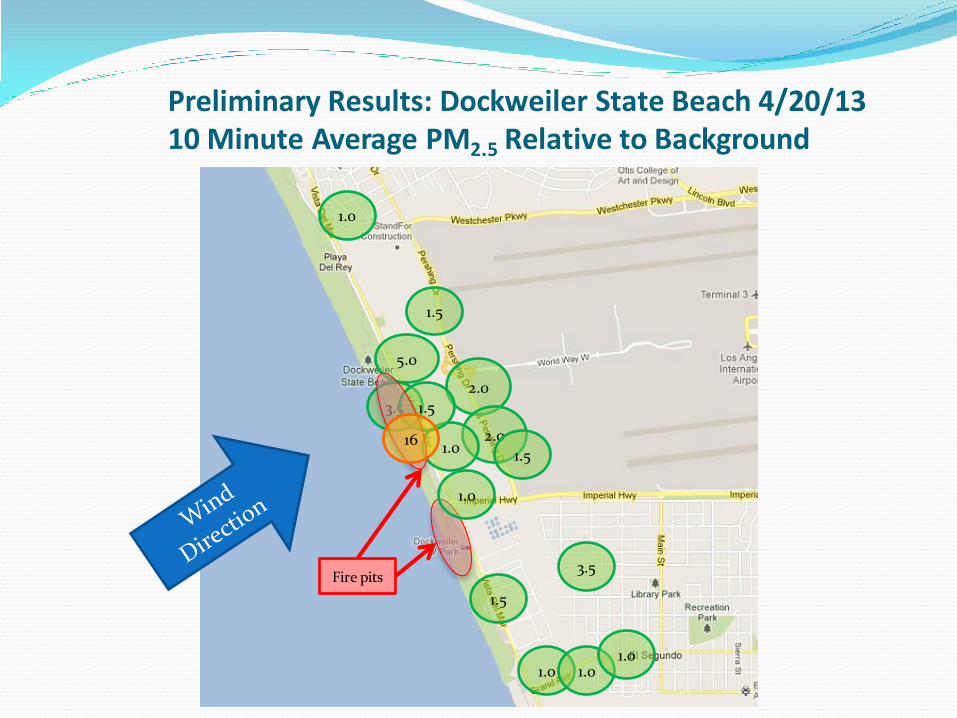
Preliminary Results: Dockweiler State Beach 4/20/13 10 Minute Average PM2.5 Relative to Background
Fire pits
1.5
2.0
1.0
1.5
3.5
5.0
1.0
2.0 1.5
1.0 1.0 1.0
1.0
3.5 1.5
16
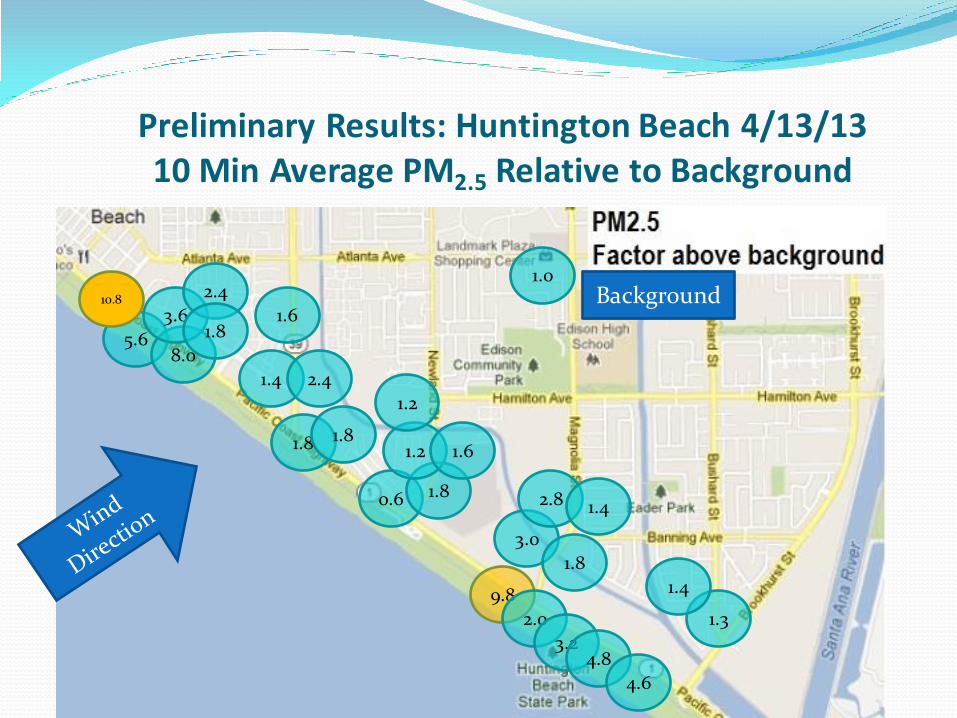
Preliminary Results: Huntington Beach 4/13/13 10 Min Average PM2.5 Relative to Background
5.6 8.0
1.4
3.6 10.8
0.6
2.4
2.4
1.6
1.8
1.8
1.8 1.8 1.2 1.6
1.2
1.0 Background
9.8
2.0
3.2
3.0
1.8
2.8 1.4
4.8
4.6
1.3
1.4
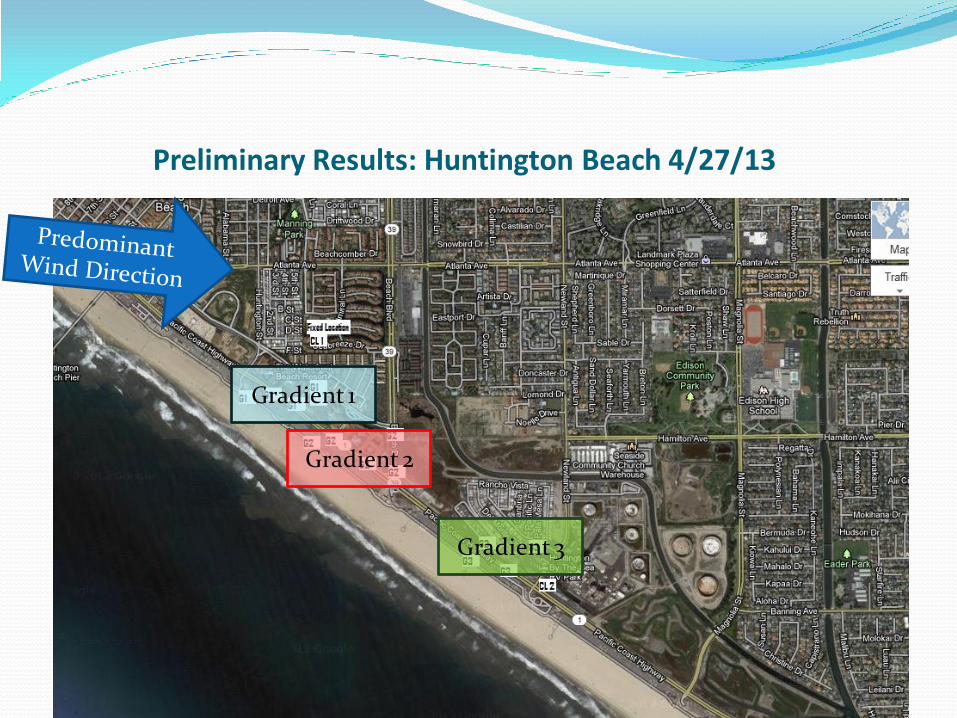
Preliminary Results: Huntington Beach 4/27/13
Gradient 1
Gradient 2
Gradient 3
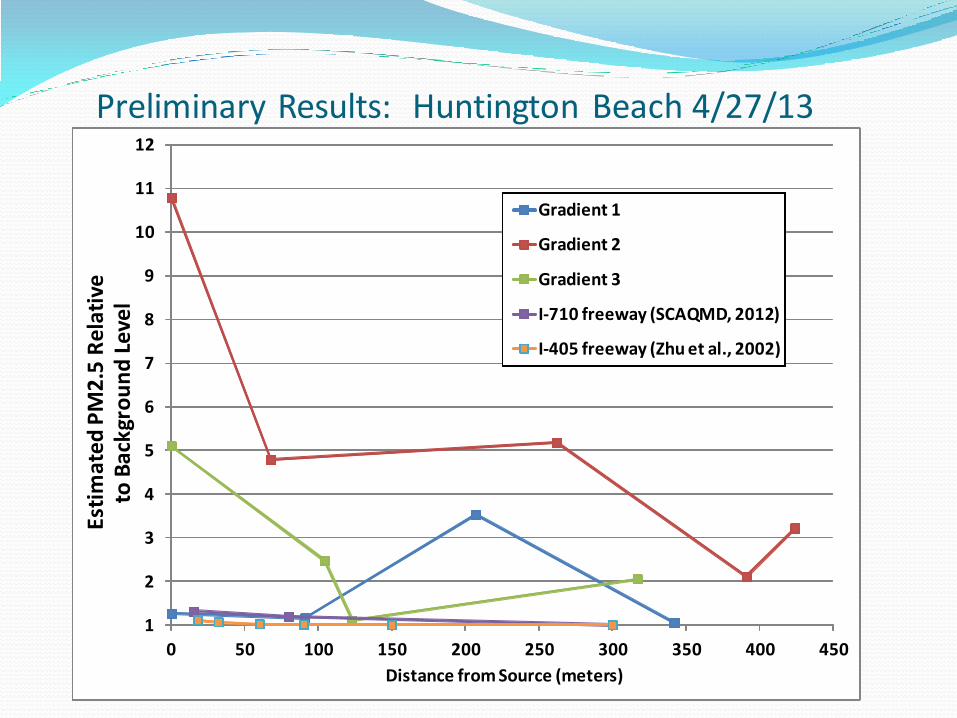
Preliminary Results: Huntington Beach 4/27/13
1
2
3
4
5
6
7
8
9
10
11
12
0 50 100 150 200 250 300 350 400 450
Esti
mat
ed P
M2
.5 R
elat
ive
to B
ackg
rou
nd
Lev
el
Distance from Source (meters)
Gradient 1
Gradient 2
Gradient 3
I - 710 freeway (SCAQMD, 2012)
I - 405 freeway (Zhu et al., 2002)
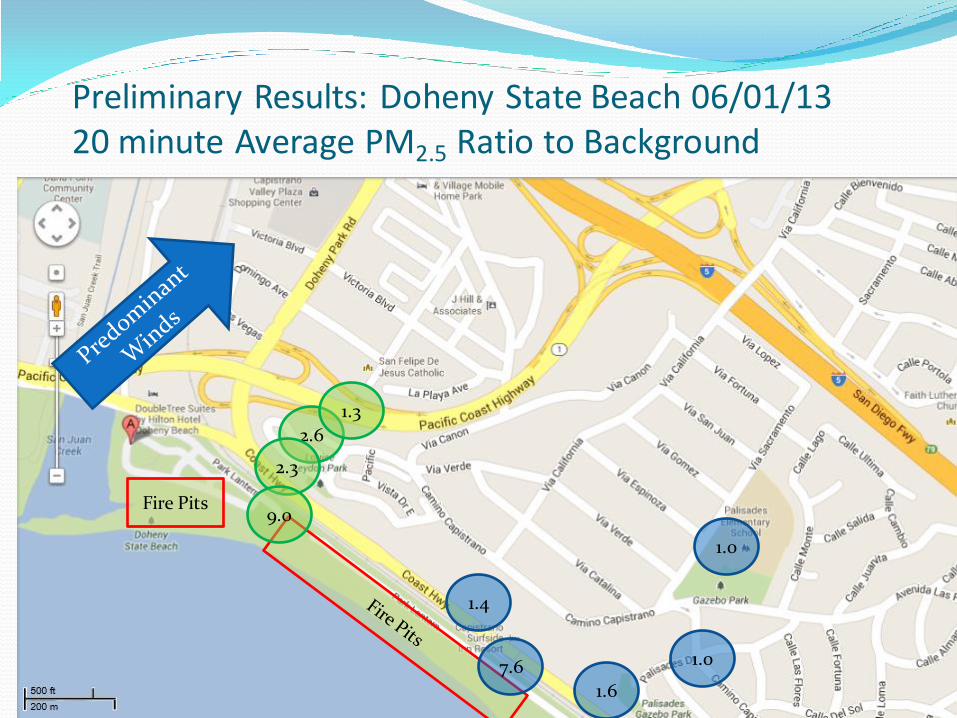
Preliminary Results: Doheny State Beach 06/01/13 20 minute Average PM2.5 Ratio to Background
2.6
1.4
1.6
1.0
1.0
2.3
1.3
Fire Pits
7.6
9.0
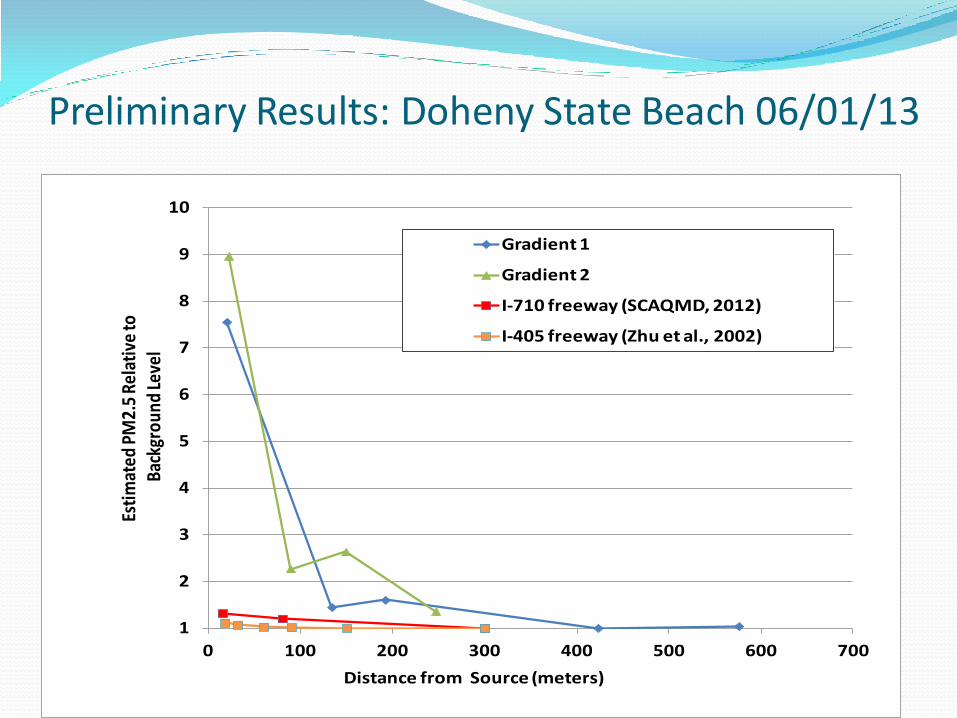
Preliminary Results: Doheny State Beach 06/01/13
1
2
3
4
5
6
7
8
9
10
0 100 200 300 400 500 600 700
Esti
mat
ed P
M2.
5 Re
lati
ve to
Back
grou
nd Le
vel
Distance from Source (meters)
Gradient 1
Gradient 2
I-710 freeway (SCAQMD, 2012)
I-405 freeway (Zhu et al., 2002)
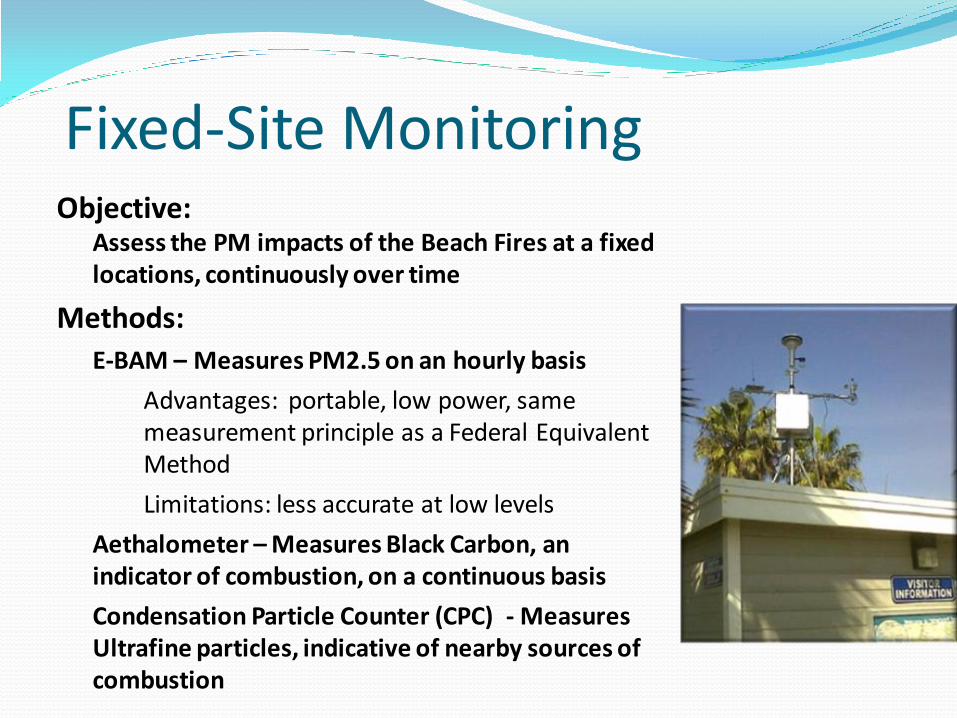
Fixed-Site Monitoring Objective:
Assess the PM impacts of the Beach Fires at a fixed locations, continuously over time
Methods:
E-BAM – Measures PM2.5 on an hourly basis
Advantages: portable, low power, same measurement principle as a Federal Equivalent Method
Limitations: less accurate at low levels
Aethalometer – Measures Black Carbon, an indicator of combustion, on a continuous basis
Condensation Particle Counter (CPC) - Measures Ultrafine particles, indicative of nearby sources of combustion
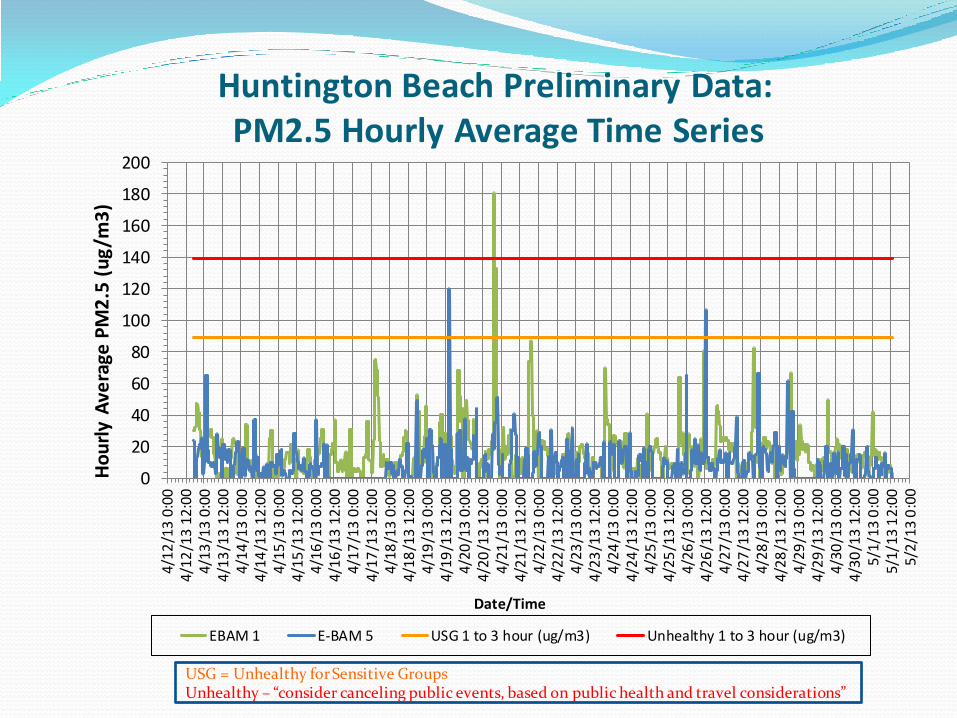
Huntington Beach Preliminary Data: PM2.5 Hourly Average Time Series
0
20
40
60
80
100
120
140
160
180
2004/
12/1
3 0:
004
/12
/13
12
:00
4/13
/13
0:00
4/1
3/1
3 1
2:0
04/
14/1
3 0:
004
/14
/13
12
:00
4/15
/13
0:00
4/1
5/1
3 1
2:0
04/
16/1
3 0:
004
/16
/13
12
:00
4/17
/13
0:00
4/1
7/1
3 1
2:0
04/
18/1
3 0:
004
/18
/13
12
:00
4/19
/13
0:00
4/1
9/1
3 1
2:0
04/
20/1
3 0:
004
/20
/13
12
:00
4/21
/13
0:00
4/2
1/1
3 1
2:0
04/
22/1
3 0:
004
/22
/13
12
:00
4/23
/13
0:00
4/2
3/1
3 1
2:0
04/
24/1
3 0:
004
/24
/13
12
:00
4/25
/13
0:00
4/2
5/1
3 1
2:0
04/
26/1
3 0:
004
/26
/13
12
:00
4/27
/13
0:00
4/2
7/1
3 1
2:0
04/
28/1
3 0:
004
/28
/13
12
:00
4/29
/13
0:00
4/2
9/1
3 1
2:0
04/
30/1
3 0:
004
/30
/13
12
:00
5/1
/13
0:0
05/
1/13
12:
005
/2/1
3 0
:00
Ho
url
y A
vera
ge P
M2
.5 (
ug
/m3
)
Date/Time
EBAM 1 E-BAM 5 USG 1 to 3 hour (ug/m3) Unhealthy 1 to 3 hour (ug/m3)
USG = Unhealthy for Sensitive Groups Unhealthy – “consider canceling public events, based on public health and travel considerations”
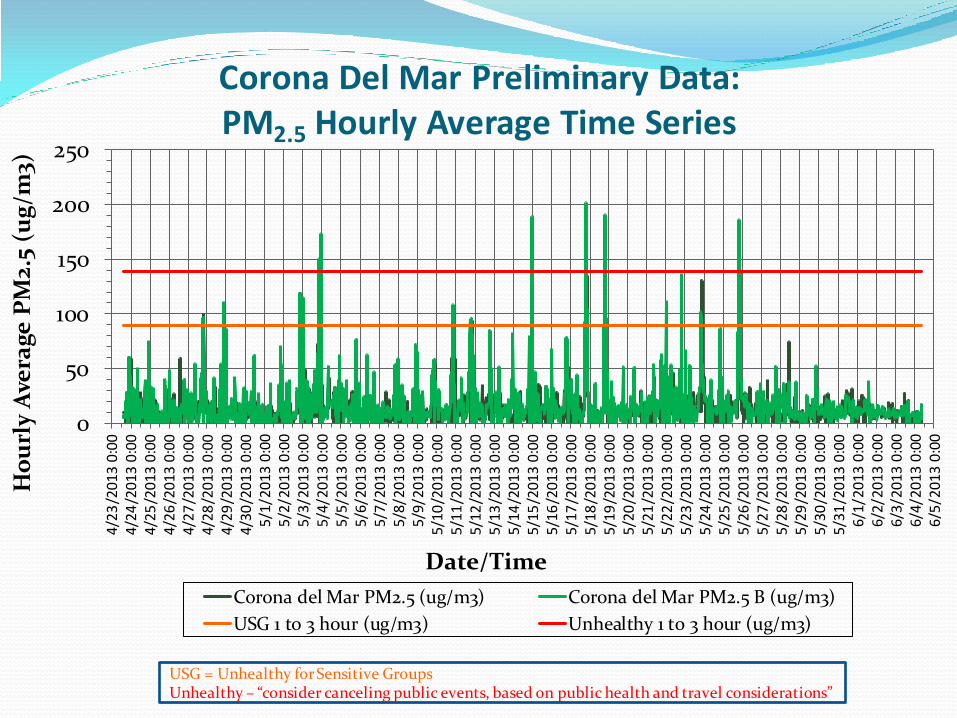
Corona Del Mar Preliminary Data: PM2.5 Hourly Average Time Series
USG = Unhealthy for Sensitive Groups Unhealthy – “consider canceling public events, based on public health and travel considerations”
0
50
100
150
200
250
4/23
/201
3 0:
004/
24/2
013
0:00
4/25
/201
3 0:
004/
26/2
013
0:00
4/27
/201
3 0:
004/
28/2
013
0:00
4/29
/201
3 0:
004/
30/2
013
0:00
5/1
/20
13
0:0
05
/2/2
01
3 0
:00
5/3
/20
13
0:0
05
/4/2
01
3 0
:00
5/5
/20
13
0:0
05
/6/2
01
3 0
:00
5/7
/20
13
0:0
05
/8/2
01
3 0
:00
5/9
/20
13
0:0
05/
10/2
013
0:00
5/11
/201
3 0:
005/
12/2
013
0:00
5/13
/201
3 0:
005/
14/2
013
0:00
5/15
/201
3 0:
005/
16/2
013
0:00
5/17
/201
3 0:
005/
18/2
013
0:00
5/19
/201
3 0:
005/
20/2
013
0:00
5/21
/201
3 0:
005/
22/2
013
0:00
5/23
/201
3 0:
005/
24/2
013
0:00
5/25
/201
3 0:
005/
26/2
013
0:00
5/27
/201
3 0:
005/
28/2
013
0:00
5/29
/201
3 0:
005/
30/2
013
0:00
5/31
/201
3 0:
006
/1/2
01
3 0
:00
6/2
/20
13
0:0
06
/3/2
01
3 0
:00
6/4
/20
13
0:0
06
/5/2
01
3 0
:00
Ho
url
y A
vera
ge P
M2.
5 (u
g/m
3)
Date/Time
Corona del Mar PM2.5 (ug/m3) Corona del Mar PM2.5 B (ug/m3)
USG 1 to 3 hour (ug/m3) Unhealthy 1 to 3 hour (ug/m3)
0
20
40
60
80
100
120
140
4/2
7/2
01
3 0
:00
4/2
7/2
01
3 6
:00
4/27
/201
3 12
:00
4/27
/201
3 18
:00
4/2
8/2
01
3 0
:00
4/2
8/2
01
3 6
:00
4/28
/201
3 12
:00
4/28
/201
3 18
:00
4/2
9/2
01
3 0
:00
4/2
9/2
01
3 6
:00
4/29
/201
3 12
:00
4/29
/201
3 18
:00
4/3
0/2
01
3 0
:00
4/3
0/2
01
3 6
:00
4/30
/201
3 12
:00
4/30
/201
3 18
:00
5/1/
2013
0:0
0
Ho
url
y A
vera
ge P
M2.
5 (u
g/m
3 )
Date/Time
Corona del Mar PM2.5 (ug/m3) Corona del Mar PM2.5 B (ug/m3)
USG 1 to 3 hour (ug/m3) Unhealthy 1 to 3 hour (ug/m3)
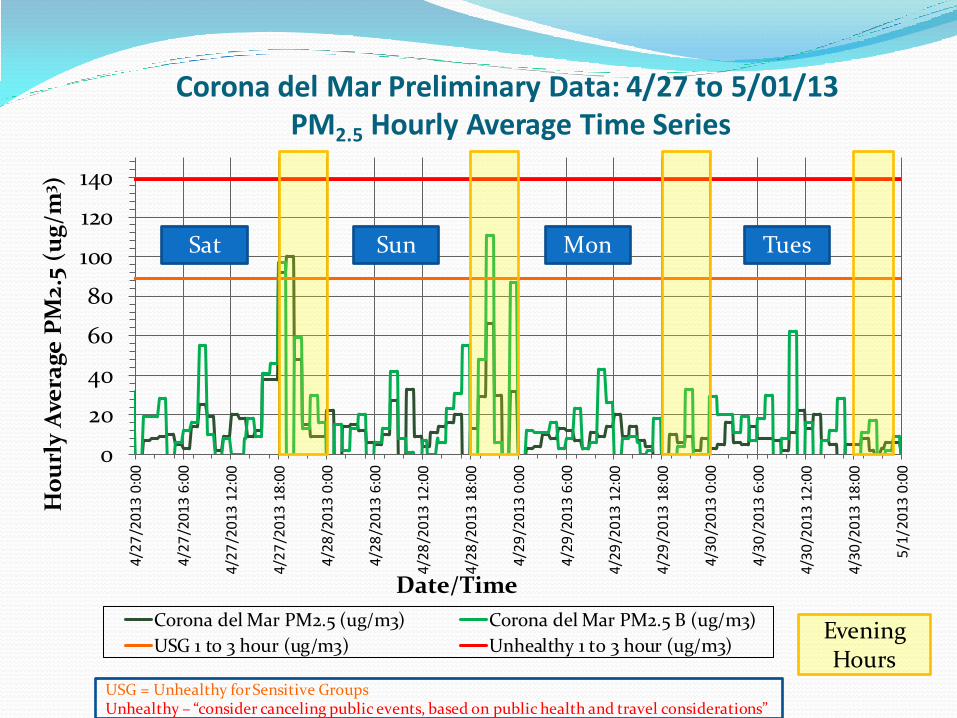
Corona del Mar Preliminary Data: 4/27 to 5/01/13 PM2.5 Hourly Average Time Series
Evening Hours
Sat Sun Mon Tues
USG = Unhealthy for Sensitive Groups Unhealthy – “consider canceling public events, based on public health and travel considerations”
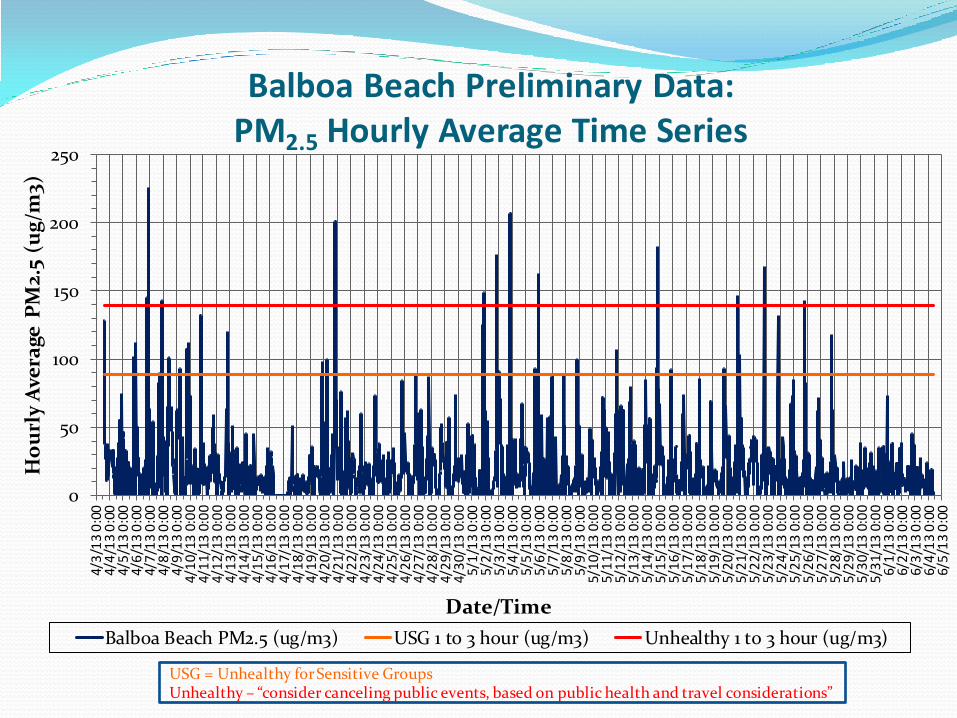
Balboa Beach Preliminary Data: PM2.5 Hourly Average Time Series
USG = Unhealthy for Sensitive Groups Unhealthy – “consider canceling public events, based on public health and travel considerations”
0
50
100
150
200
250
4/3
/13
0:0
04/
4/1
3 0
:00
4/5
/13
0:0
04/
6/1
3 0
:00
4/7
/13
0:0
04/
8/1
3 0
:00
4/9
/13
0:0
04/
10/
13 0
:00
4/1
1/13
0:0
04/
12/
13 0
:00
4/1
3/13
0:0
04/
14/
13 0
:00
4/1
5/13
0:0
04/
16/
13 0
:00
4/1
7/13
0:0
04/
18/
13 0
:00
4/1
9/13
0:0
04/
20/
13 0
:00
4/2
1/13
0:0
04/
22/
13 0
:00
4/2
3/13
0:0
04/
24/
13 0
:00
4/2
5/13
0:0
04/
26/
13 0
:00
4/2
7/13
0:0
04/
28/
13 0
:00
4/2
9/13
0:0
04/
30/
13 0
:00
5/1
/13
0:0
05/
2/1
3 0
:00
5/3
/13
0:0
05/
4/1
3 0
:00
5/5
/13
0:0
05/
6/1
3 0
:00
5/7
/13
0:0
05/
8/1
3 0
:00
5/9
/13
0:0
05/
10/
13 0
:00
5/1
1/13
0:0
05/
12/
13 0
:00
5/1
3/13
0:0
05/
14/
13 0
:00
5/1
5/13
0:0
05/
16/
13 0
:00
5/1
7/13
0:0
05/
18/
13 0
:00
5/1
9/13
0:0
05/
20/
13 0
:00
5/2
1/13
0:0
05/
22/
13 0
:00
5/2
3/13
0:0
05/
24/
13 0
:00
5/2
5/13
0:0
05/
26/
13 0
:00
5/2
7/13
0:0
05/
28/
13 0
:00
5/2
9/13
0:0
05/
30/
13 0
:00
5/3
1/13
0:0
06/
1/1
3 0
:00
6/2
/13
0:0
06/
3/1
3 0
:00
6/4
/13
0:0
06/
5/1
3 0
:00
Ho
url
y A
vera
ge P
M2.
5 (u
g/m
3)
Date/Time
Balboa Beach PM2.5 (ug/m3) USG 1 to 3 hour (ug/m3) Unhealthy 1 to 3 hour (ug/m3)
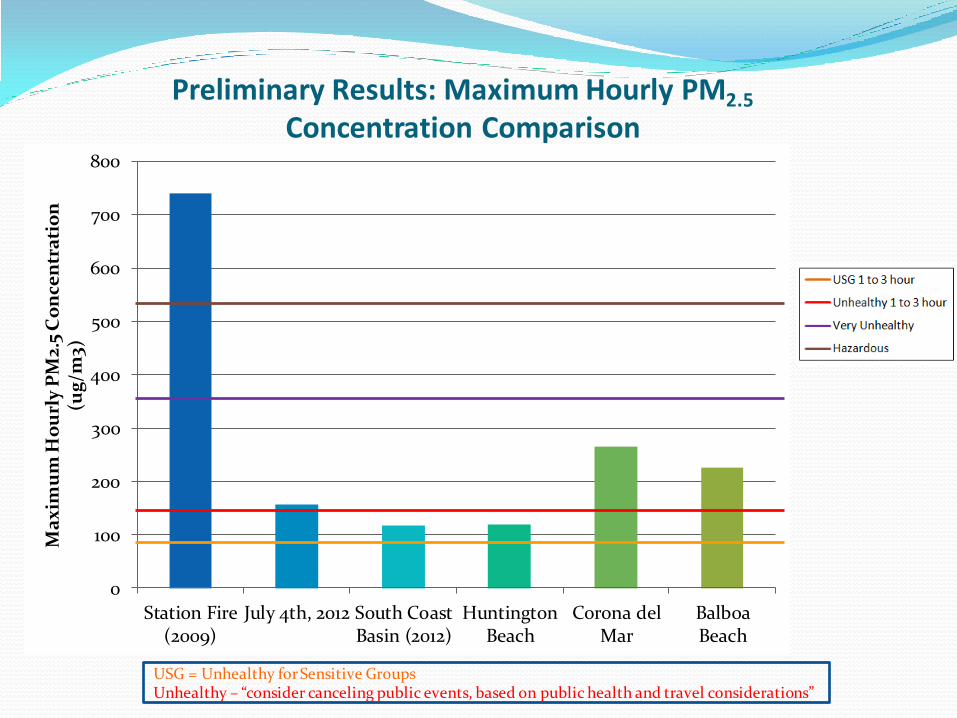
Preliminary Results: Maximum Hourly PM2.5
Concentration Comparison
0
100
200
300
400
500
600
700
800
Station Fire(2009)
July 4th, 2012 South CoastBasin (2012)
HuntingtonBeach
Corona delMar
BalboaBeach
Ma
xim
um
Ho
url
y P
M2.
5 C
on
cen
tra
tio
n
(ug
/m3)
USG = Unhealthy for Sensitive Groups Unhealthy – “consider canceling public events, based on public health and travel considerations”
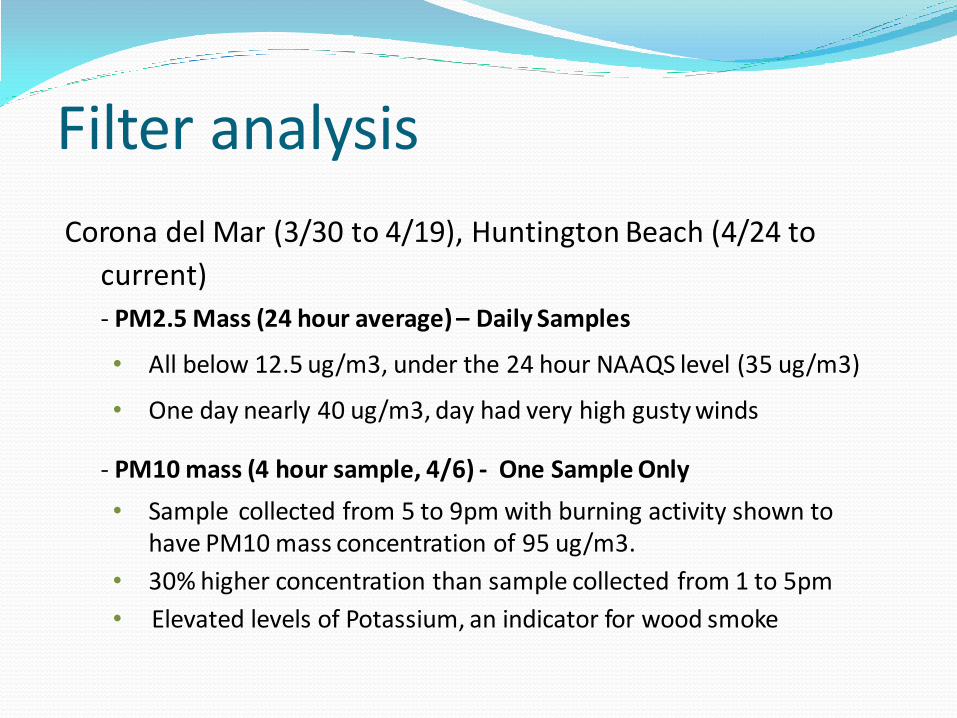
Filter analysis
Corona del Mar (3/30 to 4/19), Huntington Beach (4/24 to
current) - PM2.5 Mass (24 hour average) – Daily Samples
• All below 12.5 ug/m3, under the 24 hour NAAQS level (35 ug/m3)
• One day nearly 40 ug/m3, day had very high gusty winds
- PM10 mass (4 hour sample, 4/6) - One Sample Only
• Sample collected from 5 to 9pm with burning activity shown to have PM10 mass concentration of 95 ug/m3.
• 30% higher concentration than sample collected from 1 to 5pm
• Elevated levels of Potassium, an indicator for wood smoke
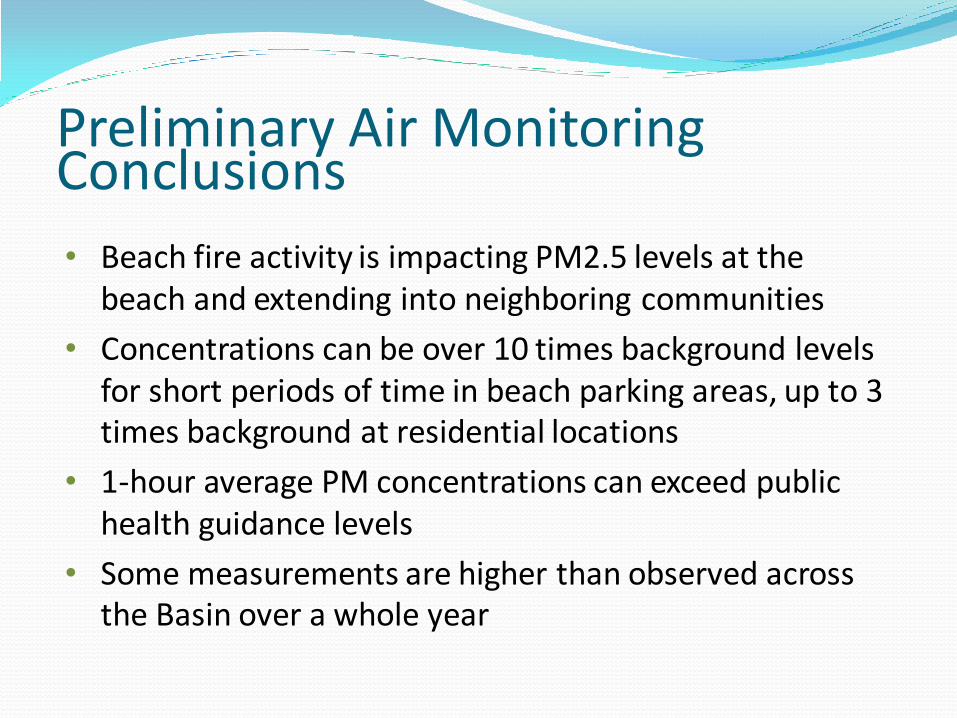
Preliminary Air Monitoring Conclusions
• Beach fire activity is impacting PM2.5 levels at the beach and extending into neighboring communities
• Concentrations can be over 10 times background levels for short periods of time in beach parking areas, up to 3 times background at residential locations
• 1-hour average PM concentrations can exceed public health guidance levels
• Some measurements are higher than observed across the Basin over a whole year
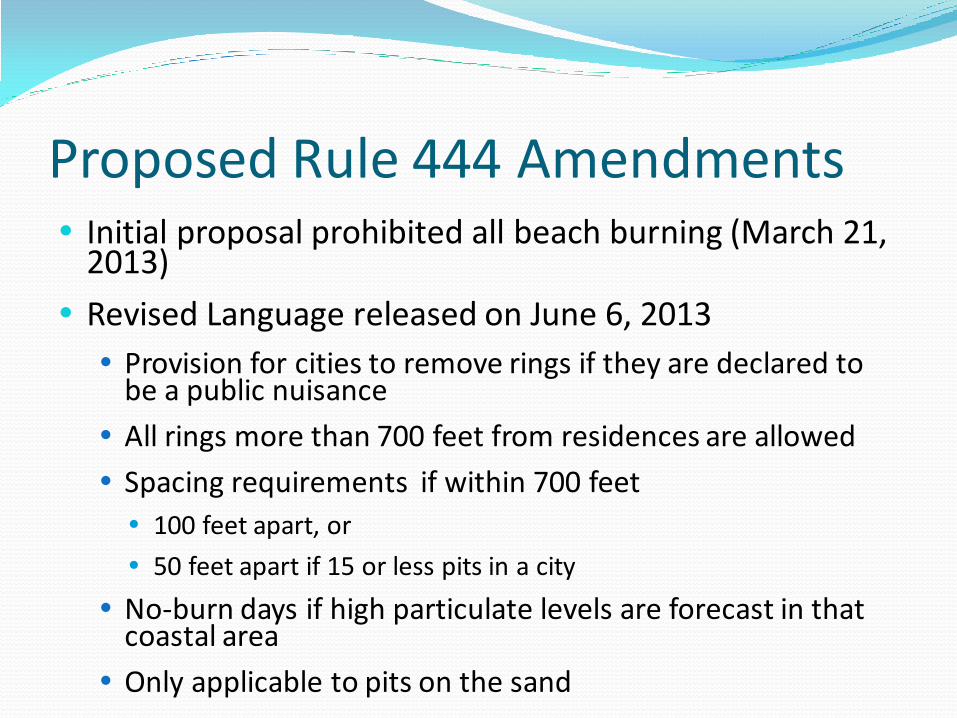
Proposed Rule 444 Amendments Initial proposal prohibited all beach burning (March 21,
2013)
Revised Language released on June 6, 2013
Provision for cities to remove rings if they are declared to be a public nuisance
All rings more than 700 feet from residences are allowed
Spacing requirements if within 700 feet
100 feet apart, or
50 feet apart if 15 or less pits in a city
No-burn days if high particulate levels are forecast in that coastal area
Only applicable to pits on the sand
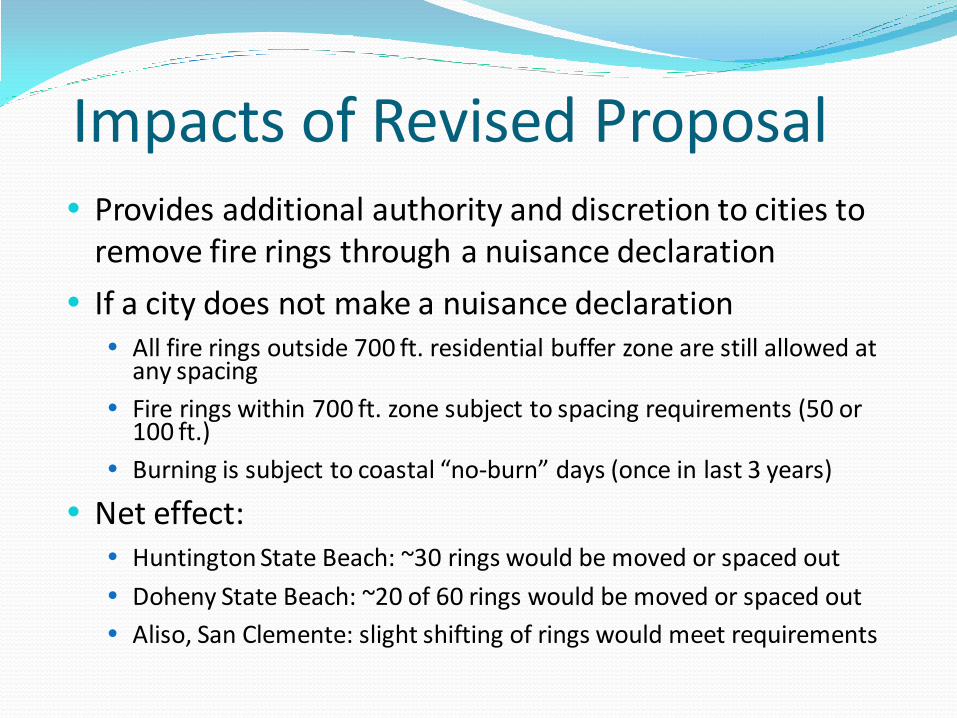
Impacts of Revised Proposal Provides additional authority and discretion to cities to
remove fire rings through a nuisance declaration
If a city does not make a nuisance declaration All fire rings outside 700 ft. residential buffer zone are still allowed at
any spacing
Fire rings within 700 ft. zone subject to spacing requirements (50 or 100 ft.)
Burning is subject to coastal “no-burn” days (once in last 3 years)
Net effect: Huntington State Beach: ~30 rings would be moved or spaced out
Doheny State Beach: ~20 of 60 rings would be moved or spaced out
Aliso, San Clemente: slight shifting of rings would meet requirements
Next steps • Seek public input
• Continue field sampling as necessary
• Continue to report findings to public as they become available
• Continue to work with potentially impacted cities and state parks
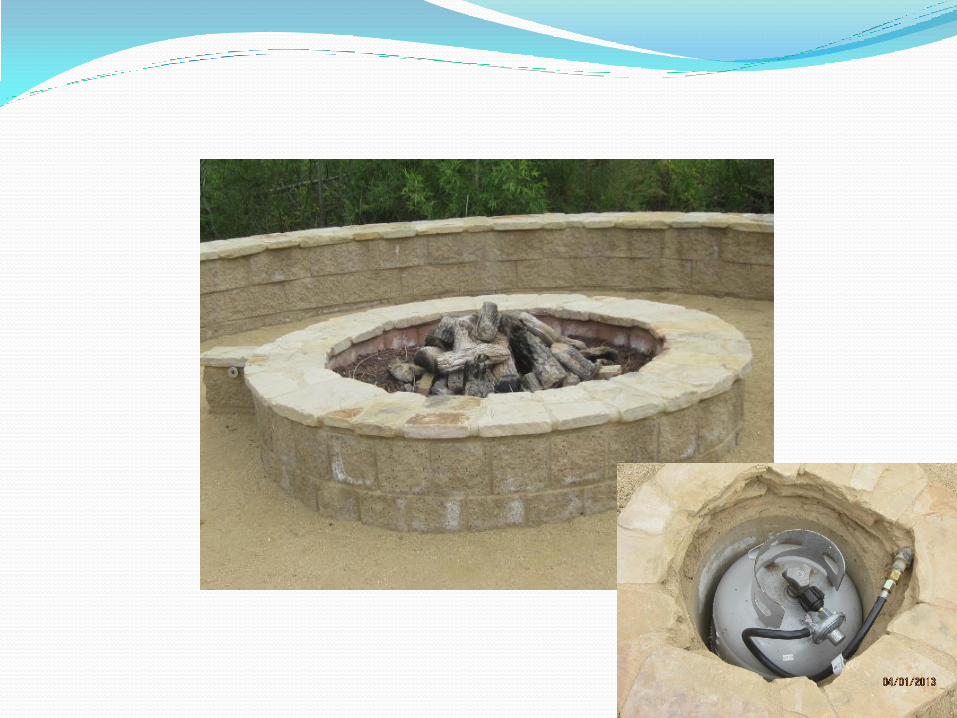
• Demonstration project for propane and natural gas beach fire options
• Public Hearing scheduled for July 12, 2013