june 2, 2017 eclerx services (eclser) |...
TRANSCRIPT
June 2, 2017
ICICI Securities Ltd | Retail Equity Research
Result Update
FY18E set to witness subdued growth…
eClerx Services (eClerx) reported its Q4FY17 earnings where US
dollar revenue and EBITDA margin were above our estimates
US$ revenues grew 1.5% QoQ to $47.9 million, above our 0.3% QoQ
decline and $47.1 million estimate. Constant currency revenues grew
1.6% QoQ
Revenues in rupees grew 2.1% QoQ at | 331.5 crore and were above
our 0.7% decline and | 322.4 crore estimate
At 33.7%, EBITDA margins expanded 160 bps QoQ and were way
above our estimate of 32%
Reported PAT of | 75 crore was in line with our | 75 crore estimate
led by revenue and margin beat offset by lower other income
Revenue headwinds to persist till Q2FY18…
eClerx reported 1.5% QoQ growth in dollar revenues, after four
consecutive declines. Growth in the quarter was led by strong growth in
emerging clients (non-Top 10), which grew 9.9% QoQ on top of last three
quarter’s sequential decline while top 10 clients (74% of revenue)
witnessed a continuous decline for a fifth consecutive quarter. The
management expects revenue headwinds to be prolonged till Q2FY18,
which were earlier expected to persist till Q1FY18 mainly due to re-
shoring of work by a large client. Overall, FY18E is expected to witness
subdued growth. Consequently, we expect dollar revenues to report 4%
CAGR in FY17-19E.
Lower employee cost leads to beat in EBITDA margins expectation…
At 33.7%, EBITDA margins grew 160 bps QoQ and were way above our
32% estimate mainly on account of higher rupee realisation and lower
employee cost (declined 1.7% QoQ). eClerx would have usual wage hike
cycle in Q1 with wage revision of high single digit to India staff and low
single digit for onshore staff thereby impacting margins in Q1FY18. The
management maintained its expectation of ~30% target for EBIT margin
for FY18E despite a continued ramp up in onshore capabilities and
sequential revenue decline in Q2FY18.
Emerging accounts break their declining streak; top 10 still weak…
Weakness continued in top 10 customers (74% of revenue) for a fifth
consecutive quarter with revenues down 1.2% QoQ impacting overall
growth. Emerging accounts broke their declining trajectory of last three
quarters and grew strongly at 9.9% supporting topline growth. Going
ahead, the management expects emerging accounts to put up a better
performance on the back of stronger deal pipeline than top five accounts
that are expected to be affected by re-shoring of work in top accounts.
Continued weakness in top 10 clients and weak outlook; maintain SELL…
Continued weakness among top 10 clients and revenue dip in Q2FY18
indicates a soft revenue growth in FY18E. Moreover, the wage hike
impact in Q1, revenue weakness in Q2 and ramp up in onshoring
capabilities leaves limited levers for margin expansion. Hence, we
maintain our SELL recommendation on the stock with a revised target
price of | 1145 (vs. earlier | 1300) based on13x FY19 EPS. We expect
eClerx’ rupee revenues to grow only ~3% in FY17-19E.
eClerx Services (ECLSER) | 1290
Rating matrix
Rating : Sell
Target : | 1145
Target Period : 12 months
Potential Upside : -11%
What’s changed?
Target Changed from | 1,300 to | 1,145
EPS FY18E Changed from | 92.6 to | 79.5
EPS FY19E Introduced at | 88
Rating Unchanged
Quarterly performance
Q4FY17 Q4FY16 YoY (%) Q3FY17 QoQ (%)
Revenue 332 343 (3.4) 325 2.1
EBITDA 112 141 (20.7) 104 7.1
EBITDA (%) 33.7 41.0 -733 bps 32.1 155 bps
PAT 75 108 (30.7) 86 (12.7)
Key financials
| Crore FY16 FY17P FY18E FY19E
Net Sales 1,314 1,330 1,281 1,406
EBITDA 487 469 446 492
Net Profit 364 354 319 353
EPS (|) 87.9 88.4 79.5 88.0
Valuation summary
FY16 FY17P FY18E FY19E
P/E 14.7 14.6 16.2 14.7
Target P/E 13.0 13.0 14.4 13.0
EV / EBITDA 9.8 9.9 10.2 9.0
P/BV 4.9 4.3 3.9 3.5
RoNW (%) 33.5 29.5 23.9 23.9
RoCE (%) 42.6 35.4 31.2 31.2
Stock data
Particular Amount
Market Capitalization (| Crore) 5,318.1
Total Debt (| Crore) -
Cash and Investments (| Crore) 606.0
EV (| Crore) 4,772.2
52 week H/L 1775 / 1260
Equity capital 40.9
Face value 10.0
Price performance
1M 3M 6M 12M
Cyient (6.2) 6.5 3.6 8.0
Persistent 0.1 (8.0) (1.4) (19.6)
eClerx 0.2 (6.3) (10.9) (7.2)
Mastek 5.2 46.5 111.0 99.2
Research Analysts
Deepak Purswani, CFA
Deepti Tayal

ICICI Securities Ltd | Retail Equity Research Page 2
Variance analysis
Q4FY17 Q4FY17E Q4FY16 YoY (%) Q3FY17 QoQ (%) Comments
Revenue 331.5 322.4 343.2 -3.4 324.7 2.1 $ revenues grew 1.5% QoQ and were above our expectation
Employee expenses 131.6 133.8 118.9 10.7 133.9 -1.7
Gross Margin 199.9 188.6 224.3 -10.9 190.8 4.8
Gross margin (%) 60.3 58.5 65.4 -505 bps 58.8 155 bps
SG&A expenses 88.3 85.4 83.6 5.6 86.5 2.1
EBITDA 111.6 103.2 140.7 -20.7 104.3 7.1
EBITDA Margin (%) 33.7 32.0 41.0 -733 bps 32.1 155 bps EBITDA margins expanded 160 bps led by decline in employee cost
Depreciation & amortisation 13.7 6.5 13.8 -0.7 13.4 2.2
EBIT 97.9 96.6 126.9 -22.8 90.9 7.8
EBIT Margin (%) 29.5 30.0 37.0 -744 bps 28.0 155 bps
Other income (less interest) -7.2 0.7 9.0 -224.4 11.3 -163.5
PBT 90.7 97.4 135.8 -33.2 102.2 -11.2
Tax paid 15.9 22.4 27.6 -42.5 16.2 -2.0
PAT 75.0 75.0 108.2 -30.7 85.9 -12.7
PAT was in line with our expectations led by revenue and margin beat offset
by lower other income
Key Metrics
Closing employees 8,737 8,700 8,862 -1.4 8,648 1.0 Sequentially, headcount increased by 89
Attrition (%) 34.3 35.0 28.6 570 bps 33.1 120 bps Attrition grew QoQ and stands at elevated levels
Utilisation (%) 68.9 70.0 67.7 116 bps 68.9 0 bps
Average $/| 68.8 68.5 66.5 3.5 68.2 0.8
Source: Company, ICICIdirect.com Research
Change in estimates
FY18E FY19E
(| Crore) Old New % Change Introduced
Revenue 1,398 1,281 -8.4 1,406
EBITDA 510 446 -12.7 492
EBITDA Margin (%) 36.5 34.8 -171 bps 35.0
PAT 382 319 -16.6 353
EPS (|) 93 79 -14.2 88 Tweaked our estimates to incorporate management commentory for FY18E
Source: Company, ICICIdirect.com Research
Assumptions
Current Earlier Introduced
FY15 FY16 FY17P FY18E FY18E FY19E
Closing employees 8,100 8,862 8,737 8,837 8,848 9,244
Attrition (%) 28.3 33.1 34.8 35.0 30.0 35.0
Utilisation (%) 73.0 76.9 78.3 77.0 67.0 79.0
Average $/| 61.2 66.0 68.5 65.9 69.0 67.0
Source: Company, ICICIdirect.com Research

ICICI Securities Ltd | Retail Equity Research Page 3
Conference call highlights…
FY18 revenue outlook – The management expects headwinds to
persist now till Q2FY18, which were earlier expected to persist till
Q1FY18 due to re-shoring of work by a large client. eClerx is
facing headwinds among top 10 clients since Q4FY16 and is
expected to be weak in FY18E. Overall, FY18E is expected to be a
soft year
Margins – The management maintained its expectation of ~30%
target for EBIT margin for FY18E despite near term headwinds
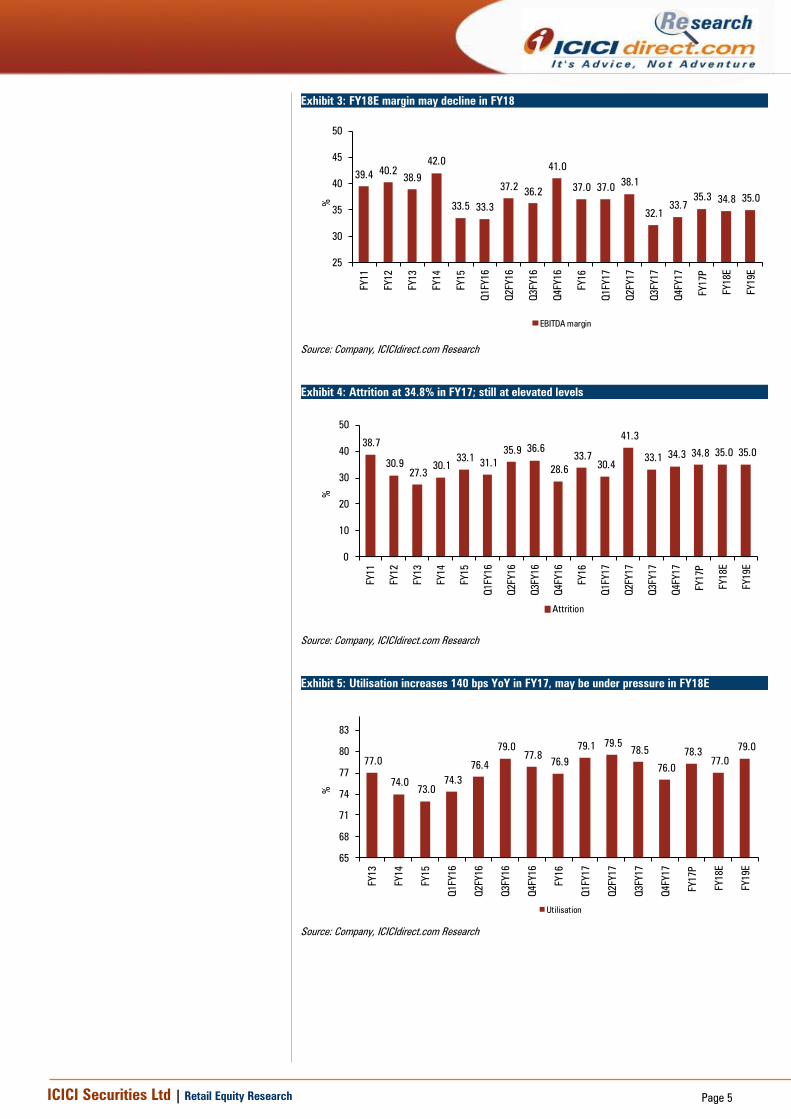
Employee update- Employee headcount is at 8737 (vs. 8862 in
FY16) at the end of FY17 with a net reduction of 125 employees.
Attrition for the fiscal was at 34.8%, up from 33.7% in FY16, which
drastically surged in Q2 owing to some mismatch of skills among
a few employees. Staff utilisation was at 78.3% in FY17, highest in
the last five years owing to economies of scale and automation
benefits, mostly in cable vertical. However, we foresee utilisation
being adversely impacted in FY18E due to Q2FY18 headwinds
Cash position – The company has cash & cash equivalent of | 606
crore. It has announced a token dividend of | 1/share. However, it
expects to maintain historical payout over the medium term
Capex - Capex declined to | 21.1 crore in FY17 vs. | 48.2 crore in
FY16. It expects capex to decline further in the coming year owing
to sufficient capacity at offshore centres
DSO days- DSO days were at 85 days at the year end (vs. 73 days
in FY16) due to one-off factors as indicated by the management
and expects it to be ~80 days, going ahead
Hedge position- Forward hedge book was at US$132.5 million
with average strike rate of | 72.1 and expects US$104 million to
convert into operating revenues by FY18E at | 72

ICICI Securities Ltd | Retail Equity Research Page 4
Company Analysis
eClerx reported 1.6% QoQ growth in constant currency (CC) revenues
while overall dollar revenues grew 1.5% QoQ led by strong growth in
emerging clients (non-top 10), which grew 9.9% QoQ offset by continued
weakness in top 10 clients (74% of revenue) declining sequentially by
1.2%. Revenue headwinds, which were earlier expected to persist till
Q1FY18, are now expected to be prolonged till Q2FY18 mainly due to re-
shoring of the work by a large client. Consequently, we expect dollar
revenues to report 4% CAGR in FY17-19E with subdued growth in FY18E.
Exhibit 1: Dollar revenues may grow at 4% CAGR during FY17-19E
76
97
122
138 154
46.4 50.2 51.8 50.8
199
50.2 48.947.2 47.9
194194
210
37.3
29.0
24.713.9
11.2
28.1
31.9 33.2
24.8
29.5
8.2
0.1
7.9
0
10
20
30
40
50
0
50
100
150
200
250
FY11
FY12
FY13
FY14
FY15
Q1FY16
Q2FY16
Q3FY16
Q4FY16
FY16
Q1FY17
Q2FY17
Q3FY17
Q4FY17
FY17P
FY18E
FY19E
%
$ m
illion
Dollar revenue Growth, YoY
Source: Company, ICICIdirect.com Research
Exhibit 2: eClerx de-grows significantly in FY17 compared to industry growth of 9%
30.0
37.3
29.0
24.7
13.911.2
29.5
-2.5
5.5
18.716.5
10.213.0 13.0 13.0
9.0
-5
5
15
25
35
45
FY10 FY11 FY12 FY13 FY14 FY15 FY16 FY17P
%
Growth, YoY NASSCOM guidance
Source: Company, ICICIdirect.com Research
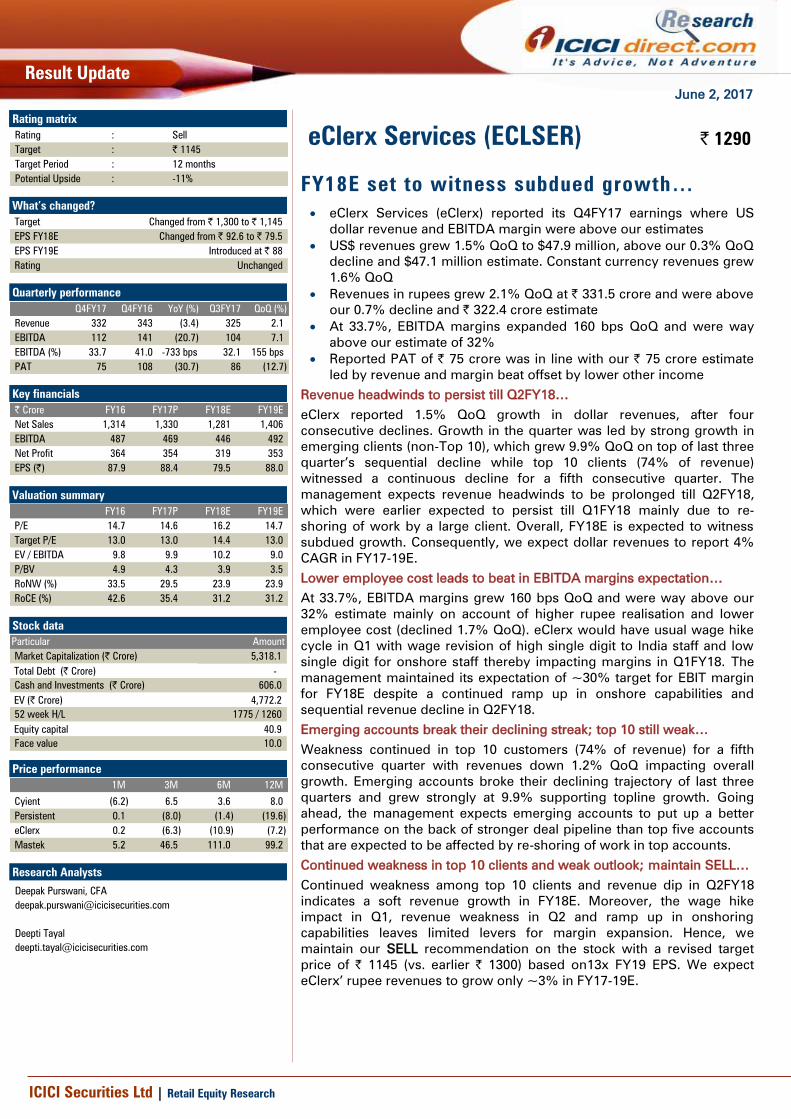
EBITDA margin beats expectations…
At 33.7%, EBITDA margins grew 160 bps QoQ and were way above our
32% estimate mainly on account of lower employee cost (declined 1.7%
QoQ). eClerx would have the usual wage hike cycle in Q1 with wage
revision of high single digit to India staff and low single digit for onshore
staff thereby impacting margins in Q1FY18. The management maintained
its expectation of ~30% target for EBIT margin for FY18E despite
continued ramp up in onshore capabilities and sequential revenue decline
in Q2FY18.
ICICI Securities Ltd | Retail Equity Research Page 5
Exhibit 3: FY18E margin may decline in FY18
39.440.2
38.9
42.0
33.5 33.3
37.236.2
41.0
37.0 37.038.1
32.1
33.7
35.3 34.8 35.0
25
30
35
40
45
50
FY11
FY12
FY13
FY14
FY15
Q1FY16
Q2FY16
Q3FY16
Q4FY16
FY16
Q1FY17
Q2FY17
Q3FY17
Q4FY17
FY17P
FY18E
FY19E
%EBITDA margin
Source: Company, ICICIdirect.com Research
Exhibit 4: Attrition at 34.8% in FY17; still at elevated levels
38.7
30.9
27.3
30.1
33.1 31.1
35.9 36.6
28.6
33.7
30.4
41.3
33.1 34.3 34.8 35.0 35.0
0
10
20
30
40
50
FY11
FY12
FY13
FY14
FY15
Q1FY16
Q2FY16
Q3FY16
Q4FY16
FY16
Q1FY17
Q2FY17
Q3FY17
Q4FY17
FY17P
FY18E
FY19E
%
Attrition
Source: Company, ICICIdirect.com Research
Exhibit 5: Utilisation increases 140 bps YoY in FY17, may be under pressure in FY18E
77.0
74.0 73.0
74.3
76.4
79.0
77.8 76.9
79.1 79.5 78.5
76.0
78.3
77.0
79.0
65
68
71
74
77
80
83
FY13
FY14
FY15
Q1FY16
Q2FY16
Q3FY16
Q4FY16
FY16
Q1FY17
Q2FY17
Q3FY17
Q4FY17
FY17P
FY18E
FY19E
%
Utilisation
Source: Company, ICICIdirect.com Research

ICICI Securities Ltd | Retail Equity Research Page 6
Clients contributing $0.5 million+ now at 38, down by two YoY…
In comparison to FY16, client count in FY17 declined by two to 14 in $0.5
million+ bucket due to certain projects getting completed in digital
verticals. Client contribution run rate increased and declined by one each
in $1 million+ bucket and US$5 million+ bucket to 18 and six,
respectively on the back of movement of a top 10 client to lower value
bucket. Weakness continued in top 10 customers (74% of revenue) for
fifth consecutive quarter with revenues declining 1.2% QoQ impacting
overall growth. Emerging accounts broke their declining trajectory of the
last three quarters and grew strongly at 9.9% supporting topline growth.
Exhibit 6: In FY17, clients contributing $0.5 million+ in revenues declined by two
56
7
9 9
16 16 16
18 18
1514 14
0
2
4
6
8
10
12
14
16
18
20
FY13
FY14
FY15
Q1FY16
Q2FY16
Q3FY16
Q4FY16
FY16
Q1FY17
Q2FY17
Q3FY17
Q4FY17
FY17P
$0.5 million+ clients
Source: Company, ICICIdirect.com Research

ICICI Securities Ltd | Retail Equity Research Page 7
Outlook and Valuation
eClerx reported Q4FY17 numbers, which were above our expectation on
the revenue front while margins also surprised on the upside. However,
for the year, consolidated dollar revenues declined 2.5% YoY and 1.5%
on a constant currency basis. The management expects headwinds to
persist till Q2FY18E with overall FY18E being a soft year.
Continued weakness among top 10 clients and revenue dip in Q2FY18
indicates a soft revenue growth in FY18E. Moreover, the wage hike
impact in Q1, revenue weakness in Q2 and ramp up in onshoring
capabilities leaves limited levers for margin expansion. Hence, we
maintain our SELL recommendation on the stock with a revised target
price of | 1145 (vs. earlier | 1300) based on 13x FY19 EPS. We expect
eClerx’ rupee revenues to grow only ~3% in FY17-19E.
Exhibit 7: One year forward rolling PE
0
360
720
1080
1440
1800
May-10
Nov-10
May-11
Nov-11
May-12
Nov-12
May-13
Nov-13
May-14
Nov-14
May-15
Nov-15
May-16
Nov-16
May-17
Price 16 13 10 7 4
Source: Company, ICICIdirect.com Research
Exhibit 8: Valuations
Sales Growth EPS Growth PE EV/EBITDA RoNW RoCE
(| cr) (%) (|) (%) (x) (x) (%) (%)
FY16 1,314 39.5 87.9 57.7 14.7 9.8 33.5 42.6
FY17P 1,330 1.2 88.4 0.6 14.6 9.9 29.5 35.4
FY18E 1,281 (3.7) 79.5 (10.0) 16.2 10.2 23.9 31.2
FY19E 1,406 9.8 88.0 10.8 14.7 9.0 23.9 31.2
Source: Company, ICICIdirect.com Research

ICICI Securities Ltd | Retail Equity Research Page 8
Recommendation History vs. Consensus
0.0
10.0
20.0
30.0
40.0
50.0
60.0
200
500
800
1,100
1,400
1,700
2,000
May-17Mar-17Dec-16Oct-16Jul-16May-16Mar-16Dec-15Oct-15Jul-15May-15
(%
)(|)
Price Idirect target Consensus Target Mean % Consensus with SELL
Source: Bloomberg, Company, ICICIdirect.com Research
Key events
Date Event
Oct-12 Reports $29.8 million revenue (6% QoQ growth) and 32.5% EBIT margins for Q2FY13, below our $30.5 million and 34.1% estimate, respectively
Aug-13 Approves buyback of shares at maximum | 825 per share
Jul-14 Reports muted Q1FY15 revenue growth led by weakness in top 5 clients (cable and sales & marketing). Margins decline 600 bps
Jan-15 Q3FY15 was yet another disappointing quarter where dollar revenue growth and margins came below our estimates led by degrowth in top 5 clients
Mar-15 Acquires CLX Europe for €25 million. CLX had revenues of €19.4 million in CY14 with EBITDA of €4.5 million and PAT of €500,000
May-15 During Q4FY15, revenue growth came above our estimates led by emerging accounts while margins continue to decline sequentially
Jun-15
Reports steady Q1FY16 earnings as revenue growth was in line but margins were above our estimates. Growth was led by CLX integration and recovery in top 5
clients
Nov-15 Reports good set of Q2FY16 earnings as both revenue and margins were above our estimates. Growth was led by CLX and top 5 clients
Aug-16 Reports Q2FY17 numbers, which were marginally below our estimates
Oct-16 Eclerx finalises buyback price of | 2000 per share with final amount of buyback at | 234 crore
Nov-16 Eclerx to commence its | 234 crore buyback on November 28, 2016 and close on December 9, 2016
Dec-16
Eclerx step-down subsidiary Agilyst Inc US, to be merged with eclerx LLC US, its wholly-owned subsidiary for administrative convenience and to maintain a lean
organisational structure
Dec-16
eClerx completes buy-back programme worth | 234 crore. Buy-back undertaken on proportionate basis by way of tender offer for cash at | 2000 per equity shares
constituted 11,70,000 shares representing 2.87% of total paid-up equity share capital
Source: Company, ICICIdirect.com Research
Top 10 Shareholders Shareholding Pattern
Rank Name Latest Filing Date % O/S Position (m) Change (m)
1 Malik (Anjan) 31-Mar-17 25.1% 10.0 0.0
2 Mundhra (Priyadarshan) 31-Mar-17 25.1% 10.0 0.0
3 Matthews International Capital Management, L.L.C. 21-Dec-15 7.9% 3.2 -0.2
4 Fidelity Management & Research Company 31-Mar-16 4.5% 1.8 1.8
5 Franklin Templeton Asset Management (India) Pvt. Ltd. 31-Mar-16 3.3% 1.3 0.0
6 HDFC Asset Management Co., Ltd. 31-Mar-16 3.0% 1.2 0.0
7 UTI Asset Management Co. Ltd. 31-Mar-17 2.9% 1.2 0.7
8 PineBridge Investments Asia Limited 31-Mar-17 2.9% 1.2 0.1
9 SBI Funds Management Pvt. Ltd. 31-Mar-17 2.2% 0.9 0.0
10 IIFL Inc 31-Mar-17 1.6% 0.6 0.0
(in %) Sep-16 Dec-16 Mar-17
Promoter 50.25 50.44 50.28
Public 49.75 49.50 49.53
Others 0.00 0.06 0.19
Total 100.00 100.00 100.00
Source: Reuters, ICICIdirect.com Research
Recent Activity
Investor name Value Shares Investor name Value Shares
UTI Asset Management Co. Ltd. 16.0m 0.7m Goldman Sachs Asset Management International 5.9m 0.3m
PineBridge Investments Asia Limited 2.7m 0.1m ABN AMRO Investment Solutions (AAIS) 0.6m 0.0m
Norges Bank Investment Management (NBIM) 1.0m 0.0m L&T Investment Management Limited 0.5m 0.0m
Eclerx Employee Welfare Trust 0.7m 0.0m State Street Global Advisors (US) 0.3m 0.0m
Mirae Asset Global Investments Co., Ltd. 0.4m 0.0m Malik (Pawan) 0.3m 0.0m
Buys Sells
Source: Reuters, ICICIdirect.com Research

ICICI Securities Ltd | Retail Equity Research Page 9
.
Financial summary
Profit and loss statement | Crore
FY16 FY17P FY18E FY19E
Total Revenues 1,314 1,330 1,281 1,406
Growth (%) 39.5 1.2 (3.7) 9.8
Employee expenses 501 525 506 555
Other Expenditure 327 337 329 359
EBITDA 487 469 446 492
Growth (%) 54.3 (3.7) (4.9) 10.4
Depreciation 51 52 50 55
Other Income 41 19 29 33
Interest expense - 0 - -
PBT before Exceptional Items 477 436 425 470
Growth (%) 60.1 (8.6) (2.6) 10.8
Tax 113 82 106 118
PAT before Exceptional Items 364 354 319 353
Exceptional items - - - -
PAT before MI 364 354 319 353
Minority Int & Pft. from associates 0 (0) - -
PAT 364 354 319 353
Growth (%) 58.3 (2.6) (10.0) 10.8
EPS 88 88 79 88
EPS (Growth %) 57.7 0.6 (10.0) 10.8
Source: Company, ICICIdirect.com Research
Cash flow statement | Crore
FY16 FY17P FY18E FY19E
Net profit before Tax 477 436 425 470
Depreciation 51 52 50 55
(inc)/dec in Current Assets (27) (5) (16) (21)
(inc)/dec in current Liabilities (113) (82) (106) (118)
CF from operations 426 441 308 359
Other Investments (63) - - -
Other income 41 19 29 -
(Purchase)/Sale of Fixed Assets (52) (75) (75) (75)
CF from investing Activities (172) (56) (46) (42)
Inc / (Dec) in Equity Capital 14 - - -
Dividend & Divendend tax (128) (5) (187) (207)
Interest Paid on Loans (0) - - -
CF from Financial Activities (165) (242) (187) (207)
Exchange rate differences (3) - - -
Opening cash balance 198 327 470 544
Other adjustments 43 - - -
Closing cash 327 470 544 654
Source: Company, ICICIdirect.com Research
Balance sheet | Crore
FY16 FY17P FY18E FY19E
Equity 41 40 40 40
Reserves & Surplus 1,045 1,162 1,293 1,439
Networth 1,086 1,202 1,333 1,479
Minority Interest 1 1 1 1
Loans - - - -
Other liabilities 33 29 29 29
Source of funds 1,119 1,230 1,363 1,508
Gross Block 264 339 414 489
Acc.dep 167 219 269 323
Net Block 97 120 145 165
CWIP - - - -
Investments 219 219 219 219
Goodwill 243 243 243 243
Debtors 186 154 174 186
Cash & Cash equivalents 327 470 544 654
Loans and advances 80 113 109 120
Other current assets 113 181 175 192
Trade payables 14 3 3 3
Current liabilities 50 27 13 14
Provisions 82 239 231 253
Application of funds 1,119 1,230 1,363 1,508
Source: Company, ICICIdirect.com Research
Key ratios
FY16 FY17P FY18E FY19E
Per share data (|)
EPS 87.9 88.4 79.5 88.0
Cash EPS 100.1 101.3 92.0 101.7
BV 262.5 299.9 332.7 369.0
DPS 1.0 1.0 39.7 44.0
Cash Per Share 79.0 117.2 135.8 163.2
Operating Ratios (%)EBITDA Margin 37.0 35.3 34.8 35.0
PAT Margin 27.7 26.6 24.9 25.1
Debtor days 52 42 49 48
Creditor days 4 1 1 1
Return Ratios (%)
RoE 33.5 29.5 23.9 23.9
RoCE 42.6 35.4 31.2 31.2
RoIC 132.1 139.3 111.1 111.6
Valuation Ratios (x)
P/E 14.7 14.6 16.2 14.7
EV / EBITDA 9.8 9.9 10.2 9.0
EV / Net Sales 3.6 3.5 3.6 3.2
Market Cap / Sales 4.0 4.0 4.2 3.8
Price to Book Value 4.9 4.3 3.9 3.5
Solvency Ratios
Debt/EBITDA - - - -
Debt / Equity - - - -
Current Ratio 2.6 1.7 1.9 1.8
Quick Ratio 2.6 1.7 1.9 1.8
Source: Company, ICICIdirect.com Research

ICICI Securities Ltd | Retail Equity Research Page 10
ICICIdirect.com coverage universe (IT)
CMP M Cap EPS (|) P/E (x) RoCE (%) RoE(%)
(|) TP(|) Rating (| Cr) FY16 FY17P FY18E FY16 FY17P FY18E FY16 FY17P FY18E FY16 FY17P FY18E FY16 FY17P FY18E
Cyient (INFENT) 537 580 Hold 6,046 29.0 30.5 35.9 18.5 17.6 15.0 12.7 10.6 9.4 20.3 20.0 20.3 17.1 16.3 17.1
Eclerx (ECLSER) 1,290 1,145 Sell 5,318 87.9 88.4 79.5 14.7 14.6 16.2 9.8 9.9 10.2 42.6 35.4 31.2 33.5 29.5 23.9
Firstsource (FIRSOU) 39 45 Buy 2,582 3.8 4.1 4.4 10.2 9.4 8.9 7.7 6.7 6.0 11.7 12.1 12.1 12.9 11.5 11.0
HCL Tech (HCLTEC) 850 930 Buy 119,994 52.1 60.0 59.6 16.3 14.2 14.3 12.6 10.3 9.7 31.2 30.3 30.6 26.9 26.6 25.1
Infosys (INFTEC) 930 1,060 Buy 212,554 59.0 62.8 64.6 15.8 14.8 14.4 10.4 9.3 9.6 30.2 28.8 31.0 21.8 20.8 22.3
KPIT Tech (KPISYS) 128 140 Hold 2,547 14.1 10.6 11.0 9.1 12.0 11.6 5.4 7.0 6.6 23.7 16.3 16.3 20.4 15.4 12.8
Mindtree (MINCON) 442 485 Hold 7,422 35.9 24.9 29.1 12.3 17.7 15.2 8.4 9.1 8.2 31.1 21.1 23.9 25.2 16.0 18.0
NIIT Technologies (NIITEC) 496 520 Hold 1,777 45.8 43.2 45.3 10.8 10.5 11.0 2.9 2.5 2.2 30.5 29.9 28.1 17.6 14.9 14.1
Persistent (PSYS) 580 700 Buy 4,639 37.2 37.6 40.1 15.6 15.4 14.5 9.7 8.5 7.1 23.8 21.3 20.4 18.1 16.2 15.4
TCS (TCS) 2,290 2,400 Hold 448,542 122.9 133.4 135.0 18.6 17.2 16.9 13.7 12.6 12.4 42.2 38.0 40.9 33.1 29.7 32.2
Tech Mahindra (TECMAH) 429 490 Buy 42,158 31.7 31.8 33.9 13.5 13.5 12.7 8.8 8.7 7.8 25.5 21.9 20.6 21.7 17.2 16.2
Wipro (WIPRO) 494 500 Hold 121,676 36.1 35.2 34.1 13.7 14.0 14.5 9.9 8.7 8.7 19.6 17.3 15.9 19.1 15.7 14.1
Sector / Company
EV/EBITDA (x)
Source: Company, ICICIdirect.com Research

ICICI Securities Ltd | Retail Equity Research Page 11
RATING RATIONALE
ICICIdirect.com endeavours to provide objective opinions and recommendations. ICICIdirect.com assigns
ratings to its stocks according to their notional target price vs. current market price and then categorises them
as Strong Buy, Buy, Hold and Sell. The performance horizon is two years unless specified and the notional
target price is defined as the analysts' valuation for a stock.
Strong Buy: >15%/20% for large caps/midcaps, respectively, with high conviction;
Buy: >10%/15% for large caps/midcaps, respectively;
Hold: Up to +/-10%;
Sell: -10% or more;
Pankaj Pandey Head – Research [email protected]
ICICIdirect.com Research Desk,
ICICI Securities Limited,
1st Floor, Akruti Trade Centre,
Road No 7, MIDC,
Andheri (East)
Mumbai – 400 093

ICICI Securities Ltd | Retail Equity Research Page 12
ANALYST CERTIFICATION
We /I, Deepak Purswani, CFA MBA (Finance), Deepti Tayal, MBA, Research Analysts, authors and the names subscribed to this report, hereby certify that all of the views expressed in this research report
accurately reflect our views about the subject issuer(s) or securities. We also certify that no part of our compensation was, is, or will be directly or indirectly related to the specific recommendation(s) or
view(s) in this report.
Terms & conditions and other disclosures:
ICICI Securities Limited (ICICI Securities) is a full-service, integrated investment banking and is, inter alia, engaged in the business of stock brokering and distribution of financial products. ICICI Securities
Limited is a Sebi registered Research Analyst with Sebi Registration Number – INH000000990. ICICI Securities is a wholly-owned subsidiary of ICICI Bank which is India’s largest private sector bank and has
its various subsidiaries engaged in businesses of housing finance, asset management, life insurance, general insurance, venture capital fund management, etc. (“associates”), the details in respect of which
are available on www.icicibank.com.
ICICI Securities is one of the leading merchant bankers/ underwriters of securities and participate in virtually all securities trading markets in India. We and our associates might have investment banking
and other business relationship with a significant percentage of companies covered by our Investment Research Department. ICICI Securities generally prohibits its analysts, persons reporting to analysts
and their relatives from maintaining a financial interest in the securities or derivatives of any companies that the analysts cover.
The information and opinions in this report have been prepared by ICICI Securities and are subject to change without any notice. The report and information contained herein is strictly confidential and
meant solely for the selected recipient and may not be altered in any way, transmitted to, copied or distributed, in part or in whole, to any other person or to the media or reproduced in any form, without
prior written consent of ICICI Securities. While we would endeavour to update the information herein on a reasonable basis, ICICI Securities is under no obligation to update or keep the information current.
Also, there may be regulatory, compliance or other reasons that may prevent ICICI Securities from doing so. Non-rated securities indicate that rating on a particular security has been suspended
temporarily and such suspension is in compliance with applicable regulations and/or ICICI Securities policies, in circumstances where ICICI Securities might be acting in an advisory capacity to this
company, or in certain other circumstances.
This report is based on information obtained from public sources and sources believed to be reliable, but no independent verification has been made nor is its accuracy or completeness guaranteed. This
report and information herein is solely for informational purpose and shall not be used or considered as an offer document or solicitation of offer to buy or sell or subscribe for securities or other financial
instruments. Though disseminated to all the customers simultaneously, not all customers may receive this report at the same time. ICICI Securities will not treat recipients as customers by virtue of their
receiving this report. Nothing in this report constitutes investment, legal, accounting and tax advice or a representation that any investment or strategy is suitable or appropriate to your specific
circumstances. The securities discussed and opinions expressed in this report may not be suitable for all investors, who must make their own investment decisions, based on their own investment
objectives, financial positions and needs of specific recipient. This may not be taken in substitution for the exercise of independent judgment by any recipient. The recipient should independently evaluate
the investment risks. The value and return on investment may vary because of changes in interest rates, foreign exchange rates or any other reason. ICICI Securities accepts no liabilities whatsoever for any
loss or damage of any kind arising out of the use of this report. Past performance is not necessarily a guide to future performance. Investors are advised to see Risk Disclosure Document to understand the
risks associated before investing in the securities markets. Actual results may differ materially from those set forth in projections. Forward-looking statements are not predictions and may be subject to
change without notice.
ICICI Securities or its associates might have managed or co-managed public offering of securities for the subject company or might have been mandated by the subject company for any other assignment
in the past twelve months.
ICICI Securities or its associates might have received any compensation from the companies mentioned in the report during the period preceding twelve months from the date of this report for services in
respect of managing or co-managing public offerings, corporate finance, investment banking or merchant banking, brokerage services or other advisory service in a merger or specific transaction.
ICICI Securities or its associates might have received any compensation for products or services other than investment banking or merchant banking or brokerage services from the companies mentioned
in the report in the past twelve months.
ICICI Securities encourages independence in research report preparation and strives to minimize conflict in preparation of research report. ICICI Securities or its associates or its analysts did not receive any
compensation or other benefits from the companies mentioned in the report or third party in connection with preparation of the research report. Accordingly, neither ICICI Securities nor Research Analysts
and their relatives have any material conflict of interest at the time of publication of this report.
It is confirmed that Deepak Purswani, CFA MBA (Finance), Deepti Tayal, MBA, Research Analysts of this report have not received any compensation from the companies mentioned in the report in the
preceding twelve months.
Compensation of our Research Analysts is not based on any specific merchant banking, investment banking or brokerage service transactions.
ICICI Securities or its subsidiaries collectively or Research Analysts or their relatives do not own 1% or more of the equity securities of the Company mentioned in the report as of the last day of the month
preceding the publication of the research report.
Since associates of ICICI Securities are engaged in various financial service businesses, they might have financial interests or beneficial ownership in various companies including the subject
company/companies mentioned in this report.
It is confirmed that Deepak Purswani, CFA MBA (Finance), Deepti Tayal, MBA, Research Analysts do not serve as an officer, director or employee of the companies mentioned in the report.
ICICI Securities may have issued other reports that are inconsistent with and reach different conclusion from the information presented in this report.
Neither the Research Analysts nor ICICI Securities have been engaged in market making activity for the companies mentioned in the report.
We submit that no material disciplinary action has been taken on ICICI Securities by any Regulatory Authority impacting Equity Research Analysis activities.
This report is not directed or intended for distribution to, or use by, any person or entity who is a citizen or resident of or located in any locality, state, country or other jurisdiction, where such distribution,
publication, availability or use would be contrary to law, regulation or which would subject ICICI Securities and affiliates to any registration or licensing requirement within such jurisdiction. The securities
described herein may or may not be eligible for sale in all jurisdictions or to certain category of investors. Persons in whose possession this document may come are required to inform themselves of and
to observe such restriction.