june 2003 1 overview presentation supply chain operations reference-model (scor)
TRANSCRIPT

June 2003June 2003 11
Overview PresentationOverview Presentation
Supply Chain Supply Chain Operations Reference-modelOperations Reference-model
(SCOR) (SCOR)

SCOR OverviewJuly 2004 2
• The SCC is an independent, not-for-profit, global corporation with The SCC is an independent, not-for-profit, global corporation with membership open to all companies and organizations interested in membership open to all companies and organizations interested in applying and advancing state-of-the-art supply chain management applying and advancing state-of-the-art supply chain management systems and practices.systems and practices.
• Over 800 Company Members Over 800 Company Members
• Cross-industry representation Cross-industry representation
• Chapters in Australia/New Zealand, Brazil, Europe, Japan, Chapters in Australia/New Zealand, Brazil, Europe, Japan, North America, Southern Africa, and South East Asia with North America, Southern Africa, and South East Asia with petitions for additional chapters pending.petitions for additional chapters pending.
•The Supply-Chain Council (SCC) has developed and endorsed the The Supply-Chain Council (SCC) has developed and endorsed the Supply Chain Operations Reference-model (SCOR) as the cross-Supply Chain Operations Reference-model (SCOR) as the cross-industry standard for supply chain managementindustry standard for supply chain management

SCOR OverviewJuly 2004 3
Quantify the operational performance of similar companies and establish internal targets based on “best-in-class” results
Quantify the operational performance of similar companies and establish internal targets based on “best-in-class” results
Benchmarking
Characterize the management practices and software solutions that result in “best-in-class” performance
Characterize the management practices and software solutions that result in “best-in-class” performance
Best Practices Analysis
Process Reference Model
Capture the “as-is” state of a process and derive the desired “to-be” future state
Capture the “as-is” state of a process and derive the desired “to-be” future state
Business Process Reengineering
Capture the “as-is” state of a process and derive the desired “to-be” future state
Capture the “as-is” state of a process and derive the desired “to-be” future state
Quantify the operational performance of similar companies and establish internal targets based on “best-in-class” results
Characterize the management practices and software solutions that result in “best-in-class” performance
What is a process reference model?What is a process reference model?
Process reference models integrate the well-known Process reference models integrate the well-known concepts of business process reengineering, concepts of business process reengineering, benchmarking, and process measurement into a cross-benchmarking, and process measurement into a cross-functional frameworkfunctional framework
SCOR OverviewJuly 2004 4
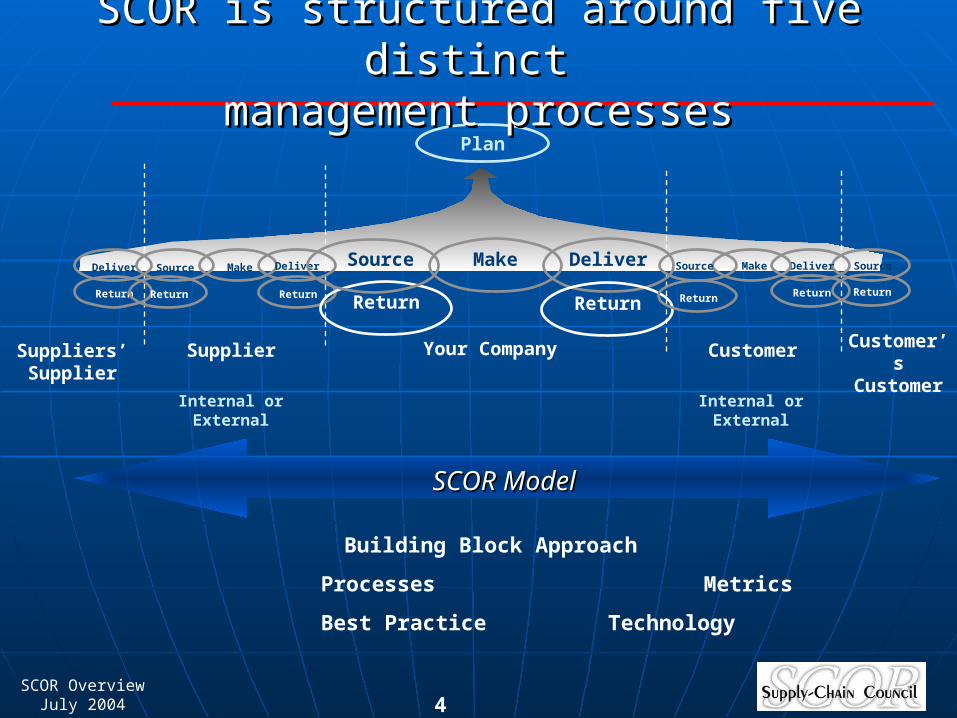
Supplier
Plan
Customer Customer’sCustomer
Suppliers’Supplier
Make DeliverSource Make DeliverMakeSourceDeliver SourceDeliver
Internal or External Internal or External
Your Company
Source
SCOR is structured around five distinct SCOR is structured around five distinct management processesmanagement processes
SCOR Model SCOR Model
Return Return ReturnReturn Return Return Return Return
Building Block Approach
Processes Metrics
Best Practice Technology

SCOR OverviewJuly 2004 5
Cu
sto
mer
sC
ust
om
ers
Su
pp
lier
sS
up
pli
ers
P1 Plan Supply ChainP1 Plan Supply ChainPlanPlan
P2 Plan SourceP2 Plan Source P3 Plan MakeP3 Plan Make P4 Plan DeliverP4 Plan Deliver
SourceSource MakeMake DeliverDeliver
S1 Source Stocked ProductsS1 Source Stocked Products M1 Make-to-StockM1 Make-to-Stock
M2 Make-to-OrderM2 Make-to-Order
M3 Engineer-to-OrderM3 Engineer-to-Order
D1 Deliver Stocked ProductsD1 Deliver Stocked Products
D2 Deliver MTO ProductsD2 Deliver MTO Products
D3 Deliver ETO ProductsD3 Deliver ETO Products
S2 Source MTO ProductsS2 Source MTO Products
S3 Source ETO ProductsS3 Source ETO Products
Supply-Chain Operations Reference-model Supply-Chain Operations Reference-model (SCOR) 6.1 - Processes(SCOR) 6.1 - Processes
Return Return SourceSource
P5 Plan ReturnsP5 Plan Returns
Return Return DeliverDeliver
EnableEnable
D4 Deliver Retail ProductsD4 Deliver Retail Products

SCOR OverviewJuly 2004 6
SCOR BoundariesSCOR Boundaries
SCOR Spans:SCOR Spans:• All supplier / customer interactionsAll supplier / customer interactions
Order entry through paid invoiceOrder entry through paid invoice• All physical material transactionsAll physical material transactions
From your supplier’s supplier to your customer’s From your supplier’s supplier to your customer’s customer, including equipment, supplies, spare parts, customer, including equipment, supplies, spare parts, bulk product, software, etc.bulk product, software, etc.
• All market interactionsAll market interactions From the understanding of aggregate demand to the From the understanding of aggregate demand to the
fulfillment of each orderfulfillment of each order• ReturnsReturns

SCOR OverviewJuly 2004 7
Material FlowMaterial Flow
SCOR Level 1
Operations Operations StrategyStrategy
Analyze Basisof
Competition
SCOR Level 2
Configuresupply chain
AlignPerformance
Levels, Practices, and
Systems
Implementsupply chain
Processes and Systems
Implementsupply chain
Processes and Systems
SCOR Project RoadmapSCOR Project Roadmap
•Competitive Performance Requirements•Performance Metrics•Supply Chain Scorecard•Scorecard Gap Analysis•Project Plan
•AS IS Geographic Map•AS IS Thread Diagram•Design Specifications•TO BE Thread Diagram•TO BE Geographic Map
InformationInformationand Work Flowand Work Flow
•AS IS Level 2, 3, and 4 Maps•Disconnects•Design Specifications•TO BE Level 2, 3, and 4 Maps
Develop, Develop, Test, and Roll Test, and Roll
OutOut
•Organization•Technology•Process•People
SCOR Level 3
SCOR OverviewJuly 2004 8
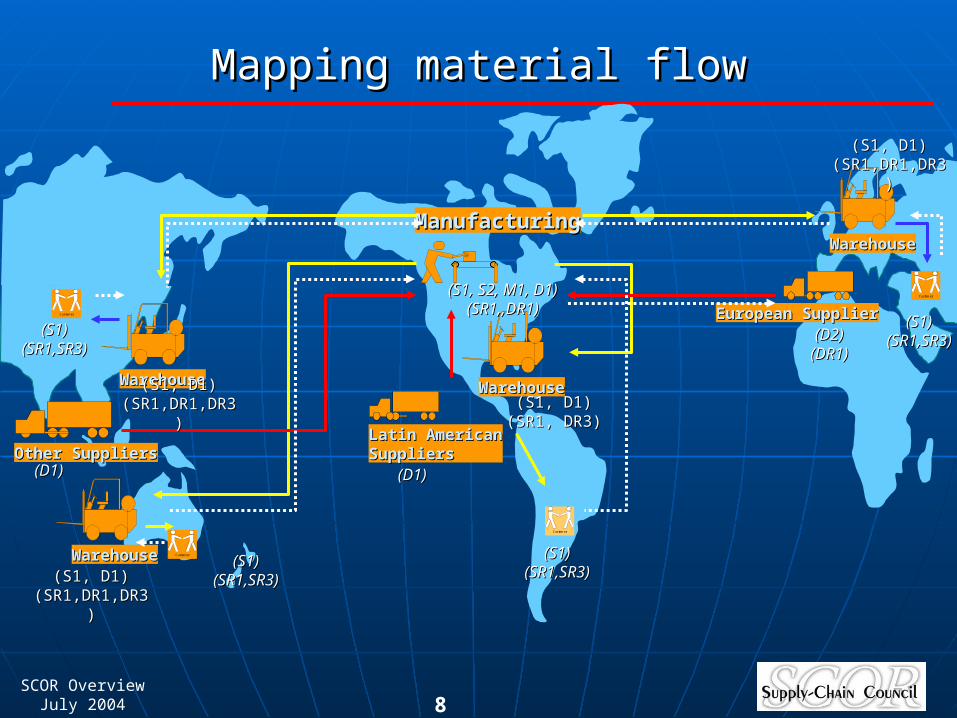
Mapping material flowMapping material flow
Latin AmericanLatin AmericanSuppliersSuppliers
(D1)(D1)
WarehouseWarehouse
Other SuppliersOther Suppliers(D1)(D1)
ManufacturingManufacturing
European SupplierEuropean Supplier(S1)(S1)
(SR1,SR3)(SR1,SR3)
Customer
Customer
Customer
Customer
(S1, D1)(S1, D1)(SR1,DR1,DR3)(SR1,DR1,DR3)
(D2)(D2)(DR1)(DR1)
WarehouseWarehouse
WarehouseWarehouse
WarehouseWarehouse
(S1, D1)(S1, D1)(SR1, DR3)(SR1, DR3)
(S1, D1)(S1, D1)(SR1,DR1,DR3)(SR1,DR1,DR3)
(S1, D1)(S1, D1)(SR1,DR1,DR3)(SR1,DR1,DR3)
(S1)(S1)(SR1,SR3)(SR1,SR3)
(S1)(S1)(SR1,SR3)(SR1,SR3)
(S1)(S1)(SR1,SR3)(SR1,SR3)
(S1, S2, M1, D1)(S1, S2, M1, D1)(SR1,,DR1)(SR1,,DR1)

SCOR OverviewJuly 2004 9
Mapping the execution processesMapping the execution processes
S1S1
D1D1 S1S1
M2M2S2S2 D2D2
M1M1 D1D1 S1S1
S2S2
D1D1M1M1
European European RM SupplierRM Supplier
European European RM SupplierRM Supplier
Key Other Key Other RM RM
SuppliersSuppliers
Key Other Key Other RM RM
SuppliersSuppliers
Alpha Alpha RegionalRegional
WarehousesWarehouses
S1S1
DR1DR1 SR1SR1
DR1DR1 SR1SR1 DR1DR1 SR1SR1
DR3DR3 SR3SR3
RM RM SuppliersSuppliers
DistributorsDistributorsALPHAALPHA
DR3DR3 SR3SR3
S1S1
AmericasDistributors
AmericasDistributors
SR1SR1
SR3SR3

SCOR OverviewJuly 2004 10
Identifying Plan ActivitiesIdentifying Plan Activities
Consumer
P2P2P2P2
PP44
PP44
P3P3P3P3
PP44
PP44
S1S1 D1D1 S1S1
PP22
PP22
P2P2P2P2
PP33
PP33
PP44
PP44
M2M2S2S2 D2D2
M1M1 D1 S1S1S2S2D1D1
M1M1
European European RM SupplierRM Supplier
European European RM SupplierRM Supplier
Key Other Key Other RM RM
SuppliersSuppliers
Key Other Key Other RM RM
SuppliersSuppliers
S1S1
Alpha Alpha RegionalRegional
WarehousesWarehousesRM RM
SuppliersSuppliersDistributorsDistributorsALPHAALPHA
P1P1P1P1
P1P1P1P1
P1P1P1P1

SCOR OverviewJuly 2004 11
Supply Chain Scorecard & Gap AnalysisSupply Chain Scorecard & Gap Analysis
50%
$30M Revenue
$30M Indirect Cost
35 days
97 days
0%
63%
Supply Chain SCORcard Performance Versus Competitive Population
Overview Metrics SCOR Level 1 Metrics Actual Parity Advantage Superior Value from ImprovementsDelivery Performance to Commit Date 85% 90% 95%
Fill Rates 94% 96% 98%
EX
TE
RN
AL
SupplySupplyChainChainReliabilityReliability
Perfect Order Fulfillment 80% 85% 90%
Order Fulfillment Lead times 7 days 5 days 3 days
Flexibility
Responsiveness
Production Flexibility 30 days 25 days 20 days
Total SCM Management Cost 19% 13% 8%
3%
INT
ER
NA
L Cost Warranty Cost NA NA NA NA NA
Value Added Employee Productivity NA $156K $306K $460K NA
Inventory Days of Supply 119 days 55 days 38 days 22 days NA
AssetsCash-to-Cash Cycle Time
196 days 80 days 46 days 28 days
Net Asset Turns (Working Capital) 2.2 turns 8 turns 12 turns 19 turns NA
Supply Chain Response Time 82 days 55 days 13 days
45 days
$7 M Capital Charge
Key enabler to cost and asset improvements
$30M Revenue
