june 2011 investor presentation - transalta mwh until 2020 13 2000 2001 2002 2003 2004 2005 2006...
TRANSCRIPT
1
June 2011 Investor Presentation.

2
This presentation may contain forward looking statements, including statements
regarding the business and anticipated financial performance of TransAlta Corporation.
All forward looking statements are based on our beliefs and assumptions based on
information available at the time the assumption was made. These statements are not
guarantees of our future performance and are subject to a number of risks and
uncertainties that may cause actual results to differ materially from those contemplated
by the forward looking statements. Some of the factors that could cause such
differences include cost of fuels to produce electricity, legislative or regulatory
developments, competition, global capital markets activity, changes in prevailing interest
rates, currency exchange rates, inflation levels, unanticipated accounting or audit issues
with respect to our financial statements or our internal control over financial reporting,
plant availability, and general economic conditions in geographic areas where TransAlta
Corporation operates. Given these uncertainties, the reader should not place undue
reliance on this forward looking information, which is given as of this date. The material
assumptions in making these forward looking statements are disclosed in our 2010
Annual Report to shareholders and other disclosure documents filed with securities
regulators.
Unless otherwise specified, all dollar amounts are expressed in Canadian dollars.
Forward looking statements
3
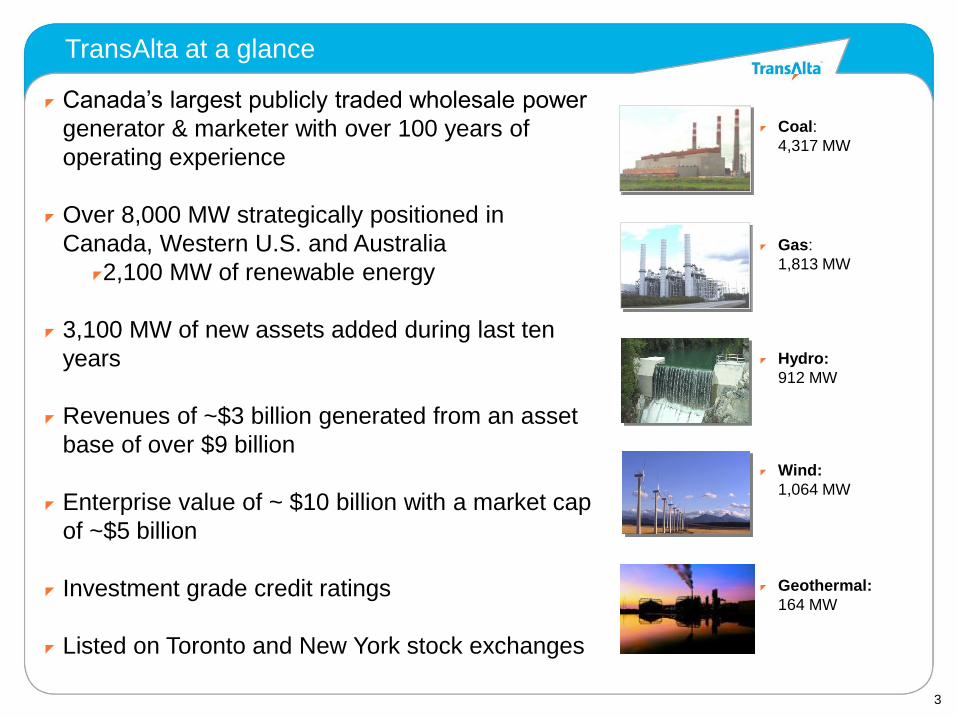
TransAlta at a glance
Canada’s largest publicly traded wholesale power
generator & marketer with over 100 years of
operating experience
Over 8,000 MW strategically positioned in
Canada, Western U.S. and Australia
2,100 MW of renewable energy
3,100 MW of new assets added during last ten
years
Revenues of ~$3 billion generated from an asset
base of over $9 billion
Enterprise value of ~ $10 billion with a market cap
of ~$5 billion
Investment grade credit ratings
Listed on Toronto and New York stock exchanges
Coal:
4,317 MW
Gas:
1,813 MW
Hydro:
912 MW
Wind:
1,064 MW
Geothermal:
164 MW

4
Why TransAlta
Diversified generation portfolio located in growing markets Diversified portfolio with over 75 facilities spanning multiple fuels and geographies
High quality resource base supporting low cost operations and future growth
Well positioned in markets with strong market fundamentals
Attractive yield supported by significant cash flow 5.5% dividend yield
$800 - $900 million in funds from operations with ~$200 million of free cash
Highly contracted with upside potential to rising power prices
Significant incremental EBITDA post 2020 when Power Purchase Arrangements roll-off
Proven track record for growth with significant upside potential
3,100 MW added in the last 10 years with 50% increase in gross margins per MWh
Significant growth pipeline across multiple fuels and geographies
Environmental leadership mitigates risk and provides growth optionality
Financial strength to deliver Investment grade ratings
$2 billion of committed credit facilities
Significant cash flow and favourable access to capital
Delivering shareholder value through yield and growth

5
INTERNATIONAL
14 MW
AUSTRALIA
UNITED STATES
CANADA
Over 75 facilities generating more than $1.5B in gross margins
Diverse and broad footprint
WESTERN CANADA
Coal
Natural gas
Hydro
Wind
Biomass
2,752 MW
391 MW
25 MW
442 MW
873 MW
4,483 MW EASTERN CANADA
Natural gas
Hydro
Wind
628 MW
622 MW
1,264 MW
Natural gas
Geothermal
Coal
Hydro
769 MW
164 MW 1,340 MW
6 MW
2,279 MW
Hydro under development
Generation Facilities
Coal-fired under construction
Coal-fired plants
Gas-fired plants
Hydro plants
Wind-powered plants
Geothermal
Biomass
Wind under development
2010 GROSS MARGIN: $789M
2010 GROSS MARGIN: $150M
2010 GROSS MARGIN: $573M
6
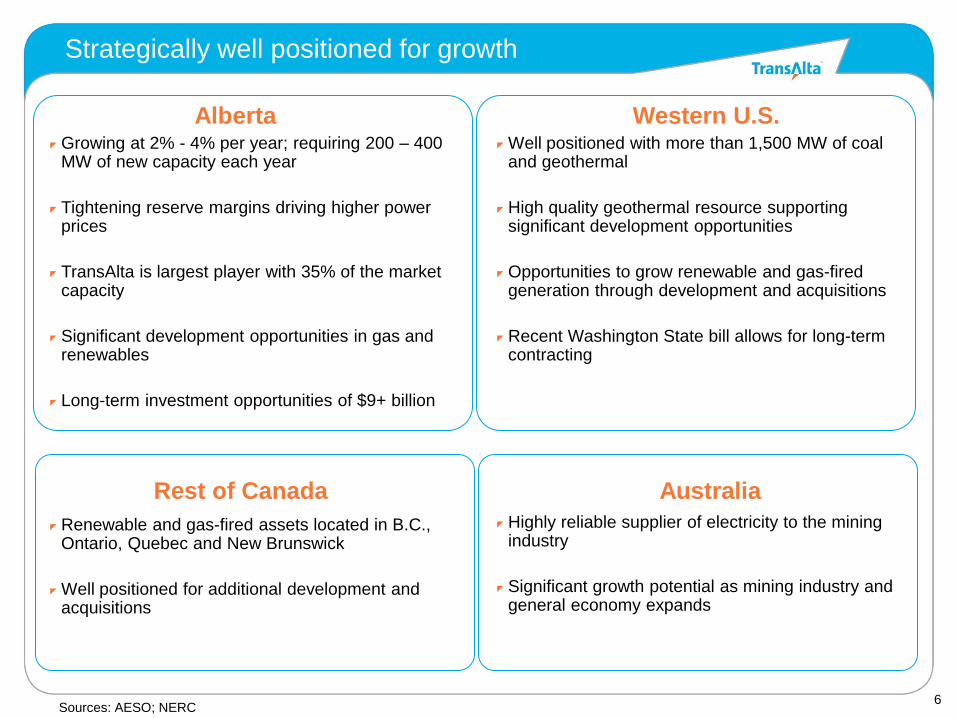
Western U.S.
Strategically well positioned for growth
Alberta
Sources: AESO; NERC
Rest of Canada Australia
Growing at 2% - 4% per year; requiring 200 – 400
MW of new capacity each year
Tightening reserve margins driving higher power prices
TransAlta is largest player with 35% of the market capacity
Significant development opportunities in gas and renewables
Long-term investment opportunities of $9+ billion
Well positioned with more than 1,500 MW of coal
and geothermal
High quality geothermal resource supporting significant development opportunities
Opportunities to grow renewable and gas-fired generation through development and acquisitions
Recent Washington State bill allows for long-term contracting
Renewable and gas-fired assets located in B.C.,
Ontario, Quebec and New Brunswick
Well positioned for additional development and acquisitions
Highly reliable supplier of electricity to the mining
industry
Significant growth potential as mining industry and general economy expands
7
5%
10%
15%
20%
25%
2005 2006 2007 2008 2009 2010 2011 2012 2013 2014
$30
$40
$50
$60
$70
$80
$90
$100
2005 2006 2007 2008 2009 2010 2011 2012 2013 2014
Actual Forecast
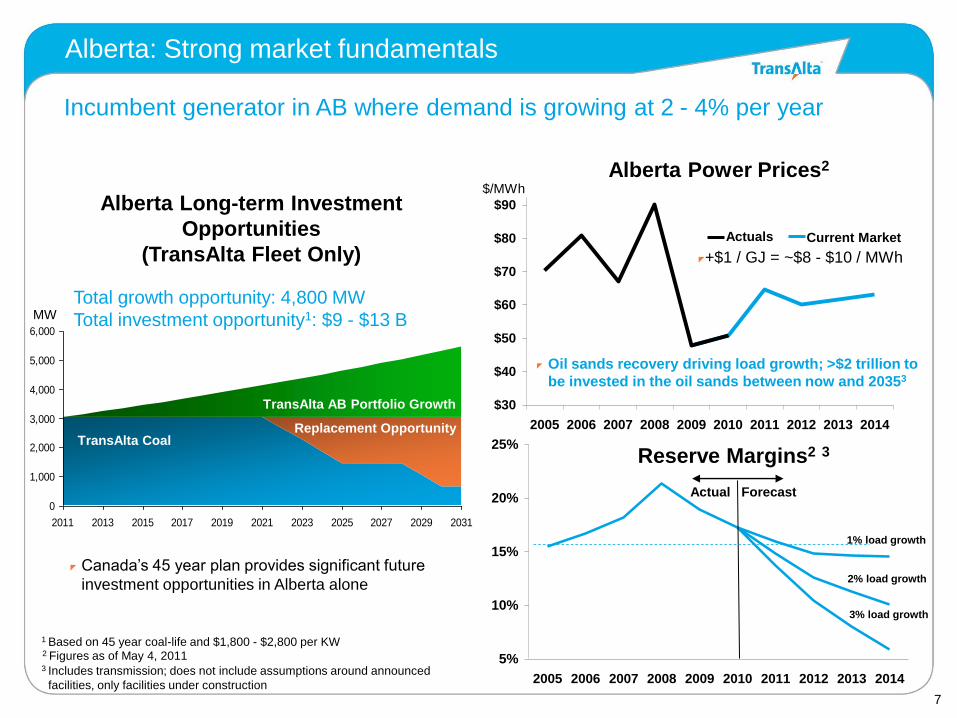
Reserve Margins2 3
1% load growth
2% load growth
3% load growth
2 Figures as of May 4, 2011
Alberta Power Prices2
Actuals Current Market
+$1 / GJ = ~$8 - $10 / MWh
Incumbent generator in AB where demand is growing at 2 - 4% per year
3 Includes transmission; does not include assumptions around announced
facilities, only facilities under construction
Alberta: Strong market fundamentals
$/MWh
Oil sands recovery driving load growth; >$2 trillion to
be invested in the oil sands between now and 20353
0
1,000
2,000
3,000
4,000
5,000
6,000
2011 2013 2015 2017 2019 2021 2023 2025 2027 2029 2031
Canada’s 45 year plan provides significant future
investment opportunities in Alberta alone
Alberta Long-term Investment
Opportunities
(TransAlta Fleet Only)
TransAlta AB Portfolio Growth
Replacement Opportunity TransAlta Coal
MW Total growth opportunity: 4,800 MW
Total investment opportunity1: $9 - $13 B
1 Based on 45 year coal-life and $1,800 - $2,800 per KW
8
0%
50%
100%
150%
200%
250%
300%
2000 2001 2002 2003 2004 2005 2006 2007 2008 2009 2010
0%
5%
10%
15%
20%
Cumulative TSR Dividend Yield
Yield2
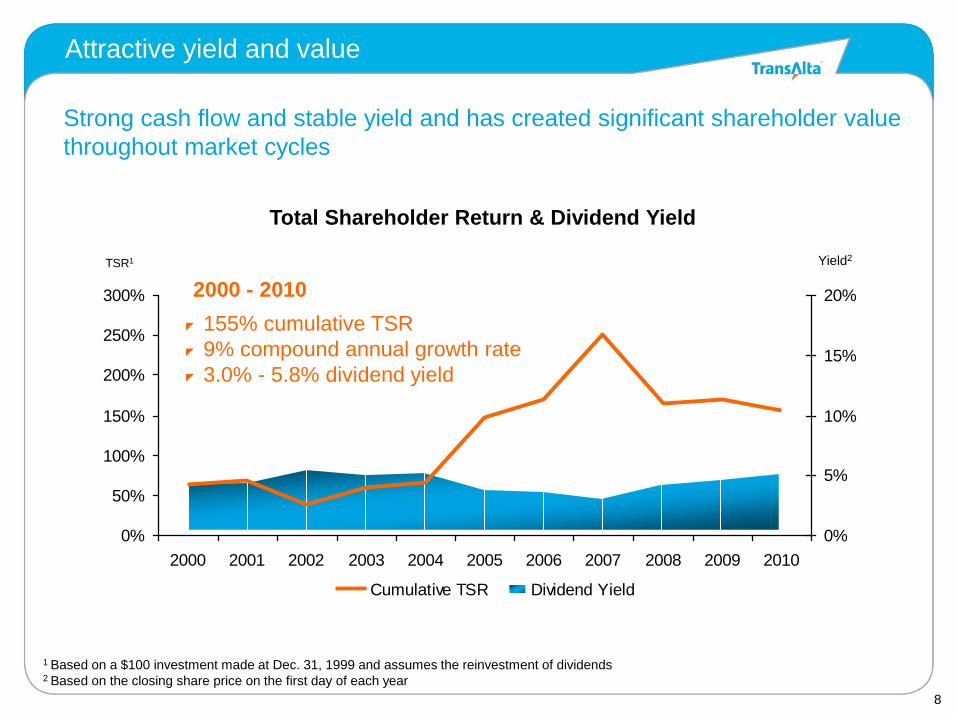
Strong cash flow and stable yield and has created significant shareholder value
throughout market cycles
Attractive yield and value
155% cumulative TSR
9% compound annual growth rate
3.0% - 5.8% dividend yield
TSR1
1 Based on a $100 investment made at Dec. 31, 1999 and assumes the reinvestment of dividends 2 Based on the closing share price on the first day of each year
Total Shareholder Return & Dividend Yield
2000 - 2010

9
Eastern Canada Western Canada
United States Australia
Multiple
Geographies Fuel
Diversification
We maintain a low-to-moderate risk profile through fuel diversification, multiple
geographies, and a solid contractual base
= Low-to-moderate risk profile
Highly
Contracted
+ + Long-term
& PPAs
70%
Merchant
Short &
medium
term
Low-to-moderate risk
24%
58%
14% 4%
2011e
MW by
region

10
$-
$250
$500
$750
$1,000
2002
2003
2004
2005
2006
2007
2008
2009
2010
Dividends
2011e
Base operations have generated strong cash flow and excellent
dividend coverage
Targeting $800 - 900 million of FFO in 2011
Solid cash flow growth
FFO
$M
Funds from Operations (FFO)
25 – 35% Payout
Ratio
Sustaining
Capex
Free cash
flow
$800 - $900M

11
0
1,000
2,000
3,000
4,000
5,000
6,000
7,000
8,000
9,000
2011 2012 2013 2014
Contracted Open
$0
$50
$100
$150
$200
$250
1 2 3 4 5
Total Portfolio Contractedness Avg. Incremental EBITDA From Higher
Prices (2011 – 2014)1
$MM
1 Relative to a base of $50/MWh in Alberta and $35/MWh in the PacNW 2 Based on a 10% ROCE, $1,500 – $3,000 per KW and a 30 year depreciation
$55
$40
$60
$45
$65
$50
$70
$55
$75
$60
Alberta:
PacNW:
MWs
At a 10% ROCE, 200 MW
growth can add another
$40 - $80 million in
additional EBITDA2
Highly contracted with upside potential
Contracting strategy provides solid downside protection while maintaining
leverage to power price recovery
2013 2014 2012 2011
Contracted
91% 75% 84% 70%
Open
70% base Upside potential
12
-
500
1,000
1,500
2,000
2,500
3,000
3,500
1
$-
$250
$500
$750
$1,000
$1,250
$1,500
$1,750
$60 $70 $80 $90 $100 $110 $120
Est.
EBIT
$MM
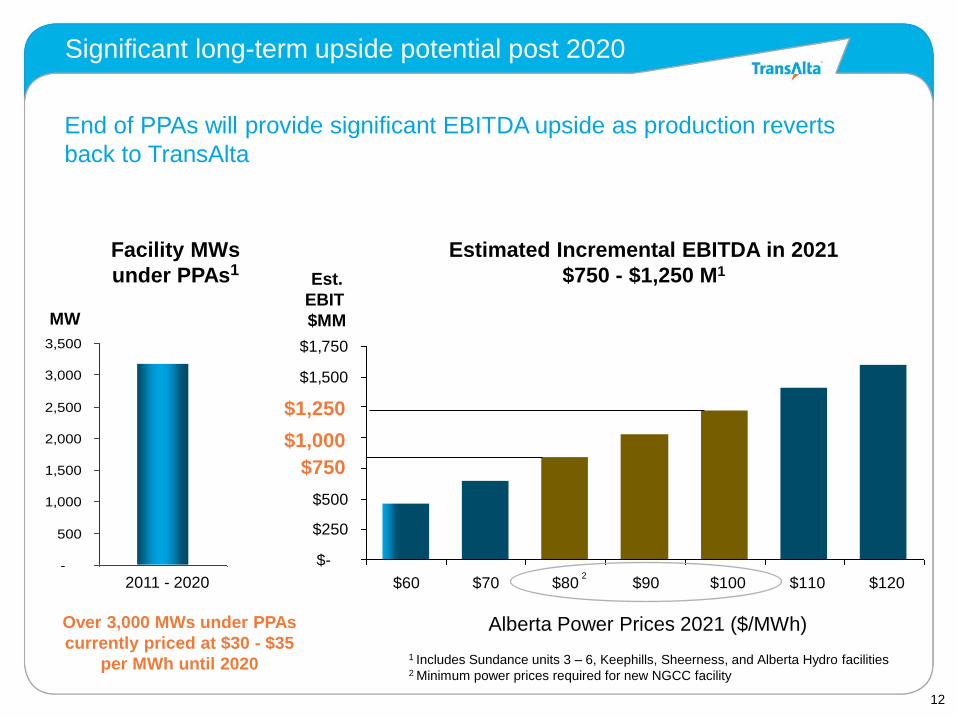
Estimated Incremental EBITDA in 2021
$750 - $1,250 M1
$750
$1,000
$1,250
Alberta Power Prices 2021 ($/MWh)
1 Includes Sundance units 3 – 6, Keephills, Sheerness, and Alberta Hydro facilities
End of PPAs will provide significant EBITDA upside as production reverts
back to TransAlta
2 Minimum power prices required for new NGCC facility
2
Significant long-term upside potential post 2020
Facility MWs
under PPAs1
MW
2011 - 2020
Over 3,000 MWs under PPAs
currently priced at $30 - $35
per MWh until 2020
13
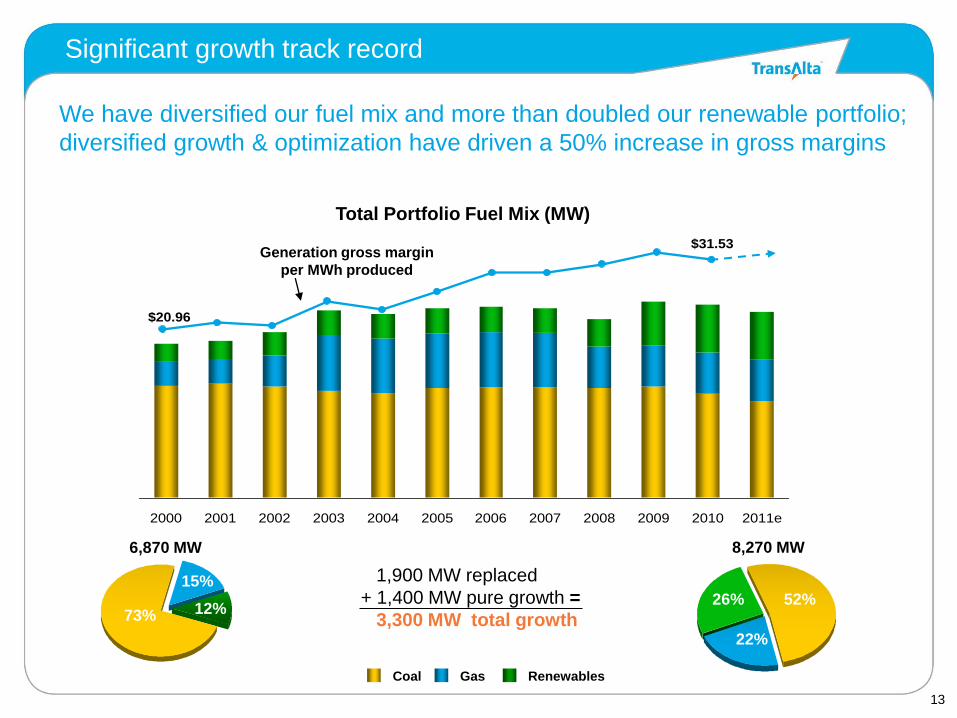
2000 2001 2002 2003 2004 2005 2006 2007 2008 2009 2010 2011e
$31.53
$20.96
Coal Gas Renewables
Generation gross margin
per MWh produced
We have diversified our fuel mix and more than doubled our renewable portfolio;
diversified growth & optimization have driven a 50% increase in gross margins
Significant growth track record
73%
15%
12% 26%
52%
22%
Total Portfolio Fuel Mix (MW)
6,870 MW
8,270 MW
1,900 MW replaced
+ 1,400 MW pure growth =
3,300 MW total growth
14
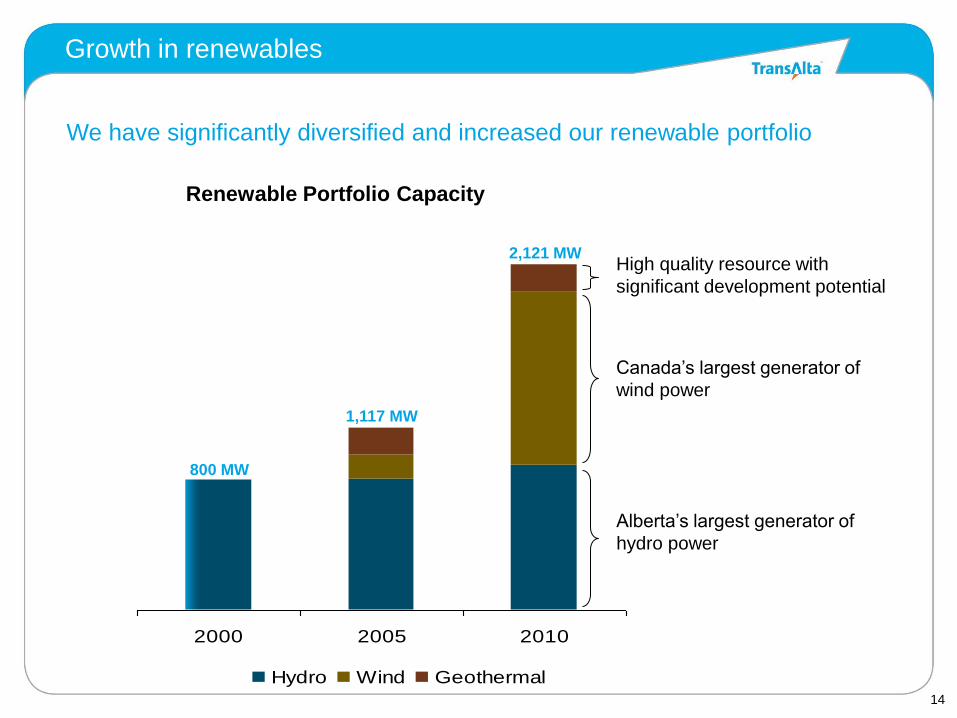
2000 2005 2010
Hydro Wind Geothermal
800 MW
1,117 MW
2,121 MW
Growth in renewables
We have significantly diversified and increased our renewable portfolio
Renewable Portfolio Capacity
High quality resource with
significant development potential
Canada’s largest generator of
wind power
Alberta’s largest generator of
hydro power
15
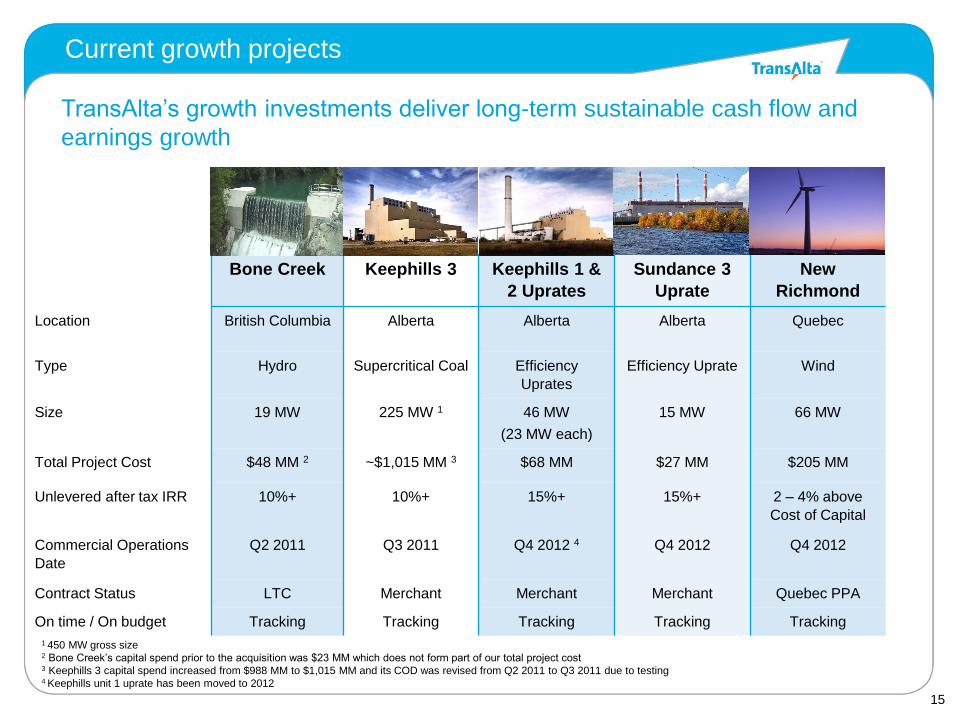
Bone Creek Keephills 3 Keephills 1 &
2 Uprates
Sundance 3
Uprate
New
Richmond
Location British Columbia Alberta Alberta Alberta Quebec
Type Hydro Supercritical Coal Efficiency
Uprates
Efficiency Uprate Wind
Size 19 MW 225 MW 1 46 MW
(23 MW each)
15 MW 66 MW
Total Project Cost $48 MM 2 ~$1,015 MM 3 $68 MM $27 MM $205 MM
Unlevered after tax IRR 10%+ 10%+ 15%+ 15%+ 2 – 4% above
Cost of Capital
Commercial Operations
Date
Q2 2011 Q3 2011 Q4 2012 4 Q4 2012 Q4 2012
Contract Status LTC Merchant Merchant Merchant Quebec PPA
On time / On budget Tracking Tracking Tracking Tracking Tracking
1 450 MW gross size 2 Bone Creek’s capital spend prior to the acquisition was $23 MM which does not form part of our total project cost 3 Keephills 3 capital spend increased from $988 MM to $1,015 MM and its COD was revised from Q2 2011 to Q3 2011 due to testing 4 Keephills unit 1 uprate has been moved to 2012
TransAlta’s growth investments deliver long-term sustainable cash flow and
earnings growth
Current growth projects
16
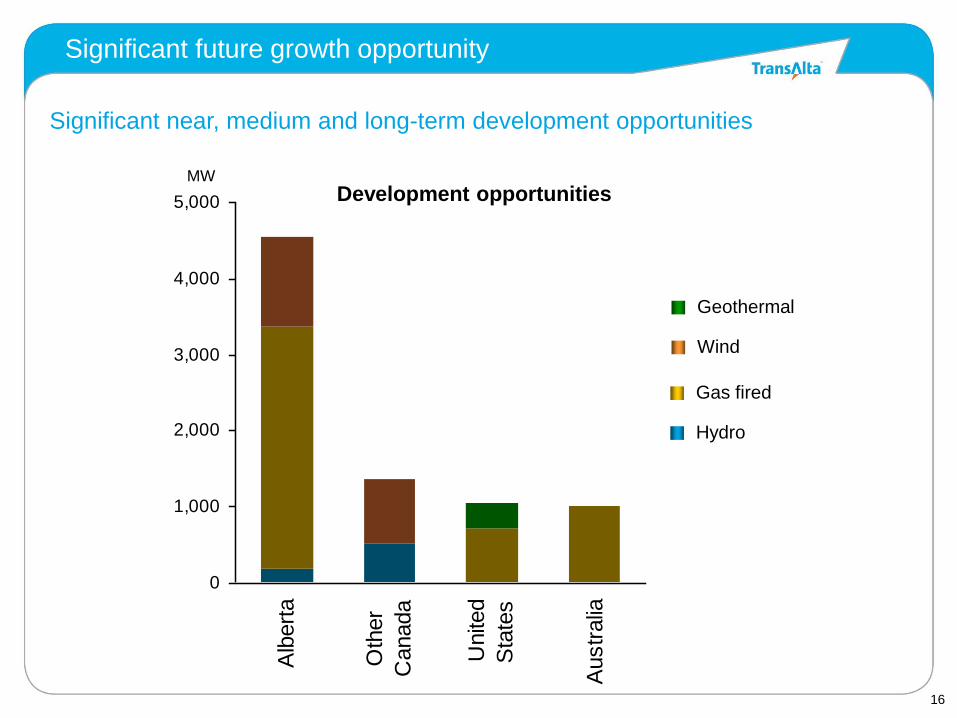
0
1,000
2,000
3,000
4,000
5,000
Alb
ert
a
Oth
er
Canada
Unite
d
Sta
tes
Austr
alia
Geothermal
Wind
Gas Fired
Hydro
Significant future growth opportunity
Replacement Opportunity
MW
Significant near, medium and long-term development opportunities
Development opportunities
Gas fired
Hydro
Geothermal
Wind
17
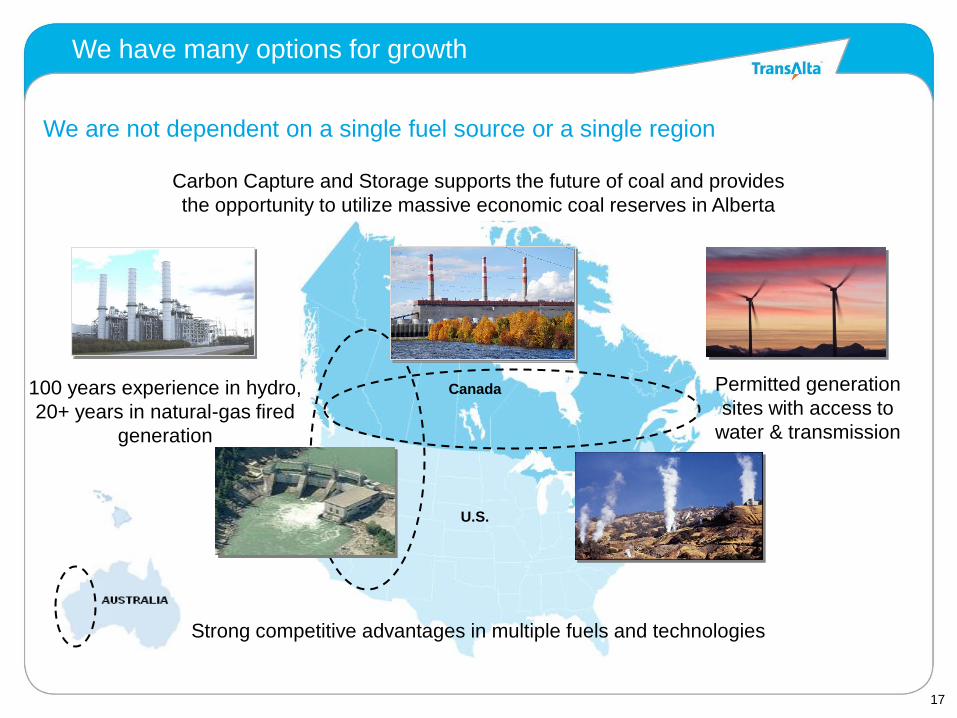
We have many options for growth
Strong competitive advantages in multiple fuels and technologies
Permitted generation
sites with access to
water & transmission
100 years experience in hydro,
20+ years in natural-gas fired
generation
We are not dependent on a single fuel source or a single region
Carbon Capture and Storage supports the future of coal and provides
the opportunity to utilize massive economic coal reserves in Alberta
Canada
U.S.
18
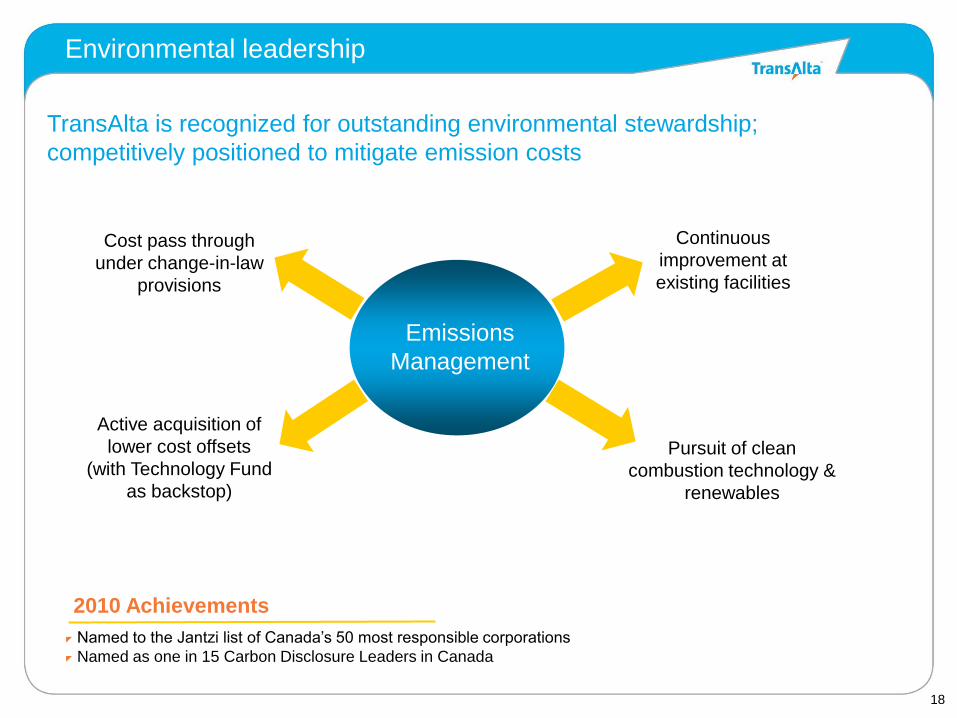
TransAlta is recognized for outstanding environmental stewardship;
competitively positioned to mitigate emission costs
Cost pass through
under change-in-law
provisions
Continuous
improvement at
existing facilities
Active acquisition of
lower cost offsets
(with Technology Fund
as backstop)
Pursuit of clean
combustion technology &
renewables
Emissions
Management
Environmental leadership
Named to the Jantzi list of Canada’s 50 most responsible corporations
Named as one in 15 Carbon Disclosure Leaders in Canada
2010 Achievements
19
$-
$0.5
$1.0
$1.5
$2.0
$2.5
Q1 2011
Credit Lines Utilized Credit Lines Available
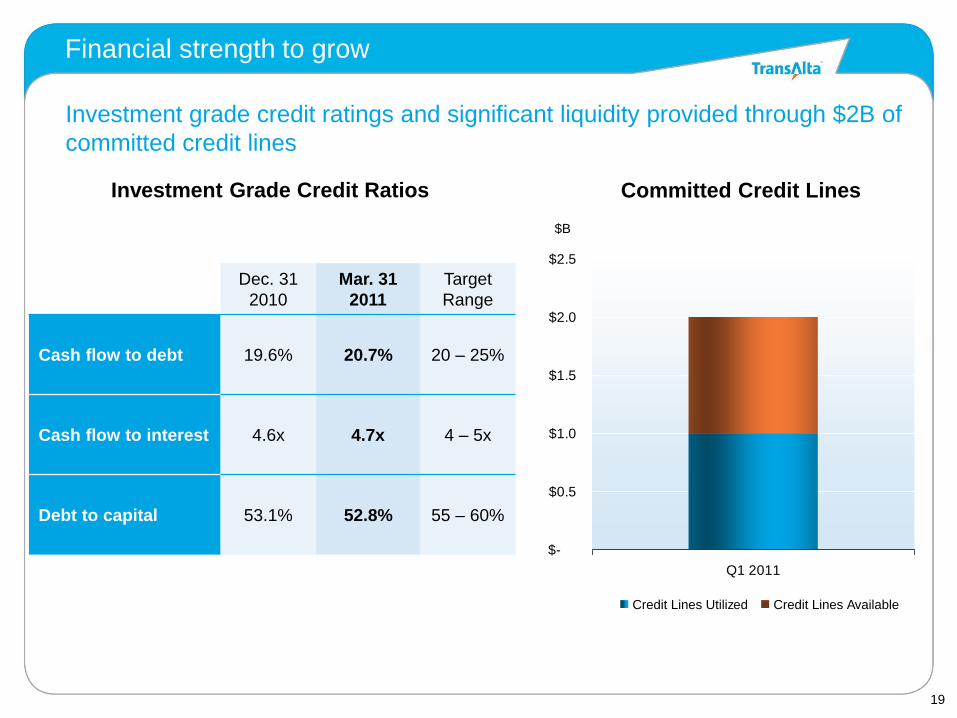
Investment Grade Credit Ratios
Financial strength to grow
$B
Dec. 31
2010
Mar. 31
2011
Target
Range
Cash flow to debt
19.6%
20.7%
20 – 25%
Cash flow to interest
4.6x
4.7x
4 – 5x
Debt to capital
53.1%
52.8%
55 – 60%
Committed Credit Lines
Investment grade credit ratings and significant liquidity provided through $2B of
committed credit lines

20
Financial strength
Optimal balance between debt, dividends, and growth
Balance sheet
enhancement
Growth
Dividends
Balanced capital allocation and disciplined investment decisions supports value
creation through market cycles
Provide shareholders with strong, sustainable dividend
Remain disciplined in how we manage our balance sheet
Disciplined growth targeting unlevered after-tax IRRs of 2 – 4% above
cost of capital
Divest or improve non-core and underperforming assets:
Meridian - sold in 2010
Sarnia - renegotiated new LTC in 2009
Mexico - sold in 2008
Portfolio
Optimization

21
Strategically positioned in markets with strong growth opportunities
Strong and stable cash flow growth
Highly contracted with leverage to power price recovery
Significant upside when Alberta PPAs roll off in 2020
Financial strength and stability
Near and long-term value driven by our unwavering commitment to provide strong
yield and growth
Why invest?
22
Additional information
23
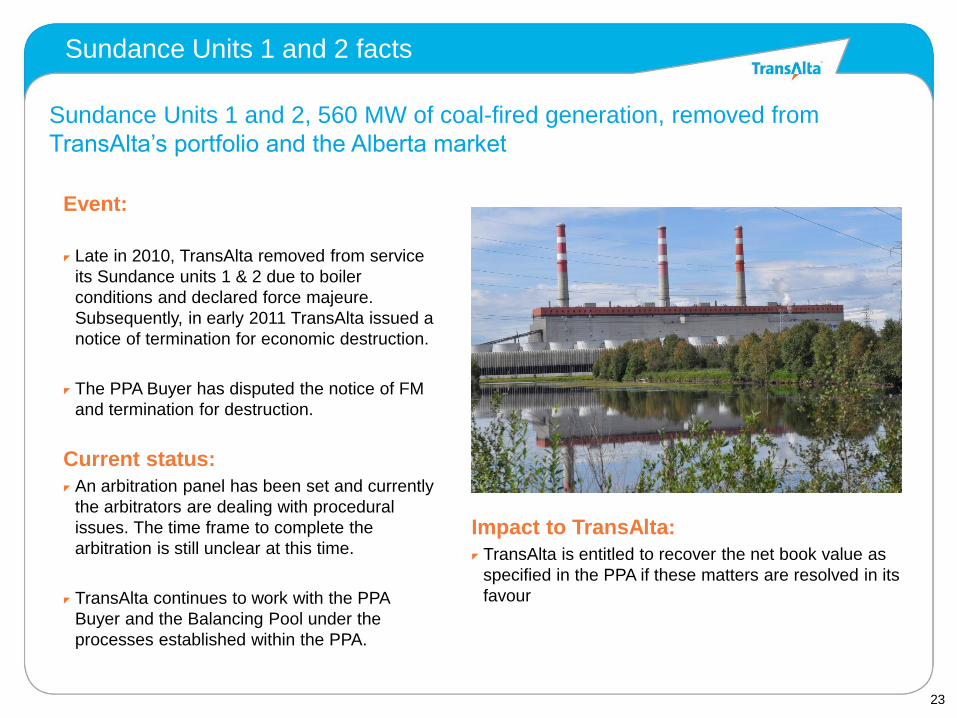
Event:
Late in 2010, TransAlta removed from service
its Sundance units 1 & 2 due to boiler
conditions and declared force majeure.
Subsequently, in early 2011 TransAlta issued a
notice of termination for economic destruction.
The PPA Buyer has disputed the notice of FM
and termination for destruction.
Current status:
An arbitration panel has been set and currently
the arbitrators are dealing with procedural
issues. The time frame to complete the
arbitration is still unclear at this time.
TransAlta continues to work with the PPA
Buyer and the Balancing Pool under the
processes established within the PPA.
Sundance Units 1 and 2, 560 MW of coal-fired generation, removed from
TransAlta’s portfolio and the Alberta market
Sundance Units 1 and 2 facts
Impact to TransAlta:
TransAlta is entitled to recover the net book value as
specified in the PPA if these matters are resolved in its
favour
24
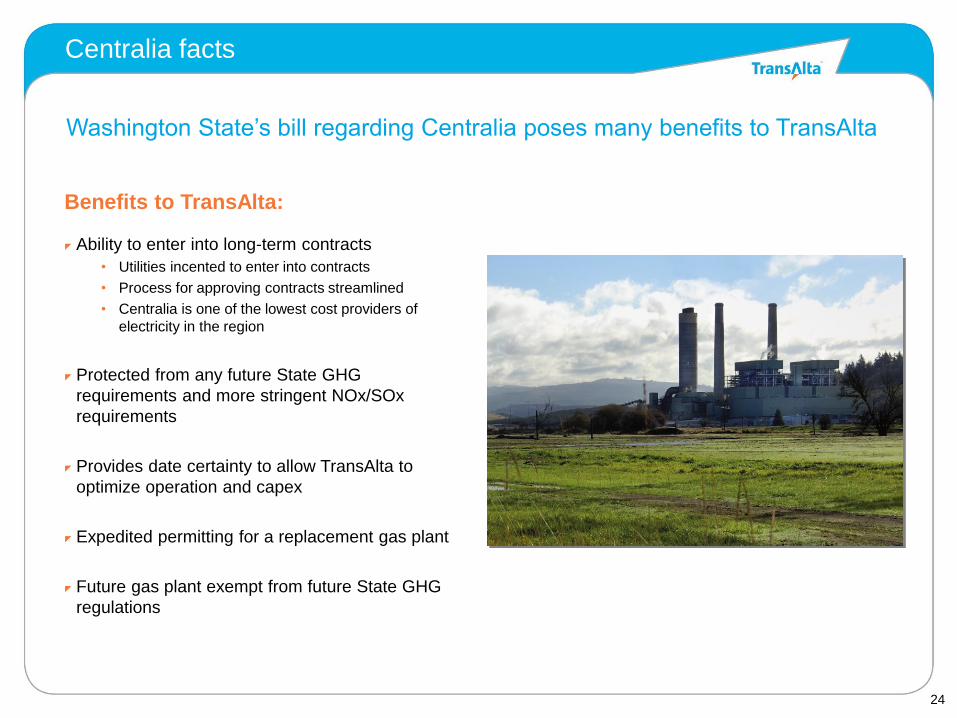
Benefits to TransAlta:
Ability to enter into long-term contracts
• Utilities incented to enter into contracts
• Process for approving contracts streamlined
• Centralia is one of the lowest cost providers of
electricity in the region
Protected from any future State GHG
requirements and more stringent NOx/SOx
requirements
Provides date certainty to allow TransAlta to
optimize operation and capex
Expedited permitting for a replacement gas plant
Future gas plant exempt from future State GHG
regulations
Washington State’s bill regarding Centralia poses many benefits to TransAlta
Centralia facts
25
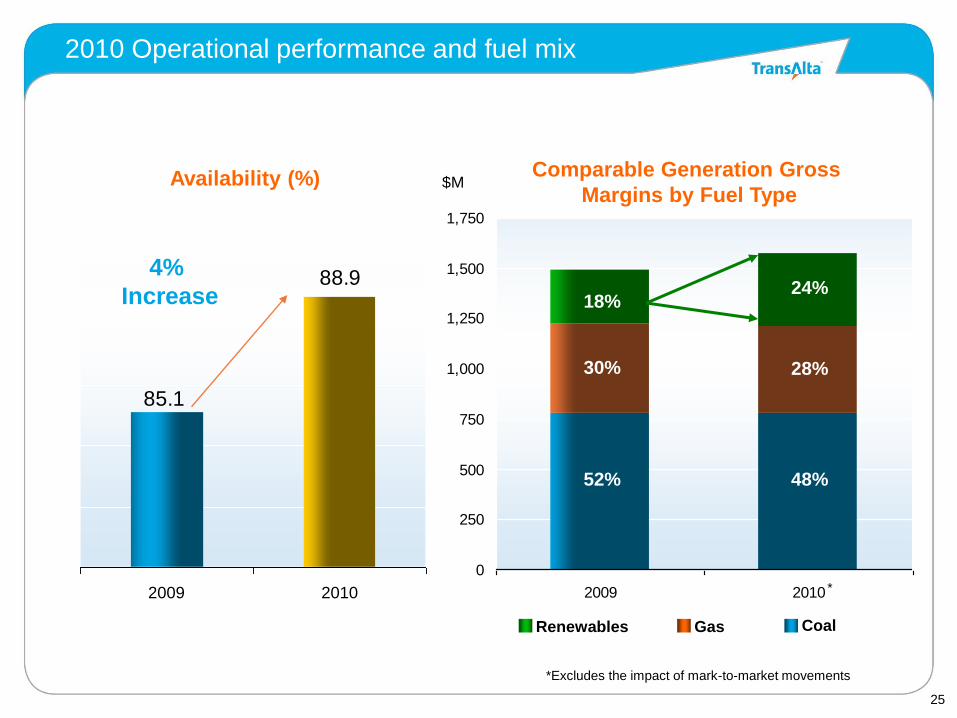
0
250
500
750
1,000
1,250
1,500
1,750
2009 2010
88.9
85.1
80
82
84
86
88
90
2009 2010
Availability (%)
2010 Operational performance and fuel mix
4%
Increase
Gas Renewables Coal
18%
30%
52% 48%
28%
24%
$M Comparable Generation Gross
Margins by Fuel Type
*Excludes the impact of mark-to-market movements
*

26
$888
$965
2009 2010
$0.90
$0.98
$0.84
$0.88
$0.92
$0.96
$1.00
2009 2010
$729
$783
650
700
750
800
2009 2010
M
M
2010 Financial performance
Comparable EBITDA
Funds from Operations Comparable EPS
9%
Increase
7%
Increase
9%
Increase
M
M
27
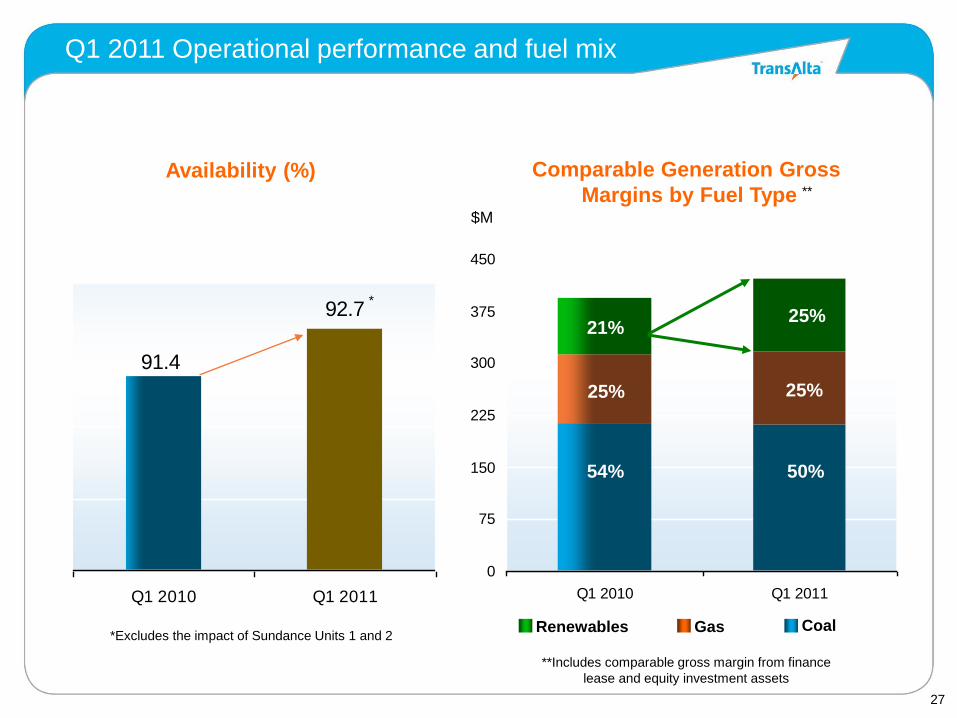
0
75
150
225
300
375
450
Q1 2010 Q1 2011
92.7
91.4
86
88
90
92
94
Q1 2010 Q1 2011
Q1 2011 Operational performance and fuel mix
Availability (%) Comparable Generation Gross
Margins by Fuel Type
Gas Renewables Coal
25%
21%
54%
25%
25%
50%
**
$M
*Excludes the impact of Sundance Units 1 and 2
*
**Includes comparable gross margin from finance
lease and equity investment assets
28
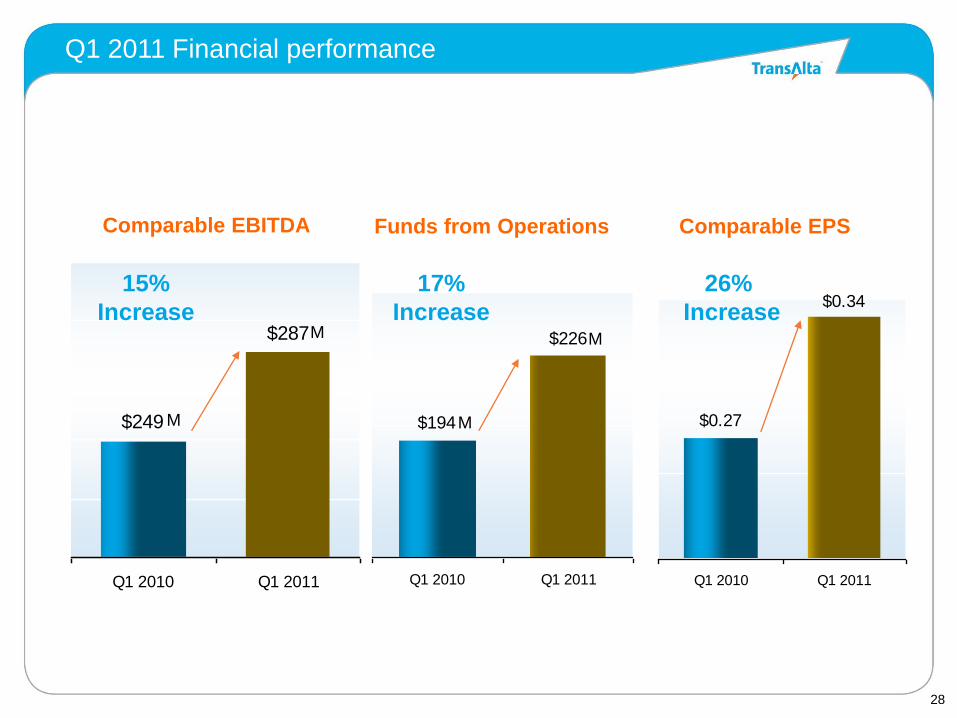
$0.27
$0.34
Q1 2010 Q1 2011
$249
$287
Q1 2010 Q1 2011
$194
$226
Q1 2010 Q1 2011
Q1 2011 Financial performance
Comparable EBITDA
Funds from Operations Comparable EPS
17%
Increase
15%
Increase
26%
Increase
M
M
M
M